Theme 2: FOOD, AGRICULTURE AND FISHERIES, AND ...
13
Pag. 1 INTEGRATING BIOTREATED WASTEWATER REUSE AND VALORIZATION WITH ENHANCED WATER USE EFFICIENCY TO SUPPORT THE GREEN ECONOMY IN EU AND INDIA INTEGRATING BIOTREATED WASTEWATER REUSE AND VALORIZATION WITH ENHANCED WATER USE EFFICIENCY TO SUPPORT THE GREEN ECONOMY IN EU AND INDIA Work Programme 2012 “COOPERATION” Theme 2: FOOD, AGRICULTURE AND FISHERIES, AND BIOTECHNOLOGY Activity 2.3: Life sciences, biotechnology and biochemistry for sustainable non- food products and processes Area 2.3.5: Environmental biotechnology KBBE.2012.3.5-03 Biotechnological waste water treatments and reuse in agronomical system Call: FP7-KBBE-2012-6 Integrating biotreated wastewater reuse and valorization with enhanced water use efficiency to support the Green Economy in EU and India Grant agreement no.: 311933 Funding scheme: Collaborative Project Coordinator: Dr Antonio Lopez, IRSA-CNR (Italy) Work Package 2 Innovative municipal wastewater bio-treatment for agricultural reuse Deliverable 2.4 Report on pilot-scale (400 L MBR) treatment Due date: Month 37 Actual submission date: 11/01/2016 Start of project: 1/08/2012 WP Leader: IRSA Participants: INOFEA/FHNW Authors: Y. Dudal, P. Corvini, P. Shahgaldian Contact for queries: [email protected] Dissemination Level: PU Water4Crops ‐ EU
Transcript of Theme 2: FOOD, AGRICULTURE AND FISHERIES, AND ...
Pag.1
INTEGRATINGBIOTREATEDWASTEW
ATERREUSEANDVALORIZATIONWITHENHANCEDWATER
USEEFFICIENCYTOSUPPORTTHEGREENECONOMYINEUANDINDIA
INTEGRATINGBIOTREATEDWASTEW
ATERREUSEANDVALORIZATIONWITHENHANCEDWATER
USEEFFICIENCYTOSUPPORTTHEGREENECONOMYINEUANDINDIA
Work Programme 2012 “COOPERATION”
Theme 2: FOOD, AGRICULTURE AND FISHERIES, AND BIOTECHNOLOGY
Activity 2.3: Life sciences, biotechnology and biochemistry for sustainable non-food products and processes
Area 2.3.5: Environmental biotechnology KBBE.2012.3.5-03
Biotechnological waste water treatments and reuse in agronomical system Call: FP7-KBBE-2012-6
Integrating biotreated wastewater reuse and valorization with enhanced water use efficiency to
support the Green Economy in EU and India
Grant agreement no.: 311933 Funding scheme: Collaborative Project
Coordinator: Dr Antonio Lopez, IRSA-CNR (Italy)
Work Package 2
Innovative municipal wastewater bio-treatment for agricultural reuse
Deliverable 2.4 Report on pilot-scale (400 L MBR) treatment
Due date: Month 37 Actual submission date: 11/01/2016
Start of project: 1/08/2012 WP Leader: IRSA
Participants: INOFEA/FHNW Authors: Y. Dudal, P. Corvini, P. Shahgaldian
Contact for queries: [email protected] Dissemination Level: PU
Water4Crops‐ EU
Pag.2
INDEX
1. Introduction p.3
2. Materials and methods p.3
3. Results p.9
4. References p.13
TABLES
Table 1 - Time schedule of the experiments with the indication of pH regulation, BPA dosing
to the influent and addition of new nanoparticles to the MBRs p.7
Table 2 - Stability test of BPA in the treated wastewater (MBR influent) p.7
Table 3 - Stability test of BPA in tap water p.7
Table 4 - Stability test of BPA in purified water p.7
FIGURES
Figure 1 – Photo of the double filtration unit p.5
Figure 2 – View of contact and filtration tank with the ceramic membrane p.6
Figure 3 – Process scheme of the pilot set-up p.7
Figure 4 COD in the samples of influent and permeates from the MBRs with the indication of
operational phases and dosing of additional nanoparticles into the MBRs p.9
Figure 5 Total solids in the MBRs p.10
Figure 6 Enzymatic activity in the samples from MBR1. The dosing of additional nanoparticles
in indicated by the arrows. p.11
Figure 7 Transmembrane pressure in the MBRs during the experiment p.12
Figure 8 Measured BPA concentrations in the samples of influent and MBR permeates p.12
Pag.3
1. Introduction
Municipal wastewaters represent an important source of micropollutants, such as pharmaceuticals,
personal care products or pesticides. In order to lower the introduction of these chemical into the
environment, technologies for the elimination beyond the capabilities of the conventional biological
treatment are being developed in recent years. Within this task, the removal of bisphenol A (BPA)
from the effluent of a municipal wastewater treatment plant (WWTP) by the immobilized laccase
enzyme was tested in a continuous pilot unit.
2. Materials and methods
Laccase
Laccase of a Thielavia genus (GTL) was purchased from AB Enzymes GmbH (Germany). The
laccase activity was determined using 2,2′-Azino-bis(3-ethylbenzothiazoline-6-sulfonic acid)
(ABTS) from Sigma-Aldrich (Switzerland) as a substrate and was carried out as previously de-
scribed (Zimmermann et al. 2011). One U was defined as the amount of laccase oxidizing 1 µmol
ABTS min-1.
Immobilization procedure in kilogram-scale
Immobilization of laccases was carried out according to the general principle described in previous
publications (Zimmermann et al. 2011, Hommes et al. 2012 and Ammann et al. 2013). Surface
modification of fumed silica nanoparticles (fsNP) purchased from Sigma-Aldrich (Switzerland)
using 3-Aminopropyltriethoxysilane (APTES) from the same company was performed according to
Hommes et al. (2012) with slight changes. A suspension of 35 mg fsNP L-1 tap water was
homogenized in a barrel (300 L) and 0.8 mmol APTES g-1 fsNP was added during stirring using a
HP 25 mixer with an A310 impeller from Lightnin (USA). The solution was incubated under
agitation (1,380 rpm) for 24 h at RT. The laccase amounts added were calculated according to
Ammann et al. (2013). Accordingly, 0.6 kU g-1 fsNP GTL was added under agitation after setting
the pH of the suspension to 7.6 using citric acid monohydrate from AppliChem (Germany). After 2
h protein sorption at RT, 1.0 mmol g-1 fsNP glutaraldehyde (50%) from AppliChem (Germany) was
added dropwise and the suspension was incubated under agitation (1,380 rpm) for 18 h at room
temperature. Subsequently, the excess enzymes and glutaraldehyde were washed away using a
single shaft disc filtration system with a 7 nm cut-off ceramic filter from Novoflow (Germany) and
approximately 110 L tap water. APTES modified fsNP without enzyme and cross-linking reagent
were used as a control and produced as above.
Pag.4
Pilot units
The treatment technology was tested in a pilot scale unit, which was operated with the effluent from
a full scale municipal wastewater treatment plant (WWTP) in Birsfelden (Switzerland). The
biologically treated effluent was first filtered through a flat-sheet polymeric ultrafiltration (UF)
membrane (Bio-Cel BC10 from Microdyn-Nadir) in a pre-filtration unit in order to remove residual
suspended solids from the WWTP effluent and avoid their accumulation in the enzymatic treatment
step.
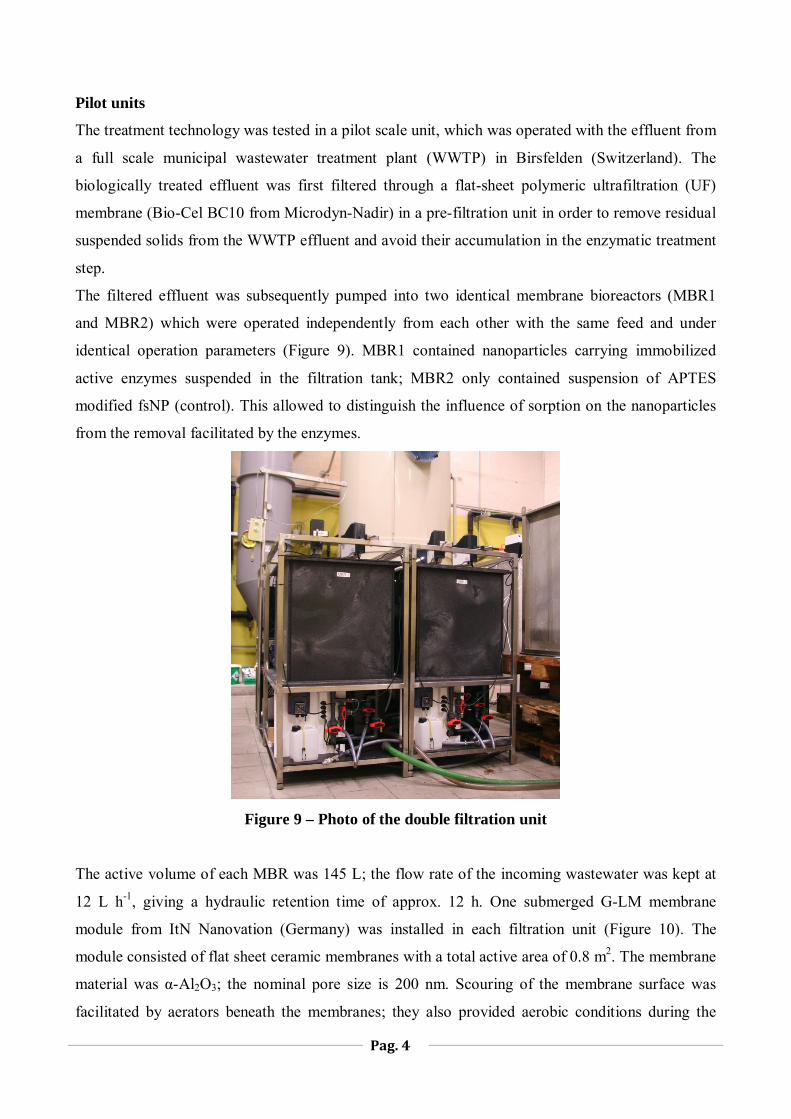
The filtered effluent was subsequently pumped into two identical membrane bioreactors (MBR1
and MBR2) which were operated independently from each other with the same feed and under
identical operation parameters (Figure 9). MBR1 contained nanoparticles carrying immobilized
active enzymes suspended in the filtration tank; MBR2 only contained suspension of APTES
modified fsNP (control). This allowed to distinguish the influence of sorption on the nanoparticles
from the removal facilitated by the enzymes.
Figure 9 – Photo of the double filtration unit
The active volume of each MBR was 145 L; the flow rate of the incoming wastewater was kept at
12 L h-1, giving a hydraulic retention time of approx. 12 h. One submerged G-LM membrane
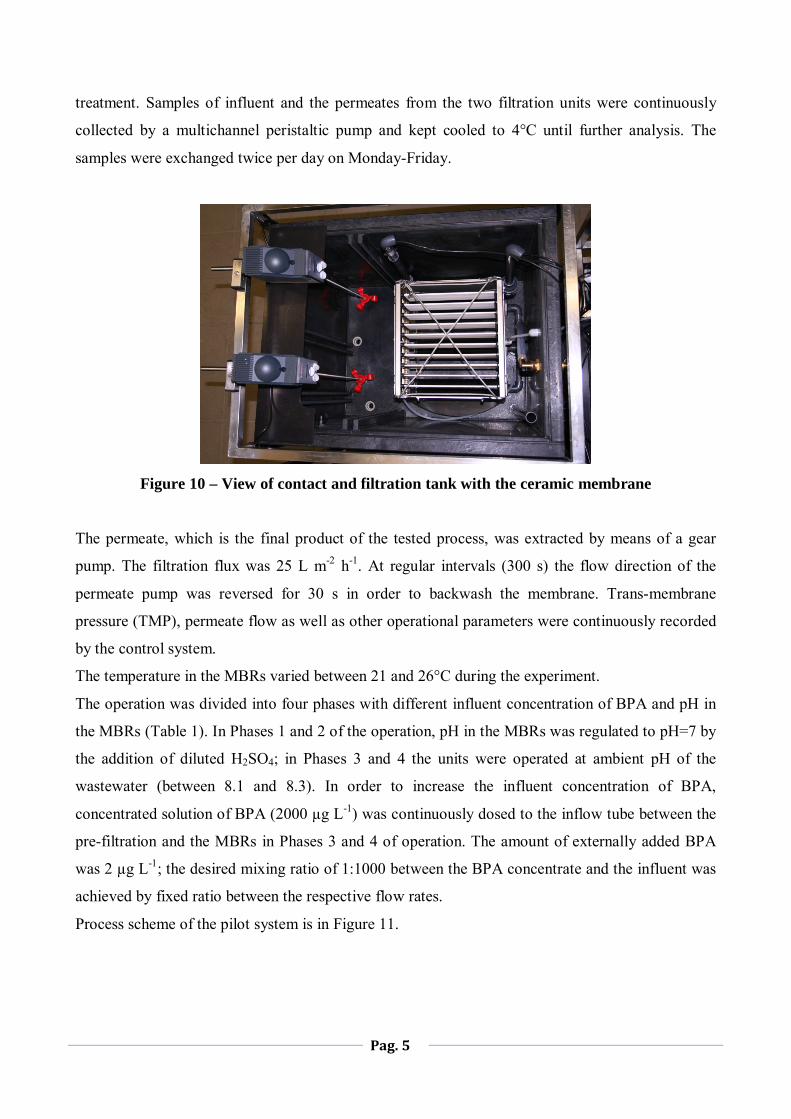
module from ItN Nanovation (Germany) was installed in each filtration unit (Figure 10). The
module consisted of flat sheet ceramic membranes with a total active area of 0.8 m2. The membrane
material was α-Al2O3; the nominal pore size is 200 nm. Scouring of the membrane surface was
facilitated by aerators beneath the membranes; they also provided aerobic conditions during the
Pag.5
treatment. Samples of influent and the permeates from the two filtration units were continuously
collected by a multichannel peristaltic pump and kept cooled to 4°C until further analysis. The
samples were exchanged twice per day on Monday-Friday.
Figure 10 – View of contact and filtration tank with the ceramic membrane
The permeate, which is the final product of the tested process, was extracted by means of a gear
pump. The filtration flux was 25 L m-2 h-1. At regular intervals (300 s) the flow direction of the
permeate pump was reversed for 30 s in order to backwash the membrane. Trans-membrane
pressure (TMP), permeate flow as well as other operational parameters were continuously recorded
by the control system.
The temperature in the MBRs varied between 21 and 26°C during the experiment.
The operation was divided into four phases with different influent concentration of BPA and pH in
the MBRs (Table 1). In Phases 1 and 2 of the operation, pH in the MBRs was regulated to pH=7 by
the addition of diluted H2SO4; in Phases 3 and 4 the units were operated at ambient pH of the
wastewater (between 8.1 and 8.3). In order to increase the influent concentration of BPA,
concentrated solution of BPA (2000 µg L-1) was continuously dosed to the inflow tube between the
pre-filtration and the MBRs in Phases 3 and 4 of operation. The amount of externally added BPA
was 2 µg L-1; the desired mixing ratio of 1:1000 between the BPA concentrate and the influent was
achieved by fixed ratio between the respective flow rates.
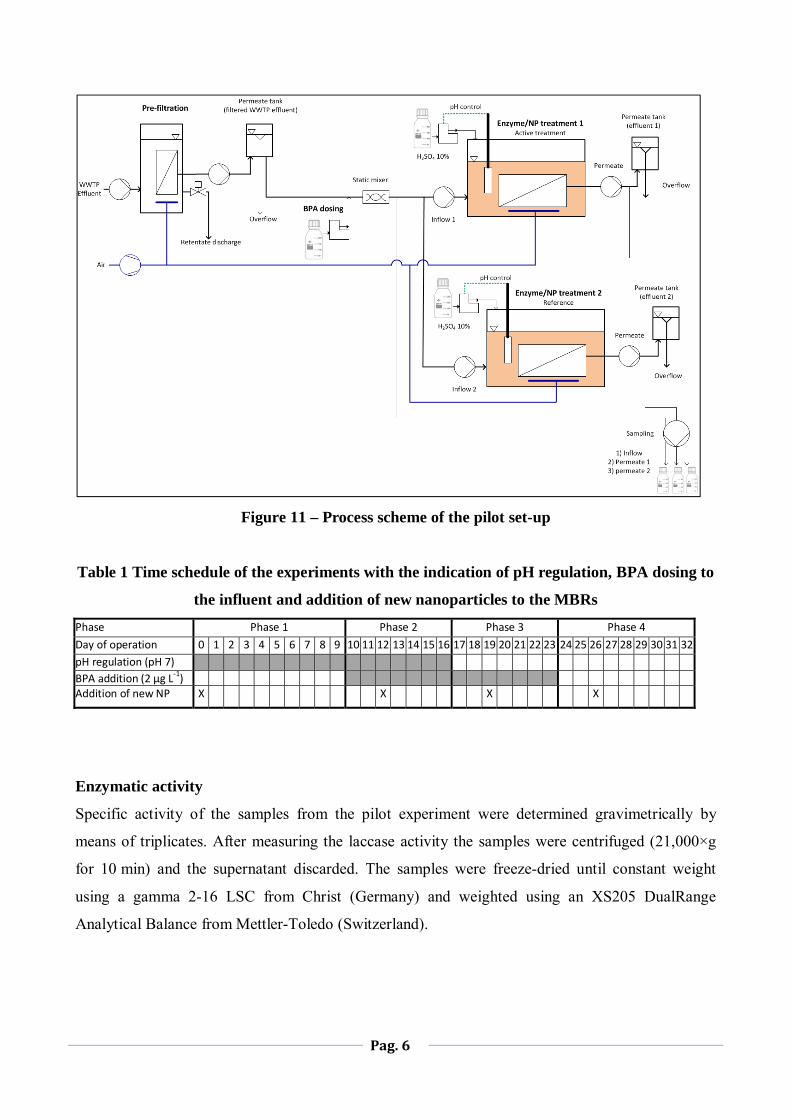
Process scheme of the pilot system is in Figure 11.
Pag.6
Figure 11 – Process scheme of the pilot set-up
Table 1 Time schedule of the experiments with the indication of pH regulation, BPA dosing to
the influent and addition of new nanoparticles to the MBRs
Phase Phase 1 Phase 2 Phase 3 Phase 4
Day of operation 0 1 2 3 4 5 6 7 8 9 10 11 12 13 14 15 16 17 18 19 20 21 22 23 24 25 26 27 28 29 30 31 32
pH regulation (pH 7)
BPA addition (2 µg L‐1)
Addition of new NP X X X X
Enzymatic activity
Specific activity of the samples from the pilot experiment were determined gravimetrically by
means of triplicates. After measuring the laccase activity the samples were centrifuged (21,000×g
for 10 min) and the supernatant discarded. The samples were freeze-dried until constant weight
using a gamma 2-16 LSC from Christ (Germany) and weighted using an XS205 DualRange
Analytical Balance from Mettler-Toledo (Switzerland).
Pag.7
COD
Chemical oxygen demand (COD) was measured using cuvette test LCK 314 and spectrophotometer
DR 6000 from Hach Lange (Germany).
Measurement of BPA in the samples
Sample preparation
Wastewater samples were stored at 4 °C without any pH adjustment for 1-2 months. Before the
analysis samples were filtrated through 0.45 μm glass fiber filter and the pH was adjusted to 6.0 by
2 mM H2SO4. Before SPE 500 ml of filtrated water samples were spiked with 250 ng of deuterated
standard BPA-d16 (50 µl; 5 µg.ml-1 in methanol).
SPE
Automated solid phase extraction system (AutoTrace™ 280 SPE, Thermo Scientific™ Dionex™)
was used. OASIS HLB (6 cc, 200 mg) cartridges (Waters, Switzerland) were preconditioned with 2
mL heptane, 2 mL ethylacetate, 6 mL methanol, and 8 mL water at pH 6.0. 500 mL of filtrated
water samples were loaded onto the cartridges. After extraction the cartridges were dried
completely with nitrogen stream for 1 h. Dry cartridges were eluted with 8 mL methanol. The eluent
was dried with nitrogen stream and resuspended in 1 mL acetonitrile.
Derivatization
For BPA analysis, 80 μL of the sample in acetonitrile was mixed with 20 μL
Bis(trimethylsilyl)trifluoroacetamide (BSTFA) and derivatized at 70 °C for 30 min. After
derivatization, 40 ng of internal standard hexachlorobenzene HCB (20 µl; 2µg.mL-1 in acetonitrile)
were added to the samples and analyzed by GC-MS.
GC-MS
Agilent 7890 A GC system coupled to mass selective 5975C inert XL MSD with Triple-Axis
Detector (Agilent technologies, Switzerland) was used to analyze BPA. The instrument was
equipped with an Agilent 7683 B injector. One μL sample was injected in a split mode 1:20 into
Split-Splitless inlet equipped with a Sky® 4.0 mm ID Liner with a glass wool. The inlet operated at
constant temperature 260 °C and pressure 0.85 bar. Separation was achieved on a column DB-35
MS (30 m × 250 μm × 0.25 μm, Agilent technologies, Switzerland), at a constant helium flow of
1.1 mL min-1. The oven temperature program started at 100 °C for 2 min and increased by 9 °C/min
Pag.8
to 290 °C holding for 10 min. MS was set at single ion mode (SIM) to acquire target ions of
hexachlorobenzene (m/z value: 282.2, 284.3, 286.2), BPA (m/z value: 357.2, 372.3) and BPA-d16
(m/z value: 368.3, 386.3). Temperatures of transferline, MS source and MS quadrupole were 280,
230 and 150°C, respectively.
Quantification of MS results
External standards of BPA were prepared at different concentrations in blank matrix (mineral
water), and extracted with SPE using the same procedures as wastewater samples. Equal amount of
internal standard BPA-d16 (250 ng) was added into external standards and wastewater samples
before SPE to improve quantification. The purpose was to minimize the influence of matrix effects,
preparation errors and detection sensitivity variations. The ratio between external standard response
(peak area) and internal standard response (peak area) was calculated as the corrected response. The
calibration curve of BPA was calculated from the corrected response and concentrations. Limit of
quantification LOQ was 20 ng L-1 and SPE recovery of BPA from wastewater matrix was � 95 %.
3. Results and discussion
COD
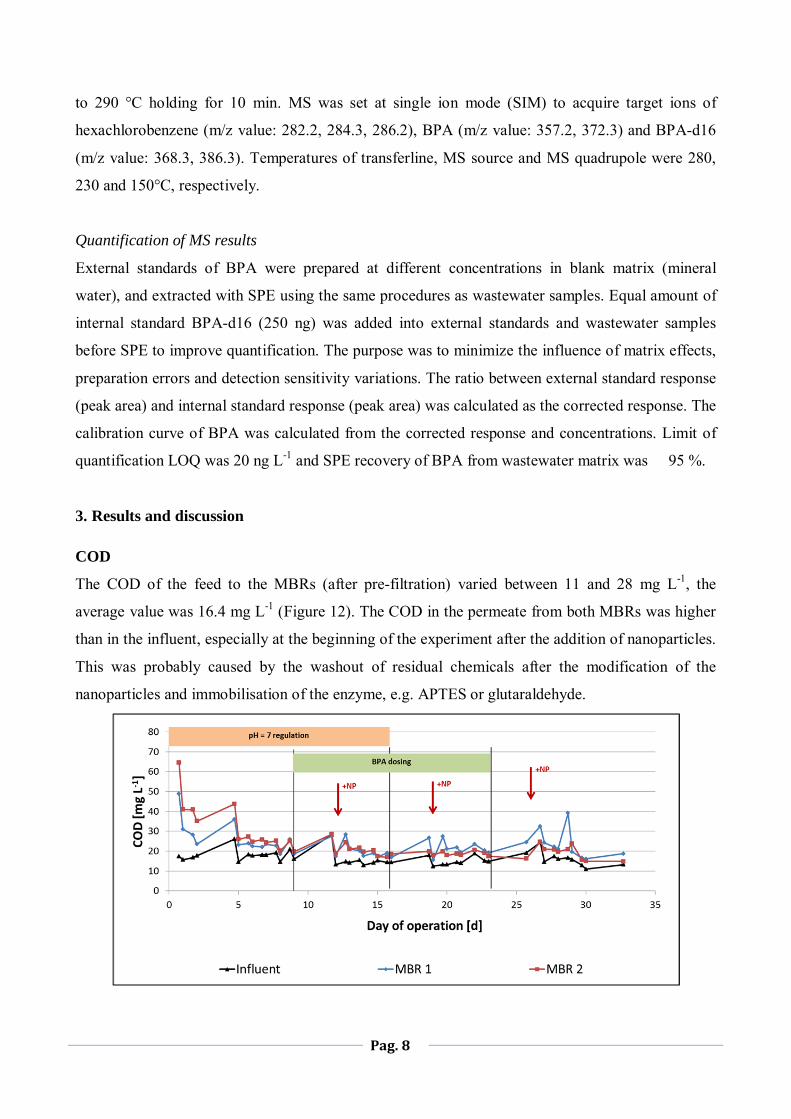
The COD of the feed to the MBRs (after pre-filtration) varied between 11 and 28 mg L-1, the
average value was 16.4 mg L-1 (Figure 12). The COD in the permeate from both MBRs was higher
than in the influent, especially at the beginning of the experiment after the addition of nanoparticles.
This was probably caused by the washout of residual chemicals after the modification of the
nanoparticles and immobilisation of the enzyme, e.g. APTES or glutaraldehyde.
Pag.9
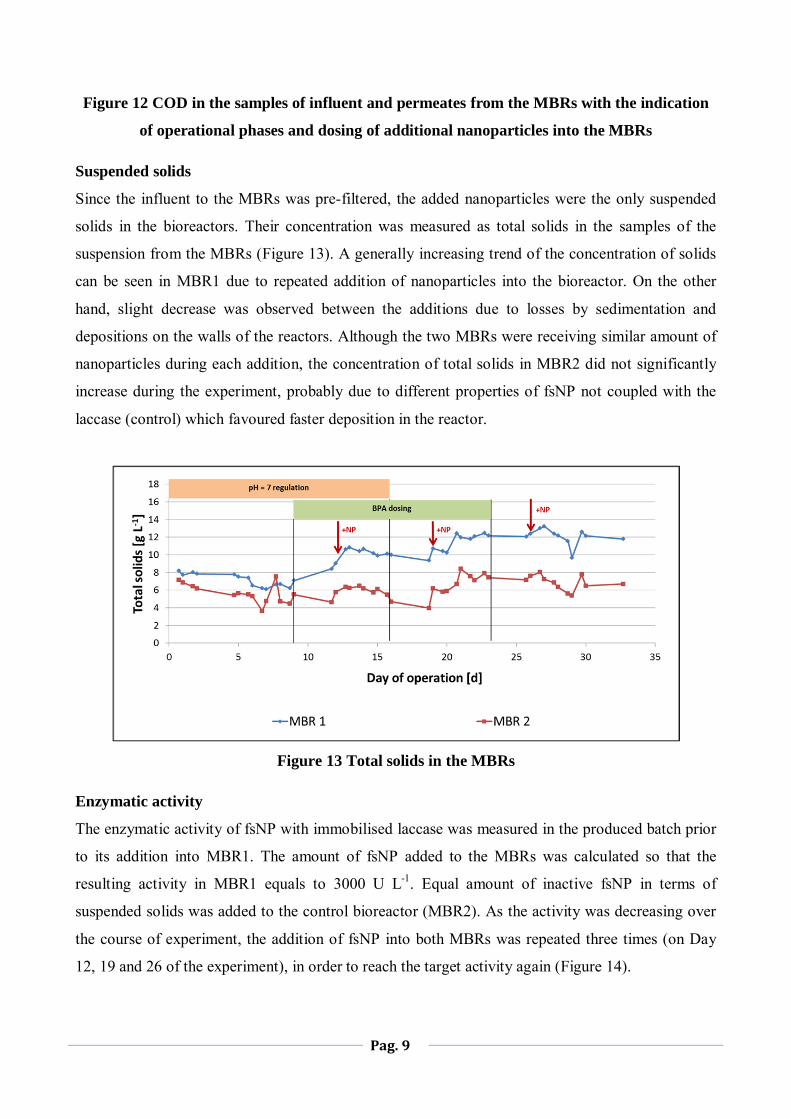
Figure 12 COD in the samples of influent and permeates from the MBRs with the indication
of operational phases and dosing of additional nanoparticles into the MBRs
Suspended solids
Since the influent to the MBRs was pre-filtered, the added nanoparticles were the only suspended
solids in the bioreactors. Their concentration was measured as total solids in the samples of the
suspension from the MBRs (Figure 13). A generally increasing trend of the concentration of solids
can be seen in MBR1 due to repeated addition of nanoparticles into the bioreactor. On the other
hand, slight decrease was observed between the additions due to losses by sedimentation and
depositions on the walls of the reactors. Although the two MBRs were receiving similar amount of
nanoparticles during each addition, the concentration of total solids in MBR2 did not significantly
increase during the experiment, probably due to different properties of fsNP not coupled with the
laccase (control) which favoured faster deposition in the reactor.
Figure 13 Total solids in the MBRs
Enzymatic activity
The enzymatic activity of fsNP with immobilised laccase was measured in the produced batch prior
to its addition into MBR1. The amount of fsNP added to the MBRs was calculated so that the
resulting activity in MBR1 equals to 3000 U L-1. Equal amount of inactive fsNP in terms of
suspended solids was added to the control bioreactor (MBR2). As the activity was decreasing over
the course of experiment, the addition of fsNP into both MBRs was repeated three times (on Day
12, 19 and 26 of the experiment), in order to reach the target activity again (Figure 14).

Pag.10
Initial decrease of the activity was approximately 170 U L-1 d-1, the decrease after the last addition
of fsNP was around 110 U L-1 d-1. The specific activity (related to the total solids in the MBR)
decreased from initial value of 360 U g-1 to 180 U g-1 at the end of the experimental period.
Figure 14 Enzymatic activity in the samples from MBR1. The dosing of additional
nanoparticles in indicated by the arrows.
Membrane filtration
Despite relatively high concentration of suspended solids in the MBR (up to 12 g L-1 in MBR1) the
transmembrane pressure (TMP) did not exceed 0.15 bar in both MBRs and low fouling rate was
observed during the experiment (Figure 15). Although both membranes had been chemically
cleaned prior to the experiment, the influence of their previous filtration history was still apparent at
the beginning of the experiment: the TMP in MBR1 was 0.01 bar compared to 0.12 bar in MBR2.
During the first two phases of operation, only low TMP increase (membrane fouling) was observed
in MBR1; in MBR2 the TMP decreased to around 0.05 bar, possibly due to the scouring effect of
the suspended fsNP. Increase in TMP was observed in both MBRs after the pH regulation was
deactivated (Phases 3 and 4), leading to pH increase from 7.0 to 8.3. Higher pH resulted in the shift
between the carbonate species in the mixture towards higher content of hydrogencarbonates, which
could have pronounced the fouling by inorganic species.
The dosing of additional nanoparticles into the MBR, which was done on Day 12, 19 and 26 of the
experiment, did not have significant influence on the measured TMP. The stepwise change in TMP
in MBR2 on day 19 was caused by the manual correction of filtration flux which coincided with the
point of the addition of nanoparticles into the bioreactor.
Pag.11
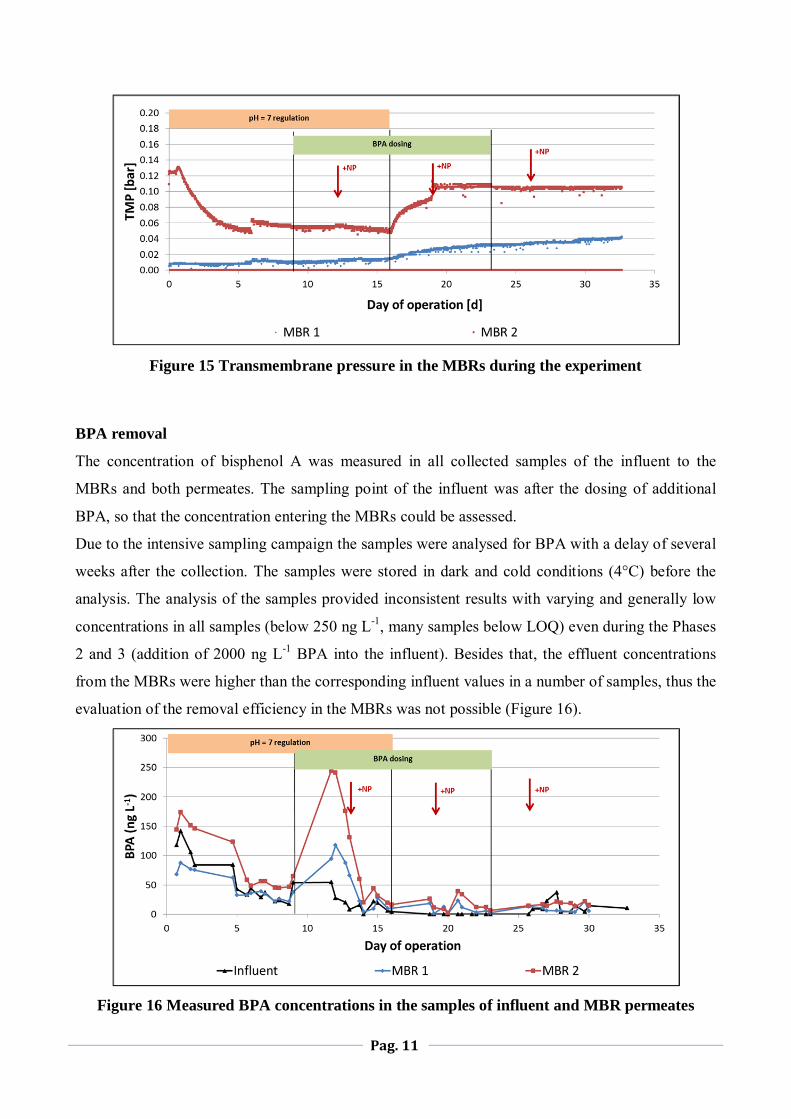
Figure 15 Transmembrane pressure in the MBRs during the experiment
BPA removal
The concentration of bisphenol A was measured in all collected samples of the influent to the
MBRs and both permeates. The sampling point of the influent was after the dosing of additional
BPA, so that the concentration entering the MBRs could be assessed.
Due to the intensive sampling campaign the samples were analysed for BPA with a delay of several
weeks after the collection. The samples were stored in dark and cold conditions (4°C) before the
analysis. The analysis of the samples provided inconsistent results with varying and generally low
concentrations in all samples (below 250 ng L-1, many samples below LOQ) even during the Phases
2 and 3 (addition of 2000 ng L-1 BPA into the influent). Besides that, the effluent concentrations
from the MBRs were higher than the corresponding influent values in a number of samples, thus the
evaluation of the removal efficiency in the MBRs was not possible (Figure 16).
Figure 16 Measured BPA concentrations in the samples of influent and MBR permeates
Pag.12
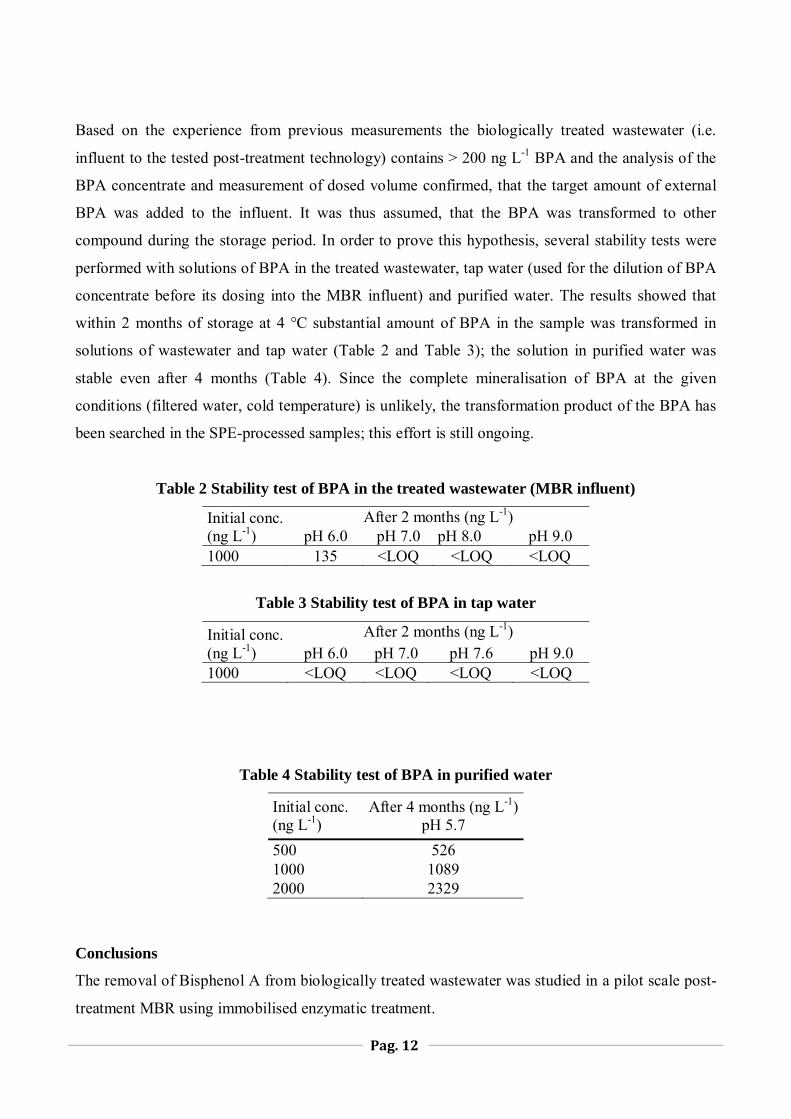
Based on the experience from previous measurements the biologically treated wastewater (i.e.
influent to the tested post-treatment technology) contains > 200 ng L-1 BPA and the analysis of the
BPA concentrate and measurement of dosed volume confirmed, that the target amount of external
BPA was added to the influent. It was thus assumed, that the BPA was transformed to other
compound during the storage period. In order to prove this hypothesis, several stability tests were
performed with solutions of BPA in the treated wastewater, tap water (used for the dilution of BPA
concentrate before its dosing into the MBR influent) and purified water. The results showed that
within 2 months of storage at 4 °C substantial amount of BPA in the sample was transformed in
solutions of wastewater and tap water (Table 2 and Table 3); the solution in purified water was
stable even after 4 months (Table 4). Since the complete mineralisation of BPA at the given
conditions (filtered water, cold temperature) is unlikely, the transformation product of the BPA has
been searched in the SPE-processed samples; this effort is still ongoing.
Table 2 Stability test of BPA in the treated wastewater (MBR influent)
Initial conc. (ng L-1)
After 2 months (ng L-1) pH 6.0 pH 7.0 pH 8.0 pH 9.0
1000 135 <LOQ <LOQ <LOQ
Table 3 Stability test of BPA in tap water
Initial conc. (ng L-1)
After 2 months (ng L-1) pH 6.0 pH 7.0 pH 7.6 pH 9.0
1000 <LOQ <LOQ <LOQ <LOQ
Table 4 Stability test of BPA in purified water
Initial conc. (ng L-1)
After 4 months (ng L-1) pH 5.7
500 526 1000 1089 2000 2329
Conclusions
The removal of Bisphenol A from biologically treated wastewater was studied in a pilot scale post-
treatment MBR using immobilised enzymatic treatment.
Pag.13
The membrane allowed efficient and reliable retention of the fsNP carrying the enzyme in the
reactor. It was possible to operate the MBR at high concentration of suspended solids (up to 12 g L-
1 total solids) with low membrane fouling rate. Correspondingly the bioreactor could be operated at
high enzymatic activity; however, certain loss of activity could not be avoided and addition of new
fsNP was necessary.
The concentration of BPA in the bioreactors was always lower in the MBR1 (NP treatment) but the
removal rates could not be directly and precisely evaluated, most probably due to the transformation
of the compound to another form during the storage of the samples and possible contamination due
to tubing system.
References
Ammann, E.M., Gasser, C.A., Hommes, G., and Corvini, P.F.X. (2013) Immobilization of de-fined
laccase combinations for enhanced oxidation of phenolic contaminants. Appl Microbiol Biot doi:
10.1007/s00253-013-5055-y
Hommes G, Gasser CA, Howald CBC, Goers R, Schlosser D, Shahgaldian P, Corvini PFX (2012)
Production of a robust nanobiocatalyst for municipal wastewater treatment. Bioresource Technol
115:8-15.
Zimmermann YS, Shahgaldian P, Corvini PFX, Hommes G (2011) Sorption-assisted surface
conjugation: a way to stabilize laccase enzyme. Appl Microbiol Biot 92:169-178.