Thematic Global Third Quarter 2017 - 银行-HSBC · Thematic Global Third Quarter 2017 Our cities:...
15
Thematic Global Third Quarter 2017 Our cities: a look into the future Growth, urbanisation and the climate challenge • Emerging market cities are key for global growth in coming decades... • ...and we may be seeing a peak in urbanisation in the west • Meanwhile cities are preparing for Climate Change, both in terms of mitigation and adaptation
Transcript of Thematic Global Third Quarter 2017 - 银行-HSBC · Thematic Global Third Quarter 2017 Our cities:...

Thematic Global
Third Quarter 2017
Our cities: a look into the futureGrowth, urbanisation and the climate challenge
• Emerging market cities are key for global growth in coming decades...
• ...and we may be seeing a peak in urbanisation in the west
• Meanwhile cities are preparing for Climate Change, both in terms of mitigation and adaptation

2
Executive Summary
Key implications
• Global growth is set to be dominated by emerging market urbanisation. There are significant investment implications for those with exposure to the fastest and slowest growing cities.
• Large investment in infrastructure is needed over the coming years to support growth. Asia alone may need to invest USD1.5trn per year by 2030.
• Demographics and new technologies may contribute to the stalling of developed markets’ urbanisation with implications for jobs, infrastructure and growth.
• Mitigating and adapting to climate change requires significant investment for cities (est. USD375bn1pa) which may in turn stimulate growth for certain industries and geographies.
Global growth dominated by EM urbanisation
In Emerging Markets (EM), urbanisation, the process of a population shifting from rural to urban areas, looks set to continue. We expect urbanisation in EM to be the dominant force of global growth in the coming decades. There is a clear link between urbanisation and the pace of economic growth. Just over half of the world’s population today lives in cities, but as much as 80% of global GDP is accounted for by them.
By 2030, 42 of the world’s 50 most populous cities will be in EM. By 2050, some 5.2bn people - most of the world population - will live in EM cities. If this does occur, then investors may have to look at the world through a different lens and there are significant investment implications for those with exposure to the fastest and slowest growing cities.
Asia needs USD1.5trn a year by 2030 invested in infrastructure to sustain growth
In order to maximise the growth potential currently on offer in EM, more infrastructure is needed. To sustain growth the Asian Development Bank estimates that Asia needs to invest USD1.5trn a year in infrastructure by 2030 (5.1% of GDP).
DM urbanisation may stall
Faced with ageing populations and the rise of decentralising technology, it is possible that in developed markets (DM) urbanisation could stall. In the coming years there may be a flow of citizens from DM cities to more rural areas affecting jobs, infrastructure, and growth. Disrupting technologies may benefit, whilst there are also implications for infrastructure and real estate prices as urban populations shrink.
Climate-smart cities – mitigating and adapting to climate change
Cities generate up to 70% of greenhouse gases and are exposed to related climate risks such as flooding and sea-level rise. City authorities are well placed to act and are already starting to do so, both in developed and emerging markets. To achieve the goal of limiting global warming to 2°C, as crystallised in the 2015 Paris Agreement, cities must adapt and this will require substantial investment. This in turn should stimulate growth in subsectors and companies in a range of industries and geographies.
If cities can successfully adapt to the changing climate, while providing clean infrastructure, we think they can continue to reap the economic benefits of urbanisation.
1 C40 (Network of the World’s 40 Megacities) initiative recently estimated that cities alone will need to spend USD375bn pa on sustainable infrastructure to 2020
3
Going to town
• Emerging market cities are key for global growth in coming decades
• Certain Chinese and Indian city populations projected to grow 50% by 2030
• To facilitate growth, emerging market cities will need a lot more infrastructure
Urbanisation in EMs will be the dominant force of global growth in the coming decades. By 2050, 5.2bn people - most of the world population - will live in EM cities, with just 440 of these cities accounting for half of global GDP growth. If this does occur, then investors may have to look at the world through a different lens and there are significant investment implications for those with exposure to the fastest and slowest growing cities.
Some key predictions*:
• 2017 will be the first year that more than half of the EM population lives in cities – but this is still much lower than the equivalent in the developed world (80%) suggesting there is plenty of scope for this to rise in EM
• By 2030, 42 of the world’s 50 most populous cities will be in emerging markets
• By 2050, 5.2bn people worldwide will live in EM cities
• Africa’s urban population is expected to rise by 200m in the next decade
*Source: HSBC, data from the UN Population Division and McKinsey
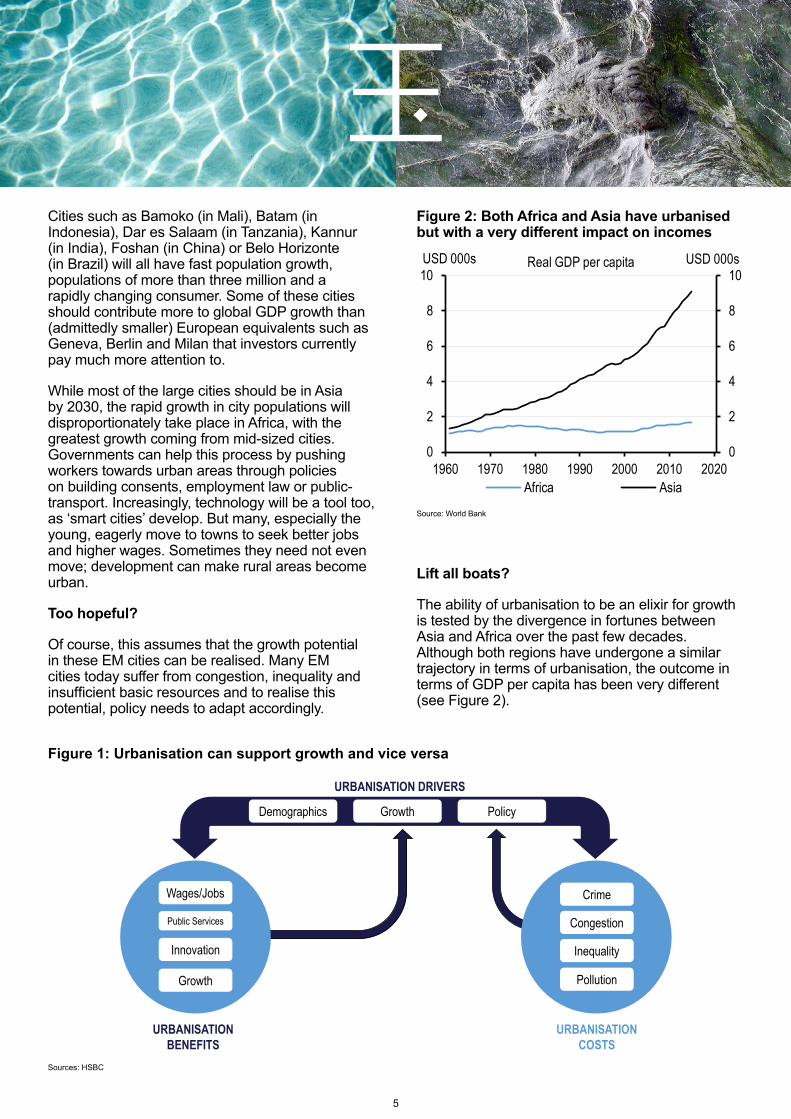
Economic growth rates and urbanisation are clearly linked: just over half of the world’s population live in cities but they generate four-fifths of global GDP. Urbanisation typically means economies of scale, higher productivity and shorter distances to market. It can facilitate better economic infrastructure, such as education, healthcare and transport, producing clusters of specialist workers that foster innovation. Figure 1 depicts how urbanisation can support growth and vice-versa.
Currently, 80% of people in developed countries live in cities compared with 50% in emerging economies; however, by 2030 places such as Dhaka, Karachi and Lagos will be among the world’s 10 biggest cities.
Indeed, by then, 81 of the world’s 100 most populous cities will be in EM.
A lot of the growth in the world economy is set to be generated in cities that many western economists and investors may not necessarily have heard of, let alone follow on a regular basis.
“by 2030 places such as Dhaka, Karachi and Lagos will be among the world’s 10 biggest cities.”

4
Source: HSBC
Key facts on urbanisation
75%of global GDP is accounted
for by cities
EM Cities2017
will be the first year that more than half of the EM population live in
cities
Africa’s urban population is expected to rise by 200min the next decade, and more people live in India’s 5 biggest cities than live in Germany.
These cities are expected to grow by more than 5m people in the next decade:
By 2030, China will have 17 cities more populous than Singapore. China will also have 148 cities with more than 1m inhabitants
2030 42 of the world’s 50 most populous cities will be in
emerging markets*
2050 5.2 billion people worldwide will
live in EM* cities
Even today, Brazil is more urbanised than the US
Kinshasa
Dhaka
SINGAPORE
CHINAKarachi
Delhi
Lagos
BRAZIL
5
Cities such as Bamoko (in Mali), Batam (in Indonesia), Dar es Salaam (in Tanzania), Kannur (in India), Foshan (in China) or Belo Horizonte (in Brazil) will all have fast population growth, populations of more than three million and a rapidly changing consumer. Some of these cities should contribute more to global GDP growth than (admittedly smaller) European equivalents such as Geneva, Berlin and Milan that investors currently pay much more attention to.
While most of the large cities should be in Asia by 2030, the rapid growth in city populations will disproportionately take place in Africa, with the greatest growth coming from mid-sized cities. Governments can help this process by pushing workers towards urban areas through policies on building consents, employment law or public-transport. Increasingly, technology will be a tool too, as ‘smart cities’ develop. But many, especially the young, eagerly move to towns to seek better jobs and higher wages. Sometimes they need not even move; development can make rural areas become urban.
Too hopeful?
Of course, this assumes that the growth potential in these EM cities can be realised. Many EM cities today suffer from congestion, inequality and insufficient basic resources and to realise this potential, policy needs to adapt accordingly.
Figure 2: Both Africa and Asia have urbanised but with a very different impact on incomes
Source: World Bank
Lift all boats?
The ability of urbanisation to be an elixir for growth is tested by the divergence in fortunes between Asia and Africa over the past few decades. Although both regions have undergone a similar trajectory in terms of urbanisation, the outcome in terms of GDP per capita has been very different (see Figure 2).
0
2
4
6
8
10
0
2
4
6
8
10
1960 1970 1980 1990 2000 2010 2020
USD 000sUSD 000s
Africa Asia
Real GDP per capita
Figure 1: Urbanisation can support growth and vice versa
Sources: HSBC
URBANISATION BENEFITS
URBANISATION COSTS
Growth
Wages/Jobs
Public Services
Innovation
Crime
Congestion
Inequality
Pollution
Demographics Growth Policy
URBANISATION DRIVERS

6
“the Asian region as a whole needs USD1.5trn per year (5.1% of projected GDP) of infrastructure investment by 2030”
This alludes to some key needs of policy when an economy urbanises. In Asia, urbanisation has been matched more often by the necessary infrastructure (water and sanitation, energy, transportation, information and communications), compared to African countries that urbanised at an earlier stage of their development. Equally, many African nations have previously faced a whole host of external limitations to growth such as war, disease and corruption.
Ultimately, the impact of urbanisation is determined by policy. With insufficient infrastructure to maximise the growth potential currently on offer in EM cities, more needs to be done.
Much more infrastructure is needed
To sustain the growth, EM cities will need more infrastructure. For example, many EM cities lack the metro networks of western cities as illustrated in Figure 3.
Figure 3: EM cities have inadequate transport networks for their large populations
Source: HSBC. Note: *Lagos to open in 2017. Populations in brackets. Maps show simple outlines of the city metro networks
Lagos* (11 million)
London (10 million)
Rio de Janeiro (13 million)
Mumbai (19 million)
The Asian Development Bank (ADB) estimates that the Asian region as a whole needs USD1.5trn per year (5.1% of projected GDP) of infrastructure investment by 2030 in order to keep growth on a sustainable path2. Policies aimed at improving power generation are top of the agenda, but transport, telecommunications and water & sanitation will all need investment totalling USD1.5trn per year for the next fifteen years.
Aside from traditional urban infrastructure, governments may also be able to meet the ongoing demand of rising urban populations through the use of technology, particularly in “smart-cities”. These cities will have more advanced public transport systems, better water and power supply management and greater participation from citizens. It is even possible that technology enables people to work remotely from rural areas, thus not necessitating a migration to the city in the first place. As technological adoption continues to rise, the opportunities for governments in EM to use these technologies may also increase.
Overall, it is clear that EM cities need considerable investment in infrastructure in order to sustain growth, and this brings with it challenges and opportunities.
2 Asian Development Bank – Meeting Asia’s Infrastructure Needs, 2017

7
“Overall, Chinese and Indian cities are expected to experience the greatest growth”
The fastest and the slowest (2015-2030)
In order to better understand where the growth will be in the coming decades we present two tables in this section showing the fastest and slowest growing EM and DM cities. Overall, Chinese and Indian cities are expected to experience the greatest growth, some of which are projected to grow 50% by 2030 (Table 1). Interestingly a number of DM cities are also growing quickly, largely in Australia and the US and have 20% forecast growth rates (Table 2).
Russian and South Korean cities have the slowest forecast growth rates in EM, and these rates are on a par with the slowest growers in DM – Japan, Italy, and Germany. Generalisation is often dangerous – with the US and Japan having both some of the fastest growing and slowest growing DM cities. This growth differentiation is significant, often surprising and will take place over a relatively short period of time. We believe it can have significant investment implications for those with exposure to the fastest and slowest growing cities.
Table 1: EM’s fastest and slowest growing cities (2015-2030)
Country City Pop growth Country City Pop growth
China Xiamen 56% Russia Saint Petersburg -1%
India Surat 53% Russia Moscow 0%
China Zhongshan 49% S. Korea Busan 1%
China Suzhou, Jiangsu 48% S. Korea Seoul 2%
India Bangalore 46% Greece Athens 4%
India Ahmadabad 43% Chile Santiago 9%
India Pune 41% Brazil Rio de Janeiro 10%Source: United Nations, Department of Economic and Social Affairs, Population Division (2014). World Urbanization Prospects: The 2014 Revision
Table 2: DM’s fastest and slowest growing cities (2015-2030)
Country City Pop growth Country City Pop growth
Israel Tel Aviv 21% Japan Kitakyushu-Fukuoka -3%
Australia Melbourne 21% Japan Tokyo -2%
USA Atlanta 19% Japan Kinki M.M.A. (Osaka) -1%
USA Houston 19% Japan Nagoya -1%
USA Phoenix-Mesa 18% Italy Milan 2%
Australia Sydney 18% Germany Berlin 3%
USA Dallas-Fort Worth 17% Italy Rome 3%Source: United Nations, Department of Economic and Social Affairs, Population Division (2014). World Urbanization Prospects: The 2014 Revision
Conclusion
For many emerging markets, while the potential growth is there, with growing, urbanising populations, policymakers need to react. In particular, significant investment in infrastructure is needed in order to sustain growth. If that can be done, then emerging market cities can be the biggest contributors to global growth over the coming decades, and investors may have to look at the world through a different lens.
8
Beyond urbanisation
• Digitalisation and decentralised technologies call into question some of the advantages cities enjoy
• This could see urbanisation stall in developed markets, affecting jobs, infrastructure and growth
• Industries and technologies exposed to this trend may continue to benefit
In contrast to EM, developed economies, faced with ageing populations, may start to see their workers focus more on the negatives of living in big cities and turn their backs on them.
While the UN expects DM to continue to see a higher share of the population living in cities – rising to 85% by 2050 from 78% today – we are more sceptical. Instead, it is possible that DM may have reached peak urbanisation and in the coming years there may be a flow of citizens from DM cities to more rural areas. We see two key drivers behind this - demographics and technology.
The demographic drag
Younger populations are more likely to move to the cities, and that certainly plays out in the data. Across the world, urbanisation rates are highest for the 20-35 age group.
In the developed world, this share of the population of prime urbanising age is on the wane; less than 20% of the population are in this age group and this is also in sharp decline with most markets expected to replicate Japan over the next 10-15 years. This puts a huge drag on the possible pace of urbanisation.
Technological shift
The negatives of living in a big city such as higher crime rates, congestion, pollution, and higher cost of living, have long been considerations but with improving technology, the benefits of city dwelling can now increasingly be enjoyed elsewhere. In short, technology changes are enabling citizens to maintain connectivity in more rural areas.
The latest general purpose technologies such as the computer, internet and business virtualisation are the key drivers of this technological shift. More specifically, these potentially transformative technologies include: virtual reality, artificial intelligence (AI), robotics, autonomous vehicles, telemedicine and 3D printing. Some of these may seem like a distant prospect, yet even today, ride-hailing, online retail, a shift to e-commerce, online education, working from home and experiential apps are all helping to reshape cities.
Accelerated adoption of the latest technologies (Figure 4) could already have started to tip the balance in favour of decentralisation. At the same time, city growth rates are naturally plateauing due to declining birth rates and worsening demographics. It is therefore possible that urbanisation could stall in DM, affecting jobs, infrastructure, and growth.

9
Figure 4: The acceleration of general purpose technologies today
9000-7000 BC
4000 BC 3000 BC 0 to 16th century
18/19thcentury
20/21st century
0
12
8
6
4
10
2
However, the picture could differ from the one we portray. For example, in developed countries, there is a risk that legacy technologies, infrastructure and current policies could prevent this new decentralised digital, autonomous and virtual era from being embraced wholeheartedly.
Nonetheless, we think it is helpful to consider the implications of such a shift, particularly in terms of the disrupting technologies which may benefit, and what it means for jobs, infrastructure and real estate within the cities.
The technologies reshaping cities
In this section, we list just a few of the relevant technologies. Whilst the list is not exhaustive it illustrates the wide range of technologies emerging and in many cases, already available, which are reshaping cities today and may continue to do so in the future.
• Experiential virtualisation: business virtualisation technologies allow knowledge workers to work from home or any location with internet access. This includes virtual reality and haptics3.
Source: Economic Transformations: General Purpose Technologies and Long Term Economic Growth, Richard G Lispey
• Experiential apps: Instant messaging and experiential apps are the new virtual “interaction spheres” for the digitally savvy; these make it possible to meet people online with common interests globally.
• AI, robotics, computer speech recognition and vision: robots using AI may displace large numbers of paid workers and could reduce the number of jobs in cities.
• Physical autonomous transport: can reduce the volume of vehicles on the road and therefore increase suburb reach. This includes ride hailing companies, autonomous vehicles, delivery services, and power storage solutions. Electric vehicle manufacturers and related suppliers, may also benefit given the push for clean energy road transportation.
• Telemedicine: as bespoke healthcare becomes possible with the plunging costs of genome sequencing (see Figure 5) and remote diagnosis is enabled through technology, first line medical screening could be provided through a smartphone. This would reduce the need for citizens to live in proximity to big hospitals/big cities to obtain the best treatment.
• Online education, online retail, online restaurant services (ordering & delivery): this includes open online courses and home schooling options (EdTech), on-demand streaming content, broad and specialist online market places.
• Transactional commerce: instant electronic in-person money transfer business, including mobile phone-based money transfer.
3 The science and technology of applying sensation and control in interacting with computers.

10
Figure 5: Cost per genome falling faster than even Moore’s Law (cost per genome USDm)
These are just a few of the disrupting technologies that are helping to reshape cities and will potentially permit citizens to access work, leisure and healthcare anywhere, even in remote locations. It is important to note that all of this is dependent on the availability of high-speed broadband infrastructure everywhere.
In DM many of these developments seem possible even today. In EM, traditional infrastructure such as fixed line internet still requires considerable investment to catch up therefore further urbanisation seems more likely. However, it is also worth considering that many emerging nations do not have the legacy issues seen in developed markets. In DM, there is a risk that legacy technologies, infrastructure and current policies could prevent a new decentralised era from being embraced wholeheartedly. The lack of legacy infrastructure in EM might even help them to adopt disruptive technologies faster than the developed world. Smartphones mean people living outside cities need not miss out on education and drones can deliver goods to remote homes.
Source: Genome.gov
The possible impact on jobs and real estate
Perhaps two of the more obvious impacts of automation are firstly the impact on jobs – robots using AI could automate physical tasks once the domain of humans: Baristas4, chefs5, retail sales support6, package deliveries for e-commerce7. Secondly, should there be net migration from DM cities to more rural areas, there are implications for infrastructure and real estate prices as urban populations shrink.
As a result, both residential and commercial real estate prices could come under pressure within these urban sprawls, especially if government policy continues promoting construction of new housing stock more evenly distributed throughout the rest of the country.
Conclusion
Disruptive innovations, suitable supportive policies, population dynamics and social preferences could permit the DM city, as we know it, to decentralise over the coming decades. EM cities may continue to grow for now as policymakers try to catch up on traditional infrastructure build-up in order to deliver the necessary services to the population. However, modern innovations could also allow EM to leapfrog DM by skipping the need to build out legacy infrastructure, bypassing the necessity and advantages offered by centralised dense cities.
“In 2000, the full genome cost USD100m. It could soon be done under USD1000” “Technology: the USD1,000 genome” Nature, March 2014
4 “Robot baristas serve up the future of coffee at Cafe X”, The Wall Street Journal, January 2017.5 “The world’s first home robotic chef can cook over 100 meals”, Forbes, October 2016.6 “Lowe’s introduces autonomous service robots to retail stores”, ZDNet, August 2016.7 “Forgot drones - Google explores robot deliveries”, MIT Technology Review, December 2016.
0.00010.0010.010.1110100
0.00010.0010.010.1
110
100
2001 2005 2008 2011 2014
Approximation of Moore's Law

11
Climate-smart cities
• ‘Climate-smart’ cities embrace efficiency and low carbon technologies
• Cities, both in DM and EM, are already acting to mitigate and adapt to climate change – this looks set to increase
• Spending requirements are increasing, and we expect an uptick in innovative financing, including green city bonds
The climate challenge for cities
Atmospheric greenhouse-gas (GHG) emissions are the highest in more than 800,000 years. On a global basis, the Global Facility for Disaster Reduction and Recovery estimates that, unless preventative action is taken, climate change-related natural disasters will put at risk 1.3bn people by 2050 and assets worth USD158trn (in 2015 the global economy was USD75trn).
Cities are exposed to rising sea levels, floods, droughts, higher average temperatures and short-term heatwaves. To address climate change, cities – which generate up to 70% of GHGs – must emit less greenhouse gas and be resilient to impacts from warmer temperatures. Those cities that strive towards these goals, we call ‘climate-smart’.
There are two areas that climate-smart cities can focus on, firstly seeking to mitigate climate change and, secondly, seeking to adapt to the adverse effects.
City authorities are well placed to act given their potential for faster decision-making and control over specific budgets. Encouragingly, as we discuss later, they are already starting to act, both in developed and emerging markets. Cities need to adapt to climate change and those that do will protect their population and economy, and are less likely in our opinion to experience net outward migration.
Mitigating climate change
A key challenge that climate-smart cities must face is to reduce urban greenhouse gas emissions. In this section we focus on some major areas where they may seek to do so and the potential opportunities, through technology, that could arise. We believe that cleaner transport and green buildings will be key to urban policy agendas. Additionally, we expect clean power and decentralised heating technologies to be an increasing area of policy focus and investment.
Transport – reducing emissions
Transport, accounting for 23%8 of city emissions, is a key area of focus. Reducing emissions is targeted by climate-smart cities in two ways, through clean electrified mass public transit and by replacing oil-feedstock vehicles with alternative fuel vehicles.
Possible solutions: Transport solutions include clean and efficient mass public transit, electric and hybrid cars, electric vehicle charging infrastructure, fuel cell cars, biofuel vehicles and other fuel efficiency technologies.
“cities generate up to 70% of greenhouse gas emissions”
8 UN-HABITAT, Global report on human settlements 2011
12
Buildings - reducing energy consumption
Residential and commercial buildings account for 13% of city GHG emissions9 and are another important area of focus. GHG emissions can be reduced through the design and construction of more efficient new buildings and by retrofitting existing buildings with insulation, glazing, low-energy appliances, lighting and roofing. Furthermore, given the significant fall in the cost of various solar technologies and battery storage, we think this will facilitate more buildings in climate-smart cities to be self-sufficient in clean power generation (e.g. roof-top solar).
Possible solutions: There already exists a range of technologies that can reduce the use of energy in buildings. These include LED/OLED lighting, insulation, heating, ventilation and air conditioning (HVAC) and smart systems in buildings.
Power - decarbonising power generation
There are two ways in which climate-smart cities can generate clean power. Firstly, by decentralising power generation using renewable sources within the city limits and; secondly cities may increasingly attempt to procure clean energy in the future. Such green procurement can already be seen. In the US, for instance, large cities such as San Francisco and Chicago have pledged to buy 100% renewable energy (by 2030 and 2035, respectively).
Possible solutions: Clean energy producing solutions include solar, wind, bio-energy, nuclear and small hydro. It also covers the entire value chain of clean energy technologies from raw materials, plant and equipment to specialised services & technologies.
Progress so far
Cities are already starting to act, both in developed and emerging markets.
The Climate Disclosure Project (CDP) Global Cities Report 2016 identified a 70% increase in cities disclosing climate data since the Paris Agreement was adopted. Meanwhile, over 12,500 cities have climate plans and many are setting more stretching emissions targets than their national governments. Some are showing true ambition – Stockholm, Copenhagen and Melbourne have pledged to reach zero carbon, with different timeframes.
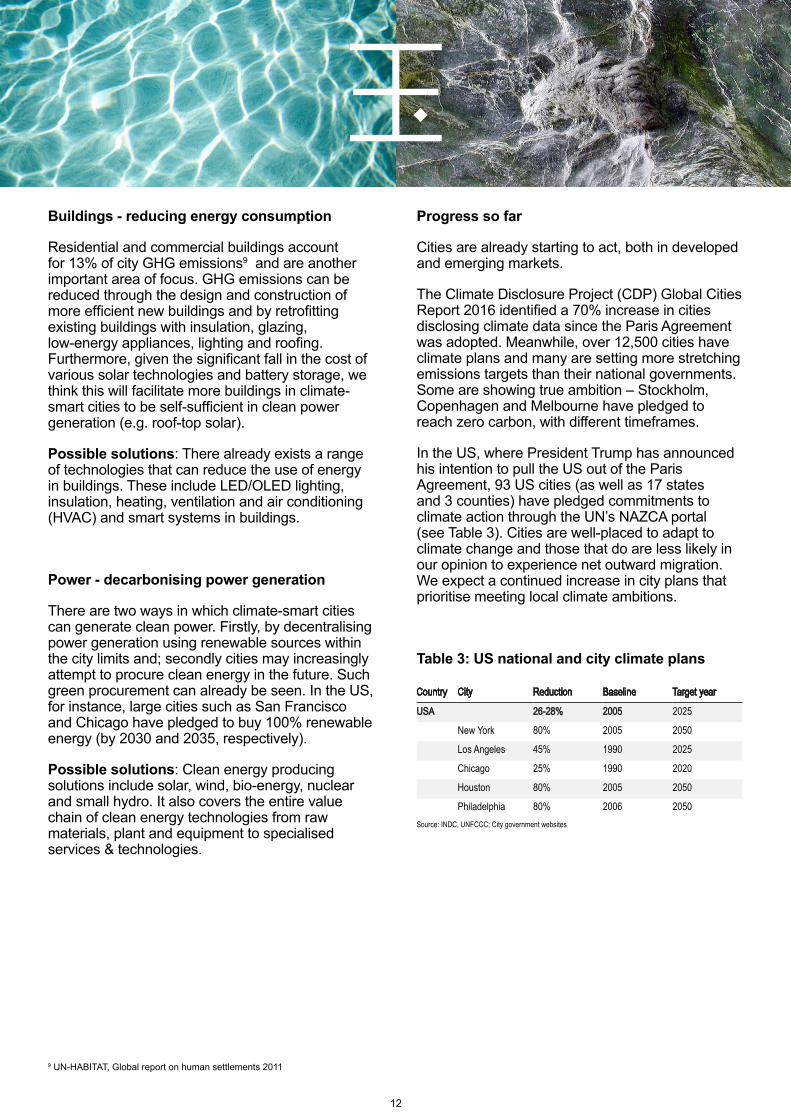
In the US, where President Trump has announced his intention to pull the US out of the Paris Agreement, 93 US cities (as well as 17 states and 3 counties) have pledged commitments to climate action through the UN’s NAZCA portal (see Table 3). Cities are well-placed to adapt to climate change and those that do are less likely in our opinion to experience net outward migration. We expect a continued increase in city plans that prioritise meeting local climate ambitions.
Table 3: US national and city climate plans
Country City Reduction Baseline Target year
USA 26-28% 2005 2025
New York 80% 2005 2050
Los Angeles 45% 1990 2025
Chicago 25% 1990 2020
Houston 80% 2005 2050
Philadelphia 80% 2006 2050Source: INDC, UNFCCC; City government websites
9 UN-HABITAT, Global report on human settlements 2011

13
Adaptation
Buildings adapted to meet the challenges of climate change should be able to withstand extreme weather. Temperature variation will bring new heating and cooling requirements to buildings and therefore different energy profiles.
It is encouraging that the rate at which cities are investing in adaptation is increasing, from both developed and EM cities. Figure 6 shows the results of research described in a 2016 academic paper (Georgeson et al, 2016 in Nature journal), which found a 27.5% increase in total spend on adaptation by ten cities over a six-year period to over USD6bn.
This chart also shows a trend of a growing rate of increase in adaptation – i.e. positive momentum – which we think is representative of the fact that administrations are increasingly recognising that the effects of climate change are already with us and resilience must be built up now.
Cities are also spending on developing resilience to extreme events in infrastructure. In a relatively recent example, post-Hurricane Sandy, in June 2013, New York launched the Special Initiative for Rebuilding and Resiliency, to deploy USD14bn to build infrastructure resilience.
Adaptation requirements will necessitate considerable expenditure by cities. If cities can successfully adapt to the changing climate, while providing clean infrastructure, we think they can continue to reap the economic benefits of urbanisation.
Figure 6: Positive momentum for city adaptation spend
-2
0
2
4
6
8
10
2009-10 2010-11 2011-12 2012-13 2013-14 2014-15
New York London Paris BeijingMexico City São Paulo Mumbai JakartaLagos Addis Ababa Average
%
For the year 2012-13, Lagos and Addis Ababa had a negative growth rate of -5.8% and -25.8% respectively
Annu
al ex
pend
iture
grow
th
Source: Data from Georgeson et al (2016), Nature Climate Change
14
Carbon finance
Climate change mitigation and adaptation on a global basis, requires large investment sums. There is an estimated total annual spend of between USD0.7-5.7trn through to 203010 and the C4011 initiative recently estimated that cities alone will need to spend USD375bn pa on sustainable infrastructure to 2020. 397 city respondents to the CDP identified over a thousand economic opportunities related to climate change12.
Innovative finance solutions should support cities in meeting mitigation and adaptation goals and finance may come from a number of sources, ranging from green and sustainability bonds to carbon price revenue and road tolls.
“green bonds have an important role to play in financing the transition to urban climate-smartness cities”
Green and sustainability bonds are a relatively new category of fixed income instruments (green bonds are for environmental projects and sustainability bonds also include social uses of proceeds). In a smart cities context, these instruments can be used to finance green buildings, energy and transport infrastructure. Notably, city green and sustainability bond issuance has grown considerably in recent years, with a combined 2016 total five times higher than in 2012. In our view, green bonds have an important role to play in financing the transition to urban climate-smartness.
There are also many other possible sources of financing. These include international finance support (e.g. Green Climate Fund), road tolls & emissions charging, cycling schemes/subsidies, building efficiency incentives, carbon price revenue and removal of oil subsidies (as is already the case in Saudi Arabia, India and Indonesia).
Cities can do many things to mitigate climate change by investing in sectors including buildings, transport and power to reduce emissions – all of which will require financing. This brings opportunities for companies with revenue exposed to climate themes such as transport efficiency, buildings efficiency, energy storage and low carbon power. Clean power and decentralised heat technologies may also increasingly be an area of focus.
Conclusion
Cities have an opportunity to lead the way in mitigating GHGs and achieving global climate ambition. But they must also adapt to the changes brought about by a warming climate. Both will require substantial investment.
These responses in turn will stimulate growth in subsectors and companies in a range of industries and geographies. Sectors with revenue exposure to this climate theme include: transport efficiency, buildings efficiency and low-carbon power sectors. As cities adapt to climate change, we also expect consumption patterns to alter: more energy demand for cooling but possibly less for heating, clothes designed for changing weather, and products and services to address health impacts. In addition, construction and energy companies will face new challenges and new markets in building resilience.
Encouragingly, we think cities are already becoming climate-smart. If cities can successfully adapt to the changing climate, while providing clean infrastructure, we think they can continue to reap the economic benefits of urbanisation.
10 HSBC, Financing the Climate, 20 April 201611 Network of the World’s 40 Megacities12 See the CDP Global Cities Report 2016

Disclosure appendix
1. This report is dated as at 03 July 2017.
2. All market data included in this report are dated as at close 29 June 2017, unless a different date and/or a specific time of day is indicated in the report.
3. HSBC has procedures in place to identify and manage any potential conflicts of interest that arise in connection with its Research business. HSBC’s analysts and its other staff who are involved in the preparation and dissemination of Research operate and have a management reporting line independent of HSBC’s Investment Banking business. Information Barrier procedures are in place between the Investment Banking, Principal Trading, and Research businesses to ensure that any confidential and/or price sensitive information is handled in an appropriate manner.
4. You are not permitted to use, for reference, any data in this document for the purpose of (i) determining the interest payable, or other sums due, under loan agreements or under other financial contracts or instruments, (ii) determining the price at which a financial instrument may be bought or sold or traded or redeemed, or the value of a financial instrument, and/or (iii) measuring the performance of a financial instrument.
Disclaimer
This document is prepared by The Hongkong and Shanghai Banking Corporation Limited (‘HBAP’), 1 Queen’s Road Central, Hong Kong. HBAP is incorporated in Hong Kong and is part of the HSBC Group. This document is distributed by HSBC Bank Canada, HSBC Bank (China) Company Limited, HSBC France, HBAP, HSBC Bank (Singapore) Limited and HSBC Bank plc (collectively, the “Distributors”) to their respective clients. This document is for general circulation and information purposes only. This document is not prepared with any particular customers or purposes in mind and does not take into account any investment objectives, financial situation or personal circumstances or needs of any particular customer. HBAP has prepared this document based on publicly available information at the time of preparation from sources it believes to be reliable but it has not independently verified such information. The contents of this document are subject to change without notice. HBAP and the Distributors are not responsible for any loss, damage or other consequences of any kind that you may incur or suffer as a result of, arising from or relating to your use of or reliance on this document. HBAP and the Distributors give no guarantee, representation or warranty as to the accuracy, timeliness or completeness of this document. This document is not investment advice or recommendation nor is it intended to sell investments or services or solicit purchases or subscriptions for them. You should not use or rely on this document in making any investment decision. HBAP and the Distributors are not responsible for such use or reliance by you. You should consult your professional advisor in your jurisdiction if you have any questions regarding the contents of this document. You should not reproduce or further distribute the contents of this document to any person or entity, whether in whole or in part, for any purpose. This document may not be distributed to any jurisdiction where its distribution is unlawful.
© Copyright 2017. The Hongkong and Shanghai Banking Corporation Limited, ALL RIGHTS RESERVED.
No part of this document may be reproduced, stored in a retrieval system, or transmitted, on any form or by any means, electronic, mechanical, photocopying, recording or otherwise, without the prior written permission of The Hongkong and Shanghai Banking Corporation Limited.