
Their Solid Solutions by Microwave Irradiation Synthesis...
9
Subscriber access provided by RICE UNIV Chemistry of Materials is published by the American Chemical Society. 1155 Sixteenth Street N.W., Washington, DC 20036 Synthesis of Chalcopyrite Semiconductors and Their Solid Solutions by Microwave Irradiation Christopher C. Landry, Jason Lockwood, and Andrew R. Barron Chem. Mater., 1995, 7 (4), 699-706 • DOI: 10.1021/cm00052a015 Downloaded from http://pubs.acs.org on January 13, 2009 More About This Article The permalink http://dx.doi.org/10.1021/cm00052a015 provides access to: • Links to articles and content related to this article • Copyright permission to reproduce figures and/or text from this article
Transcript of Their Solid Solutions by Microwave Irradiation Synthesis...

Subscriber access provided by RICE UNIV
Chemistry of Materials is published by the American Chemical Society. 1155 SixteenthStreet N.W., Washington, DC 20036
Synthesis of Chalcopyrite Semiconductors andTheir Solid Solutions by Microwave IrradiationChristopher C. Landry, Jason Lockwood, and Andrew R. Barron
Chem. Mater., 1995, 7 (4), 699-706 • DOI: 10.1021/cm00052a015
Downloaded from http://pubs.acs.org on January 13, 2009
More About This Article
The permalink http://dx.doi.org/10.1021/cm00052a015 provides access to:
• Links to articles and content related to this article• Copyright permission to reproduce figures and/or text from this article

Chem. Mater. 1995, 7, 699-706 699
Synthesis of Chalcopyrite Semiconductors and Their Solid Solutions by Microwave Irradiation
Christopher C. Landry, Jason Lockwood, and Andrew R. Barron” Department of Chemistry, Harvard University, Cambridge, Massachusetts 02138
Received October 24, 1994. Revised Manuscript Received January 25, 1995@
Chalcopyrite semiconductor compounds, MIMII’E2 (MI = Cu, Ag; M’II = Al, Ga, In; E = S, Se, Te), have been prepared by microwave irradiation of appropriate mixtures of the pure elements in a domestic microwave oven and characterized by X-ray diffraction (XRD) and energy-dispersive X-ray (EDX) analysis. Alloys of the type CuInSxSe2, and CuInSexTe2, (0 < x < 2 ) analyzed by XRD show that solid solutions are formed and there is no site preference for one chalcogenide over another. The crystallographic lattice parameters a and c were found to increase linearly rather than parabolically with increasing amounts of selenium. The exact atomic ratios of each element, as determined by EDX techniques, indicate that in all reactions the products are indium-rich p-type semiconductors. Attempts to prepare alloys of the type CuInSxTe2., (0 x < 2 ) resulted in a mixture of CuInS2, CuInTe2, and CuInSo.3- Te1.7. The formation of CuInSo.3Tel,.r appeared to be independent of the S:Te reagent ratio and possibly represents a limit of the sulfur solubility in CuInTe2. It does demonstrate that metastable phases usually precluded by traditional syntheses can be prepared by microwave irradiation. The formation of continuous sulfide-selenide and selenide-telluride solid solutions but not sulfide-telluride alloys is discussed with respect to the relative ionic radii of the chalcogenides and the 2-c l a (A) values. While AgInSe2 forms only the tetragonal chalcopyrite phase, AgInS2 and AgInTe2 formed additional orthorhombic and cubic phases, respectively. No evidence for the formation of AgAlEz could be obtained although CuAlE2 (E = S, Se) were formed, albeit as poorly crystalline samples.
Introduction
Ternary metal chalcogenides such as CuInS2 and CuInSez have been the focus of much recent research.l These “I-III-VI2” semiconductors have direct bandgaps of 1.53 and 1.04 eV, respectively,2 making them ideal for terrestrial solar cell application^.^ They also have a significant fabrication advantage over 111-V semi- conductors for solar cell applications, since polycrystal- line films may be used, as opposed to epitaxial single crystal films. Although several methods have been reported for preparing these chalcopyrites as thin films (such as evaporation, sputtering, laser ablation, and chemical vapor deposition), many of these require the prior synthesis of bulk material. Traditionally, bulk materials have been prepared by the sintering of the element^,^ a process that requires some combination of high temperatures, long reaction times, and specialized apparatus. Recent efforts to develop new syntheses of bulk chalcopyrites have focused on the pyrolysis of organometallic precur~ors .~-~ While it is useful in other
* To whom correspondence should be addressed. @ Abstract published in Advance ACS Abstracts, March 1, 1995. (1) (a) Schock, H.-W. Mater. Res. Soc. Bull. 1993, 28, 42. (b)
Woodyard, J.; Landis, G. A. Solar Cells 1991, 31, 297. (c) Walter, T.; Ruckh, M.; Velthaus, K. 0.; Schock, H.-W. In Proc. 11th EC Photovol- taics Solar Energy Conf, Hanvood Academy Publishers: New York, 1992; p 124. (d) Devaney, W. E.; Mickelson, R. A.; Chen, W. S. In Proc. 10th ZEEE Photovoltaic Specialists Conf.; New York, 1986, p 1733. (e) Noufi, R.; Matson, R. J.; Powell, R. C.; Herrington, C. Solar Cells 1986, 16, 479.
( 2 ) Semiconductors, other than Group N Elements and ZZI-V Compounds; Madelung, O., Ed., Springer-Verlag: New York, 1992.
(3) Woodyard J.; Landis, G. A. Solar Cells 1991, 31, 297. ( 4 ) Guy, A. G. Introduction to Materials Science, McGraw-Hill:
Marietta, OH, 1972.
0897-475619512807-0699$09.00/0
applications, these methods are not usually used for solar cell fabrication. This is due to the difficulty in controlling the stoichiometry of the films, because two and sometimes three precursor sources are used, in- creasing the possibility of side-product formation. One solution to this problem would be to use a single-source precursor, thus controlling the stoichiometry of the films by using the correct number of each type of atom in the starting material. Very recently, several compounds have been proposed as single-source precursors;s how- ever, thin films from their decomposition have not, as yet, been evaluated for use in solar cells. The goal of our research has been to develop new methods of synthesis of bulk material that will serve as precursor material for physical vapor deposition methods.
Within the past few years, it has been suggested that microwave radiation may be used to increase the rate of selected chemical reaction^.^ However, it is only recently that solid-state reactions involving metals have been attempted.gd In our laboratory, we have recently used microwave irradiation to synthesis samples of bulk CuInEz (E = S, Se) in as little as 3 min.1° Furthermore,
( 5 ) Nomura, R.; Fuji, S.; Kanaya, K.; Matsuda, H. Polyhedron 1990, 9, 361.
(6) Dhingra, S.; Kim, &-W.; Kanatzidis, M. G. Mater. Res. SOC., Symp. Proc. 1991,204, 163.
( 7 ) Kim, K.-W.; Dhingra, S.; Kanatzidis, M. G. Abstract 141, 199th ACS National Meeting, Boston, MA, April 1990.
(8) (a) Nomura, R.; Seki, S.; Matsuda, H. J. Mater. Chem. 1992,2, 765. (b) Hirpo, W.; Dhingra, S.; Sutorik, A.; Kamatsidis, M. G. J. Am. Chem. SOC. 1993,115, 1597.
( 9 ) (a) Guy, A. G. Introduction to Materials Science; McGraw-Hill: Marietta, OH, 1972. (b) Mingos, D. M. P.; Baghurst, D. R. Chem. Soc. Rev. 1991,20, 1. (b) Baghurst, D. R.; Mingos, D. M. P. J. Chem. Soc., Chem. Commun. 1992,674. (c) Whittaker, A. G.; Mingos, D. M. P. J. Chem. SOC., Dalton Trans. 1992, 2751.
0 1995 American Chemical Society

700 Chem. Mater., Vol. 7, No. 4, 1995
Table 1. Experimentally Determined d Spacing (A) of Copper and Silver Indium Dichalcogenides Synthesized
by Microwave Radiationa
Landry et al.
peaks confirms that the intended products are the only crystalline compounds formed. Other possible products with stoichiometries other than 1:1:2 (Cu:In:chalcogen) are not formed as crystalline materials. In addition, the formation of CuInSSe and CuInSeTe is not accompanied by that of the separate chalcogenides (CuInSz, CuInSez, or CuInTez), even for short reaction times.
X-ray photoelectron spectral ( X P S ) analysis of the products indicates that the constituents are not present in their elemental forms. Carbon and oxygen peaks observed are due to adventitious hydrocarbons adsorbed on the surface.
On the basis of EDX analysis of the crystalline particles, all the copper indium dichalcogenide materials prepared by microwave irradiation are higher in indium and lower in chalcogenide content, particularly sulfur, than would be expected from calculation. Both of these variations may be explained by the formation of a small amount of amorphous copper chalcogenides; addition- ally, in the case of sulfide materials, the low sulfur content may arise from the formation of polysulfides on the inner surface of the quartz reaction tubes.
Investigation of the Reaction Sequence. There are a number of possible pathways by which the copper, indium, and chalcogen can combine, and it is always difficult to determine the intimate mechanism of a solid state reaction. However, several additional reactions involving copper, indium, and sulfur were performed from which it was hoped a reaction sequence may be determined for chalcopyrite formation.
Since the temperatures reached are certainly high enough to melt indium (mp = 157 "C), one might envisage a multistep process in which the copper heats up and melts the indium, possibly forming a copper indium alloy which subsequently reacts with the sulfur (eq 3). It has recently been shown that CuIn alloy reacts with sulfur to give C~1nSz . l~
(3) A +2s
Cu + In - CuIn - CuInS,
CuInTez AgInSf AgInSez hkl (34-1498) CuInSeTe* (25-1330) (35-1099)
112 3.58 (3.58) 3.46 3.33 (3.34) 3.44 (3.47) 200 2.92 (2.94) 3.05 (3.05) 211 2.70 (2.71) 2.62 213 2.30 (2.30) 2.23 220/204 2.19 (2.19) 2.12 2.07 (2.07) 2.15 (2.16)
2.02 (2.03) 2.11 (2.11) 312/116 1.87 (1.87) 1.80 1.76 (1.76) 1.83 (1.83)
1.70 (1.70) 1.77 (1.78) 400/008 1.55 (1.55) 1.50 1.44 (1.40) 1.52 (1.52) 332/316 1.42 (1.42) 1.37 1.35 (1.34) 1.39 (1.39)
1.37 (1.37)
a Literature values from JCPDS files given in parentheses. No entry for CuInSeTe was found in the Joint Committee on Powder Diffraction Standards (JCPDS) database. Additional minor peaks observed due to the orthorhombic phase (JCPDS-25-1328); 3.48 (200), 3.14 (1211, 2.43 (1221, 1.76 (042).
the mixed chalcogenide CuInSSe was prepared without the concurrent formation of CuInS2 andlor CuInSez. This suggests that microwave synthesis would enable the rapid and simple preparation of the solid solutions CuInE2,E', (E * E' = S, Se, Te) with a high degree of control over the chalcogenide content. Furthermore, the rapid reaction rates possible during microwave irradia- tion open the possibility of the synthesis of metastable phases.
In this paper, we give full details of the synthesis of the chalcopyrite semiconductors, MIMIIIEz, and describe the use of microwave irradiation to prepare the solid solutions CuInEz.,E', (0 < A: < 2).
Results and Discussion
Synthesis of Copper Indium Dichalcogenides. We have previously reported the synthesis of CuInSz, CuInSSe, and CuInSez, via the microwave irradiation of stoichiometric amounts of the pure elements sealed under vacuum; cf. eqs 1 and 2.
Cu + In + 2E CuInE,
Cu + In + S + Se - CuInSSe (2)
The synthesis of the tellurides CuInSeTe and CuInTez may be accomplished in a similar manner (see Experi- mental Section). As was also noted previously, all the samples show spherical crystals, consistent with their formation from a melt (see below).
A comparison of the XRD spectra of CuInEz with reported data of known Cu-In-chalcogenide phases shows that in all cases the chalcopyrite phase is formed as the exclusive crystalline product. Table 1 gives the calculated interplanar d spacings for CuInSeTe and CuInTe2 along with the corresponding literature values (a similar table for CuInSz, CuInSSe, and CuInSez is given in ref 10). The data show that the products formed by microwave irradiation are identical to those formed by other means.11-13 The lack of any extraneous
(10) Landry, C. C.; Barron, A. R. Science 1993,260, 1653. (11) Hahn, H.; Frank, G.; Klingler, W.; Meyer, A.; Storger, G. 2.
(12) Cambi, L.; Elli, M. Chem. Ind. 1968, 50, 94. (13) Sui, D.; Nagpal, K.; Ghandha, G. J . Appl. Crystullogr. 1989,
Anorg. Allg. Chem. 1963,271, 153.
22, 578.
However, microwave irradiation of a stoichiometric mixture of copper and indium under the identical reaction conditions to that described above but in the absence of sulfur does not yield the CuIn alloy. Instead no reaction was observed as indicated by XRD. In fact, although the indium clearly melts, the copper and indium segregate, suggesting that the indium had melted but no dissolution of the copper had occurred.
A second possible reaction sequence is that indium and sulfur react to form In2S3, which subsequently react with copper and sulfur to give the chalcopyrite (eq 4).
(4) +2cu, s
21n + 3s A. I~,s, - 2CuInSz
However, subjecting indium and sulfur to microwave irradiation does not give In2S3. In fact, no reaction occurs whatsoever and the reaction tube becomes only slightly warm to the touch following several minutes of microwave irradiation. This shows that the dielectric loss of indium is not high enough to create sufficient heat to initiate the reaction; for comparison, the con- ductivity of copper is 0.652 mho m-l, while that of indium is only 0.119 mho.m-l.15
(14) Murthy, S. N. J . Muter. Chem. 1991, I , 929.
Synthesis of Chalcopyrite Semiconductors
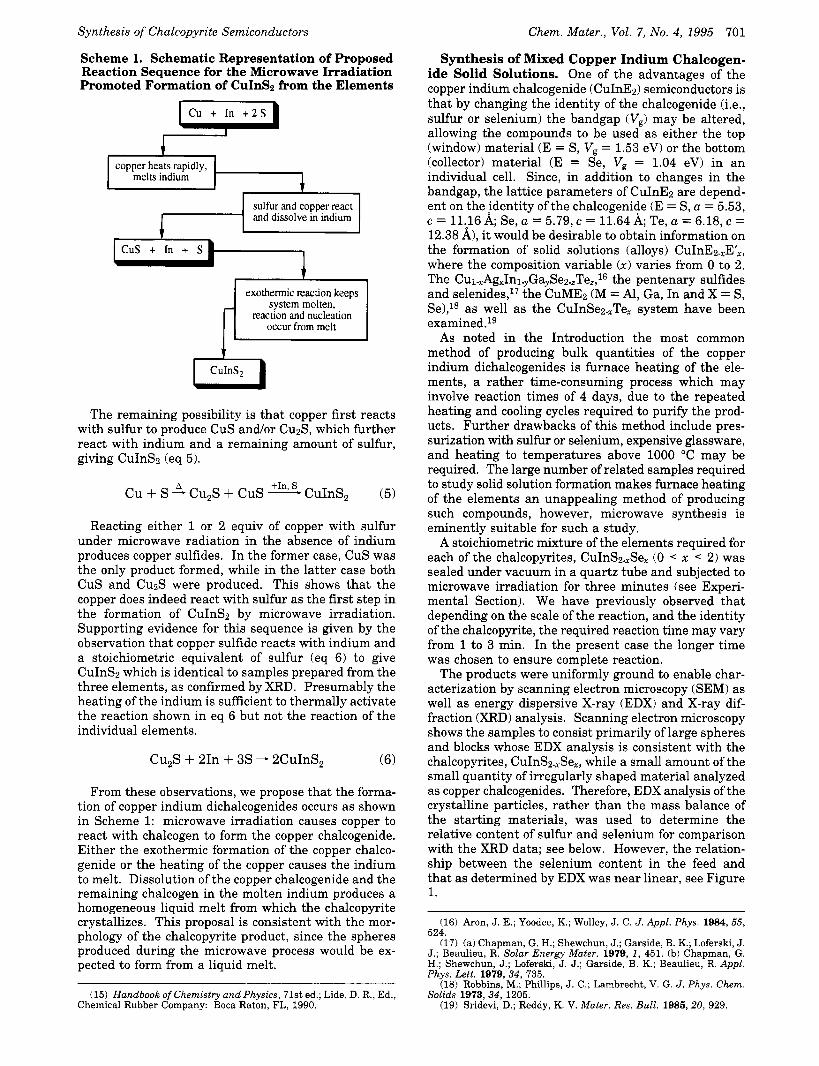
Scheme 1. Schematic Representation of Proposed Reaction Sequence for the Microwave Irradiation Promoted Formation of CuInSB from the Elements
Cu + In + 2 S 0
Chem. Muter., Vol. 7, No. 4, 1995 701
Synthesis of Mixed Copper Indium Chalcogen- ide Solid Solutions. One of the advantages of the copper indium chalcogenide (CuInE2) semiconductors is that by changing the identity of the chalcogenide (i.e., sulfur or selenium) the bandgap (V,) may be altered, allowing the compounds to be used as either the top (window) material (E = S, V, = 1.53 eV) or the bottom (collector) material (E = Se, V, = 1.04 eV) in an individual cell. Since, in addition to changes in the bandgap, the lattice parameters of CuInEz are depend- ent on the identity of the chalcogenide (E = S, u = 5.53, c = 1 1 . 1 6 ~ ; S e , a = 5 . 7 9 , ~ = 1 1 . 6 4 A ; T e , u = 6 . 1 8 , ~ = 12.38 A), it would be desirable to obtain information on the formation of solid solutions (alloys) CuInE2.,E',, where the composition variable ( x ) varies from 0 to 2. The Cu~,AgxIn~,GaySez.,Te,,16 the pentenary sulfides and selenides,17 the CuME2 (M = Al, Ga, In and X = S, Se),l* as well as the CuInSea,Te, system have been examined.lg
As noted in the Introduction the most common method of producing bulk quantities of the copper indium dichalcogenides is furnace heating of the ele- ments, a rather time-consuming process which may involve reaction times of 4 days, due to the repeated heating and cooling cycles required to purify the prod- ucts. Further drawbacks of this method include pres- surization with sulfur or selenium, expensive glassware, and heating to temperatures above 1000 "C may be required. The large number of related samples required to study solid solution formation makes furnace heating of the elements an unappealing method of producing such compounds, however, microwave synthesis is eminently suitable for such a study.
A stoichiometric mixture of the elements required for each of the chalcopyrites, CuInS2,SeX (0 < x -= 2) was sealed under vacuum in a quartz tube and subjected to microwave irradiation for three minutes (see Experi- mental Section). We have previously observed that depending on the scale of the reaction, and the identity of the chalcopyrite, the required reaction time may vary from 1 to 3 min. In the present case the longer time was chosen to ensure complete reaction.
The products were uniformly ground to enable char- acterization by scanning electron microscopy (SEM) as well as energy dispersive X-ray (EDX) and X-ray dif- fraction (XRD) analysis. Scanning electron microscopy shows the samples to consist primarily of large spheres and blocks whose EDX analysis is consistent with the chalcopyrites, CuInSz,Se,, while a small amount of the small quantity of irregularly shaped material analyzed as copper chalcogenides. Therefore, EDX analysis of the crystalline particles, rather than the mass balance of the starting materials, was used to determine the relative content of sulfur and selenium for comparison with the XRD data; see below. However, the relation- ship between the selenium content in the feed and that as determined by EDX was near linear, see Figure
copper heats rapidly, I melts indium I I
sulfur and copper react and dissolve in indium
1 exothermic reaction keeps
system molten, reaction and nucleation
occur from melt
CuInS;, U The remaining possibility is that copper first reacts
with sulfur to produce CuS and/or CuzS, which further react with indium and a remaining amount of sulfur, giving CuInS2 (eq 5).
+In, S c u + s A CU,S + c u s - CuInS, (5)
Reacting either 1 or 2 equiv of copper with sulfur under microwave radiation in the absence of indium produces copper sulfides. In the former case, CuS was the only product formed, while in the latter case both CuS and Cup3 were produced. This shows that the copper does indeed react with sulfur as the first step in the formation of CuInSz by microwave irradiation. Supporting evidence for this sequence is given by the observation that copper sulfide reacts with indium and a stoichiometric equivalent of sulfur (eq 6) to give CuInSz which is identical to samples prepared from the three elements, as confirmed by XRD. Presumably the heating of the indium is sufficient to thermally activate the reaction shown in eq 6 but not the reaction of the individual elements.
Cu,S + 21n + 3s - 2CuInS2 (6)
From these observations, we propose that the forma- tion of copper indium dichalcogenides occurs as shown in Scheme 1: microwave irradiation causes copper to react with chalcogen to form the copper chalcogenide. Either the exothermic formation of the copper chalco- genide or the heating of the copper causes the indium to melt. Dissolution of the copper chalcogenide and the remaining chalcogen in the molten indium produces a homogeneous liquid melt from which the chalcopyrite crystallizes. This proposal is consistent with the mor- phology of the chalcopyrite product, since the spheres produced during the microwave process would be ex- pected to form from a liquid melt.
(15) Handbook of Chemistry and Physics, 71st ed.; Lide, D. R., Ed., Chemical Rubber Company: Boca Raton, FL, 1990.
1.
(16) Aron, J. E.; Yoodee, K.; Wolley, J. C. J . Appl. Phys. 1984, 55, 524.
(17) (a) Chapman, G. H.; Shewchun, J.; Garside, B. K.; Loferski, J. J.; Beaulieu, R. Solar Energy Mater. 1979, I , 451. (b) Chapman, G. H.; Shewchun, J.; Loferski, J. J.; Garside, B. K.; Beaulieu, R. Appl. Phys. Lett. 1979, 34, 735.
(18) Robbins, M.; Phillips, J. C.; Lambrecht, V. G. J . Phys. Chem. Solids 1973, 34, 1205. (19) Sridevi, D.; Reddy, K. V. Mater. Res. Bull. 1986, 20, 929.

702 Chem. Mater., Vol. 7, No. 4, 1995
h z - 2000 T
Lundry et al.
?
X a w
2.0 1
1.5 - 1.0 - 0.5 -
0.0 0.0 0.5 I .o I .5 2.0
Se content, feed Figure 1. Relationship between the selenium content in the feed versus the product as determined by EDX for the synthesis of CuInSp,Se,.
- . . I
L 4
Figure 2. SEI micrograph (top) and associated back scatter- ing image (bottom) of a representative sample of CuInSo.$3el.5.
While the XRD analysis indicated the presence of solid solutions and not physical mixtures or ordered structures, for the crystalline material present, we have employed back scattering to demonstrate the uniformity of the chalcogenide distribution in the entire sample. In Figure 2 is shown a SEI micrograph (top) and the associated back scattered image (bottom) of one of the large particles of CuInSo.5Sel.s. From the SEI micro- graph several smaller (presumably amorphous) particles are observed to be stuck to the surface of the larger crystalline particle. However, from the back scattering image it can be clearly seen that the elemental composi- tion of these small particles are essentially identical to that of the larger ones. On the basis of the EDX analysis, the microwave-promoted reaction of copper,
10 20 30 40 5 0 60 70 80 28 ( 0 )
Figure 3. XRD spectrum of CuInSo.5Sel.5. Miller indices of each reflection for the tetragonal chalcopyrite cell are indi- cated.
indium, sulfur, and selenium results in an essentially uniform material CuInS2,Sex. This is in line with our previous results, which indicated that while the reaction of the elements was completed in a matter of seconds crystallization occurred over a number of minutes.
A comparison of the XRD spectra with reported data of known phases20 confirms that in all the samples the chalcopyrite structure is formed as the exclusive crys- talline product. The sharp peaks and high counts indicate that the products are well-formed polycrystal- line materials. Furthermore the presence of only a single crystalline phase confirms the formation of solid solutions as opposed to a physical mixture of products. A representative XRD diffraction patterns for CuInSo.5- Se1.5 is shown in Figure 3. The tetragonal lattice parameters a and c for CuInS2,Sex were determined for each value of x , and are given in Table 2.
As would be expected from a consideration of the relative ionic radii of sulfur (1.84 A) and selenium (1.98 A), the lattice parameters of the copper indium sulfide selenide alloys increase with increased selenium con- tent. Figure 4 shows plots of the selenium “concentra- tion variable” (x), as determined from the EDX analysis of the crystalline particles, versus the lattice parameters a and c. Vergard’s law requires the lattice constant for a linear solution of two semiconductors to vary linearly with composition, however, the plots for CuInS2,Sex (0 d x d 2) are also best described by the parabolic relationships shown in eqs 7 and 8. Such a parabolic behavior has been observed previously for other sys- tems21
a = 5.532 + 0.080l.x + 0.0260z2, R = 0.993 (7)
c = 11.156 + 0.1204~ + 0.0611.x2, R = 0.991 (8)
The accuracy of the lattice parameter versus selenium content curves suggests that they may be used to determine the sulfur and selenium concentrations of copper indium sulfide-selenide samples whose S:Se ratio is unknown. Thus, XRD analysis can be used to determine the sulfur-to-selenium ratio of a crystalline sample. Determination of the bandgaps of the com-
(20) Joint Committee on Powder Diffraction Standards, Diffraction
(21) Aron, J. E.; Wolley, J. C.; Asbjomson, A.; Chatraphorn, S.; Data File, 1992.
Ratanathammapan, K.; Yoodee, K. J. Appl. Phys. 1981,52,6223.

Synthesis of Chalcopyrite Semiconductors
Table 2. Lattice Parameters of CuInSz-,Se, Alloys
Chem. Mater., Vol. 7, No. 4, 1995 703
CuInSz,Se, Xa
0.000 0.300 0.549 0.853 1.000 1.208 1.575 1.749 2.000
lattice parameters a (A) 5.532 5.565 5.581 5.608 5.633 5.680 5.723 5.758 5.790
c (A, 11.160 11.203 11.237 11.272 11.338 11.419 11.502 11.555 11.633
a Composition variable (x) based on EDX data.
cia
2.017 2.013 2.013 2.010 2.013 2.010 2.010 2.007 2.009
0.0 0.5 1 .o I .5 2.0 composition variable (x)
11.7 1
0.0 0.4 0.8 1.2 1.6 2.0 composition variable (x)
Figure 4. Plots of the lattice parameters, a (8) and c (A), versus the composition variable x in the CuInS2,SeX system. The lattice parameters are for the chalcopyrite Z-4& tetragonal unit cell.
11.7 1
11.5 h
5 u
11.3
11.1 5.5 5.6 5.7 5.8
a (4 Figure 6. Plot of the lattice parameter c (A) versus a (A), for the chalcopyrite systems CuInSz,Se, (0 < x < 2), R = 0.998.
pounds in this study should provide an additional correlation curve for the relationship between S:Se ratio and bandgap. Thus, from a simple XRD spectrum one could determine the bandgap of a chalcogenide sample.
Substitution of Se for S in the chalcopyrite structure could possibly occur in a random manner, i.e., a chal- cogenide site has an equal probability of containing a sulfur or a selenium atom. Alternatively, if the sele- nium had preference for specific sites a superlattice structure of lower symmetry would be present, as confirmed by simulating the XRD. Such an ordering is
Table 3. Lattice Parameters of CuInSez,Te, Alloys CuInSez,Te, lattice parameters
Xa a (A) c (A, c l a
0.000 5.774 11.588 2.007 0.120 5.801 11.682 2.014 0.360 5.845 11.751 2.010 0.560 5.903 11.900 2.016 0.940 5.930 11.931 2.012 1.300 6.022 12.109 2.011 1.500 6.063 12.179 2.009 1.760 6.117 12.255 2.003 2.000 6.188 12.452 2.012
a Composition variable ( x ) based on EDX data.
3 Et
5.7 v 0.0 0.4 0.8 1.2 1.6 2.0
composition variable (x)
12.6 1
11.4 0.0 0.4 0.8 1.2 1.6 2.0
composition variable (x )
Figure 6. Plots of the lattice parameters, a (A) and c (A), versus the composition variable x in the CuInSz,Sex system. "he lattice parameters are for the chalcopyrite Z-4& tetragonal unit cell.
not observed since all the samples show no additional reflections other than those that may be indexed to a tetragonal cell. In addition, a plot of c versus a (Figure 5 ) is clearly linear; the ratio clu remains the same within experimental error as x varies from 0 to 2, suggesting no site preference for the selenide substitution.
The CuInSe2,Tex alloys may be readily produced by microwave irradiation in a manner analogous to that described above (see Table 3). The parabolic relation- ship (see Figure 6) between x and the lattice parameters (eqs 9 and 10) are in reasonable agreement with those obtained in the previous s t u d i e ~ . l ~ ~ ~ ~ As with the sulfide selenide system the variation of c with respect to a occurs in a linear manner (Figure 7).
a = 5.783 + 0.1560~ + 0.0212x2,
c = 11.628 + 0.3340~ + 0.0277x2,
R = 0.993 (9)
R = 0.998 (10)
The X-ray diffraction pattern of CuInSe2,Tex alloys prepared by microwave irradiation shows significant broadening of the peaks (e.g., Figure 8), as compared
(22) a = 5.7960 + 0.16829~ + 0.014857x2, c = 11.635 + 0.2584% + 0.060286~~.

704 Chem. Mater., Vol. 7, No. 4, 1995
3200.-
3
3 2400- % n 3 1600.- a
L
8
Landry et al.
0
12.6 1
5.7 5.8 5.9 6.0 6.1 6.2 a (A,
Figure 7. Plot of the lattice parameter c (A) versus a (A), for the chalcopyrite systems CuInSn,Se, (0 < x < 2), R = 0.998.
d-spacing 8.84 4.44 2.98 2.25 1.82 1.54 1.34
I
a 1 I
0 10 20 30 40 50 60 70
20 (")
Figure 8. XRD spectrum of CuInSeTe, showing peak broad- ening not observed for other chalcopyrites prepared by micro- wave irradiation.
to those obtained for CuInSz,Se, under identical reac- tion conditions. There are two possible reasons why this broadening may occur. First, is that the particle size of CuInSez,Te, is smaller than that of the CuInE2 and CuInS,Se2., analogues. Second, the greater difference in ionic radii between Se2- (1.98 A) and Te2- (2.21 A), as compared to S2- (1.84 A> and Se2-, produces distor- tions in the crystal lattice. If the latter is true, then the XRD of CuInSTe would be expected to show even broader peaks, since the ionic radius of S2- is signifi- cantly smaller than that of Te2-. However, reactions between stoichiometric amounts of copper, indium, sulfur, and tellurium do not produce CuInSTe; XRD clearly shows peaks for both CuInSz and CuInTez as the major species. Close inspection of a slow scan XRD of the reaction products revealed a third species; pre- sumably some sulfide-telluride alloy.
To better understand the sulfide-telluride system a study of the mixtures (Cu1nS~)z,(C~InTea~~ (x = 0.0,0.5, 1.0, 1.5, 2.0) was performed to determine if the X-ray diffraction peaks for each compound shifted with com- position (an indication of solid solution formation) or remained stationary (an indication of segregation). Representative examples (x = 0.5 and 1.5) of XRD of the products following microwave irradiation are shown in Figure 9. In each case, the intensities of the peaks for CuInS2 and CuInTez increased or decreased depend- ing on concentration of the respective chalcogenide. However, no shifts along the horizontal (28) axis were observed. Instead, a third set of peaks for a tetragonal cell are found, indicating that a small of a mixed sulfide-telluride chalcopyrite is formed. Based upon the relative d spacings and lattice parameters, an estimate of the composition assuming a near linear re-
d-spacing 8.84 4.44 2.98 2.25 1.82 1.54 1.34
I
20 30 40 50 60 70 2-theta (degrees)
(b) d-spacing
8.84 4.44 2.98 2.25 1.82 1.54 1.34
lationship: CuInSo,sTel,.i. The formation of this species is independent of the relative S:Te ratio and would thus suggest that this is the maximum solubility (miscibility) of sulfide in CuInTez; approximately one sulfur per unit cell.
Reaction of a stoichiometric mixture of the elements required for the chalcopyrite, CuInS2,Te, (x > 1.7) does not yield the alloy phase, as determined by XRD, but a mixture of CuInSz and CuInTez. This result suggests that the alloy, CuInSo.3Te1.7, represents the limit of sulfide solubility in CuInTez. In addition, the formation of CuInSo.3Tel.~ requires the relative concentration of sulfur to be higher than the solubility limit.
The segregation of CuInSz and CuInTe2 is further in evidence from a consideration of the SEM and associ- ated back scattering image of a sample of the copper indium sulfide telluride (Figure 10, top). As is clearly seen from the back-scattered image (Figure 10, bottom), there are two distinct compositional zones. The lighter area analyzes (by EDX) as CuInSn with traces of tellurium, while the darker region analyzes as CuInTez with traces of sulfur, suggesting that the Cu1nSo.3Te1,~ formed is dissolved in the segregated phases.
Robbins et a1.18 have proposed that the miscibility of ternary chalcopyrites is dependent on the differences between the respective 2-cla (A) values. On the basis of our experimental data for CuInEz the A values for the sulfide, selenide, and telluride are -0.0161, -0.0080, and -0.0120, respectively. Values based on literature

Synthesis of Chalcopyrite Semiconductors Chem. Mater., Vol. 7 , No. 4, 1995 705
h I
Figure 10. SEI micrograph (top) and associated back scat- tering image (bottom) of a representative sample of a sample of copper indium sulfide telluride.
data for the stoichiometric compounds are -0.018 08, -0.01036, and -0.003236. Given that A for our indium rich (p-type) CuInS2 is actually closer to that for CuInTe2 than for CuInSe2, and the A values clearly are different from those of the stoichiometric compounds it would seem that A is not a good indication of miscibility. Furthermore, we note that there is a general trend of A with compositional variable for the sulfide-selenide alloys (see Figure 1 la); however, for the selenide- telluride alloys A is nearly independent of x (Figure l lb). Thus, i t would appear that the variation in ionic radii ( r ) of the chalcogenide ion is a far better indication for alloy formation in this series of homologous materials.
The formation of the CuInSo.3Tel.7 phase, albeit in low yield and as a contaminant within CuInS2 and CuInTep, is of interest in considering the difference between traditional thermal synthesis and that using microwave irradiation. Grima et al. have reported23 that upon thermal annealing of the constituent elements a mis- cibility gap was observed over a wide range. However, their XRD results indicated no separate crystalline phase characterizable as CuInSo.3Tel.7. It appears, therefore, that the sulfide-telluride alloy formation is "trapped" as a metastable phase during the rapid reaction conditions of microwave synthesis. It should
(23) Grima, P.; Quintero, M.; Rincon, C.; Peres, G. S.; Woolley, J. C. Solid State Commun. 19881.67, 81.
' 8 8
' 8 1 -0.010
3 Cj 8
-0.0 I4
-0.018 t 0.0 0.5 I .o 1.5 2.0
composition variahlc: (x)
O . m 1
1 -0.005 8
-0.0154 8
1 -0.020: - 1 . 1 - 1 - I . i
0.0 0.4 0.8 1.2 1.6 2.0 composition varirhlc (x)
Figure! 11. Plot of A with compositional variable for the sulfide-selenide alloys (a) and the selenide-telluride alloys (b).
be possible therefore to synthesize other metastable phases via microwave irradiation.
Formation of Related Ternary Metal Chalcopy- rites. Attempts to replace copper with silver in reac- tions similar to those described above produced com- pounds analogous to those described in the literature (see Table 1). While samples of AgInS:! and AgInSe:! showed the formation of the tetragonal chalcopyrite phase, AgInS2 forms an additional orthorhombic phase, previously reported as a high temperature polymorph. In contrast, AgInTe2 appeared to yield a cubic phase (JCPDS-23-638), reported as a high-pressure form, as the major product. The formation of a high temperature phase of AgInS2 may be rationalized given the high temperatures achieved during microwave irradiation. However, the formation of a high-pressure phase for AgInTe2 is unexpected.
Replacing indium with aluminum in attempts to form CuAlE2 (E = S, Se, Te) met with varying success. Low peak intensities, as determined by XRD, indicated that these compounds are not as well-formed as the indium analogues. In addition, the telluride could not be prepared at all; EDX analysis indicated that a large amount of aluminum metal remained following reaction and that copper telluride was the only product formed. There are two possible explanations for these results. First, since aluminum forms a native oxide, the ability of the aluminum metal to react with the copper and chalcogen is significantly diminished. Second, the aluminum particles were much larger than the copper particles (30 mesh versus 325 mesh). Since the ability of the compounds to react when subjected to microwave radiation is dependent upon their ability to distribute charge on their surface evenly and therefore on particle size, this may have some effect on the reactivity of the

706 Chem. Mater., Vol. 7, No. 4, 1995
aluminum. Furthermore, producing a homogeneous mixture is simply more difficult with larger particles. Less homogeneous mixtures promote the formation of pockets of compounds with widely varying composition; for example, layering copper, indium, and sulfur rather than grinding them together was found to produce only copper sulfides and starting materials.
No reaction was observed between silver, aluminum, and chalcogenides. EDX analysis showed only silver chalcogenides and unreacted starting materials. At- tempts to form solid solutions using silver or aluminum in the place of copper or indium, respectively, were unsuccessful. As discussed above, aluminum does not appear to react well by microwave irradiation, and the propensity of silver indium sulfide and telluride to form more than one crystalline phase prevents the clean isolation of a solid solution which only contains the tetragonal phase.
Landry et al.
the smaller the metal particles the more uniform the composition and crystallinity of the product. Last, the product cannot be highly conducting or excessive charge buildup will cause arcing in the microwave.
Conclusion
Microwave irradiation of an intimate mixture of cop- per, indium, and chalcogenes yield the chalcopyrite com- pounds CuInEz (E = S, Se, Te), or the alloys CuInE2,E’, (E = S, E’ = Se; E = Se, E’ = Te; 0 < x < 2). On the basis of EDX and XRD analysis the products exist as solid solutions in a single phase and not a mixture of CuInEz and CuInE’z. This demonstrates that if mix- tures of elements are used, a homogeneous sample of the alloy (solid solution) is formed, the composition of which is defined by the elemental ratio in the reaction mixture. The increase in the crystal lattice parameter of the chalcopyrite solid solution is dependent on the compositional constant (x ) . In addition, the replacement of one chalcogen with another occurs without any site preference. The larger difference in ionic radii betwecn Se and Te (0.23 A) as opposed to S and Se (0.14 A) may account for the observation that samples of CuIn- Sez,Te, have substantially broader peaks than those of CuInSz,Se,. While the difference between the ionic radii of sulfide and telluride ions (0.37 A) possibly prevents formation of a solid solution above 15% sulfide, Le., equivalent to one sulfur per unit cell volume of chalcopyrite.
Microwave irradiation provides a rapid, easy means of producing a wide variety of solid-state products directly from the constituent elements. There are many advantages to this technique, including inexpensive materials and rapid reaction times. However, more important is the ease with which bulk materials may be produced using a simple domestic microwave oven. These facts suggest that a large number of samples in a solid-state systems may be prepared cheaply and rapidly by using microwave irradiation. In the case of these experiments, all reactions could be performed, the products analyzed, and the study completed in about a week! If the standard furnace methods had been used, this study would have required approximately 2 months for completion.
Finally, a comment should be made as to the mini- mum criteria for the synthesis of metal chalcogenides. First, one of the reactive metals must be highly con- ducting. While the threshold is unknown a conductivity greater than that of indium, 0.119 mho m-l, is clearly required. Second, the presence of an inert native oxide, such as A 1 2 0 3 on aluminum, can inhibit reaction. Third,
Experimental Section
Elemental sulfur, copper (99.7%, 100 mesh) and selenium (99.5%, 325 mesh) were purchased from commercial sources. Indium (99.99%, 325 mesh) was donated by the Indium Corporation of America. All metal and chalcogenide powders were stored in the dry box under argon. Three-inch-long quartz reaction tubes were blown from 6/10 mm (i.dl0.d.) tubing purchased from Quartz Plus, Inc. A Sharp Carousel I1 “Half Pint” microwave oven operating at 400 W and 2450 MHz was used for all experiments.
To enable XRD analysis, samples were ground into fine powders and mounted on glass slides prior to analysis. Data were collected on a Scintag diffractometer operating at 45 kV and 35 mA. Diffraction management systems (DMS) software operating on a micro-VAX computer was used to interpret the data. Lower symmetry structures involving order of the selenium can be simulated using the programs XP and XPOW. SEM and associated EDX analyses studies were performed on a JEOL JSM-35 scanning microscope. A small amount of the as-synthesized material was attached to an aluminum stub with graphite paint.
Synthesis of Ternary Metal Dichalcogenides. The synthesis of CuInSz is given below. Syntheses of all dichal- cogenide compounds, including those involving silver and/or aluminum, were performed in a similar manner. Elemental sulfur (0.300 g, 9.38 mmol) was intimately mixed with stoi- chiometric amounts of copper (0.298 g, 4.69 mmol) and indium (0.538 g, 4.69 mmol) with a mortar and pestle in a drybox. The mixture was then placed in a quartz tube, sealed under vacuum, and laid on a firebrick base inside a domestic microwave oven. The sample was then irradiated for 1 min, after which the microwave cavity and the reaction tube were hot. The previously reddish mixture had become completely gray. The tube was shaken to redistribute its contents and was then replaced in the microwave oven. The process was repeated twice, for a total of 3 min. After the third time, the quartz tube was removed from the oven and allowed to cool to room temperature before being broken open. The product was a crystalline, bluish-gray powder.
Formation of Mixed Copper Indium Chalcogenide Solid Solutions. All syntheses were performed in a similar manner, altering the amounts of sulfur, selenium, and/or tellurium which were used. As an example the synthesis of CuInS1,&3eo,zs ( x = 0.25) is described below. In an inert atmosphere drybox elemental sulfur (0.176 g, 5.51 mmol), copper (0.200 g, 3.15 mmol), indium (0.362 g, 3.15 mmol), and selenium (0.062 g, 0.787 mmol) were intimately mixed by grinding, to visual homogeneity, with a mortar and pestle. The mixture was placed in a quartz tube, sealed under vacuum, and placed on an, asbestos firebrick in the microwave oven. The sample was then irradiated for 1 min, after which the sample was removed from the microwave oven, shaken to redistribute its contents, and then replaced in the microwave oven. The irradiatiodshaking process was repeated twice, for a total of 3 min. After the third cycle, the tube was removed from the microwave oven and allowed to cool to room temper- ature before being broken open. The products were then poured from the tube as gray, crystalline powders.
Acknowledgment. Financial support for this work was provided under the auspices of the National Science Foundation and with a NASA Graduate Student Re- searchers Award. The Indium Corporation of America is acknowledged for its kind donation of indium metal. We express our thanks to Prof. D. M. P. Mingos and Dr. A. F. Hepp for useful discussion. CM940479S


![characterization of alkylalumoxanes [(R2Al)2O]n and (RAlO ...barron.rice.edu/Courses/575/575_09_pdfs/hydrolysis.pdf · Hydrolysis of Tri-tert-butylaluminum: The First Structural ...](https://static.fdocuments.us/doc/165x107/5af583167f8b9a154c8fd257/characterization-of-alkylalumoxanes-r2al2on-and-ralo-of-tri-tert-butylaluminum.jpg)


