The$Developmentof$aStrategic$Planning$Framework$...
66
The Development of a Strategic Planning Framework for VCU’s College of Humani?es and Sciences Data Analysis and Representa?on Interpreta?on U?liza?on
-
Upload
hoangduong -
Category
Documents
-
view
216 -
download
0
Transcript of The$Developmentof$aStrategic$Planning$Framework$...

The Development of a Strategic Planning Framework for VCU’s College of Humani?es and Sciences
Data Analysis and Representa?on Interpreta?on U?liza?on

Why are we here?
• During the fall 2013 CHS retreat, Dean Coleman charged us to iden?fy priori?es to include in a strategic plan for the college. – Requested a boNom-‐up, stakeholder-‐driven, empirically-‐derived process for determining the major components of the plan
– Sought a more engaged and intensive approach to understand the various facets and nuances of iden?fied priori?es

How long did it take us to get here? What did we do to get here?
• In about 45 days… – We engaged every CHS unit and over 350 administrators, faculty and staff
• Full-‐?me and part-‐?me employees – We systema?cally organized 125 strategic priori?es of the college
• Form and structure (a mul?dimensional strategic planning framework)
– We “priori?zed the priori?es” of the college • Rela?ve importance and impact (Tier I, II, III)

How much has it cost thus far? • Dollars
– $1,600.00 for project license • Original price for project license was $5,800. • An external consultant would have cost between $12,000-‐$15,000.
• Time – About 610 hours donated by CHS administrators, faculty, and staff
• ~300 brainstorming and ra?ng x 75 minutes = 22,500 minutes or 375 hours
• ~27 CHS/ACM members brainstorming, sor?ng, and ra?ng x 135 minutes = 3,645 minutes or roughly 60 hours
• My ?me offered in-‐kind ~175 hours

Where do we go from here?
• CHS Dean and staff will hold forums/mee?ngs – To beNer understand specific priori?es across key stakeholder groups and units
• CHS Dean and staff will map priori?es onto Quest themes and university ini?a?ves – To facilitate the development of an ac?on plan to address Tier I, II, and III priori?es

Recap: Concept Mapping Ac?vi?es • Step 1: Prepara+on
– Development of focus prompt, ra?ng items, and procedures • Step 2: Genera+on
– Par?cipant Ques?ons and Brainstorming • CHS administrators, faculty and staff (i.e., stakeholders) completed five
demographic items • CHS stakeholders brainstormed priority statements
• Step 3: Structuring – Sor?ng
• Select group of CHS stakeholders sorted priority statements into conceptually similar piles
– Ra?ng • CHS stakeholders rated priority statements based on rela?ve importance and
rela?ve impact • Step 4: Data Analysis and Representa+on • Step 5: Interpreta+on • Step 6: U+liza+on

CHS Stakeholders by Type of Posi?on

CHS Stakeholders by Years of Service

CHS Stakeholders Familiarity with CHS Mission, Values and Goals

CHS Stakeholders Perceived Empowerment

Recap: Concept Mapping Ac?vi?es • Step 1: Prepara+on
– Development of focus prompt, ra?ng items, and procedures • Step 2: Genera+on
– Par?cipant Ques?ons and Brainstorming • CHS administrators, faculty and staff (i.e., stakeholders) completed five
demographic items • CHS stakeholders brainstormed priority statements
• Step 3: Structuring – Sor?ng
• Select group of CHS stakeholders sorted priority statements into conceptually similar piles
– Ra?ng • CHS stakeholders rated priority statements based on rela?ve importance and
rela?ve impact • Step 4: Data Analysis and Representa+on • Step 5: Interpreta+on • Step 6: U+liza+on

Overview • Step 4: Data Analysis and Representa+on
– Research methodology and sta?s?cal analysis • Primary Analyses
– Sort Data Aggrega?on – Mul?dimensional Scaling (MDS)
– Representa?on of CHS Strategic Planning Framework primary components and domains
• Primary Analysis – Hierarchical Cluster Analysis
• Step 5: Interpreta+on – Empirical and interpreta?ve guidance
• Secondary Analyses – Anchoring/Bridging Analysis – Go Zone Analyses – PaNern Matching
• Step 6: U+liza+on – Applica?ons of CHS Strategic Planning Framework
• Next Steps
Step 4: Data Analysis and Representa+on
• Research Methodology and Sta?s?cal Analyses – Too complex to show analyses using sor?ng data for 23 of 28 people who sorted 125 items / strategic priori?es.
– However, I will integrate findings from the CHS Strategic Planning Framework Report where appropriate.

Illustra?ve Example
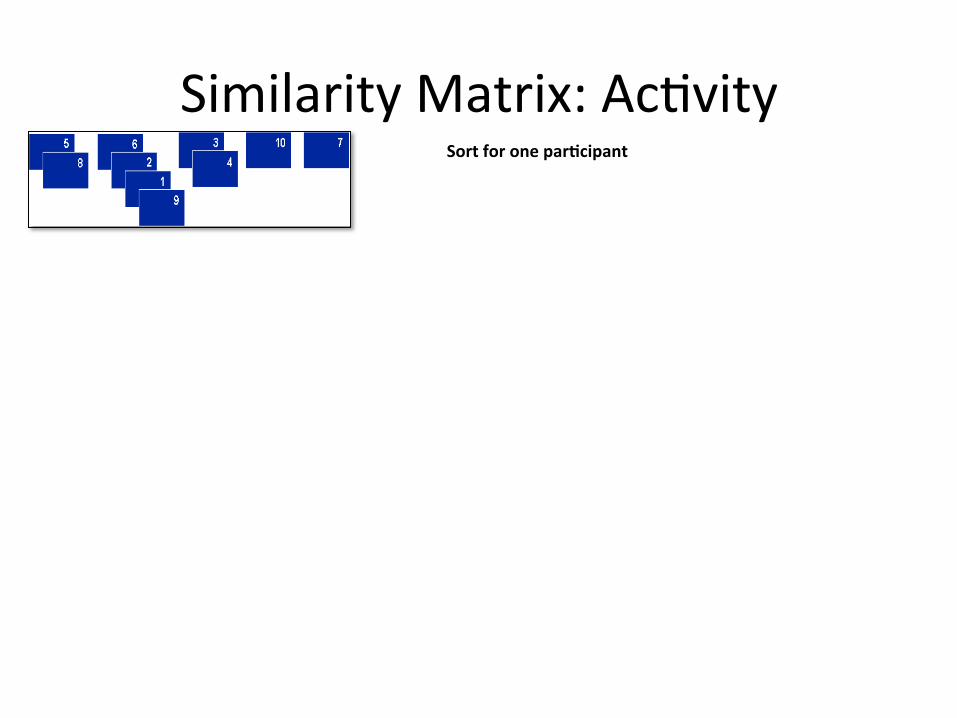
Similarity Matrix: Ac?vity Sort for one par+cipant

Similarity Matrix: Ac?vity
1 2 3 4 5 6 7 8 9 10 1 2 3 4 5 6 7 8 9 10
Sort for one par+cipant

Similarity Matrix: Ac?vity
Binary, square similarity matrix: one participant’s
sorting data
Sort for one participant Sort for one participant

Similarity Matrix: Ac?vity Sort for Individual 1.
5 629
410
7
138
Sort for Individual 2.
5 629
4 1071 3 8 Sort for Individual 3.

Similarity Matrix: Ac?vity
1 2 3 4 5 6 7 8 9 10 1 3 3 0 0 1 1 0 0 2 0 2 3 3 0 0 1 1 0 0 2 0 3 0 0 3 3 0 1 0 1 0 0 4 0 0 3 3 0 1 0 1 0 0 5 1 1 0 0 3 0 0 1 2 0 6 1 1 1 1 0 3 1 1 1 0 7 0 0 0 0 0 1 3 0 0 1 8 0 0 1 1 1 1 0 3 0 1 9 2 2 0 0 2 1 0 0 3 0 10 0 0 0 0 0 0 1 1 0 3

Similarity Matrix: Ac?vity
Binary, square similarity matrix: one par+cipant’s
sor+ng data
Total square similarity matrix: data from five
par+cipants
Sort for one par+cipant

Similarity Matrix (small sec?on)

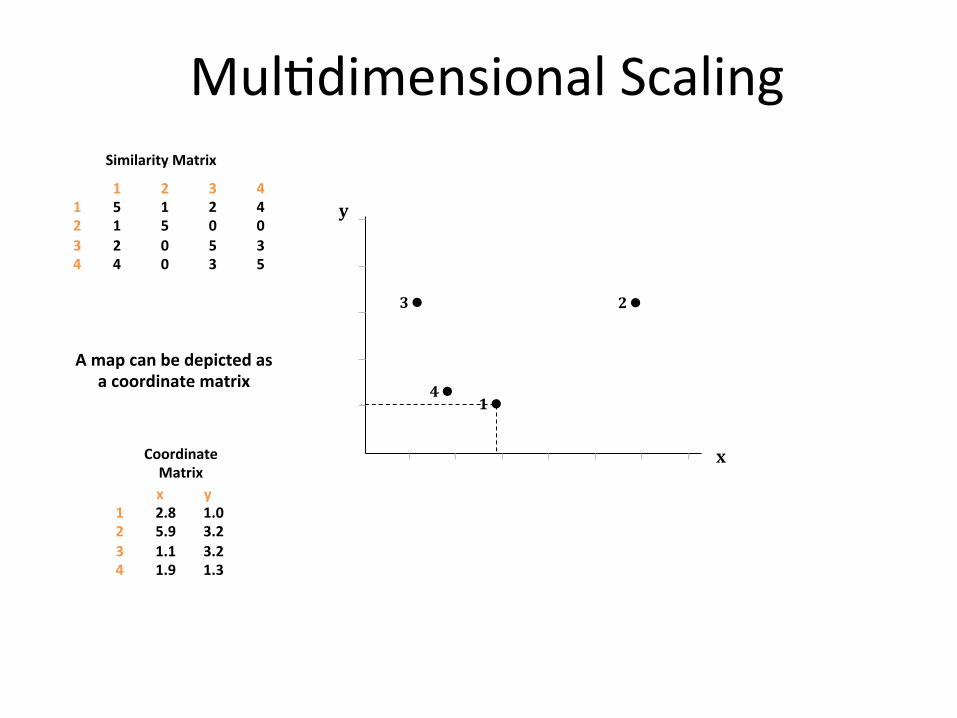
Mul?dimensional Scaling
Input: A square matrix of rela%onships among a set of en++es
Output: An n-‐dimensional mapping of the en++es based on rela+onship
1 6
8
7 5
9 10
2
4 3

1 2 3 1 5 1 2 2 1 5 0 3 2 0 5
1
If 4 out of 5 people grouped statement 1 with 2
If 3 out of 5 people grouped statement 1 with 2
If 2 out of 5 people grouped statement 1 with 2
If 1 out of 5 people grouped statement 1 with 2
If 0 out of 5 people grouped statement 1 with 2
Similarity Matrix
Mul?dimensional Scaling

1 2 3 1 5 1 2 2 1 5 0 3 2 0 5
1
2
Similarity Matrix
If 1 out of 5 people grouped statement 1 with 2
Mul?dimensional Scaling

0 out of 5 people grouped statement 2 with statement 3
1
2
3
3
Similarity Matrix
1 2 3 1 5 1 2 2 1 5 0 3 2 0 5
2 out of 5 people grouped statement 1 with statement 3
Mul?dimensional Scaling

2 3
1 4
Similarity Matrix
1 2 3 4 1 5 1 2 4 2 1 5 0 0 3 2 0 5 2 4 4 0 2 5
Mul?dimensional Scaling
1 2 3 4 1 5 1 2 4 2 1 5 0 0 3 2 0 5 3 4 4 0 3 5
A map can be depicted as a coordinate matrix
2 3
4 1
x
y
Similarity Matrix
x y 1 2.8 1.0 2 5.9 3.2 3 1.1 3.2 4 1.9 1.3
Coordinate Matrix
Mul?dimensional Scaling

Mul?dimensional Scaling
1 2 3 4 1 5 1 2 4 2 1 5 0 0 3 2 0 5 3 4 4 0 3 5
3
4
A map can be depicted as a coordinate matrix
x
y
Similarity Matrix
x y 1 2.8 1.0 2 5.9 3.2 3 1.1 3.2 4 1.9 1.3
Coordinate Matrix
And from the coordinates we can compute the
distances between all pairs of points
2!
1!
a2 + b2 = c2
a = difference between x values b = difference between y values c = distance
2
1 a
b c

1 2 3 4 1 5 1 2 4 2 1 5 0 0 3 2 0 5 3 4 4 0 3 5
2 3
4
A map can be depicted as a coordinate matrix
1!
x
y
Similarity Matrix
x y 1 2.8 1.0 2 5.9 3.2 3 1.1 3.2 4 1.9 1.3
Coordinate Matrix
And can show these as a matrix of distances between points
1 2 3 4 1 0.0 3.2 2.8 1.1 2 3.2 0.0 4.8 4.6 3 2.8 4.8 0.0 2.1 4 1.1 4.6 2.1 0.0
Distance Matrix
And from the coordinates we can compute the
distances between all pairs of points
a2 + b2 = c2
a = difference between x values b = difference between y values c = distance
Mul?dimensional Scaling

Multidimensional Scaling
Stress the rela+onship between the similarity input
matrix and the distances on the map
1 2 3 4 1 5 1 2 4 2 1 5 0 0 3 2 0 5 3 4 4 0 3 5
Similarity Matrix
1 2 3 4 1 0.0 3.2 2.8 1.1 2 3.2 0.0 4.8 4.6 3 2.8 4.8 0.0 2.1 4 1.1 4.6 2.1 0.0
Distance Matrix
1,1 5 1,2 1 1,3 2 1,4 4 2,2 5 2,3 0 2,4 0 3,3 5 3,4 3 4,4 5
1,1 0.0 1,2 3.2 1,3 2.8 1,4 1.1 2,2 0.0 2,3 4.8 2,4 4.6 3,3 0.0 3,4 2.1 4,4 0.0
Similari+es Distances
Low stress values means there is a greater correspondence
between the similarities and the map

Point Map CHS Strategic Planning Framework
1
2
3
4
5
6
7
8
9
10
11
12
13 14 15
16
17 18
19
20 21
22
23 24
25
26 27
28
29
30
31
32 33
34
35
36 37
38
39
40
41
42
43 44
45
46
47
48
49
50
51
52
53
54
55
56
57
58
59
60
61
62
63
64
65
66
67
68 69
70
71
72
73
74
75
76
77
78
79 80
81
82 83
84
85 86
87
88
89 90
91
92
93
94
95
96
97
98
99 100
101
102
103
104
105
106
107
108 109
110
111
112
113 114
115
116
117
118
119
120
121
122 123
124
125
Stress Index = 0.29 (Average Stress Index = .205 -‐ .365)

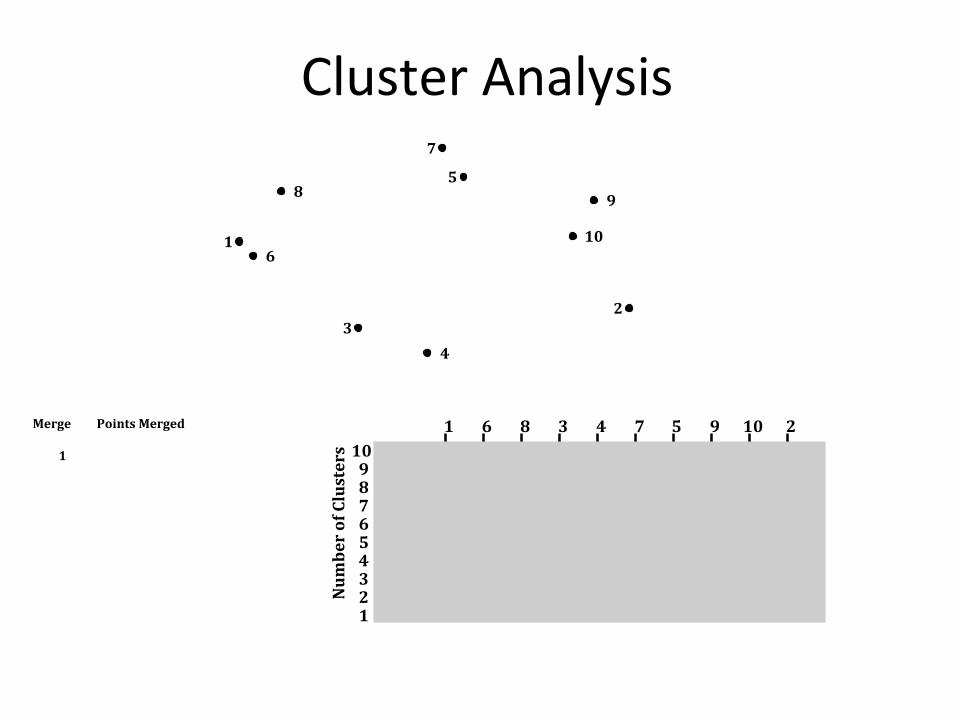
Cluster Analysis • Hierarchical
– Clusters get built in a tree-‐like method
• Agglomera?ve – Builds toward all items in one pile (divisive -‐ all start in one and divide)
• Clustering criterion – The rule used to decide the next cluster merge – Ward’s algorithm – minimum variance method -‐ Clusters merge based on op?mal value
• Number of Clusters

Cluster Analysis: Ac?vity
1 6
8
7 5
9
10
2
4 3
Merge # Points Merged
1 2 3 4 5 6 7 8 9 10
1 & 6
Cluster Analysis
1 6
8
7 5
9
10
2
4 3
1 6 8 3 4 7 5 9 10 2 10 9 8 7 6 5 4 3 2 1
Num
ber of Clusters
Merge Points Merged
1

Cluster Analysis
1 6 8 3 4 7 5 9 10 2 10 9 8 7 6 5 4 3 2 1
Num
ber of Clusters
1 6
8
7 5
9
10
2
4 3
1 + 6
Merge Points Merged
1

Cluster Analysis
1 6 8 3 4 7 5 9 10 2 10 9 8 7 6 5 4 3 2 1
Num
ber of Clusters
1 6
8
7 5
9
10
2
4 3
1 + 6 5 + 7
Merge Points Merged
1 2

Cluster Analysis
1 6 8 3 4 7 5 9 10 2 10 9 8 7 6 5 4 3 2 1
Num
ber of Clusters
1 6
8
7 5
9
10
2
4 3
1 + 6 5 + 7 9 + 10
Merge Points Merged
1 2 3

Cluster Analysis
1 6 8 3 4 7 5 9 10 2 10 9 8 7 6 5 4 3 2 1
Num
ber of Clusters
1 6
8
7 5
9
10
2
4 3
1 + 6 5 + 7 9 + 10 (1 + 6) + 8
Merge Points Merged
1 2 3 4

Cluster Analysis
1 6 8 3 4 7 5 9 10 2 10 9 8 7 6 5 4 3 2 1
Num
ber of Clusters
1 6
8
7 5
9
10
2
4 3
1 + 6 5 + 7 9 + 10 (1 + 6) + 8 3 + 4
Merge Points Merged
1 2 3 4 5

Cluster Analysis
1 6 8 3 4 7 5 9 10 2 10 9 8 7 6 5 4 3 2 1
Num
ber of Clusters
1 6
8
7 5
9
10
2
4 3
1 + 6 5 + 7 9 + 10 (1 + 6) + 8 3 + 4 2 + (9 + 10)
Merge Points Merged
1 2 3 4 5 6
Cluster Analysis
1 6 8 3 4 7 5 9 10 2 10 9 8 7 6 5 4 3 2 1
Num
ber of Clusters
1 6
8
7 5
9
10
2
4 3
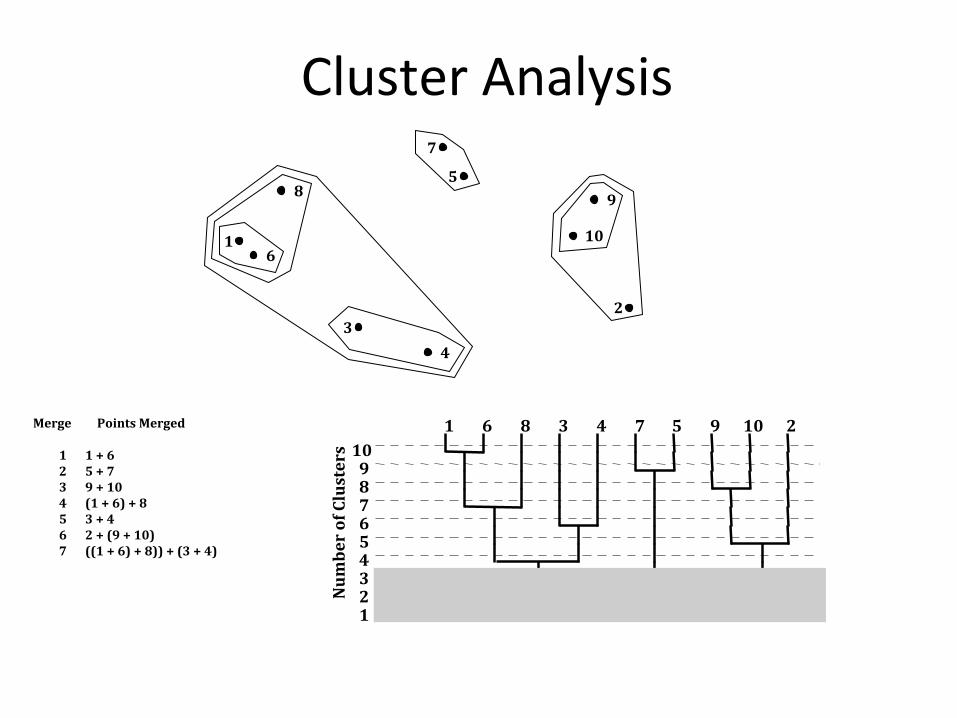
1 + 6 5 + 7 9 + 10 (1 + 6) + 8 3 + 4 2 + (9 + 10) ((1 + 6) + 8)) + (3 + 4)
Merge Points Merged
1 2 3 4 5 6 7

Cluster Analysis
1 6 8 3 4 7 5 9 10 2 10 9 8 7 6 5 4 3 2 1
Num
ber of Clusters
1 6
8
7 5
9
10
2
4 3
1 + 6 5 + 7 9 + 10 (1 + 6) + 8 3 + 4 2 + (9 + 10) ((1 + 6) + 8)) + (3 + 4) (5 + 7) + ((2 + (9 + 10))
Merge Points Merged
1 2 3 4 5 6 7 8

Cluster Analysis
1 + 6 5 + 7 9 + 10 (1 + 6) + 8 3 + 4 2 + (9 + 10) ((1 + 6) + 8)) + (3 + 4) (5 + 7) + ((2 + (9 + 10)) (((1 + 6) + 8)) + (3 + 4)) + (5 + 7) + ((2 + (9 + 10))
1 6 8 3 4 7 5 9 10 2 10 9 8 7 6 5 4 3 2 1
Num
ber of Clusters
Merge Points Merged
1 2 3 4 5 6 7 8 9
1 6
8
7 5
9
10
2
4 3

Point Map CHS Strategic Planning Framework
1
2
3
4
5
6
7
8
9 10
11
12
13 14 15
16
17 18
19
20 21
22
23 24
25
26 27
28
29
30
31
32 33
34
35
36 37
38
39
40
41
42
43 44
45
46
47
48
49
50
51
52
53
54
55
56
57
58
59
60
61
62
63
64
65
66
67
68 69
70
71
72
73
74
75
76
77
78
79 80
81
82 83
84
85 86 87
88
89 90
91
92
93
94
95
96
97
98
99 100
101
102
103
104
105
106
107
108 109
110
111
112
113 114
115
116
117
118
119
120
121
122 123
124
125

Cluster Map CHS Strategic Planning Framework
Graduate Programming
Engagement Principles
Interdisciplinary Exchanges
Enhancing Undergraduate
Educa+on
Empowering Academic Units
Administra+ve Efficiency and Op+miza+on
Accountability and Performance-‐Based
Incen+ves
Culture of Inclusiveness and Wellness
Promo+ng Diversity
Professional Development and Training
Development and Fundraising
Research and Scholarship
Pathways to Professional Success
Establishing Excellence in Teaching
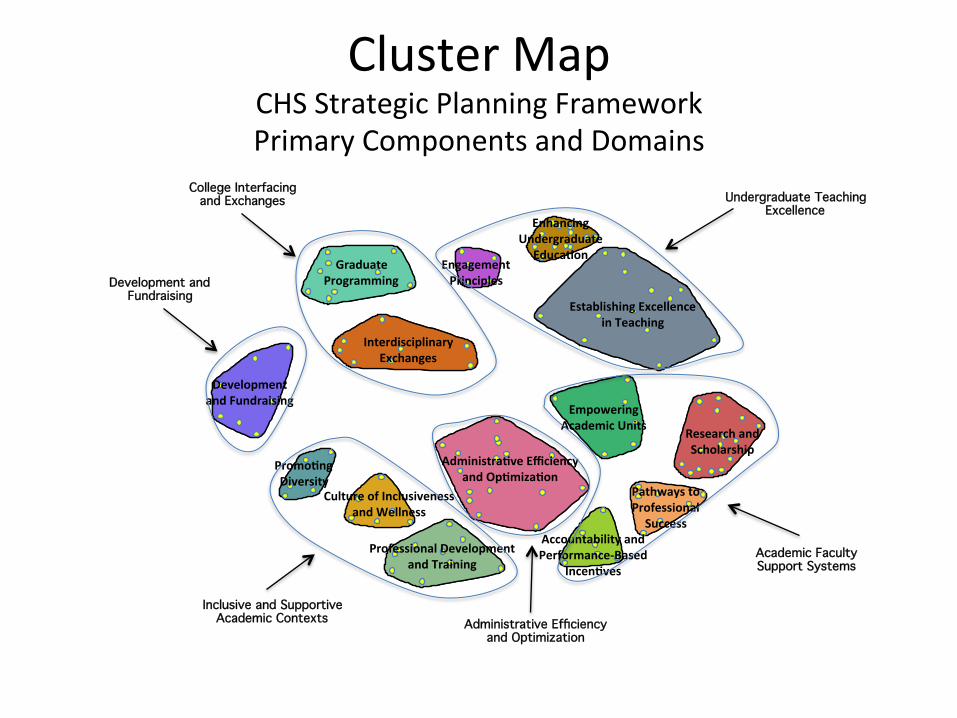
Cluster Map CHS Strategic Planning Framework Primary Components and Domains
Graduate Programming
Engagement Principles
Interdisciplinary Exchanges
Enhancing Undergraduate
Educa+on
Empowering Academic Units
Administra+ve Efficiency and Op+miza+on
Accountability and Performance-‐Based
Incen+ves
Culture of Inclusiveness and Wellness
Promo+ng Diversity
Professional Development and Training
Development and Fundraising
Research and Scholarship
Pathways to Professional Success
Establishing Excellence in Teaching
Undergraduate Teaching!Excellence!
Academic Faculty!Support Systems!
Administrative Efficiency!and Optimization!
Inclusive and Supportive!Academic Contexts!
Development and!Fundraising!
College Interfacing!and Exchanges!

Cluster Ra?ng Map CHS Strategic Planning Framework Primary Components and Domains
Rela?ve Importance
Cluster Legend Layer Value 1 4.36 to 4.59 2 4.59 to 4.82 3 4.82 to 5.05 4 5.05 to 5.28 5 5.28 to 5.51
Graduate Programming Engagement
Principles
Interdisciplinary Exchanges
Enhancing Undergraduate
Educa+on
Empowering Academic Units
Administra+ve Efficiency and Op+miza+on
Accountability and Performance-‐Based
Incen+ves
Culture of Inclusiveness and Wellness
Promo+ng Diversity
Professional Development and Training
Development and Fundraising
Research and Scholarship
Pathways to Professional Success
Establishing Excellence in Teaching
Undergraduate Teaching!Excellence!
Academic Faculty!Support Systems!
Administrative Efficiency!and Optimization!
Inclusive and Supportive!Academic Contexts!
Development and!Fundraising!
College Interfacing!and Exchanges!

Figure 1. The CHS Strategic Planning Framework: Primary Components and their Domains

Step 5: Interpreta+on
• Empirical and Interpreta+ve Guidance – Demonstrate how secondary analyses can be used to determine the importance and impact of certain strategic priori?es; domains; and components.
– Go Zones and PaNern Matching can be used to examine individual differences between stakeholders
• Sets the stage for more nuanced interpreta?ons of data • Adds depth to strategic planning documents

The Anchoring/Bridging Value
• Helps us interpret what content is associated with specific areas of the map
• Statements with lower bridging values are generally beNer indicators of the meaning of their part of the map: they are considered anchors
• Statements with higher bridging values means the statements are a bridge between different areas on map

An Anchor
1
2
3
4
5
6
7
8
9 10
11
12
13 14 15
16
17 18
19
20 21
22
23 24
25
26 27
28
29
30
31
32 33
34
35
36 37
38
39
40
41
42
43 44
45
46
47
48
49
50
51
52
53
54
55
56
57
58
59
60
61
62
63
64
65
66
67
68 69
70
71
72
73
74
75
76
77
78
79 80
81
82 83
84
85 86 87
88
89 90
91
92
93
94
95
96
97
98
99 100
101
102
103
104
105
106
107
108 109
110
111
112
113 114
115
116
117
118
119
120
121
122 123
124
125
116. To provide addi?onal service-‐learning and study abroad opportuni?es for students.
Bridging value = .01 (Low)

Graduate Programming
Engagement Principles
Interdisciplinary Exchanges
Enhancing Undergraduate
Educa+on
Empowering Academic Units
Administra+ve Efficiency and Op+miza+on
Accountability and Performance-‐Based
Incen+ves
Culture of Inclusiveness and Wellness
Promo+ng Diversity
Professional Development and Training
Development and Fundraising
Research and Scholarship
Pathways to Professional Success
Establishing Excellence in Teaching
Cluster Map CHS Strategic Planning Framework

A Bridge
1
2
3
4
5
6
7
8
9 10
11
12
13 14 15
16
17 18
19
20 21
22
23 24
25
26 27
28
29
30
31
32 33
34
35
36 37
38
39
40
41
42
43 44
45
46
47
48
49
50
51
52
53
54
55
56
57
58
59
60
61
62
63
64
65
66
67
68 69
70
71
72
73
74
75
76
77
78
79 80
81
82 83
84
85 86 87
88
89 90
91
92
93
94
95
96
97
98
99 100
101
102
103
104
105
106
107
108 109
110
111
112
113 114
115
116
117
118
119
120
121
122 123
124
125
78. To increase ethnic diversity among faculty, specifically African American, Hispanic / La?no, and Pacific Islander.
Bridging value = .72 (High)

Graduate Programming
Engagement Principles
Interdisciplinary Exchanges
Enhancing Undergraduate
Educa+on
Empowering Academic Units
Administra+ve Efficiency and Op+miza+on
Accountability and Performance-‐Based
Incen+ves
Culture of Inclusiveness and Wellness
Promo+ng Diversity
Professional Development and Training
Development and Fundraising
Research and Scholarship
Pathways to Professional Success
Establishing Excellence in Teaching
Cluster Map CHS Strategic Planning Framework

Go Zone Analyses • The resultant map can be used iden?fy strategic priori?es of highest importance and impact within each component or domain.
• Go Zones are bivariate rela?onship paNerns (V1: Importance and V2: Impact) presen?ng strategic priori?es in a scaNerplot.
• The scaNerplot is divided into quadrants: – High Importance/High Relevance (Tier I) – High Importance/Low Relevance (Tier II) – Low Importance/High Relevance (Tier II) – Low Importance/Low Relevance (Tier III)

1 17
87
89
97 114
14 18
53
58
61
70
110 117
7
Example: Go Zone Analysis for Research and Scholarship Domain
6.55
5.21
3.05
CHS Rela?ve Impact
2.81 5.13 6.49
CHS Rela?ve Importance
r = 0.96
7. To significantly improve startup packages for new faculty.
1. To implement a 2-‐2 teaching load policy in the College, in par?cular for ac?ve researchers and scholars. 17. To encourage and promote faculty par?cipa?on in interna?onal research conferences and projects. 87. To protect faculty researchers from administra?ve ini?a?ves that detract from their produc?vity. 89. To recruit and retain high quality teacher/researchers. 97. To increase the number of research leave opportuni?es for tenure/eligible faculty at all ranks. 114. To offer small seed grants (~$5,000) for research and scholarly work.
18. To recruit faculty researchers with federal funding. 53. To construct or purchase wet-‐lab research space on Monroe Campus. 58. To create funding ini?a?ves designed specifically for tenure-‐eligible faculty in the Humani?es. 61. To focus more on providing funds to sustainability-‐related research. 70. To develop ini?a?ves that support a visi?ng faculty scholars program. 110. To allow faculty greater autonomy and control in determining soqware and technologies for instruc?onal purposes. 117. To expand services provided by the College grants office to make the funding process easier for faculty.
14. To resource and support faculty scholarship areas (e.g., crea?ve expression, public works) not limited to community-‐based or health-‐related research.
TIER I Priori+es
TIER II Priori+es TIER III Priori+es
TIER II Priori+es

VCU’s College of Humani+es and Sciences Strategic Planning Framework
Priority Reference Table

21
40
91
36
42 51
85
Pathways to Professional Success
6.55
5.65
3.05
CHS Rela?ve Impact
2.81 5.51 6.49
CHS Rela?ve Importance
r = 0.98
21. To raise faculty salaries to market rate. 40. To provide formal and rou?nized mechanisms for conver?ng term faculty lines to tenure lines when it would benefit the department. 91. To increase the number of tenure-‐eligible faculty.
36. To provide more training for faculty and staff on financial areas and grants management. 42. To increase faculty pay rate for summer courses. 51. To provide more support to junior faculty members, in terms of seed funding and faculty mentorship. 85. To invest in and maximize use of limited facili?es and workspaces for faculty.
TIER I Priori+es
TIER II Priori+es TIER III Priori+es
TIER II Priori+es

VCU’s College of Humani+es and Sciences Strategic Planning Framework
Priority Reference Table

PaNern Matching
• PaNern Matching can be used to describe paNerns of rela?onships between components/domains and/or to determine consensus among key stakeholder groups
• PaNern Matching produces a “ladder graph” that displays the rela?ve importance/rela?ve impact of components/domains.

Example: Comparing Ra+ngs of Rela+ve Importance and Rela+ve Impact
CHS Rela+ve Importance CHS Rela+ve Impact
Pathways to Professional Success Pathways to Professional Success
Accountability and Performance-‐Based Incen?ves Accountability and Performance-‐Based Incen?ves
Culture of Inclusiveness and Wellness
Culture of Inclusiveness and Wellness
Graduate Programming Graduate Programming
Research and Scholarship
Research and Scholarship
Empowering Academic Units Empowering Academic Units
Administra?ve Efficiency and Op?miza?on Administra?ve Efficiency and Op?miza?on
Establishing Excellence in Teaching
Establishing Excellence in Teaching Enhancing Undergraduate Educa?on
Enhancing Undergraduate Educa?on
Promo?ng Diversity
Promo?ng Diversity Interdisciplinary Exchanges
Interdisciplinary Exchanges
Professional Development and Training Professional Development and Training
Engagement Principles Engagement Principles
Development and Fundraising Development and Fundraising 4.36 4.38
5.51 5.66
r = 0.95
Figure Summary. Relative Importance Ratings. The top five domains were (1) Pathways to Professional Success, (2) Accountability and Performance-Based Incentives, (3) Culture of Inclusive and Wellness, (4) Graduate Programming and (5) Research and Scholarship. Importantly, the average importance ratings for these top five domains did not significantly differ; however, the Pathways and Accountability domains did significantly differ from the bottom half (or rungs of the ladder). Each of the top five domains significantly differed from Development and Fundraising. Relative Impact Ratings. The top five domains were (1) Pathways to Professional Success, (2) Accountability and Performance-Based Incentives, (3) Research and Scholarship, (4) Graduate Programming and (5) Culture of Inclusiveness and Wellness. Importantly, the average impact ratings for these top five domains did not significantly differ; however, the Pathways domain did significantly differ from the bottom half (or rungs of the ladder). Level of Agreement. There is a strong positive correlation between priorities rated as highly important and priorities rated favorably impactful (r = .95) in the college. !!

Example: Comparing Specific Department and College on Ra+ngs of Importance
AFAM Rela+ve Importance CHS Rela+ve Importance
Pathways to Professional Success Pathways to Professional Success
Promo?ng Diversity
Promo?ng Diversity
Culture of Inclusiveness and Wellness Culture of Inclusiveness and Wellness
Accountability and Performance-‐Based Incen?ves
Accountability and Performance-‐Based Incen?ves
Research and Scholarship Research and Scholarship
Administra?ve Efficiency and Op?miza?on
Administra?ve Efficiency and Op?miza?on Graduate Programming
Graduate Programming
Interdisciplinary Exchanges
Interdisciplinary Exchanges
Establishing Excellence in Teaching
Establishing Excellence in Teaching
Enhancing Undergraduate Educa?on
Enhancing Undergraduate Educa?on
Empowering Academic Units
Empowering Academic Units
Engagement Principles
Engagement Principles Professional Development and Training
Professional Development and Training
Development and Fundraising Development and Fundraising 4.38 4.36
6.17 5.51
r = 0.73
Figure 27 Summary. Relative Importance Ratings. The top five domains for AFAM were (1) Pathways to Professional Success, (2) Promoting Diversity, (3) Culture of Inclusiveness and Wellness, (4) Accountability and Performance-Based Incentives and (5) Research and Scholarship. The Pathways domain was rated significantly more important than all other domains with the exception of Accountability, Promoting Diversity, and Culture of Inclusiveness and Wellness. AFAM vs. CHS on Relative Importance Ratings. AFAM stakeholders rated Promoting Diversity and Culture of Inclusiveness and Wellness domains significantly more important than the overall college. Level of Agreement. There is a moderate to strong positive correlation between the priorities rated by AFAM stakeholders and CHS stakeholders in general (r = .73).!!

PSYC Rela+ve Importance CHS Rela+ve Importance
Pathways to Professional Success Pathways to Professional Success
Graduate Programming
Graduate Programming
Culture of Inclusiveness and Wellness Culture of Inclusiveness and Wellness
Accountability and Performance-‐Based Incen?ves
Accountability and Performance-‐Based Incen?ves
Empowering Academic Units
Empowering Academic Units Research and Scholarship
Research and Scholarship
Establishing Excellence in Teaching
Establishing Excellence in Teaching Administra?ve Efficiency and Op?miza?on
Administra?ve Efficiency and Op?miza?on
Interdisciplinary Exchanges
Interdisciplinary Exchanges
Enhancing Undergraduate Educa?on
Enhancing Undergraduate Educa?on
Promo?ng Diversity
Promo?ng Diversity
Professional Development and Training Professional Development and Training
Engagement Principles Engagement Principles
Development and Fundraising Development and Fundraising 4.31 4.36
5.62 5.51
r = 0.95
Figure 41 Summary. Relative Importance Ratings. The top five domains for PSYC were (1) Pathways to Professional Success, (2) Graduate Programming, (3) Culture of Inclusiveness and Wellness, (4) Accountability and Performance-Based Incentives and (5) Empowering Academic Units. The top five domains did not significantly differ. The Pathways to Professional Success domain was rated significantly more important than the bottom four domains. PSYC vs. CHS on Relative Importance Ratings. PSYC stakeholders and CHS stakeholders in general did not significantly differ in their ratings of domains. Level of Agreement. There is a strong positive correlation between the priorities rated by PSYC stakeholders and CHS stakeholders in general (r = .95).!!
Example: Comparing Specific Department and College on Ra+ngs of Importance

GSWS Rela+ve Importance CHS Rela+ve Importance
Promo?ng Diversity
Promo?ng Diversity
Pathways to Professional Success
Pathways to Professional Success
Accountability and Performance-‐Based Incen?ves
Accountability and Performance-‐Based Incen?ves
Research and Scholarship
Research and Scholarship Engagement Principles
Engagement Principles
Culture of Inclusiveness and Wellness
Culture of Inclusiveness and Wellness
Interdisciplinary Exchanges
Interdisciplinary Exchanges
Enhancing Undergraduate Educa?on
Enhancing Undergraduate Educa?on Professional Development and Training
Professional Development and Training
Empowering Academic Units
Empowering Academic Units
Establishing Excellence in Teaching
Establishing Excellence in Teaching
Administra?ve Efficiency and Op?miza?on
Administra?ve Efficiency and Op?miza?on
Graduate Programming
Graduate Programming
Development and Fundraising Development and Fundraising 4.40 4.36
6.76 5.51
r = 0.39
Figure 32 Summary. Relative Importance Ratings. The top five domains for GSWS were (1) Promoting Diversity, (2) Pathways to Professional Success, (3) Accountability and Performance-Based Incentives, (4) Research and Scholarship and (5) Engagement Principles. The top five domains did not significantly differ. The Promoting Diversity domain was rated significantly more important than all other domains. GSWS vs. CHS on Relative Importance Ratings. GSWS stakeholders and CHS stakeholders significantly differed in their ratings of importance for Promoting Diversity, Accountability, Research and Scholarship, and Engagement Principles. GSWS stakeholders rated each of these domains significantly more important than the college. Level of Agreement. There is a low to moderate positive correlation between the priorities rated by GSWS stakeholders and CHS stakeholders in general (r = .39).!!
Example: Comparing Specific Department and College on Ra+ngs of Importance

Example: Comparing Key Stakeholder Groups on Ra+ngs of Importance
Classified Staff w/ 10 or Fewer Service Years Rela+ve Importance Classified Staff w/ 11 or More Service Years Rela+ve Importance
Culture of Inclusiveness and Wellness
Culture of Inclusiveness and Wellness Professional Development and Training
Professional Development and Training Accountability and Performance-‐Based Incen?ves
Accountability and Performance-‐Based Incen?ves
Administra?ve Efficiency and Op?miza?on Administra?ve Efficiency and Op?miza?on
Pathways to Professional Success
Pathways to Professional Success
Interdisciplinary Exchanges
Interdisciplinary Exchanges
Enhancing Undergraduate Educa?on
Enhancing Undergraduate Educa?on
Establishing Excellence in Teaching
Establishing Excellence in Teaching
Empowering Academic Units
Empowering Academic Units
Engagement Principles
Engagement Principles
Research and Scholarship
Research and Scholarship
Graduate Programming
Graduate Programming
Development and Fundraising Development and Fundraising
Promo?ng Diversity
Promo?ng Diversity
4.72 5.13
5.72 5.98
r = 0.65
Figure 47 Summary. Classified Staff w/ 10 Years or Less Importance Ratings. The top five domains were (1) Culture of Inclusive and Wellness, (2) Professional Development and Training, (3) Accountability and Performance-Based Incentives, (4) Administrative Efficiency and Optimization, and (5) Pathways to Professional Success. Classified Staff w/ 11 Years or More Relative Importance Ratings. The top five domains were (1) Accountability and Performance-Based Incentives, (2) Culture of Inclusiveness and Wellness, (3) Professional Development and Training, (4) Administrative Efficiency and Optimization and (5) Empowering Academic Units. Level of Agreement. There is a moderate positive correlation between priorities rated as highly important between key stakeholder groups (r = .65) in the college. Significant Differences Between Staff w/ 10 Years or Less and Staff w/ 11 or More Years. There were no significant differences between key stakeholder groups in their rating of the top five domains. Of note, however, is the significant difference in their rating of Promoting Diversity. Classified Staff w/ 10 or fewer service years rated strategic priorities related to promoting diversity significantly lower than their more experienced counterparts.!!!

Step 6: U+liza+on Applica?ons and Next Steps
• No+fica+on to CHS stakeholders – Comple?on of first phase. Technical report and report supplement available on Drive.
– Timetable for second phase. Scheduling small group mee?ngs with key stakeholders.
• Presenta+on to ACM – The Development of a Strategic Planning Framework for VCU’s College of HumaniFes and Sciences
• Small Group Mee+ngs – Disseminate and discuss report supplement
• Clarifica?on of strategic priori?es • Stra?fica?on of Tier I Priori?es • Reposi?oning Tier II and Tier III Priori?es