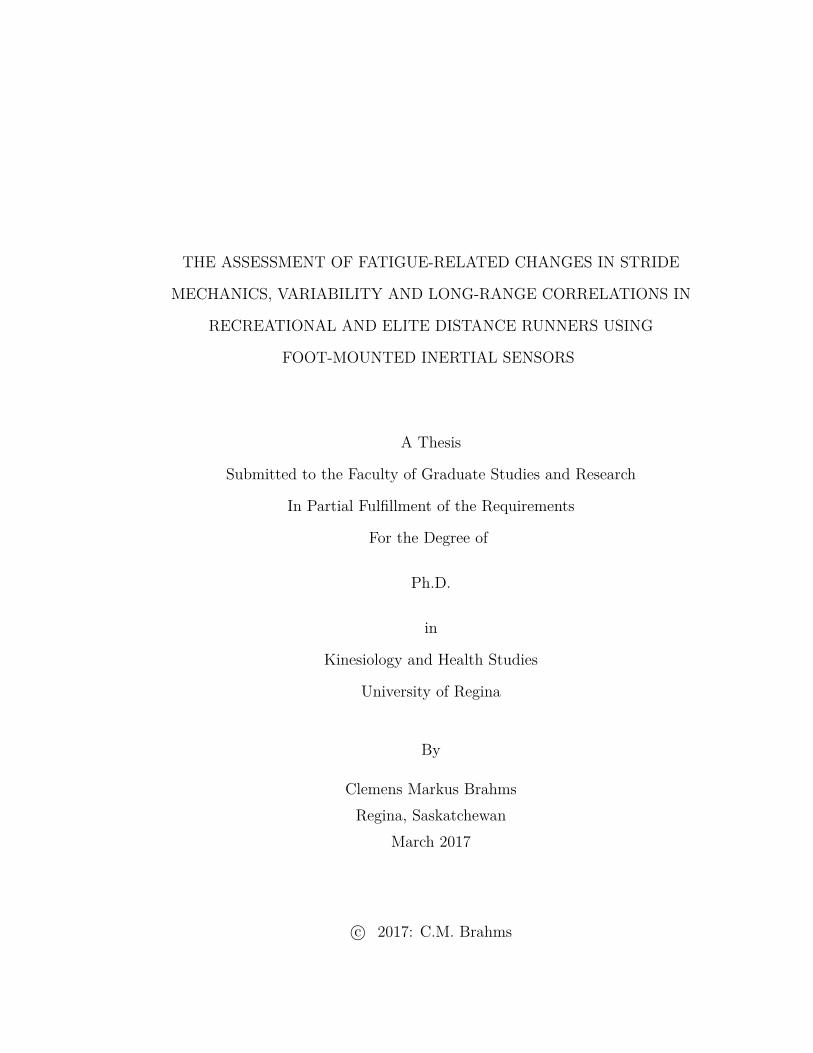
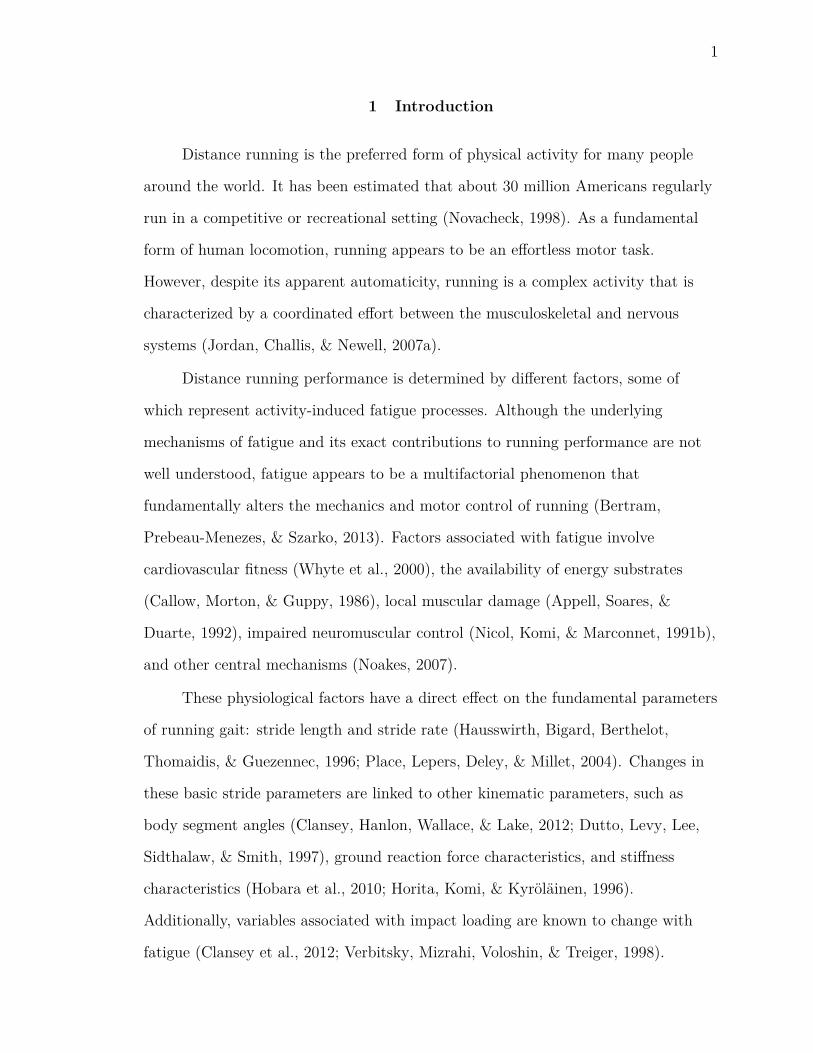
Gait Stance phase Swing phase Running speed = stride length stride rate (frequency)
THE ASSESSMENT OF FATIGUE-RELATED CHANGES IN STRIDE
MECHANICS, VARIABILITY AND LONG-RANGE CORRELATIONS IN
RECREATIONAL AND ELITE DISTANCE RUNNERS USING
FOOT-MOUNTED INERTIAL SENSORS
A Thesis
Submitted to the Faculty of Graduate Studies and Research
In Partial Fulfillment of the Requirements
For the Degree of
Ph.D.
in
Kinesiology and Health Studies
University of Regina
By
Clemens Markus BrahmsRegina, Saskatchewan
March 2017
c© 2017: C.M. Brahms

UNIVERSITY OF REGINA
FACULTY OF GRADUATE STUDIES AND RESEARCH
SUPERVISORY AND EXAMINING COMMITTEE
Clemens Markus Brahms, candidate for the degree of Doctor of Philosophy in Kinesiology and Health Studies, has presented a thesis titled, The assessment of fatigue-related changes in stride mechanics, variability and long-range correlations in recreational and elite distance runners using foot-mounted inertial sensors, in an oral examination held on December 19, 2016. The following committee members have found the thesis acceptable in form and content, and that the candidate demonstrated satisfactory knowledge of the subject material. External Examiner: *Dr. Reed Ferber, University of Calgary
Supervisor: Dr. John Barden, Faculty of Kinesiology and Health Studies
Committee Member: Dr. Paul Bruno, Faculty of Kinesiology and Health Studies
Committee Member: Dr. David Gerhard, Department of Computer Science
Committee Member: Dr. Darren Candow, Faculty of Kinesiology and Health Studies
Chair of Defense: Dr. Doug Durst, Faculty of Social Work *Via teleconference
ii
Abstract
This thesis was designed to assess stride mechanics, variability and long-range
correlations during running, as well as their relationship with fatigue and skill level.
For this purpose, three separate experiments were conducted. As a first step, it was
established whether a simple hardware setup consisting of a wireless foot-mounted
inertial measurement unit (IMU) was capable of accurately measuring individual
stride length vectors during distance running. The results showed that the
sensor-based method displayed excellent levels of agreement with a 3D motion
capture system as the criterion. Subsequently, the same setup was used to track a
set of gait variables in a group of elite and recreational runners during an exhaustive
overground run. It was established that long-range correlations (LRCs) decreased
over the run, while no significant changes were observed in the coefficients of
variation (CV). Group differences were found in mean stride length, contact time
and peak impact acceleration, stride time CV as well as peak impact acceleration
FSI. A final study assessed the impact of a fatiguing drop jump protocol on joint
stiffness, stride mechanics and measures of variability. As before, a group of elite
and recreational distance runners were recruited for this experiment. It was found
that joint stiffness was significantly reduced after the fatiguing jumps. Additionally,
mean stride time, as well as LRCs in the stride time and stride length series were
reduced in response to the jumps. Group differences existed in knee joint stiffness
and mean stride length. Notable interaction effects indicated that elite and
recreational runners reacted differently to the fatiguing jumps with respect to mean
ankle joint stiffness and stride length. Together, this thesis demonstrates that
long-range correlations serve as a potential marker of neuromuscular fatigue during
prolonged running. It also confirms that IMUs are capable of tracking a variety of
gait parameters across a range of different distance running speeds.
Keywords: distance running, fatigue, stride variability, inertial sensors, IMU

iii
Acknowledgements
First, I would like to express my sincere gratitude to my advisor Dr. John
Barden for the continuous support of my Ph.D study and related research, for his
patience, motivation, and immense knowledge. His guidance helped me in all the
time of research and writing of this thesis. I could not have imagined having a
better advisor and mentor for my Ph.D.
I would also like to thank my thesis committee: Dr. Paul Bruno, Dr. Darren
Candow and Dr. David Gerhard for their insightful comments and encouragement
that motivated me to look at my research from various perspectives.
I am indebted to Dr. Yang Zhao, who provided help and assistance with the
MATLAB scripts. Without your support it would not have been possible to conduct
this research.
Thanks to my friends and fellow graduate students in Canada: Sebastian,
Nick, Michael, Oscar and Michelle. I also want thank to my friends in Germany:
Achim, Billi, Felix, Freddy, Jan, Johanna Kristian, Markus and Steffen for keeping
in touch over the years and always being there for me.
I am very thankful to my family: My parents Heidrun and Ralf, my
grandparents Henni and Ludwig, my brother Wilko and my sister Antke. I don’t
know where I would be without you. Last but not least, I want to thank Sarah for
always being by my side. Your love and support made all of this possible.

iv
Contents
Abstract ii
Acknowledgements iii
Table of Contents iv
List of Figures vii
List of Tables xi
List of Abbreviations xii
1 Introduction 1
2 Literature Review 7
2.1 The Gait Cycle in Walking and Running . . . . . . . . . . . . . . . . 7
2.2 Kinematics . . . . . . . . . . . . . . . . . . . . . . . . . . . . . . . . 8
2.2.1 Sagittal Plane Kinematics . . . . . . . . . . . . . . . . . . . . 10
2.2.2 Coronal Plane Kinematics . . . . . . . . . . . . . . . . . . . . 11
2.2.3 Transverse Plane Kinematics . . . . . . . . . . . . . . . . . . . 11
2.3 Kinetics . . . . . . . . . . . . . . . . . . . . . . . . . . . . . . . . . . 12
2.3.1 Ground Reaction Forces and Center of Pressure . . . . . . . . 12
2.3.2 Joint Forces, Moments and Power . . . . . . . . . . . . . . . . 15
2.4 Functional Anatomy of Running . . . . . . . . . . . . . . . . . . . . . 17
2.5 Biomechanical Factors Affecting Running Technique . . . . . . . . . . 19
2.5.1 Running Speed . . . . . . . . . . . . . . . . . . . . . . . . . . 19
2.5.2 Footfall Patterns in Running . . . . . . . . . . . . . . . . . . . 21
2.5.3 Skill Level . . . . . . . . . . . . . . . . . . . . . . . . . . . . . 22

v
2.5.4 Treadmill vs. Overground Running . . . . . . . . . . . . . . . 24
2.5.5 The Stretch-Shortening Cycle . . . . . . . . . . . . . . . . . . 26
2.5.6 Stiffness and Spring-Mass Behavior in Human Running . . . . 27
2.5.7 Impact Acceleration . . . . . . . . . . . . . . . . . . . . . . . 30
2.6 Fatigue in Running . . . . . . . . . . . . . . . . . . . . . . . . . . . . 32
2.6.1 Effects of Fatigue on Kinematics . . . . . . . . . . . . . . . . . 33
2.6.2 Effects of Fatigue on Kinetics . . . . . . . . . . . . . . . . . . 35
2.6.3 Effects of Fatigue on SSC Performance and Stiffness . . . . . . 36
2.6.3.1 SSC Fatigue . . . . . . . . . . . . . . . . . . . . . . . 36
2.6.3.2 Stiffness . . . . . . . . . . . . . . . . . . . . . . . . . 39
2.6.4 Effects on Impact Acceleration and Shock Attenuation . . . . 41
2.6.5 Effects of Fatigue on Movement Variability . . . . . . . . . . . 42
2.7 Gait Variability . . . . . . . . . . . . . . . . . . . . . . . . . . . . . . 43
2.7.1 Linear Gait Dynamics . . . . . . . . . . . . . . . . . . . . . . 43
2.7.2 Nonlinear Gait Dynamics . . . . . . . . . . . . . . . . . . . . 45
2.7.3 Nonlinear Dynamics in Walking and Running . . . . . . . . . 47
2.8 Inertial Measurement Units . . . . . . . . . . . . . . . . . . . . . . . 50
2.8.1 Inertial Measurement Units in Gait Analysis . . . . . . . . . . 51
3 Purpose and Objectives 58
4 Study 1: Concurrent Validity of a Foot-Mounted IMU to Estimate
Stride Length in Running 61
4.1 Research Design . . . . . . . . . . . . . . . . . . . . . . . . . . . . . . 62
4.2 Instrumentation and Test Procedures . . . . . . . . . . . . . . . . . . 64
4.3 Data Analysis . . . . . . . . . . . . . . . . . . . . . . . . . . . . . . . 67
4.4 Statistical Analysis . . . . . . . . . . . . . . . . . . . . . . . . . . . . 69
4.5 Results . . . . . . . . . . . . . . . . . . . . . . . . . . . . . . . . . . . 69
vi
4.6 Discussion . . . . . . . . . . . . . . . . . . . . . . . . . . . . . . . . . 71
4.7 Conclusion and Future Work . . . . . . . . . . . . . . . . . . . . . . . 76
5 Study 2: Stride Mechanics and Variability over a Prolonged Run in
Recreational and Elite Distance Runners 77
5.1 Research Design . . . . . . . . . . . . . . . . . . . . . . . . . . . . . . 79
5.2 Instrumentation and Test Procedures . . . . . . . . . . . . . . . . . . 81
5.3 Data Analysis . . . . . . . . . . . . . . . . . . . . . . . . . . . . . . . 83
5.4 Statistical Analysis . . . . . . . . . . . . . . . . . . . . . . . . . . . . 87
5.5 Results . . . . . . . . . . . . . . . . . . . . . . . . . . . . . . . . . . . 88
5.6 Discussion . . . . . . . . . . . . . . . . . . . . . . . . . . . . . . . . . 102
5.7 Conclusion . . . . . . . . . . . . . . . . . . . . . . . . . . . . . . . . . 115
6 Study 3: The Effects of a Fatiguing Jump Protocol on Joint Stiff-
ness, Stride Kinematics, Variability and Long-Range Correlations in
Recreational and Elite Distance Runners 117
6.1 Research Design . . . . . . . . . . . . . . . . . . . . . . . . . . . . . . 119
6.2 Instrumentation and Test Procedures . . . . . . . . . . . . . . . . . . 120
6.3 Data Analysis . . . . . . . . . . . . . . . . . . . . . . . . . . . . . . . 125
6.4 Statistical Analysis . . . . . . . . . . . . . . . . . . . . . . . . . . . . 127
6.5 Results . . . . . . . . . . . . . . . . . . . . . . . . . . . . . . . . . . . 128
6.6 Discussion . . . . . . . . . . . . . . . . . . . . . . . . . . . . . . . . . 136
6.7 Conclusion . . . . . . . . . . . . . . . . . . . . . . . . . . . . . . . . . 145
7 Limitations 147
8 Conclusion and Future Work 150
References 156
vii
List of Figures
1 Schematic representation of the gait cycle during running. Reproduced
from Öunpuu (1994). The biomechanics of walking and running. Clin-
ics in Sports Medicine, 13, 843-863. (Copyright c©1994 Elsevier).
Reprinted with permission of Elsevier, Inc. . . . . . . . . . . . . . . . 8
2 Muscle activation patterns in running. Reproduced from Novacheck
(1998). The biomechanics of running. Gait and Posture, 7, 77-95.
(Copyright c©1998 Elsevier). Reprinted with permission of Elsevier, Inc. 19
3 Representative example of resultant acceleration signal recorded with
a foot-mounted IMU during distance running. . . . . . . . . . . . . . 55
4 Representative example of an angular velocity signal recorded with a
foot-mounted IMU during distance running. . . . . . . . . . . . . . . 56
5 Velocity estimates derived from acceleration signal by integration with
(solid line) and without (dotted line) applying regular ZUPTs. Figure
adapted from Feliz, Zalama, and Garcia-Bermejo (2009). Pedestrian
tracking using intertial sensors. Journal of Physical Agents, 3, 35-43. 63
6 IMU orientation and reflective markers attached to the foot. . . . . . 65
7 Camera setup in the lab. . . . . . . . . . . . . . . . . . . . . . . . . . 66
8 A scatterplot showing the relationship between the stride length esti-
mates of the two different methods. . . . . . . . . . . . . . . . . . . . 70
9 Bland-Altman plot comparing the two different methods to calculate
stride length. . . . . . . . . . . . . . . . . . . . . . . . . . . . . . . . 72
10 Between-method difference in stride length for each participant. . . . 73
11 Resultant angular velocity during running. The bold line indicates the
stance phases detected by the algorithm. Improper threshold tuning is
shown to cause considerable stance detection errors. . . . . . . . . . . 74

viii
12 Diagram showing the dimensions of the indoor track and the experi-
mental setup. . . . . . . . . . . . . . . . . . . . . . . . . . . . . . . . 82
13 Stride time, contact time and peak impact acceleration calculated from
the resultant acceleration signal recorded by the foot-mounted IMU. . 85
14 Mean stride length as a function of run duration. n = mean SL sig-
nificantly different (p < 0.001) between groups. . . . . . . . . . . . . 90
15 Mean stride time as a function of run duration. . . . . . . . . . . . . 90
16 Mean tc as a function of run duration. n = mean tc significant differ-
ence (p < 0.001) between groups, * = significant difference (p = 0.041)
between beginning and middle of the run . . . . . . . . . . . . . . . . 92
17 Mean PIA as a function of run duration. n = significant difference (p <
0.001) between groups. * = significant difference (p = 0.045) between
the beginning and middle of the run, ** = significant difference (p =
0.009) between the beginning and end of the run, *** = significant
difference (p = 0.031) between the middle and end of the run. . . . . 93
18 Coefficients of variation for SL as a function of run duration. . . . . . 94
19 Coefficients of variation for ST as a function of run duration. n =
significant difference (p = 0.007) between groups. . . . . . . . . . . . 95
20 Coefficients of variation for tc as a function of run duration. . . . . . 96
21 Coefficients of variation for PIA as a function of run duration. . . . . 96
22 FSI α for SL as a function of run duration. * = significant difference (p
< 0.001) between the beginning and middle of the run, ** = significant
difference (p < 0.001) between the beginning and end of the run . . . 98
23 FSI α for ST as a function of run duration. * = significant difference (p
< 0.001) between the beginning and middle of the run, ** = significant
difference (p < 0.001) between the beginning and end of the run . . . 99

ix
24 FSI α for PIA as a function of run duration. * = significant difference
(p < 0.001) between the beginning and middle of the run, ** = sig-
nificant difference (p < 0.001) between the beginning and end of the
run . . . . . . . . . . . . . . . . . . . . . . . . . . . . . . . . . . . . . 100
25 FSI α for tc as a function of run duration. * = significant difference (p
= 0.003) between the beginning and middle of the run. . . . . . . . . 101
26 Example of stride time series over the course of the run. . . . . . . . 103
27 Example of stride length series over the course of the run. . . . . . . . 104
28 Representative example of stride length series for elite and recreational
runners. . . . . . . . . . . . . . . . . . . . . . . . . . . . . . . . . . . 106
29 Mean stride length (a) and stride rate (b) of each participant as a
function of running speed. . . . . . . . . . . . . . . . . . . . . . . . . 108
30 Representative example of stride time series for elite and recreational
runners. . . . . . . . . . . . . . . . . . . . . . . . . . . . . . . . . . . 109
31 Marker setup for plug-in gait model. Reproduced from Oxford Metrics
Plug-in-gait marker placement manual. Permission granted via open-
access license. . . . . . . . . . . . . . . . . . . . . . . . . . . . . . . . 123
32 Calculation of joint stiffness for running. Stiffness (k) is represented
by the slope of the dashed line. . . . . . . . . . . . . . . . . . . . . . 127
33 AJS for the the pre- and post-jump condition. * = significant main
effect (p < 0.001) for run condition, u = significant interaction effect
for group x run condition (p = 0.042) . . . . . . . . . . . . . . . . . . 130
34 KJS for the the pre- and post-jump condition. * = significant main
effect (p = 0.007) for run condition, n = significant interaction effect
for group (p = 0.012) . . . . . . . . . . . . . . . . . . . . . . . . . . . 130
35 Mean SL for both groups before and after the fatiguing jump protocol.
n = significant main effect (p < 0.001) for group . . . . . . . . . . . 131

x
36 Mean ST for both groups before and after the fatiguing jump protocol.
* = significant main effect (p < 0.001) for run condition . . . . . . . 132
37 Stride time CV (a) and stride length CV (b) for both groups before
and after the fatiguing jump protocol. . . . . . . . . . . . . . . . . . . 133
38 FSI α calculated for SL for both groups before and after the fatiguing
jump protocol. * = significant main effect (p < 0.001) for run condition134
39 FSI α calculated for ST for both groups before and after the fatiguing
jump protocol. * = significant main effect (p < 0.001) for run condition135

xi
List of Tables
1 Subject characteristics. . . . . . . . . . . . . . . . . . . . . . . . . . . 64
2 Descriptive statistics of SL data. . . . . . . . . . . . . . . . . . . . . . 71
3 Subject characteristics of the different groups (Elite vs. Recreational). 89
4 Average values of descriptive parameters for the prolonged run. . . . . 91
5 Mean values (± SD) of selected stride parameters during the prolonged
run. . . . . . . . . . . . . . . . . . . . . . . . . . . . . . . . . . . . . 94
6 Coefficients of variation of selected stride parameters (± SD) during
the prolonged run. . . . . . . . . . . . . . . . . . . . . . . . . . . . . 98
7 α (± SD) of selected stride parameters during the prolonged run. . . 102
8 Characteristics of the different study groups (Elite vs. Recreational). 128
9 Descriptives for the pre- and post-jump overground runs on the indoor
track. . . . . . . . . . . . . . . . . . . . . . . . . . . . . . . . . . . . . 129
10 Values of the dependent variables for the pre- and post-jump condition. 136

xii
List of Abbreviations
3D Three-dimensional
α Fractal scaling exponent α
ACL Anterior cruciate ligament
AJS Ankle joint stiffness
ANOVA Analysis of variance
ASIS Anterior Superior Iliac Spine
cm Centimeter
CNS Central nervous system
COM Center of mass
COP Center of pressure
CV Coefficient of variation
df Degrees of freedom (statistics)
DFA Detrended Fluctuation Analysis
DOF Degrees of freedom (navigation)
DOMS Delayed-onset muscle soreness
e.g. Exempli gratia (for example)
EMG Electromyography
η2 Eta squared
et al. Et alia (and others)
etc. Et cetera (and so forth)
F Force
FFS Forefoot strike
FSI Fractal scaling index
g Standard gravity; acceleration due to gravity
GHz Gigahertz
GRF Ground reaction force

xiii
h Hour
HR Heart rate
Hz Hertz
i.e. Id est (that is)
IEEE Institute of Electrical and Electronics Engineers
ICC Intraclass correlation coefficient
IMU Inertial Measurement Unit
INS Inertial integration
k Stiffness
kg Kilogram
KJS Knee joint stiffness
km Kilometer
LRC Long range correlations
m Meter
MEMS Microelectromechanical systems
MFS Midfoot strike
mm Millimeter
ms Milliseconds
N Newton
p p-value
Pa Pascal
PDR Pedestrian dead reckoning
PIA Peak impact acceleration
PRS Preferred running speed
PSIS Posterior Superior Iliac Spine
r Pearson’s r ; correlation coefficient
rad Radian

xiv
RFS Rearfoot strike
RLOA Ratios limit of agreement
RMSE Root mean squared error
RPE Rate of perceived exertion
s Seconds
SD Standard deviation
SEC Series elastic component
SL Stride length
SR Stride rate
SSC Stretch shortening cycle
ST Stride time
tc Contact time
VO2max Maximal oxygen consumption
ZUPT Zero-velocity update
1
1 Introduction
Distance running is the preferred form of physical activity for many people
around the world. It has been estimated that about 30 million Americans regularly
run in a competitive or recreational setting (Novacheck, 1998). As a fundamental
form of human locomotion, running appears to be an effortless motor task.
However, despite its apparent automaticity, running is a complex activity that is
characterized by a coordinated effort between the musculoskeletal and nervous
systems (Jordan, Challis, & Newell, 2007a).
Distance running performance is determined by different factors, some of
which represent activity-induced fatigue processes. Although the underlying
mechanisms of fatigue and its exact contributions to running performance are not
well understood, fatigue appears to be a multifactorial phenomenon that
fundamentally alters the mechanics and motor control of running (Bertram,
Prebeau-Menezes, & Szarko, 2013). Factors associated with fatigue involve
cardiovascular fitness (Whyte et al., 2000), the availability of energy substrates
(Callow, Morton, & Guppy, 1986), local muscular damage (Appell, Soares, &
Duarte, 1992), impaired neuromuscular control (Nicol, Komi, & Marconnet, 1991b),
and other central mechanisms (Noakes, 2007).
These physiological factors have a direct effect on the fundamental parameters
of running gait: stride length and stride rate (Hausswirth, Bigard, Berthelot,
Thomaidis, & Guezennec, 1996; Place, Lepers, Deley, & Millet, 2004). Changes in
these basic stride parameters are linked to other kinematic parameters, such as
body segment angles (Clansey, Hanlon, Wallace, & Lake, 2012; Dutto, Levy, Lee,
Sidthalaw, & Smith, 1997), ground reaction force characteristics, and stiffness
characteristics (Hobara et al., 2010; Horita, Komi, & Kyröläinen, 1996).
Additionally, variables associated with impact loading are known to change with
fatigue (Clansey et al., 2012; Verbitsky, Mizrahi, Voloshin, & Treiger, 1998).

2
Most studies that look at the effects of fatigue on the biomechanics of running
involve either recreational runners or elite endurance athletes. Only a few studies
have focused on the differences that exist between runners of different skill and
training levels (Bertram et al., 2013; Cavanagh, Pollock, & Landa, 1977). This is
problematic because there is evidence to suggest that fatigue affects recreational
and elite distance runners to varying degrees. For example, Bertram et al. (2013)
have shown that lesser-trained runners experience fatigue at an earlier point in a
race than elite distance runners. Consequently, lesser-skilled runners may experience
a higher level of exertion and exhibit different changes in running technique in
response to fatigue. Analyzing the differences that exist between these individuals
could help make recommendations that aim at the optimization of stride mechanics
to maintain consistent running performance.
The majority of studies that have involved prolonged running have been
conducted in controlled laboratory environments. In biomechanics research, optical
methods and force plate measurements have traditionally been used to analyze
different aspects of running mechanics. However, the limited confines of the
laboratory severely restrict the number of strides that can be recorded and used for
further analysis. As a result, many studies in gait research involve treadmill
conditions because this allows researchers to track movement for a prolonged period
of time. Additionally, experiments that involve walking or running on a treadmill
are able to control for running speed and ensure accurate tracking of the parameters
of interest by using sophisticated biomechanical motion capture systems.
Although these methods have allowed researchers to investigate various aspects
of running biomechanics, there is evidence to suggest that running under controlled
conditions in the laboratory, particularly on a treadmill, differs considerably from
running in an unrestricted overground scenario (Frishberg, 1983; Nigg, Cole, &
Brüggemann, 1995). However, despite the great interest in the biomechanics of
3
distance running, there is a scarcity of research that has tried to obtain and analyze
spatiotemporal parameters of running gait in an unrestricted environment. In recent
years, advances in technology have led to the development of accurate, noninvasive
and cost-effective microelectromechanical systems (MEMS) components that have a
wide range of potential applications in biomechanics research. Among these, inertial
measurement units (IMUs) are frequently used for the analysis of locomotor tasks.
Most IMUs simultaneously collect data from a set of gyroscopes and accelerometers.
Consequently, IMUs are capable of measuring accelerations and angular velocity
along three orthogonal axes, thereby quantifying movement by six degrees of
freedom. When securely attached to an individual, IMUs can provide valuable
information about the characteristics of the stride pattern.
The placement of the IMU dictates the information provided about the
movement. When attached near the body’s center of mass, the recorded signals
represent the motion of the trunk. When placed at the distal part of the lower
extremity, the recorded signals may be used to interpret segmental kinematics.
IMUs may also be used to calculate a variety of gait events and stride parameters
during walking and running (Angermann, Robertson, Kemptner, & M., 2010;
Bichler et al., 2012; Feliz, Zalama, & Garcia-Bermejo, 2009; Jimenez, Seco, Prieto,
& Guevara, 2009; Kobsar, Olson, Paranjape, Hadjistavropoulos, & Barden, 2014) or
to measure the impact acceleration that is being exerted onto the body at ground
contact (Mercer, Devita, Derrick, & Bates, 2003). Given their small size, versatility
and accuracy, IMUs are effective biomechanical tools that are able to address and
overcome some of the current limitations of biomechanical locomotor analysis in a
confined laboratory setting.
In addition to measuring spatiotemporal gait parameters, IMUs are also
capable of assessing the regularity and variability of movement. Like other
physiological variables (such as heart rate), stride parameters vary over time and
4
change from one stride to the next, even when external conditions are controlled
(Hausdorff, 2005). Studies conducted on the dynamics of walking have shown that
healthy individuals usually exhibit a highly stable pattern of spatiotemporal
characteristics (Terrier, 2003). Traditionally, a predictable structure of
stride-to-stride fluctuations in the gait pattern is thought to indicate efficient motor
control, while changes in neurological function associated with aging and certain
disease states negatively influence the temporal persistence of the stride pattern
(Hausdorff, 2007).
Although originally regarded as noise, it is now understood that
stride-to-stride fluctuations (i.e. gait variability) play an important role in the
control of human gait. Both linear and nonlinear aspects of these gait fluctuations
can be calculated to assess the variability and temporal stability of the gait pattern.
Linear measures, such as the standard deviation (SD) or the coefficient of variation
(CV), relate to the central tendency of the gait pattern. They provide useful
information about the overall level of dispersion and indicate how much a certain
set of data fluctuates around its mean value. For example, the standard deviation of
stride-to-stride fluctuations has been used to evaluate the quality of postural control
during gait or limb asymmetries (Gabell & Nayak, 1984; Lord, Howe, Greenland,
Simpson, & Rochester, 2011).
In contrast, nonlinear measures of gait variability identify the structure of the
locomotor pattern, e.g. by assessing its temporal stability (Hamill, van Emmerik,
Heiderscheit, & Li, 1999; Hausdorff, 2007). One particular class of nonlinear
measures, which is based on the concept of fractal dynamics, assumes that
stride-to-stride fluctuations in the gait pattern are not randomly distributed but are
correlated with each other over long time spans. A method called detrended
fluctuation analysis (DFA) can be used to analyze the persistence of these so-called
long-range correlations (LRC) and indicate the level of dependency of a particular

5
gait cycle in the time series with other gait cycles. Like linear measures of gait
variability, DFA offers insight into the control of gait. Additionally, it can determine
the dynamic stability of the gait pattern by quantifying changes in fluctuations over
time, regardless of their magnitude (Jordan, Challis, Cusumano, & Newell, 2009).
Based on recent advances in the field of sensor technology, there is a growing
interest among researchers to explore the use of simple IMU-based systems in
biomechanics and clinical research. Although several studies have assessed
movement characteristics in relation to neuropathology and aging using IMUs
(Hausdorff, 2007; Hausdorff et al., 1997), there is a scarcity of research investigating
stride variability during unconstrained overground running. To date only one study
has applied DFA to prolonged distance running and examined the relationship
between stride-to-stride fluctuations and fatigue (Meardon, Hamill, & Derrick,
2011). These results indicate that prolonged running is associated with a significant
decrease in LRCs that are present in the stride time interval. The authors also
reported that the mean values of the analyzed parameters as well as linear measures
of gait variability were not affected by fatigue. However, it is not known what
causes the observed changes in gait dynamics and how they are linked to other
biomechanical parameters. It is also unclear if differences exist in the way fatigue
affects stride mechanics and gait dynamics in recreational and elite distance
runners. To address the gaps identified in the literature, the following experiments
were conducted as part of this dissertation:
1. As a first step, the concurrent validity of a foot-mounted IMU to calculate
stride length for distance running was established. In particular, it was tested
whether a pedestrian dead-reckoning (PDR) approach, which estimated stride
length by integrating the inertial signals (accelerations and angular velocities),
displayed high levels of absolute agreement with a 3D motion capture system
that measured stride length using reflective markers.

6
2. Subsequently, the validated IMU configuration was used to track different
stride parameters (e.g. stride length and stride time), as well as measures of
variability and temporal stability over the course of a fatiguing run at a fixed,
pre-determined running speed. This experiment was also designed to explore
whether skill level had an effect on stride mechanics and different measures of
stride pattern variability. In order to address this aspect, a group of elite
distance runners and a group of recreational runners were recruited for this
study. Based on the literature, it was hypothesized that a significant reduction
in the strength of the LRCs would occur over the course of the run and that
the observed changes would be more pronounced in the group of recreational
runners.
3. Finally, a third study was conducted to investigate the effects of a fatiguing
jump protocol on joint stiffness, stride kinematics and gait dynamics. It was
expected that exhaustive stretch-shortening cycle (SSC) exercise would
significantly reduce joint stiffness and also decrease the strength of LRCs
during distance running. Similar to the previous experiment, a group of elite
distance runners and a group of recreational runners were recruited to identify
whether fatigue affects stiffness characteristics and gait dynamics differently in
runners of different skill levels.

7
2 Literature Review
2.1 The Gait Cycle in Walking and Running
Walking and running gait are organized in a similar manner. Both forms of
locomotion consist of a series of strides, each of which represents one full gait cycle.
More precisely, the gait cycle is defined as the period from initial ground contact of
one foot to the following initial contact of that same foot, during which each limb
has a period of support and non-support (Öunpuu, 1994). These phases are referred
to as stance phase and swing phase (Novacheck, 1998).
Despite their similarities, walking and running gait both have unique
characteristics. Walking requires that at least one foot be in contact with the
ground throughout the whole gait cycle. It is further characterized by short periods
of double-support during which both feet are in contact with the ground. In
contrast, running is defined by a lack of double support and involves the presence of
a flight phase or double float (Novacheck, 1998). Whether a person becomes
airborne during locomotion or not, is determined by the relative contribution of the
stance phase to the gait cycle. Since a flight phase requires neither foot to be in
contact with the ground, the stance phase in running must comprise less than 50%
of the gait cycle (Öunpuu, 1994).
During running, the gait cycle can be further subdivided into a series of
specific events and sub-phases. These include initial contact, absorption, midstance,
propulsion, toe off, double float, initial swing, midswing, and terminal swing (see
Figure 1). The gait cycle begins with a period of absorption after initial contact.
This phase continues until midstance after which a period of propulsion occurs. Toe
off marks the beginning of a period of double float, which extends into initial swing.
Midswing, which occurs simultaneously with the stance phase of the contralateral
leg, is characterized by a phase of single support, while the terminal swing coincides
with a second short period of double float (Öunpuu, 1994). Running speed affects

8
the exact duration of the stance and swing phase and their respective sub-phases
(K. R. Williams, 2000).
Figure 1 . Schematic representation of the gait cycle during running. Reproducedfrom Öunpuu (1994). The biomechanics of walking and running. Clinics in SportsMedicine, 13, 843-863. (Copyright c©1994 Elsevier). Reprinted with permission ofElsevier, Inc.
2.2 Kinematics
The branch of biomechanics that deals with the description of human
movement is termed kinematics. The primary parameters of interest in kinematics
involve linear displacement, velocity and acceleration as well as its angular
equivalents. Kinematics is not concerned with the internal or external forces that
cause the observed motion (Winter, 2009).
Kinematic analyses in running often focus on the motion of body segments
with respect to an external reference frame or relative to each other. However,
sometimes researchers might also be interested in the motion of the body’s center of
mass (COM) (K. R. Williams, 2000). When the position of the COM is visualized
over the course of one full gait cycle, it becomes apparent that the vertical excursion
exhibits an oscillating pattern, where the height of the body’s COM will reach a
minimum during midstance and a maximum during the flight phase. This behavior
fundamentally affects the way in which the system maintains movement efficiency
9
and serves as a basis for biomechanical models describing the human body during
running (Enoka, 2002).
The two basic kinematic parameters in running are stride length and stride
rate. Both parameters represent the combined output of several other factors. For
example, stride length comprises the distance the body travels during the stance
and flight phase. Similarly, stride rate is the result of stance and flight time. These
parameters are in turn influenced by various other biomechanical variables, such as
takeoff height and angle, takeoff speed, vertical and horizontal takeoff velocity, as
well as segmental kinematic and inertial parameters (J. P. Hunter, Marshall, &
McNair, 2004). Although it is often thought that anthropometric variables, such as
height or leg length are important determinants of SL, these parameters only
correlate weakly at typical distance running speeds (Cavanagh & Kram, 1989).
Typical stride rates in long- and middle-distance running range from 1.4 Hz - 1.8
Hz. However, values greater than 2.3 Hz have been reported for elite sprinters (100 -
400 m) at maximal speed (Luhtanen & Komi, 1978). Distances longer than 800 m
are generally accomplished with a relatively consistent frequency of 1.75 Hz (Hanon
& Gajer, 2009). Runners also employ greater stride lengths during sprinting
compared to long-distance running. Similar to stride rate, there appears to be
relatively little variation in stride length in race distances greater than 800 m
(Brüggemann & Glad, 1990; Scholich, 1978).
Increases in stride length and stride rate are accompanied by changes in
segmental kinematics. This includes both the range of motion occurring about the
joints as well as the interjoint coordination at the lower extremity. Since joint
kinematics differ from person to person and are influenced by factors such as skill
level and speed, their absolute values are of limited relevance (Novacheck, 1998). In
order to allow for comparison between runners, values are often normalized and
presented relative to the gait cycle (Enoka, 2002).

10
2.2.1 Sagittal Plane Kinematics. Most of the motion in running occurs
in the sagittal plane. Consequently, the kinematics at the hip, knee and ankle joint
in this plane have been studied extensively and are generally well-established.
The hip joint follows a basic sinusoidal pattern over the course of a full gait
cycle. Although extension begins in the late swing phase, some degree of flexion
exists when contact is made with the ground. During stance, the hip continuously
extends until peak extension is reached immediately before toe off. In early swing,
the hip begins to move into flexion, with peak values occurring in midswing. The
second half of the swing is characterized by a gradual transition into extension,
which prepares the limb for the upcoming ground contact. This strategy helps to
prevent excessive deceleration at initial contact and reduces potentially injurious
ground reaction forces that would occur if the foot was too far in front of the body’s
COM (Novacheck, 1998).
Motion at the knee joint during running is characterized by two periods of
flexion. The first period occurs during early stance and is the result of the vertical
ground reaction force (GRF) acting on the lower extremity. In distance running, the
knee flexes to approximately 45o in response to impact. During the later stage of
the stance phase the knee extends slightly, until the knee joint reaches an angle of
approximately 25o at toe off. This motion contributes to the vertical and anterior
displacement of the COM. During the subsequent swing phase, a second period of
flexion occurs, with the knee joint angle reaching approximately 90o. This
movement aims at the reduction of the moment of inertia of the lower limb during
swing and reduces energy cost (Novacheck, 1998).
Unlike the hip and the knee, greater interindividual variation exists with
respect to ankle joint kinematics. This is because motion at the ankle is strongly
influenced by the footfall pattern of the individual. The majority of distance
runners exhibit a heel strike pattern when running at moderate speeds (Hasegawa,

11
Yamauchi, & Kraemer, 2007). In these individuals, the ankle plantarflexes after
initial contact while runners who initiate contact with the midfoot or forefoot will
experience dorsiflexion during early stance (K. R. Williams, 2000). Thus, runners
may exhibit contrasting ankle joint motion during early stance.
2.2.2 Coronal Plane Kinematics. Compared to the sagittal plane, there
is relatively little motion occurring in the coronal plane at the lower extremity. This
is mainly due to strong ligamentous and osseous constraints (Neumann, 2010). For
example, the ankle joint only allows plantar-/ and dorsiflexion due to the bony
configuration of the talus and its fixed position between the tibia and fibula
(Tortora & Derrickson, 2012). In the foot segment, however, pronation and
supination occur in the coronal plane. In general, the foot pronates during the
absorption phase and supinates during the later stages of the stance, when power is
generated (K. R. Williams, 2000).
The knee, which is classified as a hinge joint, mainly allows movement in the
direction of flexion and extension and is further restricted by the collateral and
cruciate ligaments, as well as by the muscles located around the joint (Neumann,
2010). Despite these constraints, a small amount of adduction and abduction occurs
at the knee during running (Enoka, 2002). Significantly greater motion in the
coronal plane occurs at the hip joint. In general, the hip adducts during the early
stance phase and moves into abduction in the subsequent swing phase. Hip motion
is reciprocal to movement of the pelvis. By decoupling the large amount of lower
extremity motion from the head and the trunk, this mechanism serves the purpose
of keeping the head level, allowing balance and equilibrium to be maintained
(Novacheck, 1998).
2.2.3 Transverse Plane Kinematics. Lower-extremity motion in the
transverse plane involves joint rotations. Joint excursions in this plane suspectedly
have important implications for movement efficiency and injury mechanisms. For
12
example, some degree of pelvic rotation also occurs naturally during running. More
precisely, external rotation of the pelvis during initial contact assists the generation
of propulsive forces, which helps to maintain speed. Since rotation of the pelvis is
out-of-phase with rotation of the shoulder, this motion also helps to keep the center
of mass stable in the sagittal plane (Novacheck, 1998).
In general, there is limited internal and external knee rotation when the knee
is fully extended. However, when the knee exhibits less than 10o of flexion, the
femur naturally rotates on the tibia in the medial direction (Neumann, 2010). Thus,
if the femoral condyles or tibial plateau are shaped abnormally or if an individual
lacks ligamentous restraints, they might be predisposed to greater rotational range
of motion at the knee during dynamic loading (Boden, Breit, & Sheehan, 2009).
Likewise, there is evidence to suggest that abnormal foot and hip mechanics
contribute to increased rotational movements and higher incidences of knee
pathologies (Hintermann & Nigg, 1998; Powers, 2010).
2.3 Kinetics
Kinetics is the branch of mechanics that is concerned with the forces that
cause motion. It is based on Newton’s laws, which state that: a) objects are either
at rest or move at a constant velocity unless they are acted upon by an external
force; b) an external force acting on an object accelerates the object proportionally
to its mass in the direction of the exerted force; and c) an object that exerts a force
on a second object, experiences a force that is equal in magnitude and opposite in
direction by the second body.
2.3.1 Ground Reaction Forces and Center of Pressure. Many
movements involve the interaction of the body with the ground surface. Force plates
are commonly used in biomechanics research because they are able to measure the
ground reaction forces associated with these movements (Enoka, 2002). With
13
respect to running, the GRF represents the response of the support surface to the
action of the moving system. Ground reaction forces are usually recorded along
three orthogonal axes (vertical, anteroposterior and mediolateral). The resultant
effect of these components corresponds to the acceleration experienced by the center
of mass of the body (Enoka, 2002).
In reality, the GRF does not act on the body as a single vector. Rather it is
distributed over large parts of the foot. The concept of pressure is used to describe
the way in which force is distributed over an area (Pascal; 1 Pa = 1 N/m2). When
interacting with the ground, the magnitude of the vertical GRF is equal to the sum
of the pressure applied to the foot. The point of application of the resultant GRF
vector corresponds to the center of pressure (COP). Runners exhibit a large
interindividual variability in the distribution of pressure along the plantar surface.
This variability is attributed to anatomical differences and individual running
technique. For heel strikers, the COP is located at the posterior lateral aspect of the
foot during initial contact. In the subsequent stance phase it shifts to the central
region and over to the big toe. In runners who initiate contact with the midfoot, the
COP moves from the lateral border of the midfoot to its center and then transitions
towards the big toe (Enoka, 2002).
The vertical GRF component represents the reaction of the surface to the
gravitational acceleration of the body mass and therefore reaches greater values
than the other two components.. The magnitude of the vertical GRF increases at
higher running speeds (K. R. Williams, Cavanagh, & Ziff, 1987). Despite some
invariant characteristics, the vertical GRF profile exhibits significant differences that
depend on the running style of the individual. Most significantly, the vertical GRF
is affected by different footfall patterns (Lieberman et al., 2010).
In heel striking individuals, a double-peaked pattern can be observed at
typical distance running speeds (Cavanagh & Lafortune, 1980; Munro, Miller, &

14
Fuglevand, 1987). Immediately after initial contact, the GRF profile exhibits a short
and sharp impact peak, which reaches a magnitude of approximately 1.5 - 3 × body
weight (Lieberman et al., 2010; Munro et al., 1987). Subsequently, the force declines
and transitions towards a local minimum, after which the force increases again and
reaches another smooth and elongated peak. This so-called active peak reaches a
magnitude of about 2.5 - 3 × body weight and occurs somewhere between 35 to
50% of the stance phase (Hamill, Bates, Knutzen, & Sawhill, 1983; Munro et al.,
1987). In contrast, the vertical GRF profiles of runners who initiate ground contact
with the mid- or forefoot lack an initial impact peak (Lieberman et al., 2010). This
has potential implications for running injuries because the magnitude and rate of
impact loading have been repeatedly linked to overuse injuries, such as stress
fractures (Milner, Ferber, Pollard, Hamill, & Davis, 2006; Nigg, Denoth, &
Neukomm, 1981; Pohl, Hamill, & Davis, 2009).
No uniform GRF profile exists for the anteroposterior component of the
ground reaction force in running. Depending on their technique, individuals might
produce single-, double- and multiple-peaked patterns (Munro et al., 1987).
However, the anteroposterior GRF curve generally follows a biphasic pattern. The
initial phase, which represents a negative impulse, causes deceleration of the body’s
COM because the force acts in the posterior direction. The second part of the
anteroposterior curve represents a positive impulse, which acts in the direction of
the intended displacement (Munro et al., 1987). The onset of the propulsion phase
occurs roughly in the middle of the stance phase, independent of running speed
(Hamill et al., 1983).
When running at constant speed, the braking and propulsion impulse will be
equal in magnitude and opposite in direction. This implies that the net acceleration
of the COM in the anteroposterior direction must equal zero (Munro et al., 1987).
Since the magnitude of anteroposterior GRF increases with running speed, a larger

15
braking impulse occurs and needs to be compensated by a greater propulsive force.
As a result, greater muscular effort is necessary to maintain a constant speed.
The mediolateral component of the GRF shows the greatest variability among
runners (Munro et al., 1987). In comparison to the vertical and anteroposterior
GRF components, the magnitude of the mediolateral force is relatively small, with
normalized peak values reaching about 0.12 - 0.20 × body weight (Cavanagh &
Lafortune, 1980; Hamill et al., 1983). However, despite the large variability, the
mediolateral GRF might be used to identify bilateral asymmetries (Munro et al.,
1987).
2.3.2 Joint Forces, Moments and Power. When kinematic data is
combined with anthropometric variables and force plate data (GRF, COP), it
becomes possible to calculate parameters that provide information about joint
torques and reaction forces. The biomechanical method by which these parameters
are derived is known as inverse dynamics. For a detailed description of the inverse
dynamic approach see Winter (2009). In running, large flexion and extension
torques are generated at the ankle, knee and hip joint, which are used for
repositioning of the limbs during the swing phase and for effective forward drive of
the body’s center of mass during the stance phase (Novacheck, 1998).
At the knee, a flexor moment is generated in late swing, which counteracts
passive knee extension and decelerates the forward movement of the leg. Upon
initial contact, an extensor moment is produced to prevent collapse of the lower
extremity (Winter, 1983). This extensor moment is greater in endurance running
than it is in sprinting because lower running speeds involve a greater amount of
knee flexion. Since the knee still moves into slight flexion during early stance, the
extensors must contract eccentrically and a period of power absorption occurs
(Winter, 1983). In the late stance phase, the knee extends and power is generated.
After toe off, the knee extensors act again to absorb power and control flexion in the

16
early swing phase (Winter, 1983).
In heel striking individuals, an external plantarflexor moment is generated at
the ankle following initial contact, which causes the forefoot to be lowered to the
ground (Novacheck, 1998). A strong internal dorsiflexor moment is generated to
counter this movement. In contrast, midfoot and forefoot strikers experience an
external dorsiflexor moment at the ankle, which lowers the heel towards the ground.
This demonstrates that the footfall pattern of the runner influences ankle joint
kinetics, i.e. the way in which structures absorb and generate power (Novacheck,
1998). Regardless of the footfall pattern, the initial phase of power absorption at
the ankle joint is followed by a period of power generation. At this point, a net
plantarflexion moment is generated by concentric contraction of the triceps surae
muscle group. The magnitude of the power that is absorbed and generated at the
ankle joint depends on the running speed and impact forces (Novacheck, 1998).
In contrast to the knee and ankle joint, the action of the hip is very similar
across the different forms of locomotion. In both walking and running, the hip
extensors begin to generate power before initial contact occurs. This is continued
through the first half of the stance phase. Afterwards, the hip flexors become
increasingly activated and decelerate the backward motion of the lower extremity,
which allows them to absorb power (K. R. Williams, 2000). The elastic energy
stored in these structures is returned during the subsequent swing phase, which
helps to pull the lower extremity forward and reposition it for the next stride
(Novacheck, 1998; K. R. Williams, 2000).
Relatively little information exists about the joint kinetics in the coronal and
transverse planes. The task of muscles and ligaments is mainly to minimize motion
and to stabilize the joints (Neumann, 2010). At the proximal end of the lower
extremity, the gluteal muscles generate a constant hip abductor moment, which
helps to stabilize the pelvis in the coronal plane (Powers, 2010). During the first

17
half of the stance, the GRF falls medial to the hip and creates an external
adduction moment that has to be controlled by eccentric action of the hip
abductors. In the subsequent propulsion phase, the concentric contraction of the
abductors generates power at the hip (Novacheck, 1998). Small coronal plane
moments are also generated at the knee and ankle joints.
2.4 Functional Anatomy of Running
Muscle activity patterns in running are influenced by speed of locomotion and
the desired movement goal. Due to technological limitations it is impossible to
directly quantify the force generated by individual muscles, ligaments and other
tissues. However, given the assumption that muscles are the major source of power
generation and absorption in the body, generalized statements can be made about
how groups of muscles contribute to the movements occurring about a joint
(K. R. Williams, 2000). The muscle groups that generate a significant amount of
power in running include the hip extensors , i.e. the gluteus maximus and the
hamstrings, during the late swing phase and first half of the stance phase, the hip
flexors in the early swing phase, and the knee extensors, hip abductors, as well as
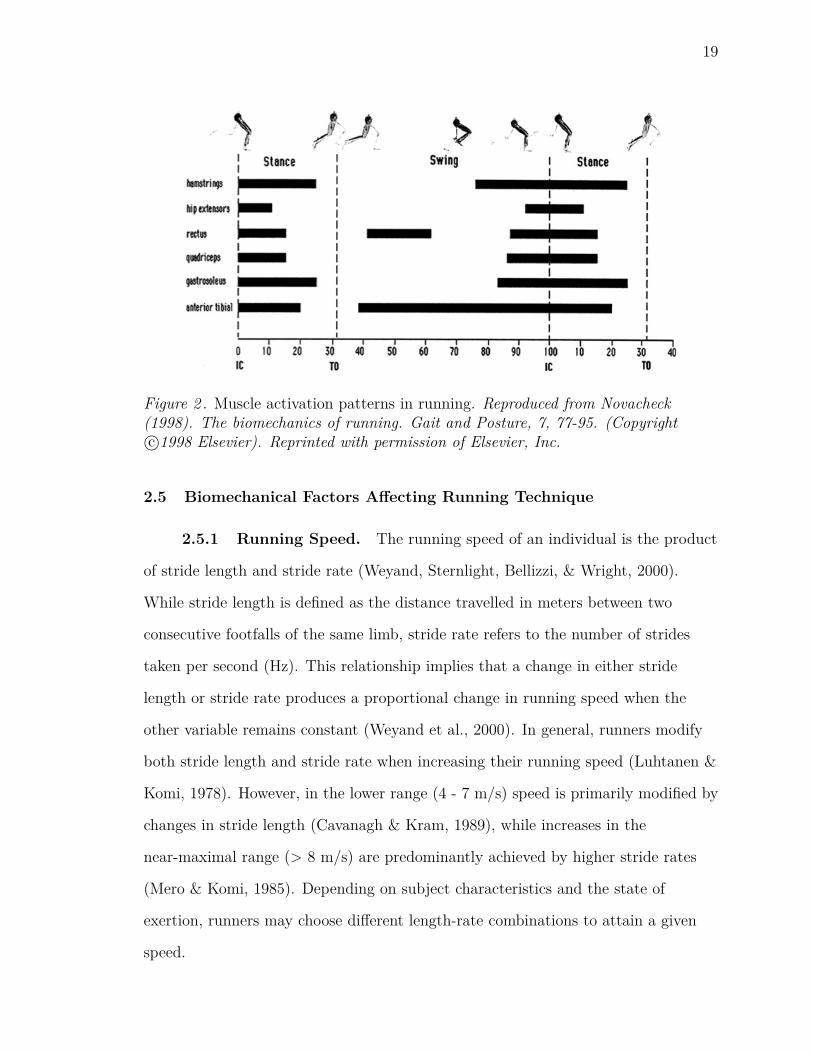
the ankle plantarflexors during the late stance phase (Novacheck, 1998).
After swing phase reversal and throughout early stance, the gluteus maximus
and hamstring muscles actively move the lower limb posteriorly by extending the
hip (see Figure 2). This observation is supported by the high electromyographic
(EMG) activity evident in these muscles before the foot makes contact with the
ground (K. R. Williams, 2000). In addition to the hip extensors, other prime
movers, such as the quadriceps, triceps surae, and tibialis anterior, also become
increasingly active during terminal swing (Öunpuu, 1994). There is evidence to
suggest that this strategy serves to adjust lower extremity stiffness in anticipation of
the high ground reaction forces that act on the system at foot strike (Komi, 2000).

18
EMG data further indicates that the knee extensors are highly active throughout
the first half of the stance phase (see Figure 2). Since there is an increase in knee
flexion during this time, these muscles contract eccentrically to attenuate impact
loads and prevent excessive knee flexion. In the subsequent propulsion phase, the
quadriceps and the triceps surae shorten to extend the knee and plantarflex the
ankle, thereby accelerating the body’s COM in the vertical and anterior direction
(Öunpuu, 1994). Simultaneously, the hip abductors (gluteus medius, gluteus
minimus) generate tension to keep the pelvis level in the coronal plane and help
provide a stable basis for the trunk (Novacheck, 1998). In the swing phase the hip
flexors accelerate the lower limb in the anterior direction (see Figure 2). The
amount of power generated by these muscles increases with running speed. The
rectus femoris becomes active during midswing to prevent excessive posterior
movement of the tibia when the knee is flexing (Öunpuu, 1994). Finally, there is
also considerable activity in the various trunk, arm and shoulder muscles, which
helps to minimize excursions of the COM during running and maintain movement
efficiency. For example, Hinrichs (1990) note that activity in the arms and the
shoulder girdle helps the runner to maintain a more constant horizontal velocity by
counteracting the rotation of the pelvis that occurs in running.
19
Figure 2 . Muscle activation patterns in running. Reproduced from Novacheck(1998). The biomechanics of running. Gait and Posture, 7, 77-95. (Copyrightc©1998 Elsevier). Reprinted with permission of Elsevier, Inc.
2.5 Biomechanical Factors Affecting Running Technique
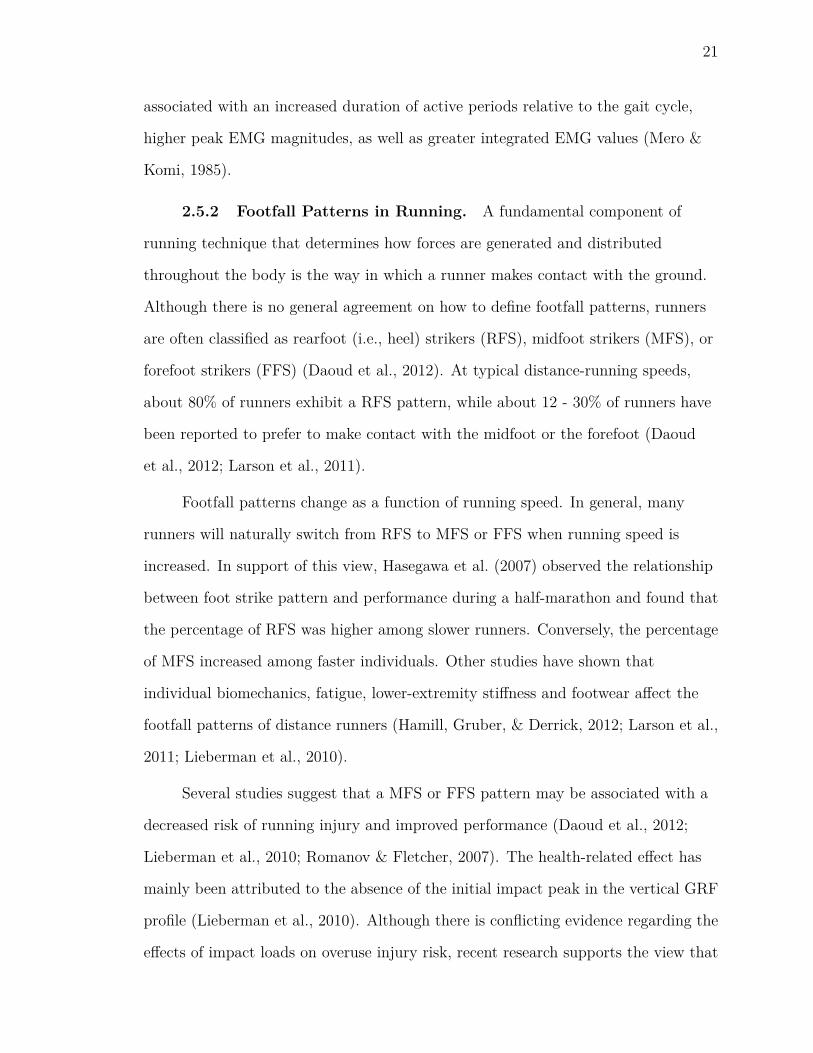
2.5.1 Running Speed. The running speed of an individual is the product
of stride length and stride rate (Weyand, Sternlight, Bellizzi, & Wright, 2000).
While stride length is defined as the distance travelled in meters between two
consecutive footfalls of the same limb, stride rate refers to the number of strides
taken per second (Hz). This relationship implies that a change in either stride
length or stride rate produces a proportional change in running speed when the
other variable remains constant (Weyand et al., 2000). In general, runners modify
both stride length and stride rate when increasing their running speed (Luhtanen &
Komi, 1978). However, in the lower range (4 - 7 m/s) speed is primarily modified by
changes in stride length (Cavanagh & Kram, 1989), while increases in the
near-maximal range (> 8 m/s) are predominantly achieved by higher stride rates
(Mero & Komi, 1985). Depending on subject characteristics and the state of
exertion, runners may choose different length-rate combinations to attain a given
speed.

20
Most biomechanical variables in running change significantly as a function of
running speed (Mero & Komi, 1985; Munro et al., 1987). Along with a general
reduction in stride time, a decrease in stance or contact time (tc) can be observed at
faster running speeds (Brughelli, Cronin, & Chaouachi, 2011). While tc comprises
approximately 60% of the gait cycle in walking, it decreases to approximately 35%
in running and 20% in sprinting (Novacheck, 1998). Nilsson, Thorstensson, and
Halbertsma (1985) further reported that swing time increases and decreases at
slower and faster running speeds, respectively. A significant effect of speed on joint
kinematics has also been documented. In general, higher speeds are associated with
a greater dynamic range of motion at the ankle, knee and hip joint. Moreover, the
point on the foot that initially touches the ground shifts from the heel towards the
forefoot (Novacheck, 1998). This is supported by the observation that most
individuals exhibit a heel strike pattern at typical distance running speeds, but
switch to a midfoot or forefoot strike pattern when sprinting.
Speed has a significant effect on the forces that cause segmental motion and
whole body movement during running. Vertical and horizontal GRF magnitudes are
known to increase directly as a function of speed. Peak vertical GRFs have been
reported to increase by 50 - 100%, while peak horizontal forces increase by more
than 200% from slow (ca. 1.5 m/s) to moderate (ca. 6.5 m/s) running speeds
(Nilsson et al., 1985). Brughelli et al. (2011) further note that peak horizontal GRF
increases over the complete range of running speeds, while peak vertical GRF
primarily increases at lower speeds and remains constant at speeds greater than
60%. The observation that the greatest changes in vertical GRF magnitude occurs
in the lower speed range is also supported by other studies (Kuitunen, Komi, &
Kyröläinen, 2002; Nummela, Keranen, & Mikkelsson, 2007).
Running speed has also been shown to influence the muscle activity of
lower-extremity muscles. Surface EMG recordings revealed that faster speeds are
21
associated with an increased duration of active periods relative to the gait cycle,
higher peak EMG magnitudes, as well as greater integrated EMG values (Mero &
Komi, 1985).
2.5.2 Footfall Patterns in Running. A fundamental component of
running technique that determines how forces are generated and distributed
throughout the body is the way in which a runner makes contact with the ground.
Although there is no general agreement on how to define footfall patterns, runners
are often classified as rearfoot (i.e., heel) strikers (RFS), midfoot strikers (MFS), or
forefoot strikers (FFS) (Daoud et al., 2012). At typical distance-running speeds,
about 80% of runners exhibit a RFS pattern, while about 12 - 30% of runners have
been reported to prefer to make contact with the midfoot or the forefoot (Daoud
et al., 2012; Larson et al., 2011).
Footfall patterns change as a function of running speed. In general, many
runners will naturally switch from RFS to MFS or FFS when running speed is
increased. In support of this view, Hasegawa et al. (2007) observed the relationship
between foot strike pattern and performance during a half-marathon and found that
the percentage of RFS was higher among slower runners. Conversely, the percentage
of MFS increased among faster individuals. Other studies have shown that
individual biomechanics, fatigue, lower-extremity stiffness and footwear affect the
footfall patterns of distance runners (Hamill, Gruber, & Derrick, 2012; Larson et al.,
2011; Lieberman et al., 2010).
Several studies suggest that a MFS or FFS pattern may be associated with a
decreased risk of running injury and improved performance (Daoud et al., 2012;
Lieberman et al., 2010; Romanov & Fletcher, 2007). The health-related effect has
mainly been attributed to the absence of the initial impact peak in the vertical GRF
profile (Lieberman et al., 2010). Although there is conflicting evidence regarding the
effects of impact loads on overuse injury risk, recent research supports the view that
22
a RFS pattern may predispose individuals to a greater injury risk. A retrospective
study that investigated the relationship between footfall pattern and injury rate
found that runners who habitually RFS experienced approximately twice as many
overuse injuries than runners who MFS or FFS (Daoud et al., 2012). Although a
direct causal relationship cannot be inferred from this, the results are in accordance
with other research that has suggested a strong link between impact loading
characteristics and stress injury rates (Mizrahi, Verbitsky, & Isakov, 2000; Radin
et al., 1973; Verbitsky et al., 1998).
Some researchers have proposed a causal relationship between footwear and
overuse running injuries. For example, Nigg (1986) as well as Lieberman et al.
(2010) state that excessive cushioning in running shoes may encourage a RFS
pattern because they have been designed to dampen the impact in RFS and make it
comfortable for runners to land on their heels. Although a runner may perceive less
shock at ground contact, the magnitude of the vertical impact force in habitual RFS
was reported to be approximately three times higher than for habitual FFS
(Lieberman et al., 2010). Furthermore, running shoes with arch supports and high
midsole stiffness have been associated with kinematic alterations (Hamill, Russell,
Gruber, & Miller, 2011; Hardin & van den Bogert, 2004), weakness of the intrinsic
muscles of the foot and decreased proprioceptive feedback (Robbins & Hanna, 1987).
2.5.3 Skill Level. In an effort to identify the main determinants of
running performance, several studies have investigated the biomechanical differences
between runners of different skill level and training status. For example, Cavanagh
et al. (1977) analyzed sagittal plane kinematics of good and elite distance runners.
They concluded that the two groups exhibited very similar running form, but noted
that lesser-skilled runners displayed a greater degree of plantarflexion at the ankle
joint during late stance, which caused an increase in stride length. It was assumed
that this factor contributes to a running style that is less economical and has a

23
negative effect on performance. The observation that fast and slow runners do not
differ considerably from each other with respect to their kinematics is consistent
with other studies. A recent study that assessed changes in sagittal plane
kinematics for fast and slow runners between the early and late stage of a marathon
run demonstrated that all runners significantly changed their running form over the
course of the run and that only small group-differences existed in the peak knee
flexion angle during stance (Chan-Roper, Hunter, Myrer, Eggett, & Seeley, 2012).
Siler and Martin (1991) also analyzed kinematic alterations between slow and fast
runners during a fatiguing 10 km treadmill run. Although significant differences in
stride length and dynamic range of motion at the hip and knee joint were found
between groups, the authors noted that performance level did not affect the relative
timing of kinematic alterations.
Different theories have been put forward regarding the mechanisms that
influence running performance. Traditionally, it has been argued that individuals
with longer limbs exhibit greater stride lengths, thus providing greater anterior
displacement of the COM with every step (Jones & Lindstedt, 1993). Moreover,
slender limbs with a higher proportion of fast-twitch muscle fibers are suspected to
increase stride rate by allowing the runner to reposition their limbs more rapidly
(van Ingen Schenau, de Koning, & de Groot, 1994). However, Weyand et al. (2000)
argue that longer stride lengths and faster maximal speeds are primarily achieved
by higher vertical ground reaction forces. They compared fast and slow runners and
observed that top speed was reached whenever the decline in tc prevented a further
increase in effective impulse, thus decreasing the time spent in double float to the
minimum necessary to reposition the limb for the next step. Additionally, this study
did not find significant differences between the minimum swing times of fast and
slow runners. Based on their findings it was concluded that leg swing is primarily
determined by passive elastic recoil, thus making it a relative invariant feature of
24
running mechanics (Weyand et al., 2000). These results are also supported by data
from Cavanagh and Kram (1989), who investigated the effects of added mass and
body dimensions on stride length and found that neither anthropometric variables,
nor the mass of lower extremity segments were primary determinants of stride
length.
K. R. Williams et al. (1987) reported that individual running form, as assessed
by segmental kinematics, accounts for up to 54% of the variability of the energy cost
of running. However, despite these large subject-specific differences, the information
regarding the effect of training status and skill level on running economy remains
inconclusive. Several studies have demonstrated that trained runners exhibit a more
economical running form than untrained individuals (V. Billat, Flechet, Petit,
Muriaux, & Koralsztein, 1999; Petray & Krahenbuhl, 1985; T. Smith, McNaughton,
& Marshall, 1999). These authors suggest that better running economy is linked to
a smaller vertical displacement of the COM during the gait cycle (Svedenhag &
Sjodin, 1984). However, their results are challenged by other studies that found no
differences in the metabolic cost of running between highly-trained, well-trained and
untrained runners (Daniels, Oldridge, Nagle, & White, 1978; Pollock, Jackson, &
Pate, 1980; Slawinski & Billat, 2004).
2.5.4 Treadmill vs. Overground Running. Many studies that
investigated physiological and biomechanical variables during running have collected
data under controlled conditions in the laboratory, with subjects running on a
treadmill. However, a generalization of these findings to all running conditions may
be problematic because the biomechanics of treadmill running have been shown to
differ from those exhibited during overground running (Frishberg, 1983; Nigg et al.,
1995; P. Riley et al., 2008).
For example, large differences in metabolic cost exist between treadmill and
overground conditions. Frishberg (1983) reported that oxygen consumption during a

25
treadmill run was 36% less than that of a comparable overground running trial. The
authors note that although the lack of air resistance in the laboratory setting may
have contributed to the decreased energy requirements, the observed difference was
too large to be caused by this factor. Likewise, Winter (1978) found large
differences in work and energy calculations between running conditions and pointed
out that in contrast to overground running, the average horizontal velocity of the
COM during treadmill running is almost zero.
Frishberg (1983) further noted significant differences in shank and thigh
kinematics between the two running conditions. Nigg et al. (1995) and
van Ingen-Schenau (1980) observed that foot placement was significantly altered in
the treadmill condition, with subjects adapting a flatter foot position during initial
contact. Minor kinematic changes on the treadmill were also observed by other
studies (P. Riley et al., 2008; Schache et al., 2001).
Different factors have been linked to the observed differences between
treadmill and overground running. These include surface characteristics, which are
known to influence the stiffness adjustment of the leg and in turn alter related
biomechanical variables, such as impact acceleration, contact time, and ground
reaction forces (Kerdok, Biewener, McMahon, Weyand, & Herr, 2002) as well as
movement of the treadmill belt, which may reduce metabolic cost by actively
driving the supporting leg backwards during the stance phase of running (Frishberg,
1983). Additionally, a familiarization effect, which has been observed after
prolonged treadmill running, is suspected to cause changes in running biomechanics
(Lavanska, Taylor, & Schache, 2005).
Running on a treadmill also forces individuals to maintain a constant speed,
regardless of whether they become fatigued or not (Verbitsky et al., 1998). This is
in contrast to overground running, where runners are likely to slow down after the
onset of fatigue (Bertram et al., 2013). This constant ’pacing’ likely influences the

26
nature of the biomechanical changes that naturally occur with the onset of fatigue
and may explain the equivocal results reported in the literature.
Despite these results, other authors have reported only small or insignificant
differences between treadmill and overground running. For example, P. Riley et al.
(2008) reported similar kinematic and kinetic trajectories for both running
conditions. Schache et al. (2001) found lumbopelvic kinematics to be similar on the
treadmill when compared to the overground condition, whereas K. R. Williams
(1985) noted a high level of agreement between the two conditions and stated that
significant differences only occurred at speeds above 5 m/s.
2.5.5 The Stretch-Shortening Cycle. Muscle actions are traditionally
described as being either isometric, concentric or eccentric. However, human
movement rarely consists of isolated muscle contractions. The natural pattern of
muscle function in most forms of locomotion is the stretch-shortening cycle (SSC),
which is characterized by the coupling of an eccentric contraction (resulting from
external forces, such as gravity) and a subsequent concentric contraction
(van Ingen Schenau, Bobbert, & de Haan, 1997). Komi and Nicol (2000) further
remarked that the SSC is characterized by preactivation of the muscles before an
eccentric contraction occurs. This has been observed in running, where the triceps
surae is activated before contact with the ground in an effort to better resist the
impact force.
Together, these mechanisms provide a biomechanical advantage as they allow
muscles to produce a greater amount of work, compared to an isolated concentric
contraction (Cavagna, Saibene, & Margaria, 1965). Different underlying mechanisms
have been suggested to contribute to this increase in muscle performance. For
example, Cavagna et al. (1965) argued that this enhancement is primarily caused by
elastic energy which is stored in the series-elastic component (SEC) of the muscle
during lengthening and returned during the subsequent concentric contraction.
27
Since mechanical energy is described as the capacity to perform work, muscular
performance is enhanced (Enoka, 2002). Another theory that has been put forward
is that reflex mechanisms play a role in the potentiation of performance during the
SSC. This assumption is made because the rapid change in muscle length and an
immediate transition into the concentric phase generally favors the contribution of
spindle-mediated reflex responses to muscle force generation (Komi, 2003).
Although there has been some doubt regarding the functional significance of reflex
contributions (van Ingen Schenau et al., 1997), there is sufficient evidence to suggest
that reflexes assist in stiffness regulation of the muscle and thus increases the
amount of elastic energy that can be stored in the series-elastic component (Komi,
2000). Despite these findings, the relative contribution of these mechanisms to force
potentiation during SSC is not clear and may be subject-specific. It is reasonable to
assume that no fixed scheme exists and that the exact role of each mechanism
depends on the type of movement involved (Enoka, 2002).
2.5.6 Stiffness and Spring-Mass Behavior in Human Running.
Many intrinsic and extrinsic factors influence the mechanical behavior of the human
body during running. An exact theoretical model would need to be very complex
and take into consideration the viscoelastic properties of individual anatomical
structures, such as muscles, ligaments and cartilage, as well as physiological factors;
i.e. reflex contributions and muscle activation state (Latash & Zatsiorsky, 1993).
However, several studies have demonstrated that human running can be accurately
modeled by using a simple spring-mass system (Alexander, 1992; Blickhan, 1989;
McMahon & Cheng, 1990). One fundamental component of this model is the
stiffness of the leg spring, which has been shown to significantly affect the
biomechanics of running (Dutto & Smith, 2002; Farley & González, 1996).
In the mechanical sense, the concept of stiffness is related to the property of a
deformable body to store and return a certain amount of elastic energy. It is

28
described by Hooke’s law, which states that the force (F ) required to deform an
elastic body by some distance (x) is related to that distance and a constant factor k,
its stiffness:
F = kx (1)
According to Hooke’s law the spring constant k describes the stiffness of an ideal
mass-spring system, i.e. the spring must be massless and has a stiffness that is
independent of displacement or velocity. Furthermore, the mass of the system is
assumed to be concentrated at a point located at the end of the spring (Butler,
Crowell, & Davis, 2003).
Many different methods exist by which lower extremity stiffness can be
calculated. Depending on the context, researchers may choose to calculate vertical
stiffness, leg stiffness or torsional/ joint stiffness. Although all of these methods are
based on the same principles, they might yield different results depending on the
variables used to calculate stiffness. This needs to be taken into account when
comparing the results of different studies (Butler et al., 2003).
Stiffness is inherently linked to the forces acting on the system. With respect
to biomechanics, a certain level of musculoskeletal stiffness is needed to store and
return elastic energy during activities involving the stretch-shortening cycle. When
higher forces are exerted onto the system, for example when exercise intensity
increases, the physiological response is an increase in stiffness (Farley, Blickhan,
Saito, & Taylor, 1991; Granata, Padua, & Wilson, 2002). This is confirmed by
studies that have analyzed leg spring stiffness at different running speeds.
Arampatzis, Brüggemann, and Metzler (1999) as well as Kuitunen, Komi, and
Kyröläinen (2002) both reported that stiffness increases at higher running speeds.
Simulated models further corroborate this assumption (Seyfarth, Geyer, Günther, &
Blickhan, 2002).
Stiffness in running also appears to be related to basic stride parameters. For

29
example, Farley and González (1996) found a positive linear relationship between
stride rate and vertical stiffness. Other studies have repeatedly confirmed this
relationship (Dutto & Smith, 2002; Granata et al., 2002). Furthermore, McMahon
and Cheng (1990) observed that a "groucho running" style, which is characterized by
increased knee flexion and a greater stride length (and consequently lower stride
rate), was associated with decreased vertical stiffness. Likewise, a simulation study
conducted by Derrick, Caldwell, and Hamill (2000) predicted decreases in leg
stiffness with increased stride length.
Running economy is also at least partially influenced by stiffness of the
musculoskeletal system. In general, a greater amount of vertical stiffness and leg
stiffness has been associated with a lower metabolic cost of running (Dutto &
Smith, 2002; Kerdok et al., 2002). In contrast, a decrease in stiffness may increase
energy demands by inhibiting the potential to use stored elastic energy in the
musculotendinous unit and during the late stance phase (Komi, 2000; Latash &
Zatsiorsky, 1993). Since stiffness modification seems to be highly dependent on
fatigue status and subject characteristics, large interindividual variability may
distort the relationship between stiffness and running economy (I. Hunter & Smith,
2007).
Butler et al. (2003) proposed the idea of an optimal stiffness range that
contributes to an economical and effective running technique. The authors present
evidence that values below or above this range could generally increase the risk of
overuse injures, since they have been associated with abnormal loading
characteristics and altered impact shock waves. More precisely, there is evidence to
suggest that excessive stiffness causes higher impact loading rates, which are
suspected to play a role in the etiology of bony injuries, such as stress fractures and
knee osteoarthritis (Burr, Martin, Schaffler, & Radin, 1985; Grimston, Engsberg, &
Kloiber, 1991). On the contrary, minimal stiffness may contribute to soft tissue
30
injuries by permitting excessive range of motion at the weight-bearing joints
(Granata et al., 2002).
This differential perspective is further supported by studies that assessed the
occurrence of injuries in runners with high and low arches. These authors found
that high-arched runners, who exhibit higher stiffness and impact loading rates, are
more likely to sustain bony injures, while low-arched runners, who are characterized
by lower stiffness and greater joint excursions, experience more soft tissue injuries
(D. S. Williams, Davis, Scholz, & Hamill, 2004, 2001).
2.5.7 Impact Acceleration. Each foot strike in running produces an
impact load that is transmitted as a shock wave through the body (Derrick, Hamill,
& Caldwell, 1998). Under normal conditions, the musculoskeletal system is able to
effectively attenuate and distribute these shock waves, thus reducing their
amplitude and absorbing impact energy (Nigg et al., 1995). While a certain amount
of loading is required to maintain optimal health of muscle, bone and other
connective tissues (Korver, van de Stadt, Kiljan, van Kampen, & van der Korst,
1992; Stone, 1988), excessive impact loading may lead to tissue damage and play a
role in the etiology of certain running injuries (Milner et al., 2006; Radin et al.,
1973). Consequently, great interest exists in the factors that influence shock
attenuation and the mechanisms by which the musculoskeletal system handles
impact loads (Milner et al., 2006; Radin et al., 1973; A. Voloshin & Wosk, 1982).
Impact characteristics are typically measured by an accelerometer that is
attached to a bony prominence of the lower extremity (Mercer et al., 2003; Mizrahi,
Verbitsky, Isakov, & Daily, 2000; Verbitsky et al., 1998). Common parameters of
interest include impact magnitude as well as the rate of loading. In order to
evaluate shock attenuation, a second accelerometer is required, which is usually
attached to the head of the individual. To quantify attenuation, the obtained
signals must be processed and compared to each other. A large difference in impact
31
magnitude between the signals measured at the leg and head is indicative of
effective shock attenuation (Abt et al., 2011; Derrick et al., 2000; Mercer, Vance,
Hreljac, & Hamill, 2002).
Both impact loading and shock attenuation are complex mechanisms that are
affected by multiple factors. For example, lower extremity geometry during initial
contact can alter the impact magnitude (Challis, 2001). More precisely, the spatial
orientation of the lower extremity segments is known to modify stiffness, which in
turn affects impact loading (Derrick et al., 2000, 1998). This is also supported by
results from McMahon, Valiant, and Frederick (1987), who found that greater knee
flexion angles at impact are associated with reduced lower-extremity stiffness and
increased shock attenuation.
Running speed also significantly affects shock attenuation. Although increased
speed results in higher magnitudes of impact accelerations (Shorten & Winslow,
1992), the ability of the body to attenuate impacts is also enhanced (Mercer et al.,
2002). Furthermore, Derrick et al. (1998) report that shock attenuation is affected
by concurrent changes in stride rate and stride length at constant running speeds.
Based on these results, subsequent studies have independently manipulated stride
rate and stride length and found that only changes in stride length, but not stride
rate, affect shock attenuation (Mercer et al., 2003). A possible explanation for this
effect is that stride length alterations are related to changes in lower extremity
geometry at initial contact (Chan-Roper et al., 2012; Mizrahi, Verbitsky, Isakov, &
Daily, 2000), which may affect stiffness and impact loading (Derrick et al., 1998).
Additionally, external factors, such as shoe design and surface characteristics
are also suspected to influence impact loading characteristics and shock attenuation
(Bigelow, Elvin, Elvin, & Arnoczky, 2013; Butler, Hamill, & Davis, 2007; Cook,
Kester, Brunet, & Haddad, 1985; Feehery, 1986).

32
2.6 Fatigue in Running
Prolonged running depends on the generation of continuous muscular effort.
When metabolic and mechanical processes in active muscles become increasingly
intense, a drop in work capacity can be observed. This marks the onset of muscular
fatigue, which is defined as a reduction in the force generating capacity of the active
muscles that occurs after prolonged and vigorous activity (Fitts, 1996).
Fatigue is a complex phenomenon. It involves multiple underlying processes
that contribute to the observed decrease in muscular performance. The two major
categories that are used to classify these processes are central and peripheral fatigue
(Nicol & Komi, 2011). Central fatigue refers to a decreased neural drive from the
central nervous system (CNS), i.e. a reduction in efferent commands to the
contracting muscle (Bigland-Ritchie, Johansson, Lippold, Smith, & Woods, 1983).
This mechanism has recently been linked to the inhibitory effects of serotonin,
which binds to extrasynaptic receptors on α-motorneurons (Cotel, Exley, Cragg, &
Perrier, 2013). In contrast, the term peripheral fatigue is commonly used to describe
any impairment that occurs distal to the neuromuscular junction (Komi & Nicol,
2000). Contributing factors include the depletion of energy substrates (Kirkendall,
1990), accumulation of potassium and hydrogen ions in the extracellular space
(DeLuca, 1997), and altered peripheral feedback (Garland & Kauffman, 1995). In
particular, prolonged muscular contraction may lead to the accumulation of
metabolites, specifically hydrogen ions, in the skeletal muscle tissue, which decreases
the susceptibility of contractile proteins to calcium, thereby impairing the
conduction of the action potential along the sarcolemma (DeLuca, 1997).
A variety of methods have been used to analyze fatigue. While some
researchers track cardiovascular parameters during prolonged running (Mizrahi,
Verbitsky, Isakov, & Daily, 2000), it is common to assess the maximal voluntary
contraction (MVC) of a certain muscle before and after a bout of exercise
33
(Kuitunen, Avela, Kyröläinen, Nicol, & Komi, 2002; Nicol, Komi, & Marconnet,
1991c). Other methods involve the analysis of an EMG signal, such as tracking the
mean or median frequency, the amplitude of a triggered M-wave or observing shifts
in the power spectrum of the recording (DeLuca, 1997). The variety of assessment
techniques used in the literature complicates the generalization of findings.
2.6.1 Effects of Fatigue on Kinematics. Many biomechanical
parameters in running are interrelated and known to affect each other. Since fatigue
impairs neuromuscular function, it becomes evident that exhaustive exercise can
fundamentally change the kinematics of running. Under normal conditions, runners
choose a preferred combination of stride rate and stride length for a given speed at
which impact loads are effectively attenuated (Mercer et al., 2002) and running
economy is optimized (Cavanagh & Williams, 1982). In contrast, fatigued runners
naturally decrease their running speed, which in turn has an effect on both stride
length and stride rate (Bertram et al., 2013).
Despite some common trends, the observed changes in running kinematics are
highly individual and appear to be influenced by subject characteristics and study
design (Dutto & Smith, 2002; Nicol, Komi, & Marconnet, 1991a). Several studies
have reported that prolonged running is associated with a decrease in stride length
and a simultaneous increase in stride rate (Hausswirth et al., 1996; Kyröläinen et al.,
2000). Furthermore, Place et al. (2004) noted a linear decrease in stride length
along with a proportional decrease in stride duration over a five-hour treadmill run.
In contrast, a recent study that monitored running kinematics at different
points of a marathon found that stride length increased between the early and late
stages of the run, while stride rate decreased (Chan-Roper et al., 2012).
Furthermore, I. Hunter and Smith (2007) reported that trained runners significantly
decreased their stride rate at the end of a 60-minute treadmill run. Since speed was
controlled in this experiment, the results imply that stride length must have

34
increased simultaneously. These results are also corroborated by other experiments
involving treadmill conditions (Candau et al., 1998; Mizrahi, Verbitsky, Isakov, &
Daily, 2000; Verbitsky et al., 1998).
Other studies have reported inconsistent trends in the changes that occur in
basic stride parameters under fatiguing conditions. Dutto and Smith (2002)
observed individual changes in stride rate during a treadmill run to exhaustion, with
some participants exhibiting increases and other decreases in stride rate. Nicol et al.
(1991a) found that although runners consistently exhibited clear signs of fatigue
over the course of a marathon (as indicated by changes in integrated EMG and by a
decrease in running speed) no effects were visible in any kinematic variables. The
authors attributed the absence of an effect to a great variability in individual
running patterns and opposite trends in fatigue-induced kinematic alterations.
Several studies have reported that contact time (tc) increases with progressive
fatigue (Chan-Roper et al., 2012; Derrick, Dereu, & McLean, 2002; Elliott &
Roberts, 1980). There is evidence to suggest that this increase results from the
inability to effectively utilize elastic energy stored in the muscle-tendon apparatus
(Komi, 2000) and from a reduction in lower extremity stiffness (Mercer et al., 2002).
This information has important implications for performance because contact time
has repeatedly been linked to the energy cost of running (Chapman et al., 2012;
Kram & Taylor, 1990; T. J. Roberts, Kram, Weyand, & Taylor, 1998).
Studies that have investigated the effects of fatigue on joint kinematics have
yielded equivocal results. For example, experiments involving exhaustive running
have shown that the onset of fatigue is associated with decreased ankle dorsiflexion
at touchdown and increased rearfoot motion (Clansey et al., 2012; Dutto et al.,
1997; Elliott & Ackland, 1981). Fatigue in running has further been associated with
increased knee flexion immediately before initial contact and a more extended knee
during early stance (Mizrahi, Verbitsky, Isakov, & Daily, 2000). Moreover, the
35
dynamic range of motion at the hip changes during fatigued running (Chan-Roper
et al., 2012), which has been linked to an increased amount of trunk flexion (Elliott
& Roberts, 1980; Hausswirth, Bigard, & Guezennec, 1997). In contrast, Abt et al.
(2011) have investigated the timing of several kinematic parameters, including ankle
pronation and knee flexion, before and after a brief exhaustive run and did not find
any significant effects of fatigue on kinematics.
In summary, no clear relationship has been established yet between the level of
fatigue and running kinematics. Although some general trends can be observed, the
fatigue response in running appears to be highly individual. Runners may be able to
effectively compensate for the impairment of neuromuscular function and maintain
performance, i.e. running speed, despite exhibiting significant changes in running
form.
2.6.2 Effects of Fatigue on Kinetics. The ability to attenuate high
forces is regarded as a major function of the neuromuscular system (Nigg & Liu,
1999). Among the different mechanisms that influence impact loading, active
regulation of muscle tension is most significantly affected by fatigue (Radin, 1986).
Simulated models support the view that the amount of co-contraction around a
joint, which determines joint stiffness, has a large effect on impact loading
characteristics (Bobbert, Yeadon, & Nigg, 1992; Gerritsen, van den Bogert, & Nigg,
1995). Consequently, fatigue may play an important role in the development of
overuse running injuries, via its effect on abnormal joint loading in combination
with altered kinematics (Christina, White, & Gilchrist, 2001).
The literature yields conflicting results regarding the effects of exhaustive
running on ground reaction forces. Although early research suggested that the
magnitude of vertical impact force increases with fatigue (Dickinson, Cook, &
Leinhardt, 1985), several studies have contested this view. For example, studies that
analyzed kinetic adaptations in SSC performance after a marathon observed
36
decreases in average vertical forces during the braking phase (Komi, Hyvärinen,
Gollhofer, & Mero, 1986; Nicol et al., 1991a). Likewise, ultra-distance running has
been shown to induce significant changes in spring-mass behavior and cause
decreases in vertical GRF peaks (Degache et al., 2013; Morin, Tomazin, Edouard, &
Millet, 2011). Clansey et al. (2012) reported that vertical loading rates but not
impact magnitudes were affected by a fatiguing treadmill run.
It has been proposed that impact attenuation may occur purposefully via
modulation of muscle stiffness in an effort to adapt a safer running style and reduce
the potentially harmful effects of high repetitive impact loads (Morin et al., 2011).
Prior to these findings, Christina et al. (2001) found that the fatigue response
during SSC activity was muscle-specific. Their results showed that localized fatigue
of the ankle dorsiflexors caused greater vertical loading rates while leaving GRF
magnitudes unaffected. In contrast, fatigue of the ankle invertors did not have any
effects on GRF characteristics. To further elucidate the effects of lower-extremity
muscle fatigue on vertical GRF, Zadpoor and Nikooyan (2012) conducted a
meta-analysis on the available literature and concluded that both impact and active
vertical GRF peaks, as well as vertical GRF loading rate do not change significantly
in running as a result of fatigue. Some researchers suspect that differences between
studies may exist because the premature onset of cardiovascular fatigue forces the
participants to terminate prolonged exercise before neuromuscular fatigue and
associated mechanical changes become detectable (Abt et al., 2011).
2.6.3 Effects of Fatigue on SSC Performance and Stiffness.
2.6.3.1 SSC Fatigue. As previously described, the SSC represents a
model from which the complex muscle actions during cyclic locomotion, such as
running, can effectively be studied. It is also a powerful method to investigate
fatigue because it integrates mechanical, neural and metabolic processes by
generating a common output (Nicol & Komi, 2011). Fatigue responses during SSC

37
exercise are highly individual and depend on the type of exercise, its intensity and
volume. In general, SSC fatigue causes reversible damage of muscle tissue and
considerably affects stiffness regulation, reflex activity, as well as muscle mechanics
(Komi, 2000).
Research involving long-duration SSC fatiguing exercise, such as continuous
running, has shown that altered kinematics may reflect purposeful adjustments to
fatigue rather than being indicative of impaired muscle function (Kyröläinen et al.,
2000; Nicol et al., 1991a). Therefore, it has been suggested that higher-intensity
loading, e.g. drop jumps, repeated sprints etc., should be combined with
long-lasting SSC exercises to reveal true deterioration of neuromuscular function
(Komi & Nicol, 2000).
Different methods and protocols have been used to study the fatigue-induced
changes of exhaustive SSC exercise. While some studies observed the fatigue
response during the course of exercise (Bertram et al., 2013; Chan-Roper et al.,
2012), others performed specific performance tests before and after exercise
(Christina et al., 2001; Morin et al., 2011). Often, researchers compare measures of
neuromuscular performance as well as kinematic, kinetic and EMG variables, in
order to isolate the different aspects of SSC-fatigue (Nicol et al., 1991b, 1991c). A
common method used to quantify fatigue is to stop the ongoing SSC activity at
certain points and perform intermittent tests. The obtained values are then
compared against baseline in order to assess the progression of fatigue. For example,
Nicol et al. (1991b, 1991c) used a marathon protocol and had the participants
perform several maximal and submaximal tests after every 10 km.
Exhaustive SSC exercise has several acute effects on neural activation and
muscle force production. Using a continuous running protocol and intermittent
tests, Place et al. (2004) monitored the MVC capacity of runners during a 5 hour
treadmill run at typical distance running speeds. Their findings suggest that knee

38
extensor force potential was significantly depressed during the late stages of the run.
The authors also concluded that both central activation failure and peripheral
mechanisms contributed to the impairment of neuromuscular function.
Significant deceases in MVC of lower extremity muscles have also been shown
to occur during marathon performance (Nicol et al., 1991b), ultra-distance running
(G. P. Millet et al., 2002; Saugy et al., 2013) and intermittent exercise (Girard,
Lattier, Maffiuletti, Micallef, & Millet, 2008). Based on existing results,
G. Y. Millet and Lepers (2004) compared the drop in force generating capacity in
running with that of a prolonged non-SSC cycling exercise. The results showed that
SSC activity induced a significantly higher amount of fatigue than a cycling
protocol of similar volume and intensity. In addition to voluntary activation levels,
exhaustive SSC fatigue is associated with a significant reduction in stretch-reflex
sensitivity (Avela, Kyröläinen, & Komi, 1999; Horita et al., 1996).
Using a high-intensity rebound protocol, Horita et al. (1996) showed that
prolonged SSC exercise required a significant increase in muscular effort during the
push-off phase. This has been associated with higher metabolic costs and is thought
to lead to failure to generate work over time (Gollhofer, Komi, Miyashita, & Aura,
1987). These results are corroborated by Nicol et al. (1991b, 1991c) who found that
the tolerance of the participants to impact loading decreased progressively over a
marathon run and that greater muscular work was required to compensate for this
effect in the subsequent push-off phase.
Repetitive SSC action has been shown to affect lower-extremity muscles in
different ways. For example, Regueme, Nicol, Barthèlemy, and Grélot (2005)
reported that a reduction in EMG activity during preactivation occurs in the early
stages of prolonged SSC activity. However, the authors also note that this effect
could be linked to an increased efficiency of the rebound technique and consequently
may not be fatigue-related. It has also been reported that EMG activity of the
39
ankle plantarflexors decreases significantly during the subsequent braking and
push-off phase (Horita, 2000). In contrast, knee extensor EMG activity increases
steadily over the course of exercise, which may indicate a greater reliance on active
force generation by this muscle group and the simultaneous decrease in SSC efficacy
(Nicol & Komi, 2011).
In summary, all of these results support the view that SSC fatigue involves the
intricate coupling between muscle damage, reduced reflex sensitivity and impaired
stiffness regulation. More precisely, deteriorated muscle function causes a reduced
tolerance to impact loading, which in turn negatively affects the utilization of elastic
energy. This loss of elastic potential requires the muscles to generate more work
during the push-off phase and eventually causes a reduction in performance.
2.6.3.2 Stiffness. Stiffness is a critical determinant of the spring-mass
behavior in SSC activities (see Section 2.5.6). In general, the stiffness of a joint is
affected by the passive mechanical properties of the surrounding tissues as well as
by the activation state of the muscles acting across a joint. It is well established
that muscle and connective tissues have viscous properties and change their
stress-strain characteristics in response to repeated mechanical stimuli. This
history-dependent behavior of tissue is known as thixotropy (Proske, Morgan, &
Gregory, 1993). In muscle tissue, however, thixotropy is not only dependent on the
passive molecular arrangement, but also on the amount of crossbridges that form
between the contractile proteins, i.e. its activation state. The fact that crossbridges
are the mechanical result of repetitive neural stimuli supports the notion that
stiffness is affected by voluntary and reflex-mediated muscular contractions (Avela &
Komi, 1998a).
It has repeatedly been reported that with progression of fatigue there is a
concomitant decrease in stiffness. For example, Rabita, Couturier, Dorel,
Hausswirth, and Le Meur (2013) demonstrated that an exhaustive run at VO2max
40
caused a significant reduction in leg-spring stiffness. Likewise, fatigue has also been
reported to reduce vertical stiffness (Girard, Micallef, & Millet, 2011; Hobara et al.,
2010), tendon stiffness (Kubo, Kanehisa, Kawakami, & Fukunaga, 2001) as well as
stiffness of the lower extremity joints (Horita et al., 1996; Kuitunen, Avela, et al.,
2002). In contrast, several other studies have reported that stiffness remained
unaltered despite the progression of fatigue (I. Hunter & Smith, 2007; Meur et al.,
2013).
Fatigue-induced stiffness alterations have been linked to kinematic and kinetic
changes in running. For example, Dutto and Smith (2002) analyzed changes in
spring-mass characteristics during a treadmill run to exhaustion and found that for
most runners both vertical and leg stiffness decreased significantly over the course of
the run. The authors also found that this decrease was correlated with the observed
changes in stride rate and thus suspected a causal relationship. This theory is
supported by data from Girard et al. (2011), who also found that changes in stride
rate were strongly correlated with a reduction in vertical stiffness. Hobara et al.
(2010) reported that vertical stiffness was significantly correlated with running
velocity and stride rate during a maximal 400 m sprint. In contrast, no relationship
existed between vertical stiffness and stride length. The authors further note that
leg stiffness was uncorrelated with any of the analyzed kinematic parameters.
The underlying mechanisms that are responsible for the stiffness alterations
remain a subject for discussion. While some authors have argued that the loss in
stiffness is due to a change in the viscoelastic properties of the musculotendinous
unit (Kubo et al., 2001), other researchers assume that impairment of the
contractile mechanism is primarily responsible for the decreased stiffness (Avela &
Komi, 1998a). The equivocal results in the literature may be caused by the various
equipment (force plates vs. video) and fatigue protocols (overground vs. treadmill;
duration and intensity) employed by researchers. Moreover, some studies have used

41
cardiovascular parameters to track fatigue (Dutto & Smith, 2002; Rabita et al.,
2013), while others used measures related to local muscular performance (Kuitunen,
Avela, et al., 2002; Nicol et al., 1991b). It is apparent that these methods assess
different levels of fatigue and thus may yield different results regarding stiffness
alterations. Additionally, stiffness alterations have been shown to be highly subject
specific (Dutto & Smith, 2002; I. Hunter & Smith, 2007).
2.6.4 Effects on Impact Acceleration and Shock Attenuation.
Dynamic loading on the musculoskeletal system has repeatedly been assessed using
body-mounted accelerometers. Since impact loads are transmitted through the body
as a shock wave, the detected signal can provide information about how fatigue
affects the impact acceleration and shock attenuation during running.
Several authors have found magnitudes of impact acceleration to increase with
fatigue (Clansey et al., 2012; Mizrahi, Verbitsky, Isakov, & Daily, 2000; Verbitsky
et al., 1998; A. S. Voloshin, Mizrahi, Verbitsky, & Isakov, 1998). For example,
Mizrahi, Verbitsky, and Isakov (2000) documented that a fatiguing treadmill run
caused significant increases in impact accelerations and concurrently changed
running kinematics (decreased stride rate, decreased knee flexion). The authors
hypothesized that these kinematic alterations in combination with altered impact
loading might be associated with a higher risk of stress fractures. Derrick et al.
(2000) also observed significant changes in running kinematics and increased impact
accelerations with fatigue. However, it was argued that the altered impact loading
characteristics do not pose a higher injury risk because the observed alterations in
kinematics caused a decrease in effective mass, which may have decreased impact
forces. This idea is supported by studies that have directly measured GRF
parameters during prolonged running (Degache et al., 2013; Morin et al., 2011; Nigg
et al., 1995).
Other authors report that impact accelerations in running are unaffected by

42
fatigue (Abt et al., 2011; Mercer et al., 2003). However, Mercer et al. (2003) found
that although impact peaks at the tibia did not increase with fatigue, less shock was
attenuated. Potential reasons for the inconclusive results might be the use of various
test protocols as well as different standards by which fatigue is assessed. Some
authors have used prolonged running conditions, while others employed brief
repetitive runs. Fatigue in running has been assessed by measuring cardiovascular
parameters like VO2max, by lactate, electromyography or by changes in
biomechanical characteristics.
2.6.5 Effects of Fatigue on Movement Variability. Only a few studies
have investigated the effects of prolonged exercise and fatigue on the variability and
regularity of movement patterns in running. Using a trunk mounted accelerometer,
Le Bris et al. (2006) looked at stride regularity and stride asymmetry by analyzing
the similarity of anteroposterior and mediolateral accelerations, during an
exhaustive run at VO2max. It was reported that the regularity of anteroposterior
accelerations decreased significantly between successive strides, thus indicating a
decline in the periodicity of the running cycle. Some authors have argued that this
decline in regularity is associated with a greater incidence of jerky movements and
unsmooth stride patterns (Hreljac, 2000; Menz, Lord, & Fitzpatrick, 2003). This is
further supported by Gazeau, Koralsztein, and Billat (1997), who observed that
runners who maintained stable movement patterns during a maximal aerobic speed
test were able to significantly delay the point of fatigue. Verkerke, Ament,
Wierenga, and Rakhorst (1998) examined step times, foot position and step width
during a fatiguing treadmill run and reported a significant increase in the variance
of these parameters that occurred with the onset of fatigue, as identified by blood
lactate concentrations. Despite these insights, little is known about how fatigue
affects long-range correlations and nonlinear measures of variability during walking
and running. Studies involving repetitive upper body reaching movements and

43
standing postural control observed that fatigue caused a reduction in the strength of
long-range correlations (Corbeil, Blouin, Bégin, Nougier, & Teasdale, 2003; Gates &
Dingwell, 2008). Gates and Dingwell (2008) further noted that increased peak forces
and greater movement errors occurred during the later stages of the protocol.
Furthermore, Meardon et al. (2011) reported that long-range correlations decrease
in a linear fashion during prolonged overground running. The authors analyzed the
temporal structure of the stride interval with a tibia-mounted accelerometer and
demonstrated that the runners’ stride pattern became less predictable with fatigue.
2.7 Gait Variability
Human walking and running are complex motor tasks that are realized by a
coordinated effort of the neuromuscular system (Jordan et al., 2007a). More
specifically, locomotion arises from the coupling of different neural control
mechanisms that act together to produce a rhythmic-patterned output (Jordan,
Challis, & Newell, 2006). The mechanical consequence of this output is an
adaptable, yet stable, gait pattern. However, despite its remarkable regularity,
human locomotion exhibits a natural degree of fluctuation, i.e. basic stride
parameters change from one stride to the next, even when external conditions are
controlled (Hausdorff, 2005). Although a small amount of variability is inherent in
all physiological variables and can be considered a sign of good adaptability
(Hausdorff, 2005), increased variability has been linked to impaired motor control
and certain movement pathologies (Hausdorff, 2007).
2.7.1 Linear Gait Dynamics. The magnitude of stride-to-stride
fluctuations, i.e. gait variability, is commonly assessed in biomechanics and motor
control research because it can help to understand how movement is regulated
under normal conditions. Moreover, variability can provide information about how
age- and health-related factors affect the consistency of human locomotor patterns

44
(Hausdorff, 2005).
Another potential benefit of measuring gait variability is its sensitivity to
changes that cannot be detected and represented by traditional parameters, such as
average velocity or joint angles. This indicates that human gait can be altered by
internal or external factors, even if no change occurs in major biomechanical
variables (Hausdorff, 2007). Variability has been assessed in different
spatiotemporal parameters of gait, such as stride time (Hausdorff et al., 2001),
stride length (Blin, Ferrandez, & Serratrice, 1990), as well as double-support time
and step width (Gabell & Nayak, 1984; Owings & Grabiner, 2004). The parameter
that is most commonly used to assess gait variability is stride time. One the one
hand, this is because it is a meaningful parameter that integrates all phases and
events of the gait cycle and can be regarded as the common output variable of the
locomotor system (Beauchet, Allali, Berrut, & Dubost, 2007). On the other hand, it
can easily and accurately be assessed with a variety of tools.
Depending on the parameter in question, gait variability can provide
information about the rhythmicity of motion (e.g. stride time variability), postural
control (e.g. step width variability) (Gabell & Nayak, 1984), or asymmetry (e.g.
differences in variability between the lower extremities) (Lord et al., 2011).
Statistically, the variability of a certain parameter is assessed by calculating the
standard deviation or the coefficient of variation from a previously recorded time
series. For a sample of the parameter x with N data points, i.e. {x1, ..., xN}, the
SD provides an estimate of the absolute amount of variability present in the data
set. It is measured in the same units as the original data and represents the square
root of the variance.
s =
√√√√ 1N − 1
N∑i=1
(xi − x)2 (2)
The CV is defined as the ratio of the SD to the mean. In contrast to the standard
deviation, the CV yields a dimensionless number, expressed as a percentage that is

45
independent of the unit of the collected data.
CV = s
x× 100 (3)
The CV is often preferred to express variability since it allows for the comparison
between data sets with different units or largely varying means. It also has the
advantage of being insensitive to the magnitude of variability because it expresses
the magnitude of a data set in relation to its level of variability (Moe-Nilssen, 2010).
On the other hand, the CV is sensitive to changes when the mean is small and
might therefore not be suited for all gait variables.
As stated before, a normal gait pattern is usually associated with small
amounts of variability. CV values of approximately 4% have been reported for the
stride interval in running of healthy adults (Jordan et al., 2006). With respect to
linear measures of variability it appears that increased stride-to-stride fluctuations,
i.e. greater variability, are indicative of an aging or unhealthy motor control system
(Auvinet, Chaleil, & Barrey, 1999; Moe-Nilssen & Helbostad, 2004). Possibly, this is
the case because lower variability is thought to reflect a high degree of rhythmicity
and less adaptability (Hausdorff, 2007).
2.7.2 Nonlinear Gait Dynamics. Both the standard deviation and
coefficient of variation have limited explanatory value because they only refer to the
amount of variability and do not provide information about the structure of
variability in a given time series (Jordan et al., 2006). In contrast, some nonlinear
measures are able to quantify changes in these fluctuations over time, regardless of
their magnitude (Jordan et al., 2009).
Studies conducted on the dynamics of gait have shown that healthy
individuals usually exhibit a very stable pattern of spatiotemporal characteristics
(Terrier, 2003). In particular, a predictable structure of stride-to-stride fluctuations

46
is thought to be representative of a high degree of motor control (Meardon et al.,
2011). In contrast, changes in neurological function associated with aging and
certain disease states negatively affect stability (Hausdorff, 2007).
To determine the temporal characteristics of gait fluctuations, a fractal-like
scaling index (FSI) can be calculated for a data set presented in the time-domain.
The index expresses whether the variability demonstrates the characteristics of
random, white noise or if it contains a pattern that is indicative of a certain degree
of self-similarity on a large time-scale. In general, persistent patterns show that
long-range correlations (LRCs) are present in time-series. They signify the
dependence of any particular data point on other points at a considerable temporal
distance (Hausdorff, 2007). This dependence has been shown to decay over time in
a fractal-like fashion.
LRCs are commonly reported for the stride time interval during walking and
running (Hausdorff, Peng, Ladin, Wei, & Goldberger, 1995; Jordan et al., 2006;
Kobsar et al., 2014). However, LRCs have also been calculated for stride length,
step length and step interval, vertical impulse, duration of contact and other kinetic
parameters (Jordan, Challis, & Newell, 2007b). Complex mathematical models are
required to assess the stride-to-stride fluctuations of cyclic motion. One common
method, called detrended fluctuation analysis, represents the long-range correlations
observed in time-series signals by a scaling exponent called α. A signal where all
data points are completely random and uncorrelated results in an α value of 0.5.
Persistent long-range correlations will yield an α between 0.5 and 1.0 (Hausdorff,
2007). Healthy young individuals exhibit α values anywhere from 0.6 - 1.0 in the
time series of different gait variables (Hausdorff et al., 1997, 1995; Jordan et al.,
2007b; Terrier, Turner, & Schutz, 2005).
The validity of DFA has been questioned by some researchers. For example,
Maraun, Rust, and Timmer (2004) criticize that fractal characteristics are
47
impossible to determine for finite sets of data, such as gait trials. Furthermore,
Damouras, Chang, Sejdić, and Chau (2010) point out that no standards exist
regarding the range of window sizes and number of strides recorded for DFA. The
fact that these factors differ significantly between studies and are known to affect
the value of α, complicates inter-study comparisons. In contrast, several studies
have confirmed the validity of DFA with other nonlinear models. These validation
techniques include the Hurst exponent, power spectrum analysis as well as
autoregressive methods (Crevecoeur, Bollens, Detrembleur, & Lejeune, 2010;
Delignieres & Torre, 2009; Gao, Hu, Tung, Cao, & Sarshar, 2006). To avoid
misinterpretation, some authors have recommended that DFA should be used
exclusively to assess LRCs in the finite time series, such as gait trials (Bollens,
Crevecoeur, Nguyen, Detrembleur, & Lejeune, 2010).
Different guidelines and recommendations for DFA can be found in the
literature. For example, Hausdorff et al. (1997) suggest that gait parameters should
be recorded for a minimum of 5 minutes when LRCs are to be calculated.
Pierrynowski et al. (2005) investigated the reliability of the DFA method and found
that a longer total recording time yielded higher intra-class coefficients and
suggested that the collected data should consist of four 3 minute, three 6 minute or
two 8 minute walking trials. Recently, Damouras et al. (2010) formulated more
specific guidelines and proposed that for a data set of length N, a box size range of
[16, N/9] should be chosen. They also recommend that a minimum of 600 strides
should be recorded to estimate α with an accuracy of ± 0.1.
2.7.3 Nonlinear Dynamics in Walking and Running. The majority
of research investigating LRCs in human gait involves speed-controlled walking
trials. In one of the earliest studies, Hausdorff et al. (1995) found that LRCs were
present in the stride interval of young healthy men. Subsequent studies that
employed walking protocols of different lengths and speeds confirmed these
48
observations. Their results show that LRCs are present in gait trials consisting of
up to several thousand steps (Hausdorff et al., 2001, 1996).
LRCs further appear to be influenced by locomotor speed. Hausdorff et al.
(1996) calculated α for slow, preferred and fast walking speeds. They found
preferred walking speed was associated with the lowest values of α. These results
are in line with Jordan and Newell (2008) who analyzed the strength of LRCs over a
range of speeds (80 - 120% of preferred running speed) during a treadmill run. The
authors found consistent LRCs and observed that they followed a U-shaped pattern,
with the lowest values occurring at preferred running speed (PRS).
No satisfactory explanation exists for why preferred locomotor speeds are
associated with the lowest values of α and different arguments have been put
forward regarding the meaning and interpretation of LRCs. Contrary to these
results, other studies have shown that low values of α are associated with a higher
risk of falls (Giladi, Herman, Reider-Groswasser, Gurevich, & Hausdorff, 2005),
aging of the neuromuscular system, as well as certain neurological disorders
(Hausdorff et al., 1997). In other words, LRCs of physiological signals may be
indicative of a healthy and adaptable locomotor system but may also be linked to
certain pathological changes and impaired motor control (Hausdorff, 2007). These
examples demonstrate the complex relationship between gait variables and
nonlinear measures of variability. It further implies that a more differentiated
perspective on LRCs and other measures of gait variability might be necessary. In
this regard, Brach, Berlin, Vanswearingen, Newman, and Studenski (2005) have
proposed the idea of an optimal window for LRCs and state that values for α should
range between the extremes of white and brown noise. However, other nonlinear
measures of gait variability seem to behave differently. For example, Beauchet et al.
(2007) state that higher Lyapunov exponents may reflect increased adaptability.
Only a small number of studies have investigated nonlinear aspects of

49
variability in running gait. For example, Hamill et al. (1999) used a dynamical
systems approach to investigate lower extremity running injuries and found that
runners with patellofemoral pain showed less variability in the continuous relative
phase (CRP) patterns of lower extremity couplings than healthy individuals. Jordan
et al. (2006) were the first to investigate LRCs in human running. The authors
reported that LRCs were speed-dependent and followed a U-shaped distribution,
with the lowest correlations occurring at PRS. The authors hypothesized that PRS
is associated with a higher number of dynamical degrees of freedom (i.e. the number
of combinations of stride length and stride rate resulting in the same speed) and
thus represents a lower biological stress than faster or slower running speeds.
Follow-up studies detected the presence of LRCs in other biomechanical variables of
running gait and confirmed the U-shaped pattern of LRCs across a range of running
speeds (Jordan et al., 2007a, 2007b). Another study recently investigated the effects
of skill level on nonlinear fluctuations via DFA in the gait cycle of running.
Although the authors did not confirm the U-shaped relationship between running
speed and the strength of LRCs, they showed that trained runners exhibited
significantly lower values of α (Nakayama, Kudo, & Ohtsuki, 2010). A recent study
found that various measures of gait dynamics differed significantly between
treadmill and overground running (Lindsay, Noakes, & McGregor, 2014). In
particular, treadmill running was characterized by a more ordered control, as
indicated by a higher scaling index α, compared to overground runs performed at
identical speeds. The authors conclude that runners on a treadmill were constrained
to a greater degree and required increased voluntary control to complete the
locomotor task. To date, only one study has investigated the effects of fatigue on
the fractal-like nature of running gait. Meardon et al. (2011) analyzed stride-time
variability in healthy and previously injured individuals. While no significant group
or fatigue effects were found for linear measures of variability, DFA, as quantified by

50
α, significantly decreased over time, thus rendering stride time less predictable.
Furthermore, injured runners exhibited lower values of α than their healthy
counterparts. The authors concluded that fatigue was associated with a higher
degree of movement errors and altered complexity.
2.8 Inertial Measurement Units
Various tools and techniques exist by which the biomechanics of locomotion
can be assessed. One alternative to traditional methods, such as force plates and
camera-based motion capture systems, involves the use of body-mounted inertial
measurement units (IMUs), which typically contain accelerometers and gyroscopes.
Accelerometers are inertial sensors that provide information about linear
acceleration. The most common sensor types include strain gauge, capacitative,
piezoelectric, and piezoresistive accelerometers (Kavanagh & Menz, 2008).
Conceptually, accelerometers act as spring-mass systems and derive acceleration
based on the relationship between Newton’s 2nd law of motion and Hooke’s law
(Godfrey, Conway, Meagher, & OLaighin, 2008):
F = ma = kx (4)
When a tensile or compressive force is applied to a linear spring-mass system, a
reactive force F that is proportional to the displacement of the mass m is generated
by the spring. Provided that spring stiffness k and mass m are invariant, the
resultant acceleration can be calculated by solving Equation 4 for a:
a = kx
m(5)
Despite some variations in technical details, all accelerometers operate by
generating an electrical signal that is proportional to the magnitude of the

51
experienced acceleration (Kavanagh & Menz, 2008). Different methods exist by
which accelerometers can be calibrated, the most common of which includes the use
of gravity. When being aligned in the vertical direction, gravity acts with an
acceleration of 9.81 m/s2 along an axis. Consequently, the magnitude of the
electrical output measured in this situation must be equal to 1 g (Kavanagh &
Menz, 2008).
Gyroscopes are inertial sensors that measure angular velocity about an axis of
rotation. They are able to provide information regarding the pitch, yaw and roll
characteristics of the sensor. The relative orientation of the sensor can be estimated
by integrating the obtained angular velocity signals. Local coordinates can
subsequently be transformed into a global frame of reference with the help of
rotational matrices or quaternions (Fischer, Sukumar, & Hazas, 2013).
While early IMUs only quantified linear acceleration along a single axis, newer
models usually contain three accelerometers and three gyroscopes that are aligned
orthogonally along three axes. When attached to an object, modern IMUs are
capable of fully quantifying its movement in three-dimensional space (i.e. six
degrees of freedom). In biomechanics research, body-fixed IMUs have several
advantages over traditional motion capture methods. In addition to the low cost,
they can be used to collect data outside of a laboratory setting. This is particularly
important in gait research as the biomechanics of walking and running may be
affected by environmental constraints. The small size and wireless capabilities of
modern IMUs allows individuals to move freely and without any restrictions, which
may improve the quality of the obtained data. Recent advances in microelectronics
and biomedical signal processing have enabled researchers to record data for several
hours or even days (Kavanagh & Menz, 2008).
2.8.1 Inertial Measurement Units in Gait Analysis. IMUs have been
used to analyze the temporal structure of cyclic motion in swimming (Barber &

52
Barden, 2014), provide feedback in weightlifting (Sato, Smith, & Sands, 2009), track
physical activity behavior (Troiano et al., 2008) and predict the risk of falls in an
elderly population (Menz, Lord, & Fitzpatrick, 2005). Additionally, IMUs are
frequently used for gait analysis. Depending on the attachment site and placement
of the sensor, IMUs are able to provide information about specific gait events and
spatiotemporal stride parameters (Kobsar et al., 2014; E. Martin, 2011;
Moe-Nilssen, 1998a). While many studies employ a trunk-mounted setup (Kobsar
et al., 2014; Moe-Nilssen, 1998a; Zijlstra, 2003), IMUs have also been attached to
the lower extremity (Lafortune, Henning, & Valiant, 1995; Sabatini, Martelloni,
Scapellato, & Cavallo, 2005) or the head (Kavanagh, Morrison, James, & Barrett,
2006; Menz et al., 2003). When mounted to the lower trunk (approximately at the
level of L3/L4) an IMU quantifies the motion of the total body COM along the
anteroposterior, vertical and mediolateral axes and therefore represents the
integrated motor output during locomotion (Zijlstra, 2003). In contrast, leg- or
foot-mounted IMUs can be used to measure impact loading characteristics as well as
stride parameters, such as contact time or stride length (J. B. Lee, James, Ohgi, &
Yamanaka, 2012; Mizrahi, Verbitsky, Isakov, & Daily, 2000; Strohrmann, Harms,
Kappeler-Setz, & Tröster, 2012).
In order to make meaningful inferences based on IMU signals, a high degree of
accuracy compared to accepted methods (i.e. videography, force plates etc.) must
be present with respect to the measured variables. However, valid kinematic
parameters, in particular velocity and position estimates, are hard to obtain because
high-frequency noise in physiological time-series amplifies when inertial signals are
integrated or differentiated (Winter, 2009). Although filtering is able to attenuate
noise and mitigate this amplification effect, it also reduces the power of the recorded
signals.
Despite these limitations, trunk acceleration and GRF signals show a similar

53
structure for walking and running. This is expected, considering the relationship
between F and a as expressed by Newton’s 2nd law of motion. In particular,
vertical accelerations exhibit a strong biphasic pattern during running, with the first
sharp peak corresponding to the maximum impact load experienced during early
stance and a second peak representing the thrust maximum achieved during active
push-off. A local minimum occurring between these two peaks indicates a short
period of unloading during midstance (Auvinet et al., 2002). Noticeable agreement
also exists between the anteroposterior acceleration curves and the respective
component of the GRF. In general, anteroposterior accelerations exhibit a bimodal
pattern in running. A period of negative acceleration (directed posteriorly) during
the early stance phase is caused by the braking impulse upon initial contact, while
the subsequent phase of positive acceleration corresponds to the propulsive impulse
(in the anterior direction) during active push-off (Auvinet et al., 2002).
Inertial signals can also be used to obtain information about basic stride
parameters, such as stride rate/ stride time. Many sensor-based methods involve the
identification of invariant periodic features of the acceleration or gyroscope signals.
For example, Mercer et al. (2003) determined the time between successive vertical
impact peaks and subsequently calculated stride rate as the inverse of this time
interval, i.e. stride time. Other authors have counted the number of zero-crossings
in the anteroposterior accelerations to estimate stride time (Neville, Wixted,
Rowlands, & James, 2010). Based on the correct identification of initial contact and
toe off, additional variables such as contact time and swing time can be determined.
Various methods exist by which the exact timing of these incidents are defined. For
example, Strohrmann et al. (2012) used a threshold value of 2 g to identify the
instant at which ground contact occurred. Other studies have defined initial contact
as the point at which large peaks occur either in the vertical or anteroposterior
direction (J. B. Lee, Mellifont, & Burkett, 2010; Purcell, Channells, James, &

54
Barrett, 2005). In addition to estimating different aspects of stride kinematics,
IMUs have been used to classify foot strike patterns (Strohrmann et al., 2012),
measure gait symmetry (Brach et al., 2011) and running speed (Neville et al., 2010).
The measurement of spatiotemporal gait parameters has mostly been
validated for walking. For example, Zijlstra (2003) compared kinematic variables
obtained from a back-mounted triaxial accelerometer with data acquired from a
force-plate mounted treadmill. The results showed that the measured stride times
were almost identical and only varied within a range of 2 to 15 ms. Using vertical
acceleration signals, the authors indirectly estimated step length and walking speed
by combining accelerometric and anthropometric data (leg length). Similarly,
Hartmann, Murer, de Bie, and de Bruin (2009) determined the concurrent validity
of a trunk-mounted accelerometer system with a force-plate walkway system in
elderly adults during level walking and demonstrated excellent levels of agreement
for walking speed, cadence and step duration. Lower intra-class correlation
coefficients (ICC) were reported for parameters of variability (step length, step
duration). Kobsar et al. (2014) reported that a waist-mounted accelerometer is able
to accurately measure stride time, its standard deviation and fractal dynamics
during level overground walking.
It has also been established that IMU-derived estimates of basic
spatiotemporal parameters display a high level of reliability. For example,
Henriksen, Lund, Moe-Nilssen, Bliddal, and Danneskiod-Samsøe (2004) investigated
the test-retest reliability of trunk accelerations as a measure of balance in walking
and standing. The reported ICC value ranged from 0.77 - 0.96, while measurement
errors were 0.007 - 0.01 g for mean accelerations; 0.009 m for step lengths; 0.022 m
for stride lengths and 1.644 steps/min for cadence (Henriksen et al., 2004). These
results are similar to those of Moe-Nilssen (1998b), who reported ICCs ranging from
0.79 - 0.94 for walking on an even and uneven surface. Hartmann, Luzi, Murer,
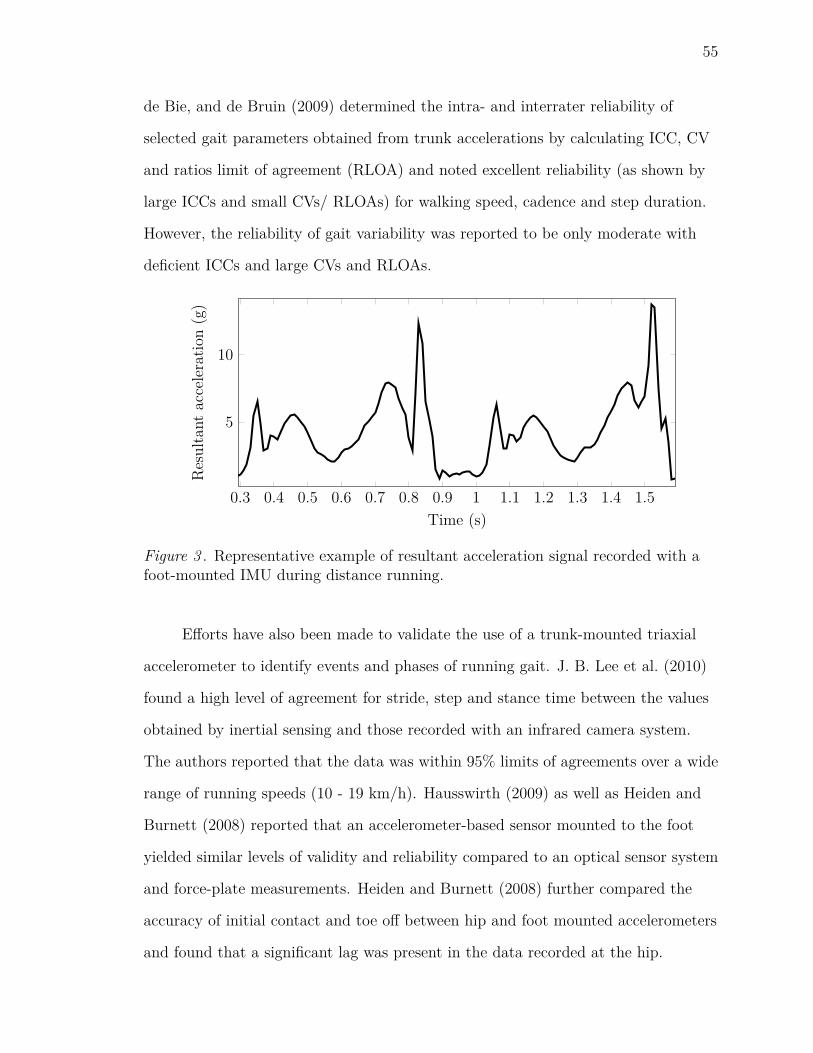
55
de Bie, and de Bruin (2009) determined the intra- and interrater reliability of
selected gait parameters obtained from trunk accelerations by calculating ICC, CV
and ratios limit of agreement (RLOA) and noted excellent reliability (as shown by
large ICCs and small CVs/ RLOAs) for walking speed, cadence and step duration.
However, the reliability of gait variability was reported to be only moderate with
deficient ICCs and large CVs and RLOAs.
0.3 0.4 0.5 0.6 0.7 0.8 0.9 1 1.1 1.2 1.3 1.4 1.5
5
10
Time (s)
Resultant
acceleratio
n(g)
Figure 3 . Representative example of resultant acceleration signal recorded with afoot-mounted IMU during distance running.
Efforts have also been made to validate the use of a trunk-mounted triaxial
accelerometer to identify events and phases of running gait. J. B. Lee et al. (2010)
found a high level of agreement for stride, step and stance time between the values
obtained by inertial sensing and those recorded with an infrared camera system.
The authors reported that the data was within 95% limits of agreements over a wide
range of running speeds (10 - 19 km/h). Hausswirth (2009) as well as Heiden and
Burnett (2008) reported that an accelerometer-based sensor mounted to the foot
yielded similar levels of validity and reliability compared to an optical sensor system
and force-plate measurements. Heiden and Burnett (2008) further compared the
accuracy of initial contact and toe off between hip and foot mounted accelerometers
and found that a significant lag was present in the data recorded at the hip.
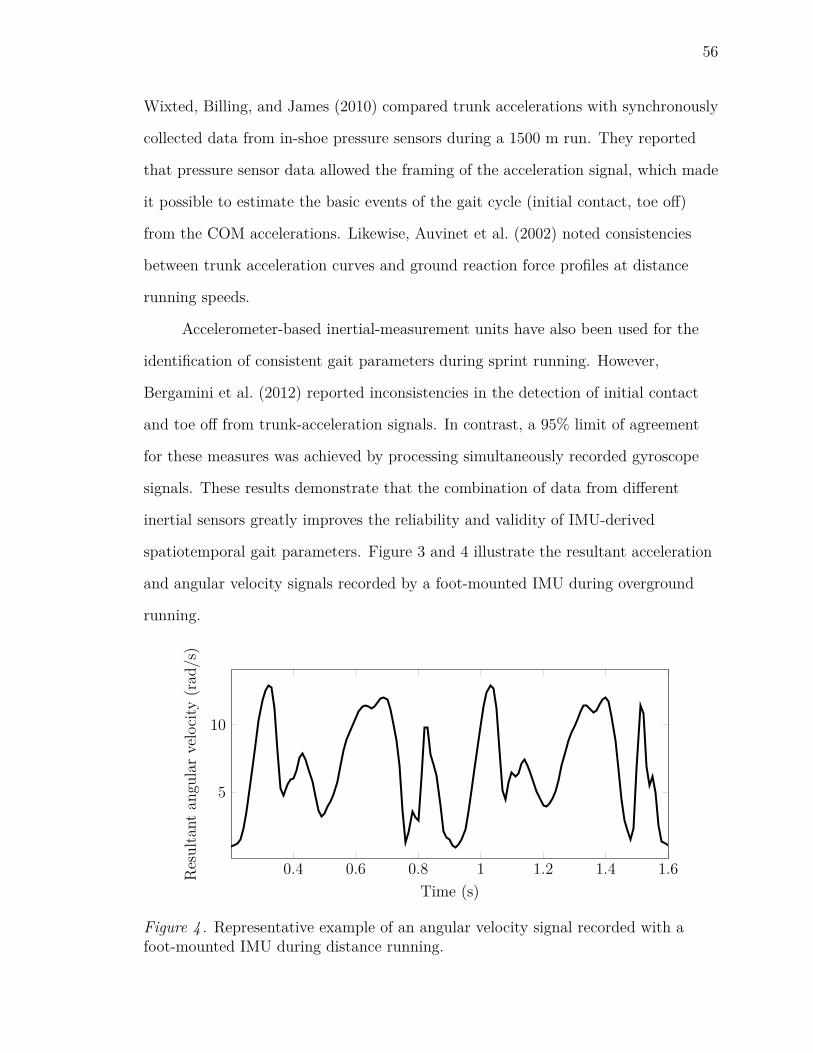
56
Wixted, Billing, and James (2010) compared trunk accelerations with synchronously
collected data from in-shoe pressure sensors during a 1500 m run. They reported
that pressure sensor data allowed the framing of the acceleration signal, which made
it possible to estimate the basic events of the gait cycle (initial contact, toe off)
from the COM accelerations. Likewise, Auvinet et al. (2002) noted consistencies
between trunk acceleration curves and ground reaction force profiles at distance
running speeds.
Accelerometer-based inertial-measurement units have also been used for the
identification of consistent gait parameters during sprint running. However,
Bergamini et al. (2012) reported inconsistencies in the detection of initial contact
and toe off from trunk-acceleration signals. In contrast, a 95% limit of agreement
for these measures was achieved by processing simultaneously recorded gyroscope
signals. These results demonstrate that the combination of data from different
inertial sensors greatly improves the reliability and validity of IMU-derived
spatiotemporal gait parameters. Figure 3 and 4 illustrate the resultant acceleration
and angular velocity signals recorded by a foot-mounted IMU during overground
running.
0.4 0.6 0.8 1 1.2 1.4 1.6
5
10
Time (s)
Resultant
angu
larvelocity
(rad
/s)
Figure 4 . Representative example of an angular velocity signal recorded with afoot-mounted IMU during distance running.
57
Despite the versatility of body-mounted IMUs, the direct estimation of
running velocity and individual stride length vectors poses a challenging problem.
Theoretically, the recorded accelerations can be combined with signals obtained by
magnetometers and gyroscopes to determine the direction and magnitude of
displacement over time. In practice, however, these methods are very sensitive to
drifting of the signal, which leads to the accumulation of significant error over time
(E. Martin, 2011). Some researchers have developed novel IMU-based algorithms to
estimate running speed. For example, Yang, Mohr, and Li (2011) combined
gyroscope and accelerometer data from a shank-mounted IMU. Using a treadmill to
verify their results, the authors reported root-mean-square error of 4.1% for their
estimates. Likewise, Hausswirth (2009) reported excellent levels of validity and a
high level of agreement between the speed calculated by a foot-mounted uniaxial
accelerometer and treadmill running speed. The accuracy of stride length estimates
can also be significantly improved (< 5% error) when double-integration of the
acceleration signal is combined with a zero-velocity reference in the gait cycle for a
sensor mounted to the distal end of the leg (Jimenez et al., 2009). This method
overcomes the problem of signal drifting by restarting the integration process after
each step and resetting movement velocity to zero during stance (Rong, Jianzhong,
Ming, & Xiangfeng, 2007). These so-called pedestrian dead-reckoning approaches
offer a viable alternative to traditional camera-based methods for estimating stride
length (Jimenez et al., 2009). Although research has shown that stride length for
walking can be estimated with a high degree of accuracy, none of these approaches
have been properly validated for running.

58
3 Purpose and Objectives
Human walking and running are complex motor tasks that are realized by a
coordinated effort of the neuromuscular system (Jordan et al., 2007a). Although the
gait pattern of healthy individuals is generally very stable, it exhibits a natural
degree of fluctuation (Hausdorff, 2005). Interestingly, research has shown that these
fluctuations do not occur randomly but rather exhibit high temporal stability as
signified by persistent long-range correlations (LRCs) (Hausdorff et al., 1995). It
has been suggested that these patterned fluctuations offer insight into the control of
gait and convey information about the way cyclic movement is organized
(Hausdorff, 2005). Despite these findings, however, very little is known about the
mechanisms that govern the emergence of LRCs during running as well as their
functional relevance. Moreover, LRCs have been shown to change with fatigue but
the exact mechanism responsible for these changes is still undetermined.
One of the main reasons for this research gap is that sophisticated
biomechanical tools, such as 3D-motion capture systems or force plates are only
capable of recording a small number of consecutive strides. As a result, many
researchers have used treadmill protocols to overcome this limitation. However,
studies have shown that running on a treadmill is biomechanically different from
unconstrained overground running (Nigg et al., 1995; P. Riley et al., 2008). With
respect to gait dynamics research has shown that treadmill locomotion is less
variable (Frenkel-Toledo et al., 2005) and more locally stable (Dingwell, Cusumano,
Cavanagh, & Sternad, 2001) compared to overground locomotion. Additionally,
Lindsay et al. (2014) demonstrated that treadmill running resulted in more
persistent LRCs.
Given the limitations of existing methods to collect a large number of
consecutive strides and to improve our understanding of stride pattern fluctuations
during unconstrained running, this thesis was designed to investigate the sensitivity

59
and applicability of LRCs to assess fatigue and their relevance for health and
performance using a simple foot-mounted IMU. In particular, the goal was to
identify factors that account for the changes in measures of self-similarity in
response to exhaustive exercise. Concomitantly, this thesis sought to determine the
effects of skill level on running mechanics and different measures of variability under
different fatiguing conditions.
In order to achieve these overall objectives, it was necessary to analyze LRCs
for both the temporal and spatial dimension of the stride pattern. This required
that stride length, which had not previously been assessed during unconstrained
running, had to be estimated with high accuracy prior to conducting any
experiments involving prolonged running. From a research perspective, detailed
knowledge about SL is important for coaches, clinicians and researchers alike
because together with SR it determines running speed. Moreover, individual SL
vectors represent the integrated output of different biomechanical determinants and
as such can provide valuable insight into the control of running gait. Therefore, the
purpose of the first study of this thesis was to determine whether a simple IMU
configuration could provide valid estimates for stride length over a range of typical
distance running speeds. Based on successful attempts to estimate walking distance
using pedestrian dead-reckoning (PDR) approaches (Angermann et al., 2010) it was
expected that a running-specific multi-threshold, zero-velocity update (ZUPT)
algorithm would be capable of accurately estimating individual stride length vectors.
In line with the overall objectives of this thesis, a subsequent experiment was
then conducted to explore changes in both spatial (SL) and temporal gait
parameters (ST, CT), their variability and LRCs during an exhaustive run. This
was necessary because only a small number of studies have previously investigated
LRCs for running and most existing studies involved treadmill protocols. Although
research suggests that factors such as fatigue (Meardon et al., 2011) and skill level

60
(Nakayama et al., 2010) may cause changes in LRCs during running, the exact
nature of this relationship and its potential causes remain unknown. Most
importantly, it is not known whether fatigue affects all dimensions of the stride
pattern to the same degree. It was hypothesized that the strength of LRCs would
decrease during the run, while linear measures of variability would not be affected by
fatigue. It was also expected that elite distance runners would be able to maintain
more persistent levels of LRCs during the run compared to recreational runners.
After gathering insights into the nature and time-course of fatigue-related
changes in the stride pattern and associated LRCs, it was intended to obtain further
information about the potential mechanisms responsible for the emergence of
patterned fluctuations in the stride pattern. Considering the relationship between
fatigue and joint stiffness (Horita et al., 1996; Kuitunen, Avela, et al., 2002; Rabita
et al., 2013) as well as the suspected link between fatigue and LRCs (Gates &
Dingwell, 2008; Meardon et al., 2011), there is a need to analyze the effects of
varying joint stiffness on stride pattern LRCs. To date, however, no study has
looked at how fatiguing high-intensity SSC exercise affects the stride pattern
variability and LRCs. Therefore, the third and final study of this thesis was
designed to examine the relationship between fatiguing high-intensity SSC exercise,
joint stiffness, stride mechanics and LRCs in elite and recreational runners. It was
hypothesized that a decrease in joint stiffness would be associated with reduced
LRCs, while linear measures of variability would remain unaffected. Furthermore, it
was expected that both joint stiffness and LRCs would decrease to a lesser degree in
competitive distance runners.

61
4 Study 1: Concurrent Validity of a Foot-Mounted IMU to Estimate
Stride Length in Running
Stride length is a fundamental variable of human gait that represents the
integrated output of various biomechanical determinants. Together with stride rate,
stride length determines the speed at which the body moves during walking and
running. Due to a lack of alternatives that are capable of continuously and
accurately assessing spatial parameters in an unconstrained setting, stride length
has traditionally been measured with force plates or camera-based systems in the
laboratory, either by recording a few isolated strides or on a treadmill.
Consequently, studies that have investigated stride characteristics during prolonged
overground locomotion were limited to focusing on temporal aspects of the stride
pattern (i.e., stride time, contact time etc.) or indirectly making inferences about its
spatial dimension. However, in order to obtain a complete picture of the stride
pattern and to allow researchers to conduct more complex time series analyses (i.e.
DFA) of parameters that have been hard to study during continuous locomotion,
accurate information regarding stride length is necessary.
Since the development of feasible and accurate MEMS components, several
studies have tried to estimate stride length and positional data using body-mounted
sensors (Bichler et al., 2012; Feliz et al., 2009; Jimenez et al., 2009; E. Martin,
2011). Often sensor algorithms are based on or include Global Positioning System
(GPS), ultrasound, or radio signals (Bichler et al., 2012; Jimenez, Seco, Prieto, &
Roa, 2005; Ogris et al., 2012; Siegle, Stevens, & Lames, 2013). Systems based on
IMUs offer a powerful alternative to beacon technologies because they can operate
without relying on a pre-installed infrastructure. The term Pedestrian Dead
Reckoning (PDR) is used to describe the process of solving the problem of
localization and object tracking by calculating displacement and orientation vectors
via integration of the recorded inertial signals, i.e. triaxial accelerations and angular

62
velocities (Bichler et al., 2012; Feliz et al., 2009; Jimenez et al., 2009; Kim, Jang,
Hwang, & Park, 2004). Although the theoretical model allows for the exact
assessment of spatial gait variables, such as stride length, the process is complicated
by measurement errors and accumulated noise that occur in practice. Since an
accurate estimation of the velocity, position and orientation vectors depends on
exact knowledge of the initial values, noise will induce substantial drift errors over
time, which are exacerbated during the integration process (Fischer et al., 2013).
Several studies have demonstrated that this drift error can be greatly reduced
when so-called zero-velocity updates (ZUPT) are periodically applied during the
integration process (Angermann et al., 2010; Bichler et al., 2012; Feliz et al., 2009;
Jimenez et al., 2009). In particular, ZUPTs involve resetting the velocity reading to
zero whenever the IMU is known to be stationary, which corrects for the
accumulation of errors generated by noise. Consequently, this method requires
accurate knowledge about the points in time where the velocity of the sensor can be
assumed to be equal to zero. In walking and running, ZUPTs have been successfully
applied during the stance phase of each gait cycle when an IMU is securely mounted
to the foot (see Figure 5). This approach has been shown to greatly improve the
accuracy of algorithms aiming at object tracking and stride length estimation
(Angermann et al., 2010; Bichler et al., 2012; Feliz et al., 2009; Jimenez et al., 2009).
4.1 Research Design
Although the performance of ZUPT-based PDR algorithms has repeatedly
been tested for walking (Feliz et al., 2009; Jimenez et al., 2009; E. Martin, 2011),
only a few studies have tested their performance during running. For example,
Angermann et al. (2010) tested the accuracy of different PDR algorithms by
calculating the cumulative distance traveled during a short indoor run and found
that an approach considering both the accelerations and turn rates of a

63
Figure 5 . Velocity estimates derived from acceleration signal by integration with(solid line) and without (dotted line) applying regular ZUPTs. Figure adapted fromFeliz, Zalama, and Garcia-Bermejo (2009). Pedestrian tracking using intertialsensors. Journal of Physical Agents, 3, 35-43.
foot-mounted IMU yielded the best results. The authors also note that the observed
position errors were higher compared to slow walking. In a similar experiment,
Bichler et al. (2012) assessed the performance of an algorithm that combined IMU
and GPS data to derive different stride parameters, including stride length, during
overground running. The results showed that the sensor estimates were in good
agreement with those produced by a simple videography system. However, the
authors also noted that the accuracy varied across running speeds. Despite these
initial attempts to estimate spatial parameters in an unconstrained setting, no
study has explicitly assessed the concurrent validity of a single foot-mounted IMU
to estimate individual stride length vectors for running. Therefore, the purpose of
this study was to determine whether a simple IMU configuration can provide valid
estimates for stride length during distance running. In particular, the concurrent
validity of a novel sensor-based existing algorithm was tested using class 3 intraclass
correlation coefficients (ICC) with a 3D-camera motion capture system (T-Series,
Vicon, Denver, CO) as the criterion. It was hypothesized that good levels of
agreement would exist between the sensor and camera-based methods for individual

64
stride length vectors. Participants were selected so that a wide range of
anthropometric characteristics (e.g. height, weight, leg length) were represented in
the sample. Subject characteristics are reported in Table 1. In order to be included
in the study, participants were not allowed to have any current medical or
pre-existing health conditions that could be exacerbated by the testing procedures.
The study was approved by the university’s ethics review board. Prior to
enrollment, all participants signed a University of Regina Ethics Board approved
consent form.Table 1Subject characteristics.
Variable M ±SDAge 22.3 (±1.5)Height (cm) 175.2 ± 23.1Leg Length (cm) 80.56 ± 4.36Bodymass (kg) 76.04 ± 3.19M = mean, SD = standard deviation
4.2 Instrumentation and Test Procedures
Eleven young healthy adults (female = 4; male = 7) volunteered to participate
in this study. A 9 degree of freedom IMU, consisting of a gyroscope, accelerometer
and magnetometer (Xsens, MTw), was secured to the right foot of each participant.
The sensor was firmly attached using the shoe’s laces and adhesive tape (see Figure
6b). It was oriented longitudinally along the foot, so that anteroposterior motion
was detected along the x-axis, mediolateral motion along the y-axis and vertical
motion along the z-axis (see Figure 6a). The exact position and orientation of the
sensor did not need to be determined because the running-specific sensor algorithm
depends only on the magnitude of the detected gyroscope and acceleration signals,
which were transformed into a global coordinate system. All sensor data were
recorded at 100 Hz.
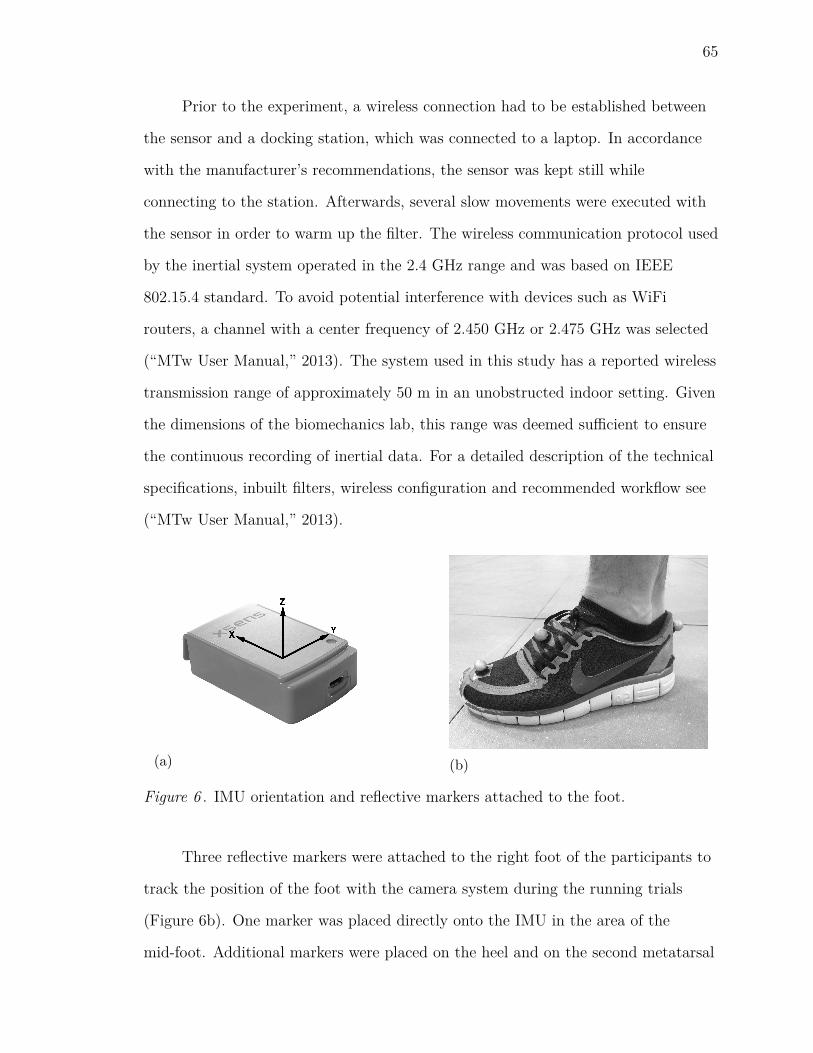
65
Prior to the experiment, a wireless connection had to be established between
the sensor and a docking station, which was connected to a laptop. In accordance
with the manufacturer’s recommendations, the sensor was kept still while
connecting to the station. Afterwards, several slow movements were executed with
the sensor in order to warm up the filter. The wireless communication protocol used
by the inertial system operated in the 2.4 GHz range and was based on IEEE
802.15.4 standard. To avoid potential interference with devices such as WiFi
routers, a channel with a center frequency of 2.450 GHz or 2.475 GHz was selected
(“MTw User Manual,” 2013). The system used in this study has a reported wireless
transmission range of approximately 50 m in an unobstructed indoor setting. Given
the dimensions of the biomechanics lab, this range was deemed sufficient to ensure
the continuous recording of inertial data. For a detailed description of the technical
specifications, inbuilt filters, wireless configuration and recommended workflow see
(“MTw User Manual,” 2013).
(a) (b)
Figure 6 . IMU orientation and reflective markers attached to the foot.
Three reflective markers were attached to the right foot of the participants to
track the position of the foot with the camera system during the running trials
(Figure 6b). One marker was placed directly onto the IMU in the area of the
mid-foot. Additional markers were placed on the heel and on the second metatarsal

66
head of the foot, respectively. The markers attached to the front and the back of
the shoe provided redundant information regarding the foot’s position that was only
used in case the mid-foot marker became obstructed or detached during the runs.
All marker positions were recorded at 100 Hz. After the participants were equipped
with the sensor and reflective markers, they performed twenty individual 10 m runs
through the previously calibrated space of the 3D camera motion capture system
(see Figure 7). The participants were instructed to naturally vary their speed
between trials. During each trial, 1 - 3 full strides were recorded and used for
further analysis. In order to identify the beginning and end of each trial,
participants were asked to stand still outside of the calibrated camera volume for 5
seconds and to initiate each run with their left foot. This also ensured that the first
footfall recorded by both the camera system and the foot-mounted IMU always
occurred with the right foot, which allowed for synchronization of the strides for
further analysis.
Figure 7 . Camera setup in the lab.
67
4.3 Data Analysis
Custom programs written in MATLAB (v. R2012a, The MathWorks, Natick,
MA) were used to process and analyze the recorded IMU signals. In particular, this
study employed a modified version of the algorithm proposed by Angermann et al.
(2010) and Fischer et al. (2013), who used inertial integration (INS) with
zero-velocity updates (ZUPT) at stance detections in combination with Kalman
Filtering to solve the problem of pedestrian navigation. This approach has been
shown to perform well over a range of locomotor speeds. However, the reliability
and concurrent validity of this PDR approach to estimate individual stride length
values in running has not been established.
Fischer et al. (2013) outlined the individual steps of the algorithm as follows:
1. Critical parameters, such as sampling rate, gravitational acceleration, as well
as different thresholds are defined before the main loop of the program is
initiated.
2. The raw signal components are imported to the program.
3. The orientation of the IMU is estimated by integration of the gyroscope
signals.
4. Accelerations are transformed from the local coordinate system, i.e. sensor
frame, to the global coordinate system, i.e. navigation frame.
5. The gravitational component is subtracted from the acceleration signals.
6. The acceleration values are integrated to obtain velocity estimates.
7. The calculated velocities are integrated to obtain position estimates.
8. A Kalman filter prediction estimates the error covariance.

68
9. The stance phase detection algorithm determines when the sensor is
stationary.
10. When stance is detected, a Kalman Filter update is applied by estimating
velocity, position and orientation errors.
11. The Kalman filter update corrects the error covariance.
12. A zero-velocity update is applied to correct velocity, position and orientation
estimates.
13. The algorithm generates the position output.
14. Individual stride length vectors are calculated by subtracting the position of
the foot at sample k-1 from the position at step k.
In this experiment, stance was declared when the resultant angular velocity
was less than 3.5 rad/s and simultaneously the resultant acceleration was between
0.3 and 1.7 g. More detailed information regarding the method is provided in
Angermann et al. (2010) and Fischer et al. (2013).
The marker coordinates recorded by the motion capture system were digitized
and processed in the motion capture software (Nexus, v.1.8, Vicon Motion System,
UK). Actual SL was defined as the horizontal displacement of the mid-foot marker
at foot contact between subsequent footfalls. Marker trajectories were low-pass
filtered using a fourth-order Butterworth filter with a cutoff frequency of 10 Hz.
The processed data were exported as a txt file in order to allow for further analysis.
Custom software written for MATLAB was used to extract the position of the right
foot during each stance phase. For the camera-based method, stance was defined as
occurring whenever the horizontal velocity of the mid-foot marker was below a
pre-defined threshold of 0.2 m/s. The positional data for the entire stance phase
was averaged to obtain a single representative value. After the stride length values
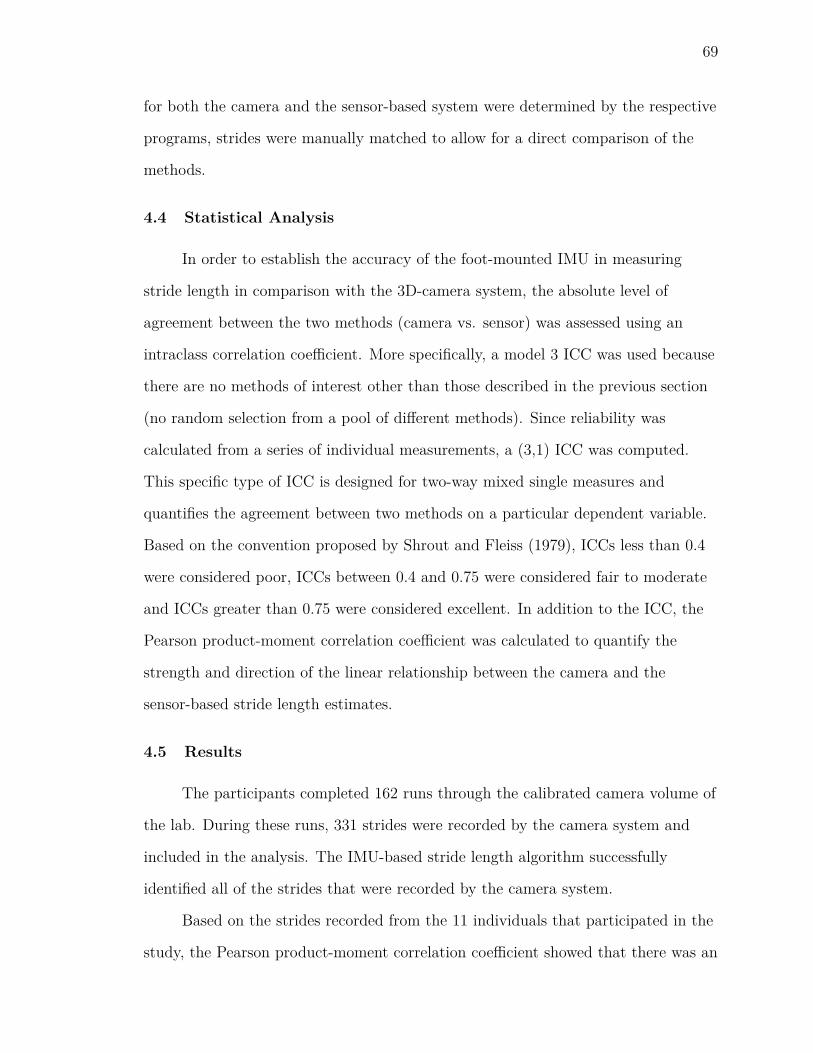
69
for both the camera and the sensor-based system were determined by the respective
programs, strides were manually matched to allow for a direct comparison of the
methods.
4.4 Statistical Analysis
In order to establish the accuracy of the foot-mounted IMU in measuring
stride length in comparison with the 3D-camera system, the absolute level of
agreement between the two methods (camera vs. sensor) was assessed using an
intraclass correlation coefficient. More specifically, a model 3 ICC was used because
there are no methods of interest other than those described in the previous section
(no random selection from a pool of different methods). Since reliability was
calculated from a series of individual measurements, a (3,1) ICC was computed.
This specific type of ICC is designed for two-way mixed single measures and
quantifies the agreement between two methods on a particular dependent variable.
Based on the convention proposed by Shrout and Fleiss (1979), ICCs less than 0.4
were considered poor, ICCs between 0.4 and 0.75 were considered fair to moderate
and ICCs greater than 0.75 were considered excellent. In addition to the ICC, the
Pearson product-moment correlation coefficient was calculated to quantify the
strength and direction of the linear relationship between the camera and the
sensor-based stride length estimates.
4.5 Results
The participants completed 162 runs through the calibrated camera volume of
the lab. During these runs, 331 strides were recorded by the camera system and
included in the analysis. The IMU-based stride length algorithm successfully
identified all of the strides that were recorded by the camera system.
Based on the strides recorded from the 11 individuals that participated in the
study, the Pearson product-moment correlation coefficient showed that there was an
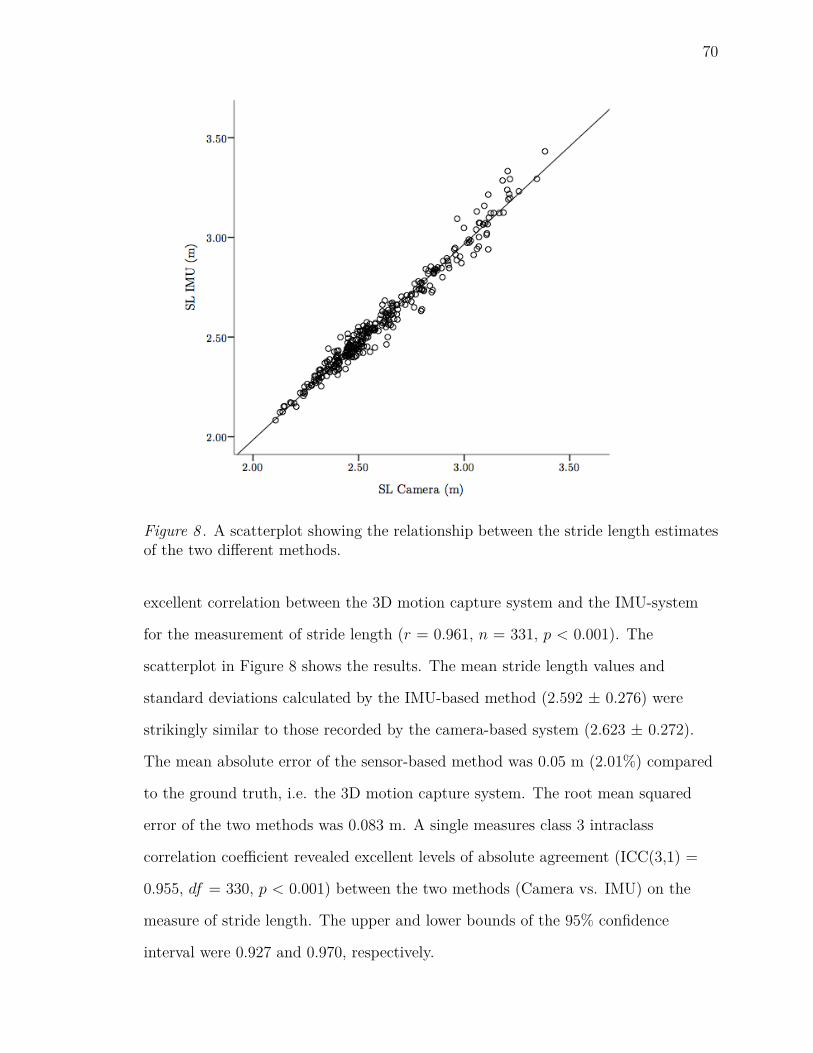
70
Figure 8 . A scatterplot showing the relationship between the stride length estimatesof the two different methods.
excellent correlation between the 3D motion capture system and the IMU-system
for the measurement of stride length (r = 0.961, n = 331, p < 0.001). The
scatterplot in Figure 8 shows the results. The mean stride length values and
standard deviations calculated by the IMU-based method (2.592 ± 0.276) were
strikingly similar to those recorded by the camera-based system (2.623 ± 0.272).
The mean absolute error of the sensor-based method was 0.05 m (2.01%) compared
to the ground truth, i.e. the 3D motion capture system. The root mean squared
error of the two methods was 0.083 m. A single measures class 3 intraclass
correlation coefficient revealed excellent levels of absolute agreement (ICC(3,1) =
0.955, df = 330, p < 0.001) between the two methods (Camera vs. IMU) on the
measure of stride length. The upper and lower bounds of the 95% confidence
interval were 0.927 and 0.970, respectively.
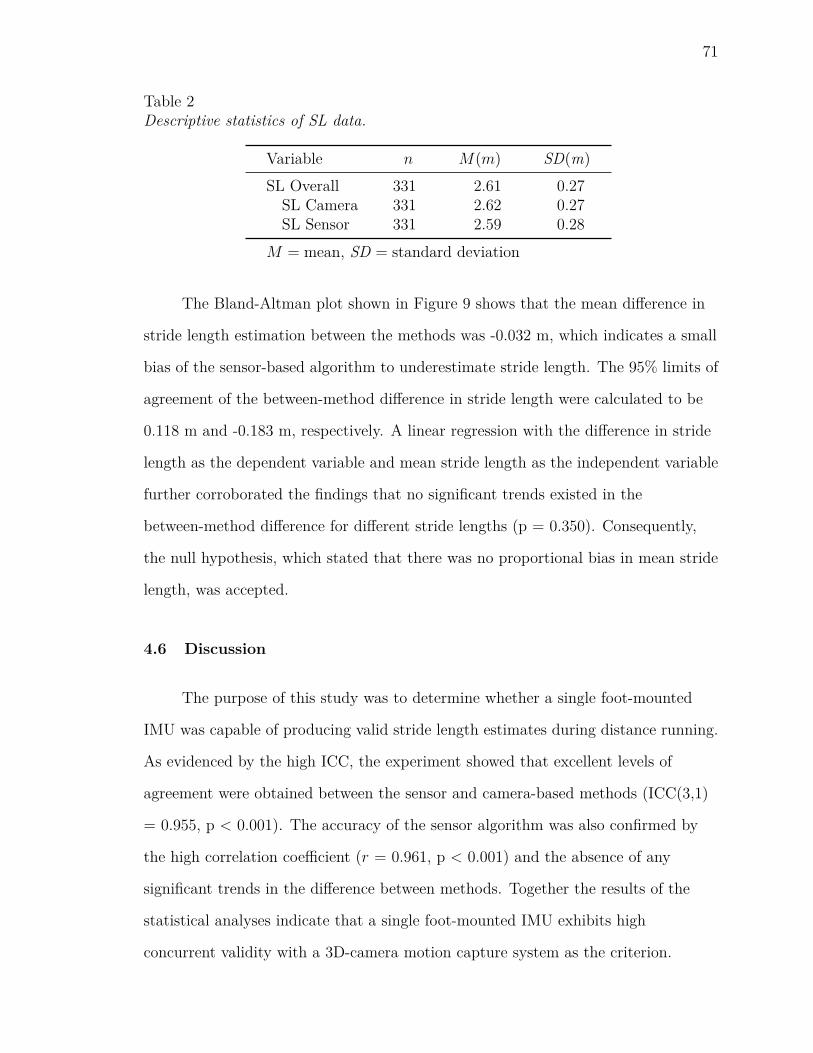
71
Table 2Descriptive statistics of SL data.
Variable n M(m) SD(m)SL Overall 331 2.61 0.27SL Camera 331 2.62 0.27SL Sensor 331 2.59 0.28
M = mean, SD = standard deviation
The Bland-Altman plot shown in Figure 9 shows that the mean difference in
stride length estimation between the methods was -0.032 m, which indicates a small
bias of the sensor-based algorithm to underestimate stride length. The 95% limits of
agreement of the between-method difference in stride length were calculated to be
0.118 m and -0.183 m, respectively. A linear regression with the difference in stride
length as the dependent variable and mean stride length as the independent variable
further corroborated the findings that no significant trends existed in the
between-method difference for different stride lengths (p = 0.350). Consequently,
the null hypothesis, which stated that there was no proportional bias in mean stride
length, was accepted.
4.6 Discussion
The purpose of this study was to determine whether a single foot-mounted
IMU was capable of producing valid stride length estimates during distance running.
As evidenced by the high ICC, the experiment showed that excellent levels of
agreement were obtained between the sensor and camera-based methods (ICC(3,1)
= 0.955, p < 0.001). The accuracy of the sensor algorithm was also confirmed by
the high correlation coefficient (r = 0.961, p < 0.001) and the absence of any
significant trends in the difference between methods. Together the results of the
statistical analyses indicate that a single foot-mounted IMU exhibits high
concurrent validity with a 3D-camera motion capture system as the criterion.

72
Figure 9 . Bland-Altman plot comparing the two different methods to calculatestride length.
Despite the positive results, it was noted that the accuracy of the sensor-based
method varied between participants. Although this study did not investigate the
causes of these inconsistencies, it is reasonable to suggest that running speed as well
as individual aspects of running technique, e.g. foot strike patterns, determine the
signal characteristics, which, in turn, may have affected the accuracy of the stride
length algorithm. Figure 10 illustrates the between-method differences in stride
length for all eleven participants.
The calculated position estimates and stride length vectors depend largely on
correct identification of the stance phases because ZUPTs are applied at each of
these points (Zhao, Brahms, Gerhard, & Barden, 2015). This study employed a
stance phase detection algorithm based on static thresholds, which were determined
by visual inspection of several running trials. An approach considering both the

73
Figure 10 . Between-method difference in stride length for each participant.
turn rates and the acceleration readings to detect stance was shown to yield better
results over a range of walking and running speeds than approaches based on
accelerometer or gyroscope readings alone (Angermann et al., 2010; Fischer et al.,
2013). However, one of the general shortcomings of threshold-based approaches is
their sensitivity to changes in gait patterns, running surfaces, sensor placement and
running speed (Angermann et al., 2010; Bichler et al., 2012). By design, the method
works better when the foot remains relatively stationary during stance compared to
when it is moving (pronation/ supination, plantarflexion/dorsiflexion) while being
in contact with the ground. Although foot strike patterns were not monitored
during the running trials, it is reasonable to assume that runners who initiated
ground contact with the fore- or midfoot exhibited different acceleration and
angular velocity profiles compared to runners who initiate ground contact with the
rearfoot (Strohrmann, Harms, Tröster, Hensler, & Müller, 2011). More specifically,
runners with a FFS/MFS pattern dorsiflex the foot during the early stance phase

74
and subsequently movie into plantarflexion, as opposed to a sequence of
plantarflexion, dorsiflexion, plantarflexion in runners who display a RFS pattern.
Furthermore, running speed, which has also been shown to influence the duration
and stability of the stance phase (Bichler et al., 2012; Strohrmann et al., 2011) may
have been a confounding factor.
Stance detection errors may affect the stride length calculation in two different
ways. One the one hand, by producing false negatives, i.e. deletion errors, which
lead to the overestimation of stride length vectors and result in the accumulation of
signal drift. In particular, this may occur when the signal is not stationary during
the stance phase because in these situations the threshold-based stance detection
mechanism may fail and subsequently continues to integrate the inertial signals even
though the stride is already completed. The negative effects of stance phase deletion
errors on pedestrian navigation have been discussed in more detail elsewhere
(Angermann et al., 2010; Bichler et al., 2012; Jimenez et al., 2009).
Figure 11 . Resultant angular velocity during running. The bold line indicates thestance phases detected by the algorithm. Improper threshold tuning is shown tocause considerable stance detection errors.
On the other hand, stance phase insertion errors, i.e. false positives, may
occur between two subsequent stance phases. These errors cause stride length to be
underestimated because the time interval between subsequent ZUPTs is reduced.
Although making the stance detection algorithm more selective by lowering the

75
gyroscope and acceleration thresholds will reduce insertion errors, the risk of
deletion errors increases simultaneously. Consequently, thresholds were manually
tuned to establish the values that work best across subjects. To correct for the
effects of the remaining insertion errors, a condition proposed by Angermann et al.
(2010) was added to the algorithm, which stated that stride length vectors must
exceed a certain distance (0.75 m) in order to be valid. For stride lengths below this
threshold, the last ZUPT was declared to be a false positive and the algorithm
continued with the integration process until the next ZUPT was applied. Figure 11
shows the occurrence of stance detection errors for a sample run as a result of an
improperly tuned algorithm. In this experiment, no insertion or deletion errors
occurred within the 331 strides that were recorded and included in the analysis.
This was achieved by meticulous fine-tuning of the stride length algorithm and by
extracting only two or three strides performed at a constant running speed from
each trial. However, occasionally inconsistencies were observed immediately at the
beginning or end of the short linear run, i.e. when runners accelerated or
decelerated. This suggests that although the proposed method performs well for
strides performed at a constant speed, it may not be suited for locomotion involving
abrupt changes in directions.
In summary, it is likely that the performance of the stride length algorithm
was affected by factors such as running speed and individual variations of running
technique. This is also consistent with other studies that have shown that features
such as foot strike patterns and locomotor speed affect the accuracy of pedestrian
navigation (Angermann et al., 2010). To minimize these effects, participants were
instructed to accelerate quickly and maintain a constant speed while running
through the calibrated 3D camera space. The participants were also asked to run
and initiate ground contact as they would do normally during a continuous
overground run. Although a simple threshold-based stance detection procedure was
76
able to correctly identify all strides recorded by the camera, an additional correction
mechanism was added to the sensor-based algorithm (i.e. the condition that a stride
length vector must exceed 0.75m in order for a new ZUPT to be applied) in order to
avoid stance insertion errors.
4.7 Conclusion and Future Work
For research purposes in biomechanics, stride length has been hard to measure
using inertial sensors in field conditions. This study has demonstrated that
individual stride length vectors can accurately be determined with a single
foot-mounted sensor during distance running. The presented method has great
potential for high-precision, real-time monitoring of stride length and other spatial
gait variables during continuous running and provides researchers with the
opportunity to apply more complex time series analyses, such as DFA, to
parameters that have thus far been hard to study in an unconstrained overground
running scenario. The studies presented in Sections 5 and 6 expand upon the results
of this experiment by tracking stride length, its variability and LRCs during
continuous overground running. The results of this study are also highly relevant for
distance runners, coaches and clinicians who are interested in tracking stride length
for the purpose of optimizing performance and exploring factors related to running
injuries. The method proposed in this paper offers a highly accurate and
cost-effective alternative to existing biomechanical tools that require a complex
setup and are restricted to laboratory settings.

77
5 Study 2: Stride Mechanics and Variability over a Prolonged Run in
Recreational and Elite Distance Runners
It is well established that fatigue has profound effects on running mechanics
(Chan-Roper et al., 2012; Derrick et al., 2002; Dutto & Smith, 2002; Elliott &
Ackland, 1981). Traditionally, these effects have been assessed by tracking the mean
values, as well as the standard deviation and coefficient of variation of certain
biomechanical variables over time (Derrick et al., 2002; Dutto & Smith, 2002;
Owings & Grabiner, 2003, 2004; Queen, Gross, & Liu, 2006). Some researchers,
however, have argued that these measures only represent one dimension of fatigue
and are insensitive to subtle changes that arise within the neuromuscular system
(Hausdorff, 2005; Jordan et al., 2006; Meardon et al., 2011).
Studies have shown that under normal conditions healthy individuals exhibit
very stable movement patterns during walking and running (Terrier, 2003).
However, like any other physiological variable the basic gait parameters change from
one stride to the next, even when external conditions are controlled (Hausdorff,
2005, 2007; Jordan et al., 2006, 2007a). Rather than occurring randomly, the
observed fluctuations exhibit varying degrees of temporal stability and show
characteristics of self-similarity. While there is evidence to suggest that a certain
amount of fluctuation is indicative of a high degree of motor control and
adaptability (Hausdorff, 2005, 2007; Meardon et al., 2011), abnormal values have
been associated with aging and certain disease states (Hausdorff, 2007).
The characteristics of these patterned fluctuations can be assessed by
calculating what is known as the fractal scaling index (FSI) for a given physiological
time-series, such as gait data derived from a series of strides. The mathematical
procedure which is used to calculate the FSI is called detrended fluctuation analysis
(DFA). The DFA yields a scaling exponent α, which represents the degree to which
stride-to-stride fluctuations exhibit characteristics of both noise and meaningful
78
non-random temporal patterns. With respect to walking and running, α signifies
the degree to which one particular stride in an existing data set is correlated with
strides that occur at a considerable temporal distance. Although these so-called
long-range correlations (LRCs) are most commonly assessed using the stride time
interval (Hausdorff et al., 1995; Jordan et al., 2006), they have also been found to
exist in other gait variables, such as stride length and certain variables of impact
loading (Jordan et al., 2007b).
While most studies have looked at LRCs during level walking, only a small
number of studies have focused on nonlinear fluctuations during distance running.
For example, Jordan et al. (2006, 2007a, 2007b), who investigated LRCs during
treadmill running, reported that the value of α was speed-dependent and followed a
U-shaped distribution, with the weakest LRCs occurring at preferred running
speeds. A study conducted by Nakayama et al. (2010), which investigated the
effects of skill level on LRCs, showed that trained runners exhibited significantly
lower values of α compared to untrained individuals during a treadmill run over a
range of typical distance running speeds. However, these findings may not be valid
for overground running and there is a scarcity of research that has investigated
changes in stride pattern variability and LRCs due to fatigue during unconstrained
overground running. Meardon et al. (2011) tracked LRCs and linear measures of
gait variability in a group of healthy and previously injured runners using a
body-fixed inertial sensor and found that for both groups α significantly decreased
over time, while linear measures of variability remained unaffected. It was
concluded that stride time becomes less predictable over the course of a fatiguing
overground run. The authors further reported that injured runners exhibited lower
values of α compared to their healthy counterparts. However, the effects of fatigue
on LRCs during exhaustive running have not yet been confirmed.
Based on these results, the purpose of the present study was twofold. The first
79
objective was to investigate changes in the variability and LRCs of various
spatiotemporal gait parameters during a prolonged run by using a single,
foot-mounted IMU. Since it has been reported that fatigue affects elite distance
runners and recreational runners differently (Bertram et al., 2013), a second
objective was to determine the extent to which skill level had an effect on running
kinematics, including the coefficient of variation of different stride parameters as
well as LRCs of the stride pattern.
It was hypothesized that a significant reduction in the strength of the LRCs
(as indicated by α) would occur over the course of the run. In contrast, it was
expected that no significant changes would occur in the mean values of selected
stride parameters and linear measures of variability, i.e. coefficient of variation. It
was also expected that elite distance runners would maintain more stable levels of α
during the run than recreational runners.
5.1 Research Design
The proposed study employed a two-way repeated-measures design, with skill
level (elite vs. recreational) as between-subject factor and run duration (normalized
and subdivided into three categories) as the within-subject factor. The sample
involved a group of elite distance runners as well as a group of individuals that had
never undergone training specific to distance running.
Both groups participated in the same experimental protocol, i.e. a prolonged
overground running trial to fatigue, performed at an individual running speed. Like
any prolonged activity, continuous running depends on the generation of tension in
the active muscles. However, when metabolic and mechanical demands surpass a
muscle’s work capacity, a decrease in performance will occur. Reduced exercise
intensity, e.g. slower running speed, is an expected result of fatigue, which can be
assessed with simple tools (Bertram et al., 2013). Given the lack of existing

80
methods to directly measure neuromuscular aspects of fatigue during unconstrained
overground running, this study employed a model of voluntary exhaustion to signify
fatigue. More specifically, fatigue was defined as the inability to maintain a
previously established running speed.
Elite distance runners (n = 16) were recruited from the University of Regina
Cougars Track and Field and Cross-Country teams. All subjects in this group were
required to have performed regular distance running between 4 and 7 days per week
for more than 2 years and must have competed at a provincial or intercollegiate
level within the preceding year. Furthermore, a personal best time of 21:30 min
(women) and 17:30 min (men) for the 5000 m was required in order to be classified
as an elite distance runner. These times were established in accordance with the
team requirements for the university track and field team. Exclusion criteria for this
group included a race time for the 5000 m above the specified threshold; any history
of lower-extremity surgery in the past 24 months; any history of running-related
injuries that caused discontinuation of running for more than 7 days; any other
neuromuscular or cardiovascular pathology; or any other medical condition that
could potentially be worsened by prolonged running.
The group of recreational runners (n = 16) consisted of young, healthy adults.
These participants were not allowed to have had any training specific to competitive
distance running. However, recreational running for a time of up to 3 hours per
week was allowed. Furthermore, in order to be included in this group, individuals
had to possess the ability to run at a comfortable pace for a minimum of 15
minutes. The health-related exclusion criteria were identical to those of the elite
distance running group. Prior to enrollment, all participants signed a consent form
that had previously been approved by the University of Regina Ethics Board.
Since the effort required to maintain a specific speed differs between
individuals, the running speed for each participant was normalized and defined

81
relative to an individual marker of performance. Therefore, participants were asked
to complete the fatiguing run at their current 5000 m race pace. This value had
been estimated based on the desired range of distances to be covered during the
prolonged run as well as on the minimum number of strides necessary to perform
calculations required for the DFA (> 1200). In order to determine the individual
running speeds, recreational runners completed a 5000 m all-out run at least 5 days
prior to performing the actual experimental protocol. The elite distance runners
completed a 5000 m time trial as part of their training in the past month and did
not have to undergo the testing protocol prior to the prolonged run. For these
individuals running velocity corresponded to their self-reported 5000 m race pace.
5.2 Instrumentation and Test Procedures
This study employed the sensor configuration and attachment protocol
described in Section 4.2. The system used in this study has a reported wireless
transmission range of approximately 50 m in an unobstructed indoor setting. Given
the dimensions of the indoor track, it was estimated that this range would be
sufficient to ensure the recording of inertial data at every point around the track.
This assumption was confirmed after conducting several test runs with the IMU
around the track before the beginning of the data collection process. Figure 12
demonstrates the equipment setup that produced the most stable results during the
test runs.
Since LRCs have been shown to change as a function of running speed (Jordan
et al., 2007a), the pace of each runner was tracked during the experiment. For this
purpose, participants were equipped with a wrist-worn running computer, a heart
rate sensor, which was strapped around their chest, and an associated footpod,
which was attached to their left foot (RS300X, Polar, Kempele, Finland). This
system continuously monitored heart rate, speed and distance covered and triggered
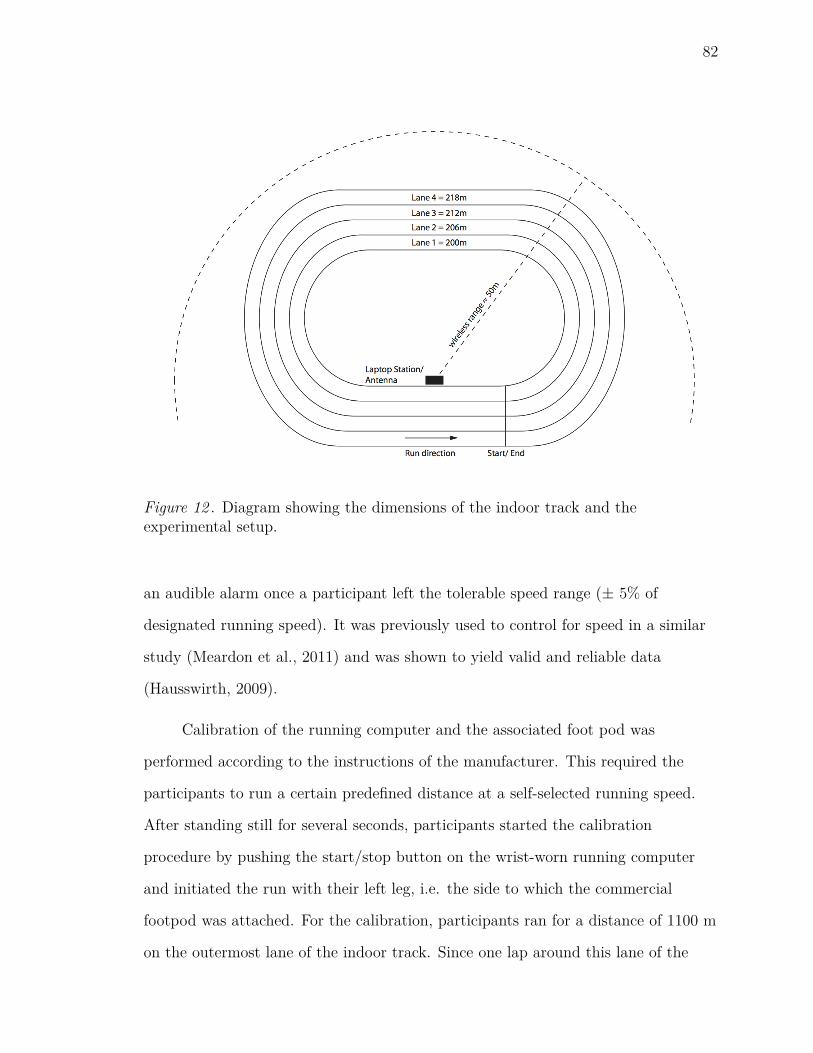
82
Figure 12 . Diagram showing the dimensions of the indoor track and theexperimental setup.
an audible alarm once a participant left the tolerable speed range (± 5% of
designated running speed). It was previously used to control for speed in a similar
study (Meardon et al., 2011) and was shown to yield valid and reliable data
(Hausswirth, 2009).
Calibration of the running computer and the associated foot pod was
performed according to the instructions of the manufacturer. This required the
participants to run a certain predefined distance at a self-selected running speed.
After standing still for several seconds, participants started the calibration
procedure by pushing the start/stop button on the wrist-worn running computer
and initiated the run with their left leg, i.e. the side to which the commercial
footpod was attached. For the calibration, participants ran for a distance of 1100 m
on the outermost lane of the indoor track. Since one lap around this lane of the
83
track equaled 218 m, the participants needed to complete five full laps and an
additional distance of 10 m. The researcher stood next to the track and indicated
the point at which the runners had to come to a full stop after the required distance
was covered. After completing the run, the participants had to stand still and wait
for 15 seconds, so the data could be transmitted from the footpod to the wrist-worn
computer. The calibration run also served as a warm up for the experimental
protocol. However, if participants indicated that they wanted to perform additional
warm-up activities, they were given the opportunity to do so, provided that these
activities were non-fatiguing. During the run, the quality of the wireless connection
between the foot-mounted IMU and the dock station over the range of the indoor
track as well as the characteristics of the inertial signal were monitored. If
abnormalities were detected, the position of the sensor on the foot was improved
and the radio channel was changed.
Following the warm up, the researcher reset the running computer and started
recording the inertial signals from the wireless foot-mounted IMU. Subsequently,
participants positioned themselves at the starting line on the outermost lane of the
indoor track in preparation for the fatiguing run. After counting down, the
researcher and the participant simultaneously started to time the run, on a stop
watch and the running computer respectively. The participants then initiated the
run on their left leg and ran around the track in a counterclockwise direction until
they felt they could no longer maintain the predetermined speed. This was
indicated by repeatedly hearing the audible alarm of the running computer.
5.3 Data Analysis
Before conducting any further analysis, the raw data collected by the
foot-mounted IMU was pre-processed and reduced. The first minute of every run
was excluded to remove potential inconsistencies in the signal that may have

84
occurred due to an irregular running pace before the participants found their
predetermined running speed. Furthermore, a custom-written MATLAB program
was used to assess the periodicity of the inertial signals. Aperiodic or weak periodic
sections that may have occurred due to weak signal reception or aberrant
movements were excluded from the analysis. After the preprocessing procedures,
custom programs written in MATLAB (v. R2012a, The MathWorks, Natick, MA)
were used to process and analyze the raw data collected with the foot-mounted IMU.
The following dependent variables were calculated from the raw data using
MATLAB scripts:
1. Stride time (ST) was defined as the interval between two subsequent
footfalls of the same foot. The stance identification was based on the resultant
acceleration signal. Individual stride times were found by subtracting the
absolute time of subsequent strides (see Figure 13).
2. Contact time (tc) was defined as the time between initial contact and toe off
of one individual step. Contact time corresponds to the stance phase of the
cycle. Previous studies have shown that a single foot-mounted sensor is able
to identify these events accurately over a wide range of running speeds (10 -
19 km/h) and that high levels of agreement (95%) exist between stance time
as assessed by inertial sensing, infrared motion capture and force plate data
(J. B. Lee et al., 2010). In accordance with previous research, the events of
initial contact and toe off were determined from the resultant acceleration
signal, using a method that combined peak extraction and thresholding. In
particular, large positive peaks in the acceleration profile indicate initial
contact, while a smaller peak immediately after a short stationary period
signifies the end of the stance phase (J. B. Lee et al., 2010). Figure 13 shows
the events of initial contact and toe-off.
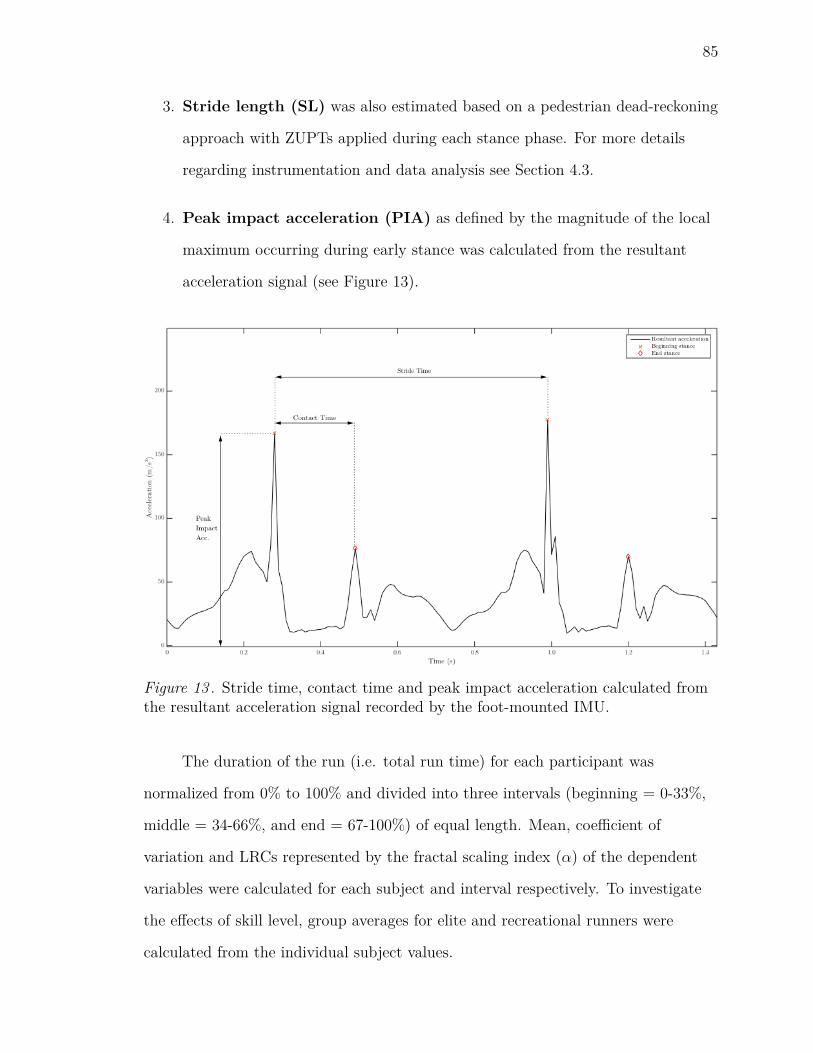
85
3. Stride length (SL) was also estimated based on a pedestrian dead-reckoning
approach with ZUPTs applied during each stance phase. For more details
regarding instrumentation and data analysis see Section 4.3.
4. Peak impact acceleration (PIA) as defined by the magnitude of the local
maximum occurring during early stance was calculated from the resultant
acceleration signal (see Figure 13).
Figure 13 . Stride time, contact time and peak impact acceleration calculated fromthe resultant acceleration signal recorded by the foot-mounted IMU.
The duration of the run (i.e. total run time) for each participant was
normalized from 0% to 100% and divided into three intervals (beginning = 0-33%,
middle = 34-66%, and end = 67-100%) of equal length. Mean, coefficient of
variation and LRCs represented by the fractal scaling index (α) of the dependent
variables were calculated for each subject and interval respectively. To investigate
the effects of skill level, group averages for elite and recreational runners were
calculated from the individual subject values.
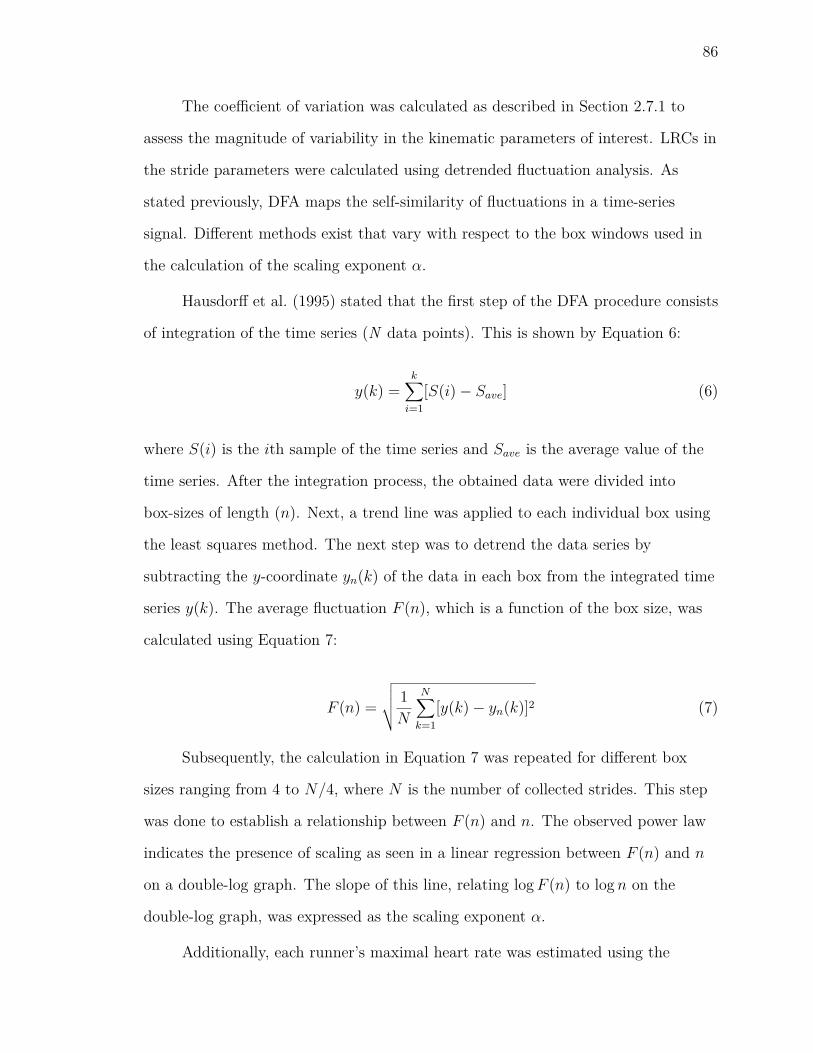
86
The coefficient of variation was calculated as described in Section 2.7.1 to
assess the magnitude of variability in the kinematic parameters of interest. LRCs in
the stride parameters were calculated using detrended fluctuation analysis. As
stated previously, DFA maps the self-similarity of fluctuations in a time-series
signal. Different methods exist that vary with respect to the box windows used in
the calculation of the scaling exponent α.
Hausdorff et al. (1995) stated that the first step of the DFA procedure consists
of integration of the time series (N data points). This is shown by Equation 6:
y(k) =k∑
i=1[S(i)− Save] (6)
where S(i) is the ith sample of the time series and Save is the average value of the
time series. After the integration process, the obtained data were divided into
box-sizes of length (n). Next, a trend line was applied to each individual box using
the least squares method. The next step was to detrend the data series by
subtracting the y-coordinate yn(k) of the data in each box from the integrated time
series y(k). The average fluctuation F (n), which is a function of the box size, was
calculated using Equation 7:
F (n) =
√√√√ 1N
N∑k=1
[y(k)− yn(k)]2 (7)
Subsequently, the calculation in Equation 7 was repeated for different box
sizes ranging from 4 to N/4, where N is the number of collected strides. This step
was done to establish a relationship between F (n) and n. The observed power law
indicates the presence of scaling as seen in a linear regression between F (n) and n
on a double-log graph. The slope of this line, relating logF (n) to log n on the
double-log graph, was expressed as the scaling exponent α.
Additionally, each runner’s maximal heart rate was estimated using the

87
nonlinear method known as the Tanaka formula (Tanaka, Kevin, & Douglas, 2001):
HRmax = 208− (0.7× age) (8)
The heart rate of each participant was collected continuously during the run.
Average heart rates for each interval were calculated as a percentage of HRmax.
This was done in order to track the individual level of exertion during
cardiovascular performance.
5.4 Statistical Analysis
The study had two main objectives. First, it was designed to investigate the
effects of a prolonged overground run to fatigue on kinematic stride parameters and
different measures of variability using a single foot-mounted IMU. The second
objective was to determine whether fatigue affected the stride kinematics of elite
distance runners and recreational runners to the same degree or if differences existed
in the onset and time-course of fatigue as indicated by the dependent variables.
Consequently, the two independent variables specified in this study were group (elite
vs. recreational) and run duration interval (Beginning = 0 - 33% vs. Middle = 34 -
66% vs. End = 67 - 100%).
Independent sample t-tests were performed on each of the following subject
characteristics: age (years), body mass (kg), training volume (hours) and height
(cm). Additional independent sample t-tests were conducted to check for group
differences regarding the characteristics of the prolonged run: average running speed
(m/s), average heart rate during the run (% of max. HR), distance covered (km),
run duration (minutes), as well as rate of perceived exertion (RPE) immediately
after completion of the run. Before the independent t-tests, all data sets were
assessed for normality and log-transformed if necessary. Homoscedasticity was
assessed using Levene’s test for equality of variances.
88
A two-way repeated measures (mixed) ANOVA was conducted for each of the
dependent variables (mean stride time, mean stride length, mean contact time, mean
impact acceleration, CV stride time, CV stride length, CV contact time, CV impact
acceleration, α stride time, α stride length, α contact time, α impact acceleration)
to examine the effect of the within-subject independent variable (run duration [3
levels]) and the between-subject independent variable (group [2 levels]). In addition
to examining the main effects for both skill level and run duration, this analysis also
provided information about potential interaction effects. Before conducting the
main analysis, all data sets were assessed for normality using the Shapiro-Wilks test.
Non-normally distributed data were log transformed before conducting any further
analysis. Sphericity was assessed using Mauchly’s test. In case the assumption of
sphericity was violated, the procedure described by Girden (1992) was applied, who
recommended applying the Huynh-Feldt correction in case ε > 0.75 and the more
conservative Greenhouse-Geisser correction for situations where ε < 0.75.
If the ANOVA revealed a significant main effect for group on any of the
dependent variables, no post-hoc test needed to be conducted. However, if a
significant main effect was found for run duration, a post-hoc Bonferroni correction
(p = 0.05) was used to identify which intervals of the run (beginning, middle or
end) were significantly different from each other.
5.5 Results
The average age of the elite runners (21.2 years) was significantly different (p
< 0.001) from that of the recreational group (26.8 years). The reported training
volume, expressed in hours spent running per week, for the group of elite runners
(9.31 hrs) was significantly higher (p < 0.001) than for recreational runners (2.34
hrs). Mean body mass for the group of elite runners (63.4 kg) was also significantly
lower (p = 0.028) than that of the recreational runners (71.6 kg). Height was not
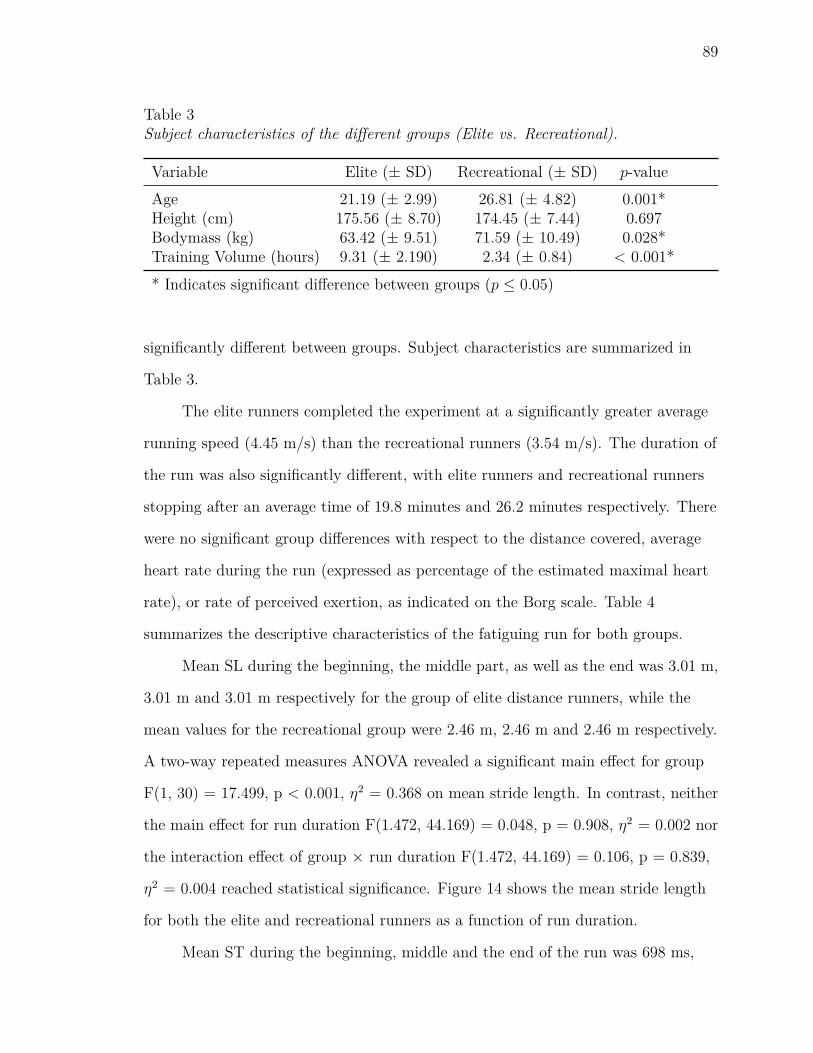
89
Table 3Subject characteristics of the different groups (Elite vs. Recreational).
Variable Elite (± SD) Recreational (± SD) p-valueAge 21.19 (± 2.99) 26.81 (± 4.82) 0.001*Height (cm) 175.56 (± 8.70) 174.45 (± 7.44) 0.697Bodymass (kg) 63.42 (± 9.51) 71.59 (± 10.49) 0.028*Training Volume (hours) 9.31 (± 2.190) 2.34 (± 0.84) < 0.001** Indicates significant difference between groups (p ≤ 0.05)
significantly different between groups. Subject characteristics are summarized in
Table 3.
The elite runners completed the experiment at a significantly greater average
running speed (4.45 m/s) than the recreational runners (3.54 m/s). The duration of
the run was also significantly different, with elite runners and recreational runners
stopping after an average time of 19.8 minutes and 26.2 minutes respectively. There
were no significant group differences with respect to the distance covered, average
heart rate during the run (expressed as percentage of the estimated maximal heart
rate), or rate of perceived exertion, as indicated on the Borg scale. Table 4
summarizes the descriptive characteristics of the fatiguing run for both groups.
Mean SL during the beginning, the middle part, as well as the end was 3.01 m,
3.01 m and 3.01 m respectively for the group of elite distance runners, while the
mean values for the recreational group were 2.46 m, 2.46 m and 2.46 m respectively.
A two-way repeated measures ANOVA revealed a significant main effect for group
F(1, 30) = 17.499, p < 0.001, η2 = 0.368 on mean stride length. In contrast, neither
the main effect for run duration F(1.472, 44.169) = 0.048, p = 0.908, η2 = 0.002 nor
the interaction effect of group × run duration F(1.472, 44.169) = 0.106, p = 0.839,
η2 = 0.004 reached statistical significance. Figure 14 shows the mean stride length
for both the elite and recreational runners as a function of run duration.
Mean ST during the beginning, middle and the end of the run was 698 ms,

90
n nn
Figure 14 . Mean stride length as a function of run duration. n = mean SLsignificantly different (p < 0.001) between groups.
Figure 15 . Mean stride time as a function of run duration.

91
Table 4Average values of descriptive parameters for the prolonged run.
Variable Elite (± SD) Recreational (± SD) p-valueRunning Speed (m/s) 4.45 (± 0.39) 3.54 (± 0.51) < 0.001*Run Duration (min) 19.83 (± 3.35) 26.18 (± 6.28) 0.002*Run Distance (km) 4.80 (± 1.46) 5.38 (± 1.02) 0.204% of HRmax 90.93 (± 3.32) 92.33 (± 5.17) 0.383RPE (Borg Scale) 15.77 (± 1.09) 16.36 (± 1.36) 0.248* Indicates significant difference between groups (p ≤ 0.05)
696 ms and 695 ms respectively for the group of elite distance runners, while the
mean values for the recreational group were 710 ms, 711 ms and 708 ms
respectively. A two-way repeated measures ANOVA did not reveal any signifiant
main effect for group F(1, 30) = 0.840, p = 0.367, η2 = 0.027 or run duration
F(1.288, 38.640) = 1.710, p = 0.200, η2 = 0.054. The interaction effect of group ×
run duration F(1.288, 38.640) = 0.355, p = 0.610, η2 = 0.012 did not reach
statistical significance. Figure 15 shows the mean stride time for both the elite and
recreational runners as a function of run duration.
Mean tc for the three run intervals were 147 ms (beginning), 148 ms (middle)
and 148 ms (end) for the group of elite distance runners. In contrast, the mean tc
for the recreational group was 171 ms, 172 ms and 173 ms respectively. A two-way
repeated measures ANOVA revealed a significant main effect for group F(1, 30) =
31.504, p < 0.001, η2 = 0.512 as well as for run duration F(1.356, 40.670) = 4.589, p
= 0.028, η2 = 0.133 on the measure of mean tc. The interaction effect of group ×
run duration F(1.356, 40.670) = 0.029, p = 0.924, η2 = 0.001 was not statistically
significant. Bonferroni adjusted pair-wise comparisons revealed that mean tc differed
significantly between the beginning and the middle of the run (p = 0.041). However,
there was no significant change between any of the other sections. Figure 16 shows
the mean tc for both the elite and recreational runners as a function of run duration.

92
Figure 16 . Mean tc as a function of run duration. n = mean tc significant difference(p < 0.001) between groups, * = significant difference (p = 0.041) betweenbeginning and middle of the run
Mean PIA during the beginning, middle and the end of the run were 197
m/s2, 201 m/s2 and 204 m/s2 respectively for the group of elite distance runners,
while the mean impact acceleration values for the recreational group were 158 m/s2,
160 m/s2 and 161 m/s2 respectively. A two-way repeated measures ANOVA
revealed a significant main effect for group F(1, 30) = 16.063, p < 0.001, η2 = 0.349.
There was also a significant main effect for run duration F(1.297, 38.905) = 8.916, p
= 0.003, η2 = 0.229. In contrast, the interaction effect for group × run duration did
not reach statistical significance F(1.297, 38.905) = 1.481, p = 0.237, η2 = 0.047.
Bonferroni adjusted pair-wise comparisons showed that the beginning differed
significantly from the middle (p = 0.045) and the end (p = 0.009) of the run.
Additionally, the difference between the middle and the end was statistically
significant (p = 0.031). Figure 17 shows the mean resultant impact acceleration of
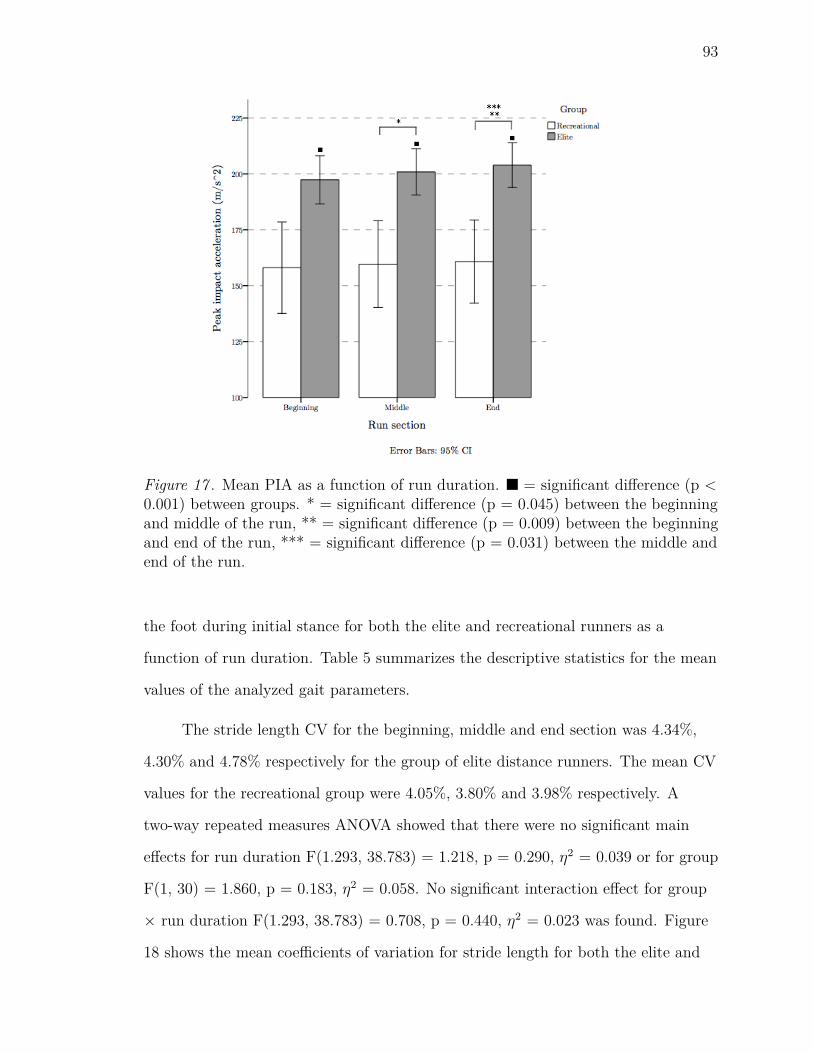
93
Figure 17 . Mean PIA as a function of run duration. n = significant difference (p <0.001) between groups. * = significant difference (p = 0.045) between the beginningand middle of the run, ** = significant difference (p = 0.009) between the beginningand end of the run, *** = significant difference (p = 0.031) between the middle andend of the run.
the foot during initial stance for both the elite and recreational runners as a
function of run duration. Table 5 summarizes the descriptive statistics for the mean
values of the analyzed gait parameters.
The stride length CV for the beginning, middle and end section was 4.34%,
4.30% and 4.78% respectively for the group of elite distance runners. The mean CV
values for the recreational group were 4.05%, 3.80% and 3.98% respectively. A
two-way repeated measures ANOVA showed that there were no significant main
effects for run duration F(1.293, 38.783) = 1.218, p = 0.290, η2 = 0.039 or for group
F(1, 30) = 1.860, p = 0.183, η2 = 0.058. No significant interaction effect for group
× run duration F(1.293, 38.783) = 0.708, p = 0.440, η2 = 0.023 was found. Figure
18 shows the mean coefficients of variation for stride length for both the elite and
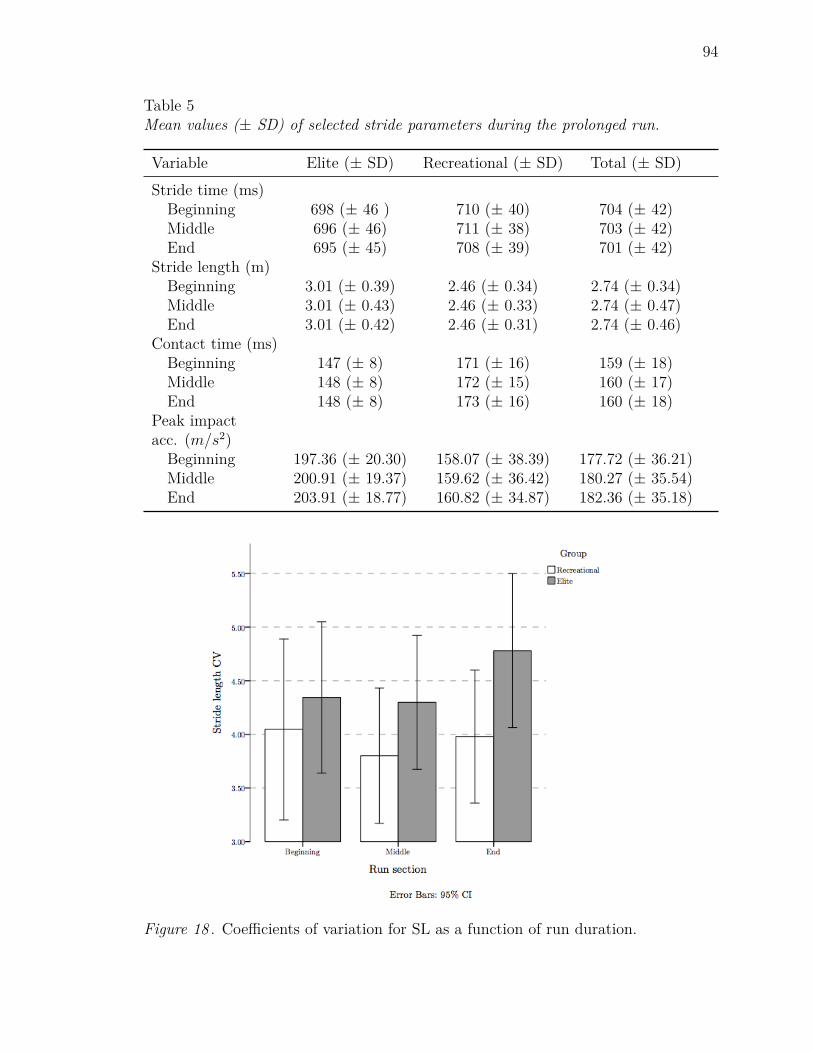
94
Table 5Mean values (± SD) of selected stride parameters during the prolonged run.
Variable Elite (± SD) Recreational (± SD) Total (± SD)Stride time (ms)Beginning 698 (± 46 ) 710 (± 40) 704 (± 42)Middle 696 (± 46) 711 (± 38) 703 (± 42)End 695 (± 45) 708 (± 39) 701 (± 42)
Stride length (m)Beginning 3.01 (± 0.39) 2.46 (± 0.34) 2.74 (± 0.34)Middle 3.01 (± 0.43) 2.46 (± 0.33) 2.74 (± 0.47)End 3.01 (± 0.42) 2.46 (± 0.31) 2.74 (± 0.46)
Contact time (ms)Beginning 147 (± 8) 171 (± 16) 159 (± 18)Middle 148 (± 8) 172 (± 15) 160 (± 17)End 148 (± 8) 173 (± 16) 160 (± 18)
Peak impactacc. (m/s2)Beginning 197.36 (± 20.30) 158.07 (± 38.39) 177.72 (± 36.21)Middle 200.91 (± 19.37) 159.62 (± 36.42) 180.27 (± 35.54)End 203.91 (± 18.77) 160.82 (± 34.87) 182.36 (± 35.18)
Figure 18 . Coefficients of variation for SL as a function of run duration.

95
Figure 19 . Coefficients of variation for ST as a function of run duration. n =significant difference (p = 0.007) between groups.
recreational runners as a function of running time.
The stride time CV for the beginning, middle and end section was 1.32%,
1.30% and 1.36% respectively for the group of elite distance runners, while the mean
CV values for the recreational group were 1.59%, 1.57% and 1.59% respectively. A
two-way repeated measures ANOVA did not find a significant main effect for run
duration F(2, 60) = 0.855, p = 0.430, η2 = 0.028. However, there was a significant
main effect for group F(1, 30) = 8.499, p = 0.007, η2 = 0.221. The interaction effect
for group × run duration F(2, 60) = 0.197, p = 0.797, η2 = 0.007 did not reach
statistical significance. Figure 19 shows the mean coefficients of variation for stride
time for both the elite and recreational runners as a function of running time.
The contact time CV for the beginning, middle and the end section was 4.06%,
3.96% and 4.05% respectively for the group of elite distance runners, while the CV
values for the recreational group were 4.46%, 4.33% and 4.45% respectively. A

96
Figure 20 . Coefficients of variation for tc as a function of run duration.
Figure 21 . Coefficients of variation for PIA as a function of run duration.

97
two-way repeated measures ANOVA did not reveal a significant main effect for run
duration F(1.449, 43.459) = 1.945, p = 0.165, η2 = 0.061 or group F(1, 30) = 1.681,
p = 0.205, η2 = 0.053. There was no interaction effect F(1.449, 43.459) = 0.031, p
= 0.931, η2 = 0.001. Figure 20 shows the mean coefficients of variation for contact
time for both the elite and recreational runners as a function of running time.
The peak impact acceleration CV for the beginning, middle and the end
sections was 14.88%, 15.05% and 15.17% respectively for the group of elite distance
runners, while the corresponding mean CV values for the recreational group were
15.98%, 15.81% and 15.87%. No significant main effects were found for run duration
F(1.350, 40.496) = 0.126, p = 0.799, η2 = 0.004 or group F(1, 30) = 0.977, p =
0.331, η2 = 0.032. There was no significant interaction effect F(1.350, 40.496) =
0.616, p= 0.484, η2 = 0.020. Figure 21 shows the mean coefficients of variation for
peak impact acceleration for both the elite and recreational runners as a function of
run duration. Table 6 summarizes the descriptive statistics for the coefficients of
variation of the analyzed gait parameters.
Mean α values for stride length were 0.89 (beginning), 0.74 (middle) and 0.77
(end) for the group of elite distance runners, while the mean α values for the
recreational group were 0.91, 0.81 and 0.77 respectively. A two-way repeated
measures ANOVA revealed a significant main effect for run duration F(2, 60) =
21.512, p < 0.001, η2 = 0.418. In contrast, the main effect for group F(1, 30) =
1.009, p = 0.323, η2 = 0.033 as well as the interaction effect for group × run
duration F(2, 60) = 1.408, p = 0.252, η2 = 0.045 did not reach statistical
significance. Pairwise comparisons with Bonferroni adjustments revealed that the α
of stride length differed significantly between the beginning and the middle of the
run (p < 0.001) as well as between the beginning and the end of the run (p <
0.001). However, there was no significant change between the middle and end of the
run. Figure 22 shows the mean α values for stride length for both the elite and

98
Table 6Coefficients of variation of selected stride parameters (± SD) during the prolongedrun.
Variable Elite (± SD) Recreational (± SD) Total (± SD)CV Stride timeBeginning 1.32 (± 0.18) 1.59 (± 0.31) 1.45 (± 0.29)Middle 1.30 (± 0.13) 1.57 (± 0.34) 1.43 (± 0.29)End 1.36 (± 0.19) 1.59 (± 0.38) 1.47 (± 0.32)
CV Stride lengthBeginning 4.34 (± 1.32) 4.05 (± 1.58) 4.20 (± 1.44)Middle 4.30 (± 1.17) 3.80 (± 1.18) 4.05 (± 1.18)End 4.78 (± 1.35) 3.98 (± 1.16) 4.38 (± 1.30)
CV Contact timeBeginning 4.06 (± 0.54) 4.46 (± 1.07) 4.26 (± 0.86)Middle 3.96 (± 0.53) 4.34 (± 1.06) 4.14 (± 0.84)End 4.05 (± 0.57) 4.46 (± 1.27) 4.25 (± 0.99)
CV peak impact acc.Beginning 15.87 (± 2.42) 15.98 (± 2.65) 15.43 (± 2.56)Middle 15.05 (± 2.45) 15.80 (± 2.80) 15.43 (± 2.61)End 15.17 (± 2.16) 15.87 (± 2.65) 15.52 (± 2.41)
Figure 22 . FSI α for SL as a function of run duration. * = significant difference (p< 0.001) between the beginning and middle of the run, ** = significant difference (p< 0.001) between the beginning and end of the run

99
Figure 23 . FSI α for ST as a function of run duration. * = significant difference (p< 0.001) between the beginning and middle of the run, ** = significant difference (p< 0.001) between the beginning and end of the run
recreational runners as a function of run duration.
Mean α values for stride time were 0.86 (beginning), 0.74 (middle) and 0.75
(end) for the group of elite distance runners, while the mean α values for the
recreational group were 0.84, 0.71 and 0.73 respectively. A two-way repeated
measures ANOVA revealed a significant main effect for run duration F(2, 60) =
28.536, p < 0.001, η2 = 0.487 but not for group F(1, 30) = 0.358, p = 0.554, η2 =
0.012. There was no significant interaction effect for group × run duration F(2, 60)
= 0.075, p = 0.928, η2 = 0.002. Pairwise comparisons with Bonferroni adjustments
revealed that α stride time differed significantly between the beginning and the
middle of the run (p < 0.001) as well as between the beginning and the end of the
run (p < 0.001). However, there was no significant change between the middle and
end of the run. Figure 23 shows the mean α values for stride time for both the elite
and recreational runners as a function of run duration.

100
Figure 24 . FSI α for PIA as a function of run duration. * = significant difference (p< 0.001) between the beginning and middle of the run, ** = significant difference (p< 0.001) between the beginning and end of the run
Mean (α) values for peak impact acceleration were 0.59 (beginning), 0.52
(middle) and 0.52 (end) for the group of elite distance runners, while the mean α
values for the recreational group were 0.64, 0.58 and 0.58 respectively. A two-way
repeated measures ANOVA revealed a significant main effect for run duration
F(1.823, 54.292) = 17.099, p < 0.001, η2 = 0.363 as well as for group F(1, 30) =
11.364, p = 0.002, η2 = 0.275. There was no significant interaction effect for group
× run duration F(1.823, 54.292) = 0.232, p = 0.774, η2 = 0.008. Pairwise
comparisons with Bonferroni adjustments revealed that the α of peak impact
acceleration differed significantly between the beginning and middle of the run (p <
0.001) as well as between the beginning and end of the run (p < 0.001). However,
there was no significant change between the middle and end of the run. Figure 24
shows the mean α values for peak impact acceleration for both the elite and
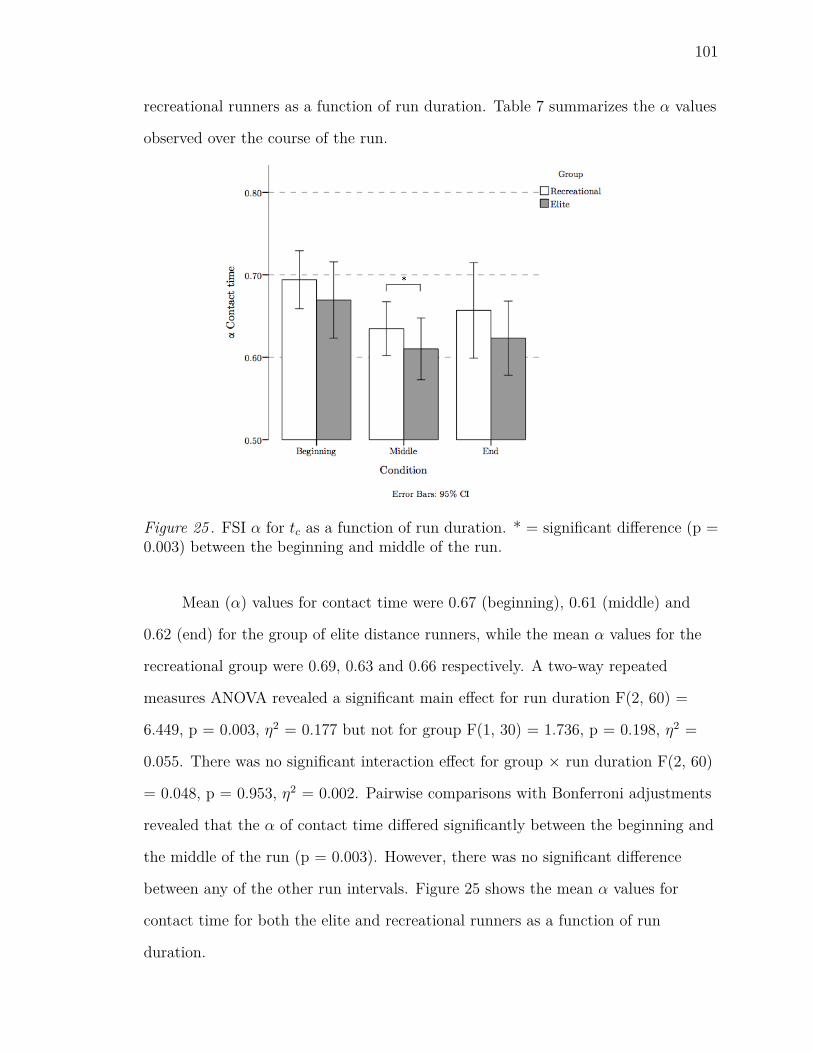
101
recreational runners as a function of run duration. Table 7 summarizes the α values
observed over the course of the run.
Figure 25 . FSI α for tc as a function of run duration. * = significant difference (p =0.003) between the beginning and middle of the run.
Mean (α) values for contact time were 0.67 (beginning), 0.61 (middle) and
0.62 (end) for the group of elite distance runners, while the mean α values for the
recreational group were 0.69, 0.63 and 0.66 respectively. A two-way repeated
measures ANOVA revealed a significant main effect for run duration F(2, 60) =
6.449, p = 0.003, η2 = 0.177 but not for group F(1, 30) = 1.736, p = 0.198, η2 =
0.055. There was no significant interaction effect for group × run duration F(2, 60)
= 0.048, p = 0.953, η2 = 0.002. Pairwise comparisons with Bonferroni adjustments
revealed that the α of contact time differed significantly between the beginning and
the middle of the run (p = 0.003). However, there was no significant difference
between any of the other run intervals. Figure 25 shows the mean α values for
contact time for both the elite and recreational runners as a function of run
duration.

102
Table 7α (± SD) of selected stride parameters during the prolonged run.
Variable Elite (± SD) Recreational (± SD) Total (± SD)α stride timeBeginning 0.86 (± 0.09) 0.84 (± 0.11) 0.85 (± 0.10)Middle 0.74 (± 0.11) 0.71 (± 0.14) 0.73 (± 0.12)End 0.75 (± 0.12) 0.73 (± 0.14) 0.74 (± 0.13)
α stride lengthBeginning 0.89 (± 0.15) 0.91 (± 0.14) 0.90 (± 0.14)Middle 0.74 (± 0.12) 0.81 (± 0.10) 0.77 (± 0.12)End 0.77 (± 0.08) 0.77 (± 0.13) 0.77 (± 0.11)
α contact timeBeginning 0.67 (± 0.09) 0.69 (± 0.07) 0.68 (± 0.08)Middle 0.61 (± 0.07) 0.63 (± 0.06) 0.62 (± 0.07)End 0.62 (± 0.08) 0.66 (± 0.11) 0.64 (± 0.10)
α peak impact accelerationBeginning 0.59 (± 0.08) 0.64 (± 0.09) 0.62 (± 0.09)Middle 0.52 (± 0.05) 0.58 (± 0.08) 0.55 (± 0.07)End 0.52 (± 0.04) 0.58 (± 0.05) 0.55 (± 0.05)
5.6 Discussion
The purpose of this study was to investigate the effects of a prolonged distance
run on stride parameters and gait variability in recreational and elite distance
runners using a single foot-mounted IMU. In particular, the means, coefficients of
variation and α values of stride time, stride length, contact time as well as peak
impact acceleration of the foot were calculated. It was hypothesized that α would
decrease significantly over the course of the run while no significant changes were
expected to be observed in the CV. It was further hypothesized that elite runners
would exhibit less changes in LRCs than recreational runners.
Our results show that the mean values for stride length (p = 0.908) and stride
time (p = 0.200) did not change significantly over time. Figure 26 shows a typical
stride time series over the course of the experiment. This is in contrast to existing
research that has reported changes in these parameters during prolonged treadmill

103
0 200 400 600720740760780
Beginning
0 200 400 600720740760780
Strid
etim
e(m
s) Middle
0 200 400 600720740760780
Stride number
End
Figure 26 . Example of stride time series over the course of the run.
and overground running (Bertram et al., 2013; Kyröläinen et al., 2000; Place et al.,
2004). Studies involving overground running have often reported a decrease in
running speed with progressive fatigue (Bertram et al., 2013; Nicol et al., 1991b).
Since running speed is the product of both SL and SR, it seems likely that the
changes reported in the literature are often a direct result of the fatigue-related
decreases in running speed. Thus, it is likely that the constant levels of stride length
and stride time that were observed in this experiment resulted from the fact that
the participants were paced with a wearable running computer. This observation is
also in accordance with Cavanagh and Williams (1982) and Mercer et al. (2002),
who reported that runners choose a preferred combination of SR and SL for a given
speed. Likewise, Meardon et al. (2011), who performed a similar experiment and
measured average stride time over the course of a fatiguing run, did not find any
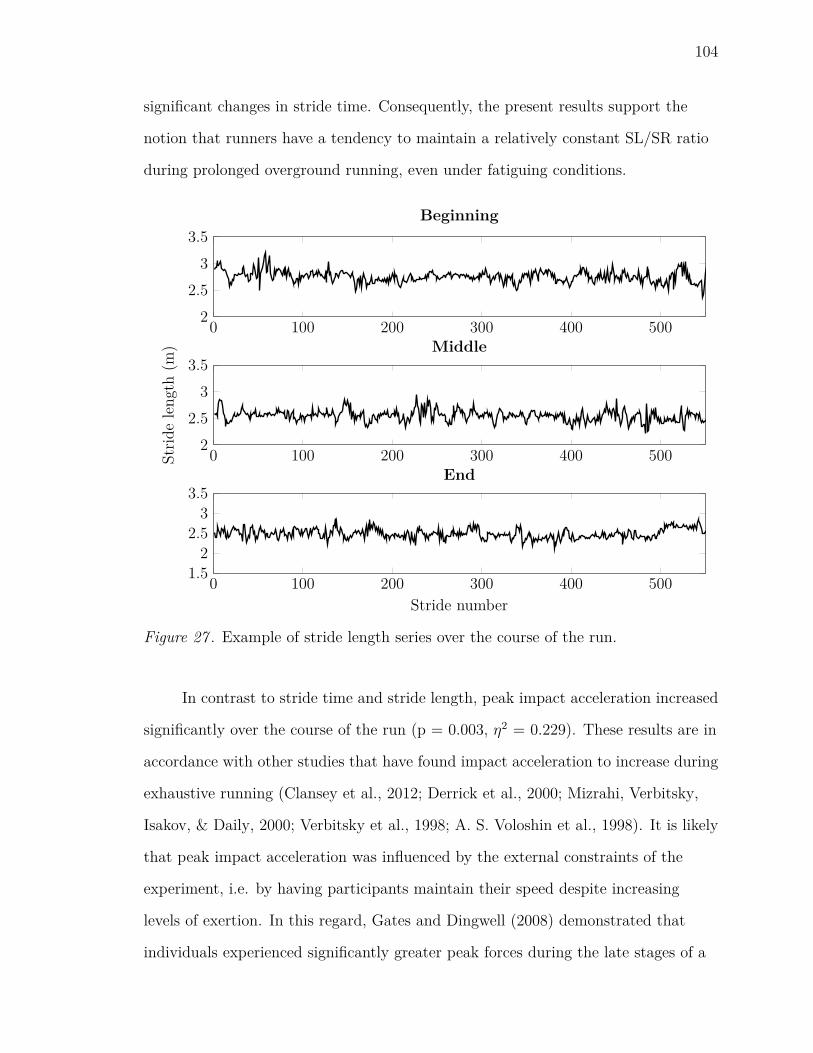
104
significant changes in stride time. Consequently, the present results support the
notion that runners have a tendency to maintain a relatively constant SL/SR ratio
during prolonged overground running, even under fatiguing conditions.
0 100 200 300 400 50022.5
33.5
Beginning
0 100 200 300 400 50022.5
33.5
Strid
eleng
th(m
) Middle
0 100 200 300 400 5001.52
2.53
3.5
Stride number
End
Figure 27 . Example of stride length series over the course of the run.
In contrast to stride time and stride length, peak impact acceleration increased
significantly over the course of the run (p = 0.003, η2 = 0.229). These results are in
accordance with other studies that have found impact acceleration to increase during
exhaustive running (Clansey et al., 2012; Derrick et al., 2000; Mizrahi, Verbitsky,
Isakov, & Daily, 2000; Verbitsky et al., 1998; A. S. Voloshin et al., 1998). It is likely
that peak impact acceleration was influenced by the external constraints of the
experiment, i.e. by having participants maintain their speed despite increasing
levels of exertion. In this regard, Gates and Dingwell (2008) demonstrated that
individuals experienced significantly greater peak forces during the late stages of a

105
repetitive movement task. Interestingly, the authors also noted that biomechanical
changes only occurred in such a way that the goal-relevant features of the task, i.e.
maintaining movement speed, were preserved. Since the primary goal of this
experiment was to maintain running speed for as long as possible, the increase in
peak impact acceleration could have resulted from limiting potential compensatory
movement strategies that may otherwise occur naturally in response to fatigue, e.g.
decreasing running speed. (Bertram et al., 2013; Kyröläinen et al., 2000).
Physiologically and mechanically, impact loading characteristics are known to
be affected by altered stiffness regulation in the lower limb via changes in muscle
preactivation levels, altered limb configuration at touchdown or a combination of
these factors (Derrick et al., 2000, 1998). For example, Challis (2001) demonstrated
that lower extremity geometry during initial contact influenced impact loading
during running. This is also supported by McMahon et al. (1987), who found that
greater knee flexion angles at impact are associated with reduced lower-extremity
stiffness and increased shock attenuation. It is reasonable to assume that the
observed increase in peak impact acceleration resulted from a combination of
different fatigue-related mechanisms, which in turn were influenced by the external
constraints of the experiment.
Runners also increased their contact time over the course of the run (p =
0.028, η2 = 0.133). This is consistent with other research that reported a
progressive increase of contact time with fatigue (Chan-Roper et al., 2012; Derrick
et al., 2002; Elliott & Roberts, 1980). Longer contact time has been associated with
the inability to effectively utilize elastic energy stored in the muscle-tendon
apparatus (Komi, 2000). More specifically, neuromuscular fatigue increases tc via
joint stiffness reduction (Mercer et al., 2002). Contact time has also repeatedly been
linked to the energy cost of running (Chapman et al., 2012; Kram & Taylor, 1990;
T. J. Roberts et al., 1998). Based on these studies, the increase in contact time may

106
indicate the tendency of the runners to expend more energy at the end of the run
compared to the beginning.
0 250 500 750
2
2.5
3
3.5
Stride number
Strid
ele
ngth
(m)
EliteRecreational
Figure 28 . Representative example of stride length series for elite and recreationalrunners.
There was a significant main effect for group with respect to mean stride
length (p < 0.001), mean contact time (p < 0.001) as well as mean peak impact
acceleration (p < 0.001). The observed magnitudes of effect sizes were large, with η2
values ranging from 0.349 (peak impact acceleration) to 0.512 (tc). More
specifically, the group of elite runners consistently produced longer stride lengths,
shorter contact times as well as higher peak impact accelerations (see Table 5).
Most biomechanical variables in running change significantly as a function of
running speed (Cavanagh & Kram, 1989; Luhtanen & Komi, 1978; Mero & Komi,
1985). In particular, Shorten and Winslow (1992) reported higher magnitudes of
impact accelerations at greater running speeds. Moreover, Brughelli et al. (2011)
observed decreases in stance or contact time (tc) at faster running speeds. As
expected, there was a significant difference between groups with respect to running

107
speed (p < 0.001). On average, elite runners performed the experiment at a speed
of 4.45 m/s compared to 3.54 m/s in the recreational group. Based on this evidence,
it is reasonable to conclude that elite runners demonstrated greater peak impact
acceleration, shorter contact times and greater stride lengths because they ran
faster. Given the fact that elite runners had a significantly lower body mass than
recreational runners, the observed difference in absolute peak impact acceleration
becomes even more relevant. Figure 28 shows the stride length series of a
recreational and an elite runner during the overground run.
The mean values of stride time (and consequently stride rate) did not exhibit
a significant group effect (p = 0.367). This seemingly contradicts reports that faster
running speeds are linked to increases in both stride length and stride rate.
However, it must be considered that the main determinant of speed in the
submaximal range (3 - 7 m/s) is stride length (Luhtanen & Komi, 1978; Weyand
et al., 2000). In contrast, stride time (and consequently stride rate) remains
constant at typical distance running speeds and only increases when a runner
approaches their maximal velocity (Bertram et al., 2013; Cavanagh & Kram, 1989;
Mero & Komi, 1985; Weyand et al., 2000). Given the results of previous studies, the
linear relationship between running speed and the two basic stride parameters SL
and SR was analyzed using Pearson’s r. As expected, very high correlations existed
between mean SL and running speed for all run intervals (Beg = 0.891, Mid =
0.883, End = 0.866), while SR was not significantly correlated with running speed
(Beg = -0.129, Mid = -0.133, End = -0.124). Figure 29a and 29b illustrate the
average stride rate and stride length values of each participant as a function of
running speed. In light of existing evidence, the present experiment demonstrates
that faster runners achieved greater speeds by taking longer strides while exhibiting
stride rates that are similar to those of the recreational runners. It is likely that the
ability to run with a greater stride length results from the high volume of
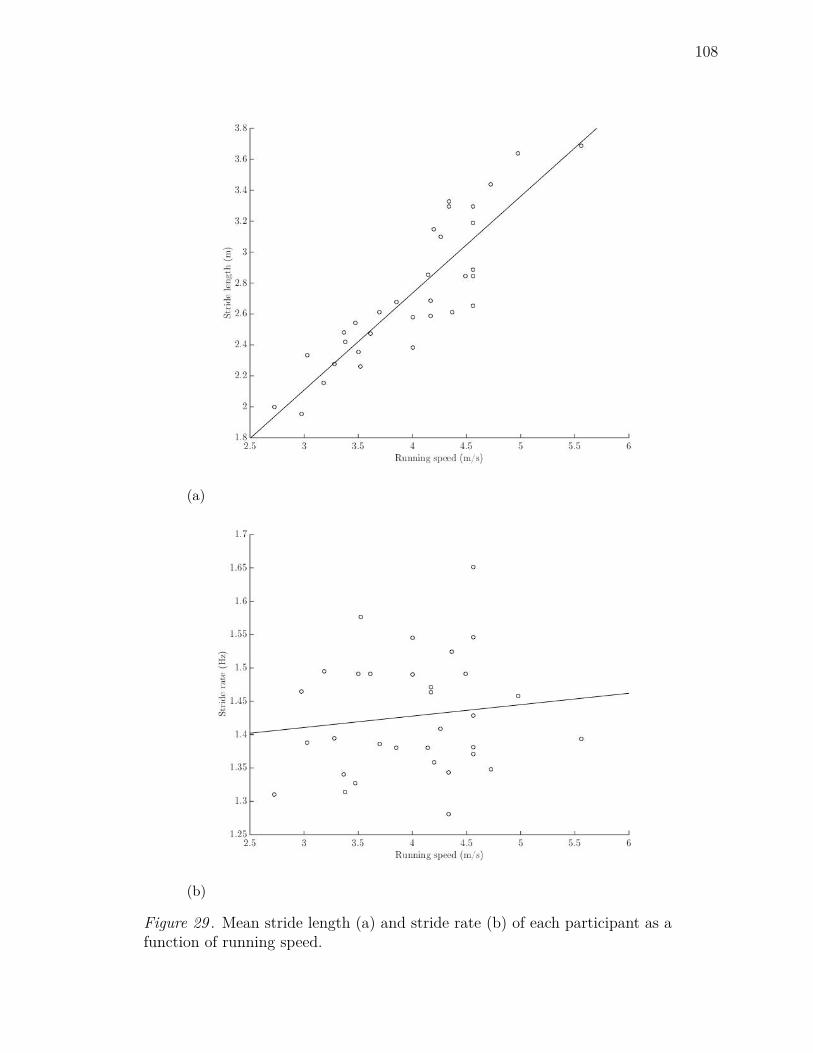
108
(a)
(b)
Figure 29 . Mean stride length (a) and stride rate (b) of each participant as afunction of running speed.
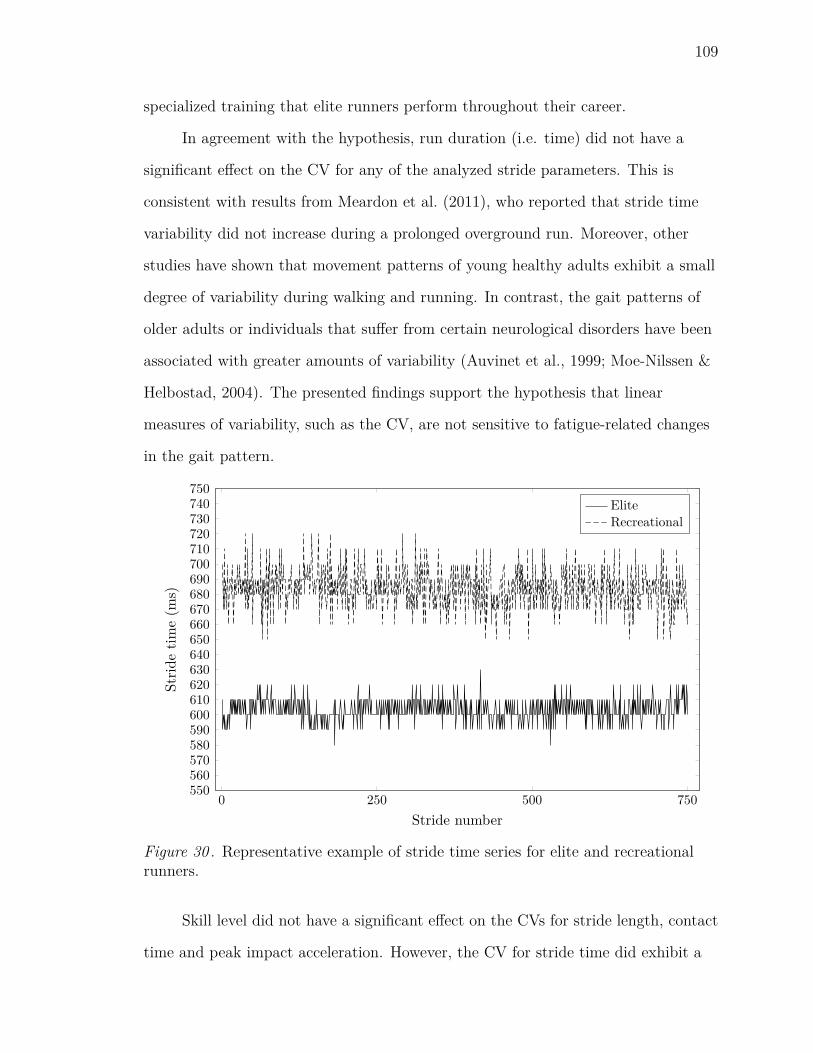
109
specialized training that elite runners perform throughout their career.
In agreement with the hypothesis, run duration (i.e. time) did not have a
significant effect on the CV for any of the analyzed stride parameters. This is
consistent with results from Meardon et al. (2011), who reported that stride time
variability did not increase during a prolonged overground run. Moreover, other
studies have shown that movement patterns of young healthy adults exhibit a small
degree of variability during walking and running. In contrast, the gait patterns of
older adults or individuals that suffer from certain neurological disorders have been
associated with greater amounts of variability (Auvinet et al., 1999; Moe-Nilssen &
Helbostad, 2004). The presented findings support the hypothesis that linear
measures of variability, such as the CV, are not sensitive to fatigue-related changes
in the gait pattern.
0 250 500 750550560570580590600610620630640650660670680690700710720730740750
Stride number
Strid
etim
e(m
s)
EliteRecreational
Figure 30 . Representative example of stride time series for elite and recreationalrunners.
Skill level did not have a significant effect on the CVs for stride length, contact
time and peak impact acceleration. However, the CV for stride time did exhibit a

110
significantly large effect for group (p = 0.007, η2 = 0.221). More specifically, the
stride time CV was significantly smaller for the elite runners than for the
recreational runners. This is in accordance with reports from Nakayama et al.
(2010) and Slawinski, Demarle, Koralsztein, and Billat (2001), who demonstrated
significantly lower stride time variability in trained endurance athletes compared to
untrained individuals. Figure 30 shows the different magnitudes of stride time
variability in recreational and elite runners. As is evident from Table 4, the elite
group spent an average of 9.31 hours per week running, compared to 2.43 hours in
the recreational group. It is highly likely that the observed group differences are
linked to the high volume of specialized training performed by the competitive
runners. A large number of studies have demonstrated that movement patterns
become more consistent as a result of extensive practice. For example, Button,
Macleod, Sanders, and Coleman (2003) reported greater movement consistency of
upper extremity motion in the basketball free throw with increasing skill level.
Likewise, Darling and Cooke (1987), Fujii, Kudo, Ohtsuki, and Oda (2009), T. Lee,
Swinnen, and Verschueren (1995) observed that trajectory variability, relative phase
alterations, as well as the variability of tapping interval in drumming decreased
significantly in response to extended practice.
Surprisingly, lower CV values for the elite group were only found in the stride
time interval but not in any other stride parameters. One possible explanation is
that stride rate is a critical determinant of energy expenditure during running and
therefore has a particular functional relevance to running performance. For
example, Cavanagh and Williams (1982) reported that the metabolic cost of
running for a given running speed is minimized at a particular SR. In this sense, the
larger CV observed in the recreational runners may indicate that these individuals
deviated to a greater degree from the most economical SR and consequently ran less
efficiently. In contrast, elite runners ran at a more steady pace (as indicated by a
111
lower CV), which minimized the metabolic cost of running and allowed them to
perform at a greater relative intensity. Based on these observations and existing
reports from the literature, it is highly likely that stride time CV is an important
marker of skill level and running economy in running.
Although some researchers have assessed LRC for ST during running (Jordan
et al., 2006; Meardon et al., 2011; Nakayama et al., 2010), the present experiment
was the first to assess LRCs for SL, contact time and peak impact acceleration
during a fatiguing overground run. Consistent with the hypothesis, it was found
that LRCs decreased significantly over the course of the run for all stride
parameters. There was a medium effect size for tc α (p = 0.003, η2 = 0.177), while
the effect sizes for stride length α (p < 0.001, η2 = 0.418), stride time α (p < 0.001,
η2 = 0.487) and peak impact acceleration α (p = 0.001, η2 = 0.363) were all found
to be large. Across groups, stride length α decreased from 0.90 at the beginning of
the run to 0.77 in the middle segment, while no change occurred between the middle
and end of the run. Stride time α was 0.85 in the beginning and dropped to 0.73 in
the intermediate run interval. It remained relatively constant for the rest of the run,
reaching a value of 0.74 in the final run interval. Contact time and peak impact
acceleration α were 0.68 and 0.62 respectively at the beginning as well as 0.62
(contact time) and 0.55 (peak impact acceleration) in the middle segment. No
significant changes occurred in these parameters between the middle and end run
interval. The LRCs of all investigated parameters followed the same pattern: After
initially displaying high relative values, α decreased sharply after the first run
interval and remained stable for the rest of the run. The percentage decrease in α
between the first two run intervals ranged from 14.4% (stride length) to 9.1%
(contact time). A strong reduction in α at an early stage was also reported by
Meardon et al. (2011), who assessed LRCs in the stride time interval during an
exhaustive overground run. This observation is particularly noteworthy because the

112
drop occurred well before the point of complete exertion was reached.
Currently, the exact meaning of LRCs during locomotion is still subject to
ongoing debate. Given that LRCs represent the degree of interdependency between
individual data points within a time series, weaker LRCs during running generally
indicate that the stride pattern becomes more random and consequently less
predictable (Jordan et al., 2007a). The majority of studies support the idea that a
reduction in α reflects the inability to maintain a stable motor output. For example,
reduced LRCs have been associated with neurological diseases, such as Huntington’s
or Parkinson’s disease (Goldberger et al., 2002; Hausdorff et al., 1997). Moreover,
older individuals are known to exhibit lower values of α during walking compared to
healthy, young adults (Kobsar et al., 2014). On the other hand, researchers have
proposed that lower values of α could be linked to increased flexibility and
adaptability of the neuromuscular system (Jordan et al., 2006, 2007a, 2007b;
Nakayama et al., 2010). Under this premise, lower values of α may indicate an
increase in the dynamical degrees of freedom, which provides an individual with
more solutions to execute a certain stride (Jordan et al., 2007a; Nakayama et al.,
2010). However, the fact that all of these experiments involved treadmill running
questions the significance of these results for unconstrained overground running.
Although the exact mechanisms that govern the emergence of LRCs in the stride
pattern remain elusive, the present experiment has clearly shown that α is reduced
as fatigue increases. Based on existing models of the physiological fatigue response,
it is reasonable to assume that reduced LRCs in the stride pattern reflect a loss of
system flexibility rather than increased adaptability. This has important
implications for health and performance because it potentially enables researchers to
monitor the persistence of gait parameters in real time and identify the point at
which the stride pattern reaches a critical level of irregularity. Sophisticated
algorithms that combine information regarding stride-to-stride fluctuations with

113
traditional biomechanical parameters could have the potential to effectively monitor
the accumulated training load and subsequently reduce the risk of overuse injuries.
Nonetheless, further research is needed to elucidate the meaning of LRCs in the
control of human movement and its complex interaction with aspects such as skill
level, fatigue and disease.
This experiment has also demonstrated that LRCs are present in gait variables
other than stride time and that stride-to-stride fluctuations can be measured with a
single foot-mounted IMU. This confirms reports by Jordan et al. (2007a), who found
persistent LRCs in variables such as stride/step time, stride/step length, contact
time and different GRF variables during treadmill running. However, although
LRCs were present in all of the analyzed stride parameters, the level of alpha
differed substantially between variables. The highest LRCs were found to exist in
stride length and stride time, with mean values of 0.81 and 0.77 respectively across
groups. In contrast, the average α for contact time was significantly lower (0.65).
The least persistent LRCs were found to exist in peak impact acceleration (0.57).
Mathematically, persistent long-range correlations will result in an α value that
ranges between 0.5 and 1.0. Studies have also shown that healthy young individuals
exhibit α values anywhere between 0.6 and 1.0 in the time series of different gait
variables (Hausdorff, 2007; Jordan et al., 2007a). In contrast, completely random
and uncorrelated time series produce an α value of 0.5 (Hausdorff et al., 1997, 1995;
Jordan et al., 2007b; Terrier et al., 2005). While the values of α for ST, SL and
contact time are similar to those reported in other studies, LRCs in peak impact
acceleration were substantially lower and approached the range that is characteristic
of white noise. The observation that the level of α was variable-dependent suggests
that the mechanism responsible for the emergence of LRCs does not affect all
biomechanical variables to the same degree. Consequently, parameters that are
more random and less self-organized, e.g. peak impact acceleration, are limited in

114
their ability to offer insight in the control mechanisms responsible for the temporal
organization of gait.
In contrast to other parameters, the LRCs of peak impact acceleration
exhibited a main effect for group. Since this study is the first to calculate α for peak
impact acceleration from a foot-mounted IMU, this observation should be
interpreted with caution. It must also be considered that α levels of peak impact
acceleration were substantially lower than those of the other stride parameters,
which signifies a greater random component within the time series and further
complicates its interpretation. The fact that no group differences were found in
other parameters suggests that persistent LRCs are an inherent feature of human
locomotion but do not show in all aspects of the gait pattern. Additional research is
required to elucidate the relationship between skill level and LRCs and different
classes of biomechanical variables.
When interpreting the results of this study, it is important to mention that
elite distance runners differed from recreational runners with respect to certain
subject and performance characteristics. Most importantly, elite runners completed
the run at a significantly faster speed than recreational runners (p < 0.001), which
was expected given the larger aerobic capacity and smaller body mass. In order to
allow the comparison of the individual data, the intensity at which the experimental
run was completed had to be normalized. Therefore, running speed for each
participant was chosen based on an individual marker of performance, i.e. their
most recent 5k race pace, and monitored during the run. It was also confirmed that
the level of fatigue experienced during the experiment was similar across
participants. For this purpose, heart rate was recorded during the run and
participants were asked to indicate their perceived level of exertion immediately
after completing the protocol (see Table 4 and Appendix G).
The recreational group ran for a significantly longer time than the elite
115
runners (p = 0.002). This difference is most likely a direct result of the experimental
protocol: Participants were instructed to run at their all-out 5k race pace. Based on
this constraint, runners were expected to reach complete exertion after
approximately 5000 m. Since faster runners are able to cover a greater distance in
less time, the elite group reached the point of exhaustion earlier than recreational
runners. As is evident from Table 4, both groups covered a comparable distance (p
= 0.204) and achieved similar levels of exertion at the end of the run (0.248).
5.7 Conclusion
The present experiment established that elite and recreational runners
increased their mean tc and peak impact acceleration over the course of a fatiguing
run, while no significant changes were observed in mean ST and SL. Significant main
effects for group existed for the mean values of SL, tc and peak impact acceleration.
It is likely that these differences were linked to the different running speeds at which
the groups completed the experiment. The results of this study also demonstrate
that persistent LRCs are present in gait parameters other than stride time during
overground running. The α values for stride length and stride time indicated a high
degree of temporal persistence, while tc and peak impact acceleration α exhibited
lower values. For SL, ST and tc, the observed range of α is comparable to those
reported by previous studies (Hausdorff, 2007; Jordan et al., 2006, 2007a, 2007b;
Meardon et al., 2011; Nakayama et al., 2010). It was further shown that LRCs
decreased significantly during the overground run, while the magnitude of variability
of the measured gait parameters remained constant. A possible explanation is that
α marks the onset of fatigue, which might have important clinical and
performance-related implications and open new ways to study fatigue during
continuous exercise. For example, individual α-thresholds might be used to indicate
when a runner’s stride pattern reaches a critical level of inconsistency. Future

116
research should explore if this information can help to reduce the accumulative
impact load and assist in preventing certain overuse injuries. LRCs did not differ
significantly between recreational and elite runners, which supports the assumption
that the mechanisms responsible for the emergence of LRC in the stride pattern are
not influenced by skill level and the high volume of training completed by the elite
distance runners. However, recreational and elite runners differed with respect to
their stride time CV, which suggests that it could be used as an indicator of skill
level in distance running. Given the potential benefits of wearable sensors for
movement analysis, the present study also demonstrated that a simple IMU-based
system is capable of measuring fatigue-related changes of different stride
parameters, their variability and LRCs in runners of different skill levels. This work
could potentially be extended to develop tools that allow athletes, coaches or
clinicians to obtain valuable information about running performance in real-time.

117
6 Study 3: The Effects of a Fatiguing Jump Protocol on Joint Stiffness,
Stride Kinematics, Variability and Long-Range Correlations in
Recreational and Elite Distance Runners
Prolonged distance running requires continuous muscular effort and eventually
leads to a decrease in performance. Although the underlying mechanisms of fatigue
and their effects on biomechanics are subject to ongoing debate, fatigue is known to
be a multifactorial phenomenon. High-intensity stretch-shortening cycle (SSC)
exercise, such as jumping, is an effective method to study fatigue because rather
than representing an isolated model, it takes into consideration mechanical, neural
and metabolic factors (Nicol & Komi, 2011). Research has established that SSC
fatigue induces delayed onset muscle soreness (DOMS), affects reflex activity, as
well as muscle mechanics and stiffness regulation of the neuromuscular system
(Komi, 2000; Kyröläinen et al., 2000; Nicol et al., 1991b, 1991c).
Many intrinsic and extrinsic factors influence the mechanical behavior of the
human body during running. However, several studies have demonstrated that
human running can be accurately simulated by a simple spring-mass model, which
is based on the property of a deformable body to store and return elastic energy
(Alexander, 1992; Blickhan, 1989; McMahon & Cheng, 1990). A fundamental
determinant of the spring-mass behavior in running is the stiffness of the leg spring.
(Dutto & Smith, 2002; Farley & González, 1996). In particular, the stiffness of a
joint is affected by the mechanical properties of the surrounding passive structures
as well as by the activation state of the muscles acting across that joint. It has
repeatedly been reported that joint stiffness decreases with progression of fatigue
(Horita et al., 1996; Kuitunen, Avela, et al., 2002; Rabita et al., 2013).
Fatigue-induced stiffness alterations have been linked to kinematic and kinetic
changes in running. For example, studies that have analyzed spring-mass
characteristics during exhaustive running found that decreases in stiffness were
118
correlated with changes in basic stride parameters (Dutto & Smith, 2002; Girard
et al., 2011; Rabita et al., 2013).
During walking and running, long range correlations (LRCs) are thought to
represent the temporal stability of the stride pattern (Hausdorff et al., 1997; Jordan
et al., 2007a). In a given data set, LRCs indicate the degree to which one particular
stride is correlated with other strides in the time series, even when they occur at a
considerable temporal distance. Early studies have shown that certain diseases of
the central nervous system, such as Huntington’s or Parkinson’s disease, cause
deterioration of LRCs during walking (Frenkel-Toledo et al., 2005; Hausdorff et al.,
1997). Moreover, imposing external constraints on the CNS, for example by pacing
a walk with a metronome, has been shown to reduce the strength of LRCs. Based
on this research, it has traditionally been thought that LRCs represent patterns
that emerge within the central nervous system.
In contrast, other researchers have argued that persistent stride-to-stride
fluctuations are the result of sensory feedback rather than representing highly
complex self-governing processes. For example, studies have demonstrated that the
strength of LRCs is affected by the quality of visual and proprioceptive feedback
(Collins & DeLuca, 1995; M. Riley, Balasubramaniam, & Turvey, 1997). In support
of these findings, Gates, Dingwell, and Su (2007) applied different levels of sensory
noise and feedback to a simple bipedal model with passive dynamic characteristics
and were able to reproduce persistent LRCs in the simulated stride time series.
Another study involving repetitive upper extremity reaching tasks showed that
LRCs in movement speed and timing errors approached the range of uncorrelated,
white noise (α = 0.5) after the onset of muscle fatigue, while the goal-relevant
features of the motor output, i.e. the accuracy of the movements, were maintained
(Gates & Dingwell, 2008). Additionally, a study involving exhaustive distance
running demonstrated that prolonged neuromuscular effort caused a reduction of

119
LRCs in the stride time interval (Meardon et al., 2011).
Considering the relationship between fatigue and joint stiffness (Horita et al.,
1996; Kuitunen, Avela, et al., 2002; Rabita et al., 2013) as well as the suspected link
between fatigue and LRCs (Gates & Dingwell, 2008; Meardon et al., 2011), there is
a need to analyze the effects of varying joint stiffness on stride pattern LRCs. To
date, however, no study has looked at how fatiguing high-intensity SSC exercise
affects the stride pattern variability. Consequently, this experiment employed a
fatiguing jump protocol to induce potential changes in joint stiffness, stride
kinematics, variability and LRCs during distance running. It was hypothesized that
a localized fatigue-response, as indicated by a decrease in joint stiffness, would be
associated with less temporal stability, i.e. reduced levels of α, while linear measures
of variability would remain unaffected.
A second objective of this study was to determine if a prolonged SSC protocol
affected the stride kinematics, variability and LRCs to a similar degree in a group of
elite distance runners and recreational runners. It was expected that both joint
stiffness and α would decrease to a lesser degree in the elite group compared to the
recreational group after completing the jump protocol.
6.1 Research Design
This study employed a two-way repeated measures design with skill level (elite
vs. recreational) and condition (pre-fatigue vs. post-fatigue) serving as independent
variables. It further involved two different experimental groups. One group
consisted of elite distance runners, while the other group contained individuals that
had not undergone training specific to distance running. Both groups participated
in the same experimental protocol, i.e. a fatiguing SSC protocol consisting of drop
jumps and countermovement jumps, that attempted to reduce ankle joint stiffness
(AJS) and knee joint stiffness (KJS). Prior to enrollment, all individuals provided

120
written consent in order to participate in the study.
Elite distance runners (n = 16) were recruited from the University of Regina
track and cross-country teams. All subjects in this group were required to have
performed regular distance running between 4 and 7 days per week for more than 2
years and competed at a provincial or intercollegiate level within the preceding year.
Furthermore, a personal best of 21:30 minutes (women) and 17:30 minutes (men) for
the 5000 m was required in order to be classified as an elite distance runner. These
times were established in accordance with the team requirements for the university
track and field team. Exclusion criteria for this group included a race time for the 5
km that was above the specified threshold; any history of lower-extremity surgery in
the past 24 months; any history of running-related injuries that caused
discontinuation of running for more than 7 days; any other neuromuscular or
cardiovascular pathology; or any other medical condition that could potentially be
worsened by prolonged running.
The group of recreational runners (n = 16) consisted of young, healthy adults.
These participants did not have any training specific to distance running. However,
recreational running for a time of up to 3 hours per week was allowed. Furthermore,
in order to be included in this group, individuals had to possess the ability to run at
a comfortable pace for a minimum of 15 minutes. The health-related exclusion
criteria were identical to those of the elite distance running group. Recruitment
occurred through university e-mail and poster advertisements. Prior to enrollment,
all participants signed a consent form that had previously been approved by the
University of Regina Ethics Board.
6.2 Instrumentation and Test Procedures
Participants were equipped with a wireless, 9 degree of freedom IMU,
consisting of a gyroscope, accelerometer and magnetometer (Xsens, MTw) on their

121
right foot. The IMU set-up and preparation procedures were identical to those
described in Sections 4.2 and 5.2.
In addition to the IMU, participants were equipped with a wrist-worn running
computer, a heart rate sensor, which was strapped around their chest, and an
associated footpod, which was attached to their left foot (RS300X, Polar, Kempele,
Finland). This system continuously monitored heart rate, speed and distance
covered during the run. It has previously been used to control for running speed
(Meardon et al., 2011) and was shown to yield valid and reliable data (Hausswirth,
2009).
Calibration of the running computer and the associated foot pod was
performed according to the instructions of the manufacturer. This required the
participants to run a certain predefined distance at a self-selected running speed.
After standing still for several seconds, participants started the calibration
procedure by pushing the start/stop button on the wrist-worn running computer
and initiating the run with their left leg, i.e. the side to which the commercial
footpod was attached. For the calibration, participants ran for a distance of 1100 m
on the outermost lane of the indoor track. Since one lap in this lane was 218 m, the
participants were asked to complete five full laps and an additional distance of 10
m. The researcher stood next to the track and indicated the point at which the
runners had to come to a full stop after the required distance was covered. After
completing the run, the participants had to stand still and wait for 10-15 seconds,
so the data could be transmitted from the footpod to the wrist-worn computer. The
calibration run also served as a warm up for the experimental protocol. However, if
participants indicated that they wanted to perform additional warm-up activities,
they were given the opportunity to do so, provided that these activities were
non-fatiguing. During the warm-up run, the quality of the wireless connection
between the foot-mounted IMU and the docking station over the range of the indoor

122
track as well as the characteristics of the inertial signal were monitored. If
abnormalities were detected, the position of the sensor on the foot was improved
and the radio channel was changed.
Following the warm up, the researcher reset the running computer and started
recording the inertial signals from the wireless foot-mounted IMU. Subsequently,
participants positioned themselves at the starting line on the outermost lane of the
indoor track. Participants were instructed to run in a counterclockwise direction at
a steady, comfortable running speed for a period of 8 minutes. This time interval
has been used previously to establish LRCs in running (Jordan et al., 2006) and is
above the minimum time of 6 minutes, which was recommended by Hausdorff
(2007). After a brief countdown, the researcher and the participant simultaneously
started timing the run, on a stop watch and the running computer respectively. The
researcher controlled the running speed of the participants by monitoring each
individual lap time and providing instructions as required.
After completing the overground run, participants went to the biomechanics
lab (Figure 7), which was located in close proximity to the indoor track, to assess
ankle and knee joint stiffness at baseline, i.e. before performing the fatiguing SSC
protocol, using GRF and 3-D motion capture data. As a first step, the following
anthropometric variables were measured: body mass, height, as well as leg length,
knee width, and ankle width of both legs. Subsequently, reflective markers (5 mm)
were placed on both lower limbs as well as on the pelvis. All markers were placed
according to the plug-in gait configuration (Figure 31): heel, distal head of the
second metatarsal, lateral malleolus, lower third of the lateral surface of the tibia,
lateral epicondyle of the knee, lower third of the lateral surface of the thigh,
posterior superior iliac spine (PSIS) and anterior superior iliac spine (ASIS).
Immediately before applying the markers, the sites were cleaned with alcohol swabs
and shaved if necessary. Afterwards, the anthropometric data was entered into the

123
Figure 31 . Marker setup for plug-in gait model. Reproduced from Oxford MetricsPlug-in-gait marker placement manual. Permission granted via open-access license.
motion capture software (Nexus v.1.8, Vicon, Denver, CO) in order to create a
kinematic model for each participant. Next, a static calibration trial was recorded,
which required the participants to stand still and maintain the anatomical position
for about 1 - 3 seconds.
After applying the markers, each participant performed a series of 10 - 15
short (15 m) runs through the calibrated volume of the 3D motion capture system
(T-Series, Vicon, Denver, CO), with the specific goal of hitting a force-plate (AMTI,
Watertown, MA) with their right foot during each trial. Participants were asked to
replicate the speed at which they previously performed the overground run. To
obtain representative data they were further instructed to run naturally and avoid
adjusting their stride in order to hit the force plate. To maximize the chances of
correctly hitting the force plate, an optimal starting position was determined for
each participant based on a series of practice runs. This position was marked on the

124
floor with adhesive tape. Following the runs, all subjects completed a fatiguing jump
protocol that attempted to reduce joint stiffness by decreasing the level of muscular
co-contraction in the ankle and knee joints. In order to minimize cardiovascular and
maximize localized fatigue, this study employed a short-duration jump protocol
instead of long-duration SSC exercise. High-intensity fatiguing SSC exercise has
been used before to induce significant reductions in stiffness (Avela & Komi, 1998b;
Kuitunen, Avela, et al., 2002; Nicol, Komi, Horita, Kyröläinen, & Takala, 1996).
Before performing the fatiguing jumps, participants were dropped from
progressively greater starting heights to determine their optimal drop height, i.e.
the height that produced the best vertical jump performance. Maximal jump height
was calculated based on the vertical displacement of the right ASIS marker
compared to its height during the static calibration trial. The fatigue protocol of
this study was similar to that described by Kuitunen, Avela, et al. (2002). It
consisted of 100 single maximal drop jumps from the optimal drop height, with one
jump being performed every 5 seconds. The participants stood on a box and took a
step forward with their right foot, thereby initiating free fall. They were instructed
to land with both feet simultaneously and rebound quickly, while trying to jump as
high as possible. After each jump, participants immediately turned around and
stepped back onto the box using a small pedestal.
After completing the drop jumps, participants were asked to continuously
jump in place with maximal effort until they could no longer reach 70% of their
maximal jump height. Height was assessed with the motion capture system. The
researcher previously calculated the 70% threshold based on the displacement of the
right ASIS marker during the maximal jump performance. For all jumps, the use of
arms to increase jump height was prevented by holding a light stick, which was
placed across the participants’ shoulders.
Within five minutes after completing the jumps, participants performed

125
another set of 10-15 short (15 m) runs through the calibrated space of the 3D
motion capture system to reevaluate knee, ankle and leg stiffness. If any markers
became detached during the jumps, they were reapplied before the runs. In this
case, another short calibration trial had to be performed. About ten minutes after
the jump protocol, stride kinematics, variability and LRCs were reassessed with the
foot mounted IMU during another 8-minute overground run on the indoor track. To
ensure that the running speed was identical to that of the pre-jump condition, the
average running speed of the baseline run was entered into the running computer.
Once participants increased or decreased their running speed out of a tolerable
range (± 5% average running speed at baseline), the computer triggered an audible
alarm, thereby notifying the participants to adjust their running speed.
6.3 Data Analysis
Before conducting any further analysis, the raw data collected by the
foot-mounted IMU was preprocessed and reduced. The first minute of every
overground run was removed to avoid potential inconsistencies in the signals that
may have occurred due to an irregular running pace before the participants found
their predetermined running speed. Furthermore, a custom-written MATLAB
program was used to assess the periodicity of the inertial signals. Aperiodic or weak
periodic sections that may have occurred due to weak signal reception or aberrant
movements were excluded from the analysis.
After the preprocessing procedures, custom programs written in MATLAB (v.
R2012a, The MathWorks, Natick, MA) were used to process and analyze the data
collected with the foot-mounted IMU. The following dependent variables were
calculated using MATLAB scripts:
1. Stride time was defined as the interval between two subsequent footfalls of
the same foot. The stance identification was based on the resultant
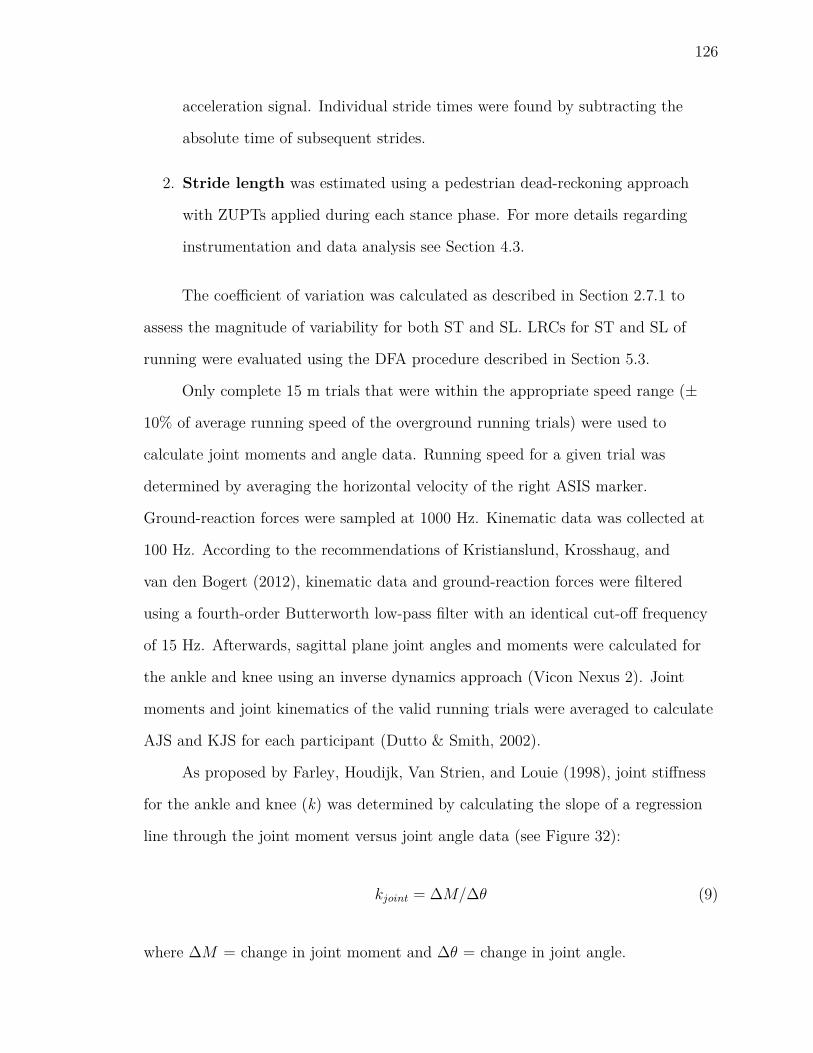
126
acceleration signal. Individual stride times were found by subtracting the
absolute time of subsequent strides.
2. Stride length was estimated using a pedestrian dead-reckoning approach
with ZUPTs applied during each stance phase. For more details regarding
instrumentation and data analysis see Section 4.3.
The coefficient of variation was calculated as described in Section 2.7.1 to
assess the magnitude of variability for both ST and SL. LRCs for ST and SL of
running were evaluated using the DFA procedure described in Section 5.3.
Only complete 15 m trials that were within the appropriate speed range (±
10% of average running speed of the overground running trials) were used to
calculate joint moments and angle data. Running speed for a given trial was
determined by averaging the horizontal velocity of the right ASIS marker.
Ground-reaction forces were sampled at 1000 Hz. Kinematic data was collected at
100 Hz. According to the recommendations of Kristianslund, Krosshaug, and
van den Bogert (2012), kinematic data and ground-reaction forces were filtered
using a fourth-order Butterworth low-pass filter with an identical cut-off frequency
of 15 Hz. Afterwards, sagittal plane joint angles and moments were calculated for
the ankle and knee using an inverse dynamics approach (Vicon Nexus 2). Joint
moments and joint kinematics of the valid running trials were averaged to calculate
AJS and KJS for each participant (Dutto & Smith, 2002).
As proposed by Farley, Houdijk, Van Strien, and Louie (1998), joint stiffness
for the ankle and knee (k) was determined by calculating the slope of a regression
line through the joint moment versus joint angle data (see Figure 32):
kjoint = ∆M/∆θ (9)
where ∆M = change in joint moment and ∆θ = change in joint angle.

127
Figure 32 . Calculation of joint stiffness for running. Stiffness (k) is represented bythe slope of the dashed line.
Additionally, each runner’s maximal heart rate was estimated using the
Tanaka formula shown in Equation 8. Heart rate was collected continuously during
the overground runs and calculated as a percentage of the maximal heart rate. This
was done in order to estimate the level of cardiovascular exertion during the pre-
and post-jump overground runs.
6.4 Statistical Analysis
Independent samples t-tests between the two groups were performed for each
of the following variables: age (years), body mass (kg), height (cm) and leg length
(cm). Additionally, paired samples t-tests were conducted to assess differences
between the pre- and post-jump condition: average running speed of the overground
runs (m/s), average heart rate during the overground runs, average speed of the
running trials that were used to calculate joint stiffness (m/s). A two-way repeated
measures ANOVA was conducted for each of the dependent variables (AJS, KJS,

128
mean stride time, mean stride length, CV stride time, CV stride length, α stride
time, α stride length) to examine the effect of the within-subject independent
variable (pre-jump vs. post-jump [2 levels]) and the between-subject independent
variable (group [2 levels]). In addition to examining the main effects for both skill
level and condition, the ANOVA also provided information about potential
interaction effects. Before conducting any statistical tests, all data sets were
assessed for normality using the Shapiro-Wilks test. If necessary, non-normally
distributed data was log transformed before conducting any further analysis.
Homoscedasticity was assessed using Levene’s test for equality of variances.
6.5 Results
Table 8Characteristics of the different study groups (Elite vs. Recreational).
Variable Elite (± SD) Recreational (± SD) p-valueAge (years) 22.56 (± 3.31) 27.81 (± 4.72) 0.001*Height (cm) 176.94 (± 8.01) 171.88 (± 8.36) 0.090Bodymass (kg) 64.19 (± 9.54) 69.52 (± 11.87) 0.172Leg Length (cm) 82.81 (± 3.79) 79.68 (± 5.51) 0.071* Indicates significant difference between groups (p ≤ 0.05)
Independent samples t-tests revealed that there was a significant age difference
between the two groups. Elite runners had a mean age of 22.56 (± 3.31) years,
while recreational runners were 27.81 (± 4.72) years on average. Elite runners
performed the overground runs as well as the linear runs in the lab at a significantly
greater running speed than recreational runners. However, the average running
speeds of the overground runs did not differ significantly from the speeds of the
linear runs in the biomechanics lab across participants for the pre- and post-jump
condition. Paired samples t-tests further revealed that mean heart rate during the
overground run was significantly higher after the participants had completed the
fatiguing jump protocol compared to the pre-jump condition. Subject

129
Table 9Descriptives for the pre- and post-jump overground runs on the indoor track.
Variable Pre-Jump (± SD) Post-Jump (± SD)Running Speed Lab (m/s) 3.80 (± 0.38) 3.86 (± 0.39)Elite 4.13 (± 0.47) 4.19 (± 0.49)Recreational 3.48 (± 0.28) a 3.53 (± 0.29) a
Running Speed Track (m/s) 3.59 (± 0.44) 3.64 (± 0.49)Elite 3.85 (± 0.38) 3.91 (± 0.43)Recreational 3.33 (± 0.32) a 3.36 (± 0.32) a
% of HRmax (track run) 80.53 (± 5.35) 85.48 (± 5.80) b
Elite 78.33 (± 5.79) 82.92 (± 6.47)Recreational 82.72 (± 3.92) a 88.04 (± 3.70) a
a Indicates significant difference between groups (p ≤ 0.05) .b Indicates significant difference between conditions (p ≤ 0.05)
characteristics and the descriptive statistics for the pre- and post-jump test
procedures are shown in Table 8 and Table 9, respectively.
Elite runners exhibited mean AJS values of 0.133 Nm/kg/◦ (pre-jump) and
0.127 Nm/kg/◦ (post-jump), while the mean ankle stiffness of the recreational group
was 0.153 Nm/kg/◦ and 0.136 Nm/kg/◦ respectively (Figure 33). A two-way
repeated measures ANOVA revealed a significant ordinal interaction effect (i.e. lines
have similar trend but do not cross) for group × condition F(1,30) = 4.508, p =
0.042, η2 = 0.131, suggesting that the jump protocol affected the AJS of elite and
recreational runners to a different degree. There was also a significant main effect
for condition F(1,30) = 20.011, p < 0.001, η2 = 0.400 but not for group F(1,30) =
0.558, p = 0.461, η2 = 0.018. Follow up paired samples t-tests showed that the
recreational group exhibited a significant difference in AJS between the pre- and
post-jump condition (p < 0.001), while AJS did not differ significantly between
conditions in the elite group (p = 0.162).
Elite runners exhibited mean KJS values of 0.092 Nm/kg/◦ (pre-jump) and
0.090 Nm/kg/◦ (post-jump), while the mean KJS of the recreational group was
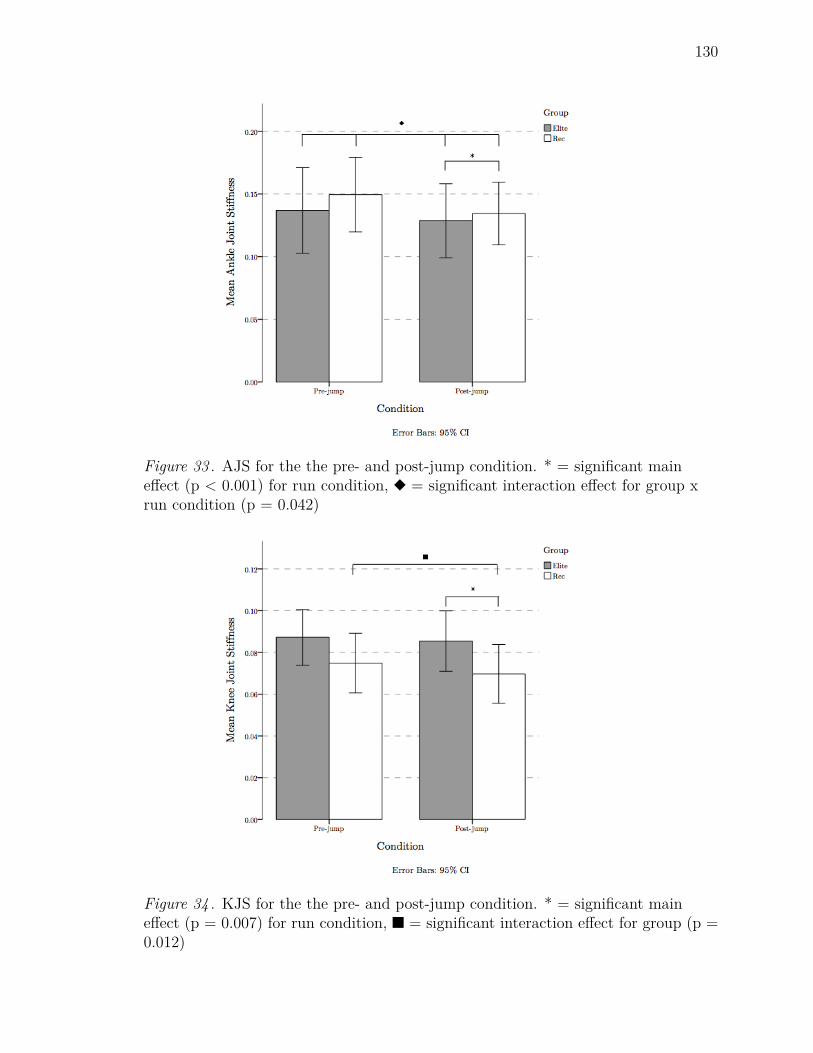
130
Figure 33 . AJS for the the pre- and post-jump condition. * = significant maineffect (p < 0.001) for run condition, u = significant interaction effect for group xrun condition (p = 0.042)
Figure 34 . KJS for the the pre- and post-jump condition. * = significant maineffect (p = 0.007) for run condition, n = significant interaction effect for group (p =0.012)
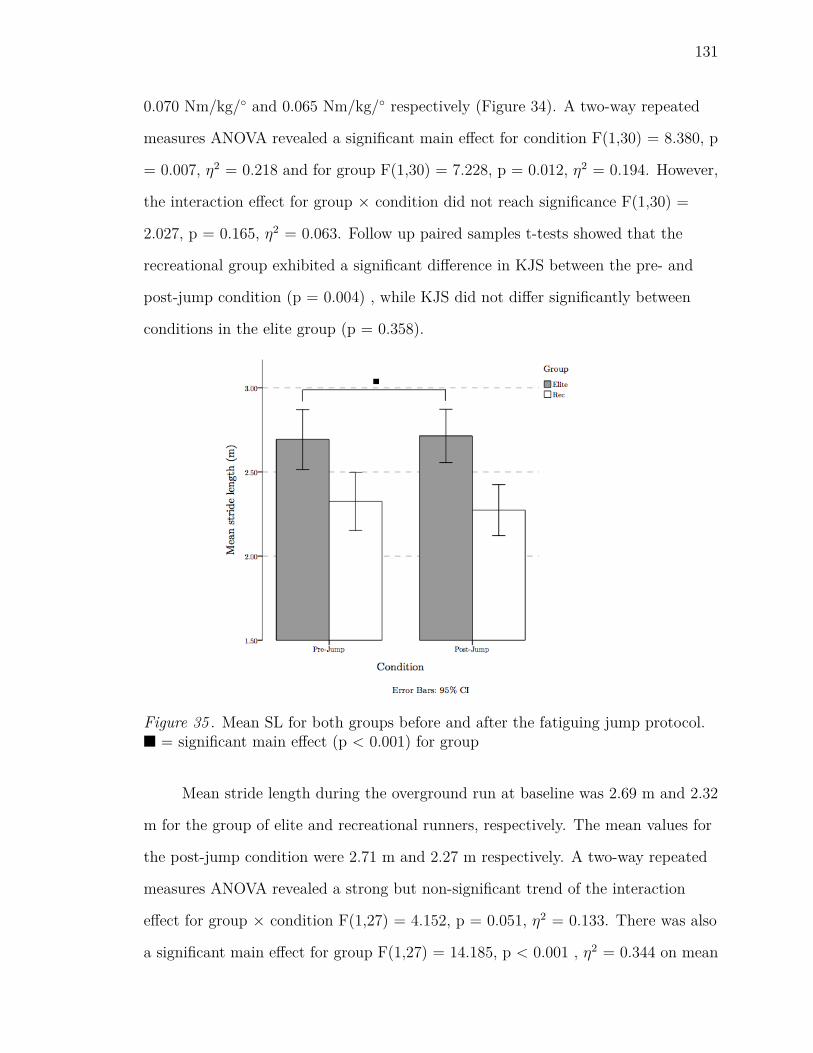
131
0.070 Nm/kg/◦ and 0.065 Nm/kg/◦ respectively (Figure 34). A two-way repeated
measures ANOVA revealed a significant main effect for condition F(1,30) = 8.380, p
= 0.007, η2 = 0.218 and for group F(1,30) = 7.228, p = 0.012, η2 = 0.194. However,
the interaction effect for group × condition did not reach significance F(1,30) =
2.027, p = 0.165, η2 = 0.063. Follow up paired samples t-tests showed that the
recreational group exhibited a significant difference in KJS between the pre- and
post-jump condition (p = 0.004) , while KJS did not differ significantly between
conditions in the elite group (p = 0.358).
Figure 35 . Mean SL for both groups before and after the fatiguing jump protocol.n = significant main effect (p < 0.001) for group
Mean stride length during the overground run at baseline was 2.69 m and 2.32
m for the group of elite and recreational runners, respectively. The mean values for
the post-jump condition were 2.71 m and 2.27 m respectively. A two-way repeated
measures ANOVA revealed a strong but non-significant trend of the interaction
effect for group × condition F(1,27) = 4.152, p = 0.051, η2 = 0.133. There was also
a significant main effect for group F(1,27) = 14.185, p < 0.001 , η2 = 0.344 on mean

132
Figure 36 . Mean ST for both groups before and after the fatiguing jump protocol. *= significant main effect (p < 0.001) for run condition
stride length. In contrast, no significant main effect was found for condition F(1,27)
= 0.694, p = 0.412, η2 = 0.025. Follow up paired samples t-tests showed that mean
stride length was not significantly different between the pre- and post-jump
condition for either the elite (p = 0.332) or the recreational group (p = 0.1).
The group of elite runners decreased their stride time from 0.715 s at baseline
to 0.706 s in the post-jump condition, while the group of recreational runners
decreased their stride time from 0.701 s (pre-jump) to 0.692 s (post-jump). A
two-way repeated measures ANOVA revealed a significant main effect for test
condition on mean stride time F(1,27) = 24.606, p < 0.001, η2 = 0.477. In contrast,
the main effect for group F(1,27) = 0.003, p = 0.957, η2 < 0.001 as well as the
interaction effect for group × condition F(1,27) = 0.621, p = 0.438, η2 = 0.022 was
non-significant. Figures 35 and 36 show the mean SL and ST values (pre-jump vs.
post-jump) for both the elite and recreational runners.
Furthermore, a two-way repeated measures ANOVA was conducted to
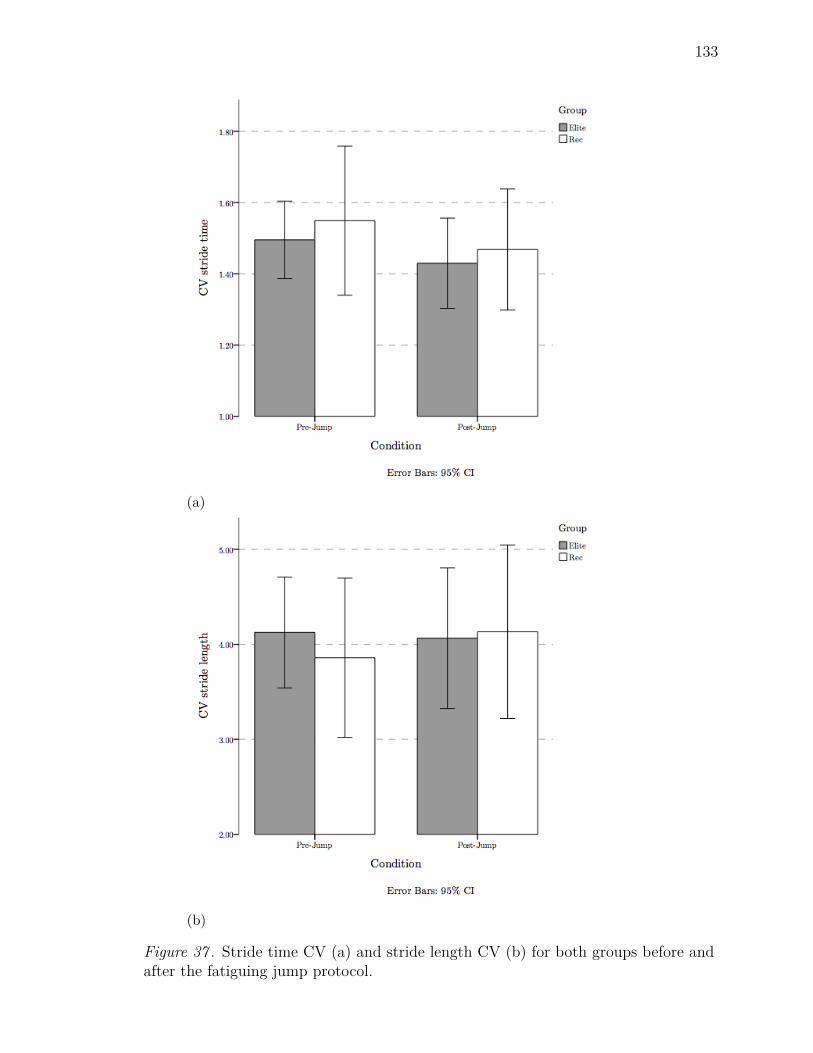
133
(a)
(b)
Figure 37 . Stride time CV (a) and stride length CV (b) for both groups before andafter the fatiguing jump protocol.
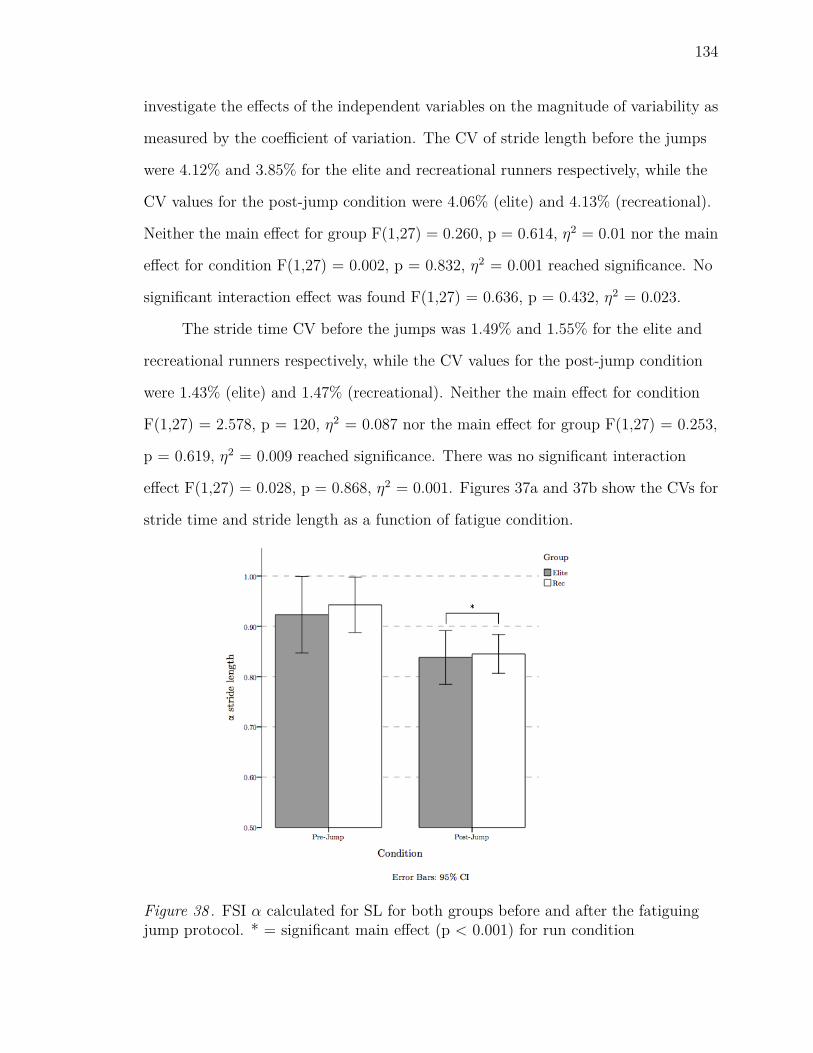
134
investigate the effects of the independent variables on the magnitude of variability as
measured by the coefficient of variation. The CV of stride length before the jumps
were 4.12% and 3.85% for the elite and recreational runners respectively, while the
CV values for the post-jump condition were 4.06% (elite) and 4.13% (recreational).
Neither the main effect for group F(1,27) = 0.260, p = 0.614, η2 = 0.01 nor the main
effect for condition F(1,27) = 0.002, p = 0.832, η2 = 0.001 reached significance. No
significant interaction effect was found F(1,27) = 0.636, p = 0.432, η2 = 0.023.
The stride time CV before the jumps was 1.49% and 1.55% for the elite and
recreational runners respectively, while the CV values for the post-jump condition
were 1.43% (elite) and 1.47% (recreational). Neither the main effect for condition
F(1,27) = 2.578, p = 120, η2 = 0.087 nor the main effect for group F(1,27) = 0.253,
p = 0.619, η2 = 0.009 reached significance. There was no significant interaction
effect F(1,27) = 0.028, p = 0.868, η2 = 0.001. Figures 37a and 37b show the CVs for
stride time and stride length as a function of fatigue condition.
Figure 38 . FSI α calculated for SL for both groups before and after the fatiguingjump protocol. * = significant main effect (p < 0.001) for run condition
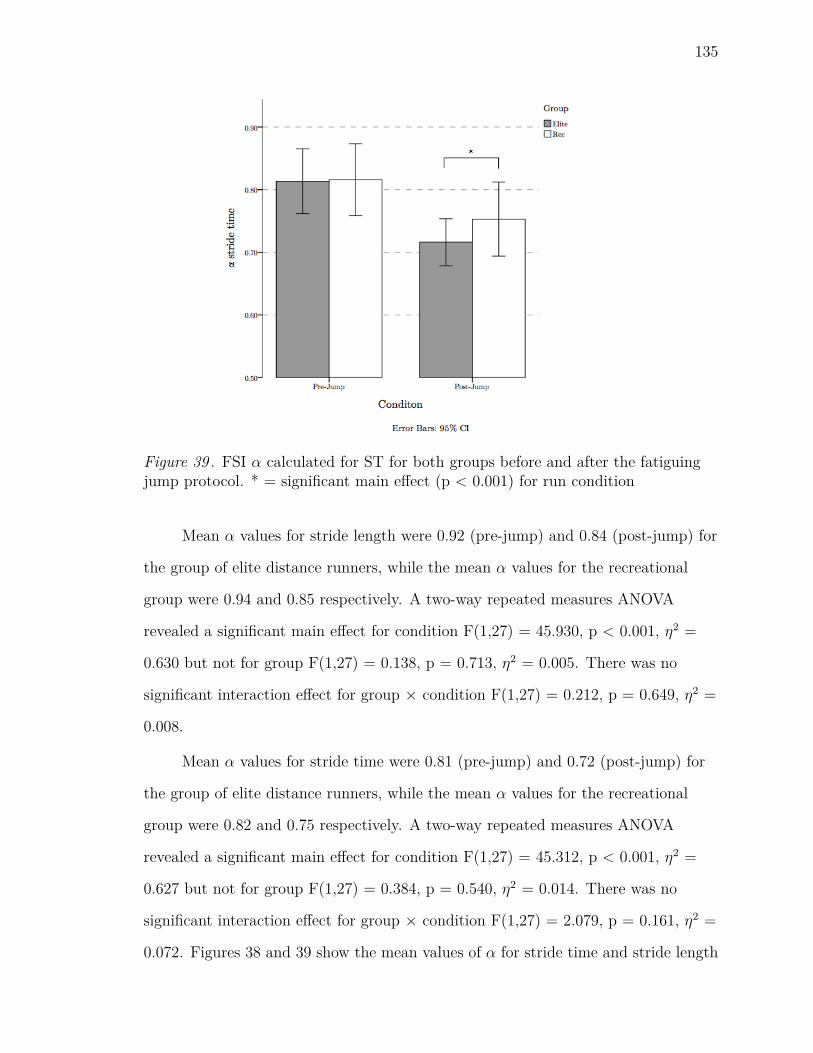
135
Figure 39 . FSI α calculated for ST for both groups before and after the fatiguingjump protocol. * = significant main effect (p < 0.001) for run condition
Mean α values for stride length were 0.92 (pre-jump) and 0.84 (post-jump) for
the group of elite distance runners, while the mean α values for the recreational
group were 0.94 and 0.85 respectively. A two-way repeated measures ANOVA
revealed a significant main effect for condition F(1,27) = 45.930, p < 0.001, η2 =
0.630 but not for group F(1,27) = 0.138, p = 0.713, η2 = 0.005. There was no
significant interaction effect for group × condition F(1,27) = 0.212, p = 0.649, η2 =
0.008.
Mean α values for stride time were 0.81 (pre-jump) and 0.72 (post-jump) for
the group of elite distance runners, while the mean α values for the recreational
group were 0.82 and 0.75 respectively. A two-way repeated measures ANOVA
revealed a significant main effect for condition F(1,27) = 45.312, p < 0.001, η2 =
0.627 but not for group F(1,27) = 0.384, p = 0.540, η2 = 0.014. There was no
significant interaction effect for group × condition F(1,27) = 2.079, p = 0.161, η2 =
0.072. Figures 38 and 39 show the mean values of α for stride time and stride length

136
as a function of fatigue condition.
Table 10Values of the dependent variables for the pre- and post-jump condition.
Variable (± SD) Pre-Jump (± SD) Post-Jump (± SD)Mean AJS (Nm/kg/◦) 0.143 (± 0.059) 0.132 (0.051 ± ) b
Elite 0.133 (± 0.061) 0.127 (± 0.050)Recreational 0.153 (± 0.059) 0.136 (± 0.052)
Mean KJS (Nm/kg/◦) 0.081 (± 0.026) 0.078 (± 0.028) b
Elite 0.092 (± 0.026) 0.090 (± 0.029)Recreational 0.070 (± 0.022) a 0.065 (± 0.020) a
Mean stride time (s) 0.708 (± 0.046) 0.700 (± 0.046) b
Elite 0.715 (± 0.057) 0.706 (± 0.054)Recreational 0.701 (± 0.033) 0.693 (± 0.035)
Mean stride length (m) 2.515 (± 0.358) 2.501 (± 0.351)Elite 2.693 (± 0.321) 2.714 (± 0.286)Recreational 2.324 (± 0.299) a 2.273 (± 0.262) a
Stride time CV (%) 1.521 (± 0.285) 1.448 (± 0.258)Elite 1.495 (± 0.197) 1.430 (± 0.228)Recreational 1.549 (± 0.362) 1.468 (± 0.294)
Stride length CV (%) 3.996 (± 1.246) 4.097 (± 1.433)Elite 4.125 (± 1.054) 4.065 (± 1.336)Recreational 3.858 (± 1.451) 4.133 (± 1.582)
α stride time 0.815 (± 0.095) 0.734 (± 0.087) b
Elite 0.813 (± 0.093) 0.716 (± 0.068)Recreational 0.816 (± 0.099) 0.753 (± 0.102)
α stride length 0.933 (± 0.118) 0.841 (± 0.082) b
Elite 0.923 (± 0.138) 0.838 (± 0.097)Recreational 0.943 (± 0.095) 0.845 (± 0.067)
a Indicates significant main effect for group (p ≤ 0.05) .b Indicates significant main effect for condition (p ≤ 0.05)
6.6 Discussion
The purpose of this study was to evaluate the effects of a fatiguing jump
protocol on stride time and stride length, the variability of these parameters as
expressed by the CV and LRCs during distance running. Moreover, the study

137
investigated whether recreational and elite runners were affected to the same degree
by the jumps or if differences existed between groups with respect to their fatigue
response. Based on existing literature and the results described in Section 5, it was
hypothesized that α would be reduced significantly after the jumps, while the
magnitude of variability, as measured by the CV, would remain unaffected by
fatigue. It was also hypothesized that elite distance runners would experience less
decrease in joint stiffness and α than recreational runners.
In general, AJS (p < 0.001, η2 = 0.4) and KJS (p = 0.007, η2 = 0.218)
decreased significantly in response to the jumping protocol, which indicates that
high-intensity SSC exercise was effective in generating fatigue in the muscles of the
lower extremities. Previous research has established a link between changes in
neuromuscular performance, stiffness modification and repetitive SSC action. For
example, Nicol et al. (1991b, 1991c) reported reduced levels of maximal voluntary
contraction, decreased force output and a lowered tolerance to stretch loads after a
fatiguing SSC protocol. Avela and Komi (1998b) demonstrated reduced stiffness of
the tendomuscular complex and decreased reflex sensitivity in the quadriceps and
soleus muscles after a high-intensity drop jump protocol. Furthermore, submaximal
SSC exercise has been shown to cause a reduction in joint stiffness at the knee joint
(Horita et al., 1996). The underlying mechanisms governing muscle (and
consequently joint) stiffness regulation involve changes in the number of active
crossbridges (i.e. muscle activation), altered reflex sensitivity as well as decreased
central drive to the muscle cells (Avela & Komi, 1998a; Kuitunen, Avela, et al.,
2002). Additionally, the accumulation of metabolites, i.e. hydrogen ions, is known
to impair cross-bridge cycling and force generation (Green, 1997). Although
neuromuscular fatigue was not assessed directly in this study, it is likely that
repetitive jumping reduced AJS and KJS by impairing the level of force generation.
Statistical analysis also revealed a significant main effect for group on KJS.

138
Figure 34 shows that elite runners (0.086, ± 0.005 Nm/kg/◦) exhibited higher
overall KJS values than recreational runners (0.072 ± 0.005 Nm/kg/◦) across test
conditions. In contrast, there was no significant main effect for group on AJS,
indicating that the reported values were similar across groups. Arampatzis et al.
(1999) systematically investigated the contribution of different joints to leg spring
stiffness and demonstrated that faster running speeds were primarily associated
with increases in KJS but not AJS. Based on these results, it is possible that the
significant group effect on KJS was mainly due to the greater running speeds at
which elite runners performed the linear overground runs in the laboratory.
Physiologically, the greater KJS of the elite group could be explained by a stronger
cocontraction of the leg muscles, which resulted from the intensive training
performed by this cohort.
There was also a significant interaction effect (p = 0.042, η2 = 0.131) on AJS.
Follow up paired samples t-tests revealed a significant decrease in AJS for
recreational runners (p < 0.001), but not in the elite group (p = 0.162), which
suggests that recreational runners were affected to a greater degree by the fatiguing
jumps. Specialized training, such as plyometric exercise, has been shown to increase
overall lower extremity stiffness (Cornu, Silveira, & Goubel, 1997; Spurrs, Murphy,
& Watsford, 2002). Additionally, Hobara et al. (2010) showed that
endurance-trained athletes exhibited greater joint stiffness during a bilateral
hopping task compared to untrained individuals. Therefore, it is likely that the
specialized training performed by the elite runners improved the fatigue resistance
of the muscles responsible for modulating AJS. The absence of an interaction effect
on KJS indicates that training influences stiffness modulation only under certain
conditions or that maintaining stiffness at the knee is less important than at the
ankle in running. Future research is required to explain the relationship between
skill level and joint specific stiffness modulation. In summary, the results of this
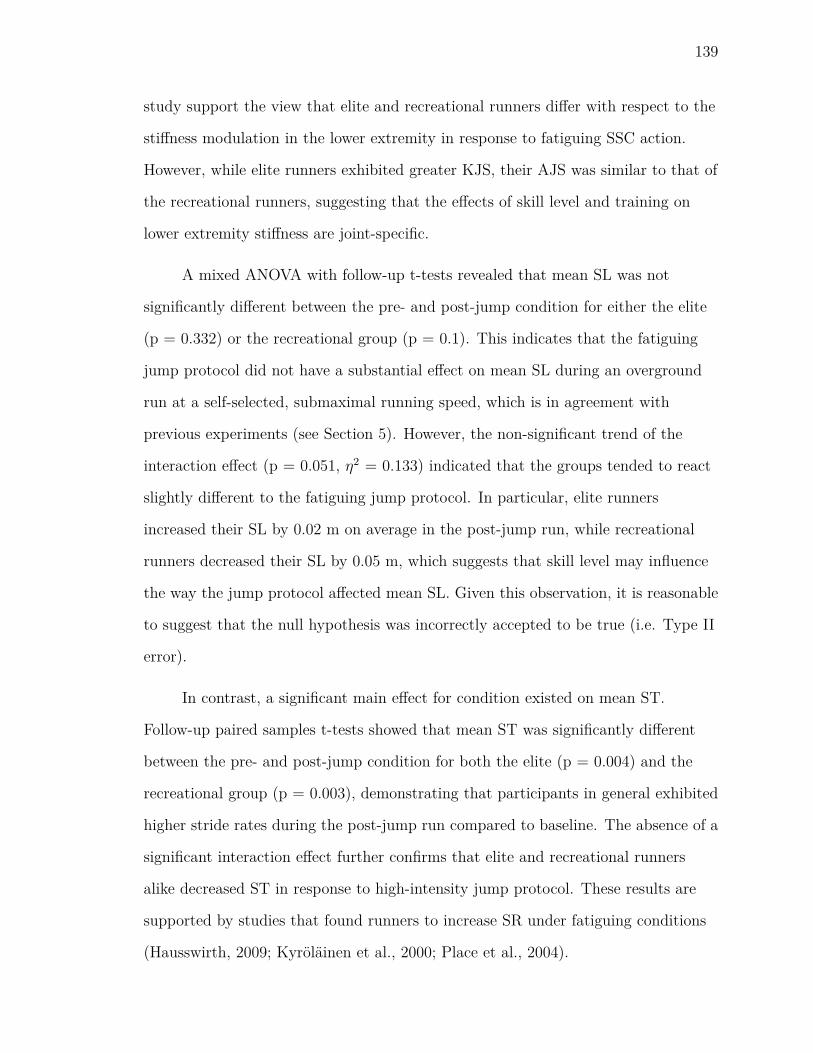
139
study support the view that elite and recreational runners differ with respect to the
stiffness modulation in the lower extremity in response to fatiguing SSC action.
However, while elite runners exhibited greater KJS, their AJS was similar to that of
the recreational runners, suggesting that the effects of skill level and training on
lower extremity stiffness are joint-specific.
A mixed ANOVA with follow-up t-tests revealed that mean SL was not
significantly different between the pre- and post-jump condition for either the elite
(p = 0.332) or the recreational group (p = 0.1). This indicates that the fatiguing
jump protocol did not have a substantial effect on mean SL during an overground
run at a self-selected, submaximal running speed, which is in agreement with
previous experiments (see Section 5). However, the non-significant trend of the
interaction effect (p = 0.051, η2 = 0.133) indicated that the groups tended to react
slightly different to the fatiguing jump protocol. In particular, elite runners
increased their SL by 0.02 m on average in the post-jump run, while recreational
runners decreased their SL by 0.05 m, which suggests that skill level may influence
the way the jump protocol affected mean SL. Given this observation, it is reasonable
to suggest that the null hypothesis was incorrectly accepted to be true (i.e. Type II
error).
In contrast, a significant main effect for condition existed on mean ST.
Follow-up paired samples t-tests showed that mean ST was significantly different
between the pre- and post-jump condition for both the elite (p = 0.004) and the
recreational group (p = 0.003), demonstrating that participants in general exhibited
higher stride rates during the post-jump run compared to baseline. The absence of a
significant interaction effect further confirms that elite and recreational runners
alike decreased ST in response to high-intensity jump protocol. These results are
supported by studies that found runners to increase SR under fatiguing conditions
(Hausswirth, 2009; Kyröläinen et al., 2000; Place et al., 2004).

140
Statistical analysis further revealed a significant group effect on mean SL
(p<0.001, η2 = 0.344) but not mean ST (p = 0.957). Consistent with the results
presented in Section 5.5, trained runners exhibited significantly greater stride
lengths in both conditions than recreational runners (see Table 10). It is evident
that stride length was the main factor responsible for the group differences that
were observed in running speed. This view is supported by Cavanagh et al. (1977)
and Weyand et al. (2000). Furthermore, the results discussed in Section 5.6 showed
that running speed was strongly correlated with SL but not with ST. Since all
participants performed this experiment at a self-selected, comfortable distance
running speed, it appears reasonable that ST was similar across participants.
Together, the results show that the elite group ran faster by taking longer strides,
while maintaining stride rates that were similar to those of recreational runners.
Greater SLs are likely a result of the specialized training that the elite runners
perform on a regular basis. Elite runners were highly efficient at preserving the
goal-relevant features of the stride pattern (i.e. constant levels of SL and ST), which
is plausible given that the main characteristic of expert performance in distance
running is to maintain running speed, even after the onset of fatigue.
In accordance with the hypothesis, the magnitude of variability of SR and SL
did not change in response to fatiguing jumps. This is demonstrated by the
persistent CVs for both ST (p = 0.120) and SL (p = 0.614) across the two different
conditions. The magnitude of variability has previously been shown to be unaffected
by increasing levels of exertion during running (Meardon et al., 2011). Likewise, the
experiment described in Section 5 did not find any effects of prolonged overground
running on the CV calculated for stride time, stride length, contact time and impact
magnitude. Although factors such as aging and certain neuropathologies (i.e.
Huntington’s or Parkinson’s disease) have been shown to increase gait variability
(Auvinet et al., 1999; Hausdorff et al., 1997; Moe-Nilssen & Helbostad, 2004), the

141
presented findings support the view that the stride pattern of young, healthy adults
remains at the same level of consistency, even after the onset of fatigue.
No group differences were observed with respect to the coefficient of variation
for both ST and SL. Although the average stride time CV was slightly lower for
elite runners, the main effect for group on stride time CV was not statistically
significant (p = 0.619). This contradicts Nakayama et al. (2010), who reported
lower stride time variability in trained runners compared to untrained individuals
during treadmill running, and the results presented in Section 5, which showed that
elite distance runners displayed significantly lower stride time CVs (p = 0.007; η2 =
0.221) during a prolonged overground run compared to recreational runners.
These differences may be linked to the implementation of different study
designs and varying nature of fatigue experienced by the participants. More
specifically, the intermittent character of the exercise and the time spent on
preparation for the post-jump run could have caused the participants to recover to a
certain degree after the fatiguing jumps. Furthermore, the present experiment
required that all participants performed the overground runs at a comfortable,
self-selected running speed, while those described in Section 5 required the
participants to run at a much greater intensity to complete exertion. It is possible
that skill-related differences in variability become smaller when runners are allowed
to choose the optimal conditions for a locomotor task themselves, while skill-level
may have a more significant effect on variability when external conditions impose a
bigger physiological stress and consequently are far from optimal. It is left to future
studies to investigate the effects of skill level on the variability of stride parameters
in relation to varying levels of exercise intensity.
There was a significant main effect for test condition on α ST (p < 0.001, η2 =
0.630) as well as on α SL (p < 0.001, η2 = 0.627). This suggests that LRCs changed
significantly in response to the fatiguing, high-intensity SSC exercise. Across
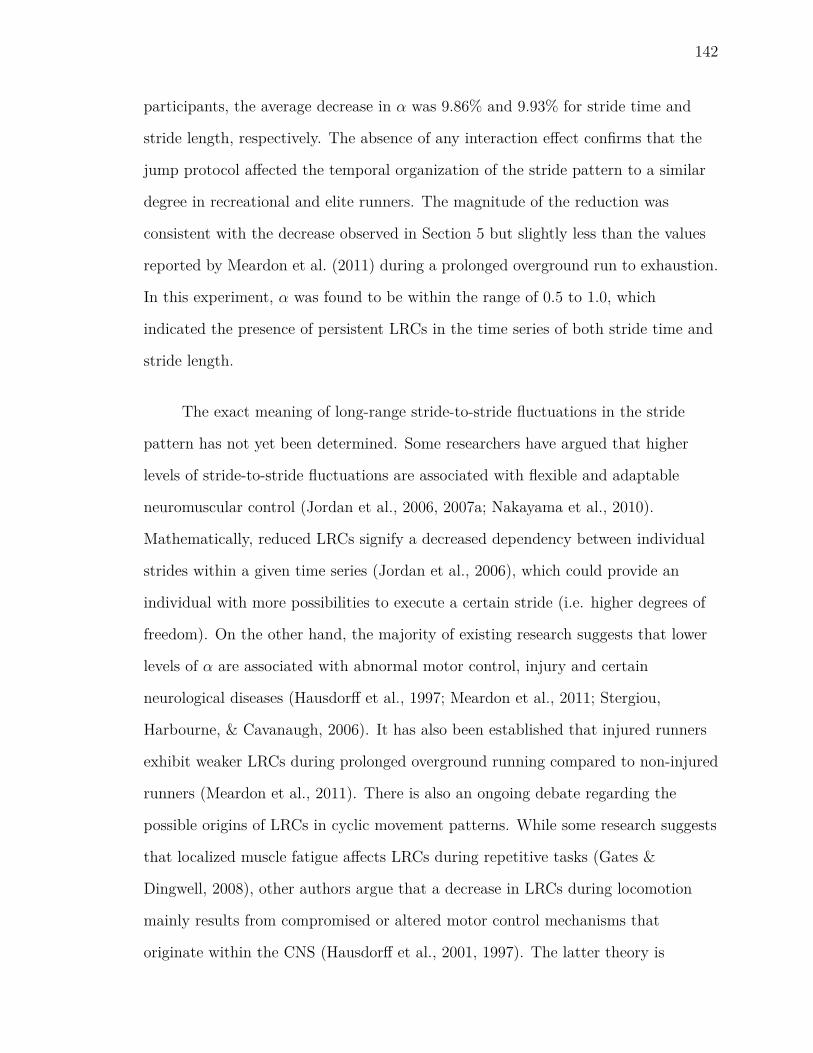
142
participants, the average decrease in α was 9.86% and 9.93% for stride time and
stride length, respectively. The absence of any interaction effect confirms that the
jump protocol affected the temporal organization of the stride pattern to a similar
degree in recreational and elite runners. The magnitude of the reduction was
consistent with the decrease observed in Section 5 but slightly less than the values
reported by Meardon et al. (2011) during a prolonged overground run to exhaustion.
In this experiment, α was found to be within the range of 0.5 to 1.0, which
indicated the presence of persistent LRCs in the time series of both stride time and
stride length.
The exact meaning of long-range stride-to-stride fluctuations in the stride
pattern has not yet been determined. Some researchers have argued that higher
levels of stride-to-stride fluctuations are associated with flexible and adaptable
neuromuscular control (Jordan et al., 2006, 2007a; Nakayama et al., 2010).
Mathematically, reduced LRCs signify a decreased dependency between individual
strides within a given time series (Jordan et al., 2006), which could provide an
individual with more possibilities to execute a certain stride (i.e. higher degrees of
freedom). On the other hand, the majority of existing research suggests that lower
levels of α are associated with abnormal motor control, injury and certain
neurological diseases (Hausdorff et al., 1997; Meardon et al., 2011; Stergiou,
Harbourne, & Cavanaugh, 2006). It has also been established that injured runners
exhibit weaker LRCs during prolonged overground running compared to non-injured
runners (Meardon et al., 2011). There is also an ongoing debate regarding the
possible origins of LRCs in cyclic movement patterns. While some research suggests
that localized muscle fatigue affects LRCs during repetitive tasks (Gates &
Dingwell, 2008), other authors argue that a decrease in LRCs during locomotion
mainly results from compromised or altered motor control mechanisms that
originate within the CNS (Hausdorff et al., 2001, 1997). The latter theory is

143
corroborated by studies that have discovered LRCs in the dynamics of respiration
and heart rate variability (Goldberger et al., 2002; Peng et al., 2002).
Although the origin of LRCs in basic stride parameters is not known, the
present findings show that LRCs in the stride pattern are reduced in a fatigued
state. Given the possible link between peripheral fatigue and changes in LRCs
(Gates et al., 2007; Meardon et al., 2011), it was anticipated that altered mechanical
properties of the musculoskeletal system, such as joint stiffness, would influence its
dynamic behavior and the ability to self-organize. This seems to be supported by
the observation that both joint stiffness and LRCs decreased significantly in
response to the fatiguing jumps. To gain a more complete picture, the linear
relationship of the observed changes in these parameters was assessed using
Pearson’s r. However, statistical analysis did not reveal any significant correlations.
This suggests that LRCs and joint stiffness alterations represent different
dimensions of fatigue and that the magnitude of their change is not linearly related.
Furthermore, these results support the view that the mechanism responsible for the
emergence of LRCs in the stride pattern is not caused by peripheral mechanical
characteristics of the locomotor system but rather depends on central factors. Given
these results, α has the potential to act as a marker of central neuromuscular
fatigue. However, future studies that involve larger cohorts are necessary to
systematically identify and rule out factors that cause LRCs during running gait.
The statistical analysis did not reveal any significant effects for skill level on
either α ST (p = 0.540) or α stride length (p = 0.713). The absence of any group or
interaction effect is consistent with the findings presented in Section 5. However,
Nakayama et al. (2010), who analyzed the strength of LRCs in the stride interval of
competitive and recreational distance runners, found that recreational runners
exhibited higher values of α, even after correcting for the effects of varying running
speeds. The authors speculate that lower values of α in elite distance runners may
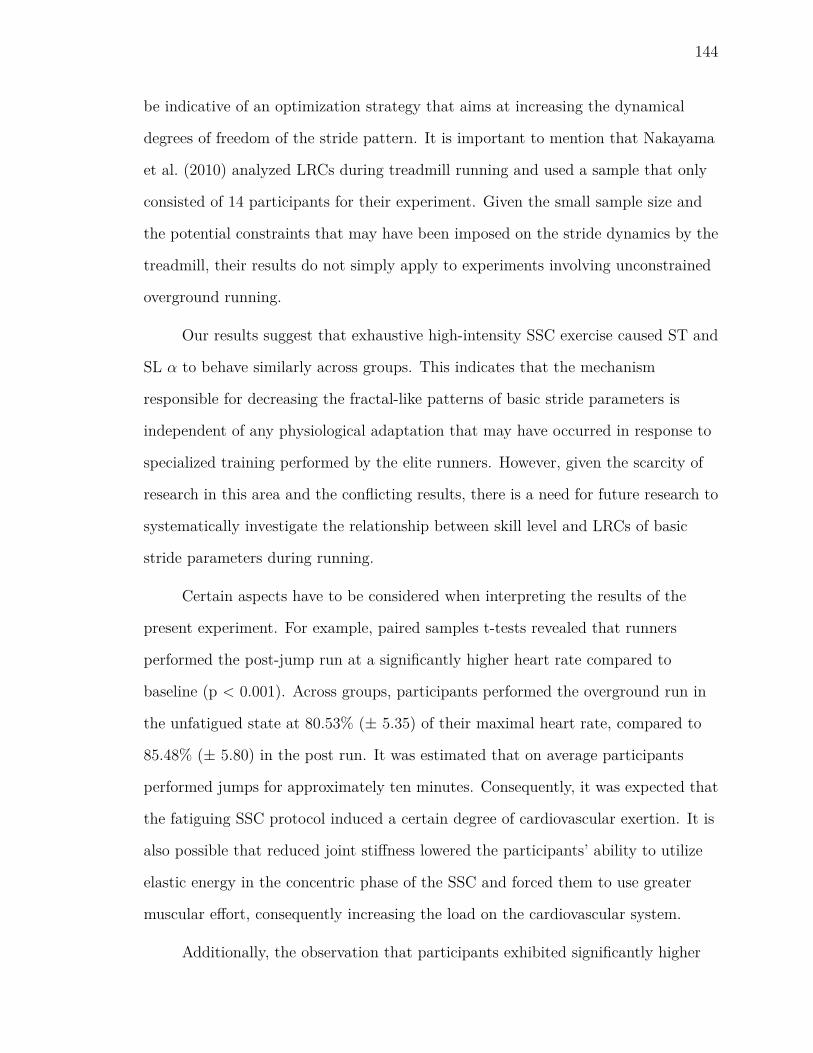
144
be indicative of an optimization strategy that aims at increasing the dynamical
degrees of freedom of the stride pattern. It is important to mention that Nakayama
et al. (2010) analyzed LRCs during treadmill running and used a sample that only
consisted of 14 participants for their experiment. Given the small sample size and
the potential constraints that may have been imposed on the stride dynamics by the
treadmill, their results do not simply apply to experiments involving unconstrained
overground running.
Our results suggest that exhaustive high-intensity SSC exercise caused ST and
SL α to behave similarly across groups. This indicates that the mechanism
responsible for decreasing the fractal-like patterns of basic stride parameters is
independent of any physiological adaptation that may have occurred in response to
specialized training performed by the elite runners. However, given the scarcity of
research in this area and the conflicting results, there is a need for future research to
systematically investigate the relationship between skill level and LRCs of basic
stride parameters during running.
Certain aspects have to be considered when interpreting the results of the
present experiment. For example, paired samples t-tests revealed that runners
performed the post-jump run at a significantly higher heart rate compared to
baseline (p < 0.001). Across groups, participants performed the overground run in
the unfatigued state at 80.53% (± 5.35) of their maximal heart rate, compared to
85.48% (± 5.80) in the post run. It was estimated that on average participants
performed jumps for approximately ten minutes. Consequently, it was expected that
the fatiguing SSC protocol induced a certain degree of cardiovascular exertion. It is
also possible that reduced joint stiffness lowered the participants’ ability to utilize
elastic energy in the concentric phase of the SSC and forced them to use greater
muscular effort, consequently increasing the load on the cardiovascular system.
Additionally, the observation that participants exhibited significantly higher

145
stride rates but similar stride length in the post-run is unexpected, since running
speed, as the product of SL and SR, did not differ significantly between the pre- and
post-jump condition. However, despite the significant main effect of condition on
stride time and its large effect size (η2 = 0.477), the mean difference in stride time
across participants was only 9 ms. Given the inverse relationship between stride
time and stride rate, participants increased their stride frequency from 1.41 Hz in
the unfatigued state to 1.43 Hz in the post-jump condition. It is safe to assume that
these significant, yet small, differences in ST did not have a significant effect on the
measured speeds at which participants completed the pre- and post-jump
overground run.
6.7 Conclusion
This study demonstrated that a high-intensity SSC protocol, consisting of a
fatiguing series of jumps, was effective in generating a local fatigue response, as
indicated by reduced knee and ankle joint stiffness. Across groups, participants
significantly decreased their ST after completing the SSC protocol, while
maintaining relatively constant levels of SL. It was also noted that participants
exhibited lower levels of α in a fatigued state, while leaving the magnitude of
variability, i.e. CV, unaffected. Elite runners took significantly longer strides but
exhibited stride rates that were comparable to those of the recreational runners.
Consequently, the elite group performed the overground run at a significantly
greater running speed. No significant group effects were found with respect to the
magnitude of variability or α. In conclusion, fatiguing high-intensity SSC exercise
was shown to affect mean ST, lower extremity joint stiffness as well as LRCs in elite
and recreational runners when running at a comfortable, self-selected speed on an
indoor track. The results suggest that α may serve as a potential indicator of
neuromuscular fatigue and possibly signifies changes in the spring-mass behavior

146
during running. It was also demonstrated that LRCs can be assessed with a simple
hardware setup, consisting of a single foot-mounted IMU. In the future, this work
could be extended by connecting sensors to mobile end-user devices, thus offering a
simple and convenient way to monitor stride kinematics, variability and
fatigue-related changes in gait dynamics in real time. Potentially, data collected
from large cohorts could be used to identify fatigue thresholds and gait patterns
that are associated with a greater risk of injury.

147
7 Limitations
There were several limitations that should be considered when interpreting the
results of this thesis:
1. The results of all three studies only apply to a population that has
characteristics similar to those of the participants that were recruited for this
study (e.g. age range, training, skill level and health status). In particular, the
results may not apply to runners with a history of running injury.
2. Although the sample sizes that were initially estimated using an a-priori
power analysis were achieved for all studies, the cohorts were relatively small.
This factor may have reduced the statistical power and increased the
likelihood of error.
3. The gender ratio was different in the cohorts of all three studies.
Consequently, any interaction that may have occurred due to gender remains
undetermined. Furthermore, a confounding effect of gender on the outcome
variables cannot be ruled out.
4. The validation of the stride length algorithm in Study 1 involved several short
linear runs. It was assumed that this method would work equally well for
prolonged continuous overground running, but the method has not been
validated for this specific condition
5. The excellent levels of agreement between the two stride length methods
reported in Study 1 were achieved by manually tuning the thresholds of the
recorded angular velocity and acceleration signals. Although this approach
worked well for a small number of participants, the use of alternative
approaches, e.g. adaptive thresholds, should be considered when applying the
method to larger cohorts.
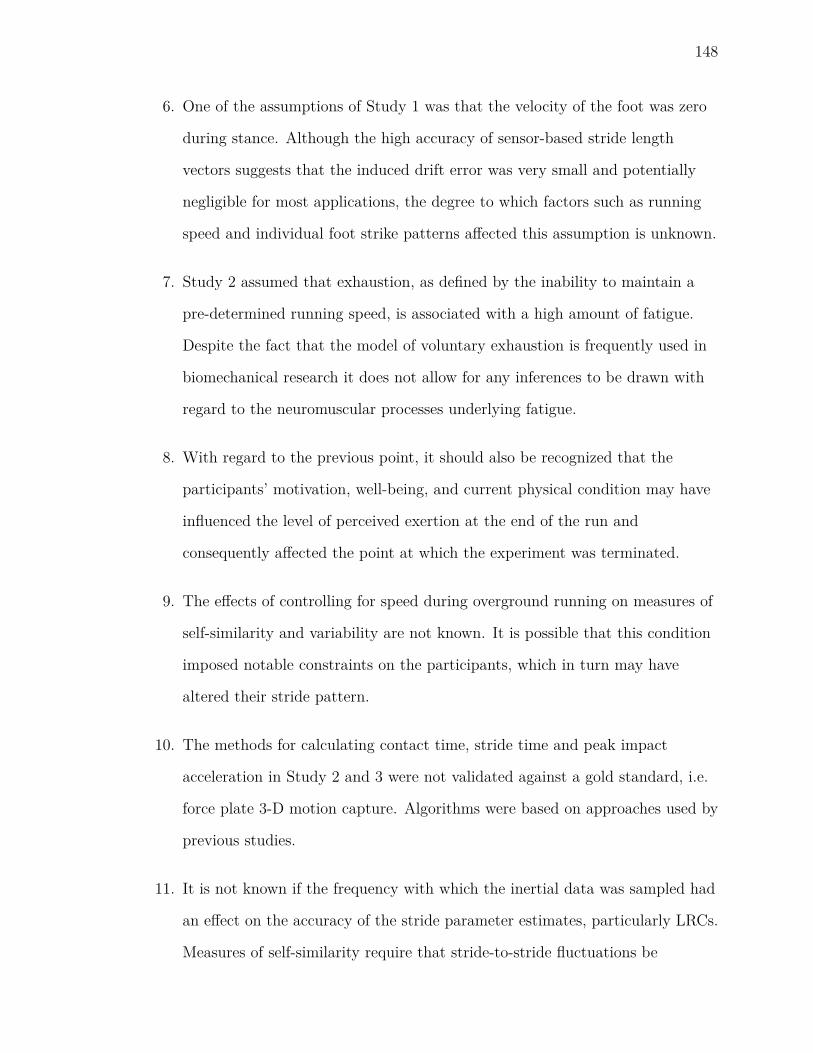
148
6. One of the assumptions of Study 1 was that the velocity of the foot was zero
during stance. Although the high accuracy of sensor-based stride length
vectors suggests that the induced drift error was very small and potentially
negligible for most applications, the degree to which factors such as running
speed and individual foot strike patterns affected this assumption is unknown.
7. Study 2 assumed that exhaustion, as defined by the inability to maintain a
pre-determined running speed, is associated with a high amount of fatigue.
Despite the fact that the model of voluntary exhaustion is frequently used in
biomechanical research it does not allow for any inferences to be drawn with
regard to the neuromuscular processes underlying fatigue.
8. With regard to the previous point, it should also be recognized that the
participants’ motivation, well-being, and current physical condition may have
influenced the level of perceived exertion at the end of the run and
consequently affected the point at which the experiment was terminated.
9. The effects of controlling for speed during overground running on measures of
self-similarity and variability are not known. It is possible that this condition
imposed notable constraints on the participants, which in turn may have
altered their stride pattern.
10. The methods for calculating contact time, stride time and peak impact
acceleration in Study 2 and 3 were not validated against a gold standard, i.e.
force plate 3-D motion capture. Algorithms were based on approaches used by
previous studies.
11. It is not known if the frequency with which the inertial data was sampled had
an effect on the accuracy of the stride parameter estimates, particularly LRCs.
Measures of self-similarity require that stride-to-stride fluctuations be
149
recorded with high temporal resolution. A sampling frequency of 100Hz
caused notable quantization for ST at the 10ms level. Although kinematic
data for running is frequently collected at 100Hz, it is not known if a higher
sampling frequency would have resulted in the same levels of LRCs.
12. Similar to study 2, neuromuscular aspects of fatigue were not assessed directly
in Study 3. Instead, this experiment was based on the assumption that severe
exertion is associated with a substantial amount of fatigue.
13. Although an effort was made to minimize any variation in the rest periods
between the testing procedures, the time between the fatiguing jump protocol
and the post-test procedures varied to a small extent between participants.
This was due to unforeseen events, such as detached camera markers, which
required a quick recalibration of the marker model.
14. Participants were instructed to perform all pre- and post-jump overground
runs at a self-selected comfortable pace. Although no significant differences in
overall running speed were found with respect to these runs, individual
variations in running speed cannot be ruled out.

150
8 Conclusion and Future Work
The present thesis adds a number of important findings to the existing
literature and raises further questions about underlying physiological mechanisms of
gait control, as well as clinical and performance-related applications. As such, it
may serve as the basis for future research that investigates the complex interactions
between fatigue, skill level and the structure of stride-to-stride fluctuations in
running.
Firstly, it was demonstrated that SL can be predicted with high accuracy by a
simple, non-invasive sensor configuration consisting of a single foot-mounted IMU.
From a research and performance perspective, detailed knowledge about SL is
crucial for coaches, clinicians and researchers alike because together with SR it
determines running speed. Moreover, individual SL vectors represent the integrated
output of different biomechanical determinants and as such can provide valuable
insight into the control of running gait.
In the past, SL during overground running has often been assessed in a
confined laboratory setting using stationary high-precision camera systems.
However, this method is not suited for detecting changes that may occur in the
stride pattern during prolonged running because it only allows for a small number of
consecutive strides to be recorded. For continuous running, researchers were
traditionally restricted to using treadmills and applying the known relationship
between running speed, SR and SL to calculate an average SL value for a certain
time interval. Although this method has helped researchers understand how runners
modify running speed (Cavanagh & Kram, 1989; Weyand et al., 2000), it is not
capable of detecting stride-to-stride fluctuations and consequently does not offer any
insight into the control of running gait. Additionally, research has shown that the
biomechanics of treadmill running differ from those exhibited during overground
running (Frishberg, 1983; Nigg et al., 1995; P. Riley et al., 2008). Likewise, LRCs

151
during running are thought to differ significantly between treadmill and overground
conditions, possibly due to the greater constraints imposed on the locomotor system
by ’pacing’ of the treadmill belt (Lindsay et al., 2014).
The limitations of existing methods used to calculate SL and the lack of
studies that have explicitly focused on SL in running emphasized the need to
systematically test the performance of an IMU-based algorithm to calculate SL
during running. The sensor-based method was found to be valid in its assessment of
stride length when compared to a 3-D camera system (ICC(3,1) = 0.955, p <
0.001). Due to the inability to continuously monitor stride length during running
using cameras, the performance of the sensor method was tested by repeatedly
recording a small number of consecutive strides. Although this approach yielded
excellent results, its accuracy during prolonged overground running is not yet
known. Consequently, future research should make an effort to validate the
performance of PDR algorithms to calculate individual stride length vectors during
running using alternative approaches. This could potentially be achieved with
synchronization between body-fixed sensors and force plates.
One of the reasons for the excellent performance of this method was the
frequent application of ZUPTs. However, this approach depended on the correct
identification of each stance phase. Although our results suggest that individual
running technique influenced the performance of the stance detection algorithm,
these aspects were not subject to investigation. Thus, future work needs to
determine the sensitivity of SL algorithms to aspects such as foot strike patterns
and running speed. Overall, this experiment is highly relevant within the field of
gait biomechanics and running research because it expands the existing set of
variables that can be monitored during continuous running. In addition to providing
detailed knowledge about SL, the excellent performance of the IMU-based algorithm
will also enable researchers to conduct other, more sophisticated analyses of a

152
continuous SL series, for example by tracking the coefficient of variation and the
fractal-scaling index α under various conditions.
Although fatigue is a well-studied phenomenon, prior to the current thesis, no
research had been done to track both spatial and temporal stride parameters, their
variability and LRCs during exhaustive overground running in a cohort of
recreational and elite runners. After validating the use of a simple
IMU-configuration to determine SL, a series of stride parameters, including their
CV and LRCs were tracked over the course of a fatiguing run at a fixed,
pre-determined running speed. While participants maintained constant levels of SR
and SL, LRCs of all investigated parameters decreased as a function of running time
(p ≤ 0.003). In contrast, no changes were observed in linear measures of variability
(p ≤ 0.126). Mean peak impact acceleration (p = 0.003) and contact time (p =
0.028) also increased over the course of the run for both groups.
Interestingly, α did not decline linearly over the course of the run but
exhibited a sharp decrease after the first run interval, which confirms previous
reports from Meardon et al. (2011). Although it is likely that participants had
already experienced a certain degree of exertion at this stage, it is safe to state that
they were still far from the point of being unable to maintain the required speed.
One possible explanation for this behavior is that α indicates the early onset of
fatigue during locomotion. Future research should systematically examine the
response of LRCs to increasing levels of exertion and also use a larger number of
time intervals for which α is calculated. This may help to further elucidate the role
of LRCs in locomotion in relation to fatigue.
Group comparison revealed that elite runners demonstrated greater stride
lengths (p < 0.001), shorter ground contact time (p < 0.001), greater peak impact
acceleration (p < 0.001) and lower stride time CV (p < 0.007) than recreational
runners. In contrast, no group differences were found with respect to the strength of

153
LRCs. This supports the idea that the mechanisms responsible for the emergence of
LRCs in the stride pattern are a general characteristic of the motor control system,
which is unaffected by skill level and the high volume of training completed by the
elite distance runners. However, similar experiments using different cohorts, e.g.
injured vs. non-injured, are necessary to better understand the role of α and its
effects on the motor control system.
A fundamental assumption of this experiment was that fatigue is associated
with the inability to preserve a constant work output, i.e. maintain running speed.
While this model is commonly used in the literature, it does not provide insight into
the physiological processes that govern the fatigue response in the working muscle.
In order to learn about the processes that are potentially responsible for the
decrease in LRCs during exhaustive exercise, future studies need to apply methods
that directly assess neuromuscular fatigue. Furthermore, the effects of controlling
for speed on measures of self-similarity and variability during a fatiguing run are not
known. As a result, future work needs to quantify the extent to which external
constraints during overground running affect the strength of LRCs and determine
the degree to which the results differ from treadmill running.
To further examine the potential link between neuromuscular fatigue, joint
mechanics and LRCs, a high intensity SSC activity was tested to determine the
extent to which it affected the stiffness characteristics of the ankle and knee joints,
basic stride parameters as well as gait dynamics during distance running. Joint
stiffness was significantly reduced after the fatiguing jumps (p < 0.007) in both
groups. Furthermore, detrended fluctuation analysis of the stride time and stride
length series revealed that levels of α decreased in response to the jump protocol (p
< 0.001) in elite and recreational runners. However, a comparison of the observed
changes in joint stiffness and LRCs did not yield any significant correlations, which
corroborates the view that these factors represent different dimensions of fatigue
154
and that LRCs in the stride pattern originate within the central nervous system.
Although this view is also supported by other studies, future research should
investigate true indicators of neuromuscular fatigue in combination with joint
stiffness to identify the mechanisms that are responsible for the reduction of LRCs.
It must also be pointed out that the findings of the third study differed from
those of study 2 in certain aspects. For instance, it was observed that mean stride
time changed only in response to the fatiguing jumps but not during the exhaustive
overground run. In contrast, group differences in stride time CV were only observed
during exhaustive running (section 5). Possibly, some of these discrepancies are
linked to differences in study design. For example, running speed in the second
experiment was equivalent to an individual all-out 5000 m pace. This implies that
the relative intensity of the run was higher compared to the third study, where
participants had to run at a comfortable, self-selected pace for 8 minutes.
Additionally, the second experiment used a prolonged continuous run to exert the
participants, while Study 3 employed a short high-intensity jump protocol. Given
the equivocal results, precise evaluation is recommended to examine the effects of
varying levels of exercise intensity on different stride parameters. Furthermore,
other factors were not investigated or controlled for in the experiments and
consequently may have had an effect on the outcome of the studies. These aspects
include but are not limited to: muscle morphology, availability of energy substrates,
individual running technique, as well as sex.
In summary, the present thesis adds valuable insight into how fatigue and skill
level affect various stride parameters, their variability and LRCs during
unconstrained running. The proposed IMU-configuration was found to be capable of
tracking various stride parameters, including mean stride length, CV and LRCs,
which are important measures in the analysis of running gait. The fact that these
parameters can be accurately calculated with an IMU demonstrates the great
155
potential for biomechanics research and clinical applications. One of the key
findings of this thesis was that LRCs changed in response to exhaustive
stretch-shortening exercise, i.e. prolonged running and jumping, while linear
measures of variability, such as the coefficients of variation were insensitive to this
process. It was also established that recreational and elite runners exhibited similar
levels of α across conditions, which suggests that the mechanism responsible for the
occurrence of LRCs in the stride pattern is unaffected by skill level or training.
These findings could act as a vantage point for future research that aims at
analyzing gait patterns under natural conditions. For example, future research
could use non-linear approaches to effectively quantify the training loads for
distance runners. When being used to derive sophisticated parameters of gait
dynamics, such as LRCs, sensor algorithms have the potential to become an
important tool for runners, which may help to monitor the training loads and
subsequently reduce the risk of overuse injuries.

156
References
Abt, J. P., Sell, T. C., Chu, Y., Lovalekar, M., Burdett, R. G., & Lephart, S. M.
(2011). Running kinematics and shock absorption do not change after brief
exhaustive running. Journal of Strength and Conditioning Research, 25,
1479–1485.
Alexander, R. (1992). Simple models of walking and jumping. Human Movement
Science, 11, 3–9.
Angermann, M., Robertson, P., Kemptner, T., & M., K. (2010). A high precision
reference data set for pedestrian navigation using foot-mounted inertial
sensors. In Indoor positioning and indoor navigation (ipin), 2010 international
conference on (pp. 1–6). IEEE.
Appell, H. J., Soares, J. M., & Duarte, J. A. (1992). Exercise, muscle damage and
fatigue. Sports Medicine, 13, 108–115.
Arampatzis, A., Brüggemann, G.-P., & Metzler, V. (1999). The effect of speed on
leg stiffness and joint kinetics in human running. Journal of Biomechanics, 32,
1349–1353.
Auvinet, B., Berrut, G., Touzard, C., Moutel, L., Collet, N., Chaleil, D., &
Barrey, E. (2002). Reference data for normal subjects obtained with an
accelerometric device. Gait & Posture, 16, 124–134.
Auvinet, B., Chaleil, D., & Barrey, E. (1999). Accelerometric gait analysis for use in
hospital outpatients. Revue du rhumatisme (English ed.) 66, 389–397.

157
Avela, J. & Komi, P. V. (1998a). Interaction between muscle stiffness and stretch
reflex sensitivity after long-term stretch-shortening cycle exercise. Muscle &
Nerve, 21, 1224–1227.
Avela, J. & Komi, P. V. (1998b). Reduced stretch reflex sensitivity and muscle
stiffness after long-lasting stretch-shortening cycle exercise in humans.
European Journal of Applied Physiology and Occupational Physiology, 78,
403–410.
Avela, J., Kyröläinen, H., & Komi, P. V. (1999). Altered reflex sensitivity after
repeated and prolonged passive muscle stretching. Journal of Applied
Physiology, 86, 1283–1291.
Barber, M. & Barden, J. M. (2014, May). The effects of breathing on hip roll
asymmetry in competitive front crawl swimming. In Proceedings of the xiith
international symposium on biomechanics and medicine in swimming
(pp. 84–89).
Beauchet, O., Allali, G., Berrut, G., & Dubost, V. (2007). Is low lower-limb
kinematic variability always an index of stability? Gait & Posture, 26,
327–328.
Bergamini, E., Picerno, P., Pillet, H., Natta, F., Thoreux, P., & Camomilla, V.
(2012). Estimation of temporal parameters during sprint running using a
trunk-mounted inertial measurement unit. Journal of Biomechanics, 45,
1123–1126.
158
Bertram, J. E. A., Prebeau-Menezes, L., & Szarko, M. J. (2013). Gait
characteristics over the course of a race in recreational marathon competitors.
Research Quarterly for Exercise and Sport, 84, 6–15.
Bichler, S., Ogris, G., Kremser, V., Schwab, F., Knott, S., & Baca, S. (2012).
Towards high- precision imu/gps-based stride-parameter determination in an
outdoor runners’ scenario. Procedia Engineering, 34, 592–297.
Bigelow, E., Elvin, N., Elvin, A., & Arnoczky, S. (2013). Peak impact accelerations
during track and treadmill running. Journal of Applied Biomechanics, 29,
639–644.
Bigland-Ritchie, B., Johansson, R., Lippold, O. C., Smith, S., & Woods, J. J.
(1983). Changes in motoneurone firing rates during sustained maximal
voluntary contractions. Journal of Physiology, 340, 335–346.
Billat, V., Flechet, B., Petit, B., Muriaux, G., & Koralsztein, J. P. (1999). Interval
training at VO2max effects on aerobic performance and overtraining markers.
Medicine and Science in Sports and Exercise, 31, 156–163.
Blickhan, R. (1989). The spring-mass model for running and hopping. Journal of
Biomechanics, 22, 1217–1227.
Blin, O., Ferrandez, A. M., & Serratrice, G. (1990). Quantitative analysis of gait in
parkinson patients: increased variability of stride length. Journal of the
Neurological Sciences, 98, 91–97.
Bobbert, M. F., Yeadon, M. R., & Nigg, B. M. (1992). Mechanical analysis of the
landing phase in heel-toe running. Journal of Biomechanics, 25, 223–234.

159
Boden, B. P., Breit, I., & Sheehan, F. T. (2009). Tibiofemoral alignment:
contributing factors to noncontact anterior cruciate ligament injury. Journal
of Bone and Joint Surgery, 10, 2381–2389.
Bollens, B., Crevecoeur, F., Nguyen, V., Detrembleur, C., & Lejeune, T. M. (2010).
Does human gait exhibit comparable and reproducible long-range
autocorrelations on level ground and on treadmill? Gait & Posture, 32,
369–373.
Brach, J. S., Berlin, J. E., Vanswearingen, J. M., Newman, A. B., &
Studenski, S. A. (2005). Too much or too little step width variability is
associated with a fall history in older persons who walk at or near normal gait
speed. Journal of Neuroengineering and Rehabilitation, 2, 21–26.
Brach, J. S., McGurl, D., Wert, D., Vanswearingen, J. M., Perera, S., Cham, R., &
Studenski, S. A. (2011). Validation of a measure of smoothess of walking.
Journal of Gerontology, 66, 136–141.
Brüggemann, G. P. & Glad, B. (1990). Time analysis of the 400 metres hurdles
events. scientific research project at the games of the XXIVth olympiad-seoul.
final report. London: IAAF Foundation.
Brughelli, M., Cronin, J., & Chaouachi, A. (2011). Effects of running velocity on
running kinetics and kinematics. Journal of Strength and Conditioning
Research, 25, 933–939.
Burr, D. B., Martin, R. B., Schaffler, M. B., & Radin, E. L. (1985). Bone
remodeling in response to in vivo fatigue microdamage. Journal of
Biomechanics, 18, 189–200.

160
Butler, R. J., Crowell, H. P., & Davis, I. (2003). Lower extremity stiffness:
implications for performance and injury. Clinical Biomechanics, 18, 511–517.
Butler, R. J., Hamill, J., & Davis, I. (2007). Effect of footwear on high and low
arched runners’ mechanics during a prolonged run. Gait & Posture, 26,
219–225.
Button, C., Macleod, M., Sanders, R., & Coleman, S. (2003). Examining movement
variability in the basketball free-throw action at different skill levels. Research
Quarterly for Exercise and Sport, 74, 257–269.
Callow, M., Morton, A., & Guppy, M. (1986). Marathon fatigue: the role of plasma
fatty acids, muscle glycogen and blood glucose. Biomedicine and Life
Sciences, 55, 654–661.
Candau, R., Belli, A., Millet, G. Y., Georges, D., Barbier, B., & Rouillon, J. D.
(1998). Energy cost and running mechanics during a treadmill run to
voluntary exhaustion in humans. European Journal of Applied Physiology and
Occupational Physiology, 77, 479–485.
Cavagna, G. A., Saibene, F. P., & Margaria, R. (1965). Effect of negative work on
the amount of positive work performed by an isolated muscle. Journal of
Applied Physiology, 20, 157–158.
Cavanagh, P. R. & Kram, R. (1989). Stride length in distance running: velocity,
body dimensions, and added mass effects. Medicine and Science in Sports and
Exercise, 21, 467–479.
Cavanagh, P. R. & Lafortune, M. A. (1980). Ground reaction forces in distance
running. Journal of Biomechanics, 13, 397–406.
161
Cavanagh, P. R., Pollock, M. L., & Landa, J. (1977). A biomechanical comparison
of elite and good distance runners. Annals of the New York Academy of
Sciences, 301, 328–345.
Cavanagh, P. R. & Williams, K. R. (1982). The effect of stride length variation on
oxygen uptake during distance running. Medicine and Science in Sports and
Exercise, 14, 30–35.
Challis, J. (2001). The variability in running gait caused by force plate targeting.
Journal of Applied Biomechanics, 17, 77–83.
Chan-Roper, M., Hunter, I., Myrer, W., Eggett, D., & Seeley, M. (2012). Kinematic
changes during a marathon for fast and slow runners. Journal of Sports
Science & Medicine, 11, 77–82.
Chapman, R. F., Laymon, A. S., Wilhite, D. P., Mckenzie, J. M., Tanner, D. A., &
Stager, J. M. (2012). Ground contact time as an indicator of metabolic cost in
elite distance runners. Medicine and Science in Sports and Exercise, 44,
917–925.
Christina, K. A., White, S. C., & Gilchrist, L. A. (2001). Effect of localized muscle
fatigue on vertical ground reaction forces and ankle joint motion during
running. Human Movement Science, 20, 257–276.
Clansey, A. C., Hanlon, M., Wallace, E. S., & Lake, M. (2012). Effects of fatigue on
running mechanics associated with tibial stress fracture risk. Medicine and
Science in Sports and Exercise, 44, 1917–1923.

162
Collins, J. J. & DeLuca, C. J. (1995). The effects of visual input on open-loop and
closed-loop postural control mechanisms. Experimental Brain Research, 103,
151–163.
Cook, S. D., Kester, M. A., Brunet, M. E., & Haddad, R. J. (1985). Biomechanics of
running shoe performance. Clinics in Sports Medicine, 4, 619–626.
Corbeil, P., Blouin, J.-S., Bégin, F., Nougier, V., & Teasdale, N. (2003).
Perturbation of the postural control system induced by muscular fatigue. Gait
& Posture, 18, 92–100.
Cornu, C., Silveira, M., & Goubel, F. (1997). Influence of plyometric training on the
mechanical impedance of the human ankle joint. European Journal of Applied
Physiology, 76, 282–288.
Cotel, F., Exley, R., Cragg, S. J., & Perrier, J.-F. (2013). Serotonin spillover onto
the axon initial segment of motoneurons induces central fatigue by inhibiting
action potential initiation. Proceedings of the National Academy of Sciences of
the United States of America, 110, 4774–4779.
Crevecoeur, F., Bollens, B., Detrembleur, C., & Lejeune, T. M. (2010). Towards a
gold-standard approach to address the presence of long-range auto-correlation
in physiological time series. Journal of Neuroscience Methods, 192, 163–172.
Damouras, S., Chang, M. D., Sejdić, E., & Chau, T. (2010). An empirical
examination of detrended fluctuation analysis for gait data. Gait & Posture,
31, 336–340.

163
Daniels, J., Oldridge, N., Nagle, F., & White, B. (1978). Differences and changes in
vo2 among young runners 10 to 18 years of age. Medicine and Science in
Sports, 10, 200–203.
Daoud, A. I., Geissler, G. J., Wang, F., Saretsky, J., Daoud, Y. A., &
Lieberman, D. E. (2012). Foot strike and injury rates in endurance runners: a
retrospective study. Medicine and Science in Sports and Exercise, 44,
1325–1344.
Darling, W. G. & Cooke, J. D. (1987). Changes in the variability of movement
trajectories with practice. Journal of Motor Behavior, 19, 291–309.
Degache, F., Guex, K., Fourchet, F., Morin, J. B., Millet, G. P., Tomazin, K., &
Millet, G. Y. (2013). Changes in running mechanics and spring-mass
behaviour induced by a 5-hour hilly running bout. Journal of Sports Sciences,
31, 299–304.
Delignieres, D. & Torre, K. (2009). Fractal dynamics of human gait: a reassessment
of the 1996 data of hausdorff et al. Journal of Applied Physiology, 106,
1272–1279.
DeLuca, C. J. (1997). The use of surface electromyography in biomechanics. Journal
of Applied Biomechanics, 13, 135–163.
Derrick, T. R., Caldwell, G. E., & Hamill, C. L. (2000). Modeling the stiffness
characteristics of the human body while running at various stride frequencies.
Journal of Applied Biomechanics, 16, 36–51.

164
Derrick, T. R., Dereu, D., & McLean, S. P. (2002). Impacts and kinematic
adjustments during an exhaustive run. Medicine and Science in Sports and
Exercise, 34, 998–1002.
Derrick, T. R., Hamill, C. L., & Caldwell, G. E. (1998). Energy absorption of
impacts during running at various stride lengths. Medicine and Science in
Sports and Exercise, 30, 128–135.
Dickinson, J. A., Cook, S. D., & Leinhardt, T. M. (1985). The measurement of
shock waves following heel strike while running. Journal of Biomechanics, 18,
415–422.
Dingwell, J. B., Cusumano, J. P., Cavanagh, P. R., & Sternad, D. (2001). Local
dynamic stability versus kinematic variability of continuous overground and
treadmill walking. Journal of Biomechanical Engineering, 123, 27–32.
Dutto, D. J., Levy, M., Lee, K., Sidthalaw, S., & Smith, G. A. (1997). Effect of
fatigue and gender on running mechanics. Medicine and Science in Sports and
Exercise, 29, 82–93.
Dutto, D. J. & Smith, G. A. (2002). Changes in spring-mass characteristics during
treadmill running to exhaustion. Medicine and Science in Sports and Exercise,
34, 1324–1331.
Elliott, B. C. & Ackland, T. (1981). Biomechanical effects of fatigue on 10,000 meter
running technique. Research Quarterly for Exercise and Sport, 52, 160–166.
Elliott, B. C. & Roberts, A. D. (1980). A biomechanical evaluation of the role of
fatigue in middle-distance running. Canadian Journal of Applied Sport
Sciences, 5, 203–207.

165
Enoka, R. M. (2002). Neuromechanics of human movement (3rd ed.). Champaign,
IL: Human Kinetics.
Farley, C. T., Blickhan, R., Saito, J., & Taylor, C. R. (1991). Hopping frequency in
humans: a test of how springs set stride frequency in bouncing gaits. Journal
of Applied Physiology, 71, 2127–2132.
Farley, C. T. & González, O. (1996). Leg stiffness and stride frequency in human
running. Journal of Biomechanics, 29, 181–186.
Farley, C. T., Houdijk, H. P., Van Strien, C., & Louie, M. (1998). Mechanism of leg
stiffness adjustment for hopping on surfaces of different stiffnesses. Journal of
Applied Physiology, 85, 1044–1055.
Feehery, R. V. (1986). The biomechanics of running on different surfaces. Clinics in
Podiatric Medicine And Surgery, 3, 649–659.
Feliz, R., Zalama, E., & Garcia-Bermejo, J. (2009). Pedestrian tracking using
intertial sensors. Journal of Physical Agents, 3, 35–43.
Fischer, C., Sukumar, T., & Hazas, M. (2013). Tutorial: implementing a pedestrian
tracker using inertial sensors. IEEE Pervasive Computing, 12 (2), 17–27.
Fitts, R. H. (1996). Cellular, molecular, and metabolic basis of muscle fatigue. In
L. B. Rowell & J. T. Shepherd (Eds.), Handbook of physiology: sec. 12.
exercise: regulation and integration of multiple systems (pp. 1151–1183). New
York: Oxford University Press.
Frenkel-Toledo, S., Giladi, N., Peretz, C., Herman, T., Gruendlinger, L., &
Hausdorff, J. M. (2005). Effect of gait speed on gait rhythmicity in parkinson’s

166
disease: variability of stride time and swing time respond differently. Journal
of Neuroengineering and Rehabilitation, 2, 23–30.
Frishberg, B. A. (1983). An analysis of overground and treadmill sprinting. Medicine
and Science in Sports and Exercise, 15, 478–485.
Fujii, S., Kudo, K., Ohtsuki, T., & Oda, S. (2009). Tapping performance and
underlying wrist muscle activity of non-drummers, drummers, and the world’s
fastest drummer. Neuroscience Letters, 459, 69–73.
Gabell, A. & Nayak, U. S. (1984). The effect of age on variability in gait. Journal of
Gerontology, 39, 662–666.
Gao, J., Hu, J., Tung, W. W., Cao, Y., & Sarshar, N. (2006). Assessment of
long-range correlation in time series: how to avoid pitfalls. Physical Review E,
73, 1–10.
Garland, S. J. & Kauffman, M. P. (1995). Neuromuscular fatigue during a
long-duration cycling exercise. In S. C. Gandevia, G. M. Allen, & K. K.
McKenzie (Eds.), Fatigue (pp. 271–278). New York: Plenum.
Gates, D. H. & Dingwell, J. B. (2008). The effects of neuromuscular fatigue on task
performance during repetitive goal-directed movements. Experimental Brain
Research, 187, 573–585.
Gates, D. H., Dingwell, J. B., & Su, J. L. (2007). Possible biomechanical origins of
the long-range correlations in stride intervals of walking. Physica A, 380,
12–12.
167
Gazeau, F., Koralsztein, J. P., & Billat, V. (1997). Biomechanical events in the time
to exhaustion at maximum aerobic speed. Archives of Physiology and
Biochemistry, 105, 583–590.
Gerritsen, K., van den Bogert, A. J., & Nigg, B. M. (1995). Direct dynamics
simulation of the impact phase in heel-toe running. Journal of Biomechanics,
28, 661–668.
Giladi, N., Herman, T., Reider-Groswasser, I., Gurevich, T., & Hausdorff, J. M.
(2005). Clinical characteristics of elderly patients with a cautious gait of
unknown origin. Journal of Neurology, 252, 300–306.
Girard, O., Lattier, G., Maffiuletti, N. A., Micallef, J.-P., & Millet, G. P. (2008).
Neuromuscular fatigue during a prolonged intermittent exercise: application to
tennis. Journal of Electromyography and Kinesiology, 18, 1038–1046.
Girard, O., Micallef, J.-P., & Millet, G. P. (2011). Changes in spring-mass model
characteristics during repeated running sprints. European Journal of Applied
Physiology and Occupational Physiology, 111, 125–134.
Girden, E. R. (1992). Anova: repeated measures. Newbury Park, CA: Sage.
Godfrey, A., Conway, R., Meagher, D., & OLaighin, G. (2008). Direct measurement
of human movement by accelerometry. Medical Engineering & Physics, 30,
1364–1386.
Goldberger, A. L., Amaral, L. A., Hausdorff, J. M., Ivanov, P. C., Peng, C. K., &
Stanley, H. E. (2002). Fractal dynamics in physiology: alterations with disease
and aging. Proceedings of the National Academy of Sciences, 99 (Suppl 1),
2466–2472.
168
Gollhofer, A., Komi, P. V., Miyashita, M., & Aura, O. (1987). Fatigue during
stretch-shortening cycle exercises: changes in mechanical performance of
human skeletal muscle. International Journal of Sports Medicine, 8, 71–78.
Granata, K. P., Padua, D. A., & Wilson, S. E. (2002). Gender differences in active
musculoskeletal stiffness. part 2. quantification of leg stiffness during functional
hopping tasks. Journal of Electromyography and Kinesiology, 12, 127–135.
Green, H. (1997). Mechanisms of muscle fatigue in intense exercise. Journal of
Sports Sciences, 15, 247–256.
Grimston, S. K., Engsberg, J. R., & Kloiber, R. (1991). Bone mass, external loads,
and stress fracture in female runners. Journal of Applied Biomechanics, 7,
293–302.
Hamill, J., Bates, B. T., Knutzen, K. M., & Sawhill, J. (1983). Variations in ground
reaction force parameters at different running speeds. Human Movement
Science, 2, 47–56.
Hamill, J., Gruber, A. H., & Derrick, T. R. (2012). Lower extremity joint stiffness
characteristics during running with different footfall patterns. European
Journal of Sport Science, 14, 1–7.
Hamill, J., Russell, E. M., Gruber, A. H., & Miller, R. (2011). Impact characteristics
in shod and barefoot running. Footwear Science, 3, 33–40.
Hamill, J., van Emmerik, R. E., Heiderscheit, B. C., & Li, L. (1999). A dynamical
systems approach to lower extremity running injuries. Clinical Biomechanics,
14, 297–308.
169
Hanon, C. & Gajer, B. (2009). Velocity and stride parameters of world-class 400m
athletes compared with less experienced runners. Journal of Strength and
Conditioning Research, 23, 524–531.
Hardin, E. C. & van den Bogert, A. J. (2004). Kinematic adaptations during
running: effects of footwear, surface, and duration. Medicine and Science in
Sports and Exercise, 36, 838–844.
Hartmann, A., Luzi, S., Murer, K., de Bie, R. A., & de Bruin, E. D. (2009).
Concurrent validity of a trunk tri-axial accelerometer system for gait analysis
in older adults. Gait & Posture, 29, 444–448.
Hartmann, A., Murer, K., de Bie, R. A., & de Bruin, E. D. (2009). Reproducibility
of spatio-temporal gait parameters under different conditions in older adults
using a trunk tri-axial accelerometer system. Gait & Posture, 30, 351–355.
Hasegawa, H., Yamauchi, T., & Kraemer, W. J. (2007). Foot strike patterns of
runners at the 15-km point during an elite-level half marathon. Journal of
Strength and Conditioning Research, 21, 888–893.
Hausdorff, J. M. (2005). Gait variability: methods, modeling and meaning. Journal
of Neuroengineering and Rehabilitation, 2, 19–28.
Hausdorff, J. M. (2007). Gait dynamics, fractals and falls: finding meaning in the
stride-to-stride fluctuations of human walking. Human Movement Science, 26,
555–589.
Hausdorff, J. M., Ashkenazy, Y., Peng, C. K., Ivanov, P. C., Stanley, H. E., &
Goldberger, A. L. (2001). When human walking becomes random walking:

170
fractal analysis and modeling of gait rhythm fluctuations. Physica A:
Statistical Mechanics and its Applications, 302, 138–147.
Hausdorff, J. M., Mitchell, S. L., R, F., Peng, C. K., Cudkowicz, M. E., Wei, J. Y.,
& Goldberger, A. L. (1997). Altered fractal dynamics of gait: reduced
stride-interval correlations with aging and huntington’s disease. Journal of
Applied Physiology, 82, 262–269.
Hausdorff, J. M., Peng, C. K., Ladin, Z., Wei, J. Y., & Goldberger, A. L. (1995). Is
walking a random walk? evidence for long-range correlations in stride interval
of human gait. Journal of Applied Physiology, 78, 349–358.
Hausdorff, J. M., Purdon, P. L., Peng, C. K., Ladin, Z., Wei, J. Y., &
Goldberger, A. L. (1996). Fractal dynamics of human gait: stability of
long-range correlations in stride interval fluctuations. Journal of Applied
Physiology, 80, 1448–1457.
Hausswirth, C. (2009). Accuracy and repeatability of the polar rs800sd to evaluate
stride rate and running speed. International Journal of Sports Medicine, 30,
354–359.
Hausswirth, C., Bigard, A., Berthelot, M., Thomaidis, M., & Guezennec, C. (1996).
Variability in energy cost of running at the end of a triathlon and a marathon.
International Journal of Sports Medicine, 17, 572–579.
Hausswirth, C., Bigard, A., & Guezennec, C. (1997). Relationships between running
mechanics and energy cost of running at the end of a triathlon and a
marathon. International Journal of Sports Medicine, 18, 330–339.

171
Heiden, T. & Burnett, A. (2008). Determination of heel strike and toe-off in the
running stride using an accelerometer: application to field-based gait studies.
In ISBS - conference proceedings archive (Vol. 1).
Henriksen, M., Lund, H., Moe-Nilssen, R., Bliddal, H., & Danneskiod-Samsøe, B.
(2004). Test-retest reliability of trunk accelerometric gait analysis. Gait &
Posture, 19, 288–297.
Hinrichs, R. N. (1990). Upper extremity function in distance running. In P. R.
Cavanagh (Ed.), Biomechanics of distance running (Vol. 4, pp. 107–133).
Champaign, IL: Human Kinetics.
Hintermann, B. & Nigg, B. M. (1998). Pronation in runners: implications for
injuries. Sports Medicine, 26, 169–176.
Hobara, H., Inoue, K., Gomi, K., Sakamoto, M., Muraoka, T., Iso, S., &
Kanosue, K. (2010). Continuous change in spring-mass characteristics during a
400m sprint. Journal of Science and Medicine in Sport, 13, 256–261.
Horita, T. (2000). Stiffness regulation during stretch-shortening cycle exercise.
Department of Biology of Physical Activity. Research series publishe by the
University of Jyväskylä, Finland.
Horita, T., Komi, P. V., & Kyröläinen, H. (1996). Stretch shortening cycle fatigue:
interactions among joint stiness, reflex, and muscle mechanical performance in
the drop jump. European Journal of Applied Physiology and Occupational
Physiology, 73, 393–403.
Hreljac, A. (2000). Stride smoothness evaluation of runners and other athletes. Gait
& Posture, 11, 199–206.

172
Hunter, I. & Smith, G. A. (2007). Preferred and optimal stride frequency, stiffness
and economy: changes with fatigue during a 1-h high-intensity run. European
Journal of Applied Physiology and Occupational Physiology, 100, 653–661.
Hunter, J. P., Marshall, R. N., & McNair, P. J. (2004). Interaction of step length
and step rate during sprint running. Medicine and Science in Sports and
Exercise, 36, 261–271.
Jimenez, A. R., Seco, F., Prieto, C., & Guevara, J. (2009). A comparison of
pedestrian dead-reckoning algorithms using a low-cost MEMS IMU. In Ieee
international symposium on intelligent signal processing (pp. 37–42).
Jimenez, A. R., Seco, F., Prieto, C., & Roa, J. (2005). Tecnologias sensoriales de
localizacion para entornos inteligentes. In I congreso espanol de informatica -
simposio de computacion ubicua e inteligencia ambiental, ucami2005
(granada) (pp. 75–86).
Jones, J. & Lindstedt, S. (1993). Limits to maximal performance. Annual Review of
Physiology, 55, 547–569.
Jordan, K., Challis, J. H., Cusumano, J. P., & Newell, K. M. (2009). Stability and
the time-dependent structure of gait variability in walking and running.
Human Movement Science, 28, 113–128.
Jordan, K., Challis, J. H., & Newell, K. M. (2006). Long range correlations in the
stride interval of running. Gait & Posture, 24, 120–125.
Jordan, K., Challis, J. H., & Newell, K. M. (2007a). Speed influences on the scaling
behavior of gait cycle fluctuations during treadmill running. Human
Movement Science, 26, 87–102.
173
Jordan, K., Challis, J. H., & Newell, K. M. (2007b). Walking speed influences on
gait cycle variability. Gait & Posture, 26, 128–134.
Jordan, K. & Newell, K. M. (2008). The structure of variability in human walking
and running is speed-dependent. Exercise and Sport Sciences Reviews, 36,
200–204.
Kavanagh, J. & Menz, H. B. (2008). Accelerometry: a technique for quantifying
movement patterns during walking. Gait & Posture, 28, 1–15.
Kavanagh, J., Morrison, S., James, D. A., & Barrett, R. (2006). Reliability of
segmental accelerations measured using a new wireless gait analysis system.
Journal of Biomechanics, 39, 2863–2872.
Kerdok, A. E., Biewener, A. A., McMahon, T. A., Weyand, P. G., & Herr, H. M.
(2002). Energetics and mechanics of human running on surfaces of different
stiffnesses. Journal of Applied Physiology, 92, 469–478.
Kim, J., Jang, H., Hwang, D.-H., & Park, C. (2004). A step, stride and heading
determination for the pedestrian navigation system. Journal of Global
Positioning Systems, 3, 273–279.
Kirkendall, D. T. (1990). Mechanisms of peripheral fatigue. Medicine and Science in
Sports and Exercise, 22, 444–449.
Kobsar, D., Olson, C., Paranjape, R., Hadjistavropoulos, T., & Barden, J. M.
(2014). Evaluation of age-related differences in the stride-to-stride
fluctuations, regularity and symmetry of gait using a waist-mounted tri-axial
accelerometer. Gait & Posture, 39, 553–557.

174
Komi, P. V. (2000). Stretch-shortening cycle: a powerful model to study normal and
fatigued muscle. Journal of Biomechanics, 33, 1197–1206.
Komi, P. V. (2003). Stretch-shortening cycle. In P. V. Komi (Ed.), Strength and
power in sport (Chap. 10, Vol. 3). The Encyclopedia of Sports Medicine
(IOC). Oxford, UK: Blackwell Science.
Komi, P. V., Hyvärinen, T., Gollhofer, A., & Mero, A. (1986). Man-shoe-surface
interaction: special problems during marathon running. Acta Universitatis
Ouluensis, 179, 69–72.
Komi, P. V. & Nicol, C. (2000). Stretch-shortening cycle of muscle function. In V.
Zatsiorsky (Ed.), Biomechanics in sport (Chap. 5, Vol. 9). The Encyclopedia
of Sports Medicine (IOC). Oxford, UK: Blackwell Science.
Korver, T. H., van de Stadt, R. J., Kiljan, E., van Kampen, G. P., &
van der Korst, J. K. (1992). Effects of loading on the synthesis of
proteoglycans in different layers of anatomically intact articular cartilage in
vitro. Journal of Rheumatology, 19, 905–912.
Kram, R. & Taylor, C. R. (1990). Energetics of running: a new perspective. Nature,
346, 265–267.
Kristianslund, E., Krosshaug, T., & van den Bogert, A. J. (2012). Effect of low pass
filtering on joint moments from inverse dynamics: implications for injury
prevention. Journal of Biomechanics, 23 (666-671).
Kubo, K., Kanehisa, H., Kawakami, Y., & Fukunaga, T. (2001). Effects of repeated
muscle contractions on the tendon structures in humans. European Journal of
Applied Physiology and Occupational Physiology, 84, 162–166.

175
Kuitunen, S., Avela, J., Kyröläinen, H., Nicol, C., & Komi, P. V. (2002). Acute and
prolonged reduction in joint stiffness in humans after exhausting
stretch-shortening cycle exercise. European Journal of Applied Physiology and
Occupational Physiology, 88, 107–116.
Kuitunen, S., Komi, P. V., & Kyröläinen, H. (2002). Knee and ankle joint stiffness
in sprint running. Medicine and Science in Sports and Exercise, 34, 166–173.
Kyröläinen, H., Pullinen, T., Candau, R., Avela, J., Huttunen, P., & Komi, P. V.
(2000). Effects of marathon running on running economy and kinematics.
European Journal of Applied Physiology and Occupational Physiology, 82,
297–304.
Lafortune, M. A., Henning, E., & Valiant, G. A. (1995). Tibial shock measured with
bone and skin mounted transducers. Journal of Biomechanics, 28, 989–993.
Larson, P., Higgins, E., Kaminski, J., Decker, T., Preble, J., Lyons, D., . . .
Normile, A. (2011). Foot strike patterns of recreational and sub-elite runners
in a long-distance road race. Journal of Sports Sciences, 29, 1665–1673.
Latash, M. L. & Zatsiorsky, V. M. (1993). Joint stiffness: myth or reality? Human
Movement Science, 12, 653–692.
Lavanska, V., Taylor, N. F., & Schache, A. G. (2005). Familiarization to treadmill
running in young unimpaired adults. Human Movement Science, 24, 544–557.
Le Bris, R., Billat, V., Auvinet, B., Chaleil, D., Hamard, L., & Barrey, E. (2006).
Effect of fatigue on stride pattern continuously measured by an accelerometric
gait recorder in middle distance runners. Journal of Sports Medicine and
Physical Fitness, 46, 227–231.

176
Lee, J. B., James, D. A., Ohgi, Y., & Yamanaka, S. (2012). Monitoring sprinting
gait temporal kinematics of an athlete aiming for the 2012 London
paralympics. Procedia Engineering, 34, 778–783.
Lee, J. B., Mellifont, R. B., & Burkett, B. J. (2010). The use of a single inertial
sensor to identify stride, step, and stance durations of running gait. Journal of
Science and Medicine in Sport, 13, 270–273.
Lee, T., Swinnen, S., & Verschueren, S. (1995). Relative phase alterations during
bimanual skill acquisition. Journal of Motor Behaviour, 27 (263-274).
Lieberman, D. E., Venkadesan, M., Werbel, W. A., Daoud, A. I., D’Andrea, S.,
Davis, I. S., . . . Pitsiladis, Y. (2010). Foot strike patterns and collision forces
in habitually barefoot versus shod runners. Nature, 463, 531–535.
Lindsay, T., Noakes, T., & McGregor, S. (2014). Effect of treadmill versus
overground running on the structure of variability of stride timing. Perceptual
and Motor Skills, 118, 331–346.
Lord, S. R., Howe, T., Greenland, J., Simpson, L., & Rochester, L. (2011). Gait
variability in older adults: a structured review of testing protocol and
clinimetric properties. Gait & Posture, 34, 443–450.
Luhtanen, P. & Komi, P. V. (1978). Mechanical factors influencing running speed.
In E. Asmussen & K. Jorgenson (Eds.), Biomechanics VI-B (pp. 23–29).
Baltimore, MD: University Park Press.
Maraun, D., Rust, H. W., & Timmer, J. (2004). Tempting long-memory - on the
interpretation of dfa results. Nonlinear Processes in Geophysics, 11, 495–503.

177
Martin, E. (2011). Novel method for stride length estimation with body area
network accelerometers. In Topical conference on biomedical wireless
technologies, networks, and sensing systems (biowireless) (pp. 79–82). IEEE.
McMahon, T. A. & Cheng, G. C. (1990). The mechanics of running: how does
stiffness couple with speed? Journal of Biomechanics, 23, 65–78.
McMahon, T. A., Valiant, G., & Frederick, E. C. (1987). Groucho running. Journal
of Applied Physiology, 62, 2326–2337.
Meardon, S. A., Hamill, J., & Derrick, T. R. (2011). Running injury and stride time
variability over a prolonged run. Gait & Posture, 33, 36–40.
Menz, H. B., Lord, S. R., & Fitzpatrick, R. C. (2003). Acceleration patterns of the
head and pelvis when walking on level and irregular surfaces. Gait & Posture,
18, 35–46.
Menz, H. B., Lord, S. R., & Fitzpatrick, R. C. (2005). A structural equation model
relating impaired sensorimotor function, fear of falling and gait patterns in
older people. Gait & Posture, 25, 243–249.
Mercer, J. A., Devita, P., Derrick, T. R., & Bates, B. T. (2003). Individual effects of
stride length and frequency on shock attenuation during running. Medicine
and Science in Sports and Exercise, 35, 307–313.
Mercer, J. A., Vance, J., Hreljac, A., & Hamill, C. L. (2002). Relationship between
shock attenuation and stride length during running at different velocities.
European Journal of Applied Physiology and Occupational Physiology, 87,
403–408.
178
Mero, A. & Komi, P. V. (1985). Effects of supramaximal velocity on biomechanical
variables in sprinting. International Journal of Sport Biomechanics, 1,
240–252.
Meur, Y. L., Thierry, B., Rabita, G., Dorel, S., Honnorat, G., Brisswalter, J., &
Hausswirth, C. (2013). Spring-mass behaviour during the run of an
international triathlon competition. International Journal of Sports Medicine,
34, 748–755.
Millet, G. P., Lepers, R., Maffiuletti, N. A., Babault, N., Martin, V., & Lattier, G.
(2002). Alterations of neuromuscular function after an ultramarathon. Journal
of Applied Physiology, 92, 486–492.
Millet, G. Y. & Lepers, R. (2004). Alterations of neuromuscular function after
prolonged running, cycling and skiing exercises. Sports Medicine, 34, 105–116.
Milner, C. E., Ferber, R., Pollard, C. D., Hamill, J., & Davis, I. S. (2006).
Biomechanical factors associated with tibial stress fractures in female runners.
Medicine and Science in Sports and Exercise, 38, 323–328.
Mizrahi, J., Verbitsky, O., & Isakov, E. (2000). Fatigue-related loading imbalance
on the shank in running: a possible factor in stress fractures. Annals of
Biomedical Engineering, 28, 463–469.
Mizrahi, J., Verbitsky, O., Isakov, E., & Daily, D. (2000). Effect of fatigue on leg
kinematics and impact acceleration in long distance running. Human
Movement Science, 19, 139–151.

179
Moe-Nilssen, R. (1998a). A new method for evaluating motor control in gait under
real-life environmental conditions. part 2: gait analysis. Clinical Biomechanics,
13, 328–335.
Moe-Nilssen, R. (1998b). Test-retest reliability of trunk accelerometry during
standing and walking. Archives of Physical Medicine and Rehabilitation, 79,
1377–1385.
Moe-Nilssen, R. (2010). Gait variability measures may represent different
constructs. Gait & Posture, 32, 98–101.
Moe-Nilssen, R. & Helbostad, J. L. (2004). Estimation of gait cycle characteristics
by trunk accelerometry. Journal of Biomechanics, 37, 121–126.
Morin, J. B., Tomazin, K., Edouard, P., & Millet, G. Y. (2011). Changes in running
mechanics and spring–mass behavior induced by a mountain ultra-marathon
race. Journal of Biomechanics, 44, 1104–1107.
Mtw user manual. (2013, November). Document MW0502P, Revision H. Xsens
Technologies. Enschede, NL.
Munro, C. F., Miller, D. I., & Fuglevand, A. J. (1987). Ground reaction forces in
running: a reexamination. Journal of Biomechanics, 20, 147–155.
Nakayama, Y., Kudo, K., & Ohtsuki, T. (2010). Variability and fluctuation in
running gait cycle of trained runners and non-runners. Gait & Posture, 31,
331–335.
Neumann, D. A. (2010). Kinesiology of the musculoskeletal system: foundations for
rehabilitation (2nd ed.). St. Louis, MO: Mosby.
180
Neville, J., Wixted, A., Rowlands, D., & James, D. (2010). Accelerometers: an
underutilized resource in sports monitoring. In 6th international conference on
intelligent sensors, sensor networks and information processing (ISSNIP)
(pp. 287–290). IEEE.
Nicol, C. & Komi, P. V. (2011). Stretch-shortening cycle fatigue. In P. V. Komi
(Ed.), Neuromusular aspects of sport performance (Chap. 12, Vol. 19,
pp. 183–215). The Encyclopedia of Sports Medicine (IOC). Oxford, UK: John
Wiley & Sons.
Nicol, C., Komi, P. V., Horita, T., Kyröläinen, H., & Takala, T. E. (1996). Reduced
stretch-reflex sensitivity after exhausting stretch-shortening cycle exercise.
European Journal of Applied Physiology and Occupational Physiology, 72,
401–406.
Nicol, C., Komi, P. V., & Marconnet, P. (1991a). Effects of marathon fatigue on
running kinematics and economy. Scandinavian Journal of Medicine &
Science in Sports, 1, 195–204.
Nicol, C., Komi, P. V., & Marconnet, P. (1991b). Fatigue effects of marathon
running on neuromuscular performance: I. changes in muscle force and
stiffness characteristics. Scandinavian Journal of Medicine & Science in
Sports, 1, 10–17.
Nicol, C., Komi, P. V., & Marconnet, P. (1991c). Fatigue effects of marathon
running on neuromuscular performance: II. changes in force, integrated
electromyographic activity and endurance capacity. Scandinavian Journal of
Medicine & Science in Sports, 1, 18–24.
181
Nigg, B. M. (1986). The biomechanics of running shoes. Champaign, IL: Human
Kinetics.
Nigg, B. M., Cole, G. K., & Brüggemann, G. P. (1995). Impact forces during
heel-toe running. Journal of Applied Biomechanics, 11, 407–432.
Nigg, B. M., Denoth, J., & Neukomm, P. A. (1981). Quantifying the load on the
human body: problems and some possible solutions. In A. Morecki, K. Fidelus,
K. Kedzior, & A. Wit (Eds.), Biomechanics VII-B (pp. 88–99).
Nigg, B. M. & Liu, W. (1999). The effect of muscle stiffness and damping on
simulated impact force peaks during running. Journal of Biomechanics, 32,
849–856.
Nilsson, J., Thorstensson, A., & Halbertsma, J. (1985). Changes in leg movements
and muscle activity with speed of locomotion and mode of progression in
humans. Acta Physiologica, 123, 457–475.
Noakes, T. (2007). The central governor model of exercise applied to the marathon.
Sports Medicine, 37, 374–377.
Novacheck, T. (1998). The biomechanics of running. Gait and Posture, 7, 77–95.
Nummela, A., Keranen, T., & Mikkelsson, L. (2007). Factors related to top running
speed and economy. International Journal of Sports Medicine, 28, 655–661.
Ogris, G., Leser, R., Horsak, B., Kornfeind, P., Heller, M., & Baca, S. (2012).
Accuracy of the lpm tracking system considering dynamic position changes.
Journal of Sports Journal of Sports Sciences, 30 (14), 1503–1511.

182
Öunpuu, S. (1994). The biomechanics of walking and running. Clinics in Sports
Medicine, 13, 843–863.
Owings, T. & Grabiner, M. (2003). Measuring step kinematic variability on an
instrumented treadmill: how many steps are enough? Journal of
Biomechanics, 36, 1215–1218.
Owings, T. & Grabiner, M. (2004). Step width variability, but not step length
variability or step time variability, discriminates gait of healthy young and
older adults during treadmill locomotion. Journal of Biomechanics, 37,
935–938.
Peng, C. K., Mietus, E. M., Liu, H., Lee, C., Hausdorff, J. M., Stanley, H. E., . . .
Lipsitz, L. A. (2002). Quantifying fractal dynamics of human respiration: age
and gender effects. Annals of Biomedical Engineering, 30, 683–692.
Petray, C. & Krahenbuhl, G. S. (1985). Running training instruction on running
technique, and running economy in 10 year-old males. Research Quarterly for
Exercise and Sport, 56, 251–255.
Pierrynowski, M. R., Gross, A., Miles, M., Galea, V., McLaughlin, L., &
McPhee, C. (2005). Reliability of the long-range power-law correlations
obtained from the bilateral stride intervals in asymptomatic volunteers whilst
treadmill walking. Gait & Posture, 22, 46–50.
Place, N., Lepers, R., Deley, G., & Millet, G. Y. (2004). Time course of
neuromuscular alterations during a prolonged running exercise. Medicine and
Science in Sports and Exercise, 36, 1347–1356.
183
Pohl, M. B., Hamill, J., & Davis, I. S. (2009). Biomechanical and anatomical factors
associated with a history of plantar fasciitis in female runners. Clinical
Journal of Sport Medicine, 19, 372–376.
Pollock, M. L., Jackson, A. S., & Pate, R. (1980). Discriminant analysis of
physiological differences between good and elite distance runners. Research
Quarterly for Exercise and Sport, 51, 521–532.
Powers, C. M. (2010). The influence of abnormal hip mechanics on knee injury: a
biomechanical perspective. Journal of Orthopaedic and Sports Physical
Therapy, 40, 42–51.
Proske, U., Morgan, D. L., & Gregory, J. E. (1993). Thixotropy in skeletal muscle
and in muscle spindles: a review. Progress in Neurobiology, 41, 705–721.
Purcell, B., Channells, J., James, D., & Barrett, R. (2005). Use of accelerometers for
detecting foot-ground contact time during running. In D. V. Nicolau (Ed.),
BioMEMS and nanotechnology II (Vol. 6036).
Queen, R., Gross, M., & Liu, H. (2006). Repeatability of lower extremity kinetics
and kinematics for standardized and self-selected running speeds. Gait and
Posture, 23, 282–287.
Rabita, G., Couturier, A., Dorel, S., Hausswirth, C., & Le Meur, Y. (2013). Changes
in spring-mass behavior and muscle activity during an exhaustive run at
VO2max. Journal of Biomechanics, 46, 2011–2017.
Radin, E. L. (1986). Role of muscles in protecting athletes from injury. Acta Medica
Scandinavica Supplementum, 711, 143–147.

184
Radin, E. L., Parker, H. G., Pugh, G. V., Steinberg, R. S., Paul, I. L., &
Rose, R. M. (1973). Response of joints to impact loading. Journal of
Biomechanics, 6, 51–57.
Regueme, S., Nicol, C., Barthèlemy, J., & Grélot, L. (2005). Acute and delayed
neuromuscular adjustments of the triceps surae muscle group to exhaustive
stretch-shortening cycle fatigue. European Journal of Applied Physiology and
Occupational Physiology, 93, 398–410.
Riley, M., Balasubramaniam, R., & Turvey, M. (1997). Common effects of touch and
vision on postural parameters. Experimental Brain Research, 117 (165-170).
Riley, P., Dicharry, J., Franz, J., Della Croce, U., Wilder, R., & Kerrigan, D. (2008).
A kinematics and kinetic comparison of overground and treadmill running.
Medicine and Science in Sports and Exercise, 40, 1093–1100.
Robbins, S. E. & Hanna, A. M. (1987). Running-related injury prevention through
barefoot adaptations. Medicine and Science in Sports and Exercise, 19,
148–156.
Roberts, T. J., Kram, R., Weyand, P. G., & Taylor, C. R. (1998). Energetics of
bipedal running: I. metabolic cost of generating force. Journal of Experimental
Biology, 201, 2745–2751.
Romanov, N. & Fletcher, G. (2007). Runners do not push off the ground but fall
forwards via a gravitational torque. Sports Biomechanics, 6, 434–452.
Rong, L., Jianzhong, Z., Ming, L., & Xiangfeng, H. (2007). A wearable acceleration
sensor system for gait recognition. In 2nd IEEE conference on industrial
electronics and applications, 2007 (pp. 2654–2659). IEEE.

185
Sabatini, A. M. A., Martelloni, C. C., Scapellato, S. S., & Cavallo, F. F. (2005).
Assessment of walking features from foot inertial sensing. IEEE Transactions
on Biomedical Engineering, 52, 486–494.
Sato, K., Smith, S. L., & Sands, W. A. (2009). Validation of an accelerometer for
measuring sport performance. Journal of Strength and Conditioning Research,
23, 341–347.
Saugy, J., Place, N., Millet, G. Y., Degache, F., Schena, F., & Millet, G. P. (2013).
Alterations of neuromuscular function after the world’s most challenging
mountain ultra-marathon. PLoS ONE, 8, e65596.
Schache, A. G., Blanch, P. D., Rath, D. A., Wrigley, T. V., Starr, R., &
Bennell, K. L. (2001). A comparison of overground and treadmill running for
measuring the three-dimensional kinematics of the lumbo-pelvic-hip complex.
Clinical Biomechanics, 16, 667–680.
Scholich, M. (1978). East german study of distance stride. Der Leichtathlet, 78,
2355–2359.
Seyfarth, A., Geyer, H., Günther, M., & Blickhan, R. (2002). A movement criterion
for running. Journal of Biomechanics, 35, 649–655.
Shorten, M. R. & Winslow, D. S. (1992). Spectral analysis of impact shock during
running. Journal of Applied Biomechanics, 8, 288–304.
Shrout, P. E. & Fleiss, J. L. (1979). Intraclass correlations: uses in assessing rater
reliability. Psychology Bulletin, 86, 420–428.

186
Siegle, M., Stevens, T., & Lames, M. (2013). Design of an accuracy study for
position detection in football. Journal of Sports Sciences, 31 (2), 166–172.
Siler, W. & Martin, P. (1991). Changes in running pattern during a treadmill run to
volitional exhaustion: fast versus slower runners. International Journal of
Sport Biomechanics, 7, 12–28.
Slawinski, J. S. & Billat, V. L. (2004). Difference in mechanical and energy cost
between highly, well, and nontrained runners. Medicine and Science in Sports
and Exercise, 36, 1440–1446.
Slawinski, J. S., Demarle, A., Koralsztein, J. P., & Billat, V. (2001). Effect of
supra-lactate threshold training on the relationship between mechanical stride
descriptors and aerobic energy cost in trained runners. Archives of Physiology
and Biochemistry, 109, 110–116.
Smith, T., McNaughton, L., & Marshall, K. (1999). Effects of 4-week training using
Vmax/Tmax on VO2max and performance in athletes. Medicine and Science
in Sports and Exercise, 31, 892–896.
Spurrs, R., Murphy, A., & Watsford, M. (2002). The effect of plyometric training on
distance running performance. European Journal of Applied Physiology, 89,
1–7.
Stergiou, N., Harbourne, R., & Cavanaugh, J. (2006). Optimal movement
variability: a new theoretical perspective for neurologic physical therapy.
Journal of Neurologic Physical Therapy, 30, 120–129.
187
Stone, M. H. (1988). Implications for connective tissue and bone alterations
resulting from resistance exercise training. Medicine and Science in Sports and
Exercise, 20, 162–168.
Strohrmann, C., Harms, H., Kappeler-Setz, C., & Tröster, G. (2012). Monitoring
kinematic changes with fatigue in running using body-worn sensors. IEEE
Transactions on Information Technology in Biomedicine, 16, 983–990.
Strohrmann, C., Harms, H., Tröster, G., Hensler, S., & Müller, R. (2011). Out of
the lab and into the woods: kinematic analysis in running using wearable
sensors. In Ubicomp ’11: proceedings of the 13th international conference on
ubiquitous computing,
Svedenhag, J. & Sjodin, B. (1984). Maximal and submaximal oxygen uptakes and
blood lactate levels in elite male middle- and long- distance runners.
International Journal of Sports Medicine, 5, 255–261.
Tanaka, H., Kevin, D., & Douglas, R. (2001). Age-predicted maximal heart rate
revisited. Journal of the American College of Cardiology, 37 (153-156).
Terrier, P. (2003). Variability of gait patterns during unconstrained walking
assessed by satellite positioning (GPS). European Journal of Applied
Physiology, 90, 554–561.
Terrier, P., Turner, V., & Schutz, Y. (2005). GPS analysis of human locomotion:
further evidence for long-range correlations in stride-to-stride fluctuations of
gait parameters. Human Movement Science, 24, 97–115.
Tortora, G. J. & Derrickson, B. H. (2012). Principles of anatomy and physiology
(13th ed.). Hoboken, NJ: John Wiley & Sons.

188
Troiano, R. P., Berrigan, D., Dodd, K. W., Mâsse, L. C., Tilert, T., & McDowell, M.
(2008). Physical activity in the united states measured by accelerometer.
Medicine and Science in Sports and Exercise, 40, 181–188.
van Ingen Schenau, G. J., Bobbert, M. F., & de Haan, A. (1997). Does elastic
energy enhance work and efficiency in the stretch-shortening cycle? Journal of
Applied Biomechanics, 13, 386–415.
van Ingen Schenau, G. J., de Koning, J. J., & de Groot, G. (1994). Optimization of
sprinting performance in running, cycling, and speed skating. Sports Medicine,
17, 259–275.
van Ingen-Schenau, G. J. (1980). Some fundamental aspects of the biomechanics of
overground versus treadmill locomotion. Medicine and Science in Sports and
Exercise, 12, 257–261.
Verbitsky, O., Mizrahi, J., Voloshin, A., & Treiger, J. (1998). Shock transmission
and fatigue in human running. Journal of Applied Biomechanics, 14, 300–311.
Verkerke, G. J., Ament, W., Wierenga, R., & Rakhorst, G. (1998). Measuring
changes in step parameters during an exhausting running exercise. Gait &
Posture, 8, 37–42.
Voloshin, A. S., Mizrahi, J., Verbitsky, O., & Isakov, E. (1998). Dynamic loading on
the human musculoskeletal system – effect of fatigue. Clinical Biomechanics,
13, 515–520.
Voloshin, A. & Wosk, J. (1982). An in-vivo study of low back pain and shock
absorption in the human locomotor system. Journal of Biomechanics, 15,
21–27.

189
Weyand, P. G., Sternlight, D. B., Bellizzi, M. J., & Wright, S. (2000). Faster top
running speeds are achieved with greater ground forces not more rapid leg
movements. Journal of Applied Physiology, 89, 1991–1999.
Whyte, G. P., George, K., Sharma, S., Lumley, S., Gates, P., Prasad, K., &
McKenna, W. J. (2000). Cardiac fatigue following prolonged endurance
exercise of different distances. Medicine and Science in Sports and Exercise,
32, 1067–1072.
Williams, D. S., Davis, I., Scholz, J. P., & Hamill, J. (2004). High-arched runners
exhibit increased leg stiffness compared to low-arched runners. Gait &
Posture, 19, 263–269.
Williams, D. S., McClay, I. S., & Hamill, J. (2001). Arch structure and injury
patterns in runners. Clinical Biomechanics, 16, 341–347.
Williams, K. R. (1985). Biomechanics of running. Exercise and Sport Sciences
Reviews, 13, 389–441.
Williams, K. R. (2000). The dynamics of running. In V. Zatsiorsky (Ed.),
Biomechanics in sport (Chap. 8, Vol. 9). The Encyclopedia of Sports Medicine
(IOC). Oxford, UK: Blackwell Science.
Williams, K. R., Cavanagh, P. R., & Ziff, J. (1987). Biomechanical studies of elite
female distance runners. International Journal of Sports Medicine, 8, 107–118.
Winter, D. A. (1978). Calculation and interpretation of mechanical energy of
movement. Exercise and Sport Sciences Reviews, 6, 182–201.

190
Winter, D. A. (1983). Moments of force and mechanical power in jogging. Journal of
Biomechanics, 16 (1), 91–97.
Winter, D. A. (2009). Biomechanics and motor control of human movement
(4th ed.). Hoboken, NJ: John Wiley & Sons.
Wixted, A., Billing, D. C., & James, D. (2010). Validation of trunk mounted inertial
sensors for analysing running biomechanics under field conditions, using
synchronously collected foot contact data. Sports Engineering, 12, 207–212.
Yang, S., Mohr, C., & Li, Q. (2011). Ambulatory running speed estimation using an
inertial sensor. Gait & Posture, 34, 462–466.
Zadpoor, A. A. & Nikooyan, A. A. (2012). The effects of lower-extremity muscle
fatigue on the vertical ground reaction force: a meta-analysis. Journal of
Engineering in Medicine, 226, 579–588.
Zhao, Y., Brahms, C., Gerhard, D., & Barden, J. M. (2015). Stance phase detection
for walking and running using an imu periodicity-based approach. In J.
Kacprzyk (Ed.), Advances in intelligent systems and computing (Vol. 392).
Proceedings of the 10th International Symposium on Computer Science in
Sports (ISCSS). IACSS. New York, NY: Springer.
Zijlstra, W. (2003). Assessment of spatio-temporal gait parameters from trunk
accelerations during human walking. Gait & Posture, 18, 1–10.

Please send all correspondence to: Office for Research, Innovation and Partnership University of Regina Research and Innovation Centre 109 Regina, SK S4S 0A2 Telephone: (306) 585-4775 Fax: (306) 585-4893 [email protected]
PRINCIPAL INVESTIGATOR DEPARTMENT REB# Clemens Markus Brahms Kinesiology and Health Studies 2014-174 4 – 2104 McIntyre St. Regina, SK S4P 2R7 SUPERVISOR Dr. John Barden – Kinesiology and Health Studies FUNDER(S) Unfunded TITLE Concurrent Validity of Body-Fixed IMUs to Estimate Stride Length and Stride-to-Stride Fluctuations in Running APPROVAL OF APPROVED ON RENEWAL DATE Consent Form Information Sheet Poster
October 16, 2014 October 16, 2015
______________________________________________________
Full Board Meeting
Delegated Review CERTIFICATION The University of Regina Research Ethics Board has reviewed the above-named research project. The proposal was found to be acceptable on ethical grounds. The principal investigator has the responsibility for any other administrative or regulatory approvals that may pertain to this research project, and for ensuring that the authorized research is carried out according to the conditions outlined in the original protocol submitted for ethics review. This Certificate of Approval is valid for the above time period provided there is no change in experimental protocol, consent process or documents. Any significant changes to your proposed method, or your consent and recruitment procedures should be reported to the Chair for Research Ethics Board consideration in advance of its implementation. ONGOING REVIEW REQUIREMENTS In order to receive annual renewal, a status report must be submitted to the REB Chair for Board consideration within one month of the current expiry date each year the study remains open, and upon study completion. Please refer to the following website for further instructions: http://www.uregina.ca/research/REB/main.shtml
Dr. Larena Hoeber, Chair University of Regina Research Ethics Board
Research Ethics Board Certificate of Approval
Appendix A
Ethics Approval Forms
A

Please send all correspondence to: Office for Research, Innovation and Partnership University of Regina Research and Innovation Centre 109 Regina, SK S4S 0A2 Telephone: (306) 585-4775 Fax: (306) 585-4893 [email protected]
PRINCIPAL INVESTIGATOR DEPARTMENT REB# 2014-232
Clemens Markus Brahms Kinesiology and Health Studies
4 – 2104 McIntyre Street
Regina, SK S4P 2R7
SUPERVISOR
Dr. John Barden - Kinesiology and Health Studies
FUNDER(S)
Unfunded
TITLE
Variability of Stride Kinematics and Impact Loading Characteristics During a Prolonged Run in Recreational and Elite Distance Runners
APPROVAL OF APPROVED ON RENEWAL DATE
Application for Behavioural Research Ethics Review
Consent Form
Information Sheet
Poster
February 5, 2015 February 5, 2016
______________________________________________________
Full Board Meeting
Delegated Review
CERTIFICATION The University of Regina Research Ethics Board has reviewed the above-named research project. The proposal was found to be
acceptable on ethical grounds. The principal investigator has the responsibility for any other administrative or regulatory approvals
that may pertain to this research project, and for ensuring that the authorized research is carried out according to the conditions
outlined in the original protocol submitted for ethics review. This Certificate of Approval is valid for the above time period provided
there is no change in experimental protocol, consent process or documents.
Any significant changes to your proposed method, or your consent and recruitment procedures should be reported to the Chair for
Research Ethics Board consideration in advance of its implementation.
ONGOING REVIEW REQUIREMENTS In order to receive annual renewal, a status report must be submitted to the REB Chair for Board consideration
within one month of the current expiry date each year the study remains open, and upon study completion.
Please refer to the following website for further instructions: http://www.uregina.ca/research/REB/main.shtml
Dr. Larena Hoeber, Chair
University of Regina
Research Ethics Board
Research Ethics Board Certificate of Approval

Please send all correspondence to: Office for Research, Innovation and Partnership University of Regina Research and Innovation Centre 109 Regina, SK S4S 0A2 Telephone: (306) 585-4775 Fax: (306) 585-4893 [email protected]
PRINCIPAL INVESTIGATOR DEPARTMENT REB# 2014-233
Clemens Markus Brahms Kinesiology and Health Studies
4 – 2104 McIntyre Street
Regina, SK S4P 2R7
SUPERVISOR
Dr. John Barden - Kinesiology and Health Studies
FUNDER(S)
Unfunded
TITLE
The Effects of Stiffness Modification on Variability and Running Mechanics in Recreational and Elite Distance Runners
APPROVAL OF APPROVED ON RENEWAL DATE
Application for Behavioural Research Ethics Review
Consent Form
Information Sheet
Poster
February 5, 2015 February 5, 2016
______________________________________________________
Full Board Meeting
Delegated Review
CERTIFICATION The University of Regina Research Ethics Board has reviewed the above-named research project. The proposal was found to be
acceptable on ethical grounds. The principal investigator has the responsibility for any other administrative or regulatory approvals
that may pertain to this research project, and for ensuring that the authorized research is carried out according to the conditions
outlined in the original protocol submitted for ethics review. This Certificate of Approval is valid for the above time period provided
there is no change in experimental protocol, consent process or documents.
Any significant changes to your proposed method, or your consent and recruitment procedures should be reported to the Chair for
Research Ethics Board consideration in advance of its implementation.
ONGOING REVIEW REQUIREMENTS In order to receive annual renewal, a status report must be submitted to the REB Chair for Board consideration
within one month of the current expiry date each year the study remains open, and upon study completion.
Please refer to the following website for further instructions: http://www.uregina.ca/research/REB/main.shtml
Dr. Larena Hoeber, Chair
University of Regina
Research Ethics Board
Research Ethics Board Certificate of Approval

Faculty of Kinesiology and Health Studies
CONSENT FORM
Concurrent Validity of Body-Fixed IMUs to Estimate Stride Length and Stride-to-Stride Fluctuations in Running
Principal Investigators:
Clemens M. Brahms Faculty of Kin. & Health Studies University of Regina Regina, SK S4S 0A2 Phone: (306) 551-9155 E-mail: [email protected]
Dr. John Barden Faculty of Kin. & Health Studies University of Regina Regina, SK S4S 0A2 Phone: (306) 585-4629 E-mail: [email protected]
To be completed by the participant:
Have you read and received a copy of the attached Information Sheet? Yes No Do you understand the benefits and risks involved in taking part in this research study? Yes No Have you had an opportunity to ask questions regarding the study? Yes No Do you understand that you are free to refuse to participate or withdraw from the study at any time? Yes No Has the issue of confidentiality been explained to you? Yes No If you are currently a student in a class of one of the investigators: Do you understand that participation will not result in favorable treatment in class? Yes No Are you currently between the ages of 20 and 35? Yes No
This study was explained to me by: _____________________________
I agree to take part in this study.
_________________________ _________ _________________________
Signature of participant Date Witness
_________________________ _________________________
Printed Name Printed Name
I believe that the person signing this form understands what is involved in the study and voluntarily agrees to participate.
_________________________ ____________
Signature of Investigator Date Date
This project has been approved by the Research Ethics Board of the University of Regina. If you have any questions or concerns about your rights or treatment as a research participant, you may contact the Chair of the University Research Ethics Board by phone at 585-4775 or by e-mail at [email protected]. Should you have any questions or wish to discuss the procedures or objectives of the study, please contact Clemens Brahms via phone (306) 216-6847 or e-mail ([email protected]).
THE INFORMATION SHEET MUST BE ATTACHED TO THIS CONSENT FORM AND A COPY GIVEN TO THE RESEARCH PARTICIPANT
Appendix B
Consent Form Study 1
B

Faculty of Kinesiology and Health Studies
INFORMATION SHEET
Concurrent Validity of Body-Fixed IMUs to Estimate Stride Length and Stride-to-Stride Fluctuations in Running
Principal Investigators:
Clemens M. Brahms Faculty of Kin. & Health Studies University of Regina Regina, SK S4S 0A2 Phone: (306) 551-9155 E-mail: [email protected]
Dr. John Barden Faculty of Kin. & Health Studies University of Regina Regina, SK S4S 0A2 Phone: (306) 585-4629 E-mail: john.barden@uregina
PURPOSE OF THE STUDY:
The purpose of this study is to determine whether body-mounted sensors can provide valid estimates for stride length (SL) during distance running. In particular, the accuracy of two existing methods will be tested with a camera system as the criterion.
BACKGROUND:
Stride length is an important variable of running. It can be precisely assessed with force plates or cameras. Since the advent of cost-effective and accurate inertial sensors, several studies have tried to estimate SL by attaching these sensors to the body (Jimenez et al., 2009; Martin, 2011). However, this is difficult because small errors will add up over time. Additionally, most studies have tried to determine SL during walking on a flat surface. To the best of our knowledge, no study exists that has examined the precision of body-mounted sensors to calculate SL and its variability for running.
PROCEDURE:
An inertial sensor will be placed on your right foot. It will be firmly attached using the shoe’s laces and adhesive tape. Additionally, you will be equipped with a small accelerometer, which will be secured to your lower back region with a waist-belt. Once equipped with these sensors, you will be asked to perform a series of twenty short runs (approx. 10m) through a calibrated camera space. You will also be asked to naturally vary your running speed between trials. The time required to collect the data will be approximately 20-30 minutes.
RISKS/BENEFITS:
There are no known risks associated with the short runs. The sensors used in this project are attached to the body in a way that they do not interfere with your natural movements. You will be able to stop running on your own account at any point during the experiment. Your participation will help to develop a tool that is able to accurately measure stride length in running. This tool could be used to improve running technique and detect injury.
CONFIDENTIALITY/FREEDOM TO WITHDRAW:
Group averages rather than individual data will be reported. If it becomes necessary to report individual data, an anonymous subject code and trial number will be used. Individual subject codes (e.g., Subject 1a) will be the only reference to any presentation of individual data. Only the investigators will have access to participant information. Investigators will not directly identify any participants in the study. Participation is strictly voluntary. You are free to withdraw from the study at any time. Data from this study will not be used in future studies without approval from an ethics committee.
If you have any questions about the study or wish to provide comments about the research and its procedure, please contact Clemens Brahms at (306) 551-9155 or via e-mail at [email protected]; or Dr. John M. Barden at (306) 585-4629 or via e- mail at [email protected].
Appendix C
Information Sheet Study 1
C

CONSENT FORM
Variability of Stride Kinematics and Impact Loading Characteristics During a Prolonged Run in Recreational and Elite Distance Runners
Principal Investigators:
Clemens M. Brahms Faculty of Kin. & Health Studies University of Regina Regina, SK S4S 0A2 Phone: (306) 551-9155 E-mail: [email protected]
Dr. John Barden Faculty of Kin. & Health Studies University of Regina Regina, SK S4S 0A2 Phone: (306) 585-4629 E-mail: [email protected]
To be completed by the participant:
Have you read and received a copy of the attached Information Sheet? Yes No Do you understand the benefits and risks involved in taking part in this research study? Yes No Have you had an opportunity to ask questions regarding the study? Yes No Do you understand that you are free to refuse to participate or withdraw from the study at any time? Yes No Has the issue of confidentiality been explained to you? Yes No If you are currently a student in a class of one of the investigators: Do you understand that participation will not result in favorable treatment in class? Yes No Do you understand that no negative consequences will result from not choosing to participate? Yes No
This study was explained to me by: _____________________________
I agree to take part in this study.
_________________________ _________
Signature of participant Date
_________________________
Printed Name
I believe that the person signing this form understands what is involved in the study and voluntarily agrees to participate.
_________________________ ____________
Signature of Investigator Date Date
This project has been approved by the Research Ethics Board of the University of Regina on _________. If you have any questions or concerns about your rights or treatment as a research participant, you may contact the Chair of the University Research Ethics Board by phone at 585-4775 or by e-mail at [email protected]. Should you have any questions or wish to discuss the procedures or objectives of the study, please contact Clemens Brahms by phone (306) 551-9155 or e-mail ([email protected]).
THE INFORMATION SHEET MUST BE ATTACHED TO THIS CONSENT FORM AND A COPY GIVEN TO THE RESEARCH PARTICIPANT
Appendix D
Consent Form Study 2
D

INFORMATION SHEET Variability of Stride Kinematics and Impact Loading Characteristics During a Prolonged
Run in Recreational and Elite Distance Runners
Principal Investigators:
Clemens M. Brahms Faculty of Kin. & Health Studies University of Regina Regina, SK S4S 0A2 Phone: (306) 551-9155 E-mail: [email protected]
Dr. John Barden Faculty of Kin. & Health Studies University of Regina Regina, SK S4S 0A2 Phone: (306) 585-4629 E-mail: john.barden@uregina
PURPOSE OF THE STUDY:
This project is designed to investigate the relationship between gait variability and running mechanics under fatiguing conditions using body-mounted sensors. It will also assess the extent to which these relationships differ between recreational and competitive distance runners.
BACKGROUND:
Prolonged distance running requires continuous effort and eventually causes muscle fatigue. It has been shown that this can fundamentally alter the running mechanics of an individual. Measures of variability and temporal stability convey important information about the control of gait and have been reported to change with fatigue. However, these results are still preliminary and require further investigation.
PROCEDURE:
Wireless sensors will be securely attached to your trunk and foot. Additionally, you will also be equipped with a heart rate monitor and an associated footpod that monitors speed and triggers an audible alarm when running speed changes significantly. Once equipped with the sensors, you will be asked to complete a fatiguing run at a constant, predetermined running speed on an indoor running track. The run will end when your running speed repeatedly drops below a pre-defined, individualized threshold. The estimated time requirement for participation in this study will be 60-75 minutes.
RISKS/BENEFITS:
There are no known risks associated with the overground running trials. The body-mounted sensors used in this project are attached in a way that will not interfere with your natural movements. You might experience some discomfort and considerable exhaustion at the end of the run. Guidance in terms of medical assistance will be provided to you prior to the test protocol. There is also a small risk of over-exertion. If your perceived exertion is becoming severe, you can terminate the run on your own account at any point during the experiment. Your participation will help to develop a potentially important screening tool to detect signs of fatigue and overtraining, which could lead to more efficient methods for injury prevention.
CONFIDENTIALITY/FREEDOM TO WITHDRAW:
Group averages rather than individual data will be reported. If it becomes necessary to report individual data, the data will be referred to by an anonymous subject code and trial number. Individual subject codes (e.g., Subject 1a) will be the only reference to any presentation of individual data. Only the investigators will have access to participant information. There are no circumstances that would require the investigators to directly identify any participants in the study. Participation is strictly voluntary and you are free to withdraw from the study at any time. You can request that your data will be deleted after participation in the study. Data from this study will not be used in future studies without further approval from an ethics committee.
Appendix E
Information Sheet Study 2
E

STUDYINTAKEFORM
StrideKinematics,ImpactLoadingCharacteristicsandVariabilityoveraProlongedRuninRecreationalandEliteDistanceRunners YES NO
Areyouunder18yearsofage?
Areyouover35yearsofage?
Doyouhaveanymedicalconditionthatcouldbeworsenedbyprolongedrunning?
Haveyouhadsurgeryoranyrunningrelatedinjuryorinthepast6monthsthatpreventedyoufromtrainingformorethan7days?
Howmanyhours,onaverage,doyourunperweek?
Areyoucurrentlyacompetitivedistancerunner?
Age: _________________Gender: _________________
Height: _________________Weight: _________________
ParticipantNumber: ______________Whatisyoumostrecent5ktime? _____________Howmanyhours,onaverage,doyourunperweek? _____________
Appendix F
Participant Intake Form Study 2
F

RPE BORG SCALE RATING DESCRIPTION 6 NO EXERTION AT ALL 7 EXTREMELY LIGHT 8 9 VERY LIGHT 10 11 LIGHT 12 13 SOMEWHAT HARD 14 15 HARD (HEAVY) 17 VERY HARD 18 19 EXTREMELY HARD 20 MAXIMAL EXERTION
Appendix G
RPE / Borg Scale
G

Faculty of Kinesiology and Health Studies
CONSENT FORM
The Effects of Stiffness Modification on Variability and Running Mechanics in Recreational and Elite Distance Runners
Principal Investigators:
Clemens M. Brahms Faculty of Kin. & Health Studies University of Regina Regina, SK S4S 0A2 Phone: (306) 551-9155 E-mail: [email protected]
Dr. John Barden Faculty of Kin. & Health Studies University of Regina Regina, SK S4S 0A2 Phone: (306) 585-4629 E-mail: [email protected]
To be completed by the participant:
Have you read and received a copy of the attached Information Sheet? Yes No Do you understand the benefits and risks involved in taking part in this research study? Yes No Have you had an opportunity to ask questions regarding the study? Yes No Do you understand that you are free to refuse to participate or withdraw from the study at any time? Yes No Has the issue of confidentiality been explained to you? Yes No If you are currently a student in a class of one of the investigators: Do you understand that participation will not result in favorable treatment in class? Yes No Are you currently between the ages of 18 and 35? Yes No
This study was explained to me by: _____________________________
I agree to take part in this study.
_________________________ _________ _________________________
Signature of participant Date Witness
_________________________ _________________________
Printed Name Printed Name
I believe that the person signing this form understands what is involved in the study and voluntarily agrees to participate.
_________________________ ____________
Signature of Investigator Date Date
This project has been approved by the Research Ethics Board of the University of Regina. If you have any questions or concerns about your rights or treatment as a research participant, you may contact the Chair of the University Research Ethics Board by phone at 585-4775 or by e-mail at [email protected]. Should you have any questions or wish to discuss the procedures or objectives of the study, please contact Clemens Brahms by phone (306) 551-9155 or e-mail ([email protected]).
THE INFORMATION SHEET MUST BE ATTACHED TO THIS CONSENT FORM AND A COPY GIVEN TO THE RESEARCH PARTICIPANT
Appendix H
Consent Form Study 3
H

Faculty of Kinesiology and Health Studies
INFORMATION SHEET
The Effects of Stiffness Modification on Variability and Running Mechanics in Recreational and Elite Distance Runners
Principal Investigators:
Clemens M. Brahms Faculty of Kin. & Health Studies University of Regina Regina, SK S4S 0A2 Phone: (306) 551-9155 E-mail: [email protected]
Dr. John Barden Faculty of Kin. & Health Studies University of Regina Regina, SK S4S 0A2 Phone: (306) 585-4629 E-mail: john.barden@uregina
PURPOSE OF THE STUDY:
This project is designed to test whether fatigue-induced alterations in leg and joint stiffness are associated with changes in movement variability during running. It will also investigate whether altered joint stiffness has similar effects on measures of stride pattern self-similarity in both elite distance runners and recreational runners.
BACKGROUND:
Although it is generally thought that self-similar patterns emerge within the central nervous system, there is evidence to suggest that these so-called long-range correlations (LRCs) present in gait variables may have biomechanical origins. It has further been established that prolonged stretch-shortening cycle exercise, such as hopping and jumping, causes a reduction in the force generating capacity of the active muscles and fundamentally alters the biomechanics of running. In order to elucidate the meaning of LRCs in running gait, this study will investigate the relationship between fatigue-induced alterations in stiffness and movement variability. A second objective of this study will be to determine whether altered joint stiffness has similar effects on LRCs in both elite distance runners and recreational runners.
PROCEDURE:
After a short warm-up, reflective markers will be placed on your lower extremity to track leg movements. Subsequently, you will be asked perform a 2-minute run on a force-plate mounted treadmill. All runs in this experiment will be performed at your preferred running speed. After the short run, you will complete an 8-minute overground run on a running track while wearing a waist-mounted accelerometer. Following this pre-test, participants will participate in a jumping protocol which will consist of 100 single drop jumps from a predetermined height, with one jump being performed every 5 seconds. After this series of jumps, you will be asked to continuously jump in place until you feel you can no longer continue. For all jumps, you will be asked to keep your hands placed firmly against your waist to prevent the use of your arms to increase jump height.
Upon completion of the protocol, you will again be equipped with reflective markers and asked to perform another 2 minute run on the force-plate mounted treadmill to re-evaluate knee, ankle and leg stiffness. Subsequently, LRCs will be re-assessed using the body-mounted accelerometer on a running track. The total time requirement for participation in this study will be approximately 60 minutes.
RISKS/BENEFITS:
There are no known risks associated with the overground running trials. The body-mounted sensors used in this project will be attached in a way that will not interfere with your natural movements. You might experience some discomfort and considerable exhaustion at the end of the jumping protocol. Participants who are unaccustomed to repetitive jumping might also experience some degree muscle soreness or over-exertion. Guidance in terms of medical assistance will be provided to you prior to the test protocol. If your perceived exertion is becoming severe, you can stop running or jumping on your own account at any point during the experiment. Your participation will help to develop a potentially important screening tool for running injuries, which could lead to more efficient methods for injury prevention.
Appendix I
Information Sheet Study 3
I

STUDYINTAKEFORM
TheEffectsofStiffnessModificationonVariabilityandRunningMechanicsinRecreationalandEliteDistanceRunners
YES NO
Areyouunder18yearsofage?
Areyouover35yearsofage?
Doyouhaveanymedicalconditionthatcouldbeworsenedbytheproceduresdescribedontheinformationsheet?
Haveyouhadsurgeryoranyinjuryorinthepast6monthsthatpreventedyoufromrunning/trainingformorethan7days?
Howmanyhours,onaverage,doyourunperweek?
Areyoucurrentlyacompetitivedistancerunner?
Age: _________________Gender: _________________
Height: _________________Weight: _________________
ParticipantNumber: ______________Howmanyhours,onaverage,doyourunperweek? _____________
Appendix J
Participant Intake Form Study 3
J


![EKF Estimation of Stride Width from Individual IMU-based ... · determining individual stride metrics (e.g. stride time, stride speed, foot clearance, stride length, etc.)[9][1],](https://static.fdocuments.us/doc/165x107/5ec0069b65be937c564c10bb/ekf-estimation-of-stride-width-from-individual-imu-based-determining-individual.jpg)