mBank-CASE Seminar 132 - Is Europe Overbanked? prof. Marco Pagano
Upload
quinn-terrellCategory
view
36download
0description
Why do we need something new?
What is a z-score?
How does the regression work?
How good are the results?
How to stay out of trouble?

Why do we need something new or different?
Challenges forecasters face:
Data-rich mixed with data-poor stations
Missing realtime data
High cross-correlation of variables(“co-linearity”)
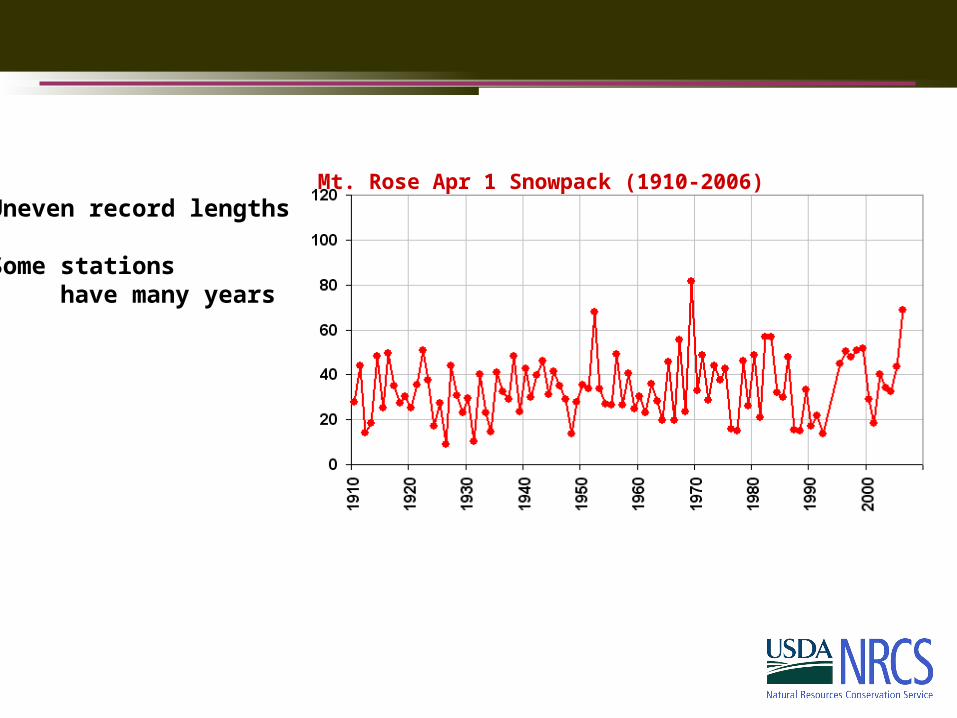
Mt. Rose Apr 1 Snowpack (1910-2006) Uneven record lengths
Some stations have many years

Mt. Rose Apr 1 Snowpack (1910-2006)
Mt. Rose Water Year Precipitation (1981-2005)
Uneven record lengths
Some stations have many years
Others have fewer
Typical regression requires completeness
Overlapping record

Mt. Rose Apr 1 Snowpack (1910-2006)
Mt. Rose Water Year Precipitation (1981-2005)
Uneven record lengths
Some stations have many years
Others have fewer
Typical regression requires completeness
The choice in this situation has been:Use fewer stations or use fewer years
Overlapping record

Why this is a problem
To use new, younger stations, older information has to be “forgotten”.
Otherwise, a station must existfor a long time before becoming useable.
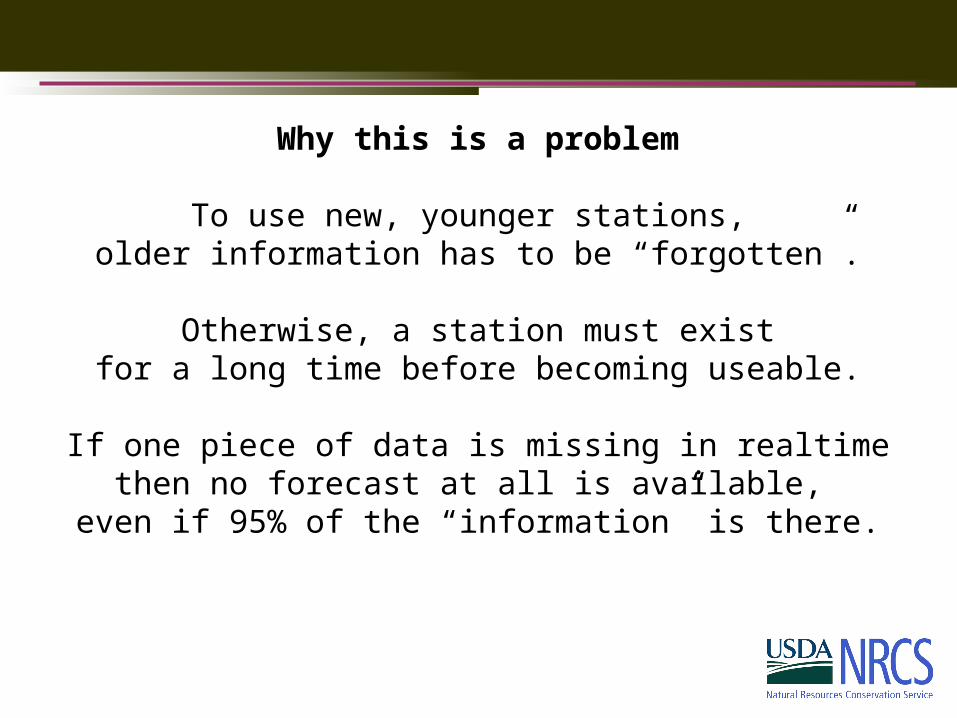
Why this is a problem
To use new, younger stations, older information has to be “forgotten”.
Otherwise, a station must existfor a long time before becoming useable.
If one piece of data is missing in realtimethen no forecast at all is available,
even if 95% of the “information” is there.

What does z-score regression do?
1. Combines predictors into weighted indices,emphasizing good stations, minimizing bad ones.
What does z-score regression do?
1. Combines predictors into weighted indices,emphasizing good stations, minimizing bad ones.
2. Compensates for missing data with remaining data.
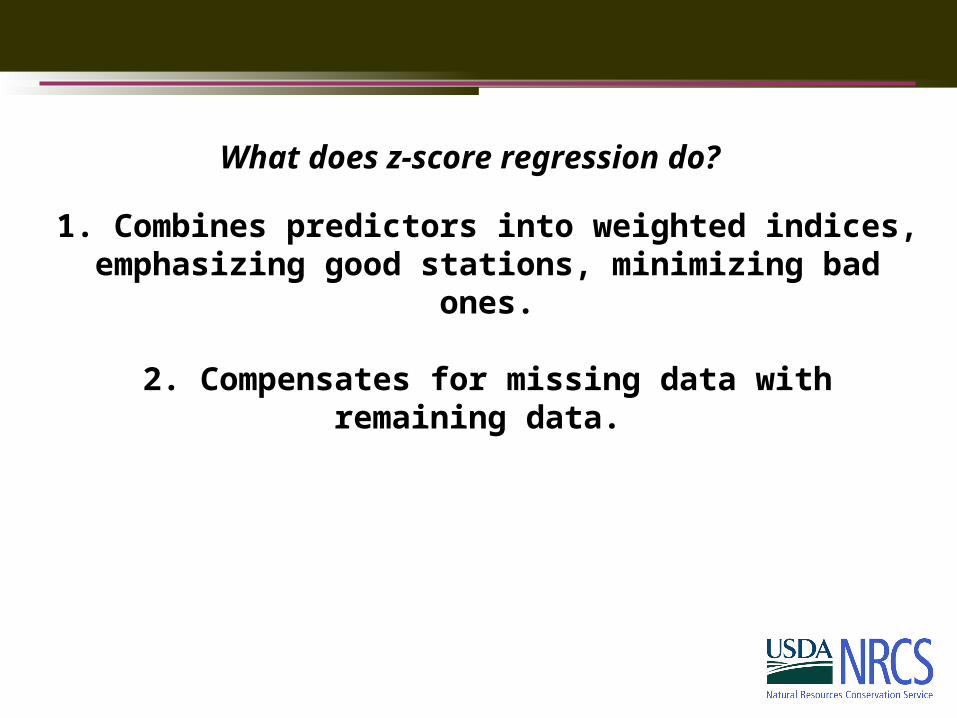
What does z-score regression do?
1. Combines predictors into weighted indices,emphasizing good stations, minimizing bad ones.
2. Compensates for missing data with remaining data.
3. Regresses index against target predictand

What is a z-score?
A z-score is a “normalized anomaly”:Z = value - average
standard deviation

What is a z-score?
A z-score is a “normalized anomaly”:Z = value - average
standard deviation

What is a z-score?
A z-score is a “normalized anomaly”:Z = value - average
standard deviation
60
135
avg stdev
30
15

What is a z-score?
A z-score is a “normalized anomaly”:Z = value - average
standard deviation
60
135
avg stdev
30
15
Z = (90 – 60)/15 = +2

Z-s
core
s
wetter
drier
Stations are now on an “even footing”
0
avg stdev
1
What is a z-score?
+2

Z-s
core
s
wetter
drier
If one station is partially missing, the other station hints
at what it might have been.
0
avg stdev
1
What is a z-score?
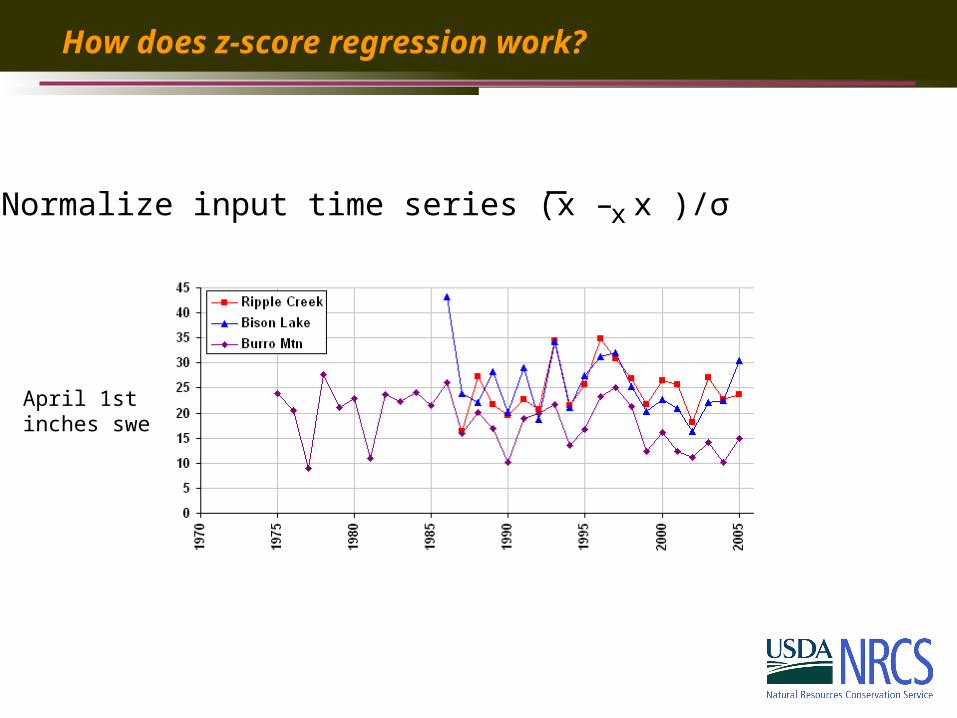
1. Normalize input time series (x – x )/σ
April 1stinches swe
x
How does z-score regression work?
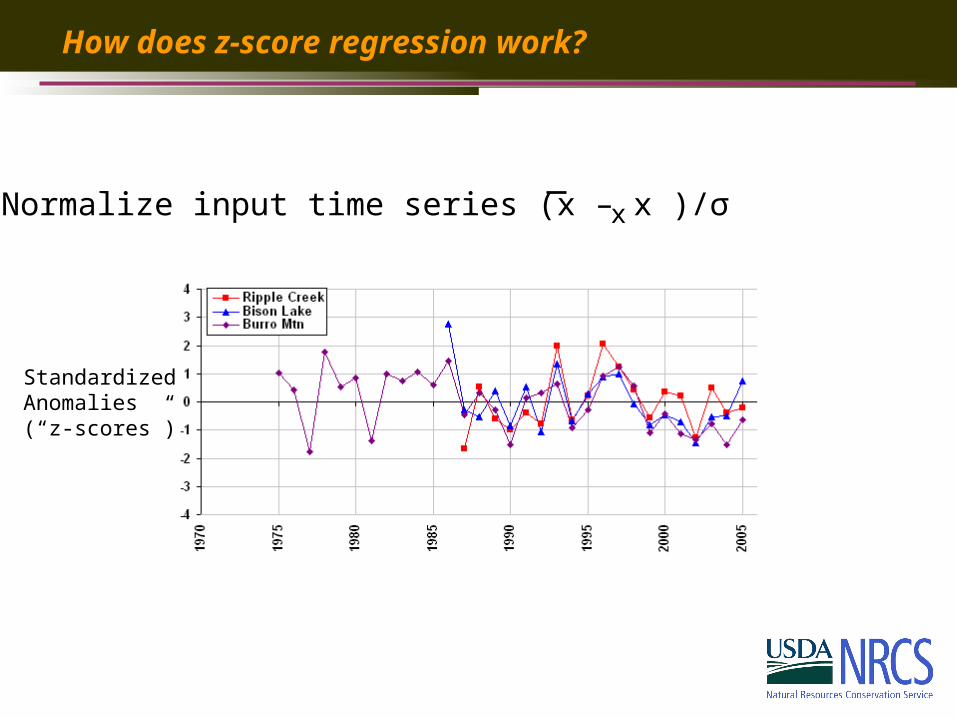
StandardizedAnomalies(“z-scores”)
1. Normalize input time series (x – x )/σx
How does z-score regression work?

2. Correlate each index with target (flow) to get weights
StandardizedAnomalies(“z-scores”)
r^2 with Apr-Jul
flow
0.480.520.61
How does z-score regression work?

3. Develop weighted average of available sites
StandardizedAnomalies(“z-scores”)
r^2 with Apr-Jul
flow0.480.520.61
Relativeweightings
e.g.A*x1 + B*x2
A + B
How does z-score regression work?

3. Develop weighted average of available sites
StandardizedAnomalies(“z-scores”)
Relativeweightings
e.g.A*x1 + B*x2
A + B
r^2 with Apr-Jul
flow0.480.520.61
How does z-score regression work?
Weighted average

Multi-station z-score index
Observed
4. Regress multi-station
weighted index against flow
How does z-score regression work?

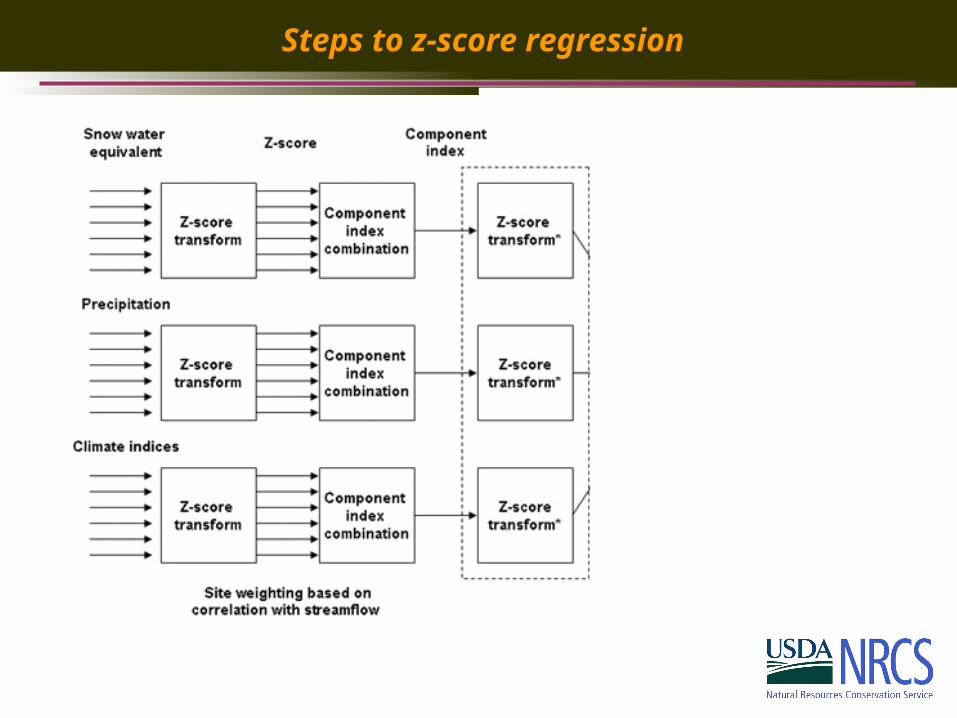
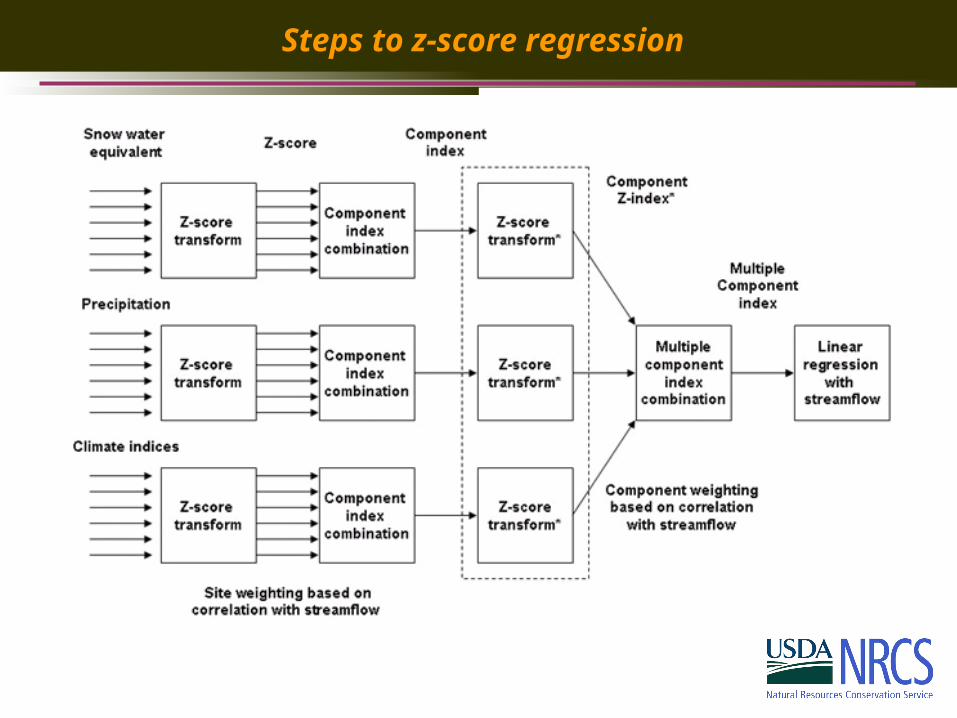
In the case of multiple signals, stations with a like signal (e.g. fall precipitation)
are combined by the userinto their own respective “group index”, weighted by their combination with flow.
The use of “groups” (aka components)

In the case of multiple signals, stations with a like signal (e.g. fall precipitation)
are combined by the userinto their own respective “group index”, weighted by their combination with flow.
All the group indices are then combined into a “master index”,
weighted, again, by their correlation with flow.
The master index is regressed against flow.
The use of “groups” (aka components)

Steps to z-score regression

Steps to z-score regression
Steps to z-score regression

Steps to z-score regression
Steps to z-score regression

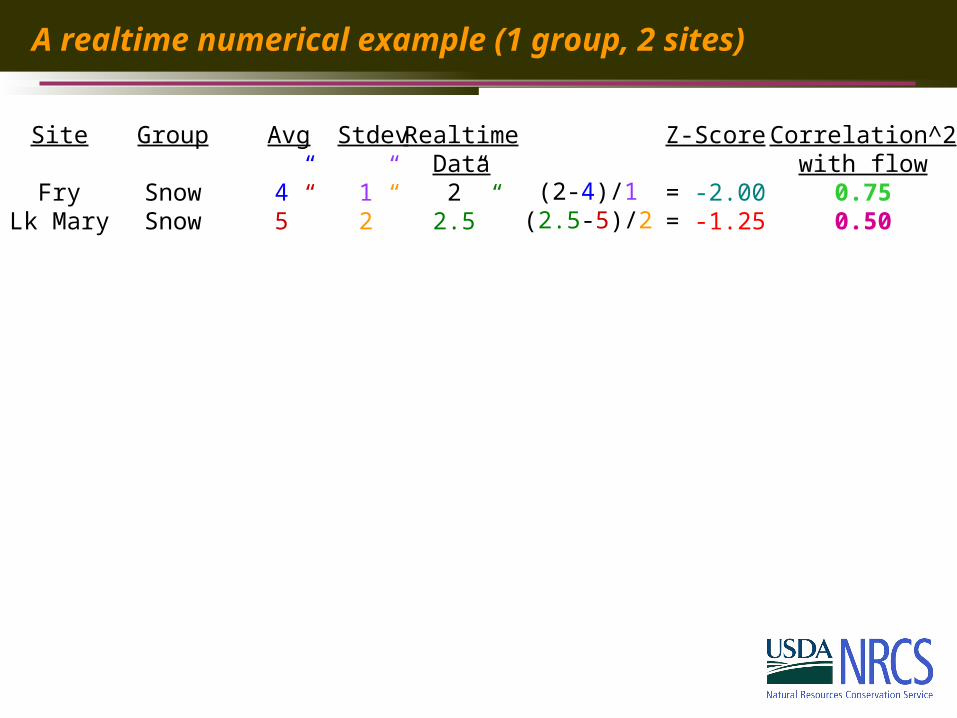
A realtime numerical example (1 group, 2 sites)
Site
FryLk Mary
Group
SnowSnow
Avg
4”5”
Stdev
1”2”
RealtimeData
2”2.5”
Z-Score
= -2.00= -1.25
Correlation^2with flow
0.750.50
Group
Snow-2*0.75 + -1.25*0.50
0.75+0.50
Group index
= -1.7
(2-4)/1(2.5-5)/2
A realtime numerical example (1 group, 2 sites)
Site
FryLk Mary
Group
SnowSnow
Avg
4”5”
Stdev
1”2”
RealtimeData
2”2.5”
Z-Score
= -2.00= -1.25
Correlation^2with flow
0.750.50
Group
Snow-2*0.75 + -1.25*0.50
0.75+0.50
Group index
= -1.7
(2-4)/1(2.5-5)/2

A realtime numerical example (1 group, 2 sites)
Site
FryLk Mary
Group
SnowSnow
Avg
4”5”
Stdev
1”2”
RealtimeData
2”2.5”
Z-Score
= -2.00= -1.25
Correlation^2with flow
0.750.50
Group
Snow-2*0.75 + -1.25*0.50
0.75+0.50
Group index
= -1.7
(2-4)/1(2.5-5)/2

A realtime numerical example (3 sites)
Site
FryLk MaryNewman
Group
SnowSnowSnow
Avg
4”5”
12”
Stdev
1”2”4”
RealtimeData
2”2.5”6”
Z-Score
= -2.00= -1.25= -1.50
Correlation^2with flow
0.750.500.65
Group
Snow-2*0.75 + -1.25*0.50 + -1.5*0.65
0.75+0.50+0.65
Group index
= -1.63
(2-4)/1(2.5-5)/2(6-12)/4

A realtime numerical example (3 sites, 1 missing)
Site
FryLk MaryNewman
Group
SnowSnowSnow
Avg
4”5”
12”
Stdev
1”2”4”
RealtimeData
2”missing
6”
Z-Score
= -2.00= missing
= -1.50
Correlation^2with flow
0.750.500.65
Group
Snow-2*0.75 + -1.25*0.50 + -1.5*0.65
0.75+0.50+0.65
Group index
= -1.77
(2-4)/1
(6-12)/4

A realtime numerical example (2 groups, 3 sites)
Site
FryLk Mary
Fry
Group
SnowSnow
Precip
Avg
4”5”
6”
Stdev
1”2”
2”
RealtimeData
2”2.5”
3”
Z-Score
= -2.00= -1.25
= -1.50
Correlation^2with flow
0.750.50
0.25
Group
Snow
Precip
-2*0.75 + -1.25*0.50 0.75+0.50
-1.5 * 0.250.25
Group index
= -1.7
= -1.5
Group Correlation^2
with flow
0.6
0.25
Master index -1.7*0.6 + -1.5*0.25 = -1.64 0.6+0.25
(2-4)/1(2.5-5)/2
(3-6)/2
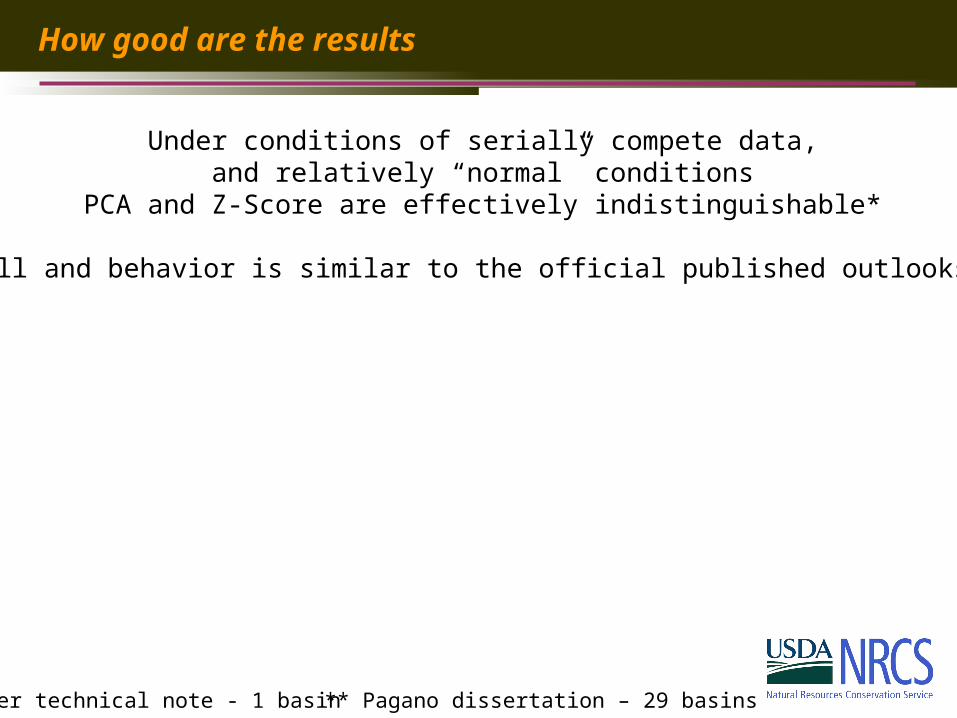
How good are the results
Under conditions of serially compete data,and relatively “normal” conditions
PCA and Z-Score are effectively indistinguishable*
Skill and behavior is similar to the official published outlooks**
*Viper technical note - 1 basin ** Pagano dissertation – 29 basins

How good are the results
Under conditions of serially compete data,and relatively “normal” conditions
PCA and Z-Score are effectively indistinguishable*
Skill and behavior is similar to the official published outlooks**
However… Any tool is a weapon if you hold it right.
(aka “A fool with a tool is still a tool”)
*Viper technical note - 1 basin ** Pagano dissertation – 29 basins

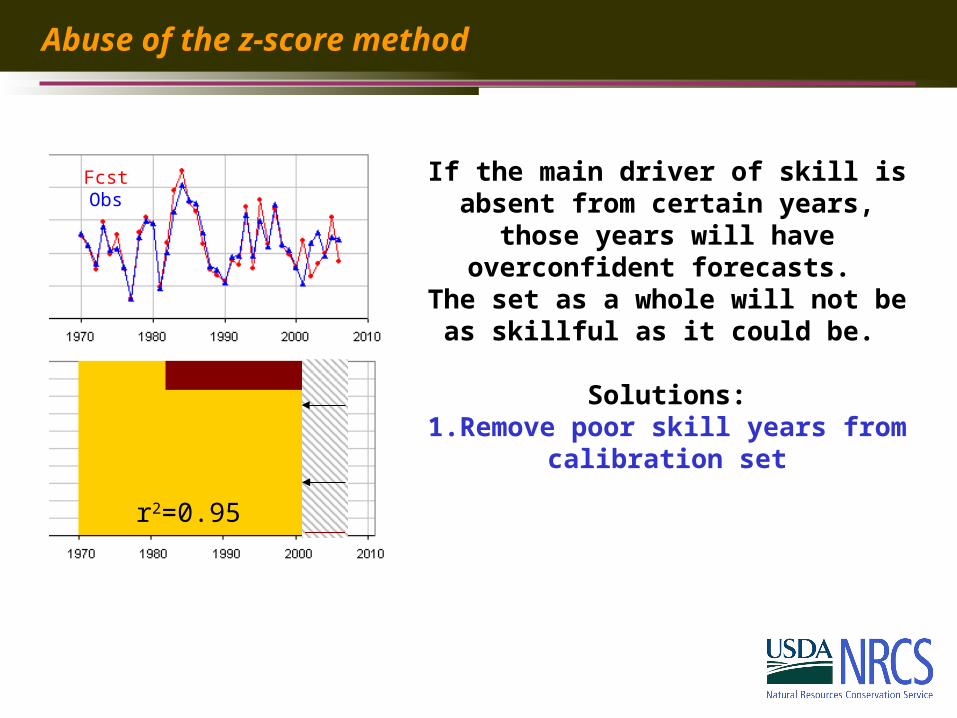
Abuse of the z-score method
r2=0.95
r2=0.18
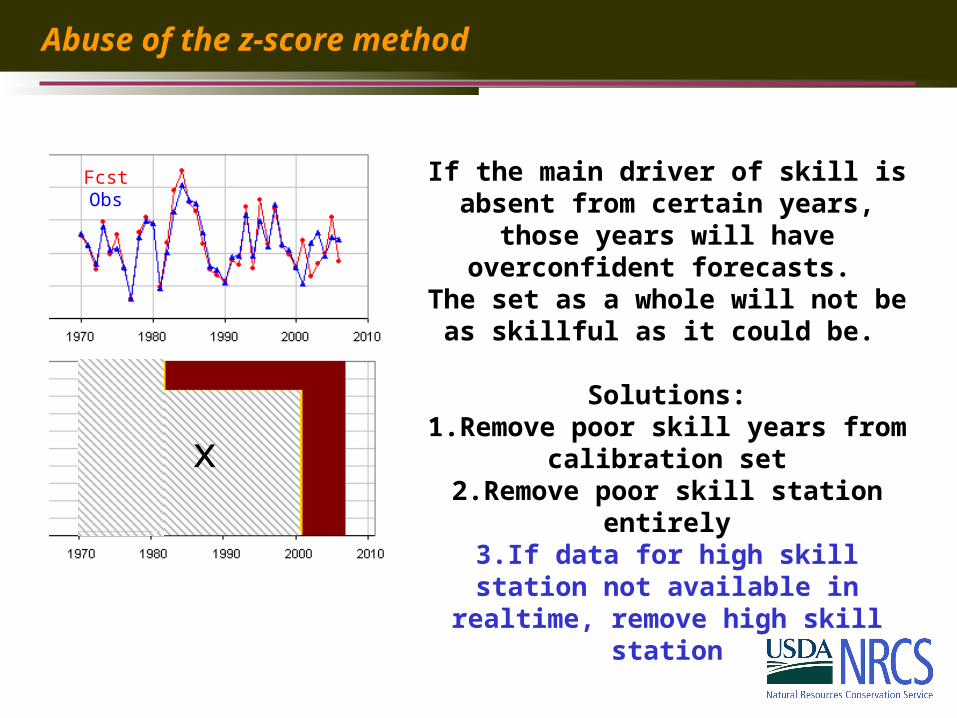
If the main driver of skill is absent from certain years, those years
will have overconfident forecasts. The set as a whole will not be as
skillful as it could be.
FcstObs
Abuse of the z-score method
r2=0.95
If the main driver of skill is absent from certain years, those years
will have overconfident forecasts. The set as a whole will not be as
skillful as it could be.
Solutions:1.Remove poor skill years from
calibration set
FcstObs

Abuse of the z-score method
r2=0.95
If the main driver of skill is absent from certain years, those years
will have overconfident forecasts. The set as a whole will not be as
skillful as it could be.
Solutions:1.Remove poor skill years from
calibration set2.Remove poor skill station entirelyx
x
FcstObs
Abuse of the z-score method
If the main driver of skill is absent from certain years, those years
will have overconfident forecasts. The set as a whole will not be as
skillful as it could be.
Solutions:1.Remove poor skill years from
calibration set2.Remove poor skill station entirely
3.If data for high skill station not available in realtime, remove high skill
station
x
FcstObs

More z-score method atrocities
Stations’ period of recordsshould be representative
station1
station2

Stations’ period of recordsshould be representative
station1
station2
Blue station’s “wet” years are actually
normal over longer term.
More z-score method atrocities

Z-Score Rescaling
Stations’ period of recordsshould be representative
Blue station’s “wet” years are actually
normal over longer term.
More z-score method atrocities

Z-Score Rescaling
Stations’ period of recordsshould be representative
Solutions:1.Use consistent years2.Eliminate one station3.Estimate missing data
ahead of time
Blue station’s “wet” years are actually
normal over longer term.
More z-score method atrocities
Z-score regression –
A regression methodology that, within reason, can handle uneven record lengths and missing data.
It groups stations into indices, emphasizing good stations, minimizing the effect of poor stations. Multiple signalscan be managed (e.g. snow, fall precip, baseflow).
Can be abused especially if the input data set is highly uneven.
Summary