The Year of Tropics- MidlatitudeInteractions and Teleconnections€¦ · · 2015-12-09The Year of...
37
The Year of Tropics- Midlatitude Interactions and Teleconnections Cristiana Stan George Mason University December 9, 2015
Transcript of The Year of Tropics- MidlatitudeInteractions and Teleconnections€¦ · · 2015-12-09The Year of...

TheYearofTropics-Midlatitude InteractionsandTeleconnections
CristianaStanGeorgeMasonUniversity
December9,2015
1
The Sub-seasonal to Seasonal (S2S) Prediction Project
1
“Bridging the gap between weather and climate”
Co-chairs: Frédéric Vitart (ECMWF) Andrew Robertson (IRI)

Madden-JulianOscillation
Monsoons
Africa
Extremes
Verification andProducts
Sub-Projects
S2SDatabase
Teleconnections
Sub-seasonal toSeasonal(S2S)PredictionProject
ResearchIssues
• Predictability• Teleconnection• O-A Coupling• Scale interactions• Physical processes
ModellingIssues• Initialisation• Ensemblegeneration• Resolution• O-ACoupling• Systematicerrors• Multi-modelcombination
Needs&Applications
LiaisonwithSERA(WorkingGrouponSocietalandEconomicResearchApplications)

YTMIT Outline§ OverviewofthecurrentknowledgeandchallengesoftheteleconnectionsontheS2Stimescales– Observations– Modelingstudies
§ PresentationoftheVirtualFieldCampaign– YTMIT
§ Discussion
1
The Sub-seasonal to Seasonal (S2S) Prediction Project
1
“Bridging the gap between weather and climate”
Co-chairs: Frédéric Vitart (ECMWF) Andrew Robertson (IRI)

YTMIT Observations
Riehl,1950“Themostoutstandingofthesefeaturesarethebreakdownofthetropicalatmosphereintoatrainofvorticesandthecompleteinterlockingofflowbetweenthehighandlowlatitudes.”
“Itwouldseemmorethandifficulttodrawalineseparatingpolarandtropicalzones.”
“Heat isinjected intothepolarzonesinfewandnarrowstripsoflongitude… inpart,changesofflowconfigurationsandintensityinhigherlatitudesmustdependontheavailability oflowlatitudesdisturbancestoformextendedtroughs.”
Overviewofthecurrentknowledgeandchallenges
Thevirtual fieldcampaign
Discussions
TheinfluenceofTropicsontoNHMidlatitudes3 ON THE ROLE OF THE TROPICS IN THE GENERAL CIRCULATION
Fig. 2. Topography of the 3oo-mb surface (100's feet), August 26, 1945. 06002. Insert: meridional profile of the zonal wind (mps) at 300 and 700 nib computed between longitudes zoOE and IIOOE via westcrn hemisphere.
eastern Asia. These months are eminently suited for large-scale anal sis. Under auspices
States Navy, the entire period was analyzed at the University of Chicago, both at low and high levels. The chart for August 26, 1945, 'epresents a random selection from this file. p.ven under the favorable circumstances pre-
ding in 1945 station coverage was poor in ne area's, especially in the tropical Atlantic. STerential analysis therefore was a standard
.,' .diary analysis tool, to ether with time cross-sections and other tecfmques employed under such conditions. It is not possible to
of the Office of Nava Y Research, United
vouchsafe for all details of fig. 2. But its broadscale features are submitted without hesitation as reliable.
The most outstanding of these features are the breakdown of the tropical atmosphere into a train of vortices (RIEHL 1948) and the complete interlocking ofjlow between high and low latitudes. It would seem more than difficult to draw a line separating polar and tropical zones. Every- where, troughs of great extent - called nextended troughu) by CRESSMAN (1948) - reach from pole to equator. It is only to the east of these troughlines that heat can flow poleward. Thus there is not a general seepage
TheroleofTropicsinthegeneralcirculationoftheatmosphere.Tellus.

YTMIT Observations
J.Bjerknes,1966
§ LargepositiveSSTanomaliesintheeasternEquatorialPacificstrengthenthezonalwindsintheNorthernHemispherewinter.
§ “AclosewatchofthetemperatureanomaliesarisingovertheeasterntropicalPacificislikelytoplayanimportantpartonthefutureseasonalforecasting ofclimaticanomalies,overNorthAmericaandoverEurope.”
Overviewofthecurrentknowledgeandchallenges
Thevirtual fieldcampaign
Discussions
TheinfluenceofTropicsontoNHMidlatitudes826 J. BJERKNES
WINTER
FIG. 6. Average distribution of atmospheric pressure at sea level during the winter seasons, December to February inclusive, of 1955-56 and 1956-57, before the East Pacific equatorial warming, and 1957-58 at the peak of that warming.
Moreover, the westerlies in the middle latitudes of the eastern Pacific are much stronger than normal in the winter of 1957-58, presumably indicating that the northward flux of angular momentum operated by the Hadley cirulation
did achieve above-normal efficiency when fue- led by an above-normal equatorial heat source. Finally, with the subtropical High rather far south and the westerlies strong, the eastern Pacific by necessity got a deep Low established
Tellus XVIII (1966), 4
SeaLevelPressure
warmerSST
YTMIT Observations
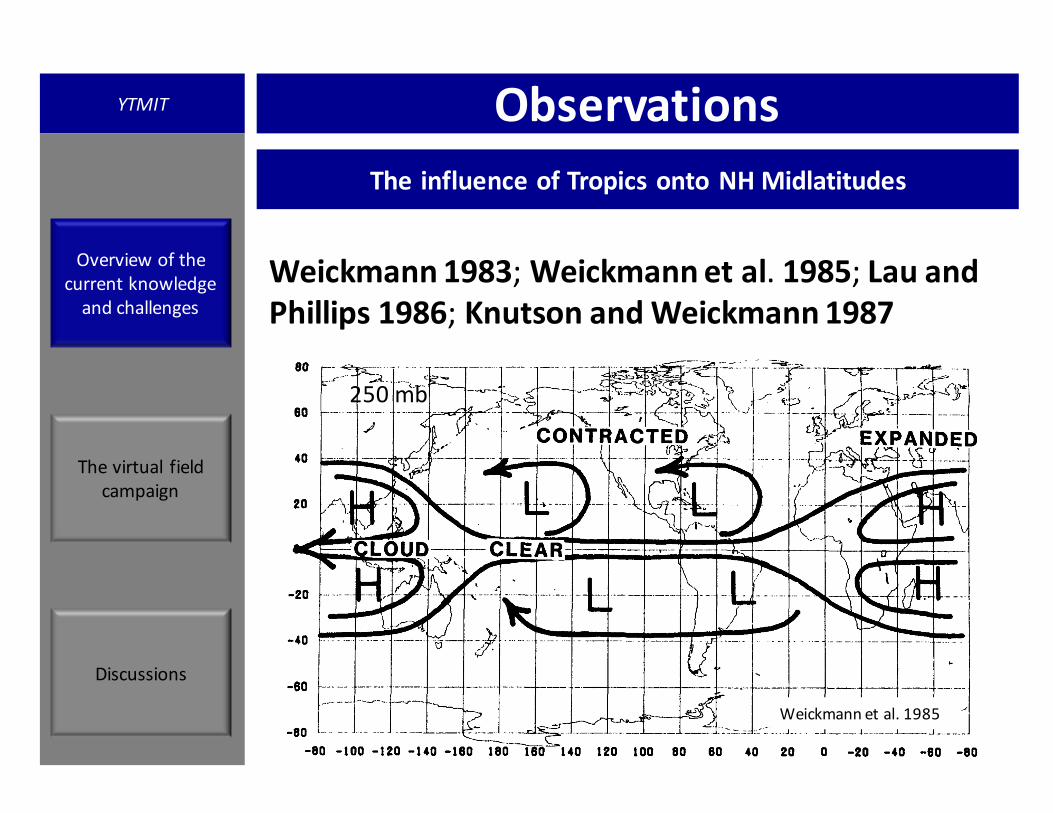
Weickmann1983;Weickmannetal. 1985; LauandPhillips1986; KnutsonandWeickmann1987
Overviewofthecurrentknowledgeandchallenges
Thevirtual fieldcampaign
Discussions
TheinfluenceofTropicsontoNHMidlatitudes
Weickmann etal.1985
250mb

YTMIT Observations
Overviewofthecurrentknowledgeandchallenges
Thevirtual fieldcampaign
Discussions
Liebmann andHartmann, 1984§ Regionofwintermonsoonrainfalloverthefar
westernPacificisforcingthemidlatitudeflow
TheinfluenceofTropicsontoNHMidlatitudes
§ NorelationshipbetweenregionsofequatorialcloudinessandcirculationanomaliesoverNorthAmericanAtlanticregions

YTMIT Observations
1. Whatarethegeographicalregionswheretropicalforcingismosteffectiveinexcitingextratropical circulationanomalies?
Overviewofthecurrentknowledgeandchallenges
Thevirtual fieldcampaign
Discussions
TheinfluenceofTropicsontoMidlatitudes
Question

YTMIT Observations
Ferrantietal. 1990; GillandMo1991a,b; HigginsandMo1997;MathewsandKiladis 1999;§ Variabilityoftheclimatepatternsofmidlatitudes,
suchasNAOandPNAislinkedtotheconvectiveactivityinthetropics
§ IntheNorthernHemisphere,therearetwomodesofoscillationwithperiodsofabout48and23days
§ NorthPacificcirculationanomaliesdeveloponetotwoweeksaftertheappearanceofanomalousconvectionoverthetropicalPacific
Overviewofthecurrentknowledgeandchallenges
Thevirtual fieldcampaign
Discussions
TheinfluenceofTropicsontoNHMidlatitudes
YTMIT Observations
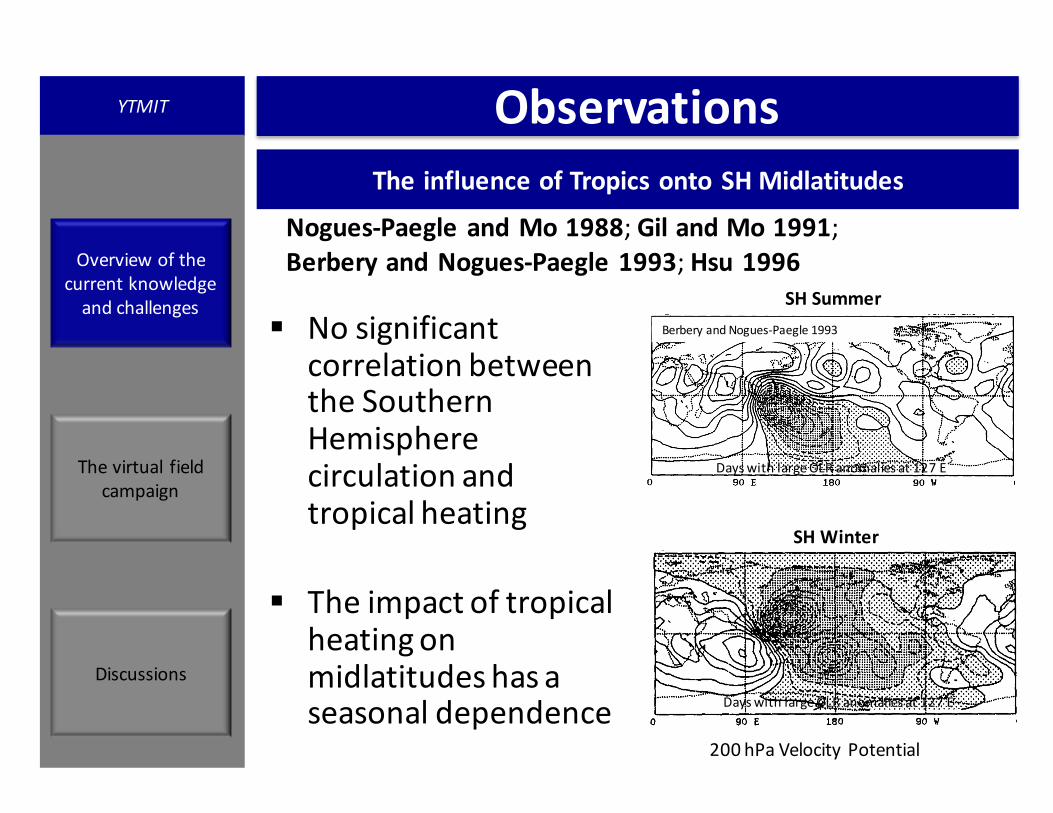
§ NosignificantcorrelationbetweentheSouthernHemispherecirculationandtropicalheating
§ Theimpactoftropicalheatingonmidlatitudes hasaseasonaldependence
Overviewofthecurrentknowledgeandchallenges
Thevirtual fieldcampaign
Discussions
TheinfluenceofTropicsontoSHMidlatitudes
Nogues-Paegle andMo1988; GilandMo1991;Berbery andNogues-Paegle 1993;Hsu1996
200hPa VelocityPotential
SHWinter
SHSummerBerbery andNogues-Paegle 1993
DayswithlargeOLRanomaliesat127E
DayswithlargeOLRanomaliesat127E

YTMIT Observations
MoandHiggins1998; Jones2000; BondandVecchi2003; Jeong 2005; Heetal.2011; Zhouetal.2012Overviewofthe
currentknowledgeandchallenges
Thevirtual fieldcampaign
Discussions
TheinfluenceofTropicsontoNHMidlatitudesWeather
3584 VOLUME 13J O U R N A L O F C L I M A T E
TABLE 3. Distribution of the number of 5%, 10%, and 15% extreme events for cases of U850 anomalies associated with the MJO (U850index at lag 22), (sample size n1 5 439 pentads) and no U850 anomalies due to the MJO (sample size n2 5 356 pentads). The value ofthe Z statistic for each case and box is also indicated. The Z values greater than Z95 5 1.64 indicate that the difference between the twoproportions is significant at 95% confidence level.
Type-I extreme events (5%)
Tropical U850(lag 22)
No tropicalU850
Type-II extreme events (10%)
Tropical U850(lag 22)
No tropicalU850
Type-III extreme events (15%)
Tropical U850(lag 22)
No tropicalU850
Box 1 58 22 32 9 13 6
Box 2Z 5 3.277
54 19Z 5 3.099
35 11Z 5 1.220
13 5
Box 3Z 5 3.398
60 22Z 5 3.001
25 9Z 5 1.530
10 5
Box 4Z 5 3.447
66 24Z 5 2.264
23 8Z 5 0.940
8 2
Box 5Z 5 3.644
65 23Z 5 2.240
18 6Z 5 1.661
5 1
Box 6Z 5 3.709
67 26Z 5 2.055
22 5Z 5 1.460
5 2Z 5 3.440 Z 5 2.894 Z 5 0.909
FIG. 8. (a) Percentage of type-I (5%) extreme events that occurduring active and inactive MJO periods. (b) Same as in (a), but fortype-II (10%) events. Sample sizes are 439 pentads for active MJOand 356 pentads inactive MJO. Percentages are expressed as occur-rences from the sample size.
higher number of extreme events during active MJOperiods than in inactive ones. The differences in oc-currences are statistically significant at 95% level (Z .1.64) for type-I and -II extreme events in all six gridboxes. An important issue to consider in this analysis,however, is how many of the extreme cases occurringduring active MJO periods were also coincident withthe warm phase of ENSO. We counted the number ofextreme events occurring from November to March forthe El Nino years of 1957/58, 1965/66, 1968/69, 1972/73, 1982/83, 1986/87, and 1991/92. Only a small frac-tion of the events shown in Table 3 occurred also duringwarm ENSO phases. For type-I events the counts were11, 10, 11, 13, 12, and 14 cases for grid boxes 1–6,whereas for type-II events the counts were 4, 5, 6, 5,4, and 5. In addition, only one event was reported duringthe 1965/66 and no extreme events occurred in the 1986/87 El Nino. These results further substantiate the hy-pothesis that extreme events in California are not onlymodulated by ENSO but also by tropical intraseasonalactivity such as the MJO.To better illustrate the differences between active and
inactive MJO cases and summarize the main results ofTable 3, Fig. 8 shows the percentage of occurrences ofextreme events of types I and II (number of occurrencesdivided by the sample size) during active MJO (lag 22pentads) and inactive periods. While the average per-centage of type I for all grid boxes during active MJOperiods is 14%, the average for inactive cases is only6.3%. Likewise, for type II, the average percentages are5.8% and 2.2% for active and inactive MJO periods,respectively.
5. Interannual variability of the Madden–Julianoscillation and extreme events in CaliforniaSince the MJO is known to exhibit significant inter-
annual variations, we now investigate the question ofwhether or not variations in the amplitude of the oscil-
Jones,2000§ Winterextreme
precipitationeventsoverU.S.WestCoastandbelow-averageSATarefavoredbyMJOinphase2
§ ExtremecoldsurgesinthesurfaceairtemperatureovereastAsiaarefavoredbyMJOconvectiveactivitylocatedovertheIndianOcean
by Zhang et al. [1997] and 17.3 cases noted by Chen etal. [2004]. This is because we have focused on coldsurges which dominate over most of China, so ourcriteria are stricter than those of prior studies. We includethe pre-existence of the Siberian high and used area-averaged SAT (six stations in the middle of China, 110!–115!E, 32.5!–37.5!N and seven stations in southernChina, 115!–120!E, 22.5!–27.5!N) as a substitute forsingle-station data to identify cold surges. Thirty-fourextreme cold surges (1.26 per year) are classified asextreme cold surges, and this frequency is also less thanthe number of two per year found by Zhang et al. [1997].[15] To represent the relationship between cold surges
and the MJO phase, all occurrences of normal and extremesurges are denoted over the phase diagram of the MJO inFigure 3, and basic statistics for cold surges are summarizedin Table 2. It is anticipated from the SATcomposite (Figure 1)that occurrences of cold surges increased during phases 2–4,but the phase dependency is not so significant in normal coldsurge cases which are rather independent of MJO phase.Occurrences of cold surges slightly increased during MJO
phase 2 (28 cases) and 3 (27 cases), but still a considerablenumber of cold surges occurred during other MJO phases(21–30 cases during MJO phases 5–8). On the other hand,occurrences of extreme cold surges show strong phase de-pendencywithMJO phase.Most occurrences of extreme coldsurges are concentrated in phases 2 (9 cases) and 3 (11 cases)of the MJO phase, but no extreme cold surge occurs inphases 1 and 4, and only 1–5 cold surges occur in otherphases. Dealing with cold surges occurring only duringactive MJO periods (amplitude of MJO greater than 1[Wheeler and Hendon, 2004]), the phase dependency isalso significant. Occurrences of extreme cold surges aremostly concentrated in phases 2 (4 cases) and 3 (8 cases).Furthermore, most of the extreme cold surges in phase 3occur when the amplitude of MJO is very high. From theabove results, it is inferred that the MJO-related circula-tion anomalies may selectively reinforce the amplificationof normal surges to extreme cases.[16] In this respect, extreme cold surge composites of
Z500 anomaly and baroclinity (defined as the differencebetween zonal wind at 300 and 850 hPa) are constructed forthe corresponding occurrence dates before and after 6 dayswith 3-day intervals (Figure 4, left). Overall, a strongnegative geopotential anomaly, which is usually suggestiveof low-level cold air mass over the continental area inwintertime, is formed in the west of Lake Baikal on day!6, moves to the northeast of China by day +3, and finallypasses through the east coast of China and the Koreanpeninsula. This negative anomaly is also indicative ofstrong cold advection from southern Siberia to the interiorof China during occurrences of extreme cold surges. Thecenter of positive baroclinity anomaly is located in southernSiberia on day !6 and gradually moves to the south of LakeBaikal (day !3), northeastern China and the North Koreanregion (day 0), and middle and southern China (from +3 to+6 days).[17] To examine the influence of the MJO-related circula-
tion anomaly, the MJO composites are presented in Figure 4(right). Circulation features during MJO phases 2–3 aresimilar to those of !6 to +6 days at extreme cold surgeoccurrence when the negative geopotential height anomalyfirst appears over Siberia, then moves to the north and middleof China in phases 2–3. The baroclinity changes significantlyin accord with theMJO phase, and this is easily understood inconsideration of the well-known feature that the midlat-itude jet fluctuates with the eastward propagation of theMJO. Positive baroclinity emerges over Lake Baikal andmoves southward during MJO phases 1–2, then isabruptly enhanced over the south of China during MJOphases 3–4.[18] Putting the above results together, we can further
infer that the increase of extreme cold surge occurrences inMJO phases 2–3 is significantly connected with the MJO-
Figure 3. Identified occurrences of cold surges over-lapping on the phase-space diagram of MJO (RMM1 andRMM2). The phase of the MJO and the approximatelocations of the enhanced convection are labeled. Small andlarge circles denote all and extreme cold surges, respec-tively. The circle of radius 1 is denoted in the middle of thediagram.
Table 2. Cold Surge Statistics Based on 27 Winters (1974/1975–2000/2001)a
Total Occurrences Number of Occurrences Per Year
MJO Phase
1 2 3 4 5 6 7 8
Cold surges 206 (118) 7.63 (4.37) 15 (14) 28 (15) 27 (22) 17 (7) 23 (16) 21 (12) 30 (21) 21 (11)Extreme cold surges 34 (20) 1.26 (0.74) 0 (0) 9 (4) 11 (8) 0 (0) 1 (0) 3 (2) 2 (2) 5 (4)
aNumber of occurrences during strong MJO period denoted within parentheses.
D11104 JEONG ET AL.: MADDEN-JULIAN OSCILLATION AND COLD SURGES
5 of 7
D11104
Jeong,2005

YTMIT Observations
MoriandWatanabe2008; Linetal. 2009;Riddleetal. 2013Overviewofthe
currentknowledgeandchallenges
Thevirtual fieldcampaign
Discussions
TheinfluenceofTropicsontoMidlatitudes
are completely absent during unfavorable ENSO conditions
and are nearly triple the climatology during favorable
ENSO conditions.
In general, the strongest responses occur when upper-level convergence/divergence patterns associated with
ENSO constructively interfere with those associated with
the MJO over the Pacific Basin. For example, Cluster 6probabilities are particularly high during El Nino following
phase 6 of the MJO when both ENSO and the MJO con-
tribute towards anomalous upper-tropospheric divergenceover the central Pacific region. Conversely, Cluster 7 prob-
abilities are particularly high during La Nina after phases 2
and 3 of the MJO, when both contribute towards anomalousupper-tropospheric convergence over the central Pacific.
Previous studies have found that the Rossby waveresponse to a combined ENSO and MJO event is not
simply the linear combination of the separate responses to
the MJO and ENSO (Roundy et al. 2010; Moon et al. 2010;Schrage et al. 1999). With our analysis, however, we do not
see a large non-linear effect, at least for Clusters 6 and 7.
That is, when Cluster 6 and 7 occurrences are normalized
with respect to the ENSO background state (i.e. NiNT
in (2) is
calculated for the El Nino or La Nina periods only, insteadof for the full climatology), the MJO modulation of the
clusters is quite similar in magnitude to that for the entire
time period (Fig. 5). Cluster 7, for example, occurs only8 % of the time during El Nino according to Table 2, but
these probabilities increase to approximately 25 % a few
weeks following phases 2 and 3 of the MJO. This repre-sents a threefold increase over the 8 % El Nino baseline,
but only a moderate increase over the climatological
baseline for Cluster 7 (18 %).Cluster 4, on the other hand, is equally common during
the El Nino and La Nina periods (Table 2). Thus, the
enhanced signal seen during El Nino after phase 7 of
the MJO (Fig. 7) cannot be explained by a combination ofthe MJO and ENSO signals. These results are in contrast
with those of Roundy et al. (2010) who note an amplified
relationship between the MJO and the NAO during LaNina periods compared with El Nino periods. Further work
Fig. 6 Percent change in the occurrence frequency of a positive AOclusters, b negative AO clusters, c positive PNA clusters andd negative PNA clusters during and in the 40 days after MJO eventsin phases 1–8. Light red (light blue) shading represents enhanced(suppressed) probabilities that are locally significant at a 95 % level
based on a Monte Carlo simulation. Dark red (dark blue) shadingrepresents enhanced (suppressed) probabilities that are locallysignificant at a 98.5 % level which is the level needed to controlthe false discovery rate at 15 %
Impact of the MJO 1759
123
§ PhaselockingbetweenPNAandMJO;convectiveactivityassociatewiththeMJOinitiationexplains30%ofPNAvariability
§ MJOmaynotexciteapurePNApattern,butratheraPNA-likeresponse
DaysafterMJO
Riddleetal.,2013

YTMIT Observations
Cassou 2008; DengandJiang2011; LeeandLim2012;Grise etal. 2013; Frederiksen andLin2013;Lin2014
§ NAOisinfluencedbytropicalconvectionwhenMJOisineitherphase2-4(IndianOcean-MaritimeContinent)or6-8(WesternPacific)
§ TheactivityofNorthPacificstormtrackduringwinterismodulatedbythetropicalconvectionassociatedwithMJOvariability
§ ThewinterSAToverNorthAmericaischaracterizedbya70-dayoscillationforcedbyMJO
Overviewofthecurrentknowledgeandchallenges
Thevirtual fieldcampaign
Discussions
TheinfluenceofTropicsontoMidlatitudes

which is consistent with the results of Jiang and Lau (2008)
and other previous studies that had examined the rainfall/drought of the western or central US (Liu et al. 1998;
Newman and Sardeshmukh 1998; Schubert et al. 2011).
They showed the variations in WNP convection are cor-related with the intraseasonal variability of the monsoons
in both North America and East Asian/WNP sectors. It is
also noteworthy that this relationship is found in 30–60 daytime scale in our study while other studies focused on the
time scale shorter than 30 day.
4.3 The teleconnection associated with the NASM ISO
Similar to the opposite anomaly patterns associated with
the ISM and NASM ISO (Fig. 3), Fig. 6c shows that the
time evolution of the convective anomalies associated with
the NASM ISO also closely resemble the negative evolu-
tion patterns of Fig. 6a. It is of note that the convectiveactivity over the eastern Pacific near Mexico evolves
northward to southern US with increased amplitude on the
western side from day -10 to ?5 and decays from day ?5.In Fig. 6c, the teleconnection pattern shows opposite
signal with Fig. 6a, but the convective activity is much
strengthened near Mexico. From day -10 to 0, two anti-cyclonic anomalous centers over the southern North Pacific
and western Canada propagate slowly eastward. When theeastward evolving meridional tripole approaches eastern
Pacific, the anticyclonic center over the North Pacific is
reinforced by the localized heating near Mexico during theactive phase of NASM. From day 0 to ?10, the arch-
shaped downward energy transfer from the North Pacific to
western coast of US along the jet can be detected.
Fig. 8 The regressedintraseasonal anomalies of 2 mair temperature (T2m Temp,shaded) and GPH200 (contour)with reference to the a ISM,b WNPSM, and c NASMindices. The unit of T2m Tempand GPH200 are !C and gpm,respectively. Shaded regionsindicate the T2m Temp that arestatistically significant at above95 % confidence level
Teleconnections associated with Northern Hemisphere summer monsoon intraseasonal oscillation 2771
123
T2m(shading)GPH200(contour)
YTMIT Observations
Overviewofthecurrentknowledgeandchallenges
Thevirtual fieldcampaign
Discussions
TheinfluenceofTropicsontoMidlatitudes, BorealSummer
Moonetal.2013§ Duringtheactivephase
ofISM,WNPSM,andNASMextratropicalcirculationandsurfacetemperatureanomaliesdevelop.
§ BSISOteleconnectionsshowbothquasi-stationaryandeastwardpropagationcharacteristics

YTMIT ModelingStudies
Opsteegh andVandenDool 1980;HoskinsandKaroly1981;Webster1981
Overviewofthecurrentknowledgeandchallenges
Thevirtual fieldcampaign
Discussions
300-hPaHeight
0.5K/day 15N
§ Linearsteadystatemodelswithprescribedornumericalschemesforatmosphericheating
§ Intheuppertroposphere,thetropicalheatingsourcegeneratesatrainofRossby wavespropagatingpoleward andeastward
HoskinsandKaroly, 1981
TheinfluenceofTropicsontoMidlatitudes

YTMIT ModelingStudies
Overviewofthecurrentknowledgeandchallenges
Thevirtual fieldcampaign
Discussions
Simmonsetal.,1983
§ PerturbationsoverthenortheasternPacificareexcited bytropicalforcinglocatedoverSoutheastAsiaandtropicalwesternPacific
§ TheAtlanticperturbationsareexcited bythetropicalforcinglocatedtothesoutheast
Simmonsetal.1983;Branstator 1985
TheinfluenceofTropicsontoMidlatitudes

YTMIT ModelingStudies
Sardeshmukh andHoskins1988;
§ Themidlatitude perturbationsareassociatedwiththefastgrowingmodeofbarotropic instability
§ Theatmosphericanomaliesintheextratropicshaveanequivalentbarotropic structure
§ Thevariabilityofthemidlatitude large-scaleflowduetotropicalforcingisdominatedbya28-72dayoscillation
Overviewofthecurrentknowledgeandchallenges
Thevirtual fieldcampaign
Discussions
TheinfluenceofTropicsontoMidlatitudes

YTMIT ModelingStudies
2. Howandwhydothebaroclinic atmosphericanomaliesinthetropicstransitiontobarotropicanomaliesbythetimetheyreachtheextratropics?
Overviewofthecurrentknowledgeandchallenges
Thevirtual fieldcampaign
Discussions
TheinfluenceofTropicsontoMidlatitudes
Question
YTMIT ModelingStudies
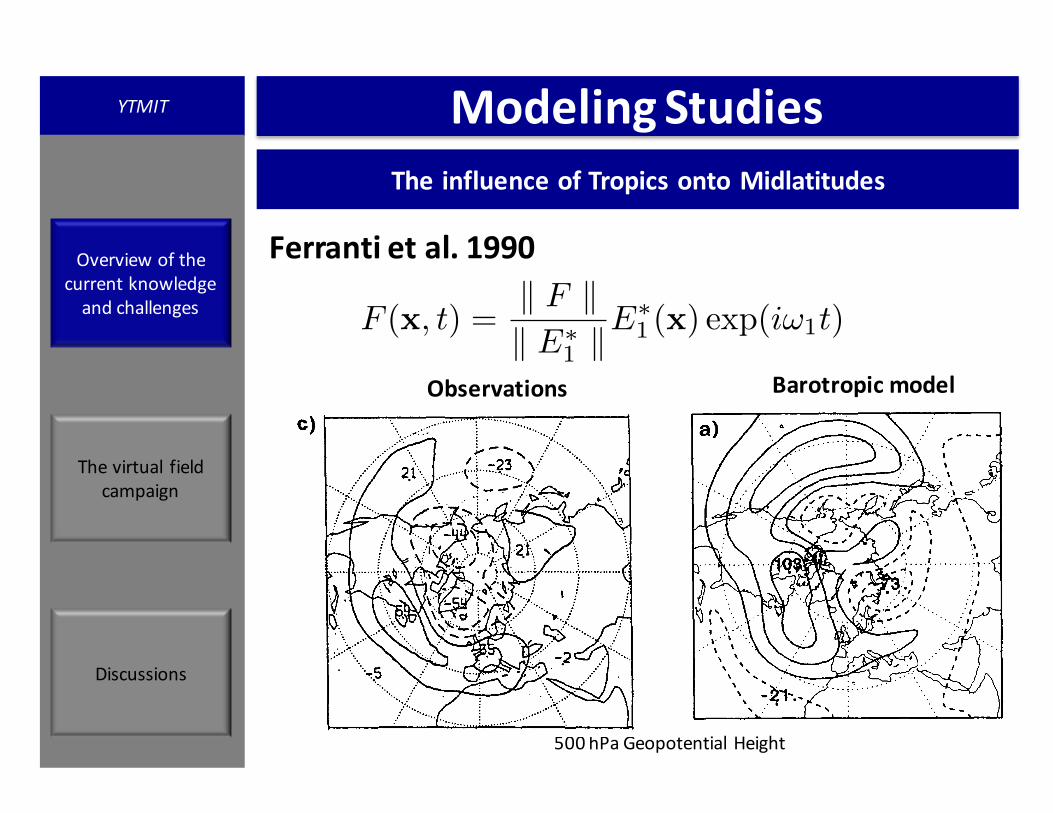
Ferrantietal.1990Overviewofthecurrentknowledgeandchallenges
Thevirtual fieldcampaign
Discussions
TheinfluenceofTropicsontoMidlatitudes
Barotropic model
500hPa Geopotential Height
Observations
F (x, t) =k F kk E⇤
1 kE⇤1 (x) exp(i!1t)

YTMIT ModelingStudies
Slingo andSlingo 1988,1991
§ Longwave cloudradiativeforcingintheTropicsaccelerates thesub-tropicaljetsandgeneratesheightperturbations inmidlatitudeswithabarotropic structure.
§ Thelongwave cloudforcingoverSouthAmerica inducesbarotropic cycloniccirculationsinthemidlatitudes andanticyclonic structures inthepolarregionsoftheNH.
Overviewofthecurrentknowledgeandchallenges
Thevirtual fieldcampaign
Discussions
TheinfluenceofTropicsontoMidlatitudes
RESPONSE OF A GCM TO RADIATIVE FORCING. I 1051
The preferential acceleration of the Atlantic jet compared with that over the Pacific is associated with a strong and statistically significant anomaly pattern in the 200 mb geopotential height (Fig. 14). In the northern hemisphere, cloud forcing results in a deep negative anomaly centred over Newfoundland, with a smaller anomaly near the dateline. In the tropics, the warming of the troposphere shown in Fig. 7(a) increases the heights by on average about 100 m. This change is large compared with the variability of tropical temperatures on the 90-day timescale, hence the large values of t in Fig. 14(b). The juxtaposition of a height maximum over the Atlantic at about 25"N and the negative anomaly to the north gives rise to a strong height gradient at 40"N, which is another manifestation of the acceleration of the jet. The height changes are much smaller in the high latitudes of the southern hemisphere and are not statistically significant.
The height anomaly pattern in the northern hemisphere shows a marked barotropic structure. At both 500 mb and 850 mb the pattern in Fig. 14(a) is preserved, the major anomaly centres showing no significant changes in position. Such barotropic patterns have been generated in modelling studies of the atmospheric response to s.s.t. anomalies (e.g. Blackmon et al. 1983; Geisler et al. 1985; Palmer and Mansfield 1986a, b). In those
a) Control - CF1 : 200mb geopotential height (m) 180 12ow 60W 0 60E 120E 180
180 12OW 60W 0 60E 12OE 180
b) Control-CF1 : t-stat ist ic f o r the dif ference 180 120w 60W 0 60E 120E 180
90N 90N
60N 60N
30N 30N
0 0
30s 30s
605 60s
90s 90s 180 12ow 60W 0 60E 120E 180
Figure 14. (a) 200 mb geopotential height difference between Control and CFI. The contour interval is 40 m. (b) The corresponding t-statistic. The contour interval is 10. Negative values are hatched in both plots.
200-mbstreamfunction.CLAFappliedeverywhereMinusCLAFappliedeverywhereexceptSouthAmerica.

YTMIT ModelingStudies
SchubertandPark,1991§ Globalinitializedanalyses(ECMWF)
§ PNA appearstohaveitsmainenergysourceinmidlatitudes,andthelinktothetropicsmanifestsasaphaselockingwithanomaliesforcedbytropicalconvectionlocatedinthewesternandcentralPacific
Overviewofthecurrentknowledgeandchallenges
Thevirtual fieldcampaign
Discussions
TheinfluenceofTropicsontoMidlatitudes

YTMIT ModelingStudies
JinandHoskins1995;§ PropagationofRossby wavestrainissensitiveto
thezonallyvaryingbasicstate,withpreferredpathsinregionswithprevailingwesterlies
§ TheresponseoftheNorthernHemispheretotropicalheatingismuchstrongerthanintheSouthernHemisphere
§ TheRossbywaveresponsetoafixedtropicalheatingestablishesin10-15days
Overviewofthecurrentknowledgeandchallenges
Thevirtual fieldcampaign
Discussions
TheinfluenceofTropicsontoMidlatitudes inGCMs

YTMIT ModelingStudies
HigginsandSchubert1996;Hsu1996;
§ GCMsimulationstendtoreproducetheobservedrelationshipsbetweentropicalanomalousconvectionandmidlatitude circulationanomaliesduringborealwinter
§ GCMsimulationsalsoshowdifferencesfromobservation,resultingespeciallyfromthemodelinabilitytoreproducetheobservedlocationofthetropicalheatinganomalies
Overviewofthecurrentknowledgeandchallenges
Thevirtual fieldcampaign
Discussions
TheinfluenceofTropicsontoMidlatitudes inGCMs

YTMIT ModelingStudiesLinetal.2007§ Primitiveequationdryatmosphericmodelcan
simulatetropicalintraseasonal variabilitywithaKelvinwavestructure
§ HayashiandSuni,1986:“Nomoistprocessesresultintheabruptdisintegrationofthe30dayoscillationintoKelvinandRossby waves.Strongmodecouplingbetweentheequatorialfreewavesisrequiredtomaintainthe30-dayoscillation
§ ThedivergentflowinthetropicalwesternPacificgenerateswaveactivityintothePNAregion
Overviewofthecurrentknowledgeandchallenges
Thevirtual fieldcampaign
Discussions

YTMIT ModelingStudies
BladeandHartmann 1995;Mathewsetal.2004;Branstator2014;Strausetal.2015
§ Extratropical response issensitive tothephasespeed oftheforcing
§ Thetropicalconvectionoutflowanomalies leadtoRossbywaves,whichtheninteractwiththemidlatitude meanflowandinpreferred locationsextractenergyfromthemeanflow,inamannersimilartothatofunstablebarotropicmodes.
§ Themidlatitude response totheMJOdependsonthehistoryofheatingandcoolingandisnotjustaresponse toheatingatsome longitudewithsomelag.
§ Shortpulsesoftropicalheatingalsoaffect themidlatitudesandtheeffectpersists formorethantwoweeks.
Overviewofthecurrentknowledgeandchallenges
Thevirtual fieldcampaign
Discussions
TheinfluenceofTropicsontoMidlatitudes inInterventionExperiments

YTMIT ModelingStudies
Feranti etal.1990;Waliser etal.2003;Vitart andMolteni2010;Riddleetal.2013;Vitart 2013;Moltenietal.2015;
Overviewofthecurrentknowledgeandchallenges
Thevirtual fieldcampaign
Discussions
TheinfluenceofTropicsontoMidlatitudes inForecasts
§ Extended-rangeforecastswithsmallerrorsinthesimulationoftropicalheatingareskillful
§ MJOhassignificantimpactonthemidlatitude forecastespeciallyfordays19-25
Evolution of ECMWF sub-seasonal forecast skill scores over the past 10 years
2002 2003 2004 2005 2006 2007 2008 2009 2010 2011YEAR
0.3
0.4
0.5
0.6
0.7
Corre
latio
n
MJONO MJO
Figure 9: Evolution of the NAO skill scores (correlation between the ensemble mean NAO index and the NAOindex computed from ERA Interim) for the period day 19-25 for all the cases when there is an MJO in the initialconditions (amplitude of the MJO index larger than 1 independently of the phase) and when there is no MJO in theinitial conditions (amplitude of the MJO index less than 1).
the NAO skill scores have been much stronger when there was an MJO in the initial conditions than whenthere was no MJO in the initial conditions, suggesting that the major part of the improvements in NAOskill scores displayed in Figures 7 and 8 come from improvements in the prediction of the MJO. Figure9 also suggests that in the first years of the ECMWF monthly forecasts, the presence of an MJO had anegative impact on the NAO skill scores, with lower NAO skill scores when there was an MJO in theinitial conditions. However, since 2008, the presence of an MJO in the initial conditions has a positiveimpact on the NAO skill scores. This can be explained by the fact that the MJO amplitude was too weakbefore 2007, making it difficult for the ECMWF model to reproduce correctly its teleconnections in theExtratropics as shown in Figure 5. Since 2008, the impact of the MJO on the Extratropics is much morerealistic and the ECMWF model can now reproduce a realistic impact of the MJO on the NAO.
5 Sudden Stratospheric Warmings
Sudden stratospheric warmings (SSWs), where the polar vortex of westerly winds in the winter hemi-sphere abruptly (i.e. over the course of a few days) slows down or even reverses direction, accompaniedby a rise of stratospheric temperature by several tens of kelvins, are considered a potential source of
16 Technical Memorandum No. 694
Vitart,2013
NAOIndexfor19-25day

YTMIT TheinfluenceofMidlatitudes ontoTropics
Nitta1970;Zangvil and Yanay1980;LimandChang1981;WebsterandHolton1982;Yanai andLu1983;Libmann andHartmann1984; Randel 1992;Frederiksen andFrederiksen 1997
§ Onlyextratropicalwaveswithwestwardphasespeedslargerthanthezonalmeanwindcanpropagateintothetropics
§ Equatorialuppertroposphericwavesareexcitedbymeridional propagationofextratropicalwaves
§ ThestrongestinfluencemanifestsoverthePacificandAtlanticOceans
Overviewofthecurrentknowledgeandchallenges
Thevirtual fieldcampaign
Discussions

YTMIT
MatthewsandKiladis 1999;StrausandLindzen2000;Linetal.2000,ThompsonandLorenz2004
§ Baroclinically unstabledisturbancesofmidlatitudesmodulatethetropicalconvection
§ Midlatitude stormsmaintaintheintrasesonalvariabilityoftheTropics
§ NAMandSAMhaveasubstantialsignatureinthetropicaltroposphereduringtheirwinterseasonswitha2-weeklag
Overviewofthecurrentknowledgeandchallenges
Thevirtual fieldcampaign
Discussions
TheinfluenceofMidlatitudes ontoTropics

YTMIT
3. Whatarethesystematicaspectsandmechanismsofextratropical initiationandmaintenanceoforganizedtropicalconvection?
Overviewofthecurrentknowledgeandchallenges
Thevirtual fieldcampaign
Discussions
TheinfluenceofMidlatitudes ontoTropics
Question

YTMIT Two-wayInteractionsandFeedbacksLauandPhillips1984;StrausandLindzen 2000;Krishnanetal.2009;Mooreetal.2010;FrederiksenandLin2013
Overviewofthecurrentknowledgeandchallenges
Thevirtual fieldcampaign
Discussions
(2) The circulation associated with the combination of the MJO and the backgroundstate can later guide the extratropical waves in (1) back into or parallel to thetropics in other geographical regions.
(3) These extratropical waves disturb the equatorial waveguide and further influencethe local development and organization of convection associated with the MJO.
(4) The tropical convection influenced by extratropical waves can then redistributemass, yielding Rossby wave dispersion to the extratropics, resulting in acontinuously interactive feedback loop.
Consistent with this view, Moore et al. (2010) demonstrate that Rossby wavesinitially forced by convection within the MJO frequently break across the subtropicsand in turn modulate further development of tropical convection. Figure 14.4illustrates how the active convective phase of the MJO approaching the maritimecontinent region is associated with Rossby wave development near South East Asiaand extension of a subtropical jet stream eastward across the Central Pacific basin(figure adapted from Moore et al., 2010). An anticyclonic wave-breaking eventfrequently develops across the Central Pacific basin at this stage of the MJO,which yields an upper-level trough in the deep tropics. Although this troughenhances convection on its eastern side, it suppresses convection on its westernside, reinforcing the suppressed convective phase of the MJO over the west centralPacific basin.
The above works taken together suggest that the MJO might influenceextratropical flow and then in turn be modulated thereby. Apparent dependenceof the MJO on baroclinic instability along the subtropical jet stream (e.g., Straus
14.5 Two-way interactions between the tropics and extratropics 505]Sec. 14.5
Figure 14.4. Schematic representation of the MJO and its associated patterns across higherlatitudes as its active convection approaches the maritime continent, highlighting itsassociation with breaking Rossby waves across the Central Pacific basin. LC1 refers to ananticyclonic wave-breaking event (adapted from Moore et al., 2010).
Roundy,2011
• Rossby wavesexcitedbyMJOconvectiveactivitybreakinthesubtropicsandfurthermodulatetheconvectiveactivityintheTropics
§ Monsoonbreaks– midlatitude circulationfeedbacksleadtolong-lastingdroughtsoverIndia

YTMIT Two-wayInteractionsandFeedbacks
Overviewofthecurrentknowledgeandchallenges
Thevirtual fieldcampaign
Discussions
4. Towhatextentarethedominanttropicalandextratropical intraseasonal oscillationconnected?
Questions

YTMIT S2STeleconnectionSub-projectMembers§ JorgenFrederiksen (CSIRO)§ HaiLin(ECCanada)andCristianaStanCo-Chairs§ EricMaloney(CSU)andStevenWoolnough (U
Reading)– LiaisontotheMJOsub-project§ FrancoMolteni (ECMWF)§ AndrewRobertson(IRI)– LiaisontoWGSIP§ CourtneySchumacher(TexasA&MUniversity)§ DavidStraus(GeorgeMasonUniversity)
Overviewofthecurrentknowledgeandchallenges
Thevirtual fieldcampaign
Discussions

YTMIT BroadObjectives§ Betterunderstandsub-seasonaltropical-
extratropical interactionpathways
§ Identifyperiodsandregionsofincreasedpredictability(“forecastsofopportunity”)
§ Improvesubseasonal-to-seasonalforecastsofweatherandclimateforapplications
Overviewofthecurrentknowledgeandchallenges
Thevirtual fieldcampaign
Discussions

Betterunderstandandpredictsub-seasonaltropical-extratropicalinteractionpathways
YTMITmid2017-mid2019
Virtual
Field
Campaign
Subseasonal-to-Seasonal
Pr edi ct i on Pr oject
YearofTropics-MidlatitudeInteractionsandTeleconnections
Description• Intense coordinated effortinvolving existing observational data,forecasts
andapplications, diagnostics, theory andmodeling experiments
Mission• Foster relationship between research, forecasting, andstakeholder
communities, andfacilitatethesharing of common interests toexplorethelinks between thetropics andmidlatitudes forabetterpredictionskill atintraseasonal timescales
ResearchQuestions• Aremid-latitude teleconnections from thefluctuating tropical heating
fundamentally just time-lagged stationarywaveresponses toheating, ordoes time-dependent waveinterfaceplay arole?
• WhyaretheNorthAtlanticweatherregimes soinfluenced byMJO-relatedheatingin thedistant Indian andPacificOceans?
• Whatistherole ofsynoptic-scale transients?• Istheimpact ofextra-tropical forcing associated primarily withthe
initiation oftropical convection, orcanitorganizetropical convection ofintraseasonal timescale?
• Whatistherole ofPVstreamers?

S2S DB&
NMME
MechanisticExperiments
Diagnostics
PredictionCenters
ReanalysisProducts
Tropical-MidlatitudeInteractions
Mechanisms
SatelliteProducts
Betterunderstandandpredictsub-seasonaltropical-extratropicalinteractionpathways
YTMITmid2017-mid2019
Virtual
Field
Campaign
Subseasonal-to-Seasonal
Pr edi ct i on Pr oject
YearofTropics-MidlatitudeInteractionsandTeleconnections

Tropical-MidlatitudeInteractions RemainingChallenges
§ Canweunderstandmidlatitude teleconnectionsfromthefluctuatingtropicalheatingastime-laggedstationarywaveresponsestotheheating,ordoestime-dependentwaveinterfaceplayaroleintheresponse?
§ Howdointensemidlatitude stormsandpolewardpropagatingtropicalstormsinteractwiththepolarvortexandaltertheannularmodesonsub-seasonaltimescales?
§ Towhatextentarethedominanttropicalandextratropicalintraseasonal oscillationconnected?
§ Whataspectsofintra-seasonalheatingarisingfromtropicalconvectionaremostimportantforforcingextra-tropicalresponses?
Overviewofthecurrentknowledgeandchallenges
Thevirtual fieldcampaign
Discussions

Tropical-MidlatitudeInteractions RemainingChallenges
§ Whatisthesensitivitytoverticalandhorizontalstructureandtotemporalevolutionoftheheating,andwhy?
§ Doestropicalforcingamplifytheintrinsicextratropical intraseasonal variabilityorexcitenewperturbations?
§ Whatexplainsthehemisphericasymmetryoftheresponsestotropicalforcing?
§ Roleofthebasicstateerrorsinsimulationoftropical-midlatitude interactions
Overviewofthecurrentknowledgeandchallenges
Thevirtual fieldcampaign
Discussions