
The X-Alter Algorithm: A Parameter-Free Method of Unsupervised Clustering
14
Journal of Modern Applied Statistical Methods Volume 12 | Issue 1 Article 14 5-1-2013 e X-Alter Algorithm: A Parameter-Free Method of Unsupervised Clustering omas Laloë Université of Nice Sophia-Antipolis, Nice, France Rémi Servien UMR Toxalim, IN, Toulouse, France Follow this and additional works at: hp://digitalcommons.wayne.edu/jmasm Part of the Applied Statistics Commons , Social and Behavioral Sciences Commons , and the Statistical eory Commons is Regular Article is brought to you for free and open access by the Open Access Journals at DigitalCommons@WayneState. It has been accepted for inclusion in Journal of Modern Applied Statistical Methods by an authorized editor of DigitalCommons@WayneState. Recommended Citation Laloë, omas and Servien, Rémi (2013) "e X-Alter Algorithm: A Parameter-Free Method of Unsupervised Clustering," Journal of Modern Applied Statistical Methods: Vol. 12 : Iss. 1 , Article 14. DOI: 10.22237/jmasm/1367381580 Available at: hp://digitalcommons.wayne.edu/jmasm/vol12/iss1/14
Transcript of The X-Alter Algorithm: A Parameter-Free Method of Unsupervised Clustering
Journal of Modern Applied StatisticalMethods
Volume 12 | Issue 1 Article 14
5-1-2013
The X-Alter Algorithm: A Parameter-Free Methodof Unsupervised ClusteringThomas LaloëUniversité of Nice Sophia-Antipolis, Nice, France
Rémi ServienUMR Toxalim, INRA, Toulouse, France
Follow this and additional works at: http://digitalcommons.wayne.edu/jmasm
Part of the Applied Statistics Commons, Social and Behavioral Sciences Commons, and theStatistical Theory Commons
This Regular Article is brought to you for free and open access by the Open Access Journals at DigitalCommons@WayneState. It has been accepted forinclusion in Journal of Modern Applied Statistical Methods by an authorized editor of DigitalCommons@WayneState.
Recommended CitationLaloë, Thomas and Servien, Rémi (2013) "The X-Alter Algorithm: A Parameter-Free Method of Unsupervised Clustering," Journal ofModern Applied Statistical Methods: Vol. 12 : Iss. 1 , Article 14.DOI: 10.22237/jmasm/1367381580Available at: http://digitalcommons.wayne.edu/jmasm/vol12/iss1/14

Journal of Modern Applied Statistical Methods Copyright © 2013 JMASM, Inc. May 2013, Vol. 12, No. 1, 90-102 1538 – 9472/13/$95.00
90
The X-Alter Algorithm: A Parameter-Free Method of Unsupervised Clustering
Thomas Laloë Rémi Servien
Université of Nice Sophia-Antipolis, Nice, France
UMR Toxalim, INRA, Toulouse, France
Using quantization techniques, Laloë (2010) defined a new clustering algorithm called Alter. This L1-based algorithm is shown to be convergent but suffers two major flaws. The number of clusters, K, must be supplied by the user and the computational cost is high. This article adapts the X-means algorithm (Pelleg & Moore, 2000) to solve both problems. Key words: Clustering, quantization, K-means, free-parameter algorithm.
Introduction Clustering consists in partitioning a data set into subsets (or clusters) so that the data in each subset share some common trait; proximity is determined according to a distance measure (for a thorough introduction to this subject please see Kaufman & Rousseeuw, 1990). The origin of clustering goes back over 45 years when some biologists and sociologists began to search for automatic methods to build different data groups. Today, clustering is used in many fields, for example, in medical imaging it can be used to differentiate between types of tissue and blood in a three dimensional image. Market researchers use clustering to partition the general population of consumers into market segments and to better understand the relationships between different groups of consumers/potential customers. There are also many applications in artificial intelligence, sociology, medical research and political science. Thomas Laloë is Assistant Professor at the University of Nice Sophia-Antipolis. Email him at: [email protected]. Rémi Servien is Permanent Researcher for the National Institute for Agronomic Research (INRA). Email him at: [email protected].
K-means clustering is the most popular
method (Hartigan & Wong, 1979; MacQueen, 1967); its attractiveness lies in its symplicity and its fast execution. It has however two main drawbacks. First, the number of clusters K must be supplied by the user; for this reason, different ways to determine K have been studied in the literature (Li, et al., 2008; Pham, et al., 2005). Second, the algorithm strongly depends on initialization and can easily converge to a local minimum. Pelleg and Moore (2000) offered a solution for the first problem with a building-block algorithm called X-means that quickly estimates K. After each run of 2-means, local decisions are made regarding whether subsets of the current centroid should be split; the splitting decision is accomplished by computing the Bayesian Information Criterion (BIC). In a different approach, Laloë (2010) proposed a consistent algorithm, called Alter, which also requires specification of K.
This article combines the X-means and the Alter algorithm to overcome the drawbacks of both algorithms. The complexity of the Alter algorithm decreases and an automatic selection of the number of clusters is simultaneously performed. In addition, the convergence properties of the Alter algorithm overcomes the local optimality problem of the X-means algorithm inherited from the K-means algorithm.
THOMAS LALOË & REMI SERVIEN
91
Methodology The Alter Algorithm
The Alter algorithm method is based on quantization. It is a commonly used technique in signal compression (Graf & Luschgy, 2000; Linder, 2002). All theoretical results presented herein are from Laloë (2010). Consider (H,|.|) a normed space. Let X be a H-valued random variable with distribution μ such as E|X|<∞.
Given a set C of points in kH , any Borel function q:H→C is called a quantizer. The set C is called a codebook, and the error made by replacing X by q(X) is measured by the distortion:
( , ) ( , ( )) | ( ) | ( ).D q Ed X q X x q x dxμ μ= = −H
Note that D(μ,q)<∞ because E|X|<∞. For a given k, the aim is to minimize D(μ,.) among the set Qk of all possible k-quantizers. The optimal
distortion is then defined by *( ) inf ( , ).
kk q Q
D D qμ μ∈
=
When it exists, a quantizer q* satisfying * *( , ) ( )kD q Dμ μ= is said to be an optimal
quantizer. Laloë (2010) showed that only nearest neighbor quantizers can be considered, that is, a quantizer q will be characterized by its codebook
1{ }ki iC y == and the rule:
( ) 1 , ,|| || || ||i i jq x y j k j i x y x y= ⇔ ∀ ≤ ≤ ≠ − ≤ − .
Thus, a quantizer can be defined by its codebook only. Moreover the aim is to minimize the distortion among all possible nearest neighbor quantizers. However, in practice, the distribution μ of the observations is unknown, and only n independent observations 1,..., nX X with the
same distribution than X are available. The goal is then to minimize the empirical distortion:
1
1( , ( )).
n
i ii
d X q Xn =
The L1-based distortion is chosen to obtain more robust estimators (Kemperman, 1987). The
clustering is accomplished by regrouping the observations that have the same image by q; more precisely, a cluster C is defined by
{ : ( ) }Ci iC X q X x= = , Cx being representative of
cluster C . Laloë (2010) presented theoretical
results of consistency and rate of convergence. In particular, he stated that the rate of convergence is closely related to the metric entropy, however, the minimization of the empirical distortion is not possible in practice and Laloë (2010) proposed an alternative to perform the Alter algorithm. The idea is to select an optimal codebook among the data set. The outline of the algorithm is: 1. List all possible codebooks , i.e., all possible
K-tuples of data; 2. Compute the empirical distortion associated
to the first codebook. Each observation Xi is
associated with its closed center; 3. For each successive codebook, compute the
associated empirical distortion. Each time a codebook has an associated empirical distortion smaller than the previous smallest one, store the codebook;
4. Return the codebook that has the smallest
distortion.
Theoretical results of consistency and rate of convergence have been shown for the Alter algorithm. In particular it has been stated that the convergence rate is of the same order as the theoretical method described previously. Moreover, this algorithm does not depend on initial conditions (unlike K-means) and it converges to optimal distortion; unfortunately its complexity is 1( )KO n + and it is not possible to use it for high values of n or K. The X-Means Algorithm
Pelleg and Moore (2000) define the X-means algorithm adapted from a K-means algorithm. The X-means algorithm goes into action after each run of K-means, making local decisions about which subset of the current centers should split themselves in order to better

X-ALTER ALGORITHM: A PARAMETER-FREE METHOD OF CLUSTERING
92
fit the data. The splitting decision is done by computing the BIC criterion. This new approach proposes an efficient solution to one of the major drawbacks of K-means: the search for the number of clusters K. In addition, X-means has a low computational cost. However, results suffer from the non-convergence property of the K-means algorithm. The outline of this algorithm is: 1. Perform 2-means to obtain clustering C; 2. Evaluate the relevance of the classification
C with a BIC Criterion; and 3. Iterate step one and two in each cell of C.
Continue until there is no more relevant discrimination.
The X-Alter Algorithm
Following X-means, a recursive use of Alter with K=2 can simultaneously allow both advantages of these two methods to be combined: estimation of K/low computational cost for X-means and convergence/parameter-free character for Alter. An aggregation step is added at the end of the algorithm to prevent the creation of too many clusters. Note that no parameter is needed by the algorithm, although a user can specify a range in which the true K reasonably lies if desired (this would be [2,+∞[ if no information was available). The outline of the algorithm is: 1. Perform Alter with K=2 to obtain clustering
C; 2. Evaluate the relevance of the classification
C (see Figure 1) with a BIC criterion; 3. Iterate steps one and two in each cell of C
(see Figure 2); continue until there is no more relevant discrimination (see Figure 3);
4. Final aggregation; aggregation can be
considered if BIC(K=1)>BIC(K=2); aggregations are successively made according to decreasing values of BIC(K=1)−BIC(K=2) (see Figure 4).
The algorithm starts by performing Alter
with K=2 centers. A model selection criterion
(BIC) is performed on all data in the set. Using this criterion, the suitability of the discrimination is checked by comparing BIC(K=1) and BIC(K=2). The criterion asks if the two cluster model is better than the one cluster model. If the answer is yes, the iterative procedure occurs in the two subsets.
The structure improvement operation begins by splitting each cluster into two subsets. The procedure is local in that the children are fighting each other for the points in the parent’s region, no others; when the discrimination is not validated by BIC criterion the algorithm ends in this region. Up to that point, the only difference with X-means is the utilization of Alter as opposed to 2-means because the consistent property of Alter must improve results. When all regions are asleep and no more clusters are needed, the aggregative step prevents the creation of too many clusters or the presence of split clusters (see Figure 2).
The complexity of this algorithm in the worst case scenario, that is when it creates n
clusters with one data set, is O(n4) which is less than the initial Alter algorithm. However, the computational cost is still higher than for X-means. For several thousand points, this complexity is not a critical practical concern but, if the database exceeds several tens of thousands of points, it could still be too high. The BIC Criterion
Pelleg and Moore (2000) used the formula from Kass and Wasserman (1995) that evaluates the relevance of the classification C with
( ) log2
pBIC C l n= −
where l is the log-likelihood of the data according to clustering C and taken at the maximum likelihood point and p is the number of parameters in C. The number of free parameters p is the sum of K−1 class probabilities, d*K centroids coordinates and one variance estimate. Data in each cluster are supposed to be normally distributed around the center. The empirical study shows that it performs well on real data.

THOMAS LALOË & REMI SERVIEN
93
Figure 1: First Iteration of X-Alter
Notes: The discrimination in 2 clusters (Step 1) was validated by the BIC criterion (Step 2); in each cluster, observations are represented by a different symbol.
Figure 2: Second Iteration of X-Alter
Notes: The sub-classification is done in the two relevant clusters (Step 1). Sub-classifications are validated by BIC (Step 2) and four clusters are obtained.

X-ALTER ALGORITHM: A PARAMETER-FREE METHOD OF CLUSTERING
94
Figure 3: No Relevant Sub-Classification in the Left Cluster According to BIC
Note: In the three other clusters, the same rejection of sub-classification was obtained (Step 3).
Figure 4: Final Discrimination
Note: The two middle clusters were aggregated in Step 4

THOMAS LALOË & REMI SERVIEN
95
Results An empirical study was performed to show the relevance of the proposed method. Three criterion were considered: the number of detected clusters, the Adjusted Rand Index (A.R.I.) (Rand, 1971; Hubert & Arabie, 1985) and the Dunn index (Dunn, 1974; Handl, et al., 2005). The Rand Index is a measure of the similarity between two clusters. A problem with the Rand index is that the expected value of the Rand index of two random partitions does not take a constant value (for example, zero). Thus, Hubert and Arabie (1985) defined the A.R.I. which is a corrected-for-chance version of the Rand index. Studies have shown the need and usefulness of the adjusted measures (Nguyen, et al., 2009); more clusters are similar (respectively dissimilar) closer to 1 (respectively 0).
Alternatively, the Dunn Index measures the compactness of the clusters and is a worst case indicator. The goal is to identify sets of clusters that are compact, with a small variance between individuals in the same cluster, and well separated, where the centers of different clusters are sufficiently far apart, as compared to the within cluster variance. The higher the Dunn Index, the better the clustering. For more details on this classical cluster validation indexes the interested reader is referred to Dunn (1974) or Handl, et al. (2005).
Pelleg and Moore showed that X-means performs better and faster than repeatedly using accelerated K-means for different values of K. Thus, the X-Alter algorithm is compared to X-means and to X-means with the aggregation step, called X-means-R, that is, a clustering is obtained using X-means and then the aggregation procedure is computed (Step 4 in the X-Alter algorithm ) on this clustering. This allows the usefulness and the computational time of the aggregation step to be assessed. Simulated data A Simple Case
Clusters of Gaussian vectors were
simulated in d . First, two clusters well
identified in 20 were considered (see Table 1). More precisely, two clusters of 25 vectors (in
20 ) with μ1=−μ2=15 and 2 21 2 100σ σ= = were
simulated. The covariance matrices are given by
Σ2=100I20 where I20 is the identity 20*20
matrix and the mean vectors are:
1 2
1
15
1
M M
= − =
.
This results in 1 25 1, , ( , )X X N M Σ and
25 50 2, , ( , )X X N M Σ . The results are
averaged on 300 simulations.
As expected, the three methods perform well on this very simple case. Next three
simulated clusters well identified in 5 were considered. This allows the relevance of the aggregation step to be observed because X-means will often cut the middle cluster in its first
iteration. Two clusters of 20 vectors (in 5 ) with μ1=−μ2=20 and 2 2
1 2 100σ σ= = were
simulated and one cluster of 20 vectors with μ3=0 and 2
3 100σ = . The results were averaged
on 300 simulations (see Table 2). The influence of the aggregation step
can be remarked upon; X-means-R found the good number of clusters almost forty percent more often than X-means. Moreover, the proposed X-means algorithm obtained better results than the other two: the inherited convergence property of Alter clearly improves results.
Table 1: Results of the Three Algorithms for the Two Well-Defined Clusters
Algorithm % of Correct Number of
Clusters A.R.I.
Dunn Index
X-means 99 1 1.62
X-means-R 100 1 1.64
X-Alter 100 1 1.64

X-ALTER ALGORITHM: A PARAMETER-FREE METHOD OF CLUSTERING
96
Finally, tests with random values for the numbers of clusters were performed, the mean, standard deviation and number of data in cluster. The μi are randomly selected between −50 and
50, the σi between 5 and 15, the number of
clusters between 2 and 10 and the number of vectors in each cluster between 8 and 25. The dimension of the data is fixed to 10. Table 3 summarizes the results averaged over 300 simulations. The proposed algorithm obtains better results than the other two for the estimated number of clusters, also the A.R.I. and Dunn Index are approximately the same. Functional Case
Functional data are now considered along with computing times. When a dimension is small (as in the previous examples), the CPU times were approximately the same. Two configurations were considered: First, functions
cos(10 / 2 10) / 5x x π+ + − ,
cos(10 / 2 10) / 5x x π+ + − and
² cos(10 / 2 10) / 5x x π+ + − were taken in [0, 1] discretized 20 times. The term cos(10 / 2 10) / 5x π+ − was added to disturb
functions x , x and ²x . Each data in 20 was noised with a vector composed by twenty Gaussian law N(0,σ) where the value of σ is selected for each data using σ∼N(0.1,0.02). Figure 5 shows examples of some of the functions generated. Three clusters of size randomly chosen between 15 and 25 were simulated 300 times. Results are presented in Table 4 (time is given in seconds).
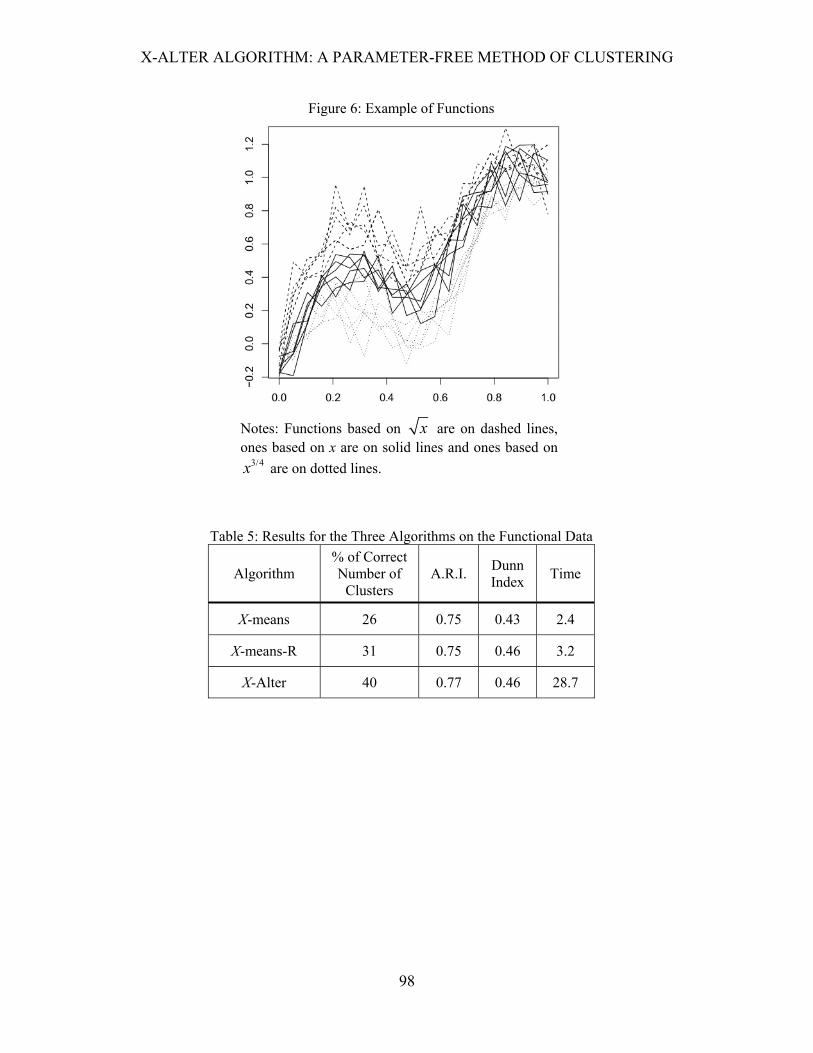
The proposed method gives better results, mainly regarding the search of the number of clusters. A slightly more difficult case was also considered. This configuration was constructed on the same model as the first,
but based on functions x , 3/4x and x which are closer than previous ones (see Figure 6 and Table 5).
The proposed method retrieves the correct number of clusters more often. Note that if the complexity of the algorithm is larger than that of the X-means, it is still much smaller than the Alter. Moreover Alter does not estimate the number of clusters. Robustness Study
The robustness properties of the L1
distance are now illustrated. As a starting point, the first functional configuration shown in Figure 5 was considered. To obtain noisy data the following protocol was used: a value x∈[−0.30;−0.15]∪[0.15;0.30] was added to a∈[10;25] percent of points (randomly chosen) of b∈[10;25] percent of data (randomly chosen) (see Figure 7 for an example). This procedure was repeated 300 times and averaged results are provided in Table 6.
The relevance of the L1-based distance error, which is much more robust to extreme values, is shown. If results are compared to those shown in Table 4 the correct number of clusters is found 95% of the time, while X- means and X-means-R do not perform as well and X-means-R do not perform as well (a loss of respectively 4% and 6%).
Table 2: Results for the Three Algorithms on the Three Clusters
Algorithm % of Correct Number of
Clusters A.R.I.
Dunn Index
X-means 55 0.82 0.22
X-means-R 76 0.82 0.22
X-Alter 86 0.84 0.22
Table 3: Results for the Three Algorithms on the Random Clusters
Algorithm % of Correct Number of
Clusters A.R.I.
Dunn Index
X-means 63 0.96 0.60
X-means-R 71 0.97 0.60
X-Alter 91 0.96 0.59

THOMAS LALOË & REMI SERVIEN
97
Figure 5: Example of Functions
Notes: Functions based on x are on dashed lines, ones
based on x are on solid lines and ones based on x2 are on dotted lines.
Table 4: Results for the Three Algorithms on the Functional Data
Algorithm % of Correct Number of
Clusters A.R.I.
Dunn Index
Time
X-means 81 0.88 0.63 2.0
X-means-R 85 0.88 0.63 3.5
X-Alter 95 0.89 0.63 27.6
X-ALTER ALGORITHM: A PARAMETER-FREE METHOD OF CLUSTERING
98
Figure 6: Example of Functions
Notes: Functions based on x are on dashed lines, ones based on x are on solid lines and ones based on
3/4x are on dotted lines.
Table 5: Results for the Three Algorithms on the Functional Data
Algorithm % of Correct Number of
Clusters A.R.I.
Dunn Index
Time
X-means 26 0.75 0.43 2.4
X-means-R 31 0.75 0.46 3.2
X-Alter 40 0.77 0.46 28.7

THOMAS LALOË & REMI SERVIEN
99
Real Data
The proposed method is next used with two conventional data sets from the UCI Machine Learning Repository (Frank & Asuncion, 2010); these are wine and iris data. In this case, the spherical Gaussian assumption of the BIC criterion cannot be assumed to be verified, therefore, it is important to test to ensure that this hypothesis is reasonable. The proposed method was compared to the X-means algorithm but also to the K-means algorithm with K known to be 3 (the real number of clusters); thus, 3-means have a significant
advantage over others methods by knowing the number of clusters. In these two real cases, as suggested in the description of the data sets, each variable is centered and standardized before performing clustering. Because K-means, X-means and X-means-R depend on the initialization, averaged results are given (over 50 runnings) for these methods. Wine Data Set
The wine data set is composed of 178 instances and 13 variables found in each of three types of wines. These data are the results of a
Figure 7: Example of the Results of the Perturbation of cos(10 / 2 10) / 5x x π+ + −
Note: Affected functions are on dashed lines.
Table 6: Results for the Three Algorithms on the Perturbated Functional Data Sets
Algorithm % of Correct Number of
Clusters A.R.I.
Dunn Index
Time
X-means 77 0.87 0.52 2.6
X-means-R 79 0.87 0.52 3.8
X-Alter 95 0.88 0.53 29.4

X-ALTER ALGORITHM: A PARAMETER-FREE METHOD OF CLUSTERING
100
chemical analysis of wines grown in the same region in Italy but derived from three different cultivars. In a classification context, this is a well posed problem with well-behaved class structures. The results for the 4 methods are presented in Table 7. The proposed method retrieves the real number of clusters and the same adjusted Rand index of 3-means is obtained, which is slightly less than the 2 others. Conversely, the method does not result in a good Dunn Index because one extreme instance is bad classified. X-Alter can also be compared to other methods used on this data set and listed on the UCI Machine Learning (Frank & Asuncion, 2010). For example, it better estimates the number of clusters than Dy and Brodley (2004) with their different methods.
Iris Data Set The iris data set is composed of 150
instances and 4 variables of 3 classes of 50 instances each, where each class refers to a type of iris plant. One class is linearly separable from the other two; the latter are not linearly separable from each other which makes it more difficult to classify. The results are gathered in Table 8.
The proposed method does not find the real number of clusters but it gets closer than other methods. Although the adjusted Rand Index was previously very close for all methods, the X-Alter is significantly better. Because the adjusted Rand Index is here considered – as opposed to the Rand Index – it does not indicate that the classification is perfect.
Table 7: Results for the Wine Data Set
Algorithm Number of
Clusters A.R.I. Dunn
X-means 8.67
(var=6.92) 0.78
(var=0.03) 0.162
(var=2.10−4)
X-means-R 8.54
(var=6.01) 0.78
(var=0.03) 0.165
(var=10−4)
3-means - 0.76
(var=0.03) 0.163
(var=0.0002)
X-Alter 3 0.76 0.142
Table 8: Results for Iris Data Set
Algorithm Number of
Clusters A.R.I. Dunn
X-means 13.7
(var=6.2) 0.46
(var=0.07) 0.0405
(var=6.10−5)
X-means-R 8
(var=1.56) 0.57
(var=0.03) 0.0398 (var=0)
3-means - 0.46
(var=0.0036)0.04
(var=0)
X-Alter 6 1 0.402
THOMAS LALOË & REMI SERVIEN
101
However, the high value of the A.R.I. indicates that the great majority of iris plants are well-classified; the 3 additional clusters are very small and do not affect the A.R.I and the global quality of the obtained clustering. In Dy and Brodley (2004), the estimation of the number of clusters was slightly better but, as discussed, the quality of clustering seems (as different criterions are used) to be better. Moreover, the interest of the aggregation step in X-means-R is enlightened and it appears that the spherical Gaussian assumption required for the BIC is acceptable and the X-Alter can be used with every data set.
Finally, in all cases the proposed method performed better than the others to estimate the number of clusters. This confirms that the local convergence of X-means, inherited from K-means, is avoided. Further, according to the adjusted Rand and the Dunn Indexes the quality of clustering is either equal to or significantly better than the other methods considered.
Conclusion A simple new algorithm to perform clustering was presented. The main advantage of this method is that it is parameter-free and, thus, it can be easily used without an expert knowledge of the data. This algorithm combines the Alter and X-means algorithms to benefit from the qualities of both (respectively the convergence and the automatic selection of the number of clusters). Moreover, combining the methods eliminates the main drawbacks of these two methods: the high complexity for Alter and the dependence on initials conditions for X-means.
Experiments using both simulated and real data sets show the relevance of the proposed method. However, even if complexity decreases (with respect to the Alter algorithm) it is too important for the method to be applied on very large data sets. A possible way to overcome this problem could be the utilization of the Alter-Fast algorithm (Laloë, 2010) as opposed to the Alter. Alter-Fast runs several times Alter in randomly chosen partitions of a data set and it can help save computational time but with some loss of efficiency. In future studies it would be interesting to look for others ways to accelerate Alter while preserving (as much as possible) its properties of convergence.
References Dunn, J. (1974). Well separated clusters
and fuzzy partitions. Journal on Cybernetics, 4, 95-104.
Dy, J., & Brodley, C. (2004). Feature selection for unsupervised learning. Journal of Machine Learning Research, 5, 845-889.
Frank, A., & Asuncion, A. (2010). UCI machine learning repository. Accessed at: http://archive.ics.uci.edu/ml.
Graf, S., &Luschgy, H. (2000). Foundations of quantization for probability distributions: Lecture Notes in Mathematics, 1730. Berlin, Germany: Springer-Verlag.
Handl, J., Knowles, K., & Kell, D. (2005), Computational cluster validation in post-genomic data analysis. Bioinformatics, 21, 3201-3212.
Hartigan, J., & Wong, M. (1979). A k-means clustering algorithm. Journal of the Royal Statistical Society, 28, 100-108.
Hubert, L., & Arabie, P. (1985). Comparing partitions. Journal of Classification, 2(1),193-218.
Kass, R., & Wasserman, L. (1995). A reference bayesian test for nested hypotheses and its relationship to the schwarz criterion. Journal of the American Statistical Association, 90, 928-934.
Kaufman, L., & Rousseeuw, P. (1990). Finding groups in data: An introduction to cluster analysis. New York, NY: John Wiley & Sons.
Kemperman, J. H. B. (1987). The median of a finite measure on a Banach space. In Statistical data analysis fased on the L1-norm and related methods, Neuchâtel, Ed., 217-230. Amsterdam: North-Holland.
Laloë, T. (2010). L1 quantizationand
clustering in Banach spaces. Mathematical Methods of Statistics, 19(2), 136-150.
Li, M., Ng, M., Cheung, Y. M., & Huang, J. (2008). Agglomerative fuzzy k-means clustering algorithm with selection of number of clusters. IEEE Transactions on Knowledge and Data Engineering, 20, 1519-1534.

X-ALTER ALGORITHM: A PARAMETER-FREE METHOD OF CLUSTERING
102
Linder, T. (2002). Learning-theoretic methods in vector quantization. In Principles of nonparametric learning (Udine, 2001), CISM Courses and Lectures, Vol. 434, 163-201. Vienna, Austria: Springer.
MacQueen, J. (1967). Some methods for classification and analysis of multivariate observations. In Proceedings of 5-th Berkeley symposium on mathematical statistics and probability, 281-297. Berkeley, CA: University of California Press.
Nguyen, X., Epps, J., & Bailey, J. (2009). Information theoretic measures for clustering comparison: Is a correction for chance necessary? In ICML’09: Proceedings of the 26th Annual International Conference on Machine Learning, 1073-1080. San Francisco, CA: Morgan Kaufmann.
Pelleg, D., & Moore, A. (2000). X-means: Extending k-means with efficient estimation of the number of clusters. In Proceedings of the Seventeenth International Conference on Machine Learning, 727-734. San Francisco, CA: Morgan Kaufmann.
Pham, T., Dimov, S., & Nguyen, C. (2005). Selection of K in K-means clustering. Proceedings of the Institution of Mechanical Engineers, Part C: Journal of Mechanical Engineering Science, 219, 103-119.
Rand, W. (1971). Objective criteria for the evaluation of clustering methods. Journal of the American Statistical Association, 66(336), 846-850.


