The Worldwide LHC Computing Grid
8
The Worldwide LHC Computing Grid WLCG Milestones for 2007 Focus on Q1 / Q2 MB, February 6 2007
-
Upload
honoria-merritt -
Category
Documents
-
view
12 -
download
2
description
The Worldwide LHC Computing Grid. WLCG Milestones for 2007 Focus on Q1 / Q2 MB, February 6 2007. Q1 2007 – Tier0 / Tier1s. Demonstrate Tier0-Tier1 data export at 65% of full nominal rates per site using experiment-driven transfers - PowerPoint PPT Presentation
Transcript of The Worldwide LHC Computing Grid
The Worldwide LHC Computing Grid
WLCG Milestones for 2007Focus on Q1 / Q2
MB, February 6 2007

Q1 2007 – Tier0 / Tier1s
1. Demonstrate Tier0-Tier1 data export at 65% of full nominal rates per site using experiment-driven transfers
– Mixture of disk / tape endpoints as defined by experiment computing models, i.e. 40% tape for ATLAS; transfers driven by experiments
– Period of at least one week; daily VO-averages may vary (~normal)2. Demonstrate Tier0-Tier1 data export at 50% of full nominal rates
(as above) in conjunction with T1-T1 / T1-T2 transfers– Inter-Tier transfer targets taken from ATLAS DDM tests / CSA06 targets
3. Demonstrate Tier0-Tier1 data export at 35% of full nominal rates (as above) in conjunction with T1-T1 / T1-T2 transfers and Grid production at Tier1s
– Each file transferred is read at least once by a Grid job– Some explicit targets for WMS at each Tier1 need to be derived from
above4. Provide SRM v2.2 endpoint(s) that implement(s) all methods defined
in SRM v2.2 MoU, all critical methods pass tests– See attached list; Levels of success: threshold, pass, success, (cum
laude)

What’s Changed Since TDRs?
• Main changes (AFAIK) are:– Doubling of ATLAS ESD (of which 2 copies)– Explicit full ATLAS ESD to BNL (hence ~3 total)– Doubling of CMS trigger rate
VO SIM SIMESD RAW Trigger RECO AOD TAG
ALICE 400KB
40KB 1MB 100Hz 200KB 50KB 10KB
ATLAS 2MB 500KB 1.6MB 200Hz 500KB 100KB 1KB
CMS 2MB 400KB 1.5MB 150Hz 250KB 50KB 10KB
LHCb 400KB 25KB 2KHz 75KB 25KB 1KB
VO SIM SIMESD RAW Trigger RECO AOD TAG
ALICE 400KB
40KB 1MB 100Hz 200KB 50KB 10KB
ATLAS 2MB 500KB 1.6MB 200Hz 1MB 100KB 1KB
CMS 2MB 400KB 1.5MB 300Hz 250KB 50KB 10KB
LHCb 400KB 25KB 2KHz 75KB 25KB 1KB

Megatable240107
Tier1 Centre ALICE ATLAS CMS LHCb Target
IN2P3, Lyon 5.8 109.2 31.5 10.5 157
GridKA, Germany 14.9 88.2 26.3 6.3 135.7
CNAF, Italy 4.6 88.2 36.8 6 135.6
FNAL, USA - - 105 - 105
BNL, USA - 287.2 - - 287.2
RAL, UK 0.3 102.2 26.3 6.3 135.1
NIKHEF, NL 1.7 109.2 - 9.1 120
ASGC, Taipei - 65.1 26.3 - 91.4
PIC, Spain - 49.7 10.5 3.5 63.7
Nordic Data Grid Facility 3.8 49.7 - - 53.5
TRIUMF, Canada - 48.3 - - 48.3
US ALICE 9.2 - - - 9.2
TOTALS 40.3 997 262.7 41.7 1341.7

Adjust ALICE Rates(Multiply by 4… Unlike HI)
Tier1 Centre ALICE ATLAS CMS LHCb Target
IN2P3, Lyon 23.2 109.2 31.5 10.5 174.4
GridKA, Germany 59.6 88.2 26.3 6.3 180.4
CNAF, Italy 18.4 88.2 36.8 6 149.4
FNAL, USA - - 105 - 105
BNL, USA - 287.2 - - 287.2
RAL, UK 1.2 102.2 26.3 6.3 136
NIKHEF, NL 6.8 109.2 - 9.1 125.1
ASGC, Taipei - 65.1 26.3 - 91.4
PIC, Spain - 49.7 10.5 3.5 63.7
Nordic Data Grid Facility 15.2 49.7 - - 64.9
TRIUMF, Canada - 48.3 - - 48.3
US ALICE 36.8 - - - 36.8
TOTALS 161.2 997 262.7 41.7 1462.6
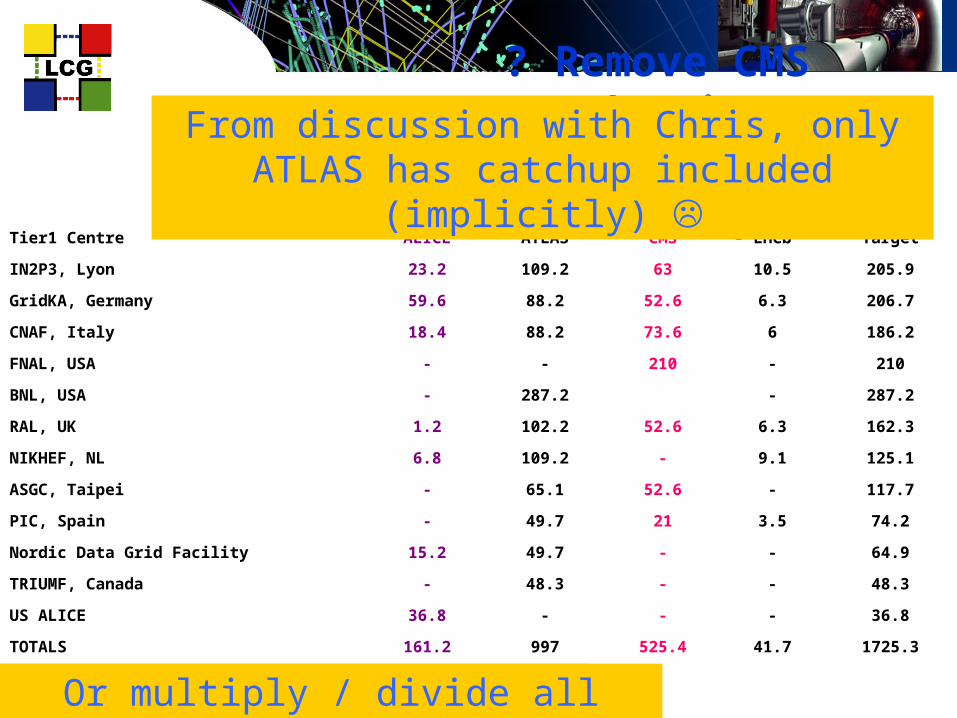
? Remove CMS Reduction
for machine efficiency ?
Tier1 Centre ALICE ATLAS CMS LHCb Target
IN2P3, Lyon 23.2 109.2 63 10.5 205.9
GridKA, Germany 59.6 88.2 52.6 6.3 206.7
CNAF, Italy 18.4 88.2 73.6 6 186.2
FNAL, USA - - 210 - 210
BNL, USA - 287.2 - 287.2
RAL, UK 1.2 102.2 52.6 6.3 162.3
NIKHEF, NL 6.8 109.2 - 9.1 125.1
ASGC, Taipei - 65.1 52.6 - 117.7
PIC, Spain - 49.7 21 3.5 74.2
Nordic Data Grid Facility 15.2 49.7 - - 64.9
TRIUMF, Canada - 48.3 - - 48.3
US ALICE 36.8 - - - 36.8
TOTALS 161.2 997 525.4 41.7 1725.3
CSA06 25% target was 150MB/sOr multiply / divide all others by 2?
From discussion with Chris, only ATLAS has catchup included (implicitly)

‘Catch-up’ for all…
Tier1 Centre ALICE ATLAS CMS LHCb Target
IN2P3, Lyon 46.4 95.2 63 21 225.6
GridKA, Germany 119.2 83.3 52.6 12.6 267.7
CNAF, Italy 36.8 127.4 73.6 12 249.8
FNAL, USA - - 210 - 210
BNL, USA - 355 - - 355
RAL, UK 2.4 96.6 52.6 12.6 164.2
NIKHEF, NL 13.6 91.7 - 18.2 123.5
ASGC, Taipei - 54.6 52.6 - 107.2
PIC, Spain - 39.2 21 7 67.2
Nordic Data Grid Facility 30.4 91.7 - - 122.1
TRIUMF, Canada - 37.8 - - 37.8
US ALICE 73.6 - - - 73.6
TOTALS 322.4 1072.5 525.4 83.4 2003.7

Conclusions
• We need to agree and document the basic input parameters to these calculations
Any changes must be announced & documented• It is understood that there are many more factors
than just machine efficiency…– Reprocessing of data at the Tier0 and sending out updated
copies has been mentioned – are the resources available?• We need to work from the same explicit assumptionsBaseline assumption is that 65% (etc) applies
to the final table (2GB/s out of CERN total pp)– i.e. 2GB/s *.65 ~ 1.3GB/s out of CERN– (1GB/s & 700MB/s respectively for M2/M3)