The World Cruise Industry: A Profile of the - Cardiff University · The World Cruise Industry: A...
43
Transcript of The World Cruise Industry: A Profile of the - Cardiff University · The World Cruise Industry: A...


The World Cruise Industry: A Profile of the
Global Labour Market
Bin Wu
Seafarers International Research Centre (SIRC) Cardiff University
52 Park Place Cardiff
CF10 3AT
Tel: +44 (0)29 2087 4620 Fax: +44 (0)29 2087 4619
[email protected] www.sirc.cf.ac.uk
March 2005
ISBN: 1-900174-25-1

2
CONTENTS
Acknowledgements 3 Executive Summary 4 1 Introduction 8 2 SIRC Cruise Database: Method and Sample 10 3 Distinguishing Cruise Jobs: The coding system applied in the SIRC Dataset 14 4 Age and Gender Profiles 19 5 Global Participation in the Contemporary Cruise Sector 26 6 Conclusions 35 References 38 Appendices 39

3
ACKNOWLEDGEMENTS
This report is rather uneven in terms of the scale of people involvement and the period from data
collection to this report. The idea of a cruise labour market survey through crew lists was originated
from Professor Tony Lane, former director of SIRC who had conducted a world seafarer survey
based upon collection and analysis of crew lists from UK seaports (Lane 1996). The scope of
information collection was then enlarged through an on-going project of global labour market
survey in SIRC and Bernardo Obando-Rojas was in charge of collecting crew lists (including cargo
and cruise ships) from main seaports world-wide from 1998. Many port authorities, seamen
missions and local collaborators in European ports kindly offered their helps in collection and
delivery of cruise lists. With encouragement and help from Bernardo Obando-Rojas and Dr.
Minghua Zhao, the data entrance started from October 2000. During the following half year period,
Phil Belcher, Drs. Tony Alderton and Nik Winchester also offered their time and expertise to
overcome many technical issues in relation to job distinction, database structure and analysis
techniques. It is no less important that Ms. Maria Goldoni and Ms. Louise Deeley provided full
support for recruiting and managing data entry which lasted for nearly half a year.
Special thanks should be given to Dr. Helen Sampson, current Director of SIRC, who has not only
encouraged the publishing of this report but also spent a lot time reading through the manuscript. So
also to Professor Tony Lane, Professor Mick Bloor, Dr. Nik Winchester and Dr. Michelle Thomas
who offered their support and comments at various stage of writing this report. However, only the
author is responsible for any mistakes or misinterpretation.
Part of this information has been used by some publications in other places including: Crewing
International Merchant Fleets (by Lane et al, Lloyd’s Register-Fairplay 2002) and “Accession to
global labour market: principles and applications of SIRC database in the cruise sector” (Wu, WMU
Journal of Maritime Affair 2003). This report, however, presents an improvement in both analysis
methods and the accuracy of results.

4
EXECUTIVE SUMMARY
The emergence of a global labour market in the world cruise sector raises questions about the
availability of reliable, accurate and timely information about seafarers world-wide. Alongside a
global seafarer database established for the cargo sector, the Seafarers International Research
Centre (SIRC) at Cardiff University has also created a global seafarer database for the cruise sector.
This report aims to: (1) introduce the principles of the SIRC cruise labour survey; (2) establish a
coding system for job recognition, classification and profile analysis; (3) reveal the scale and extent
of global participation in this sector; (4) highlight the contribution of women seafarers; (5) explore
the methodological implications for the next cohort of the SIRC world cruise labour market survey.
The SIRC cruise database is the product of the on-going SIRC global labour market survey project,
which is based upon collecting, cleaning and coding crew lists from major seaports world-wide. As
an alternative method to national census or company questionnaire surveys, crew list sampling
captures three types of information: voyage details (port visited and destination port), ship details
(name etc.) and crew details (nationality, rank and date of birth). Including vessel details allows for
linkages to be established with cruise vessel ownership and management company details all of
which are available in world vessel databases (e.g. Lloyd’s Register-Fairplay world ship CD-ROM).
The first cohort of the SIRC world cruise survey was limited to European waters and resulted in the
collection of 96 valid crew lists in the period from 1996 to 2000. This report however, focuses on
the year 2000 itself, during which time the largest number of crew lists were collected containing
12,000 seafarer cases aboard 37 vessels and accounting for about 15 percent of the world fleet in
that year. The profile of the sampled ships in the 2000 dataset is quite well matched with the profile
of the world cruise fleet in terms of ship size, age, and flag register. It is therefore reasonable to
assume that the results from data analysis offer valuable ins ights into world cruise employment

5
although a certain degree of caution may be needed regarding the accuracy of this data when
generalising about cruise seafarers word-wide.
One difficulty of compiling this data is that there is a lack of standardisation across the world cruise
employment sector, resulting in a great variety of job names and function definitions being used by
different cruise operators. In order to cope with this difficulty, this report proposes a coding system
based upon three criteria as follows:
A.) Occupation and skill category, by which the enormous number of job titles can be reduced to a
few standardised job areas;
B.) Functional division, by which hundreds of crew members are relocated into several sections and
departments for analysis and comparison purposes;
C.) Responsibility in crew management, by which all crew members can be distinguished into four
hierarchies: senior, junior and petty officers, and ratings regardless of their skills or locations.
As a result, over a thousand job titles in the raw data are reduced to a total of 28 in the dataset. 85
percent of the sample is located in the hotel section, leaving the remaining 15 percent in the marine
section. Within the hotel section, nearly 30 percent of people work in the bar and food department
and the rest work in guest services (e.g. medicine, security, maintenance, cruise services, in total
25%), galley (21%) and cabin (18%), leaving 6% in the category of “other” (e.g. casino, shop,
photo, beauty). A pyramid structure characterises cruise employment with ratings located at the
bottom of the pyramid (59%), followed by petty officers (26%) and junior officers (12%),
culminating with senior officers (3%) on the top. The distribution of ranks is uneven: the marine
section has more senior and junior officers (36%) than the hotel section (11%); within the hotel
section, all senior officers are located in guest services while over three quarters of cabin, bar/food
and galley staff are ratings.

6
The average age of cruise seafarers in the 2000 dataset was 33.8 years old although marine staff are
nearly 5 years older than this on average. The mean age of senior officers was 44 years old for both
marine and hotel sections. Below senior level, marine staff were older than their hotel counterparts
by an average of 3 years in the case of junior officers and 8 years in terms of petty officers. A cross-
sectional analysis of the age profile indicates that there is a normal distribution at senior officer
level, but that amongst the rest of the ranks, cruise seafarers are skewed to younger age groups (i.e.
under 30), and there is no significant difference between the marine and hotel sections.
Furthermore, amongst hotel staff, junior and petty officers are similar in mean age. The exception
to this is found amongst junior officers in the guest services and cabin departments who are an
average of 3 years younger than their colleagues, and whose ages more closely correspond with
those of hotel ratings.
Within this dataset females constitute 19 percent of (cruise) seafarers, 81 percent being male. A
third of females work in guest services, followed by the cabin (23%), bar and food (20%) and
“other” (17%) departments. By contrast, few females (7%) are found in either marine or galley
departments. Amongst the female ‘favoured’ departments, the share of females in the total staff
varies from 56 percent in the “other” category (mainly concessionaire) and 30 percent in guest
services and cabin, to 15 percent in the bar/food department. The survey suggests that over a half of
all female cruise seafarers are engaged in middle ranking jobs (i.e. junior or petty officers). This
places them 16 percentage points above their male counterparts. In addition, the average age of
females is just 30 years old, 5 years younger than their male colleagues in all ranks. However, the
data also indicates that females are under represented at senior level in both absolute (number) and
relative (percent) terms. Only 13% of senior officers, for instance, are female.
99 different nationalities can be found within the SIRC cruise seafarer dataset. However, 10
nationalities account for two thirds of the sample. Of these the Philippines provides 29% of the

7
total and the next largest suppliers, Italy and the UK, each supply 6%. However a rough regional
balance can be identified whereby 40 percent of seafarers are supplied by the Asia-Pacific region
(excluding Japan, South Korea, Hong Kong and Taiwan), 30 percent by advanced economies, and
the rest by East Europe, Latin America and others. Regional differentiation is apparent in the
consideration of the division of labour: over a half of the advanced economies’ seafarers are located
in the guest services and other departments which is in contrast to those from the developing world
(mainly Asia and Latin America) who are more likely to work in the galley, bar and food
departments. Additionally, regional inequalities are obvious: seafarers from advanced economies
occupy three quarters of senior and over half of all middle ranks. Such Regional differences remain
even after gender differences are accounted for.

8
1. Introduction
The latter part of the 20th Century was characterised by rapid growth in the contemporary cruise
industry. According to Institute of Shipping Economics and Logistics (ISL) statistics, the total
number of world cruise ships over 1000 GT increased by 65 percent in the year 2000 compared
with the year 1985, whilst in gross tonnage (GT) terms there was a growth of approximately 350%
in the same period (ISL 2001). This growth was associated with an expansion in the size of the
average cruise vessel taking it from 15 thousand GT in 1985 to 32 thousand GT in 2000. Such
growth is likely to continue as more new vessels join the world fleet (Wild and Dearing 2000, Klein
2003).
The rapid growth of the world cruise industry is closely related to the establishment and
development of a global labour market for seafarers. It is common strategy for cruise companies to
seek and recruit seafarers from Asia, Latin America, and East European countries, just like their
counterparts in the cargo sector (Klein 2001, Lane et al 2002; Wu, 2003). This offers companies
cost-cutting opportunities that they are eager to take advantage of.
Compared with the cargo sector however, the labour market is more complex in the cruise sector
due to the large size of cruise vessels and their complex division of labour. Reliable, accurate and
timely information on the cruise labour market is important for ship owners and managers in order
to enable them to evaluate vessel operations, crew size and staffing costs. However, while a
regular labour survey is available for the cargo sector (e.g. BIMCO/ISF report), no such work has
been done for the cruise sector. As a result we have little knowledge about the world cruise labour
market and the extent to which the world cruise sector depends upon a global labour market.

9
Similarly we do not know what role major suppliers play in this sector or what recruitment patterns
have been adopted by the industry?
In an attempt to address these and similar questions, a limited cruise labour market survey has been
conducted by the Seafarers International Research Centre (SIRC) at Cardiff, UK. As a part of an on-
going global seafaring labour market project, the cruise sector survey follows a similar
methodology to that conducted for the cargo sector in terms of data collection and analysis. As the
first trial in the world, the SIRC world cruise survey, in phase one, was limited to European waters,
resulting in the collection of 96 valid crew lists in the period 1996 to 2000. This report is restricted
to the year 2000, which represents the biggest portion of the SIRC cruise database.
This report aims to achieve the following objectives:
• To introduce the principles of the SIRC cruise labour market survey;
• To establish a coding system for job recognition, classification and profile analysis;
• To reveal the scale and extent of global participation in this sector;
• To highlight the contribution of women seafarers;
• To explore the methodological implications for future cruise sector surveys.

10
2. The SIRC Cruise Database – Method and Sample
The SIRC cruise database has been developed as part of the on-going SIRC global labour market
survey project. It is based upon collecting, verifying, coding and analysing crew lists. Crew lists are
legal documents containing information on both vessels and crew members for the purpose of
reporting to port authorities or immigration control officers. The information available from a crew
list includes: ship name, call time, voyage details, crewing level and a range of information about
individual crew members including name, rank, nationality, date and place of birth. As a result,
crew lists provide a reliable and efficient means to access up-to-date information on active seafarers
in the international fleet.
The survey of the cruise sector labour force began with the collection of crew lists from major
seaports in Europe. The information on ship voyages and crew members was entered and
supplemented with additional information on ship registration, ship type, size, flag, date of build,
nationalities of ship manager and registered owner.1
Figure 1 SIRC Global Labour Market Survey and Seafarers Database
1 This data is available from world ship register databases (e.g. Lloyd’s Register-Fairplay or Clarksons World Fleet Register).
SHIP • Type & Size • Date of build • Flag & owner • Crewing level
CREW LIST • Ship name • Port of data collection • Date of data collection • Voyage details
CREW • Age • Rank • Nationality • Place of birth

11
Figure 1 outlines the framework of the SIRC global seafarer market survey. As an alternative
method to those utilising national census data or surveys of international shipping companies, the
SIRC survey utilises crew lists to extrapolate world labour market data. Active seafarers constitute a
mobile population intrinsically linked with flows of ships, commodities (for the cargo sector) and
passengers/services (for the cruise sector) (Wu 2003). In the absence of a sample frame for the
world seafaring population, world seaport and fleet statistics provide an alternative means to
estimate sample bias and errors in the SIRC database. For instance, sample bias in the cruise dataset
can be measured by contrasting all seaports, flag states, or cruise companies recorded in the SIRC
cruise dataset with the profile of the world cruise sector as recorded in Lloyd’s Register-Fairplay
world ship database.
Constrained by limited resource and issues of port access, the first cohort of the SIRC cruise labour
market survey was limited to major EU ports including: Barcelona, Southampton and Amsterdam,
during the period 1999 to 2000. Prior to data entry, crew lists were ‘verified’ via the application of
the following rules. Firstly, only cruise ships qualified for the survey, which ruled out ferry or other
passenger ships. Secondly, in each year a ship was allowed to appear only once in the cruise dataset.
Finally, where more than one crew list had been collected from a specific ship within the same year,
priority was given to the list collected on a date nearest to the middle of the year (e.g. 1st July, the
peak time of cruise business).
Of a total of 96 valid crew lists from 1996 to 2000, this report presents data from the year 2000, the
biggest dataset within the SIRC cruise database which contains 12000 seafarers. Although crew lists
were collected at EU ports, all 37 sampled vessels within the dataset operated on the world’s major
cruise routes including: the Caribbean, Mediterranean and Western Europe. These vessels were
managed by 26 different companies based in the USA, UK and other EU countries. The ships in the
sample were registered with a total of 12 different flag states.

12
The representativeness of the SIRC sample can be examined by considering: a) vessel
characteristics, i.e. the number of vessels, type, size and age; b) the profile of ship management, i.e.
ship owner and manager, flag register, country of economic benefit. To assess the former, Table 1
contrasts the sample vessels with the world total in 2000. It shows that the SIRC sample represents
more than 15 percent of the world fleet in terms of vessel numbers and 13 percent in total GT (see
Table 1). Within the SIRC sample, on average, vessels were slightly smaller (in terms of GT) and
older than the average for the world fleet. However, the difference is not great and is unlikely to be
significant.
Table 1 Sample Ships in SIRC Database and Profile Comparison with World Fleets
Data N GT total (‘000) GT average Age average
SIRC 37 1,040 28,099 20.2
World 243 7,772 32,000 18.8
SIRC/World (%) 15.2 13.4 87.8 107.5 Source: World cruise data from ISL 2000.
In relation to the profile of cruise management, the representativeness of the SIRC sample is
illustrated by Table 2 which shows that the sample ships match the world fleet fairly closely in
general, but may be closer for one flag than another (comparing the distribution of Panama and UK
vessels in Table 2 for instance) . This seems to indicate that despite the limitations of resource and
access constraining the data collection, the information presented in this report can be considered to
be reasonably representative of the world cruise fleet. It is thus reasonable to assume that the results
from the analysis of the SIRC dataset offer valuable insights into the world cruise employment
situation although some caution in generalising from the figures is advisable.

13
Table 2 Top 5 Flag Register in SIRC Dataset and World Fleet
SIRC World
Rank Flag % of total in sample
Average GT (000)
Average Age
Flag % of total in world fleet
Average GT
(000)
Average Age
1 Bahamas 35.1% 21 20.0 Bahamas 28.0% 34 17.6
2 Liberia 24.3% 50 15.6 Liberia 16.9% 50 10.6
3 Panama 8.1% 20 39.3 Panama 14.4% 26 26.9
4 UK 8.1% 55 13.0 UK 4.9% 56 14.8
5 NIS 5.4% 11 21.0 NIS 4.9% 43 14.5
-- -- -- -- -- -- -- -- --
Total 37 (Ships) 28 20.2 Total 243 (Ships) 32 18.8
Notes: World cruise data from ISL 2000. GT and age of ships as average.
This section of the report has briefly introduced the principles of the SIRC cruise database and
examined its overall representativeness. As an alternative to a national census survey or company
questionnaire survey, the SIRC labour survey collects, verifies and compiles crew lists from major
seaports world-wide, then conjoins them with other information already in the public domain such
as world transport/cruise/fleet statistics to extrapolate from these data sources a picture of the world
labour market. The accuracy of the SIRC sample is dependent upon both the geographic location of
the sample ports and the profile of sample ships. Although the first cohort of the SIRC cruise labour
survey was limited to European ports, the profile of sample ships is quite well matched with the
world cruise fleet (in 2000) in terms of both the physical characteristics of ships and the profile of
ship management. Bearing in mind sample biases however, a certain amount of caution is advisable
when generalising from the SIRC dataset and reaching major conclusions about the profile of the
world’s cruise sector seafarers.

14
3. Distinguishing Cruise Jobs: The coding system applied in the SIRC dataset
A major barrier to any analysis of the cruise industry labour force is that there are no standard job
definitions or classification systems utilised across the sector. This constrains the analysis and any
comparison of crew information across flags or companies. In order to overcome this problem a
coding system has been established by SIRC to assist with the analysis of the dataset.
The coding system is based upon three criteria as follows.
A) Occupation or skill level. Marine and hotel staff are distinguished from each other using an
understanding of their different career routes and qualification requirements.
B) Functional differentiation. Functionally similar groups can be identified within the workforce.
For example bar, food, and beverage sections can be treated as similar because they share
working procedures, standards and skills. Also guest services - which technically speaking
crosses the boundaries of cabin, food processing (galley) or delivery (Bar, Food & Beverage)
departments - can be defined as an independent department which provides support, co-
ordination or inter-departmental services for customers (e.g. security, medicine, maintenance,
entertainment, host/ess; chaplain, librarian, excursion, etc). A category of “other” is used to
cover those concessionaires (including casino, shop, photo, hairdresser) which rent a place
onboard for special services.
C) Responsibility and crew management . Four categories or hierarchies are used for this report
including: senior officers who take charge of, and manage, staff to achieve the aims of the
cruise operation; junior officers who are responsible for achieving aims defined by senior
officers through detailed planning, communication or management practices; petty officers who
have a role in the supervision of a work group or who can work onboard ship with minimum

15
supervision; ratings are all other crew members (although some may have more skills than
others).
Applying these criteria to the SIRC dataset enables us to conflate all job variations (1500+) found in
the raw data to a more manageable and meaningful 28 job categories for the purpose of analysis.
Cruise staff can be divided into those who work in the marine and those who work in the hotel
sections of the ship. Within each section, several departments can be identified. For the purpose of
this report, we do not distinguish between deck and engine staff within the marine section and we
focus on the much larger and more differentiated hotel side. Accordingly, in this report the hotel
section is divided into five “departments”: guest services, cabin, bar and food, galley and other.
Figure 2 illustrates the distribution of the sample of seafarers by section: 85 percent of cruise staff
work in the hotel section and 15 percent on the marine side. Within the hotel section, the largest
department is bar and food which employs nearly 30 percent of the hotel staff, followed by guest
services (25%), galley (21%) and cabin (18%). The other (concessionaire) department represents
about 7 percent of the total personnel in the hotel section.
Figure 2 Division of Sample Seafarers by Section and Department
With reference to management and supervisory responsibilities, a “four-tier” occupational hierarchy
aboard cruise ships can be identified as follows:
Section division
Hotel85%
Marine15%
Department division within Hotel
Cabin18%
Galley21%
Other7%
Bar/FD29%
Guest service25%

16
• Senior officers: captain, staff captain, chief engineer, purser, cruise director. Doctors onboard
are also put into this category in recognition of their special responsibility and social status.
• Junior officers. Officers at or below 2nd officer and 3rd engineer as well as radio, electrical and
trainee officers (cadets). Managers on the hotel side who are in charge of a department.
• Petty officers. On the marine side these include the bosun and fitter. On the ho tel side, chief
waiter/ess, chief cook, as well as some key positions such as store keeper, tailor, entertainment
and concessionaire staff are placed in this category.
• Ratings are all crew members outside these categories although some of them may have more
skills (e.g. baker or cooks) than others (e.g. deck boy, cleaner or various trainees).
Table 3 provides a “road-map” illustrating the job coding system implemented in this analysis and
demonstrating the intersection between departmental and hierarchical divisions. Here we see that
the occupational division of labour aboard cruise vessels must be understood in terms of both a
horizontal and vertical differentiation.
Table 3 Road-Map for Job Coding System RANK MARINE GUEST CABIN BAR/FD GALLEY OTHER
Senior
Captain, Ch engineer
1st mate, 2nd engineer
Staff captain purser,
doctor, cruise director
--
--
--
--
Junior
2nd officer/3rd engineer,
cadet
Security officer cruise
assistants nurses
Manager Clerk officer
Manager
Chef
--
Petty
Bosun, fitter,
Quarter master
Maintenance Ch laundry
Entertainment
Manager assists Linen store,
tailor, Ch steward
Manager assist Ch waiter/ess
Ch cook
All staff
Rating
Ratings in deck and engine
Fireman steward,
cleaner utility
Steward, Cleaner Utility
Waiter/ess
utility
Cook Steward Cleaner
--

17
If we consider the horizontal division of labour on board we find a pyramid structure in which
ratings constitute the bottom (59%), followed by petty officers (26%), junior officers (12%) and
finally senior officers (3%) (see figure 3).
Figure 3 Pyramid Structure of Cruise Employees
However, when we consider vertical as well as horizontal divisions of labour aboard cruise vessels
we find a more complex and revealing pattern. Figure 4 illustrates that there are a greater
proportion of senior and junior officers (36 % in total) in the marine section than in the hotel section
(11% in total). Within the hotel section however, different departments are characterised by
different hierarchical patterns. Specifically the cabin, bar/food and galley departments share a
similar pattern in which over three quarters are ratings. This differs markedly from the guest
services department where ratings constitute less than 40 percent of the total and where all senior
officers within the hotel side are located.
Junior 12%
Ratings 59%
Petty 26%
Senior 3%

18
Figure 4 Rank Composition by Department
In summary, the great variety of jobs aboard cruise ships can be categorised and analysed with
reference to three criteria: occupation/skill category, functional differentiation and management/
supervisory responsibility. Such an analysis reveals that 85 percent of cruise sector workers are
employed in the hotel section and 15 percent in the marine section. Within the hotel section, nearly
30 percent are employed in the bar/food department, followed by guest services, galley, cabin and
“other”. A pyramid structure applies to the cruise hierarchy in which nearly 60 percent of posts are
filled by ratings, followed by petty and junior officers and culminating with senior officers. The
distribution of ranks between the marine and hotel sections is uneven: the marine section has a
higher proportion of senior and junior officers (36%) than the hotel section (11%). It is also
interesting to note that within the hotel section, all senior officers reside in guest services
departments whilst over three quarters of cabin, bar/food and galley staff are ratings.
0%
20%
40%
60%
80%
100%
Marine Guest Cabin Bar/FD Galley
Senior
Junior
Petty
Rating

19
4. Age and Gender Profiles
Using the categorisation already described, this section further cons iders cruise vessel employment
in terms of age and gender.
The average age of the sample is 33.8 years old. However age varies considerably across section
and rank. Marine staff are, on average, nearly 5 years older than the mean for cruise ship workers
while senior officers in both marine and hotel sections have an average age of over forty.
Figure 5 Mean Age by Section and Rank
30
32
34
36
38
40
42
44
46
Senior Junior Petty Rating
Rank Division
Age
Marine Hotel
Figure 6 illustrates age profile by rank and section. Amongst senior officers, in general a normal age
distribution can be found for both marine and hotel staff. By contrast, the age profile for junior
officers is skewed towards younger age groups in both the marine and hotel sections (see Figure 6).
Such patterns also apply to petty officers and ratings in both sections.

20
Figure 6 Comparison of Age Profile by Section and Rank (2000)
Amongst hotel staff, junior and petty officers are similar in terms of mean age (see Figure 7).
The exception is found amongst junior officers in the guest services and cabin departments who are
on average 3 years younger than their colleagues.
Figure 7 Mean Age of Hotel Staff by Department and Rank
31
32
33
34
35
36
37
Junior Petty Rating
Rank Division
Age
Guest Cabin Bar/Fd Galley
Senior Officer
05
1015202530354045
< 30 30 - 39 40 - 49 50 - 59 >= 60
Age Band
Per
cent
Marine Hotel
Junior Officer
0
10
20
30
40
50
< 30 30 - 39 40 - 49 50 - 59 >= 60
Age Band
Per
cent
Marine Hotel

21
Compared with the cargo sector where less than 1 percent of seafarers are women (Belcher et al
2003: 10), contemporary cruise ships generally offer more opportunities to females. In conducting
this survey, practical problems were encountered in collecting data on gender as less than 20
percent of crew lists contained information on sex which impedes effective gender analysis and
comparison. To partially address this difficulty, the first names of crew members were entered into
the database alongside their nationality and members from appropriate cultural groups were
consulted about naming practices vis a vis gender. Using this method, 95 percent of the sample’s
gender was identified, and the rest was treated as missing data and weighted using mathematical
procedure.
Using this technique, we are able to estimate with a reasonable degree of confidence that female
seafarers account for 19 percent of the sample (see Figure 8).
Figure 8 Participation of Female Seafarers in Sample Cruises
Figure 9 indicates the distribution of women across sections/departments. It is notable that there are
few females working in either the marine section (less than 2 percent) or the galley (4%)
Female19%
Male81%

22
department. By contrast, over one third of them are employed in guest services, followed by the
cabin (23%), bar/food (20%), and other (concessionaires, 17%) departments.
Figure 9 Distribution of Female Seafarers by Department/Section
Within female-favoured departments, the female share of employment varies ranging from 15
percent in bar/food to 30 percent in guest services and cabin (see Figure 10). It is noteworthy that
female seafarers are actually dominant in the ‘other’ (concessionaire) department where 56 percent
of staff are female.
Figure 10 Gender Composition by Female-favoured Department
Marine2%
Bar/FD20%
Galley4%
Other17%
Guest service34%
Cabin23%
0%
20%
40%
60%
80%
100%
Guest service Cabin Bar/FD Other
Department Division
Female
Male
23
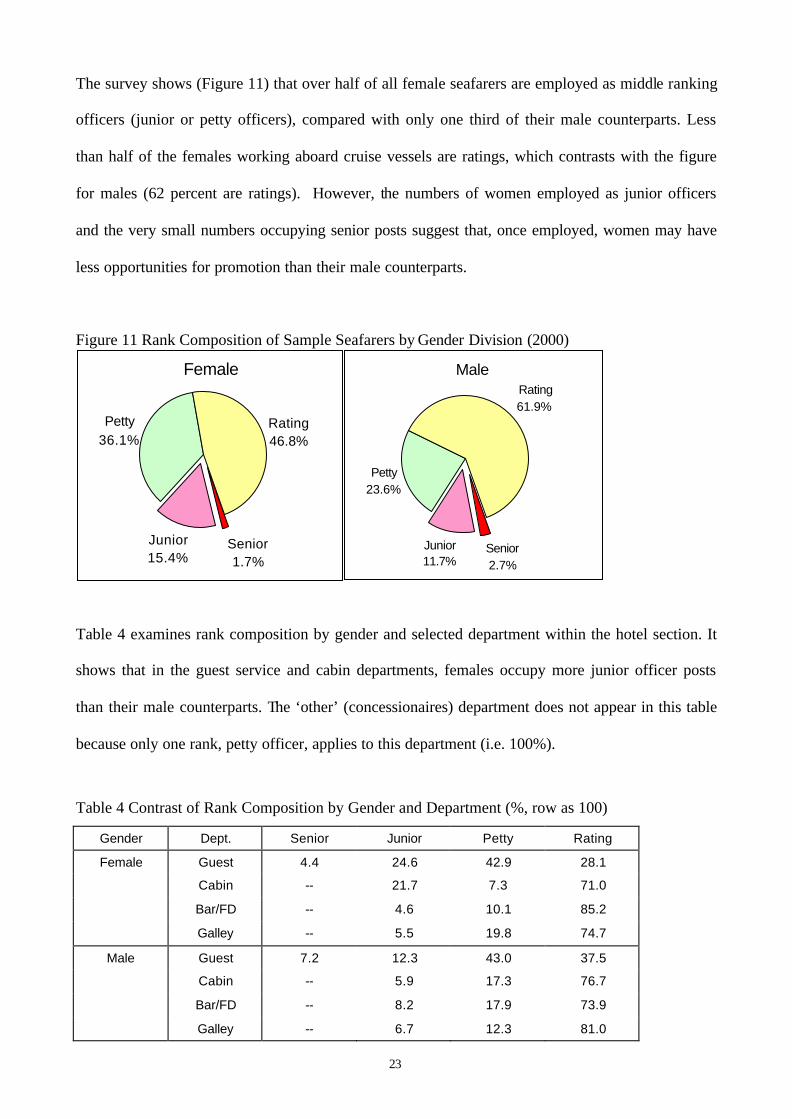
The survey shows (Figure 11) that over half of all female seafarers are employed as middle ranking
officers (junior or petty officers), compared with only one third of their male counterparts. Less
than half of the females working aboard cruise vessels are ratings, which contrasts with the figure
for males (62 percent are ratings). However, the numbers of women employed as junior officers
and the very small numbers occupying senior posts suggest that, once employed, women may have
less opportunities for promotion than their male counterparts.
Figure 11 Rank Composition of Sample Seafarers by Gender Division (2000)
Table 4 examines rank composition by gender and selected department within the hotel section. It
shows that in the guest service and cabin departments, females occupy more junior officer posts
than their male counterparts. The ‘other’ (concessionaires) department does not appear in this table
because only one rank, petty officer, applies to this department (i.e. 100%).
Table 4 Contrast of Rank Composition by Gender and Department (%, row as 100)
Gender Dept. Senior Junior Petty Rating
Female Guest 4.4 24.6 42.9 28.1
Cabin -- 21.7 7.3 71.0
Bar/FD -- 4.6 10.1 85.2
Galley -- 5.5 19.8 74.7
Male Guest 7.2 12.3 43.0 37.5
Cabin -- 5.9 17.3 76.7
Bar/FD -- 8.2 17.9 73.9
Galley -- 6.7 12.3 81.0
Female
Senior1.7%
Junior15.4%
Petty36.1%
Rating46.8%
Male
Senior2.7%
Junior11.7%
Petty23.6%
Rating61.9%

24
Male predomination in senior officer posts is confirmed by Table 5 which shows gender
composition by department and rank. Indeed, female senior officers account for only 13 percent of
the total senior officers. This is six percentage points less than would be expected given the ir
numbers on board (see Figure 8). This indicates that whilst the largest number of female seafarers
are employed in middle ranks (junior and petty officers), they are under represented at senior officer
level. Significantly they are also massively underrepresented in marine departments where only 2.8
percent of senior officers, 3.2% of junior officers and 1.3% of petty officers are female. This
suggests that, in the cruise sector, vertical gender segregation is stronger than horizontal gender
segregation.
Table 5 Ratio of Female to Male Seafarers by Department and Rank (%, column as 100)
Rank Gender Marine Guest Cabin Bar/FD Galley Other Total
Senior Female 2.8 21.5 -- -- -- -- 12.7
Male 97.2 78.5 -- -- -- -- 87.3
Junior Female 3.2 47.3 60.1 9.2 3.5 -- 23.6
Male 96.8 52.7 39.9 90.8 96.5 -- 76.4
Petty Female 1.3 30.9 14.7 9.2 6.6 55.5 26.5
Male 98.7 69.1 85.3 90.8 93.4 44.5 73.5
Rating Female 2.3 25.1 27.5 17.2 3.9 -- 15.1
Male 97.7 74.9 72.5 82.8 96.1 -- 84.9
Our survey suggests that the average age of female seafarers is just over 30 years old, making them
an average of 4.6 years younger than their male colleagues. Furthermore, Figure 12 indicates that
females are younger than males in all positions but that the average age difference ranges from 7
years amongst senior and petty officer ranks to 3 years amongst ratings (see Appendix 2 for details).

25
Figure 12 Difference of Mean Age by Gender and Rank
25
30
35
40
45
50
Senior Junior Petty Rating
Rank Division
Age
Female Male
In summary, this section has examined the age and gender profile of cruise ship workers. Two
conclusions can be drawn from this data. Firstly, the world cruise industry is dominated by young
employees; the average age of the sample being less than 34 years old. With the exception of senior
officers, employment in all ranks is skewed toward younger age groups (i.e. under 30). The SIRC
cruise survey also indicates that there is a significant contribution from female workers in the cruise
sector. However, whilst females represent 19 percent of all employees, they are unevenly
distributed by department and rank. Generally, females are employed in higher numbers in
concessionaire, guest services and cabin departments. They are under represented in the marine
section and galley department. Female seafarers are, on average, younger than their male
counterparts. In addition, females are better represented in junior or petty officer posts than their
male counterparts. However, they are significantly less likely to hold a senior position than males.

26
5. Global Participation in the Contemporary Cruise Sector
That cruise shipping employs a multinational workforce can be illustrated by the scale and extent of
differentiation by nationality.
Amongst the total 12,450 seafarers in the SIRC dataset, 99 nationalities are represented. Of these,
ten nationalities constitute two thirds of the sample. Figure 13 shows the most common nationalities
found aboard contemporary cruise vessels.
Figure 13 Top 10 Nationalities in SIRC Cruise Dataset
Regional patterns can be identified using the Internationa l Monetary Fund’s regional categorisation
(IMF 2003). Thus four regions can be identified: Advanced Economies, East Europe (or countries
in transition), Asia2, Latin America and others (for a comprehensive list see Appendix 1). Using this
differentiation, Table 6 highlights the regional distribution of the sample and the major players
within each group. Generally, advanced economies supply nearly 30 percent of cruise labour, Asia
supplies 40 percent, and 30 percent is supplied by East Europe, Latin America and others.
2 Asia here excludes those countries or regions - Japan, South Korea, Hong Kong, Taiwan and Singapore - which are in the Advanced Economies category.
Other33%
Germany4%
Ukraine3%
Colombia3%
Indones.4%
India5%
Honduras5%
UK6%
Italy6%
Philip.29%
Greece2%

27
Table 6 Regional Division and Top 5 Nationalities within each Region (2000, unweighted)
Region Nationality N % of Region % of World
Advanced Italy 789 21.8 6.3
United Kingdom 722 19.9 5.8
Germany 484 13.4 3.9
Greece 280 7.7 2.2
United States 200 5.5 1.6
Sub-total 2475 68.4 19.9
Regional total 3621 100.0 29.1
E Europe Ukraine 416 23.1 3.3
Russia 242 13.4 1.9
Croatia 227 12.6 1.8
Romania 202 11.2 1.6
Poland 194 10.8 1.6
Sub-total 1281 71.1 10.3
Regional total 1801 100.0 14.5
Asia Philip. 3546 71.3 28.5
India 670 13.5 5.4
Indonesia 524 10.5 4.2
China 103 2.1 0.8
Thailand 73 1.5 0.6
Sub-total 4916 98.9 39.5
Regional total 4973 100.0 39.9
L America Honduras 677 32.8 5.4
& others Colombia 315 15.2 2.5
Peru 266 12.9 2.1
Mauritius 128 6.2 1.0
Mexico 108 5.2 0.9
Sub-total 1494 72.3 12.0
Regional total 2059 100.0 16.5
World Total 12454 -- 100.0
Figure 14 shows the regional characteristic s of the division of labour onboard. Over half of the
advanced economies’ seafarers work for the guest services and other departments, which contrasts
with the domination of the galley, bar and food departments by Asian and Latin American seafarers.

28
Figure 14 Distribution of Regional Seafarers by Department
The data indicate that there are some concentrations of nationals in particular jobs and ranks.
Table 7 illustrates some of these national “specialities”. For example, whilst British seafarers are
concentrated in the guest services and “other” departments, half of the Greeks employed can be
found within the Marine section.
Table 7 Speciality of Labour Supply by Selected Countries (%, row as 100)
Nationality Marine Guest Cabin Bar/FD Galley Other
U. K. 11 43 4 6 1 34
Greece 50 19 3 19 9 1
Italy 26 32 7 13 10 11
Russian 19 39 12 21 8 0
Ukraine 29 14 19 24 14 0
Honduras 17 13 18 23 29 0
India 3 16 25 32 23 1
Philip. 17 12 16 27 27 1
Regional differences are even more evident when rank is considered. Figure 15 shows that over 30
percent of the advanced economies’ seafarers occupy senior or junior posts, compared with almost
no senior officers and few junior officers from Asia and Latin America. By contrast, less than one
0%
20%
40%
60%
80%
100%
Advanced E Europe Asia L A/other
Regional Division
Other
Galley
Bar/FD
Cabin
Guest
Marine

29
quarter of ratings come from advanced economies and more than three quarters of ratings come
from Asia and Latin America.
Figure 15 Rank Composition of Regional Seafarers
Figure 16 confirms the unevenness of regional distribution across rank. It shows that in particular
more than half of all petty officer jobs on the hotel side are occupied by seafarers from advanced
economies which is in contrast to less than 20 percent on the marine side. East European seafarers
are well represented in junior and petty officer positions within the marine section whilst Latin
American seafarers hold more officer posts on the hotel side than on the marine side. Senior officer
posts in the marine department are most commonly held by seafarers from advanced economies
with the majority of ratings and petty officer positions being held by Asian seafarers (see Appendix
3 for details).
0%
20%
40%
60%
80%
100%
Advanced E Europe Asia L A/other
Regional Division
Senior
Junior
Petty
Rating

30
Figure 16 Comparison of Regional Composition by Section and Rank
Gender and Nationality
The SIRC dataset shows that women seafarers aboard cruise ships are employed from fewer
countries (74) than their male counterparts (99). Table 8 contrasts the top ten labour supply
countries by gender. It indicates that three of the five top female labour supply countries are
advanced economies with Britain in a lead position.
Marine Section
0%
20%
40%
60%
80%
100%
Senior Junior Petty Rating
Rank Division
L A/other
Asia
E Europe
Advanced
Hotel Section
0%
20%
40%
60%
80%
100%
Senior Junior Petty Rating
Rank Division
L A/other
Asia
E Europe
Advanced

31
Table 8: Top 10 Nationalities by Gender Division
Female Male Rank Nationality N % of Total Nationality N % of Total
1 United Kingdom 337 14.3 Philippines 3280 32.5
2 Philippines 266 11.3 Honduras 662 6.6
3 Germany 193 8.2 India 641 6.3
4 Italy 177 7.5 Italy 612 6.1
5 Ukraine 147 6.2 Indonesia 494 4.9
6 Russian 98 4.2 United Kingdom 385 3.8
7 United States 87 3.7 Germany 291 2.9
8 Peru 71 3.0 Colombia 277 2.7
9 France 69 2.9 Greece 273 2.7
10 Romania 62 2.6 Ukraine 269 2.7
Sub-total 1507 64.0 Sub-total 7184 71.1
Total of 74 nations 2353 100.0 Total of 99 nations 10101 100.0
At a regional level, Figure 17 illustrates that over half of the cruise sector’s female workforce
comes from advanced economies compared with less than one quarter of the male labour force. It
also indicates that East Europe plays an important role in the supply of females as nearly one
quarter of the female total comes from this region. By contrast, Asia provides only 15 percent of the
female workforce compared with 46 percent of the male.
Figure 17 Gender Comparison of Regional Composition
Female
Advanced51%
E Europe24%
Asia15%
L A/other10%
Male
Advanced24%
E Europe12%
Asia46%
L A/other18%

32
Table 9 shows that nearly one quarter of female seafarers from advanced economies are senior or
junior officers, over half are petty officers, and just over 20 percent are ratings. In sharp contrast, 70
to 80 percent of East European and Asian women work aboard cruise vessels as ratings. It is notable
that nearly 40 percent of female seafarers from Latin America occupy middle ranking jobs (junior
and petty officers), a higher proportion than is found amongst their female colleagues from East
Europe and Asia and also their male counterparts from Latin America.
Table 9 Rank Composition by Gender and Region in All Sections (%, row as 100)
Gender Region Senior Junior Petty Rating Total
Female Advanced 2.2 21.9 54.3 21.5 100
E Europe 1.6 4.7 20.7 73.0 100
Asia 0.6 8.8 8.2 82.5 100
L A/other 0.9 17.6 21.5 60.1 100
Total 1.7 15.4 36.1 46.8 100
Male Advanced 8.8 28.9 37.3 25.0 100
E Europe 3.1 11.8 29.0 56.1 100
Asia 0.4 5.6 16.5 77.6 100
L A/other 0.5 4.6 19.4 75.4 100
Total 2.7 11.7 23.6 61.9 100
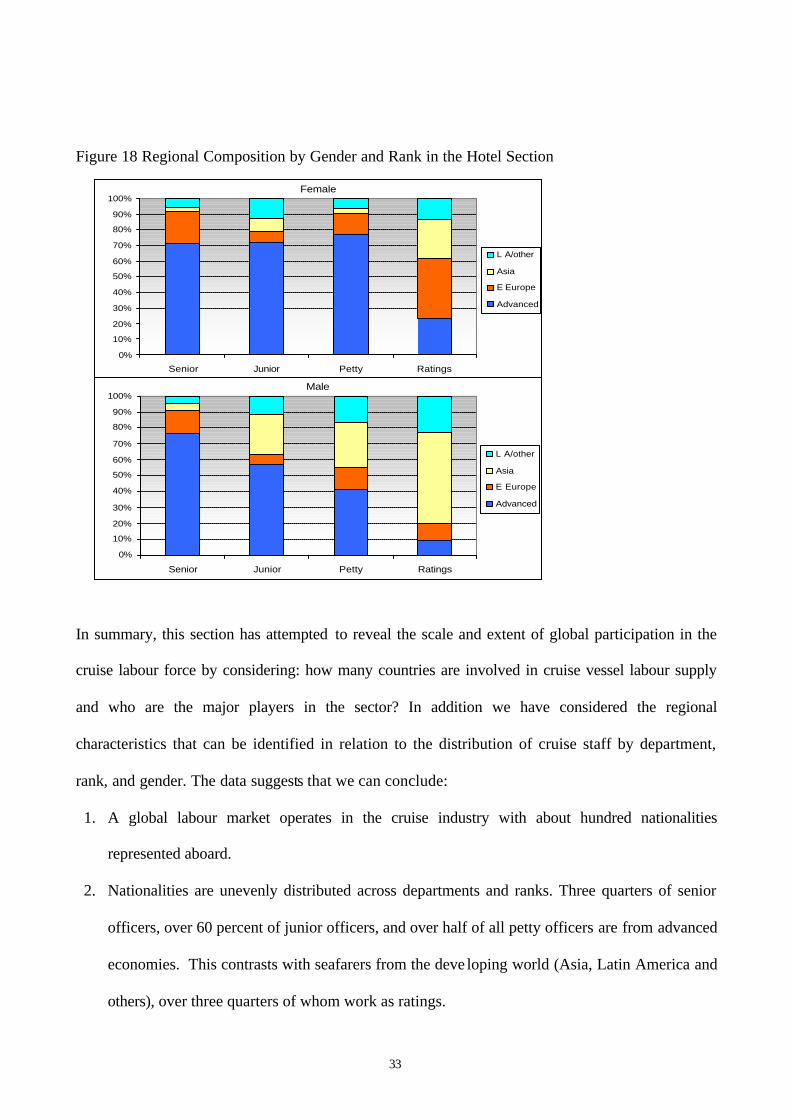
In the hotel section, over 70 percent of female officer positions (senior, junior and petty officers) are
occupied by women from advanced economies (see Figure 18) which is in contrast to their male
counterparts who occupy slightly more senior, but considerably fewer, junior positions (see
Appendix 4 for further details).
33
Figure 18 Regional Composition by Gender and Rank in the Hotel Section
In summary, this section has attempted to reveal the scale and extent of global participation in the
cruise labour force by considering: how many countries are involved in cruise vessel labour supply
and who are the major players in the sector? In addition we have considered the regional
characteristics that can be identified in relation to the distribution of cruise staff by department,
rank, and gender. The data suggests that we can conclude:
1. A global labour market operates in the cruise industry with about hundred nationalities
represented aboard.
2. Nationalities are unevenly distributed across departments and ranks. Three quarters of senior
officers, over 60 percent of junior officers, and over half of all petty officers are from advanced
economies. This contrasts with seafarers from the deve loping world (Asia, Latin America and
others), over three quarters of whom work as ratings.
Female
0%
10%
20%
30%
40%
50%
60%
70%
80%
90%
100%
Senior Junior Petty Ratings
L A/other
Asia
E Europe
Advanced
Male
0%
10%
20%
30%
40%
50%
60%
70%
80%
90%
100%
Senior Junior Petty Ratings
L A/other
Asia
E Europe
Advanced

34
3. The global labour market in the cruise sector operates differently for male and female workers
with significantly fewer countries involved in the supply of female labour (74 as opposed to
99). Data analysis shows that advanced economies and Eastern Europe predominate in the
supply of female labour, accounting for three quarters of the female total.

35
6. Conclusions
This report presents the findings of an analysis of the SIRC (cruise sector) seafarer database for the
year 2000. Whilst we freely acknowledge some limitations in the data collection process,
specifically the method for sampling crew lists, the study nevertheless provides some considerable
insight into patterns of employment in the cruise sector.
The findings indicate that approximately 85% of employees aboard cruise vessels are employed in
the hotel sections of these ships with only 15% of staff serving as seafarers on the marine (deck and
engine) side of vessel operations. Almost 60% of posts across the board are filled by ratings.
However, there is a higher proportion of senior and junior officers as compared with ratings on the
marine side of operations where 36% of seafarers occupy these ranks. On the hotel side of the cruise
sector different departments are characterised by different occupational hierarchies. For example,
the survey found that senior officers are only employed in guest service departments and over three
quarters of the staff in the galley, bar/food, and cabin, departments were ratings.
Seafarers working aboard cruise vessels are relatively young on average, with women tending to be
younger than men. The mean age across the sample was found to be 34, however, as one might
expect, senior officers tended to be older than this on average. Women constituted 19% of the
sample of seafarers although they were unevenly distributed across ranks and departments. Women
employees tended to be concentrated in the concessionaire, cabin, and guest service departments
and they were under-represented in jobs on the marine side of vessels. Women tended to occupy
middle ranking jobs on board but were under represented in higher management positions
suggesting that they are less likely to be promoted than their male counterparts.

36
The cruise sector labour market is also differentiated by nationality. While in the region of one
hundred nationalities were represented in the sample, these were not evenly distributed across ranks
or departments. For example, three quarters of senior officer posts were occupied by seafarers from
countries with advanced economies whilst similar proportions of ratings’ jobs were allocated to
seafarers from developing areas of the world.
The labour market for cruise sector seafarers is, thus, complex and diverse. Further research with
employers is required to reveal the rationale behind the employee distribution that has been
identified here, and it is hoped that there may be opportunities to undertake such research at some
time in the future.

37
Postscript: comments relating to the data collection process
The rapid growth of the world cruise industry has been associated with the development of a global
labour market for cruise sector workers. By extending its expertise from the cargo to the cruise
sector, the Seafarers International Research Centre (SIRC) has initiated a world cruise labour
market survey and this report is one outcome from this on-going project.
The SIRC cruise database is based upon the collection of crew lists from major seaports world-
wide. As an alternative method to a national census or company questionnaire survey, the sample of
crew lists, in theory, provides a means to access reliable, accurate and current information on the
cruise labour market.
While a great effort has been made to produce a reliable and comprehensive cruise labour market
survey, there are limitations to the existing database. For example, the first data sweep was limited
to European ports which calls into question, but does not rule out, representativeness. In addition,
any quantitative analysis of the world cruise labour market inevitably lacks depth and detail and
should thus benefit from consideration alongside more detailed qualitative studies of the cruise
sector.
With respect to the improvement of the SIRC world cruise labour market survey, the following
require further consideration:
§ The possible inclusion of major seaports beyond Europe, esp. North America, Caribbean, East
Asia;
§ The inclusion of onboard observation and qualitative studies.
Any further extension of this survey will bear these points in mind and will build upon the
experience of collecting this initial data chunk.

38
REFERENCES
Baltic and International Maritime Council and International Shipping Federation (BIMCO/ISF, 2000). Manpower Update: the world-wide demand for and supply of seafarers: main report, Institute for Employment Research, University of Warwick. Belcher, P., Sampson, H., Thomas, M., Veiga, J. and M. Zhao. 2003. Women Seafarers: Global Employment Policies and Practices, Geneva: International Labour Organisations. Braun B.M.; Xander J.A. and K.R. White (2002), “The impact of the cruise industry on a region's economy: a case study of Port Canaveral, Florida”, Tourism Economics, vol. 8, no. 3, 281-288; International Monetary Fund (IMF 2003): World Economic Outlook: Public Debt in Emerging Markets, World Economic and Financial Survey Report, September 2003. http://www.imf.org/external/pubs/ft/weo/2003/02/pdf/appendix.pdf Institute of Shipping Economics and Logistics (ISL, 2001). Shipping Statistics Yearbook 2000, Bremen: ISF. Israel, G and Miller, L (1999). Dictionary of the Cruise Industry, Colchester: Seatrade Cruise Academy Publication. Klein, R. A. 2001. “High seas, low pay: working on cruise ships”, Our Times: Canada's Independent Labour Magazine, December 2001/January 2002, online: http://www.cruisejunkie.com. Klein, R. A. 2003. “Cruising-Out of Control: the cruise industry, the environment, workers, and the maritime”, Canada Centre for Policy Alternatives, Halifax, Canada. Online: http://www.cruisejunkie.com/cruise.pdf. Lane, T. 1996. Crewing the World’s Merchant Ships, SIRC report, Cardiff University. Lane T, Obando-Rojas, B., Wu, B. and A., Tasiran, 2002. Crewing the International Merchant Fleet, Redhill: Lloyd’s Register-Fairplay. Springett, P, “Safety Training for Hotel & Entertainment Departments: Time to consolidate, collaborate and modernise?”, Maritime Hotel Conference, 8th-10th May 2001, London: Lloyd’s List Events; Wild P. and J. Dearing (2000). Development of and prospects for cruising in Europe, Maritime Policy & Management, October 2000, 27 (4): 315-333 Wu, B. (2003). “Accession to global labour market: principles and applications of SIRC database in the cruise sector”, WMU Journal of Maritime Affair, 2(1): 17-32. Zhao. M. (2002), “Emotional Labour in a Globalised Labour Market: Seafarers on Cruise Ships”, Paper 27, Working Paper Series, School of Social Sciences, Cardiff University, May. ISBN: 1 872330 68 1.

39
APPENDICES Appendix 1 List of Seafarer Nationalities by Regional Division
Region Nationality Region Nationality Region Nationality Advanced Australia Asia China L A/other South Africa Austria India Syria Belgium Indonesia Trinidad and Tobago Canada Malaysia Tunisia Denmark Burma/ Myanmar Uganda Finland Nepal Tanzania France Pakistan Uruguay Germany Philippines Venezuela Greece Sri Lanka Zimbabwe Hong Kong Thailand Iceland Vietnam Ireland L
A/other Algeria
Israel Angola Italy Argentina Japan Barbados Luxembourg Brazil Netherlands Chile New Zealand Colombia Norway Costa Rica Portugal Cuba Korea, South Cyprus Singapore Dominica Spain Dominican Rep Sweden Ecuador Switzerland Egypt Turkey El Salvador United Kingdom Guatemala United States Guyana E Europe Belarus Haiti Bosnia & Herzegovina Honduras Bulgaria Jamaica Croatia Lebanon Czech Rep Malta Estonia Mauritania Hungary Mauritius Latvia Mexico Lithuania Morocco Poland Nicaragua Romania Nigeria Russian Panama Slovakia Paraguay Slovenia Peru Macedonia Saint Lucia Ukraine Saint Vincent Yugoslavia Seychelles

40
Appendix 2 Comparison of Mean Age by Gender, Department and Rank
Gender Dept Senior Junior Petty Rating Total
Female Marine 42.8 30.9 46.8 36.7 36.0
Guest 37.5 32.5 29.2 29.7 30.5
Cabin -- 28.2 34.5 30.8 30.5
Bar/fd -- 33.3 29.4 29.0 29.2
Galley -- 28.6 33.8 31.4 31.8
Other -- -- 28.7 -- 28.7
Female Total 38.0 31.0 29.4 30.1 30.1
Male Marine 44.9 37.6 41.4 36.8 38.4
Guest 44.8 33.9 38.3 32.4 36.0
Cabin -- 39.1 35.6 32.9 33.8
Bar/fd -- 36.0 35.4 32.2 33.1
Galley -- 36.5 36.2 32.5 33.2
Other -- -- 30.9 -- 30.9
Male Total 44.9 36.6 36.7 33.1 34.7

41
Appendix 3 Top 5 Nationalities by Section and Rank
Marine Hotel Rank Nationality % of the total Nationality % of the total
Senior Italy 17.9 Italy 17.2
Greece 15.9 United Kingdom 12.9
Norway 12.4 Greece 11.7
Germany 11.0 Germany 10.4
United Kingdom 7.6 Ukraine 5.5
Sub total 64.8 Sub total 57.7
Junior Italy 21.1 Italy 14.2
Greece 17.5 Philippines 12.9
Philippines 14.9 Germany 11.4
United Kingdom 10.1 United Kingdom 9.3
Ukraine 6.9 France 4.7
Sub total 70.5 Sub total 52.5
Petty Philippines 47.4 Philippines 16.4
Ukraine 10.1 United Kingdom 14.2
Indonesia 8.1 Italy 11.7
Italy 7.1 United States 5.6
Poland 5.5 Germany 5.5
Sub total 78.2 Sub total 53.4
Ratings Philippines 41.8 Philippines 37.0
Indonesia 12.6 Honduras 7.0
Honduras 11.3 India 6.7
Italy 5.6 Indonesia 5.2
Ukraine 5.3 Colombia 3.5
Sub total 76.5 Sub total 59.4

42
Appendix 4 Profile of Selected Nationalities by Age, Section, Gender and Rank Composition
Section Gender Rank Nation
Item Marine Hotel Female Male Senior Junior Petty Rating
Total
Colombia Age 40.4 36.1 33.1 37.0 47.0 33.7 37.4 36.5 36.5
% 10.5 89.5 12.1 87.9 0.3 4.8 15.6 79.4 100.0
Germany Age 42.5 31.1 28.4 35.0 44.4 34.7 32.1 28.1 32.3
% 11.0 89.0 39.9 60.1 6.8 27.5 33.1 32.5 100.0
Greece Age 43.5 40.6 35.1 42.2 45.8 40.4 44.6 41.0 42.1
% 49.6 50.4 2.5 97.5 15.0 39.6 16.1 29.3 100.0
Honduras Age 39.0 35.3 34.5 36.0 -- 37.2 38.2 35.4 35.9
% 16.7 83.3 2.2 97.8 -- 1.5 19.2 79.3 100.0
India Age 33.6 30.8 29.6 30.8 32.5 30.3 33.1 30.7 30.9
% 2.7 97.3 4.3 95.7 1.2 7.1 8.8 82.9 100.0
Indonesia Age 38.5 31.9 31.5 33.8 -- 39.3 37.3 32.9 33.7
% 26.5 73.5 5.7 94.3 -- 1.5 15.1 83.4 100.0
Italy Age 38.8 36.8 29.5 39.6 46.7 36.4 35.1 41.4 37.4
% 26.5 73.5 22.4 77.6 6.9 31.8 44.8 16.4 100.0
Philip. Age 35.6 33.8 31.7 34.3 41.4 36.7 38.3 32.9 34.1
% 17.0 83.0 7.5 92.5 0.3 5.8 17.4 76.5 100.0
Russian Age 40.7 32.9 31.0 36.7 44.9 39.8 33.7 32.9 34.4
% 19.0 81.0 40.5 59.5 5.0 10.3 20.2 64.5 100.0
Ukraine Age 43.4 34.7 33.9 39.1 46.1 43.1 41.7 34.0 37.2
% 29.3 70.7 35.3 64.7 4.3 10.3 22.8 62.5 100.0
U. K. Age 34.2 31.4 28.7 34.5 43.8 33.8 29.9 32.6 31.7
% 11.5 88.5 46.7 53.3 5.0 22.3 62.5 10.2 100.0
SIRC total Age 38.4 33.0 30.1 34.6 44.0 35.3 34.8 32.6 33.8
% 15.3 84.7 18.9 81.1 2.5 12.4 26.0 59.1 100.0