The Woodlands TX Home Sales Report - October 2016
12
The Home Sales Real Estate Report The Woodlands | October, 2016 Lis?ng Inventory Month By Month Home Sales Month By Month Average Sold Price / Median Sold Price Average Price Per Square Foot Average Days On Market Months Supply of For Sale Inventory 9000 Forest Crossing Drive | The Woodlands TX 77381 | 281-367-3531 281-367-3531
-
Upload
ken-brand -
Category
Real Estate
-
view
82 -
download
0
Transcript of The Woodlands TX Home Sales Report - October 2016

TheHomeSalesRealEstateReportTheWoodlands|October,2016Lis?ngInventoryMonthByMonthHomeSalesMonthByMonthAverageSoldPrice/MedianSoldPriceAveragePricePerSquareFootAverageDaysOnMarketMonthsSupplyofForSaleInventory
9000 Forest Crossing Drive | The Woodlands TX 77381 | 281-367-3531
281-367-3531

The Woodlands Texas Real Estate ReportListing Inventory - All Brokers Combined
Better Homes And Gardens Real Estate Gary Greene - 9000 Forest Crossing, The Woodlands Texas / 281-367-3531Data obtained from the Houston Association of Realtors Multiple Listing Service - Single Family/TheWoodlands TX
2016 Listing Inventory 2015 Listing Inventory
Jan Feb Mar Apr May Jun Jul Aug Sep Oct Nov Dec2016 788 809 855 863 875 900 957 913 901 8782015 591 630 658 731 818 863 912 947 925 917 906 889
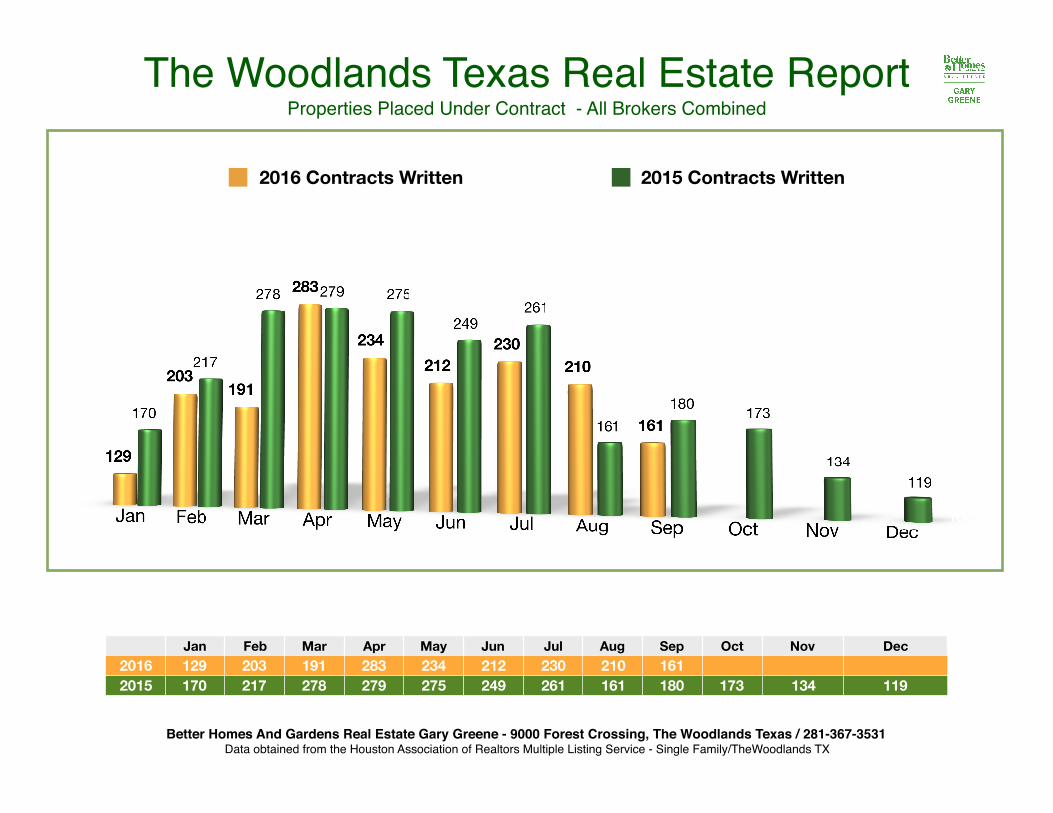
The Woodlands Texas Real Estate ReportProperties Placed Under Contract - All Brokers Combined
Jan Feb Mar Apr May Jun Jul Aug Sep Oct Nov Dec2016 129 203 191 283 234 212 230 210 1612015 170 217 278 279 275 249 261 161 180 173 134 119
Better Homes And Gardens Real Estate Gary Greene - 9000 Forest Crossing, The Woodlands Texas / 281-367-3531Data obtained from the Houston Association of Realtors Multiple Listing Service - Single Family/TheWoodlands TX
2016 Contracts Written 2015 Contracts Written

KEY INFORMATION
2 Years (Monthly) 09/01/14 - 09/30/16
Market Dynamics BHGRE Gary GreeneSold Average vs. Median Price
Monthly % Total % Change
-6.25-0.20
Monthly Change
-931.30Median
Total ChangeAverage -909.15 -21,819.60 -4.69
-22,351.22-0.26
WoodlandsAll
Bathrooms:Single-Family: (Free Standing, Patio Home) Sq Ft:
HAR AllAll AllAllAll Lot Size:Bedrooms:Property Types:
THEWOO
2 Years (Monthly) Construction Type:Price:Period:MLS:
10/06/16BrokerMetrics®Information not guaranteed. © 2006 - 2016 Terradatum and its suppliers and licensors (http://www.terradatum.com/metrics/licensors).
© 2016 - 2017 Houston Association of Realtors Certain information contained herein is derived from information which is the licensed property of, and copyrighted by, Houston Association of Realtors
1 of 2

BHGRE Gary Greene
2 Years (Monthly) 09/01/14 - 09/30/16
Market DynamicsSold Average vs. Median Price
Time Period # Properties Sold Sold Average $ Sold Median $ Sold Avg DOMAverage $ - Median $ Median $ as % of Average $157Sep-16 412,018 81.3335,000 77,018 49232Aug-16 454,232 73.2332,250 121,982 51209Jul-16 435,491 83.8365,000 70,491 45234Jun-16 443,994 81.7362,500 81,494 55226May-16 486,426 74.0360,000 126,426 53148Apr-16 428,549 78.2335,250 93,299 61174Mar-16 414,500 73.7305,275 109,225 63113Feb-16 402,515 70.8285,000 117,515 62104Jan-16 478,814 60.8291,000 187,814 66159Dec-15 505,979 73.1370,000 135,979 55117Nov-15 398,091 74.1295,000 103,091 57163Oct-15 462,944 75.2348,000 114,944 62171Sep-15 442,019 82.3364,000 78,019 43241Aug-15 435,178 75.8330,000 105,178 41241Jul-15 518,493 78.1405,000 113,493 46291Jun-15 554,075 75.7419,500 134,575 43233May-15 478,273 81.5390,000 88,273 44207Apr-15 467,674 71.6335,000 132,674 46210Mar-15 405,888 82.5335,000 70,888 50133Feb-15 437,539 78.8345,000 92,539 64127Jan-15 526,636 68.4360,000 166,636 55214Dec-14 442,647 80.2354,966 87,681 55127Nov-14 510,416 69.5354,500 155,916 46165Oct-14 404,115 84.1340,000 64,115 42187Sep-14 410,118 82.7339,000 71,118 37
© 2016 - 2017 Houston Association of Realtors Certain information contained herein is derived from information which is the licensed property of, and copyrighted by, Houston Association of Realtors
2 10/06/162 ofBrokerMetrics®Information not guaranteed. © 2006 - 2016 Terradatum and its suppliers and licensors (http://www.terradatum.com/metrics/licensors).
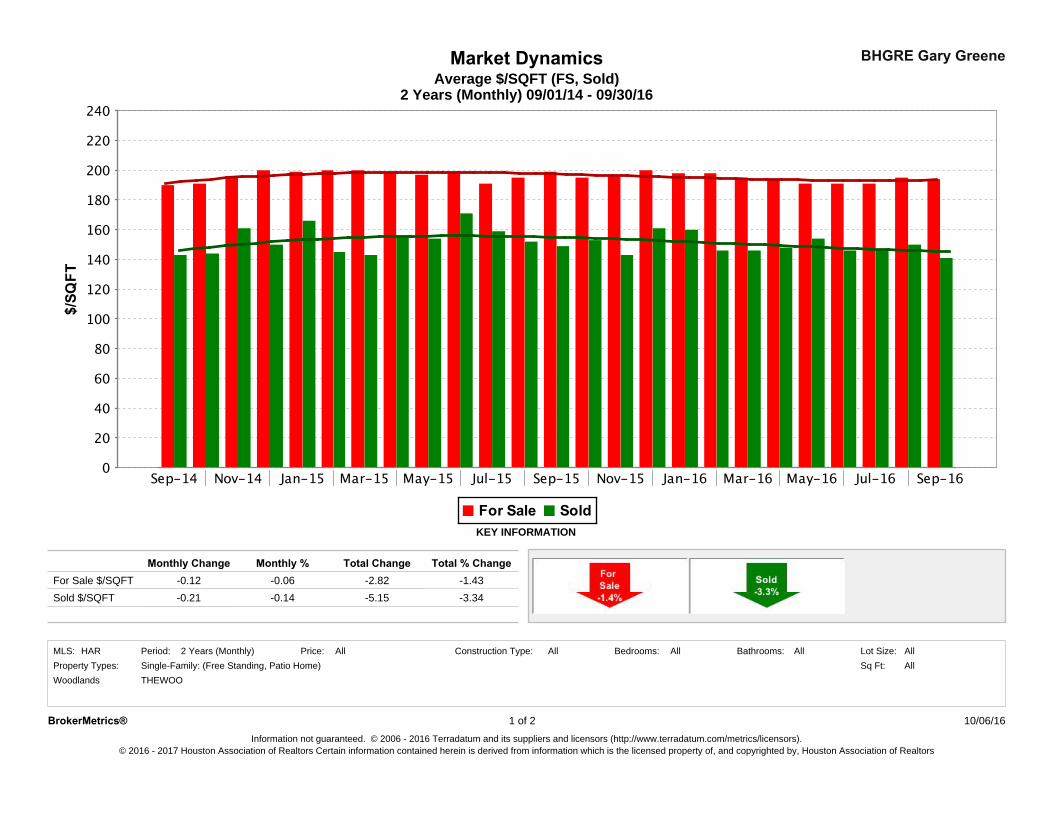
Market DynamicsAverage $/SQFT (FS, Sold)
2 Years (Monthly) 09/01/14 - 09/30/16
BHGRE Gary Greene
Price:
-0.06
AllAll All
-0.14-2.82
Property Types:HAR
Sold $/SQFTFor Sale $/SQFT
MLS: All
-0.21
Bathrooms:
-0.12
All
-3.34-5.15
Construction Type:
Total Change
Sq Ft:
Monthly Change
2 Years (Monthly)
Woodlands
All
-1.43
Lot Size:Period:
Monthly %
Bedrooms:
KEY INFORMATION
Total % Change
Single-Family: (Free Standing, Patio Home)THEWOO
10/06/16BrokerMetrics®Information not guaranteed. © 2006 - 2016 Terradatum and its suppliers and licensors (http://www.terradatum.com/metrics/licensors).
© 2016 - 2017 Houston Association of Realtors Certain information contained herein is derived from information which is the licensed property of, and copyrighted by, Houston Association of Realtors
1 of 2

Average $/SQFT (FS, Sold)2 Years (Monthly) 09/01/14 - 09/30/16
Market Dynamics BHGRE Gary Greene
#
FOR SALE
SQFTPeriod$/Avg
SQFTTime
Avg $
UNDER CONTRACT
# Avg $Avg
SQFT$/
SQFT
SOLD EXPIRED NEW LISTINGS
# # #Avg $ Avg $ Avg $Avg
SQFT$/
SQFTAvg
SQFT$/
SQFTAvg
SQFT$/
SQFT
194Sep-16 1,220 3,588694,233 159 446,998 2,937 152 157 173 276412,018 588,921 519,0672,926 141 3,423 172 3,157 164195Aug-16 1,293 3,586698,328 168 492,809 3,055 161 232 181 344454,232 643,341 557,4123,027 150 3,410 189 3,160 177191Jul-16 1,338 3,601688,713 207 456,345 3,049 150 209 182 369435,491 636,513 541,3812,968 147 3,509 181 3,210 169191Jun-16 1,342 3,621691,395 200 437,526 2,911 150 234 173 394443,994 685,661 601,9413,036 146 3,719 184 3,357 179191May-16 1,309 3,648697,384 203 475,747 3,062 155 226 158 385486,426 795,009 526,1473,159 154 3,901 204 3,255 162194Apr-16 1,324 3,664709,386 258 484,624 3,073 158 148 142 426428,549 731,580 562,1272,899 148 3,783 193 3,284 171195Mar-16 1,200 3,682718,893 178 446,729 2,899 154 174 124 361414,500 672,531 575,5092,847 146 3,624 186 3,355 172198Feb-16 1,143 3,657724,472 176 492,714 2,928 168 113 128 340402,515 675,318 605,3312,753 146 3,576 190 3,409 178198Jan-16 1,095 3,627719,819 124 453,836 2,890 157 104 168 273478,814 652,778 585,1312,984 160 3,526 185 3,303 177200Dec-15 1,097 3,662732,582 109 540,803 3,057 177 159 166 181505,979 700,207 600,2483,141 161 3,701 189 3,176 189196Nov-15 1,152 3,640712,759 128 409,501 2,853 144 117 108 207398,091 682,268 499,6662,775 143 3,571 191 3,127 160195Oct-15 1,281 3,613703,404 157 507,791 3,037 167 163 179 326462,944 579,160 503,5363,020 153 3,379 171 3,140 160199Sep-15 1,308 3,653725,888 166 435,810 2,874 152 171 187 322442,019 749,781 606,9492,967 149 3,726 201 3,362 181195Aug-15 1,300 3,617706,778 148 455,816 2,960 154 241 166 306435,178 586,308 541,3232,869 152 3,421 171 3,152 172191Jul-15 1,360 3,570683,493 235 442,234 2,924 151 241 131 413518,493 553,116 490,1043,252 159 3,290 168 3,093 158199Jun-15 1,313 3,658726,652 222 517,754 3,100 167 291 144 422554,075 777,885 585,7983,248 171 3,732 208 3,302 177197May-15 1,245 3,647717,267 244 493,646 3,055 162 233 110 402478,273 596,918 530,8853,107 154 3,503 170 3,187 167199Apr-15 1,209 3,705735,911 259 544,747 3,232 169 207 107 451467,674 645,274 629,1733,000 156 3,575 180 3,418 184200Mar-15 1,097 3,704739,540 257 554,892 3,157 176 210 82 392405,888 764,747 627,6432,832 143 3,828 200 3,413 184200Feb-15 977 3,669733,486 201 447,442 2,926 153 133 71 299437,539 865,363 564,1133,009 145 3,831 226 3,287 172199Jan-15 934 3,656727,442 154 452,545 3,015 150 127 102 308526,636 605,815 572,2843,167 166 3,415 177 3,295 174200Dec-14 864 3,664731,149 148 527,120 3,135 168 214 90 175442,647 561,460 600,4992,947 150 3,356 167 3,310 181195Nov-14 914 3,620707,451 145 452,211 2,928 154 127 80 217510,416 680,176 542,7643,175 161 3,709 183 3,136 173191Oct-14 968 3,563679,813 182 444,345 2,914 152 165 89 248404,115 543,347 503,1702,815 144 3,275 166 3,097 162190Sep-14 964 3,564677,832 139 453,528 2,891 157 187 105 257410,118 543,968 489,0602,878 143 3,359 162 3,058 160
© 2016 - 2017 Houston Association of Realtors Certain information contained herein is derived from information which is the licensed property of, and copyrighted by, Houston Association of Realtors
2 10/06/162 ofBrokerMetrics®Information not guaranteed. © 2006 - 2016 Terradatum and its suppliers and licensors (http://www.terradatum.com/metrics/licensors).

BHGRE Gary GreeneMarket Dynamics
2 Years (Monthly) 09/01/14 - 09/30/16Average DOM for Under Contract Properties
Monthly %0.42
THEWOO
Total % Change
Sq Ft:Bathrooms:All All
DOM
Construction Type:
Woodlands
Period:Property Types:
10.13 21.13Monthly Change
0.88
Lot Size:All
KEY INFORMATION
Single-Family: (Free Standing, Patio Home) AllHAR AllBedrooms:
Total Change
AllMLS: Price:2 Years (Monthly)
Information not guaranteed. © 2006 - 2016 Terradatum and its suppliers and licensors (http://www.terradatum.com/metrics/licensors).
BrokerMetrics® 1 of 2
© 2016 - 2017 Houston Association of Realtors Certain information contained herein is derived from information which is the licensed property of, and copyrighted by, Houston Association of Realtors
10/06/16
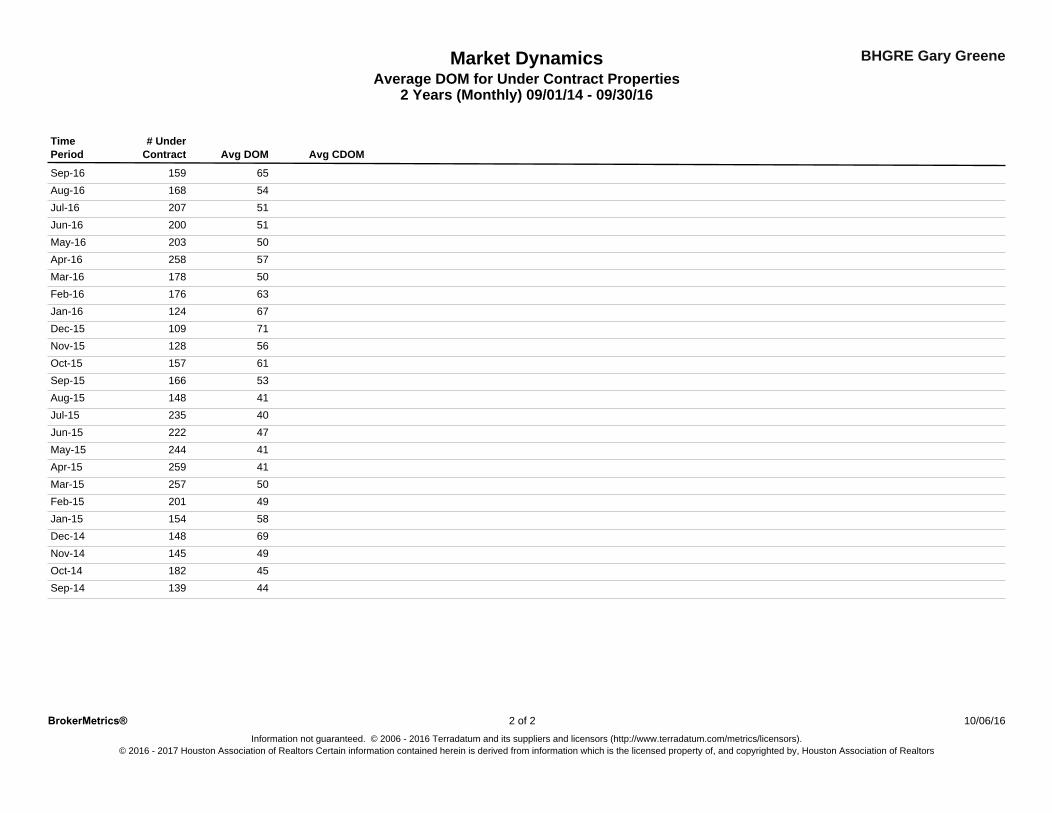
Average DOM for Under Contract PropertiesMarket Dynamics BHGRE Gary Greene
2 Years (Monthly) 09/01/14 - 09/30/16
Period Avg DOM Avg CDOMContract# UnderTime
65Sep-16 15954Aug-16 16851Jul-16 20751Jun-16 20050May-16 20357Apr-16 25850Mar-16 17863Feb-16 17667Jan-16 12471Dec-15 10956Nov-15 12861Oct-15 15753Sep-15 16641Aug-15 14840Jul-15 23547Jun-15 22241May-15 24441Apr-15 25950Mar-15 25749Feb-15 20158Jan-15 15469Dec-14 14849Nov-14 14545Oct-14 18244Sep-14 139
2
© 2016 - 2017 Houston Association of Realtors Certain information contained herein is derived from information which is the licensed property of, and copyrighted by, Houston Association of Realtors
10/06/16Information not guaranteed. © 2006 - 2016 Terradatum and its suppliers and licensors (http://www.terradatum.com/metrics/licensors).
BrokerMetrics® 2 of
l Page 1 9000 Forest Crossing, The Woodlands, Texas 77381 Office: 281.367.3531 or 800.932.7253 9000 Forest Crossing, The Woodlands, Texas 77381 Office: 281.367.3531 or 800.932.7253
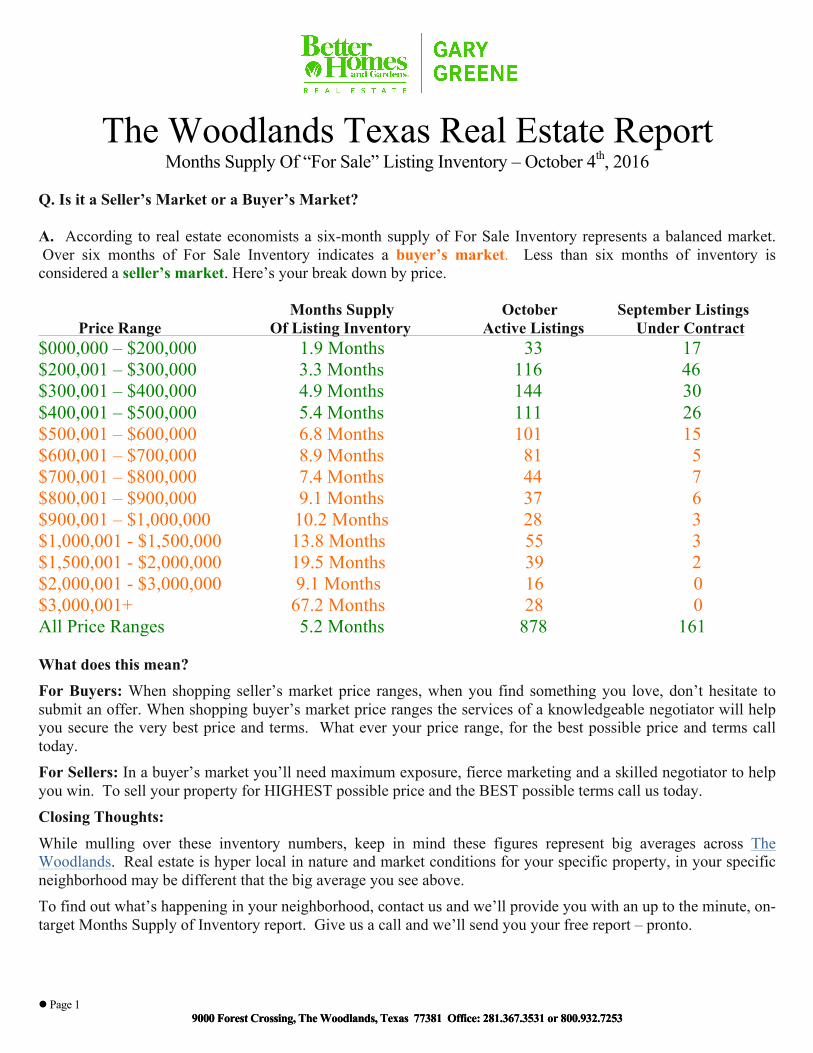
The Woodlands Texas Real Estate Report
Months Supply Of “For Sale” Listing Inventory – October 4th, 2016 Q. Is it a Seller’s Market or a Buyer’s Market? A. According to real estate economists a six-month supply of For Sale Inventory represents a balanced market. Over six months of For Sale Inventory indicates a buyer’s market. Less than six months of inventory is considered a seller’s market. Here’s your break down by price. Months Supply October September Listings Price Range Of Listing Inventory Active Listings Under Contract $000,000 – $200,000 1.9 Months 33 17 $200,001 – $300,000 3.3 Months 116 46 $300,001 – $400,000 4.9 Months 144 30 $400,001 – $500,000 5.4 Months 111 26 $500,001 – $600,000 6.8 Months 101 15 $600,001 – $700,000 8.9 Months 81 5 $700,001 – $800,000 7.4 Months 44 7 $800,001 – $900,000 9.1 Months 37 6 $900,001 – $1,000,000 10.2 Months 28 3 $1,000,001 - $1,500,000 13.8 Months 55 3 $1,500,001 - $2,000,000 19.5 Months 39 2 $2,000,001 - $3,000,000 9.1 Months 16 0 $3,000,001+ 67.2 Months 28 0 All Price Ranges 5.2 Months 878 161 What does this mean? For Buyers: When shopping seller’s market price ranges, when you find something you love, don’t hesitate to submit an offer. When shopping buyer’s market price ranges the services of a knowledgeable negotiator will help you secure the very best price and terms. What ever your price range, for the best possible price and terms call today. For Sellers: In a buyer’s market you’ll need maximum exposure, fierce marketing and a skilled negotiator to help you win. To sell your property for HIGHEST possible price and the BEST possible terms call us today. Closing Thoughts:
While mulling over these inventory numbers, keep in mind these figures represent big averages across The Woodlands. Real estate is hyper local in nature and market conditions for your specific property, in your specific neighborhood may be different that the big average you see above. To find out what’s happening in your neighborhood, contact us and we’ll provide you with an up to the minute, on-target Months Supply of Inventory report. Give us a call and we’ll send you your free report – pronto.
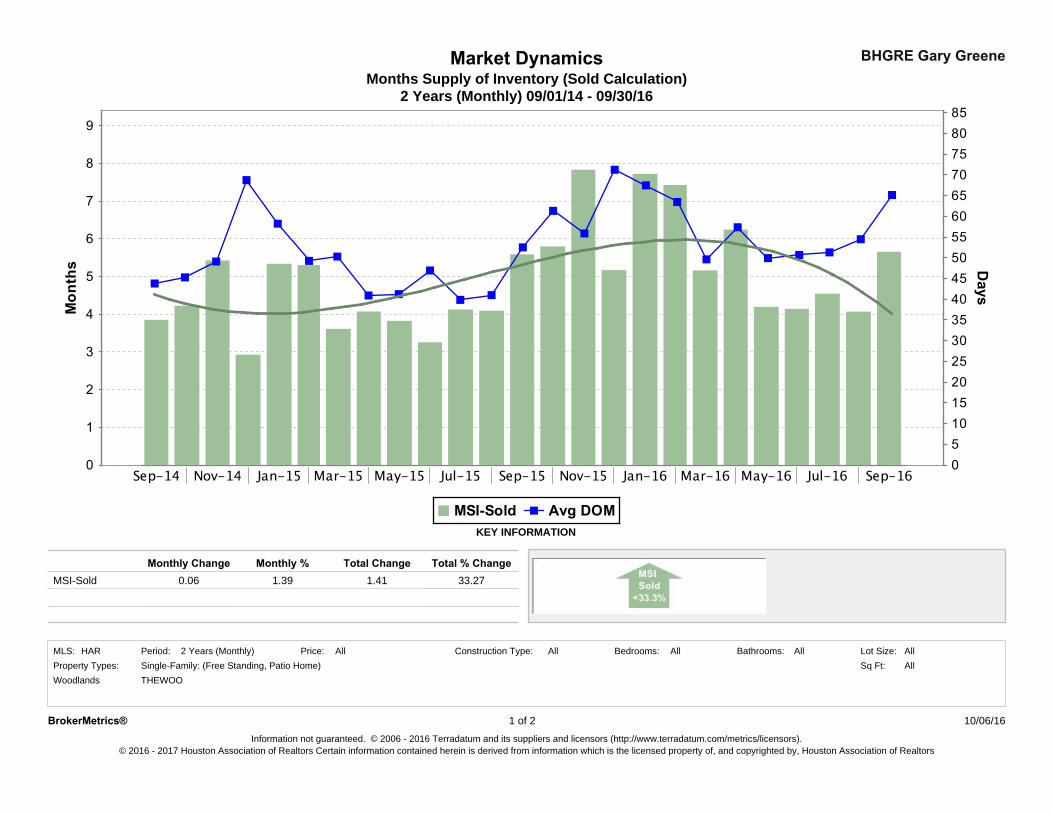
Months Supply of Inventory (Sold Calculation)Market Dynamics
2 Years (Monthly) 09/01/14 - 09/30/16
BHGRE Gary Greene
Woodlands
33.27
Price:HAR Bedrooms:Period:
Monthly %MSI-Sold
2 Years (Monthly)
THEWOO
1.39
Single-Family: (Free Standing, Patio Home)
Total % Change
Property Types:
KEY INFORMATION
AllAll Lot Size:All
1.41Monthly Change
0.06Total Change
Sq Ft:AllAll Bathrooms:MLS: AllConstruction Type:
Information not guaranteed. © 2006 - 2016 Terradatum and its suppliers and licensors (http://www.terradatum.com/metrics/licensors).
BrokerMetrics® 1 of 2
© 2016 - 2017 Houston Association of Realtors Certain information contained herein is derived from information which is the licensed property of, and copyrighted by, Houston Association of Realtors
10/06/16
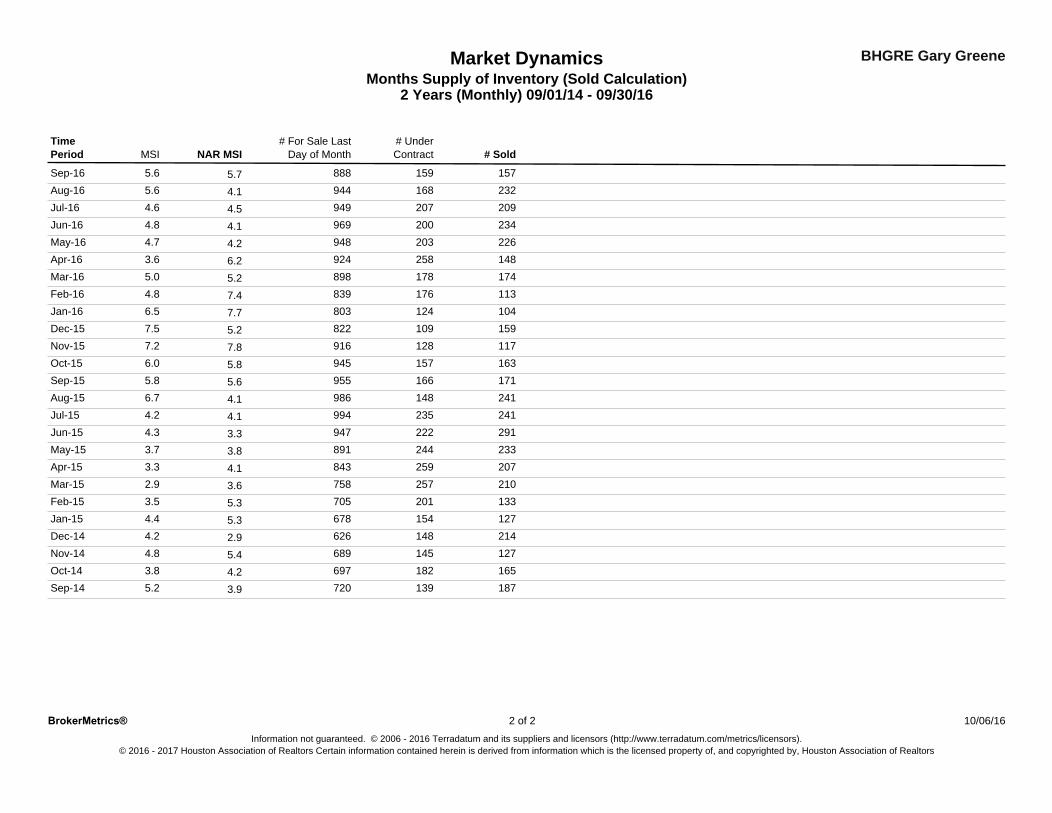
BHGRE Gary GreeneMarket DynamicsMonths Supply of Inventory (Sold Calculation)
2 Years (Monthly) 09/01/14 - 09/30/16
Period NAR MSI # SoldMSI# For Sale Last
Day of Month# UnderContract
Time
5.7Sep-16 159 1578885.6
4.1Aug-16 168 2329445.6
4.5Jul-16 207 2099494.6
4.1Jun-16 200 2349694.8
4.2May-16 203 2269484.7
6.2Apr-16 258 1489243.6
5.2Mar-16 178 1748985.0
7.4Feb-16 176 1138394.8
7.7Jan-16 124 1048036.5
5.2Dec-15 109 1598227.5
7.8Nov-15 128 1179167.2
5.8Oct-15 157 1639456.0
5.6Sep-15 166 1719555.8
4.1Aug-15 148 2419866.7
4.1Jul-15 235 2419944.2
3.3Jun-15 222 2919474.3
3.8May-15 244 2338913.7
4.1Apr-15 259 2078433.3
3.6Mar-15 257 2107582.9
5.3Feb-15 201 1337053.5
5.3Jan-15 154 1276784.4
2.9Dec-14 148 2146264.2
5.4Nov-14 145 1276894.8
4.2Oct-14 182 1656973.8
3.9Sep-14 139 1877205.2
2
© 2016 - 2017 Houston Association of Realtors Certain information contained herein is derived from information which is the licensed property of, and copyrighted by, Houston Association of Realtors
10/06/16Information not guaranteed. © 2006 - 2016 Terradatum and its suppliers and licensors (http://www.terradatum.com/metrics/licensors).
BrokerMetrics® 2 of