The Wind Observation on the Pacific Ocean for Offshore ...
8
The Wind Observation on the Pacific Ocean for Offshore Wind Farm Manabu TSUCHIYA *, Takeshi ISHIHARA **, Yukinari FUKUMOTO *** * Environmental Engineering Division, Kajima Corporation 3-7-1-29F, Nishi-shinjuku Shinjuku TOKYO 163-1029, JAPAN Phone: +81-3-5321-7321, Fax: +81-3-5321-7321, E-mail: [email protected] ** Institute of Engineering Innovation, School of Engineering, The University of Tokyo 2-11-6 Yayoi Bunkyo TOKYO 113-8656, JAPAN Phone: +81-3-5841-1145, Fax: +81-3-5841-1147, E-mail: [email protected] *** Engineering R&D Division, Tokyo Electric Power Company 4-1, Egasaki Tsurumi YOKOHAMA 230-8510, JAPAN Phone: +81-45-613-5505, Fax: +81-45-613-7999, E-mail: [email protected] Summary For the investigation on the possibility of wind farm in the Pacific Ocean near Japan, wind speed and direction were observed using a platform for natural gas mining, 37 km far from a coastline. The platform is located on the east sea of the Tohoku district, northeast part of Japan. There is no island around the platform. The platform has a trussed tower, and a windmill-type anemometer was installed at the top of the tower. The sensor height is 94 m above the sea level. The anemometer was non-spark type for the gas-mining site. The observation was started in September 2004, and it will be continued for three years. We recorded wind speed and wind direction averaged over ten minutes, maximum and turbulence of wind speed. The characteristics of observed wind are good for wind turbines. The annual wind speed average is 7.5 m/s, the turbulence intensity is 8 %. 1. Introduction Offshore wind farms, which are currently being developed in Europe, are expected to be introduced in Japan. Consequently, many attempts have been made to estimate the offshore wind energy available around Japan. Ishihara estimated that the offshore wind energy available along the coastline of the Kanto area near Tokyo is 280 billion kWh/year. [1] However, all the estimates made thus far are based on numerical simulations that have not been validated by field measurements. The full-scale development of offshore wind farms requires an investigation of the offshore wind conditions through measurement and validation of numerical simulations. For this reason, the authors conducted offshore wind observations at a sufficient height at an offshore natural gas platform located 37 km off the coast, in the Pacific Ocean.
Transcript of The Wind Observation on the Pacific Ocean for Offshore ...
The Wind Observation on the Pacific Ocean for Offshore Wind Farm
Manabu TSUCHIYA *, Takeshi ISHIHARA **, Yukinari FUKUMOTO ***
* Environmental Engineering Division, Kajima Corporation 3-7-1-29F, Nishi-shinjuku Shinjuku TOKYO 163-1029, JAPAN Phone: +81-3-5321-7321, Fax: +81-3-5321-7321, E-mail: [email protected]
** Institute of Engineering Innovation, School of Engineering, The University of Tokyo 2-11-6 Yayoi Bunkyo TOKYO 113-8656, JAPAN Phone: +81-3-5841-1145, Fax: +81-3-5841-1147, E-mail: [email protected]
*** Engineering R&D Division, Tokyo Electric Power Company 4-1, Egasaki Tsurumi YOKOHAMA 230-8510, JAPAN Phone: +81-45-613-5505, Fax: +81-45-613-7999, E-mail: [email protected]
Summary
For the investigation on the possibility of wind farm in the Pacific Ocean near Japan, wind speed and direction
were observed using a platform for natural gas mining, 37 km far from a coastline. The platform is located on the
east sea of the Tohoku district, northeast part of Japan. There is no island around the platform.
The platform has a trussed tower, and a windmill-type anemometer was installed at the top of the tower. The
sensor height is 94 m above the sea level. The anemometer was non-spark type for the gas-mining site. The
observation was started in September 2004, and it will be continued for three years. We recorded wind speed and
wind direction averaged over ten minutes, maximum and turbulence of wind speed.
The characteristics of observed wind are good for wind turbines. The annual wind speed average is 7.5 m/s, the
turbulence intensity is 8 %.
1. Introduction
Offshore wind farms, which are currently being developed in Europe, are expected to be introduced in Japan.
Consequently, many attempts have been made to estimate the offshore wind energy available around Japan. Ishihara
estimated that the offshore wind energy available along the coastline of the Kanto area near Tokyo is 280 billion
kWh/year. [1]
However, all the estimates made thus far are based on numerical simulations that have not been validated by field
measurements. The full-scale development of offshore wind farms requires an investigation of the offshore wind
conditions through measurement and validation of numerical simulations. For this reason, the authors conducted
offshore wind observations at a sufficient height at an offshore natural gas platform located 37 km off the coast, in the
Pacific Ocean.

2. Outline of the wind observations
Fig. 1 shows the locations where the wind observations were carried out. The observations were carried out at
two locations — one offshore and the other onshore.
The offshore observations were made at a platform for natural gas mining, 37 km off the coast. Photo 1 shows
the platform. A windmill-type anemometer was installed on the top of the drilling tower at a height of 94 m above
sea level. (Fig. 2) In general, drilling facilities for natural gas specify that only explosion-proof electrical equipment
be used; therefore, the anemometer used was of the type that detects the number of revolutions of the propeller and
the wind direction with optical signals through an optic fiber, instead of with electrical signals. The observations
began in September 2004 and are currently in progress.
For comparison purposes, a three-cup anemometer and a wind vane were installed on the top of a 24-m-high pole
for the onshore wind observations. (Photo 2)
Offshore Observation Site(Natural Gas Platform)
N37° 17’ 49”, E141° 27’ 47”
JAPANJAPAN
Tokyo
Pacific Ocean
Sea of Japan
Onshore Observation Site(Thermal Power Plant)
N37° 13’ 53”, E141° 0’ 35”
37km
Pacific Ocean
Fig. 1 Locations of offshore and onshore observation site.
Photo 1 The natural gas platform.
528
Lightning Rod Explosion-Proof TypeAnemometer
94 m heightabove sea level
1m 2m0
Fig. 2 Anemometer installed on the top beam of the trussed tower.

AAnneemmoommeetteerr aanndd wwiinndd vvaannee
Photo 2 On shore observation site in Hirono thermal power plant.
3. Results of the wind observations
The characteristics of the annual wind, which observed from October 2004 to September 2005, are presented
below.
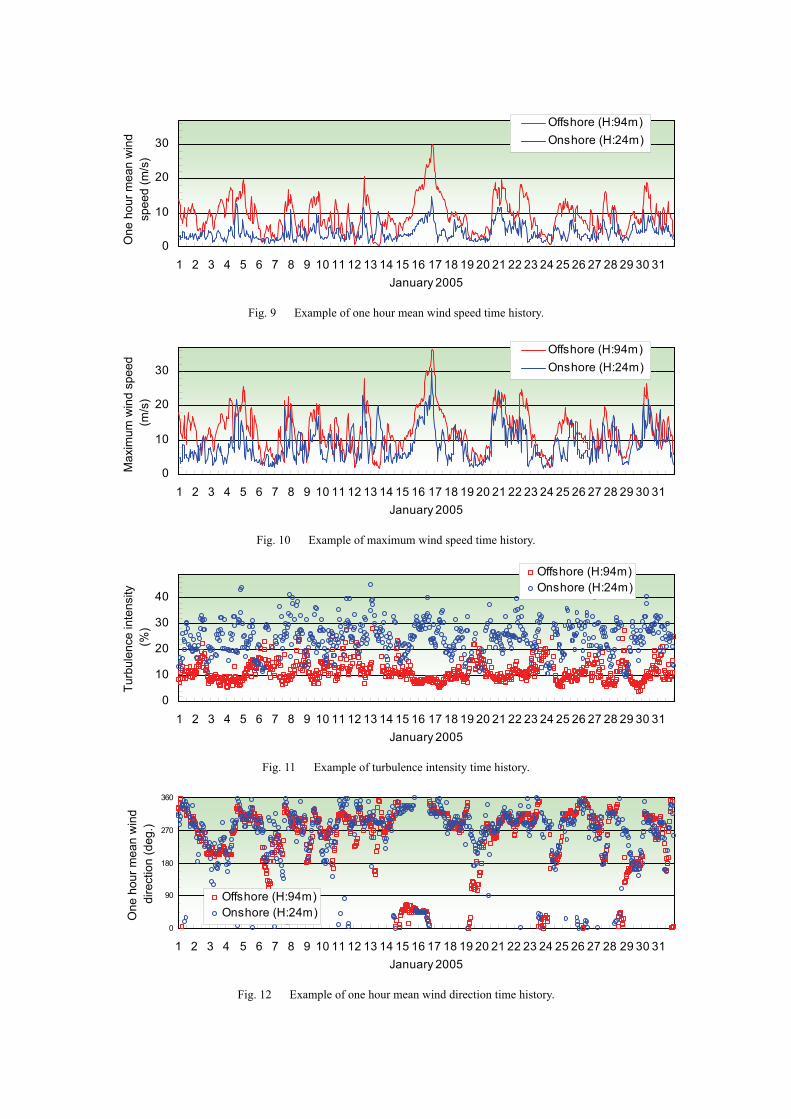
3.1 Average wind speed
Fig. 9 shows the changes in the time-averaged wind speed on monthly basis, respectively.
Fig. 3 shows the changes in the average monthly wind speed. The average annual offshore wind speed is 7.5 m/s,
and the average annual onshore wind speed is 3.5 m/s.
The changes in the average monthly wind speed tends to be higher in winter and lower in summer. In particular,
during the period of January to May, the average monthly offshore wind speed is high, exceeding 8 m/s. The
highest average monthly onshore wind speed — 9.1 m/s — is observed in January. In June and July, the average
monthly offshore wind speed falls below 6 m/s, the lowest being 5.7 m/s in July.
0
2
4
6
8
10
Jan Feb Mar Apr May Jun Jul Aug Sep Oct Nov Dec Annual
Mea
n W
ind
Vel
ocity
(m/s
)
Offshore (H:94m)Onshore (H:24m)
Fig. 3 Average annual and monthly wind speeds.
The average annual and monthly wind speeds shown in Fig. 4 were calibrated for a height of 80 m above sea level
(and above the ground) to allow an easy comparison between the offshore and onshore measurements. The
following formula was used for the height calibration.

1.0
9480 9480
⎟⎠⎞
⎜⎝⎛=
mmVV moffshoreHmOffshoreH
, 2.0
2480 2480
⎟⎠⎞
⎜⎝⎛=
mmVV monshoreHmOnshoreH
Equation 1
The average annual offshore wind speed at a height of 80 m is 7.4 m/s, and the average annual onshore wind speed
is 4.4 m/s. The average annual offshore wind speed is 70 % higher than the onshore wind speed.
0
2
4
6
8
10
Jan Feb Mar Apr May Jun Jul Aug Sep Oct Nov Dec Annual
Mea
n W
ind
Vel
ocity
(m/s
)
Offshore (Calibrated for H80m)Onshore (Calibrated for H80m)
Fig. 4 Average annual and monthly wind speeds calibrated for a height of 80 m above sea and ground level.
3.2 Turbulence intensity
The average annual offshore turbulence intensity is 8 %, indicating that the offshore wind has a low turbulence.
The average annual onshore turbulence intensity is 24 %. However, this value was obtained at a ground height of 24
m and is therefore considered to be significantly affected by the surrounding buildings, trees, and topography.
Fig. 5 shows the turbulence intensity for each wind direction. Fig. 11 shows the changes in the time-averaged
turbulence intensity on monthly basis, respectively.
0153045
NNNE
NE
ENE
E
ESE
SESSE
SSSW
SW
WSW
W
WNW
NWNNW
Offshore(H:94m)
Onshore(H:24m)
Fig. 5 Turbulence intensity for each wind direction. (%)
3.3 Wind speed occurrence frequency
Fig. 6 compares the wind speed occurrence frequency between the offshore and onshore observations. The two
observations reveal clear differences. The offshore observations show a smoother occurrence distribution and a
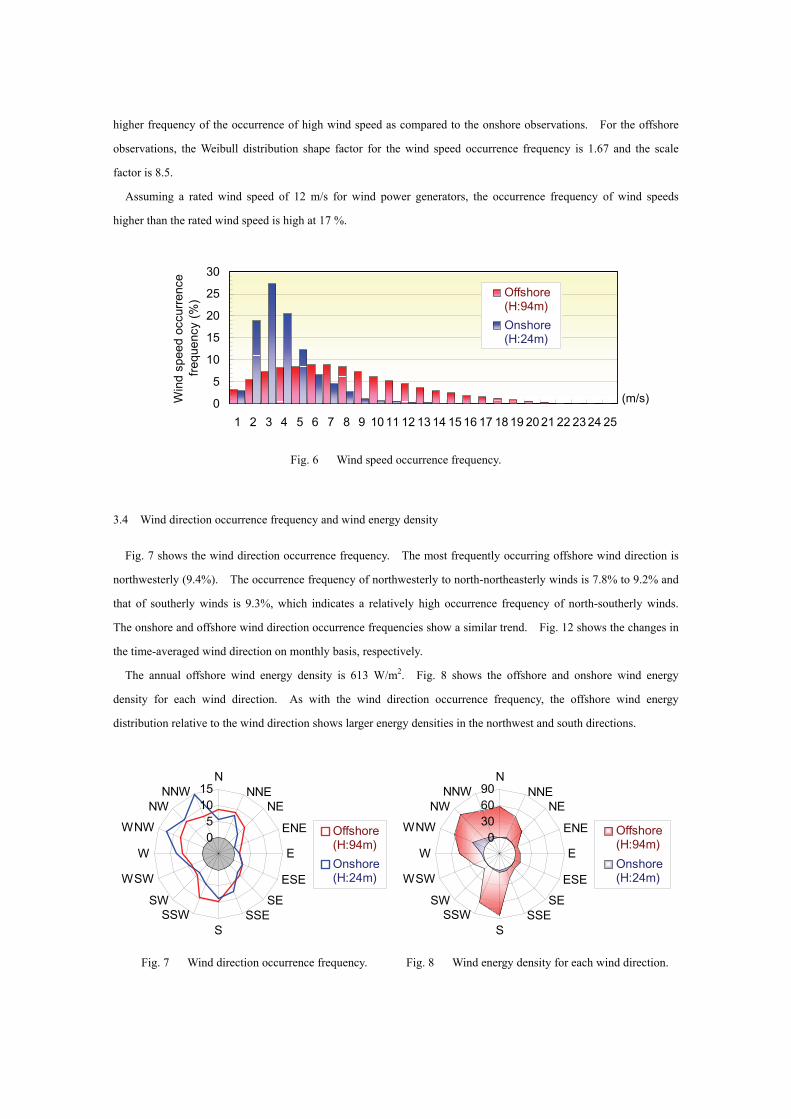
higher frequency of the occurrence of high wind speed as compared to the onshore observations. For the offshore
observations, the Weibull distribution shape factor for the wind speed occurrence frequency is 1.67 and the scale
factor is 8.5.
Assuming a rated wind speed of 12 m/s for wind power generators, the occurrence frequency of wind speeds
higher than the rated wind speed is high at 17 %.
0
5
10
15
20
25
30
1 2 3 4 5 6 7 8 9 10 11 12 13 14 15 16 17 18 19 20 21 22 23 24 25
Win
d sp
eed
occu
rrenc
efre
quen
cy (%
) Offshore(H:94m)Onshore(H:24m)
(m/s)
Fig. 6 Wind speed occurrence frequency.
3.4 Wind direction occurrence frequency and wind energy density
Fig. 7 shows the wind direction occurrence frequency. The most frequently occurring offshore wind direction is
northwesterly (9.4%). The occurrence frequency of northwesterly to north-northeasterly winds is 7.8% to 9.2% and
that of southerly winds is 9.3%, which indicates a relatively high occurrence frequency of north-southerly winds.
The onshore and offshore wind direction occurrence frequencies show a similar trend. Fig. 12 shows the changes in
the time-averaged wind direction on monthly basis, respectively.
The annual offshore wind energy density is 613 W/m2. Fig. 8 shows the offshore and onshore wind energy
density for each wind direction. As with the wind direction occurrence frequency, the offshore wind energy
distribution relative to the wind direction shows larger energy densities in the northwest and south directions.
05
1015
NNNE
NE
ENE
E
ESE
SESSE
SSSW
SW
WSW
W
WNW
NWNNW
Offshore(H:94m)Onshore(H:24m)
Fig. 7 Wind direction occurrence frequency.
0306090
NNNE
NE
ENE
E
ESE
SESSE
SSSW
SW
WSW
W
WNW
NWNNW
Offshore(H:94m)Onshore(H:24m)
Fig. 8 Wind energy density for each wind direction.
0
10
20
30
1 2 3 4 5 6 7 8 9 10 11 12 13 14 15 16 17 18 19 20 21 22 23 24 25 26 27 28 29 30 31January 2005
One
hou
r mea
n w
ind
spee
d (m
/s)
Offshore (H:94m)Onshore (H:24m)
Fig. 9 Example of one hour mean wind speed time history.
0
10
20
30
1 2 3 4 5 6 7 8 9 10 11 12 13 14 15 16 17 18 19 20 21 22 23 24 25 26 27 28 29 30 31January 2005
Max
imum
win
d sp
eed
(m/s
)
Offshore (H:94m)Onshore (H:24m)
Fig. 10 Example of maximum wind speed time history.
0
10
20
30
40
1 2 3 4 5 6 7 8 9 10 11 12 13 14 15 16 17 18 19 20 21 22 23 24 25 26 27 28 29 30 31January 2005
Turb
ulen
ce in
tens
ity(%
)
Offshore (H:94m)Onshore (H:24m)
Fig. 11 Example of turbulence intensity time history.
0
90
180
270
360
1 2 3 4 5 6 7 8 9 10 11 12 13 14 15 16 17 18 19 20 21 22 23 24 25 26 27 28 29 30 31January 2005
One
hou
r mea
n w
ind
dire
ctio
n (d
eg.)
Offshore (H:94m)Onshore (H:24m)
Fig. 12 Example of one hour mean wind direction time history.
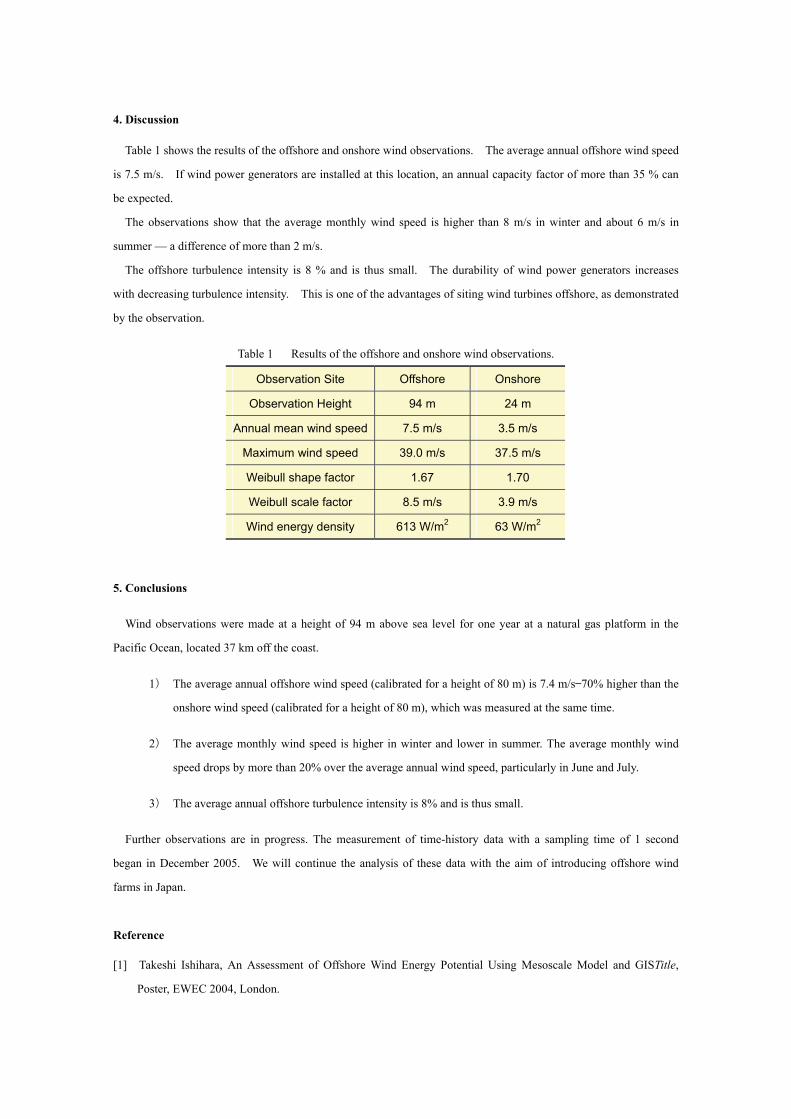
4. Discussion
Table 1 shows the results of the offshore and onshore wind observations. The average annual offshore wind speed
is 7.5 m/s. If wind power generators are installed at this location, an annual capacity factor of more than 35 % can
be expected.
The observations show that the average monthly wind speed is higher than 8 m/s in winter and about 6 m/s in
summer — a difference of more than 2 m/s.
The offshore turbulence intensity is 8 % and is thus small. The durability of wind power generators increases
with decreasing turbulence intensity. This is one of the advantages of siting wind turbines offshore, as demonstrated
by the observation.
Table 1 Results of the offshore and onshore wind observations.
Observation Site Offshore Onshore
Observation Height 94 m 24 m
Annual mean wind speed 7.5 m/s 3.5 m/s
Maximum wind speed 39.0 m/s 37.5 m/s
Weibull shape factor 1.67 1.70
Weibull scale factor 8.5 m/s 3.9 m/s
Wind energy density 613 W/m2 63 W/m2
5. Conclusions
Wind observations were made at a height of 94 m above sea level for one year at a natural gas platform in the
Pacific Ocean, located 37 km off the coast.
1) The average annual offshore wind speed (calibrated for a height of 80 m) is 7.4 m/s—70% higher than the
onshore wind speed (calibrated for a height of 80 m), which was measured at the same time.
2) The average monthly wind speed is higher in winter and lower in summer. The average monthly wind
speed drops by more than 20% over the average annual wind speed, particularly in June and July.
3) The average annual offshore turbulence intensity is 8% and is thus small.
Further observations are in progress. The measurement of time-history data with a sampling time of 1 second
began in December 2005. We will continue the analysis of these data with the aim of introducing offshore wind
farms in Japan.
Reference
[1] Takeshi Ishihara, An Assessment of Offshore Wind Energy Potential Using Mesoscale Model and GISTitle,
Poster, EWEC 2004, London.
The Wind Observation on the Pacific OceanThe Wind Observation on the Pacific Oceanfor Offshore Wind Farmfor Offshore Wind Farm
Manabu TSUCHIYA * [email protected]
Takeshi ISHIHARA ** [email protected]
Yukinari FUKUMOTO *** [email protected]
* Environmental Engineering Division, Kajima Corporation, 3-7-1-29F, Nishi-shinjuku Shinjuku TOKYO 163-1029 JAPAN
** Institute of Engineering Innovation, School of Engineering, The University of Tokyo, 2-11-6 Yayoi Bunkyo TOKYO 113-8656 JAPAN
*** Engineering R&D Division, Tokyo Electric Power Company, 4-1, Egasaki Tsurumi YOKOHAMA 230-8510 JAPAN
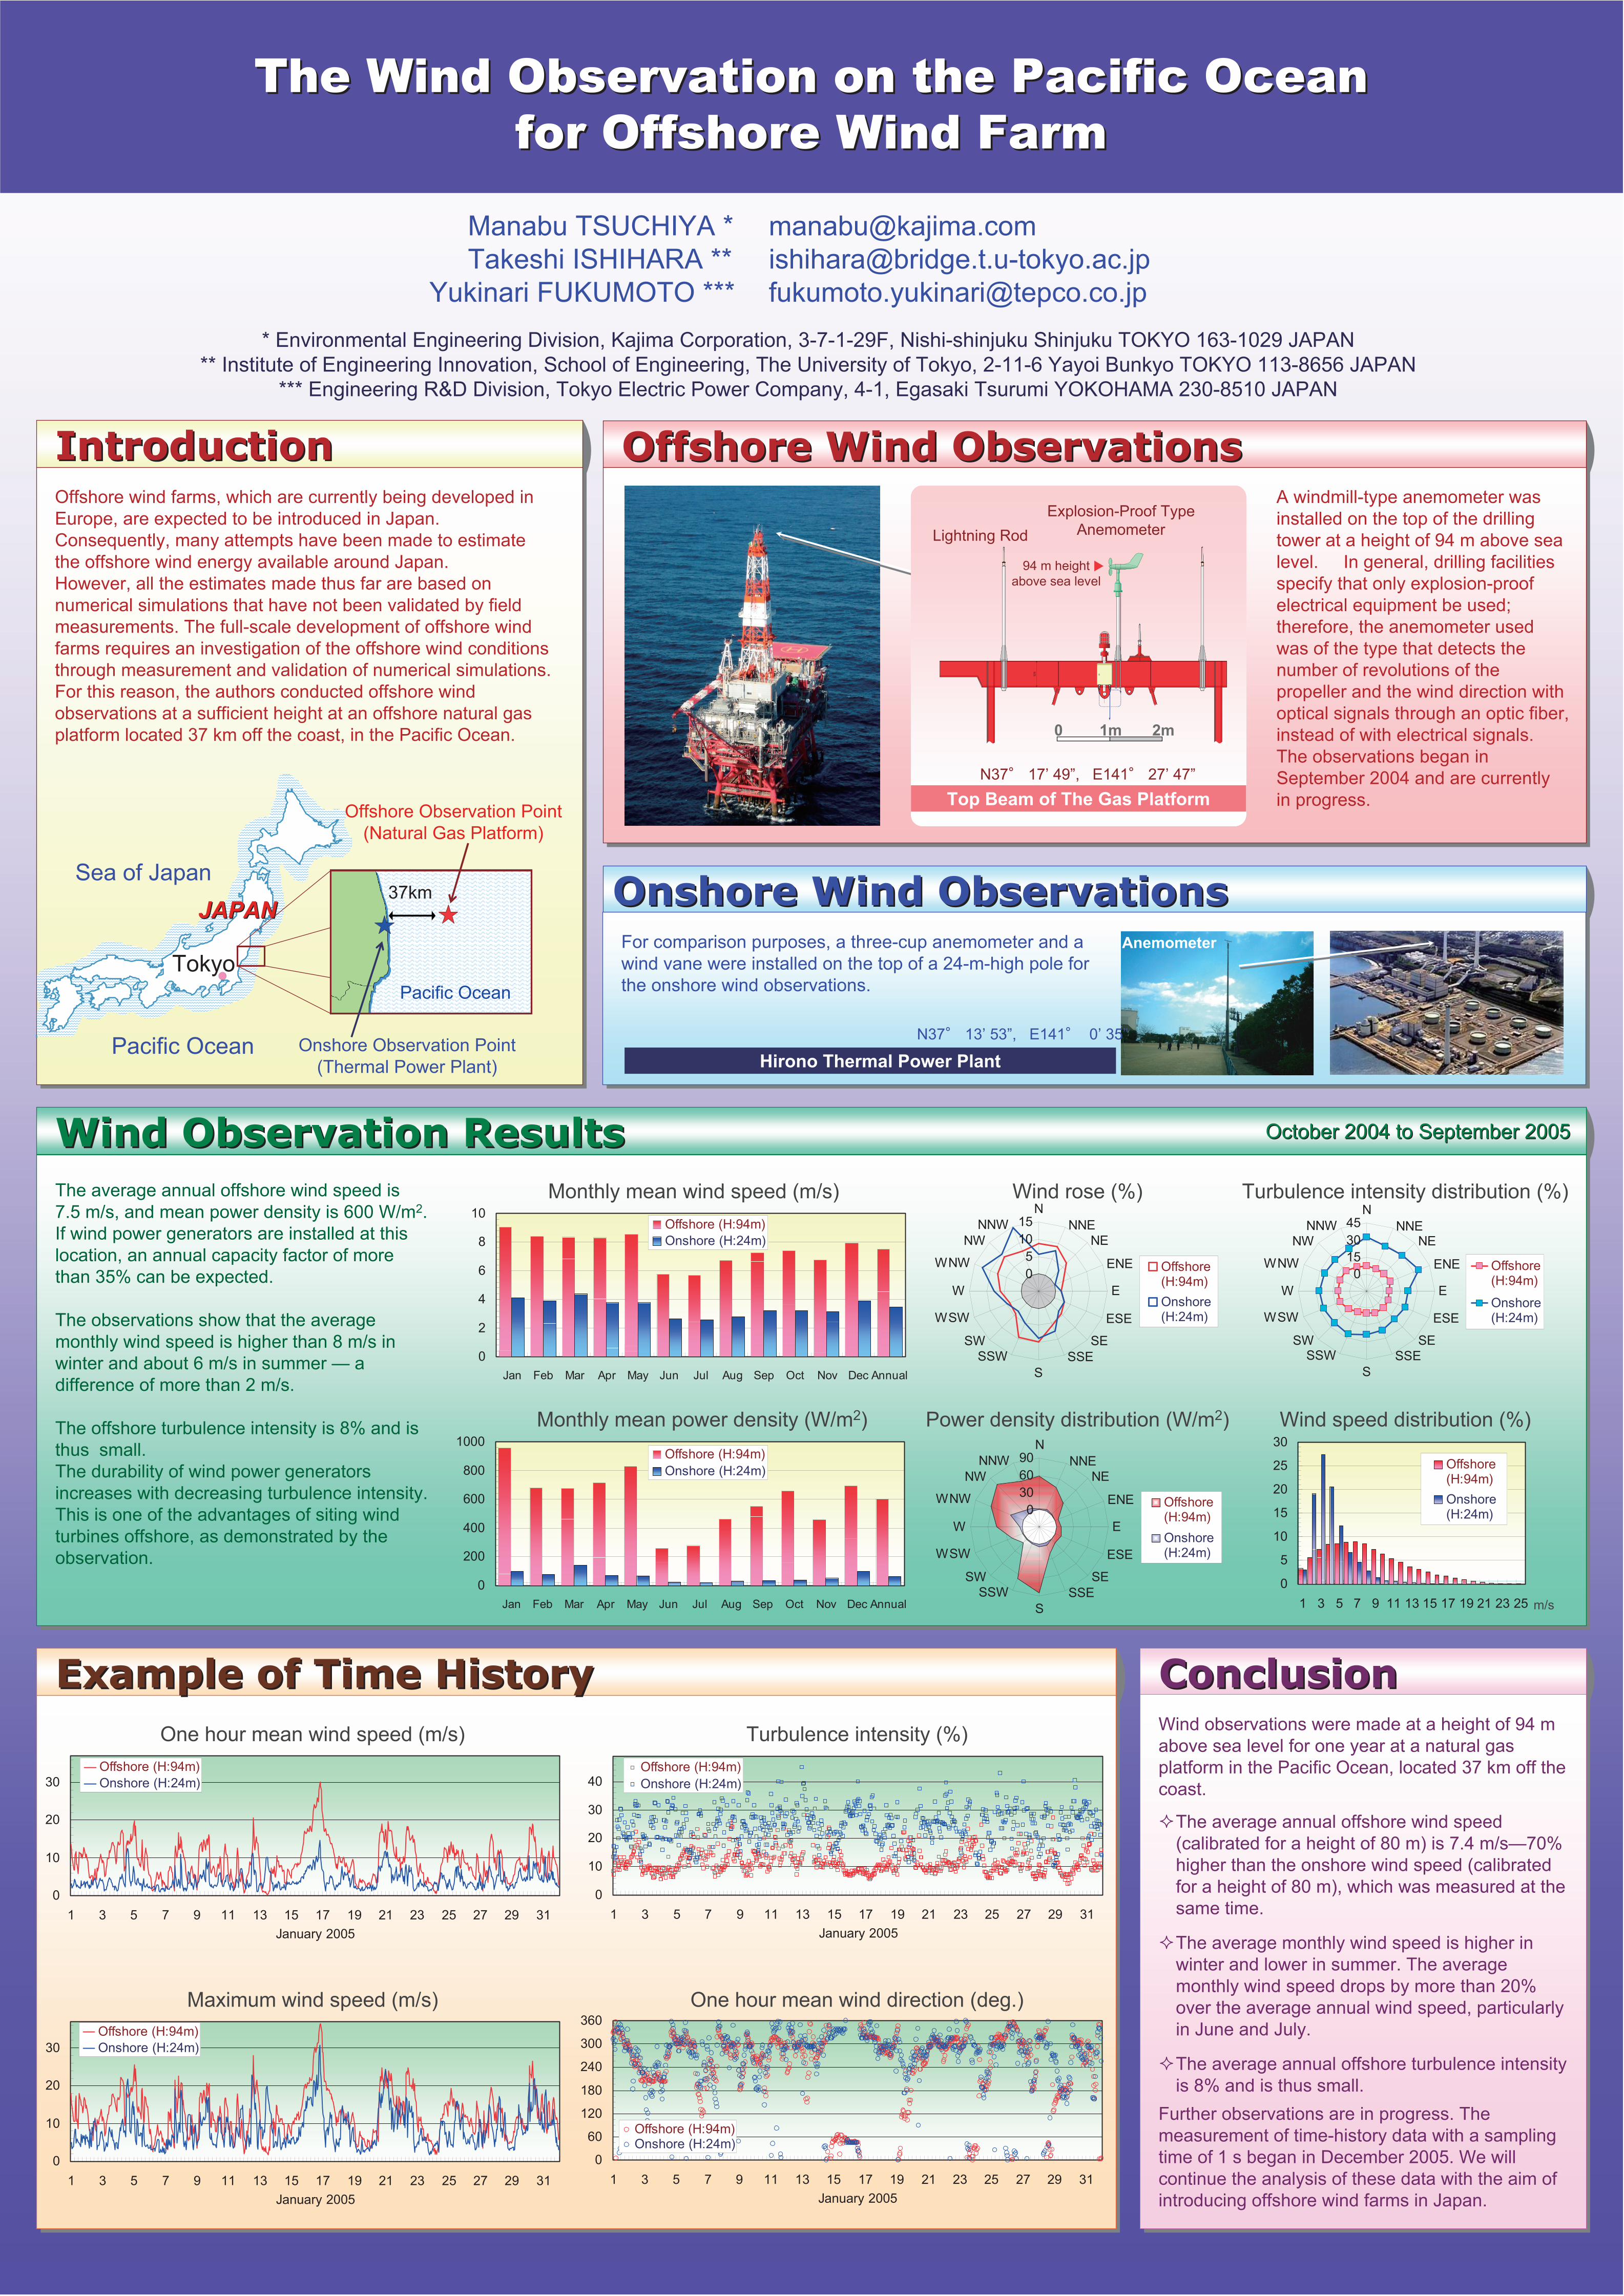
IntroductionIntroduction
Wind Observation ResultsWind Observation Results
Example of Time HistoryExample of Time History ConclusionConclusion
Offshore wind farms, which are currently being developed in
Europe, are expected to be introduced in Japan.
Consequently, many attempts have been made to estimate
the offshore wind energy available around Japan.
However, all the estimates made thus far are based on
numerical simulations that have not been validated by field
measurements. The full-scale development of offshore wind
farms requires an investigation of the offshore wind conditions
through measurement and validation of numerical simulations.
For this reason, the authors conducted offshore wind
observations at a sufficient height at an offshore natural gas
platform located 37 km off the coast, in the Pacific Ocean.
A windmill-type anemometer was
installed on the top of the drilling
tower at a height of 94 m above sea
level. In general, drilling facilities
specify that only explosion-proof
electrical equipment be used;
therefore, the anemometer used
was of the type that detects the
number of revolutions of the
propeller and the wind direction with
optical signals through an optic fiber,
instead of with electrical signals.
The observations began in
September 2004 and are currently
in progress.
JAPANJAPAN
Tokyo
Pacific Ocean
Sea of Japan
Offshore Observation Point
(Natural Gas Platform)
Onshore Observation Point
(Thermal Power Plant)
37km
Pacific Ocean
Offshore Wind ObservationsOffshore Wind Observations
Onshore Wind ObservationsOnshore Wind ObservationsFor comparison purposes, a three-cup anemometer and a
wind vane were installed on the top of a 24-m-high pole for
the onshore wind observations.
52
8
N37 17’ 49”, E141 27’ 47”
Lightning Rod
Explosion-Proof Type
Anemometer
1m 2m0
94 m height
above sea level
Top Beam of The Gas Platform
N37 13’ 53”, E141 0’ 35”
Hirono Thermal Power Plant
Anemometer
Wind observations were made at a height of 94 m
above sea level for one year at a natural gas
platform in the Pacific Ocean, located 37 km off the
coast.
Further observations are in progress. The
measurement of time-history data with a sampling
time of 1 s began in December 2005. We will
continue the analysis of these data with the aim of
introducing offshore wind farms in Japan.
The average annual offshore wind speed
(calibrated for a height of 80 m) is 7.4 m/s—70%
higher than the onshore wind speed (calibrated
for a height of 80 m), which was measured at the
same time.
The average monthly wind speed is higher in
winter and lower in summer. The average
monthly wind speed drops by more than 20%
over the average annual wind speed, particularly
in June and July.
The average annual offshore turbulence intensity
is 8% and is thus small.
One hour mean wind speed (m/s) Turbulence intensity (%)
Maximum wind speed (m/s) One hour mean wind direction (deg.)
0
10
20
30
1 3 5 7 9 11 13 15 17 19 21 23 25 27 29 31
January 2005
Offshore (H:94m)
Onshore (H:24m)
0
10
20
30
1 3 5 7 9 11 13 15 17 19 21 23 25 27 29 31
January 2005
Offshore (H:94m)
Onshore (H:24m)
0
10
20
30
40
1 3 5 7 9 11 13 15 17 19 21 23 25 27 29 31
January 2005
Offshore (H:94m)
Onshore (H:24m)
0
60
120
180
240
300
360
1 3 5 7 9 11 13 15 17 19 21 23 25 27 29 31
January 2005
Offshore (H:94m)Onshore (H:24m)
0
2
4
6
8
10
Jan Feb Mar Apr May Jun Jul Aug Sep Oct Nov Dec Annual
Offshore (H:94m)
Onshore (H:24m)
0
200
400
600
800
1000
Jan Feb Mar Apr May Jun Jul Aug Sep Oct Nov Dec Annual
Offshore (H:94m)
Onshore (H:24m)
Monthly mean wind speed (m/s)
Monthly mean power density (W/m2)
Wind rose (%)
Power density distribution (W/m2)
Turbulence intensity distribution (%)
Wind speed distribution (%)
0
5
10
15N
NNE
NE
ENE
E
ESE
SE
SSE
S
SSW
SW
WSW
W
WNW
NW
NNW
Offshore(H:94m)
Onshore(H:24m)
0
15
30
45N
NNENE
ENE
E
ESE
SE
SSE
S
SSWSW
WSW
W
WNW
NW
NNW
Offshore(H:94m)
Onshore(H:24m)
0
5
10
15
20
25
30
1 3 5 7 9 11 13 15 17 19 21 23 25
Offshore(H:94m)
Onshore(H:24m)
The average annual offshore wind speed is
7.5 m/s, and mean power density is 600 W/m2.
If wind power generators are installed at this
location, an annual capacity factor of more
than 35% can be expected.
The observations show that the average
monthly wind speed is higher than 8 m/s in
winter and about 6 m/s in summer — a
difference of more than 2 m/s.
The offshore turbulence intensity is 8% and is
thus small.
The durability of wind power generators
increases with decreasing turbulence intensity.
This is one of the advantages of siting wind
turbines offshore, as demonstrated by the
observation.
m/s
OctoberOctober 20042004 to September to September 20052005
0
30
60
90N
NNE
NE
ENE
E
ESE
SE
SSE
S
SSW
SW
WSW
W
WNW
NW
NNW
Offshore(H:94m)
Onshore(H:24m)