The Wide Angle - DWS
83
Deutsche Bank Research Global Economics Date 1 September 2014 The Wide Angle India 2020: The Road to East Asia ________________________________________________________________________________________________________________ Deutsche Bank AG/Hong Kong DISCLOSURES AND ANALYST CERTIFICATIONS ARE LOCATED IN APPENDIX 1. MCI (P) 148/04/2014. Sanjeev Sanyal Global Strategist (+65) 6423 5969 [email protected] Abhay Laijawala Head of India Equity Research, (+91) 22 7180 4031 [email protected] Michael Spencer, Ph.D Chief Economist (+852) 2203 8303 [email protected] Taimur Baig, Ph.D Chief Economist (+65) 64238681 [email protected] Manish Saxena Head of Asia ex Japan Industrials and Infrastructure (+91) 22 7180 4034 [email protected] Abhishek Puri Research Analyst - Utilities (+91) 22 7180 4214 [email protected] Harshad Katkar Research Analyst - Oil and Gas +91(22)7180 4029 [email protected] Manish Karwa Research Analyst - Banks and Financials +91(22)7180 4212 [email protected] Srinivas Rao Research analyst - Automobiles, Telecom +91(22)7180 4210 [email protected] Summary A clear and internally coherent economic model is emerging from Prime Minister Modi’s speeches and policy actions. The model includes export- oriented manufacturing, heavy infrastructure building and urbanization. In our view, this suggests a shift from India’s current services-driven growth trajectory to an East Asian growth model based on the mass deployment of labour and capital. The new strategy will require keeping the Rupee weak and dramatically expanding the financial system. International experience shows that the model can generate growth and jobs, but sustaining such rapid financial expansion is not without risks. The East Asian model will also be more materials and energy intensive. We calculate that a shift to manufacturing-led growth will increase the power demand multiplier to a range of 1-1.2x from 0.8x currently. Thus, apart from re- starting stalled projects, an additional 100GW of power generation capacity will be needed by 2020. The Oil & Gas sector will have to be simultaneously reformed to cut subsidies and incentivize domestic production. Meanwhile, the pace of road construction will need to rise five-fold to 30Kms/day from the current 6 kms/day. Similarly, railway capacity will have to be increased to carry more than three-times the current traffic of both passengers as well as freight. India is known for its services exports but many doubt its ability to export manufactures. In this report we have looked at the automobile sector as a case study. With Chinese labour becoming increasingly expensive, we feel that there will be an opportunity for India to expand manufacturing exports. Of course, the critical ingredient in this growth model is the ability of the domestic financial sector to sustain rapid expansion. While the banking system is likely to remain the key driver, attention should be paid to expanding the wider ecosystem of bond markets, insurance companies, mutual funds and so on. The government will also have to seriously think about injecting capital into the public sector banks. We feel that the government will eventually dilute its stake in public sector banks to ~51% and perhaps even lower.
Transcript of The Wide Angle - DWS

Deutsche Bank Research
Global
Economics
Date 1 September 2014
The Wide Angle India 2020: The Road to East Asia
________________________________________________________________________________________________________________Deutsche Bank AG/Hong Kong
DISCLOSURES AND ANALYST CERTIFICATIONS ARE LOCATED IN APPENDIX 1. MCI (P) 148/04/2014.
Sanjeev Sanyal
Global Strategist (+65) 6423 5969 [email protected]
Abhay Laijawala
Head of India Equity Research, (+91) 22 7180 4031 [email protected]
Michael Spencer, Ph.D
Chief Economist (+852) 2203 8303 [email protected]
Taimur Baig, Ph.D
Chief Economist (+65) 64238681 [email protected]
Manish Saxena
Head of Asia ex Japan Industrials and Infrastructure (+91) 22 7180 4034 [email protected]
Abhishek Puri
Research Analyst - Utilities (+91) 22 7180 4214 [email protected]
Harshad Katkar
Research Analyst - Oil and Gas+91(22)7180 4029 [email protected]
Manish Karwa
Research Analyst - Banks and Financials+91(22)7180 4212 [email protected]
Srinivas Rao
Research analyst - Automobiles, Telecom+91(22)7180 4210 [email protected]
Summary A clear and internally coherent economic model is emerging from Prime Minister Modi’s speeches and policy actions. The model includes export-oriented manufacturing, heavy infrastructure building and urbanization. In our view, this suggests a shift from India’s current services-driven growth trajectory to an East Asian growth model based on the mass deployment of labour and capital.
The new strategy will require keeping the Rupee weak and dramatically expanding the financial system. International experience shows that the model can generate growth and jobs, but sustaining such rapid financial expansion is not without risks.
The East Asian model will also be more materials and energy intensive. We calculate that a shift to manufacturing-led growth will increase the power demand multiplier to a range of 1-1.2x from 0.8x currently. Thus, apart from re-starting stalled projects, an additional 100GW of power generation capacity will be needed by 2020. The Oil & Gas sector will have to be simultaneously reformed to cut subsidies and incentivize domestic production. Meanwhile, the pace of road construction will need to rise five-fold to 30Kms/day from the current 6 kms/day. Similarly, railway capacity will have to be increased to carry more than three-times the current traffic of both passengers as well as freight.
India is known for its services exports but many doubt its ability to export manufactures. In this report we have looked at the automobile sector as a case study. With Chinese labour becoming increasingly expensive, we feel that there will be an opportunity for India to expand manufacturing exports. Of course, the critical ingredient in this growth model is the ability of the domestic financial sector to sustain rapid expansion. While the banking system is likely to remain the key driver, attention should be paid to expanding the wider ecosystem of bond markets, insurance companies, mutual funds and so on. The government will also have to seriously think about injecting capital into the public sector banks. We feel that the government will eventually dilute its stake in public sector banks to ~51% and perhaps even lower.

1 September 2014
The Wide Angle: India 2020: The Road to East Asia
Page 2 Deutsche Bank AG/Hong Kong
Foreword
Prime Minister Narendra Modi was elected to power in May with the strongest mandate in decades. During his campaign, he had promised a structural break from India’s past economic performance. Although it is still early days, his words and initial policy actions suggest that he is serious about his promises and is working to a systematic model. Moreover, it appears that his economic model echoes the strategy used by East Asian countries from Japan to China to rapidly modernize themselves.
The East Asian model of growth is a well trodden path, and has now been used by a succession of countries to generate and sustain rapid economic expansion. It is also accompanied by risks, especially in the financial system, that could derail the whole project. If India succeeds, it would prove to be a major turning point in the lives of 1.2bn people and would have very significant ramifications for the world economy. We feel, therefore, that the world should pay close attention to what is happening in India and this report is an attempt to provide a simple framework for understanding what the new government is attempting.
Regards
David Folkerts-Landau Group Chief Economist & Member, Group Executive Committee Deutsche Bank AG

1 September 2014
The Wide Angle: India 2020: The Road to East Asia
Deutsche Bank AG/Hong Kong Page 3
Macroeconomic Overview
Introduction
In May 2014, India’s voters gave a clear mandate to the BJP-led National Democratic Alliance (NDA). Not only did the alliance get a majority in the Lok Sabha (Lower House of Parliament), the BJP even attained a majority of its own – the first time a single party has won a majority since 1984. The mandate is widely seen as an endorsement of Prime Minister Narendra Modi’s message of rapid economic development. Indeed, he is the first Prime Minister to have fought and won national elections on unapologetically pro-reform, pro-growth agenda.
This report is not about making hard forecasts of GDP growth and other economic variables, but an attempt to give readers a sense of the economic framework likely to be adopted by Prime Minister Modi. Although India has been slowly reforming its economy since 1991, many of the institutions of the socialist Nehruvian era had continued to thrive. One the most important of these was the Planning Commission that continued to publish Soviet-style “Five Year Plans” and was at the heart of a centralized resource allocation process. In his Independence Day speech on 15th August, Prime Minister Modi abolished the institution in one fell sweep. Instead, he articulated his intention of encouraging export oriented manufacturing. Similarly, his government has shown a special interest in investing up heavy infrastructure such as power, railways and highways. This emphasis on export-oriented manufacturing and heavy infrastructure suggests that Prime Minister Modi’s government is likely to shift India to a more “East Asian” growth model based on the bulk deployment of labour and capital.
The first section of this report looks at the overall macro-economic context with particular focus on the need to ramp up investment activity and job growth. In the later sections, we have looked at different sectors that will be expected to make an important contribution of the new growth trajectory.
The Collapse in Growth and Investment
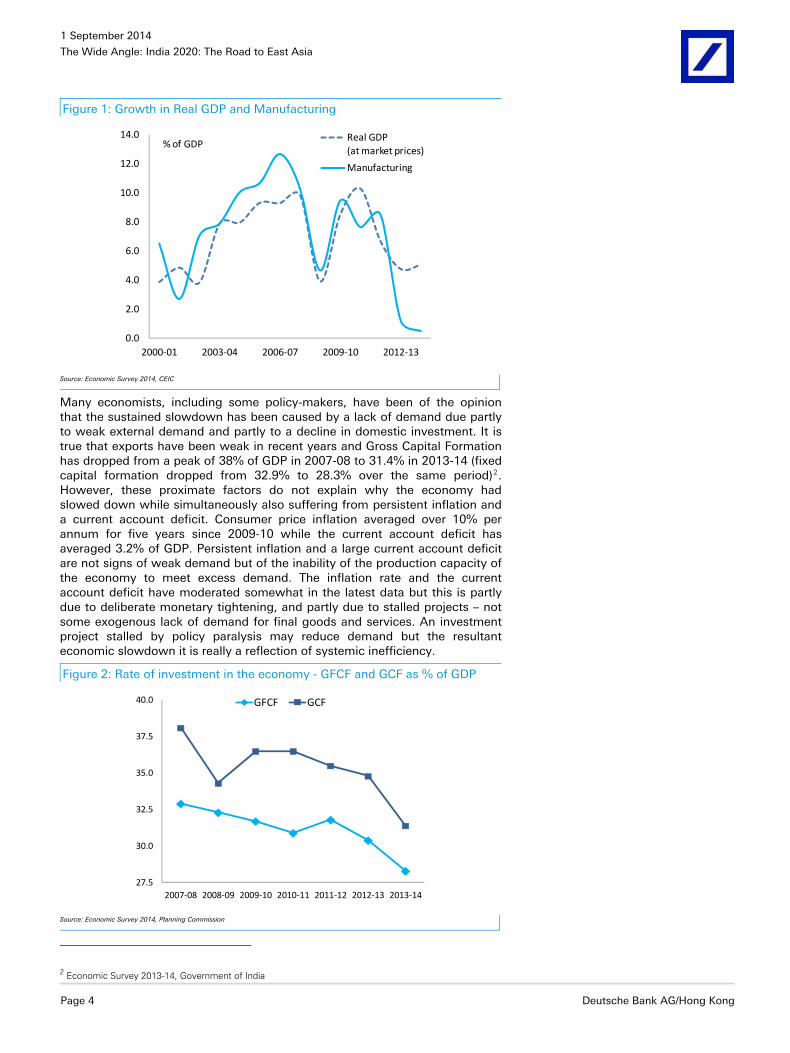
One of the immediate problems faced by the new government is the significant slowdown in economic activity in recent years. After a sustaining growth rates of over 9% between 2005-061 and 2007-08, growth slowed in 2008-09 in the wake of the global financial crisis but, despite a brief bounce, it has continued to slow and has been running below 5% for the last two years. The once booming services sector has slowed, but it is the manufacturing sector that has performed especially poorly by recording an expansion of barely 1.1% growth in 2012-13 followed by a contraction of 0.7% 2013-14. Latest data shows a mild improvement in industrial momentum but it remains very weak.
1 India’s fiscal year runs from 1st April to 31st March
1 September 2014
The Wide Angle: India 2020: The Road to East Asia
Page 4 Deutsche Bank AG/Hong Kong
Figure 1: Growth in Real GDP and Manufacturing
0.0
2.0
4.0
6.0
8.0
10.0
12.0
14.0
2000-01 2003-04 2006-07 2009-10 2012-13
% of GDPReal GDP (at market prices)
Manufacturing
Source: Economic Survey 2014, CEIC
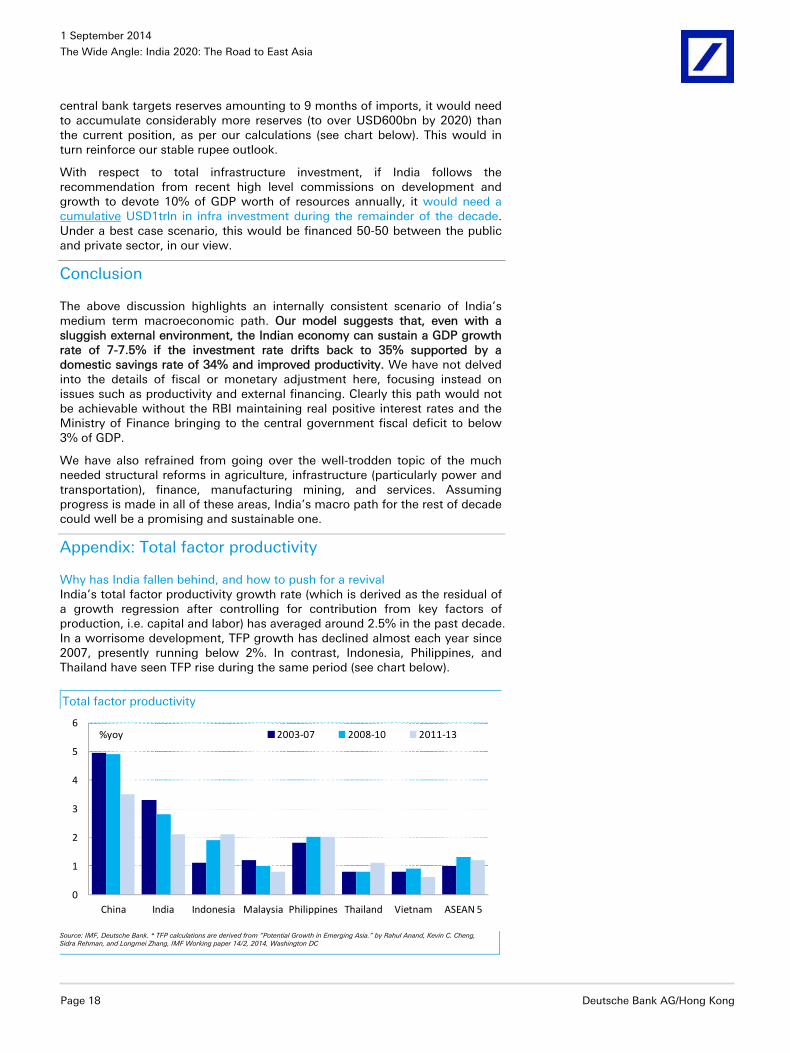
Many economists, including some policy-makers, have been of the opinion that the sustained slowdown has been caused by a lack of demand due partly to weak external demand and partly to a decline in domestic investment. It is true that exports have been weak in recent years and Gross Capital Formation has dropped from a peak of 38% of GDP in 2007-08 to 31.4% in 2013-14 (fixed capital formation dropped from 32.9% to 28.3% over the same period)2. However, these proximate factors do not explain why the economy had slowed down while simultaneously also suffering from persistent inflation and a current account deficit. Consumer price inflation averaged over 10% per annum for five years since 2009-10 while the current account deficit has averaged 3.2% of GDP. Persistent inflation and a large current account deficit are not signs of weak demand but of the inability of the production capacity of the economy to meet excess demand. The inflation rate and the current account deficit have moderated somewhat in the latest data but this is partly due to deliberate monetary tightening, and partly due to stalled projects – not some exogenous lack of demand for final goods and services. An investment project stalled by policy paralysis may reduce demand but the resultant economic slowdown it is really a reflection of systemic inefficiency.
Figure 2: Rate of investment in the economy - GFCF and GCF as % of GDP
27.5
30.0
32.5
35.0
37.5
40.0
2007-08 2008-09 2009-10 2010-11 2011-12 2012-13 2013-14
GFCF GCF
Source: Economic Survey 2014, Planning Commission
2 Economic Survey 2013-14, Government of India

1 September 2014
The Wide Angle: India 2020: The Road to East Asia
Deutsche Bank AG/Hong Kong Page 5
This fits with a recent IMF working paper that found that interest rates explained no more than a quarter of the investment slowdown in India, and that policy uncertainty and business confidence were more important factors3. The government’s latest Economic Survey, published in mid-July, also recognizes this when it states “part of the slowdown in investment growth post 2007-08 can be attributed to policy uncertainty emanating from difficulties in land acquisition, delayed environmental clearances, infrastructure bottlenecks, “and so on. The larger point is that the underlying problem of the Indian economy derives from the supply-side and not from the demand-side. This important distinction suggests that measures aimed at merely reviving demand – say by cutting interest rates – would mostly feed inflation unless wider supply-side reforms, including the revival of stalled projects, are undertaken to free up the productive capability of the economy.
Figure 3: Infrastructure projects, rate
of completion
Figure 4: Value of implementation
projects that are stalled
3.0
4.0
5.0
6.0
7.0
8.0
9.0
2004 2006 2008 2010 2012 2014
%
0
2,000
4,000
6,000
8,000
10,000
2004 2006 2008 2010 2012 2014
INR billion
Source: Economic Survey 2014. CMIE Capex database Source: Economic Survey 2014 CMIE Capex database
In order to gauge the cost of policy uncertainty and other bottle-necks, we can consider trends in the Incremental Capital-Output Ratio (ICOR) of the Indian economy. This ratio looks at the incremental fixed investment required to generate an additional unit of output. We are aware that is it a rough measure and of its limitations4, but the trends are clear and unmistakable. India’s ICOR jumped from a 3-year moving average of 3.5 in 2005-06 to over 7 in 2013-14.
The ICOR can rise due to falling final demand but, as we have already discussed, the deterioration in this case reflects supply-side problems. In other words, the jump in the ICOR reflects a sharp deterioration in the efficiency of investment. Not surprisingly, the private corporate sector responded to the situation by cutting back on investment activity. Gross Fixed Investment by the private corporate sector dropped from a peak of 14.3% of GDP in 2007-08 to 8.5% of GDP in 2012-13 (and likely even lower in 2013-14) with investments in machinery and equipment being particularly hit (investment by households and the public sector were less hurt).
3 “Disentangling India’s Investment Slowdown”, Rahul Anand & V. Tulin, IMF Working Paper, 2014 4 The ICOR has long been used by Indian policy-makers following the traditional Harrod-Domar framework. For this report, we have used the formulation as discussed in “Report of the Working-Group on Estimation of Investment, it Composition and Trend for Twelfth Five-Year Plan (2012-23 to 2016-17)”, Planning Commission, Government of India, June 2012

1 September 2014
The Wide Angle: India 2020: The Road to East Asia
Page 6 Deutsche Bank AG/Hong Kong
Figure 5: Incremental Capital Output Ratio (ICOR)
0.0
1.0
2.0
3.0
4.0
5.0
6.0
7.0
8.0
2000-01 2003-04 2006-07 2009-10 2012-13
Source: Economic Survey 2014, CEIC. Note: Three year moving average.
Figure 6: Investment rates by private sector and in machinery – respective
GFCF as % of GDP
0.0
3.0
6.0
9.0
12.0
15.0
2004-05 2006-07 2008-09 2010-11 2012-13
Private corporate sector
Machinery and equipment
Source: Data-book Compiled for use of Planning Commission
Demographics and Jobs
A poor emerging economy like India is always in search of growth as it is needed for increasing per capita income. However, there is an additional reason for wanting to revive growth – the need to generate employment. As the latest Economic Survey puts it “The defining challenge in India today is that of generating employment and growth”. Part of the urgent need for employment generation is due to the country’s expanding working age population. Between 2015 and 2020, the working age population (defined here as 15-59years) will rise from 804mn to 856mn. This requires 10mn additional jobs per year till the next elections to keep up with demographic expansion alone.

1 September 2014
The Wide Angle: India 2020: The Road to East Asia
Deutsche Bank AG/Hong Kong Page 7
Figure 7: Working Population and Total Population
1,0421,127
1,2061,282
1,3481,402 1,444 1,476 1,498
614682
749804
856901 939 963 971
0
300
600
900
1,200
1,500
2000 2005 2010 2015 2020 2025 2030 2035 2040
mill
ions
Total population Working population (15-59 yrs)
Source: Deutsche Bank estimates
However demographic expansion of the labour force is only part of the employment generation problem. Despite the expansion of the economy since 1991 and its changing structure, a disproportionate share of the workforce is still engaged in agriculture. The share of the primary sector has fallen from 28.5% of the economy in 1990-91 to 23.2% in 1999-00 to around 14% of GDP today, but it still employs 49% of the active workforce. Note that this growing imbalance is one of the reasons that India has been a reluctant urbaniser and two-thirds of the population still lives in rural areas. Not surprisingly, the children of farmers can see that they are getting cornered into a shrinking segment of the economy and want to opt out. Meetings their aspirations is not merely an economic issue but a socio-political one.
The services sector, in contrast, has seen its share jump from 43% to 60% since 1990-91 but employs only 28% of the workforce. Meanwhile, the secondary sector, which has been a big contributor to growth and job creation in China, has seen its share remain unchanged in India at around 26% of the economy for the last three decades (the manufacturing segment is even smaller at 14.9% of GDP). Nonetheless, despite its stagnant share in the economy, the share of industry in employment has gone up to 24.3% over time. The differential between the ability of industry and services to generate jobs has an important influence in the current government’s thinking.
Figure 8: Sectoral share in GDP, 1999-2000 (left) and 2013-14 (right)
Agriculture and allied23.20
Industry26.80
Services50.00
Agriculture and allied13.90
Industry26.10
Services59.90
Source: Economic Survey 2014

1 September 2014
The Wide Angle: India 2020: The Road to East Asia
Page 8 Deutsche Bank AG/Hong Kong
Figure 9: Sectoral share in employment, 1999-2000 (left) and 2011-12 (right)
Agriculture and allied59.9Industry
16.4
Services23.7
Agriculture and allied48.9Industry
24.3
Services26.9
Source: Economic Survey 2014
There is a further twist to India’s employment generation problem. The Ministry of Labour’s “Third Annual Employment & Unemployment Survey 2012-13”, published in November last year, shows that the unemployment among illiterate youth stands at 3.7% but that among graduates was as high 32% - i.e., education was clearly not improving employment prospects of the youth . The problem is clearly not for graduates from the elite universities who can often command international salaries but for the growing pool of students being churned out by the bulk of lesser known secondary schools and tertiary institutions. This has led to the feeling that the services-led economic boom has disproportionately benefitted the old “English-speaking” middle class but not those aspiring to join the middle-class through hard work and education.
In other words, Prime Minister Modi’s mandate is to clear up the pipeline that allows the increasingly literate/educated children of farmers to join the middle-class. Fulfilling this aspiration requires “honorable” jobs and not rural employment guarantee schemes. Part of the solution would be reform agriculture and speed up growth to support the creation of a rural middle class but the sector is now just 14% of the economy and cannot be expected to absorb the growing numbers. The services sector has shown that it can generate growth but, as we have seen, its ability to generate jobs for the newly literate/educated is suspect. Thus, the strategy is swaying towards a rapid expansion of the manufacturing and construction sectors which can deploy the pipeline of semi-skilled workers trying to climb the social and economic ladder.
The East Asian Model?
The latest Economic Survey summaries the government’s employment generation strategy in one line: “Jobs are created by firms when firms invest and grow”. This may sound like a motherhood statement but those familiar with India’s recent past will recognize a break from the entitlements-based approach of the previous government. Till now, the conventional wisdom was that mechanization would increase unemployment and lead to social and political instability. This is why government sponsored employment guarantee schemes in rural areas explicitly discouraged use of machinery.
So, what does the government need to do in order to get firms to invest again? The first and most obvious thing would be to finish the various stalled infrastructure projects. The capital invested in these projects can be made generate output. This will also help the banking system which has seen an increase in its non-performing loans as a consequence of the various delays. However, the longer term agenda would be to make it easier to do business in India. The World Bank’s “Doing Business Report 2014” ranked India 134 out of 189 countries in terms of the ease of doing business. As one can see from the

1 September 2014
The Wide Angle: India 2020: The Road to East Asia
Deutsche Bank AG/Hong Kong Page 9
table below, it performs especially poorly in categories that involve interface with the government – paying taxes, construction permits and so on. The national government cannot resolve all the issues, but Prime Minister Modi’s election slogan of “Minimum Government, Maximum Governance” suggests that he is acutely aware of this issue and, given his administrative record, it is reasonable to expect significant improvement in this space.
Figure 10: Doing Business Rankings India Brazil South Korea Turkey China
Ease of doing business 134 116 7.0 69 96
Starting a business 179 123 34.0 93 158
Dealing with construction permits
182 130 18.0 148 185
Getting electricity 111 14 2.0 49 119
Registering property 92 107 75.0 50 48
Getting credit 28 109 13.0 86 73
Protecting investors 34 80 52.0 34 98
Paying taxes 158 159 25.0 71 120
Trading across borders 132 124 3.0 86 74
Enforcing contracts 186 121 2.0 38 19
Resolving Insolvency 121 135 15.0 130 78Source: The World Bank
While a generic improvement in the business climate would be welcome, Prime Minister Modi’s speeches and actions suggest a more specific economic model. As explicitly stated in the Independence Day speech, one component of his economic model is an emphasis on export oriented manufacturing. Notice that this is not about agnostic free markets but about creating competitiveness by investing in industry clusters. Another component is investment in heavy infrastructure ranging from power to railways. A third element is labour reforms. This is an area that previous government considered too politically sensitive but has already been opened up for reform by the NDA government both at the state and central level. These reforms are clearly a prelude to the mass deployment of labour. Finally, a repeated emphasis on building and expanding cities – urbanization being the spatial manifestation of industrialization. Not only are these elements internally consistent, they also look very much like the economic model used by East Asian countries to rapidly modernize themselves. In other words, for the first time since Nehru, we have a wide-ranging, internally consistent economic model. Moreover, this model follows a well trodden path
Of course, we are not implying that agriculture and services will be simply ignored. Far from it, the new “investment” based approach will be applied to these sectors as well. Indeed, Narendra Modi’s political rise is partly due to his success in generating agricultural growth during his stint as Chief Minister of Gujarat. This is particularly remarkable given that Gujarat is a semi-desert state that is not naturally well-endowed with either good soil or plentiful water supply. Heavy investment in water management and new technology were responsible for the state’s success. At the national level, however, farm mechanization is only 25% while the productivity levels for rice and wheat have not increased significantly since the 1980s.An important change in the strategy of this government will be its openness to mechanization and new technology even in agriculture. This is consistent with the idea that the farm sector will have to produce more even as industry sucks out workers from it. The latest Economic Survey summarizes this approach as follows “Due to the significant and continuous reduction of agricultural workforce, higher levels of farm mechanization are necessary for sustaining productivity and profitability.” Of course, this will require a wider reform and liberalization of the sector.

1 September 2014
The Wide Angle: India 2020: The Road to East Asia
Page 10 Deutsche Bank AG/Hong Kong
Who will finance the new model?
One of the obvious implications of the new growth trajectory is that the country’s gross investment rate will have to go up significantly from the 31.4% of GDP registered in 2013-14 (the fixed investment rate is even lower at 28.3%). The East Asian model is about sustaining a high investment rate over long periods of time. As shown in the chart below, Japan, South Korea and China all enjoyed a phase where heavy investment in infrastructure and industrial capacity created a virtuous cycle that simultaneously created capacity as well as demand. Japan was the pioneer of this growth model although its investment rate has been declining since the 1980s5. It was followed by others like South Korea and most recently by China which is still in the high investment phase. While India may never follow China into investing almost half its economy, it is not inconceivable that India’s investment rate could rise to around 38-40% of GDP (with fixed investment in the 35-38% range). After all, India’s investment rate had gone up briefly to 38.1% in 2007-08. In that episode, India was unable to sustain the pace and the investment rate subsequently declined, but it illustrates what the Indian economy is capable of doing.
Figure 11: Investments as a percent of GDP in selected countries
10
20
30
40
50
1980 1984 1988 1992 1996 2000 2004 2008 2012
% of GDP
China Japan Korea
Source: IMF WEO April 2014
Foreign capital, especially foreign direct investment, can play a very important role in capital formation. In addition to money, it brings in technology as well as international linkages. The Modi regime recognizes this and initial steps have been taken to attract foreign money including liberalizing the defense manufacturing and insurance sectors. Nonetheless, history suggests that East Asian countries that sustained the investment boom were all funded mostly by the mobilization and deployment of domestic savings. This means funding an investment rate of around 40% would require a savings rate that is much higher than the current level of 30% of GDP.
5 It can be argued that the East Asian model was pioneered not by Japan but by Victorian Britain. The 19th century investment boom in Britain created infrastructure that is still in use today.

1 September 2014
The Wide Angle: India 2020: The Road to East Asia
Deutsche Bank AG/Hong Kong Page 11
Figure 12: Gross national savings as percent of GDP in selected countries
0
10
20
30
40
50
60
1990 2001 2012
% of GDP
China Japan Korea
Source: IMF WEO April 2014
One major factor that could help India’s savings rate could be its demographics. In previous reports we have discussed how an increase in the share of working age population causes savings rates to rise6. All the East Asians were beneficiaries of this process to some extent during their boom phase. India is now entering the phase where the proportion of population of working age will steadily rise and it would be reasonable to expect that its savings rate will naturally rise. As illustrated below, household savings have been rising steadily for a long time. Indeed, the country’s overall domestic savings rate drifted up from the 21-24% of GDP range of the nineties to a peak of 36.8% in 2007-08 before it declined. A number of factors were responsible for this ranging from a decline in corporate savings to a shift in fiscal spending towards consumption. Still, it is not inconceivable that the country’s savings rate will go back up over the next five years.
6 see “Global Imbalances in the Post-Crisis World”, Sanjeev Sanyal, The Wide Angle Series, Deutsche Bank, 30th November 2013.

1 September 2014
The Wide Angle: India 2020: The Road to East Asia
Page 12 Deutsche Bank AG/Hong Kong
Figure 13: Gross Domestic Savings by Sector as % of GDP at Current Market
Prices
-5
0
5
10
15
20
25
30
1950-51 1960-61 1970-71 1980-81 1990-91 2000-01 2010-11
House- hold sector
Private corporate sector
Public sector
Source: Economic Survey 2014, Table 1.6, Pg 10
Mobilizing and deploying a large pool of capital is a very important aspect of the new growth model. In turn, this implies a very rapid expansion of the financial system in general and the banking system in particular. Prime Minister Modi is already implementing a target of opening 75mn new bank accounts by January 2015. The proximate driver of the expansion is a plan to directly transfer subsidy payments to the poor, but expanded financial inclusion could play a big role in mobilizing savings in the long run.
All the East Asians experienced rapid financial expansion in some form during their take-off phase but they also suffered the problems of misallocation. The Asian Crisis of 1997-98 was mostly due to the inability of the financial systems of countries like Indonesia and Thailand to handle rapid expansion. Even Japan’s economy was ultimately weighed down by the accumulation of bad debts and many economists argue that China will eventually have to deal with the same problem. We have, therefore, discussed the ability of the Indian banking system to sustain rapid expansion later in this report.
Reforming cities and labour laws
In addition to the bulk deployment of capital, the East Asian model is about the mass deployment of labour (this is its main attraction in the first place). However, the Modi regime will find two major roadblocks. First, the country has a plethora of outdated labour laws, some dating from the 1940s, that discourage hiring. Second, the country’s cities are not prepared to absorb the millions of industrial workers needed to feed the growth machine.
The labour market is currently clogged by a Byzantine web of state and central laws (this is an area subject to the laws made at both levels)7. Economists and businesses have been complaining for decades about the inefficiencies of Indian labour laws, but governments had so far steered clear of reforms as it was considered too politically sensitive. It is significant therefore, that we have suddenly seen some movement in this space and the strategy being used to initiate this change is worth understanding. Rather than initiate this reform at
7 For a fuller discussion on labour laws see “The Indian Renaissance: India’s Rise After a Thousand Years of Decline”, Sanjeev Sanyal, Penguin 2008.

1 September 2014
The Wide Angle: India 2020: The Road to East Asia
Deutsche Bank AG/Hong Kong Page 13
the central government, it is the BJP-ruled state of Rajasthan that is taking the initiative. In June, the state government announced its decision to amend the Industrial Disputes Act, the Contract Labour Act and the Factories Act8. The change in the Industrial Disputes Act, for instance, now means that businesses do not have to ask for government permission for retrenching up to 300 workers. The idea appears to be that Rajasthan’s example can then be used to change laws in other states as well as those at the central level. This will take time but in July, Labour Minister Vishnu Deo Sai informed Parliament that the government was actively considering changes in a number of laws including Minimum Wage Act 1948, Factories Act 1948 and Labour Laws 19889.
Assuming that these laws are amended and the investment cycle revives, the next big problem that will be faced by the new economic model will be the need to absorb millions of workers into the urban landscape. As shown in the table below, India has been a very reluctant urbanizer and two-thirds of its population still lives in villages (China in contrast is now an urban majority country). Historically, Indian policy-makers had tended to look at the urbanization as a problem that should be discouraged where possible and only reluctantly accommodated where inevitable. Prime Minister Modi’s vision, in contrast, is very enthusiastic about urban growth and the Finance Minister’s budget speech reiterated the idea of building a hundred “smart cities”. We do not yet have enough details on what this exactly means, but one should recognize that it is consistent with the wider economic plan of heavy infrastructure building and industrialization.
Figure 14: Urbanisation by Selected Countries Country Population
(mn) Urbanisation rates (%)
2010 1950 1970 1990 2010 2030
China 1,341.3 11.8 17.4 26.4 49.2 62.4
India 1,224.6 17.0 19.8 25.5 33.0 44.2
United States of America
310.4 64.2 73.6 75.3 82.1 86.0
Indonesia 239.9 12.4 17.1 30.6 49.9 63.1
Brazil 194.9 36.2 55.9 73.9 84.3 88.5
Bangladesh 148.7 4.3 7.6 19.8 27.9 39.1
Russian Federation 143.0 44.1 62.5 73.4 73.7 77.6
Japan 126.5 53.4 71.9 77.3 90.5 96.8
Mexico 113.4 42.7 59.0 71.4 77.8 82.7
Germany 82.3 68.1 72.3 73.1 73.8 77.4
Egypt 81.1 31.9 42.2 43.5 43.4 49.6
Turkey 72.8 24.8 38.2 59.2 70.5 83.1
France 62.8 55.2 71.1 74.1 85.2 91.4
United Kingdom 62.0 79.0 77.1 78.1 79.5 82.7
South Africa 50.1 42.2 47.8 52.0 61.5 69.8Source: UN Population and Urbanisation Prospects (2011 revision) and Deutsche Bank estimates
Implications for the Rupee
Some economists are of the opinion that the Indian Rupee is undervalued at the current range of INR60-61/USD. In a recent article, Martin Kessler and Arvind Subramanian of Peterson Institute of International Economics argued
8 http://indianexpress.com/article/india/india-others/rajasthan-shows-way-in-labour-reforms/ 9 http://www.business-standard.com/article/politics/govt-considering-to-amend-labour-laws-sai-114071600752_1.html

1 September 2014
The Wide Angle: India 2020: The Road to East Asia
Page 14 Deutsche Bank AG/Hong Kong
that the Indian Rupee is more than 30% undervalued based on a Purchasing Power Parity valuation applied to the Balassa-Samuelson framework10. We agree that prices in India are low by international standards and one of our recent studies found that it is the cheapest major economy in the world (see “Mapping the World’s Prices 2014”, Sanjeev Sanyal, The Random Walk series, May 2014) However, the PPP based valuation misses the point – being cheap is not the same as being competitive. Moreover, in the East Asian model, the currency can be an important tool rather than a passive exchange rate that drifts towards “fair value”. Recall how both Japan and China accumulated very large reserves and held down their currencies over long periods of time.
Even if India decides not to wholeheartedly use the Rupee as a mercantilist tool, it is likely that it will lean against a significant appreciation from current levels and probably may prefer it to weaken in the long run to make up for inflation differentials. In turn, the Reserve Bank would have to be willing to accumulate large piles of foreign exchange reserves.
This preference for foreign exchange accumulation was part of central bank policy till 2007-08. As shown in the chart, reserves rose steadily in the nineties and then peaked at USD310bn in 2007-08, but then has been broadly flat (it stands now at USD317bn). The government’s new growth model will demand a shift back to a preference to reserve accumulation. Given the size of India’s economy and its future external requirements, it would not be out of place if India had reserves in the USD500-600bn range by 2020. We also think that the central bank has the capacity to sterilize and manage the monetary impact of such accumulation.
Figure 15: Total Reserves held by India
0
50
100
150
200
250
300
350
1995-96 1998-99 2001-02 2004-05 2007-08 2010-11 2013-14
USD billion
Others
Foreign currency assets
Gold
Source: Economic Survey 2013-14
10 “Is the Rupee fairly Valued?” Kessler & Subramanian, Business Standard, 22 June 2014, http://www.business-standard.com/article/opinion/martin-kessler-arvind-subramanian-is-the-rupee-fairly-valued-114062200728_1.html
Sanjeev Sanyal +65 6423 5969

1 September 2014
The Wide Angle: India 2020: The Road to East Asia
Deutsche Bank AG/Hong Kong Page 15
A model of growth-investment for India: 2014-2020
Assumptions and implications of our growth model
What would it take for India to grow by 7-7.5% by the end of this decade? Below we present an internally consistent framework of savings, investment, and productivity that would attain such a goal. Our medium term scenario is broadly constructive, but cognizant of the external and internal challenges. In our view, the growth spurt seen in the past decade coincided with a favorable global backdrop of strong demand, abundant liquidity, general optimism about EM economies, and stable geopolitics. Even if one is optimistic of an enabling domestic environment and more effective governance, external conditions may not be as strong for the remainder of this decade. Also, the loss of momentum of recent years may be difficult and time consuming to recover.
With these caveats in mind, in this piece we highlight the key assumptions and implications of the model.
Assumptions
Savings and investment India’s domestic savings rate fell from 37% of GDP in FY07 to 30% of GDP in FY13 due to a variety of factors. Public sector deficit widened first to stimulate the economy around the global financial crisis in 2008 and then due to a ballooning subsidy bill. Corporate savings declined along with a sharp reduction in profits during the same period, while households dis-saved as inflation soared.
We expect a gradual improvement in the savings rate in the coming years as the public sector consolidates its fiscal position, corporate profitability returns, and households find savings worthwhile as inflation eases and real rates rise. We don’t however expect a sharp reversion to pre-crisis savings rate as we think it will take time for private sector savings rate to turn, primarily because households and firms have years of balance-sheet consolidation ahead. Our assumption is for the savings rate to bottom in FY14 at slightly below 30% of GDP, gradually rising to 34% of GDP by FY20.
Buoyed by the improvement in savings, the investment/GDP ratio rises from 30% in FY14 to 35% by FY20. Current account deficit persists at the 1-1.5% of GDP range, which is readily financed by sustained FDI and portfolio flows.
Growth Improvement in investment pushes up real GDP growth, which bottoms out from FY15 onward, rising initially to 5.5%, then to 6.5% by FY17, and 7.5% by FY19. Nominal GDP crosses USD3.4trln by 2020 in our scenario, raising per capita GDP to around USD2500. This constitutes about a 4.5% annual average growth of real per capita income.
Inflation RBI targets inflation successfully, bringing it down to below 6% by FY16 and below 5% by FY19, as per our scenario.

1 September 2014
The Wide Angle: India 2020: The Road to East Asia
Page 16 Deutsche Bank AG/Hong Kong
Rupee The exchange rate appreciates gradually in real terms. In nominal terms, against the USD, the rupee ranges 63-65 during this period.
Incremental capital-output ratio (ICOR) Boosted by productivity enhancing measures and efficiency gains through effective governance, the incremental capital-output ratio improves gradually, helping growth prospects to be boosted without excessive creation of capacity.
7%+ growth by the end of the decade would require significant improvements
in productivity
0
2
4
6
8
10
12
FY04 FY06 FY08 FY10 FY12 FY14 FY16 FY18 FY20
Growth ICOR
Source: CEIC, Deutsche Bank. ICOR stand for incremental capital output ratio, derived by dividing gross investment by real GDP growth. Dotted lines denote projections.
Investment recovery will likely be accompanied by a persistent but
sustainable current account deficit
-3
-2
-1
0
1
2
3
4
5
6
0
5
10
15
20
25
30
35
40
FY04 FY06 FY08 FY10 FY12 FY14 FY16 FY18 FY20
Investment, left C/A deficit, right
% of GDP
Source: CEIC, Deutsche Bank. Dotted lines denote projections.
Key constraints
While our scenario may not come across as particularly exuberant, it is nevertheless rather constructive, and subject to some risks.
Subdued global demand for the rest of the decade. In its latest forecasts, the International Monetary Fund projects 3% (or lower) real growth for the United Stated during 2014-20, while the forecast is less than 1.5% for

1 September 2014
The Wide Angle: India 2020: The Road to East Asia
Deutsche Bank AG/Hong Kong Page 17
Germany and Japan during the same period. This implies 100-150bps in lower growth rate in key industrial economies in the coming years relative to the pre-global financial crisis average. Clearly this will hamper demand globally, and India’s exporters will face some consequent headwinds.
Weak productivity growth. India’s TFP growth rate has slowed considerably in recent years. Many areas of the economy have seen excessive investment, while other areas are capacity constrained. Turning around the productivity engine will take time. (More on this in the appendix at the end of this report)
A relatively shallow financial sector. India’s bank and nonbank financial sector have experienced considerable stress in recent years due to slowing economic growth and market volatility. Wide ranging regulatory constraints and uncertainty have also gotten in the way for healthy financial sector activities. Burdened with major capital impairment and regulatory issues, domestic financial intermediation would likely remain curtailed for some time. Furthermore, local bond markets remain shallow and foreign access to the market limited, which may get in the way of expeditious capital-raising.
Another complicating factor would be if inflation is not tamed soon and the central bank is compelled to maintain a relatively tight policy stance for a prolonged period.
Financing needs
The model suggests that the above macro outcome would necessitate the current account to run a deficit of 1-1.5% of GDP during 2015-20, with a cumulative net external BOP financing need of USD250bn. A proactive disinvestment agenda, along with capital account liberalization measures, could readily generate USD75bn in FDI and an equal amount of net portfolio flows during this period, in our view.
External debt will rise gradually
If the target is 9 months of imports, RBI will have to add
substantially to spot reserves
0
5
10
15
20
25
30
0
200
400
600
800
1000
FY04 FY06 FY08 FY10 FY12 FY14 FY16 FY18 FY20
USD bn, left % of GDP, right
0
100
200
300
400
500
600
700
FY04 FY06 FY08 FY10 FY12 FY14 FY16 FY18 FY20
Target Actual
USD bn
Source: CEIC< Deutsche Bank Source: CEIC, Deutsche Bank
The rest of the financing can come from a well supervised external borrowing program by capital deficient Indian banks and corporations. Even if it doesn’t rise substantially as a share of GDP (we see external debt rising from 22% to 27% of GDP by 2020), there would be a need to build safeguard against possible funding crunch around events of global market stress. We assume that faced with such risks the RBI would aggressively build reserves. If the
1 September 2014
The Wide Angle: India 2020: The Road to East Asia
Page 18 Deutsche Bank AG/Hong Kong
central bank targets reserves amounting to 9 months of imports, it would need to accumulate considerably more reserves (to over USD600bn by 2020) than the current position, as per our calculations (see chart below). This would in turn reinforce our stable rupee outlook.
With respect to total infrastructure investment, if India follows the recommendation from recent high level commissions on development and growth to devote 10% of GDP worth of resources annually, it would need a cumulative USD1trln in infra investment during the remainder of the decade. Under a best case scenario, this would be financed 50-50 between the public and private sector, in our view.
Conclusion
The above discussion highlights an internally consistent scenario of India’s medium term macroeconomic path. Our model suggests that, even with a sluggish external environment, the Indian economy can sustain a GDP growth rate of 7-7.5% if the investment rate drifts back to 35% supported by a domestic savings rate of 34% and improved productivity. We have not delved into the details of fiscal or monetary adjustment here, focusing instead on issues such as productivity and external financing. Clearly this path would not be achievable without the RBI maintaining real positive interest rates and the Ministry of Finance bringing to the central government fiscal deficit to below 3% of GDP.
We have also refrained from going over the well-trodden topic of the much needed structural reforms in agriculture, infrastructure (particularly power and transportation), finance, manufacturing mining, and services. Assuming progress is made in all of these areas, India’s macro path for the rest of decade could well be a promising and sustainable one.
Appendix: Total factor productivity
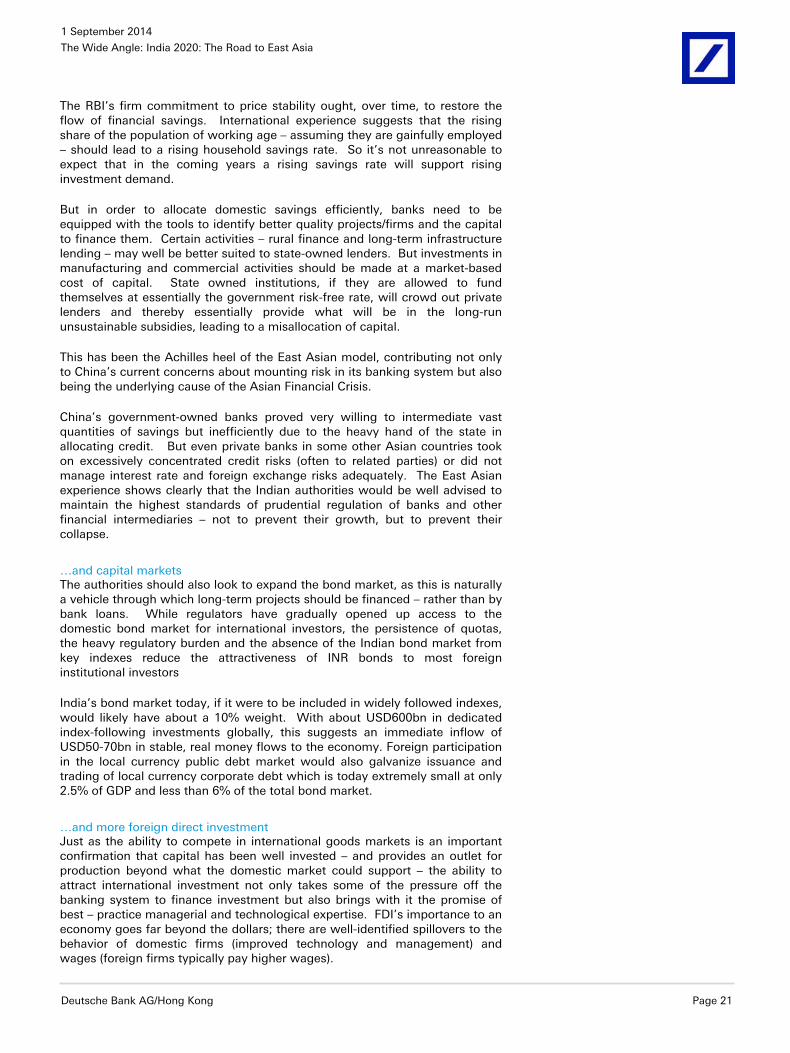
Why has India fallen behind, and how to push for a revival India’s total factor productivity growth rate (which is derived as the residual of a growth regression after controlling for contribution from key factors of production, i.e. capital and labor) has averaged around 2.5% in the past decade. In a worrisome development, TFP growth has declined almost each year since 2007, presently running below 2%. In contrast, Indonesia, Philippines, and Thailand have seen TFP rise during the same period (see chart below).
Total factor productivity
0
1
2
3
4
5
6
China India Indonesia Malaysia Philippines Thailand Vietnam ASEAN 5
2003-07 2008-10 2011-13%yoy
Source: IMF, Deutsche Bank. * TFP calculations are derived from “Potential Growth in Emerging Asia.” by Rahul Anand, Kevin C. Cheng, Sidra Rehman, and Longmei Zhang, IMF Working paper 14/2, 2014, Washington DC

1 September 2014
The Wide Angle: India 2020: The Road to East Asia
Deutsche Bank AG/Hong Kong Page 19
To boost TFP, India needs to focus on the following:
Larger scale of manufacturing. Vast majority of Indian firms are small by international comparison, which restricts them from exploiting economies of scale. Incentives need to be provided for firm merger, consolidation, and expansion.
Reducing product market regulation. Stringent rules prevent efficient shipment and transaction of goods and services. Many food items, for example, are required to be traded through centralized wholesales markets, which are often characterized by cartels and monopoly pricing.
Easing of employment protection. Reforms to allow businesses to hire workers on variable tenure and terminate contracts expeditiously (while respecting labor laws) would allow for greater labor mobility and business flexibility.
Removal of barriers to entry. Indian corporate sector tends to feature a low degree of entry-exit by international comparison. This also gets in the way of employment creation. Efforts to remove barriers to entry will foster competition and more dynamic corporate sector activity.
Taimur Baig +65 6423 8681

1 September 2014
The Wide Angle: India 2020: The Road to East Asia
Page 20 Deutsche Bank AG/Hong Kong
Financing India’s “take-off”
The new Indian government has proposed a significantly different model for India’s economic development, one that has worked well in East Asia. Essentially, it amounts to providing the basic infrastructure to support a rapid expansion of manufacturing with a bias initially towards export-oriented production. Exporting offers both a means of expanding production of some higher value-added goods and services beyond what the domestic market can currently absorb and also a way of continuously verifying that domestic savings are being well invested in competitive ventures rather than wasted in making goods and services that no-one else values, which is always the danger in autarchic states. This recipe delivered unprecedented improvements in peoples’ welfare in some of the world’s smallest (HK, Singapore) and largest (China) economies. There is no reason not to expect it can do the same in India11.
To succeed – over a generation – this strategy has at least the following five implications:
1) much greater levels of domestic savings need to be raised in order to fund the investment;
2) access to international markets is essential because only by competing successfully in international markets can one be assured that savings are being well invested;
3) to avoid China’s current problems, the capital should be invested as far as possible through markets and private sector balance sheets rather than across balance sheets of state owned institutions. It is important at the beginning to get the cost of capital right.
4) the exchange rate must remain “competitive” throughout. The latter means the Reserve Bank should, if conditions require it, be willing to accumulate previously unimaginable stocks of foreign exchange reserves in order to slow down the pace of INR appreciation.
5) industrialization necessarily means agglomeration. Urbanization should not only be accepted, it should be encouraged.
India needs bigger banks… Improving the efficiency of capital allocation – which enhances productivity growth – can boost GDP growth. And orienting investment towards export markets is an important contributor towards improved efficiency. But the East Asian model is primarily an investment-led growth strategy that involved more rapid capital accumulation that took fixed investment/GDP ratios in most countries above 40% whereas in India it peaked in FY07/08 at 33%.
The bulk of this investment will be financed primarily from domestic sources. Indian households’ propensity to save in financial assets has declined in recent years due to concerns about inflation and lack of confidence in intermediaries.
11 We made this point more than a decade ago when we asked “Will India Challenge China?”, Sanjeev Sanyal and Michael Spencer, Deutsche Bank Global Markets Research, December 18, 2002. We answered in the affirmative, and in the following seven years it did just that, doubling its export/GDP ratio and increasing the investment/GDP and savings/GDP ratios by 9ppts each. But more supportive government policy will be needed, we think, to build on these gains in a weaker global growth environment in the years to come.
1 September 2014
The Wide Angle: India 2020: The Road to East Asia
Deutsche Bank AG/Hong Kong Page 21
The RBI’s firm commitment to price stability ought, over time, to restore the flow of financial savings. International experience suggests that the rising share of the population of working age – assuming they are gainfully employed – should lead to a rising household savings rate. So it’s not unreasonable to expect that in the coming years a rising savings rate will support rising investment demand.
But in order to allocate domestic savings efficiently, banks need to be equipped with the tools to identify better quality projects/firms and the capital to finance them. Certain activities – rural finance and long-term infrastructure lending – may well be better suited to state-owned lenders. But investments in manufacturing and commercial activities should be made at a market-based cost of capital. State owned institutions, if they are allowed to fund themselves at essentially the government risk-free rate, will crowd out private lenders and thereby essentially provide what will be in the long-run unsustainable subsidies, leading to a misallocation of capital.
This has been the Achilles heel of the East Asian model, contributing not only to China’s current concerns about mounting risk in its banking system but also being the underlying cause of the Asian Financial Crisis.
China’s government-owned banks proved very willing to intermediate vast quantities of savings but inefficiently due to the heavy hand of the state in allocating credit. But even private banks in some other Asian countries took on excessively concentrated credit risks (often to related parties) or did not manage interest rate and foreign exchange risks adequately. The East Asian experience shows clearly that the Indian authorities would be well advised to maintain the highest standards of prudential regulation of banks and other financial intermediaries – not to prevent their growth, but to prevent their collapse.
…and capital markets The authorities should also look to expand the bond market, as this is naturally a vehicle through which long-term projects should be financed – rather than by bank loans. While regulators have gradually opened up access to the domestic bond market for international investors, the persistence of quotas, the heavy regulatory burden and the absence of the Indian bond market from key indexes reduce the attractiveness of INR bonds to most foreign institutional investors
India’s bond market today, if it were to be included in widely followed indexes, would likely have about a 10% weight. With about USD600bn in dedicated index-following investments globally, this suggests an immediate inflow of USD50-70bn in stable, real money flows to the economy. Foreign participation in the local currency public debt market would also galvanize issuance and trading of local currency corporate debt which is today extremely small at only 2.5% of GDP and less than 6% of the total bond market.
…and more foreign direct investment Just as the ability to compete in international goods markets is an important confirmation that capital has been well invested – and provides an outlet for production beyond what the domestic market could support – the ability to attract international investment not only takes some of the pressure off the banking system to finance investment but also brings with it the promise of best – practice managerial and technological expertise. FDI’s importance to an economy goes far beyond the dollars; there are well-identified spillovers to the behavior of domestic firms (improved technology and management) and wages (foreign firms typically pay higher wages).

1 September 2014
The Wide Angle: India 2020: The Road to East Asia
Page 22 Deutsche Bank AG/Hong Kong
Over the past decade, gross FDI inflows into India have averaged less than 2% of GDP and coincidentally also just under 2% of world FDI flows – about one-third of India’s share of world GDP. This could be expected to at least double as the government’s commitment to a more attractive stance towards foreign capital becomes understood. Truthfully, just as China was too big and too important for multinationals not to be present, the same will be true of India.
Sudden starts/stops? The role of domestic savings is key to the success of this new strategy. Pre-AFC East Asian economies – and many Latin American economies previously -- enjoyed rapid growth, to be sure. But it proved unsustainable because the demand for capital had outstripped the domestic supply, making the whole structure dependent upon foreign capital. Rising US interest rates and a depreciating yen precipitated a withdrawal of foreign capital that revealed the misallocation of much of the previous years’ investments. One of the lessons from the AFC was that current account deficits – an excess of investment over savings – rendered the investment-led growth model vulnerable to external shocks.
So the savings rate is likely to be what determines how fast India can grow. We think there are sound reasons to expect the savings rate will rise – and possibly faster than the investment rate. If so, then growth will be resilient to external shocks. But if the investment growth is associated with a rising current account deficit, then the economy’s growth momentum will likely regularly be disrupted by shocks to global investor sentiment or foreign interest rates. Modest deficits can, of course, be financed from time to time. But we think surpluses – and therefore a much higher domestic savings rate achieved via a reduction in fiscal deficits and an increase in household savings – will be needed to convince investors that growth can be sustained at a higher rate.
Bretton Woods III? More than ten years ago, our colleagues Michael Dooley, David Folkerts-Landau and Peter Garber described the international financial system that emerged from China’s pursuit of the East Asian development model as the “Revived Bretton Woods “system. That system – which soon came to be described as “Bretton Woods II”12-- was characterized superficially by China’s maintenance of an undervalued exchange rate so as to absorb surplus labour into its export sector. But this wasn’t simply vendor financing. The key insight was that the resulting ‘uphill’ flow of capital – China’s accumulation of foreign exchange reserves – was a necessary part of the system as it provided collateral against which foreign investors were prepared to provide FDI to China.
Current account surpluses are a necessary, not accidental, part of the strategy. If India is to truly embrace the same model, this will be its surest sign. Otherwise, the investment needed to finance industrialization will either not be forthcoming or will be less secure, reflected in a widening current account deficit and the consequent risk of capital outflows and crisis as occurred in East Asia in 1997-98.
Global implications Lastly, consider the global implications of India pursuing an export/investment – led growth strategy. In 2004, China had a USD per capita GDP of about USD1,500; today it is over USD7,000. The enormous boost to China’s purchasing power that it derived from the surge in growth from the mid-2000s
12 See “An Essay on the Revived Bretton Woods System, “ Deutsche Bank Global Markets Research, September 2003.

1 September 2014
The Wide Angle: India 2020: The Road to East Asia
Deutsche Bank AG/Hong Kong Page 23
has had profound impacts on the rest of the world, most notably in commodity markets. The commodity ‘super-cycle’ was often little more than an extrapolation of unending growth in Chinese demand and therefore an overly optimistic simplification. But India has today a per capita GDP of about USD1,500, almost as many people as China and is embarking on a similar investment-driven growth strategy. Industrialization implies urbanization – the government embraces the need for more large urban centers – and therefore the potentially the same need for commodities to feed infrastructure and housing demand as China demonstrated. And at the same time, these new urban workers in India will save more and the government will export their savings, depressing global interest rates in the same way China contributed to the tail end of the Great Moderation.
Michael Spencer
+852 2203 8305

1 September 2014
The Wide Angle: India 2020: The Road to East Asia
Page 24 Deutsche Bank AG/Hong Kong
Infrastructure
Executive summary
The NDA government’s proposed strategic transition towards an East Asian model of labor intensive manufacturing growth cannot be achieved without making substantial investments in transportation Infrastructure, which remains woefully inadequate to meet even current needs, leading to time delays and high transaction costs, making Indian manufacturing severely uncompetitive. Various studies on the opportunity cost of India’s inefficient transport infrastructure peg the loss of GDP to transport constraints between almost 2-3.5%. A fast growing, assertive middle class, large-scale mobility of working population to longer distances and growing demographic pressure, will further accentuate India’s transport infrastructure bottlenecks unless the government embarks on an urgent gameplan to build vital transport infrastructure. While transport capacity constraints have been blamed for India’s woeful transport inadequacies we believe that an imbalanced transport mix between rail and roads has played an equally important role in making India’s transport infrastructure inefficient. Over the years, the share of railways in freight transport has fallen steeply from 89% in 1951 to only about 36% by 2008, while the share of road transport has risen to over 50% in the same time period.
In our view India will need a dramatic improvement in transport connectivity together with addressing the skewed transport mode mix, current biased towards roads. In roads, it was been well articulated that road construction will need to rise 5-fold to 30Kms/day from the current 6 kms/day. The Indian Railways will also need to build the capacity to evacuate more than 3x the current traffic of both passengers as well as freight by building high speed dedicated freight corridors and faster trains. Ease of goods and passenger movement will be complemented through passing of the new goods and service tax -which will reduce/replace local tax levies at production centers with direct levies at consumers-closing the leakages in logistic costs, which are currently equivalent to 14% of GDP (amongst highest globally) to less than 7-8%. In our view the combination of improved transport connectivity and simplified, one point collection of taxation will go a long way in implementing the Prime Minister’s vision of ‘Made in India’. Urbanization driven by smart cities/metro trains –will help ease congestion. Considerable progress has been made in fresh awards for metro rails in at least 27 cities of the country in pipelines.
India’s transport infrastructure is severely constrained
High cost of logistics remains biggest challenge for Indian manufacturing India’s manufacturing competitiveness is seriously affected by critical bottlenecks in transport infrastructure and poor logistics management, leading to time delays and high transaction costs. The time taken in inland transport is too long on account of deficiencies in the road network as well as delays at the inter-state borders. The performance of the railways is improving but it is still not possible to have assured transportation of a consignment within a given time frame. Both the vessel turnaround time and vessel waiting time to obtain berth at ports do not measure up to world standards.
India’s transport mix is too highly skewed towards roadways While transport capacity constraints have been blamed for India’s woeful transport inadequacies we believe that an imbalanced transport mix between rail and roads has played an equally important role in making India’s transport

1 September 2014
The Wide Angle: India 2020: The Road to East Asia
Deutsche Bank AG/Hong Kong Page 25
infrastructure inefficient. Over the years, the share of railways in freight transport has fallen steeply from 89% in 1951 to only about 36% by 2008, while the share of road transport has risen to over 50% in the same time period. The reasons for this skew can be attributed to (1) freight revenue has been used by railway ministers to cross subsidize passenger rail fares (2) passenger tariffs have not been raised for populous reasons with India’s passenger tariffs now close to one third of those in China. According to the Indian planning commission, even adjusted for purchasing power parity they are far below amounting to the equivalent of only 37% of tariffs in China. Freight tariffs correspondingly in China are only 72% of the tariffs in India.
Indian Railways has a total track length of 113,611km. Of this, 88% of tracks are on concrete sleepers and 78% are Continuously Welded Rail (CWR) track. With a legacy of political populism, line capacity has been severely constrained due to the introduction of more and more trains over the years. The high-density integrated routes account for about 28% of the total IR route kilometers and 76% of the total freight (71% of the total passenger plus freight). On high-density routes, the capacity utilization is now greater than 100%. These issues have further exacerbated the shift in freight from railways to roads. On account of stretched capacity, freight movement in India is currently rationalized with the highest in priority accorded to Food grains/oil/coal, making track virtually not available for other bulk and container shipments. Constrained capacity also leads to slower speeds. Average speed of a freight train in India is 25kms per hour, almost half the speed of freight trains in other countries.
The skewed rail –road mode mix is also highly energy inefficient. %. We estimate that a 10% higher movement in freight through railways could save India 20% of its current diesel consumption and 10% lower Oil- which could have a significant impact on a country reliant on imports for its fossil fuel requirements..
Figure 16: Utilisation levels in key railway routes are alarmingly high
Delhi Howrah Link: (1444 kms) CU is 112% Route Capacity: 148 rakes/day
Critical paths (567 kms) CUs are 113% to 163%
Delhi Guwahati Link: (1483 kms) CU is 80% Critical paths (492 kms) CU is 100% to 139%
Mumbai Howrah Link: (1966 kms) CU is 105%Route Capacity (Kolkata-Bina): 99 rakes/dayCritical paths (943kms) CUs are 107% - 142%
Delhi Mumbai Link: (1371 kms ) CU is 83%Route Capacity: 108 rakes/day
Critical paths (696 kms) CU is 107-127%
Mumbai Chennai Link: (1630 kms) CU is 99%Route Capacity: 189 rakes/day
Critical Paths (339 kms) CU is 112% to 145%
Delhi Chennai Link: (2045 kms) CU is 104%Critical paths (1318 kms) CU is 126-163%
Delhi
Guwahati
Kolkota
Chennai
Mumbai
Howrah Chennai Link: (1003kms) CU: 85%Route Capacity: 75 rakes/ day
Source: Deutsche Bank, Indian Railways
Resulting in ports operating below par Rail-road challenges have resulted in serious constraints in all ports in India

1 September 2014
The Wide Angle: India 2020: The Road to East Asia
Page 26 Deutsche Bank AG/Hong Kong
Figure 17: Rake availability is causing a serious constraint Coal Capacity (mt) Rake requirement/day Current Rake
availability
FY12 FY17 FY12 FY17
Mundra 60 80 31 30 17
Ennore 21 29 12 14
Paradip 20 24 12 14 9
Dhamra 12 12 7 7 4
Krishnapatnam 8 28 4 9 6
Gangavaram 5 15 3 9 5
Karaikal 4 18 3 11 3
Others 31 99 16 44 36
Total 161 305 88 137 80Source: Deutsche Bank
Figure 18: Constraints in Ports
4
7
10
13
16
3.0
3.5
4.0
4.5
5.0
FY02 FY04 FY06 FY08 FY10 FY12 FY14
Ports average turnaround time (days)
Average pre-berthing detention time (Hours) - RHS
Source: Ministry of Shipping, Indian Ports Association, Deutsche Bank
Endeavours of the new government to augment transport infrastructure
The NDA government has made infrastructure development a key economic priority. In its first economic survey, released in July it said “stepping up infrastructure investment, improving productivity and quality of infrastructure spending, removing procedural bottlenecks, improving governance and above all, maintaining consistency in government’s infrastructure policies are some of the issues that need to be urgently addressed.
1 September 2014
The Wide Angle: India 2020: The Road to East Asia
Deutsche Bank AG/Hong Kong Page 27
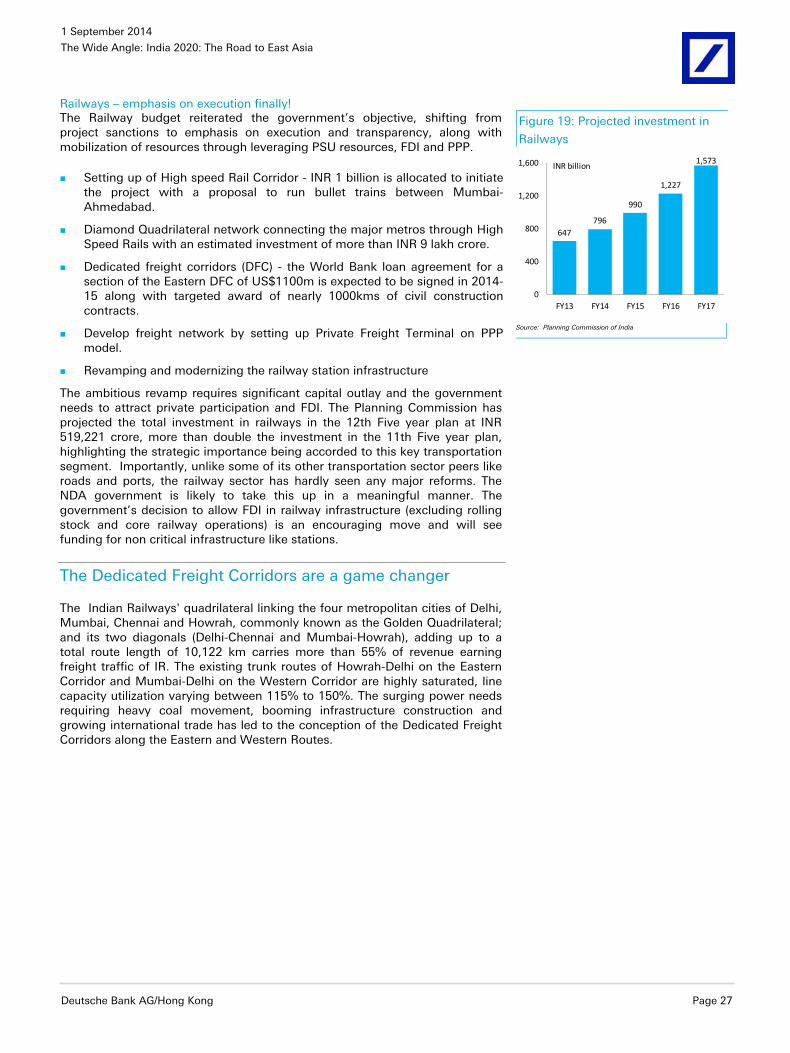
Railways – emphasis on execution finally! The Railway budget reiterated the government’s objective, shifting from project sanctions to emphasis on execution and transparency, along with mobilization of resources through leveraging PSU resources, FDI and PPP.
Setting up of High speed Rail Corridor - INR 1 billion is allocated to initiate the project with a proposal to run bullet trains between Mumbai-Ahmedabad.
Diamond Quadrilateral network connecting the major metros through High Speed Rails with an estimated investment of more than INR 9 lakh crore.
Dedicated freight corridors (DFC) - the World Bank loan agreement for a section of the Eastern DFC of US$1100m is expected to be signed in 2014-15 along with targeted award of nearly 1000kms of civil construction contracts.
Develop freight network by setting up Private Freight Terminal on PPP model.
Revamping and modernizing the railway station infrastructure
The ambitious revamp requires significant capital outlay and the government needs to attract private participation and FDI. The Planning Commission has projected the total investment in railways in the 12th Five year plan at INR 519,221 crore, more than double the investment in the 11th Five year plan, highlighting the strategic importance being accorded to this key transportation segment. Importantly, unlike some of its other transportation sector peers like roads and ports, the railway sector has hardly seen any major reforms. The NDA government is likely to take this up in a meaningful manner. The government’s decision to allow FDI in railway infrastructure (excluding rolling stock and core railway operations) is an encouraging move and will see funding for non critical infrastructure like stations.
The Dedicated Freight Corridors are a game changer
The Indian Railways' quadrilateral linking the four metropolitan cities of Delhi, Mumbai, Chennai and Howrah, commonly known as the Golden Quadrilateral; and its two diagonals (Delhi-Chennai and Mumbai-Howrah), adding up to a total route length of 10,122 km carries more than 55% of revenue earning freight traffic of IR. The existing trunk routes of Howrah-Delhi on the Eastern Corridor and Mumbai-Delhi on the Western Corridor are highly saturated, line capacity utilization varying between 115% to 150%. The surging power needs requiring heavy coal movement, booming infrastructure construction and growing international trade has led to the conception of the Dedicated Freight Corridors along the Eastern and Western Routes.
Figure 19: Projected investment in
Railways
647796
990
1,227
1,573
0
400
800
1,200
1,600
FY13 FY14 FY15 FY16 FY17
INR billion
Source: Planning Commission of India

1 September 2014
The Wide Angle: India 2020: The Road to East Asia
Page 28 Deutsche Bank AG/Hong Kong
Figure 20: Upgraded Design Features
Feature Existing On DFC
Moving Dimensions
Height
7.1 m for Western DFC
5.1 m for Eastern DFC
Width
Container Stack
Single Stack
Double Stack
Train length
Train Load
Source: Government of India
Dedicated Freight Corridors are proposed to adopt world class and state-of-the-art technology. Significant improvement is proposed to be made in the existing carrying capacity by modifying basic design features. The permanent way will be constructed with significantly higher design features that will enable it to withstand heavier loads at higher speeds. Simultaneously, in order to optimize productive use of the right of way, dimensions of the rolling stock is proposed to be enlarged. Both these improvements will allow longer and heavier trains to ply on the Dedicated Freight Corridors.
With the DFC taking shape, new corridors will reverse the trend of freight being transferred to roads, as the railways would be able to offer faster and cheaper transportation. Carrying load through rail is more efficient than roads. For instance, on rail, one freight with 59 wagons and one electric engine of 5,000-6,000 Hp, carries ~4,600 tonnes, whereas on road the same amount would require 400 trucks, with each having a 150 Hp engine and carrying a 10-tonne load.
Assuming a 35% improvement in fuel efficiency with the DFC, we believe that future energy demand will be far lower than without the DFC scenario. Without the DFC, demand for diesel is expected to rise almost five times between FY17 and FY47, as the economy would increase its reliance on freight movement by road considering the railway capacity is already saturated.

1 September 2014
The Wide Angle: India 2020: The Road to East Asia
Deutsche Bank AG/Hong Kong Page 29
Figure 21: Fuel savings from DFC 2016-17 2021-22 2026-27 2031-32 2036-37 2041-42 2046-47
Total Annual Freight Traffic (in Billion NTKM)
With DFC 218 295 362 426 498 595 701
5 year CAGR growth
Without DFC
Rail 152 166 171 179 186 184 179
5 year CAGR growth 1.8 0.6 0.9 0.8 -0.3 -0.5
Road 70 130 182 232 289 368 469
5 year CAGR growth 13.2 6.9 5.0 4.5 5.0 5.0
Total annual future energy requirements by type of fuel
With DFC
Diesel (M. Litres) 0 0 0 0 0 0 0
Electricity (M. KWh) 1622 2195 2690 3166 3702 4424 5216
Without DFC
Diesel (M. Litres) 1237 2002 2646 3318 3932 4869 6109
Electricity (M. KWh) 764 893 961 921 1278 1387 1395Source: Deutsche Bank
What else could the government do for railways to augment investments?
Operational changes: Develop hub and spoke system for passenger traffic similar to Swiss rail model. Long distance trains should stop at very few stations. These few stations should have regional connectivity with trains which travel for less than 200 kms. This would ensure timeliness of service and proper passenger charges.
Attracting REIT or Infra Investment trust capital for service providers who could aggregate various carriage services. Adani Port has successfully demonstrated that once they build the track and gave it to Railways to run it, the track as well as railways start getting significant returns on this track. Adani Port has also benefitted as they could use this track for freight movement from their own port. A lot of these last mile connectivity routes could be aggregated by REIT investments and there could be good appetite for the same.
Financial Side: Government could set up a rail regulator which can segregate the content and carriage charges of the Indian railways. Carriage charges should be a mark up on investments, while traffic content could be privatized and one should use competition for price discovery and attract capital as demand in India is quite high. This would attract a lot of investments.
Asset sale monetisation: Railways have a lot of prime property in various cities. They have not used FSI. They should construct and sell these properties or else sell FSI to builders. This could be through auction and attract lot of capital
Increased focus on road infrastructure to 30kms/day build out- a five fold increase
The total projected investment in roads and bridges in the 12th Five year plan is INR 914,537 crore, more than double the investment in the 11th plan, highlighting the significance of road infrastructure. In Jun-14 the ministry has approved INR 40,000 crore worth of projects.

1 September 2014
The Wide Angle: India 2020: The Road to East Asia
Page 30 Deutsche Bank AG/Hong Kong
Figure 22: Projected Investment in Roads and Bridges
1,5051,645
1,8041,982
2,210
0
500
1,000
1,500
2,000
2,500
FY13 FY14 FY15 FY16 FY17
INR billion
Source: Planning Commission of India
NHAI plans to clear bottlenecks The new government plans to fast track projects and clear bottlenecks to ensure effective project execution. NHAI is planning to change the model concession agreement (MCA), which specifies contract rules for road projects, in a bid to achieve flexibility in sync with the market conditions. Further, NHAI’s move to reschedule the premium that developers of road projects have to pay for bagging road projects on a build-operate-transfer basis will facilitate faster completion of the stalled projects and help companies service the debt. The ministry of road transport and highway has targeted to build 30kms of road per day from 2016 onwards.
Port Capacity set to increase, but improvement in ship turnaround time is critical
The National Maritime Agenda (2010) envisioned that the capacity of ports in India is projected to increase to 3,130 million tonnes by FY20, increasing at a CAGR of 13.0% since FY12. In this period, cargo traffic growth is expected to grow at a CAGR of 13.4%, mainly driven by 17.4% CAGR in cargo traffic at non-major ports. The proposed capacity addition will ease congestions at Indian ports where the average turnaround time was about 3 days in 2013 compared with about 1 day in Singapore and Shanghai.
We believe the main growth drivers for cargo traffic are likely to be coal and crude oil given India’s growing energy demand. The new government’s plan to boost economic growth will benefit the port sector. Further, sustained recovery in global markets especially US and Europe will augur well for Indian ports.

1 September 2014
The Wide Angle: India 2020: The Road to East Asia
Deutsche Bank AG/Hong Kong Page 31
Figure 23: India port cargo traffic and capacity projection 2011-12 2016-17 2019-20
Major ports
Cargo 560 1032 1215
Capacity 697 1328 1460
% utilisation 80% 78% 83%
Non-major ports
Cargo 354 988 1280
Capacity 483 1264 1671
% utilisation 73% 78% 77%
Total
Cargo 914 2019 2495
Capacity 1180 2592 3130
% utilisation 77% 78% 80%Source: Ministry of Shipping
Focus on reforms and modernisation The new government plans to modernise existing ports and also develop new world class ports. There are 43 modernisation projects under implementation at an estimated cost of about Rs. 12,000 crore which are expected to add about 220 million tonnes capacity on their completion.
The total projected investment in ports in the 12th plan is INR 197,780, more than quadrupling the investment during the 11th. In 2013, the government deregulated port tariffs. Following this, the government awarded bids for 30 ports in FY14 worth $3.4 billion, adding 217.6 million metric tons capacity.
Figure 24: Projected Investment in Ports
187255
353
491
693
0
200
400
600
800
FY13 FY14 FY15 FY16 FY17
INR billion
Source: Planning Commission of India
Evacuation constraints issue is the key issue at hand
Railway and road connectivity to the key industrial clusters plays a crucial role in ensuring the timely evacuation of materials. While major ports have historically had access to the main road and rail networks, they have been constrained by a lack of land availability and clearances to expand this support infrastructure to cater to the growth in traffic. Data over the past decade from major ports suggest that this investment has lagged at the major ports, leading to evacuation and the turnaround time constraints. This has become the key differentiating factor across the port assets in the country.

1 September 2014
The Wide Angle: India 2020: The Road to East Asia
Page 32 Deutsche Bank AG/Hong Kong
Turnaround times have deteriorated across most ports – particularly at major ports
Figure 25: Evacuation constraints have largely led to the
sharp dip in port productivity levels at major ports over
the last decade…
Figure 26: : ….resulting in a gradual but sure shift to the
minor ports capturing a bulk of the 6% CAGR traffic
growth in last decade
4
7
10
13
16
3.0
3.5
4.0
4.5
5.0
FY02 FY04 FY06 FY08 FY10 FY12
Ports average turnaround time (days)
Average pre-berthing detention time (Hours) - RHS
0
200
400
600
800
1,000
1,200
FY02 FY04 FY06 FY08 FY10 FY12 FY14
Major Ports
Minor Ports
mn tonnes
Source: Planning Commission of India, Indian Ports Association, Deutsche Bank Source: Planning Commission of India, Indian Ports Association, Deutsche Bank
For the new and upcoming minor ports, the challenge is to get connectivity to the existing railway lines. One of the solutions is to tender these contracts to a private developer who, at his own cost, builds, owns, operates and then transfers the railway asset to the Indian railways or develops the lines through an SPV or JV with the Indian Railways. However, it remains to be seen how many private developers will take this route.
Other areas of Infrastructure development
Metro Rail With increasing urbanization, the demand for more efficient mass public transport systems such as Metro Rail is growing rapidly. The Ministry of Urban Development has decided that cities with a population of more than 20 lakhs will have Mass Rapid Transit System (MRTS). Around INR 300,000 crore has been committed for setting up or expanding metro and monorail systems in 20 cities across India. India will be one of the biggest markets for urban rail transportation and is likely to attract more global and local private players to participate and invest across the value chain.
Smart Cities The government plans to build smart cities across the country using the latest technology and infrastructure, integrated waste management and advanced transport system. The government has allocated INR 7,060 crore for 100 smart cities. The plan provides a fillip to infrastructure development, housing and employment.
Water According to National Commission on Integrated Water Resources Development, the total water demand in India is projected to increase by 19% by 2025, and 66% by 2050. The High Powered Expert Committee Report on Indian Urban Infrastructure and Services pegs the total capital investment needed for infrastructure in the water, sewerage and storm-water sector at INR7.55trillion over the next 20 years.
Manish Saxena
+91 22 7180 4034
Chockalingam Narayanan
+91 22 7180 4056

1 September 2014
The Wide Angle: India 2020: The Road to East Asia
Deutsche Bank AG/Hong Kong Page 33
Power and Renewables
Executive summary – Roadmap for 2020
The Indian power sector has outlived the first generation of reforms started in 2003, and is today crucially awaiting its second generation of reforms. Power generation de-licensing, now needs to be followed through with de-licensing of resources and retail power distribution. We welcome the Government's strategic intent to achieve 24x7 power availability. Given the successful implementation of this target in Gujarat, we do not see why this cannot be replicated across the country progressively, albeit with considerable effort.
We reckon that apart from re-starting stalled projects, an additional 100GW of power generation capacities are required to meet burgeoning power demand by 2020 as India embarks upon an era of manufacturing led-growth, driving an increase in its power demand multiplier to a range of 1-1.2x from 0.8x currently. We estimate an additional need for 310 mn tonnes of coal annually to fuel the existing and new capacities for meeting power demand growth of 8-9% by 2020. Alleviating coal supply shortfalls will remain critical to India’s energy security and will need innovative solutions including enlarged private sector participation in coal mining. We believe that de-bottlenecking fuel constraints should be the highest priority for the government in the immediate term followed by a progressive focus on unleashing the second generation of reforms.
Once the pending issue of strangulated fuel supply is addressed we expect the policy focus to shift to- (1) a strategic thrust on Decentralized Renewable Energy, (2) Expanding grid capacities through transmission highways, (3) Expanding the Private Public Partnership footprint in Distribution by amending the Electricity Act to separate Supply and Wires business, and (4) building long-term Energy security through development of 3rd generation of Nuclear Power technology.
Last decade was one of de-licensing of Power generation
The foundation for private sector participation in the power sector was laid through the Electricity Act 2003, which was introduced by the erstwhile NDA government (1998-2004). Power generation was de-licensed, along with distribution and trading, and Government permitted captive generation. India has added 55GW of power generation capacity over last 3 years and could add an additional 45GW in next two years. Open-access was introduced in the Electricity Act providing a significant fillip to private sector participation in the sector. The success of de-licensing is demonstrated by fact that the private sector accounted for over 54% of capacity additions during the 2008-2014 period.

1 September 2014
The Wide Angle: India 2020: The Road to East Asia
Page 34 Deutsche Bank AG/Hong Kong
Figure 27: Private sector participation in generation capacity addition (MW)
0.0%
20.0%
40.0%
60.0%
80.0%
0
4,000
8,000
12,000
16,00020
00-0
1
2001
-02
2002
-03
2003
-04
2004
-05
2005
-06
2006
-07
2007
-08
2008
-09
2009
-10
2010
-11
2011
-12
2012
-13
2013
-14
MW
Private sector Capacity Additions (MW)
Contribution of private sector to total capacity addition (%)
Source: Deutsche Bank, Ministry of Power Annual Reports, CEA
However, fuel availability constraints came to the fore Domestic coal availability- which has been a legacy challenge for India - mothballed into a full blown crisis following the impressive private sector led capacity addition in power generation. Despite high reserves of 58 bn tonnes, India has to import USD 15 bn of imported coal to meet its burgeoning demand. The severity of the crisis is gauged from the fact that close to 36GW of installed capacity, equivalent to 16% of India’s total installed capacity is running at sub optimal capacity utilization rates on account of coal constraints.
These constraints could become even more severe if power demand were to increase to 8-9% versus flat growth last year. India’s average power elasticity to GDP stands at 0.8x and with a manufacturing revival led GDP recovery over next five years, we believe that domestic coal availability issues must be urgently addressed. Other conventional power generation capacities have not kept pace with demand and their proportion has reduced considerably. Hence, dependence on coal based generation could be even higher in the near-to mid-term.
Figure 28: New capacity addition peaking in FY15e Figure 29: Coal Deficit likely in FY16-17
0
5,000
10,000
15,000
20,000
25,000
30,000
100,000
150,000
200,000
250,000
300,000
350,000
FY03
FY05
FY07
FY09
FY11
FY13
FY15
E
FY17
E
FY19
E
Addition (RHS) Capacity (LHS)
0
200
400
600
800
1000
FY11 FY12 FY13 FY14 FY15E FY16E FY17E
Su
pp
ly /
Dem
and
(In
dia
n c
oal
eq
uiv
alen
t)
Domestic Supply in Indian coal equivalent Imports
(7) (7)
7 7
(7)
(22)
(39)
-60
-40
-20
0
20
Co
al S
urp
lus
/ (D
efic
it)
Demand in Indian coal equivalent Surplus / (Deficit) RHS
Source: CEA, Deutsche Bank estimates Source: Deutsche Bank

1 September 2014
The Wide Angle: India 2020: The Road to East Asia
Deutsche Bank AG/Hong Kong Page 35
State Distribution Utilities did not reform, and deteriorated The financial health of the State distribution companies, popularly known in India as State Electricity Boards (SEBs) has deteriorated considerably with aggregate annual losses for all SEB’s (without subsidies) peaking at INR 928.45 bn in 2011-12. Political compulsions have led to significant lag in effecting tariff increases to offset rising power costs, with certain Indian states not having revised power tariffs for more than five years in succession. The inability to enforce financial discipline has therefore been a drag on the power sector, as weaker SEBs are unable to purchase power at market rates, thereby impacting PLFs and dampening ROEs for generators.
However, we are enthused by the recent bout of positivity around the financial situation of SEBs. Continuing high-levels of transmission and distribution losses seem to be getting the attention of policy-makers. The annual review of the State Electricity Boards by the Planning Commission (PC) projected reduction in losses for state distribution utilities by 50% in FY14E over FY12 to INR 311bn. This is driven by the PC’s assumption that cost would remain flat in FY14 vs. FY13 while revenues could increase 22/ 25% respectively for FY13 and FY14. Average tariffs for India are expected by the PC to increase by 13% and 9% for FY13 and FY14 respectively.
Additionally, the Financial Restructuring Package (FRP) for state distribution companies, formulated last year seems to be helping. The program involved participation from eight states with outstanding liabilities of INR1.6tr. Four states – Tamil Nadu, Uttar Pradesh, Rajasthan and Haryana – have finalized the FRP scheme with INR1.0tr liabilities. The program could lead to a ~INR 74bn reduction in interest costs when State Governments take over the bonds.
Figure 30: Losses have peaked in 2011-12
(248)(305)
(516)(626)
(514)
(311)
(1,000)
(800)
(600)
(400)
(200)
-2008-09 2009-10 2010-11 2011-12 2012-13RE 2013-14AP
Loss Loss without subsidy Interest Cost(INR bn)
Source: Planning Commission, Deutsche Bank Note- RE – Revised Estimates by Planning Commission AP – Advance Projections by Planning Commission
Where is the opportunity?
Real Demand is depressed Demand growth in India will be contingent on a pick-up in industrial and manufacturing growth. The electricity demand multiplier (reflecting the elasticity of electricity demand to GDP growth) had dropped in the last decade, possibly reflecting the services-led growth story which played out in the country over 2001-2011. Benchmarking with Asian peers which have been manufacturing-led recovery plays in the last decade, we see electricity demand multiplier trending up to 1.0-1.2x over the next five years.

1 September 2014
The Wide Angle: India 2020: The Road to East Asia
Page 36 Deutsche Bank AG/Hong Kong
In spite of a healthy rise in per capita consumption of electricity in India, it continues to remain at abysmally low levels when compared to global peers. To contrast, Bihar per capita consumption of electricity is lowest at 134 whereas Industrial states like Gujarat and 100% connected states like Punjab consumption is 1663 and 1799 respectively. With a manufacturing-led recovery in sight and 100% electrification target by 2017, we could see significant upsides to per capita consumption of electricity in India closer to the World average of 2400 units over the next five years.
Figure 31: Electricity Demand Multiplier Figure 32: Per Capita Consumption (kWh) - 2010
11% 15%
-15%
30%
-1%
-43%
17%
-50%
-35%
-20%
-5%
10%
25%
40%
0.4x
0.6x
0.8x
1.0x
1.2x
1.4x
1.6x
Chi
na
Indo
nesi
a
Indi
a
Sou
th K
orea
Mal
aysi
a
Sin
gapo
re
Thai
land
1985-2011 2001-2011 10 yr avg premium/(discount) to 25 yr avg
0
2000
4000
6000
8000
10000
12000
14000
16000
Cana
da
USA
Aus
tral
ia
Kore
a
Japa
n
Fran
ce
Ger
man
y
Russ
ia UK
Italy
Sout
h A
fric
a
Chin
a
Wor
ld
Braz
il
Indi
a
Source: RBI, CEA Source: CEA
Mix of generation capacity is largely focused on coal Two key highlights stand out while analyzing changes in the generation mix over the last 24 years – (1) Decreasing contribution of hydro-electric power – driven by absence of large-scale capacity build-up and (2) excessively high- dependence on coal based power generation. Contribution from renewable energy sources – which is currently low, needs to be increased urgently.
From a demand perspective, a rising middle class population has driven an increase in domestic consumption while industrial demand has grown a mere 4.2% over 1985-2013. Hydro and Gas based generation is important for an economy to cater to the varying peak load requirements, whereas India has focused largely on meeting base-load requirements through coal- based power generation.
Figure 33: Segment-wise breakdown of generation
sources – Coal generation has expanded significantly
Figure 34: Segment-wise breakdown of demand –
Industrial and domestic demand led growth
Hydro Coal Gas Diesel Nuclear RES
2014
1990
0
100,000
200,000
300,000
400,000
500,000
600,000
700,000
800,000
900,000
1985 1990 1997 2002 2007 2012 2013
GW
h
Domestic Commercial Industrial Traction Agriculture
Source: CEA Source: CEA

1 September 2014
The Wide Angle: India 2020: The Road to East Asia
Deutsche Bank AG/Hong Kong Page 37
Transmission investments have lagged generation A large part of the new power generation capacity is operating at low utilization levels. While fuel shortages have been blamed, we believe that legacy under-investments in transmission capacity are equally responsible for the woes facing the sector. Inadequate inter-regional connectivity has resulted in keeping bottling up of the power in fuel-resource regions and could not transmitted to Northern and Southern India which face chronic shortages. Inter-regional grid capacity addition has remained behind schedule, and below the requirements. We believe that there is gross under-capacity in inter-regional capacities especially for a country like India where fuel resources are geographically constrained to few states while demand-centers are scattered over a far wider locus of 1,000-1,500km. About 40% of capacity proposed to be built in the 12th Plan (2012-17) is in five central Indian States, which have coal resources. The 12th Five Year Plan has proposed to focus on improving grid connectivity and has provided an outlay of USD 97 bn for transmission and distribution capacity expansion.
Figure 35: Comparison of Transmission and Generation
Capacity Addition
Figure 36: Investments in Transmission and Distribution
(USD bn)
3%
4%4%
6%6% 5%6%
11%
0%
2%
4%
6%
8%
10%
12%
1992-1997 1997-2002 2002-2007 2007-2012
Transmission Build up ('000 circuit kms) - CAGR %
Installed Capacity (MW) - CAGR (%)
928 3614
5761
0
20
40
60
80
100
10th Plan 11th Plan 12th Plan
Source: Deutsche Bank , CEA, Source: Deutsche Bank, CEA
Enablers for the big future
APDRP requires strict implementation for 100% metering We expect the momentum to continue for the Restructured Power Development Reforms Program (R-APDRP) into the Twelfth Five Year Plan (2012-2017). As a reminder, the program was launched in 2002-03 (and subsequently restructured in 2008) to facilitate government support for projects intended to reduce Aggregate Technical & Commercial (AT&C) losses. The Power Ministry’s Report on The Working Group on Power for Twelfth Plan had called for a strengthening of this scheme, with an estimated total fund requirement of INR 158.7bn and a grant amount of INR 99.24bn. An additional positive could be if the scheme is extended to private distribution companies as well, which we believe will only be contingent on the success of the projects in the pipeline.

1 September 2014
The Wide Angle: India 2020: The Road to East Asia
Page 38 Deutsche Bank AG/Hong Kong
Figure 37: APDRP – Current Progress Figure 38: Historic Trend in AT&C Losses (%)
Grant Objective Progress
Part-AEstablishing IT systems for data monitoring
1,401 projects at estimated cost of INR 51.76 bn approved for 29 States/Uts; INR 15.12bn disbursed
Part-BRenovation and modernization of T&D infrasturcture
907 projects at estimated cost of INR 193.67bn approved for 15 States and INR 22.91 bn have been disbursed
32.5%
34.8%34.3%
33.0%
30.6% 29.5%
27.7%27.2%
26.0%27.0%
25%
27%
29%
31%
33%
35%
37%
FY03 FY04 FY05 FY06 FY07 FY08 FY09 FY10 FY11 FY12
Source: Deutsche Bank, Government of India – Ministry of Power Source: Deutsche Bank, Government of India – Ministry of Power
‘Jyotigram’ Feeder Separation Scheme – potential to curb losses Gujarat implemented the Rural Feeder Segregation Scheme, popularly known as the ‘Jyotigram Scheme’ with an objective for 100% metering and reducing agricultural losses and subsidies. Under the scheme, it bifurcated transmission lines catering to rural areas for households and agricultural purposes. It helped the state in mapping and controlling the power supply to heavily subsidised agri consumers from residential consumers, who have to pay normal domestic tariffs. Whereas Agri consumers get a few fixed hours of regular single phase supply, residential consumers are supplied 24x7 power at regular tariffs. The benefit of feeder separation is that it eliminated the diversion of subsidised power for household use, a key reason for losses historically.
Maharashtra also demonstrated successful implementation of feeder separation. Typically, losses are hidden (under-reported) under the un-metered agricultural power supply by a few state distribution companies. Hence, metering of all subsets of power is absolutely necessary to arrest high T&D losses in the country.
Vision 2020 – Aim for 24x7 power supply
Decade of de-licensing of generation needs to be followed-up with a decade of de-licensing of resources and distribution Power Ministry has articulated a vision of 24x7 power availability, and yet expect tariffs to remain reasonable for the end consumers Power Ministry vision is achievable, but will require concerted effort to work with States- power being a concurrent subject.
We highlight six strategies that have the potential to meet the desired objectives of 24x7 power for India. Reasonable power rates depend upon the bulk cost of energy. We believe that India could have surplus power if PPP in resources and logistics sectors, coupled with a conscious de-politicization of distribution companies (privatization) could be achieved in the current decade. while the former two objectives look achievable, the latter, which relies on a relinquishing of State control looks far more difficult.
1. Increase through-put for power generation projects to improve efficiency
India has added 95GW power generation capacity over last 5 years, increasing installed capacity by ~65%. Reserve margin is adequate in comparison to other countries if one looks at the peak demand.
Typically, losses are hidden
(under-reported) under the
un-metered agricultural
power supply by a few state
distribution companies

1 September 2014
The Wide Angle: India 2020: The Road to East Asia
Deutsche Bank AG/Hong Kong Page 39
However, Indian power generation capacities are operating at lower utilization rates (64% in FY2013-14) and power mix is skewed towards base-load (68% coal projects). Consequently, the throughput (or load factors – PLF) of power generation projects need to be raised. It will not only help reduce power shortages, but also improve fuel consumption efficiency. Efficiencies have deteriorated by 20% to 0.68 kg/kWh over last 8 years due to decline in utilization rates, despite deploying superior super-critical technology.
Figure 39: Reserve margins for power generation
17% 15%
32%
8%
23%
76% 76%
0%
10%
20%
30%
40%
50%
60%
70%
80%
US (Summer
2012)
Thailand Malaysia Korea Taiwan -2012
Singapore India
Source: Deutsche Bank, 2013 data; EIA; CEA; KEEI; MOE Thailand; Energy commission, Malaysia; The Bureau of Energy, Taiwan; EMA, Singapore
2. Addressing fuel shortages is very critical-
Thermal capacity addition has been handicapped by a lack of coordination between the ministries of coal and power. There are large gaps between required and available coal supply. Coal India’s inability to supply the amount required implies a need to review and re-optimize the allocation of coal linkages and rely on imports in the interim.
Our assessment suggests that India needs to address its coal supply deficit urgently, not only to reduce import dependence but also to provide uninterrupted power to fuel a growing economy. If power demand grows by 8%, ~240 mn tonnes of incremental coal will be required by 2020, yet power shortages will remain. However, if power shortages need to be eliminated, ~310mn tones of incremental coal supplies will be required.
For expanding coal availability, we believe the following are necessary (1) streamline clearance process for coal mines of CIL and captive coal blocks (2) attract global mining developers and operators and (3) augment loading and transportation infrastructure. Additionally, private sector could be incentivized to transfer additional production over and above approved plans to be diverted to other power companies at regulated prices. This would however require the appointment of a Coal regulator.

1 September 2014
The Wide Angle: India 2020: The Road to East Asia
Page 40 Deutsche Bank AG/Hong Kong
Figure 40: Projected coal demand in India for power projects
INDIA 2014
Capacity – 245 GW
Coal – 145 GW
Coal consumption –488 mn tonnes
(79 mn t imported)
INDIA 2020
Capacity – 340 GWCoal – 214 GW
Demand 6-8%Additional coal–240 mn tonnes
Demand 8%Additional coal–310 mn tonnes
Source: Deutsche Bank estimates, CEA data
3. Correcting fuel-mix to meet peaking demand - India’s fuel mix is highly dependent on coal which constitutes 60% of capacities but 75% of generation underscoring the highly skewed reliance on one fuel source. Gas projects are grossly under-utilized due to lack of fuel availability. In fact, world over, peaking power is catered to by hydro and gas power projects, which are inadequately underutilized in India. However, renewables and nuclear power could have strategic importance for long-term energy security in India, given the limited availability of fossil fuel.
Renewables have a huge potential in meeting peaking demand, but the output is erratic. Per unit cost for renewable energy sources have reduced, but is still away from grid parity with conventional energy sources. Increase in coal costs and/or technological innovations can help reduce Solar tariffs- reduced over last 3 years from ~INR 15 to INR 6.7 (US$ 0.11/kWh) in recent bids. Equipment costs have declined by 50% in last 3 years and domestic equipment manufacturers’ are losing money largely due to equipment dumping from China.
Figure 42: Cost and Operational comparison of various energy sources Coal -
Domestic Coal -
ImportedCoal - 70% domestic,
30% Imported
Gas Hydro Nuclear Wind Solar in 2012
Solar in 2014
Construction period 4-5years 4-5years 4-5years 3-4years 6-8years 6-8years 1-2years 1-2years 1-2years
Project cost INR mn/MW 70-75 70-75 70-75 45-50 85-105 100-120 65-70 85-120 75-90
Utilization Rate (PLF) % 80 80 80 60 55 80 28 19 22
Units/MW MU 7.0 7.0 7.0 5.3 4.8 7.0 2.5 1.7 1.9
Tariffs
Energy Cost INR / kWh 1.58 2.32 1.88 2.93 - 0.90 - - -
Fixed Cost INR / kWh 2.40 2.35 2.30 1.64 5.20 3.72 4.98 10.16 7.31
Total Tariff INR / kWh 3.98 4.67 4.18 4.57 5.20 4.62 4.98 10.16 7.31Source: Deutsche Bank
Figure 41: Fuel mix highly skewed
17% 14%
60%75%
9%4%
12% 3%
Capacity Generation
Renewable
Nuclear
Gas
Coal
Hydel
Source: Deutsche Bank, CEA
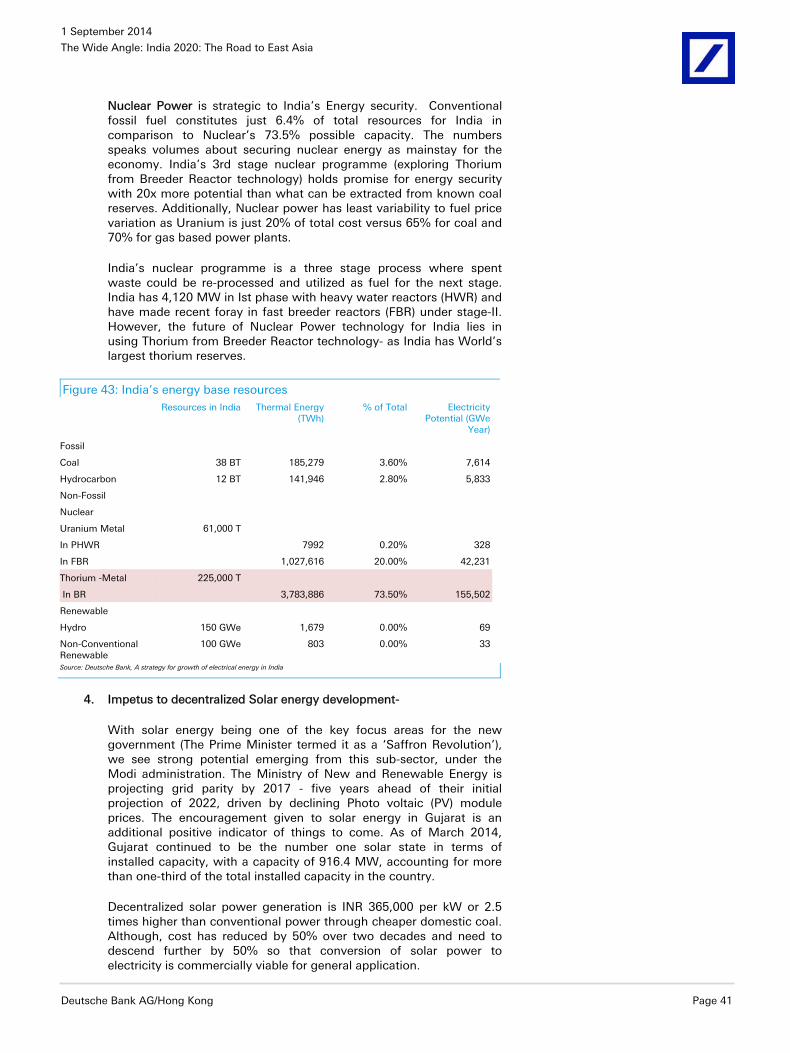
1 September 2014
The Wide Angle: India 2020: The Road to East Asia
Deutsche Bank AG/Hong Kong Page 41
Nuclear Power is strategic to India’s Energy security. Conventional fossil fuel constitutes just 6.4% of total resources for India in comparison to Nuclear’s 73.5% possible capacity. The numbers speaks volumes about securing nuclear energy as mainstay for the economy. India’s 3rd stage nuclear programme (exploring Thorium from Breeder Reactor technology) holds promise for energy security with 20x more potential than what can be extracted from known coal reserves. Additionally, Nuclear power has least variability to fuel price variation as Uranium is just 20% of total cost versus 65% for coal and 70% for gas based power plants.
India’s nuclear programme is a three stage process where spent waste could be re-processed and utilized as fuel for the next stage. India has 4,120 MW in Ist phase with heavy water reactors (HWR) and have made recent foray in fast breeder reactors (FBR) under stage-II. However, the future of Nuclear Power technology for India lies in using Thorium from Breeder Reactor technology- as India has World’s largest thorium reserves.
Figure 43: India’s energy base resources Resources in India Thermal Energy
(TWh) % of Total Electricity
Potential (GWe Year)
Fossil
Coal 38 BT 185,279 3.60% 7,614
Hydrocarbon 12 BT 141,946 2.80% 5,833
Non-Fossil
Nuclear
Uranium Metal 61,000 T
In PHWR 7992 0.20% 328
In FBR 1,027,616 20.00% 42,231
Thorium -Metal 225,000 T
In BR 3,783,886 73.50% 155,502
Renewable
Hydro 150 GWe 1,679 0.00% 69
Non-Conventional Renewable
100 GWe 803 0.00% 33
Source: Deutsche Bank, A strategy for growth of electrical energy in India
4. Impetus to decentralized Solar energy development-
With solar energy being one of the key focus areas for the new government (The Prime Minister termed it as a ‘Saffron Revolution’), we see strong potential emerging from this sub-sector, under the Modi administration. The Ministry of New and Renewable Energy is projecting grid parity by 2017 - five years ahead of their initial projection of 2022, driven by declining Photo voltaic (PV) module prices. The encouragement given to solar energy in Gujarat is an additional positive indicator of things to come. As of March 2014, Gujarat continued to be the number one solar state in terms of installed capacity, with a capacity of 916.4 MW, accounting for more than one-third of the total installed capacity in the country.
Decentralized solar power generation is INR 365,000 per kW or 2.5 times higher than conventional power through cheaper domestic coal. Although, cost has reduced by 50% over two decades and need to descend further by 50% so that conversion of solar power to electricity is commercially viable for general application.
1 September 2014
The Wide Angle: India 2020: The Road to East Asia
Page 42 Deutsche Bank AG/Hong Kong
Brief overview of National Solar Mission of India
The National Solar Mission (NSM) launched in January 2010 is a major initiative of the GoI with active participation from States to promote utilization of solar energy to supplement the country’s energy needs. It aims at establishing India as a global leader in solar energy, by creating the policy conditions for its diffusion across the country as quickly as possible. The Mission has set a goal, amongst others, for deployment of 20,000 MW grid connected solar power capacity by 2022 in 3 phases (1,000 MW in first phase up to 2012-13 – 9,000MW in second phase from 2013 to 2017and 10000MW in third phase from 2017 to 2022).
The resulting tariffs in Batch-I for SPV projects ranged between INR 10.95 and INR12.76 per unit, with average of INR12.12 per unit and for Solar Thermal Projects. In Batch-II, for Solar PV Projects, the tariff ranged between INR7.49 and INR9.44 per unit, with average tariff being INR8.77 per unit. The Solar Power from these plants is being purchased by NVVN and is being sold to Distribution Utilities/ Discoms after bundling with power from the unallocated quota of power from Coal Based Stations of NTPC on equal capacity (MW) basis, thus effectively reducing the average per unit cost of solar power. A total capacity of 568 MW has been commissioned so far under Phase-1.
Phase-II Batch-I: 750 MW Viability Gap Funding (VGF) Scheme:
This scheme for setting up of 750MW of Grid Connected Solar PV Projects with VGF support from National Clean Energy Fund (NCEF) is being implemented through Solar Energy Corporation of India (SECI). It entails purchase of power from developers at a fixed tariff of INR5.45/ unit (INR4.95/unit in case benefit of Accelerated Depreciation is availed) and payment of VGF to the developers as per their bids, limited to a maximum of INR2.5crore/MW). Bids for the same (reverse bidding on the VGF) were invited by SECI in October, 2013 in two Categories: 375MW Capacity under DCR (Domestic Content Requirement) and 375 MW Capacity under Open Category. Power Purchase Agreements with the successful bidders/ developers have since been signed in March 2014. The Projects have a Schedule of Commissioning of 13 Months from the Date of Signing of PPA.
Phase-II Batch-II : 1500 MW Scheme:
Under Batch-II, Solar PV projects with a total capacity of 1500 MW capacity are proposed to be selected under the scheme of Bundling with Thermal power as in Phase-I, to be implemented through NVVN. The present Guidelines lay down the framework for implementation of this scheme.
Source: MNRE

1 September 2014
The Wide Angle: India 2020: The Road to East Asia
Deutsche Bank AG/Hong Kong Page 43
Figure 44: Solar LCOEs across major markets Figure 45: Solar Installations Build-up in India (MW)
$0.21
$0.18$0.16 $0.16
$0.11$0.09 $0.09
$0.00
$0.05
$0.10
$0.15
$0.20
$0.25
United Kingdom
Germany USA South Korea
Y China India
3 11 36
1,030
1,684
2,632
0
500
1,000
1,500
2,000
2,500
3,000
2009 2010 2011 2012 2013 2014
Inst
alle
d C
apac
ity (M
W)
Source: Deutsche Bank Source: Deutsche Bank, MNRE
5. Remove transmission bottlenecks - We find transmission bottlenecks as another big reason for regional power shortages. West and East India are power surplus, while North and South experience chronic power shortages. On the other hand, power projects are operating at low utilization levels. This dichotomy clearly indicates lack of connectivity for seamless transfer of surplus power. Many states are power surplus like Punjab, Chhattisgarh and Gujarat with negligible shortages., while Tamil Nadu, Andhra and UP continue to report high power shortages.
More than inter-regional, inter-state transmission capacities are also lacking capability for seamless movement of power from surplus to deficit zones. Over the next 3 years, transmission highways, high-capacity corridors and South grid link are likely to become operational, which could ease the transmission bottlenecks and hence, raise plant utilization and power shortages significantly.
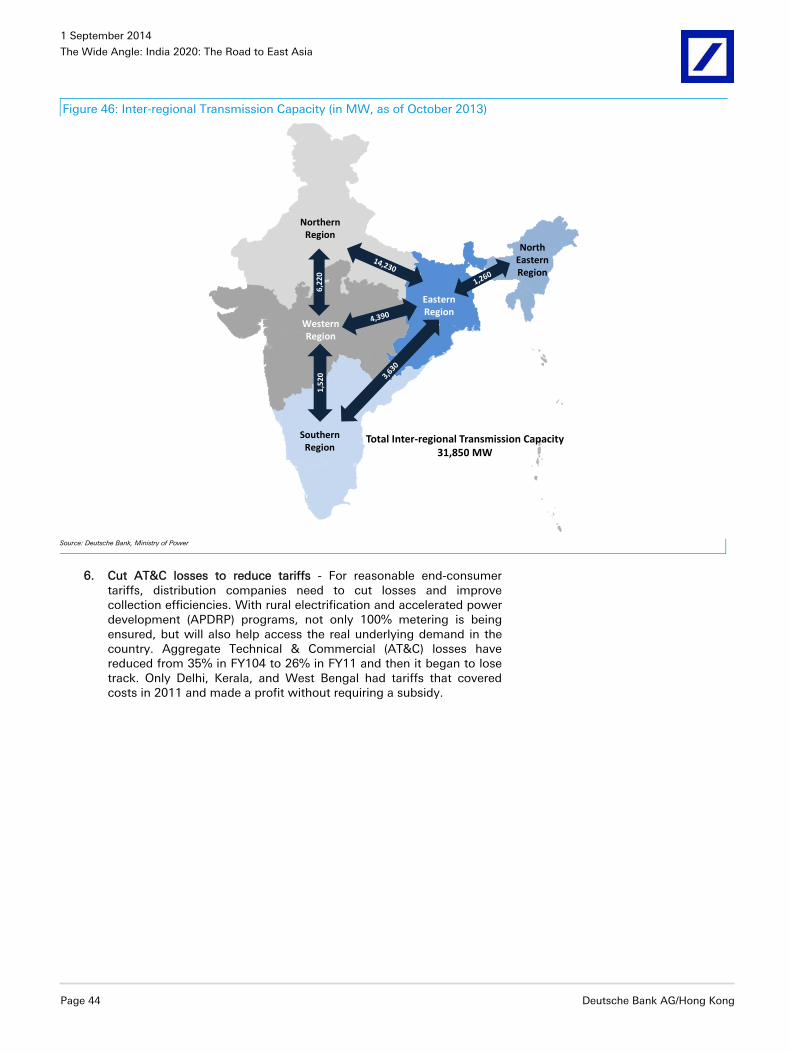
1 September 2014
The Wide Angle: India 2020: The Road to East Asia
Page 44 Deutsche Bank AG/Hong Kong
Figure 46: Inter-regional Transmission Capacity (in MW, as of October 2013)
NorthernRegion
WesternRegion
SouthernRegion
EasternRegion
North EasternRegion
6,22
01,
520
Total Inter-regional Transmission Capacity 31,850 MW
Source: Deutsche Bank, Ministry of Power
6. Cut AT&C losses to reduce tariffs - For reasonable end-consumer tariffs, distribution companies need to cut losses and improve collection efficiencies. With rural electrification and accelerated power development (APDRP) programs, not only 100% metering is being ensured, but will also help access the real underlying demand in the country. Aggregate Technical & Commercial (AT&C) losses have reduced from 35% in FY104 to 26% in FY11 and then it began to lose track. Only Delhi, Kerala, and West Bengal had tariffs that covered costs in 2011 and made a profit without requiring a subsidy.

1 September 2014
The Wide Angle: India 2020: The Road to East Asia
Deutsche Bank AG/Hong Kong Page 45
Figure 47: AT&C Losses across major Indian States (2011-12)
21%
15-20%
>30%
21-30%
Punjab
28%Haryana
45%
Uttar Pradesh
38%
Madhya Pradesh
22%Maharashtra
25%Karnataka
25%Rajasthan
19%Gujarat
15% Andhra Pradesh
20% Tamil Nadu
2011-12 AT&C Losses (%)
Source: Power Finance Corporation report on “The Performance of State Power Utilities for the years 2009-10 to 2011-12”
AT&C losses are needed to be brought down to 15-17%, which are comparable to global standards. Central Government can do little to help reduce losses as predominantly (~92%) distribution systems are managed by State Governments with low improvement in distribution network. States will have to be incentivized as well as monitored/ penalized to achieve loss reduction, and more importantly depoliticized through private sector participation.
Government needs to encourage private participation through PPP or a distribution franchisee model. There is a full spectrum of options and success models in various countries, that the Indian government could look as best practices. Privatization has evidently proven to reduce losses and improve standards of power supply, but not necessarily achieve reasonable power tariffs. As Indian consumers’ aspirational levels move-up, they could increasingly accept to pay higher tariffs for 24x7 power supply. Power tariffs are dependent on cheaper energy sources in any economy, and India with its abundant low-cost coal reserves need to exploit it. The PPP model in distribution was successful in Chile, Peru, and the United Kingdom, whereas management contracts were offered to electric cooperatives in Philippines, concession contracts in Brazil and transfer of operating rights in Turkey in recent times. In India, the distribution franchisee model has proven efficacy with limited employment related disruptions, and we believe that ruling party (BJP) led states can take leadership in semi-privatization drive to showcase model of development to other states.

1 September 2014
The Wide Angle: India 2020: The Road to East Asia
Page 46 Deutsche Bank AG/Hong Kong
Bhiwandi Distribution Franchisee: A Success Story
The Bhiwandi distribution franchise (DF), run by Torrent Power, completed seven years of operation in January 2014. The state has not only achieved significant loss reduction, but also a tremendous improvement in power supply. Based on an input-based 10-year DF agreement with the Maharashtra distribution company, it is responsible for metering, billing, revenue collection, and capital expenditures. The expenditures, subject to regulatory approval, are jointly verified by the distribution company and franchisee.
Bhiwandi, a textile hub in Maharashtra, was reeling under a severe power shortage in 2007 and high losses. Due to inaccurate aggregate technical and commercial (AT&C) loss figures, the bid for a DF could not even be based on loss reduction targets, as is standard for DFs. The franchisee was also not subject to a minimum capital expenditure/investment commitment.
Figure 48: Progress in Bhiwandi’s Power Sector over 2006-11 Parameters 2006/07 2010/11
AT&C Losses (%) 58.0 18.5
Number of transformers 2,254 2,611
Distribution transformer failure rate (%) 42 3
Metering (%) 23 98
Load-shedding (hours/day) 10-12 NA
Collection efficiency (%) 58 99
Megavolt-amperes of reactive power installed 0 160
Number of feeders 46 86
Extra high voltage capacity 550 1,000
Customers 174,000 235,000
Use of information technology None SCADA, AMRSource: Deutsche Bank; Mukherjee 2013 Note: AMR = automated meter reading; SCADA = supervisory control and date acquisition, NA = not available
Last 10 years of the Gujarat Model and learning for the country
Gujarat State has been a poster boy of reforms in the Electricity sector. We believe many successful experiences and policies will be replicated on a country level in next 5 years. The state was early to introduce industry friendly policies, easy land acquisition procedures and invited capital – resulting in significant capacity built-up in the state.

1 September 2014
The Wide Angle: India 2020: The Road to East Asia
Deutsche Bank AG/Hong Kong Page 47
Figure 49: India Capacity & Demand Figure 50: Gujarat Capacity & Demand
0
200
400
600
800
1,000
1,200
1,400
1,600
1,800
0
50,000
100,000
150,000
200,000
250,000
300,000
350,000
400,000
FY13 FY14 FY15E FY16E FY17E FY18E FY19E FY20E
Capacity (MW) - LHS Demand (GWh) - RHS
-
10,000
20,000
30,000
40,000
50,000
60,000
70,000
80,000
90,000
100,000
0
5,000
10,000
15,000
20,000
25,000
30,000
FY03 FY05 FY07 FY09 FY11 FY13
Capacity (MW) - LHS Demand (MU) - RHS
Source: Deutsche Bank, CEA Source: Deutsche Bank, CEA
AT&C losses were reduced significantly in Gujarat from 35% in FY04 to 23.7% in FY07 in a matter of short span, along with reduction in power shortages. If the same can be implemented at India level, the country could save precious fuel resources as well and could satiate the power demand.
Figure 51: India AT&C & shortage scenario Figure 52: Gujarat AT&C & Shortage scenario
8.7%4.2% 4.8% 4.9% 5.4%
5.8% 5.6%7.0%
27.0%26.5%
26.0%25.5%
25.0%24.5%
24.0% 23.5%
15.0%
17.0%
19.0%
21.0%
23.0%
25.0%
27.0%
29.0%
0.0%
5.0%
10.0%
15.0%
20.0%
FY13 FY14 FY15E FY16E FY17E FY18E FY19E FY20E
% Shortage (LHS)
%AT&C Loss (RHS)
12.9% 13.7% 13.2%
9.0%
15.5%
19.3%
10.9%
4.7%6.1%
0.3%
31.2%
35.4% 35.2%
26.5%
23.7%22.8%22.0% 22.8%
16.9%19.3%
0.0%
5.0%
10.0%
15.0%
20.0%
25.0%
30.0%
35.0%
40.0%
0.0%
5.0%
10.0%
15.0%
20.0%
25.0%
FY03 FY04 FY05 FY06 FY07 FY08 FY09 FY10 FY11 FY12
% Shortage (LHS)
%AT&C Loss (RHS)
Source: Deutsche Bank, CEA Source: Deutsche Bank, CEA, GUVNL
What will be the opportunities for sector participants? Opening up the coal sector to private competition, coal operator (MDO)
and infusing globally best technologies.
Transmission – Doubling of capacities, promote private sector competition.
Distribution - Separation of wires and content business, distribution franchise for major Tier 2 cities with higher losses
Renewable energy- capacity expansion could see a big impetus. Solar targeted to 20GW by 2022 from 2GW in 2014.
Abhishek Puri
+91 22 7180 4214
Manish Saxena
+91 22 7180 4034

1 September 2014
The Wide Angle: India 2020: The Road to East Asia
Page 48 Deutsche Bank AG/Hong Kong
Oil and Gas
Executive summary
For the first time since Independence, the Oil & Gas sector has emerged at the centre focus of both, the government’s energy, as well as fiscal security. Over the next one year we see the government building a strong national consensus on the need for incentivizing higher domestic production and achieving a dramatic reduction in fuel subsidies, in a progressive manner. Over the next five year period, this should have a material impact on the fiscal deficit and divert close to USD18bn annually by 2020 from wasteful subsidies to financing infrastructure projects. Over the next 5 years the government’s oil and gas policy is expected to focus on –
1. Incentivizing domestic gas production to reduce India’s hydrocarbon import intensity through raising gas prices from existing USD4.2/mmbtu
2. Streamlining regulatory processes in Exploration and Production and improve co-ordination between petroleum, environment and defense ministries to reduce existing long gestation periods between the award of blocks and actual production
3. A progressive rationalization of fuel subsidy potentially extinguishing government’s fuel subsidy bill and releasing resources to fund infrastructure
Figure 53: Oil & Gas accounted for 37% of India energy mix in 2013
Coal55%
Oil29%
Gas8%
Nuclear1%
Hydro-Power
5%
Other renewables
2%
Source: BP statistical review, Deutsche Bank

1 September 2014
The Wide Angle: India 2020: The Road to East Asia
Deutsche Bank AG/Hong Kong Page 49
Figure 54: Domestic E&P activity has
declined since 2008, due to policy
delays …
Figure 55: …leading to stagnant or
falling production after FY11
Figure 56: Consequently, import
intensity for hydrocarbons is on the
rise
0102030405060708090
100
2000 2002 2004 2006 2008 2010 2012
Total wells drilled
25.0
30.0
35.0
40.0
45.0
50.0
55.0
25.0
27.0
29.0
31.0
33.0
35.0
37.0
39.0
FY04 FY06 FY08 FY10 FY12 FY14
Crude oil (Mmt)
Natural gas (Bcm), RHS
0
2
4
6
8
10
12
14
60
80
100
120
140
160
180
200
FY04 FY06 FY08 FY10 FY12 FY14
Crude oil imports (Mmt)
LNG imports (Mmt), RHS
Source: Wood Mackenzie Source: MoPNG, Deutsche Bank Source: PPAC, Deutsche Bank
Figure 57: Resulting in India’s Net energy imports rising to USD103bn in FY13
0
20
40
60
80
100
120
FY05 FY06 FY07 FY08 FY09 FY10 FY11 FY12 FY13
Net petroleum products imports inc LNG (US$bn)
Source: MoPNG, Deutsche Bank
Figure 58: India’s Oil Consumption (kb/d) has grown at
4% CAGR over last 10 years
Figure 59: India Natural Gas Consumption (bcf/d) – Has
been domestic supply driven
1,500
2,000
2,500
3,000
3,500
4,000
2000 2002 2004 2006 2008 2010 2012
0.0
1.0
2.0
3.0
4.0
5.0
6.0
7.0
2000 2002 2004 2006 2008 2010 2012
Source: Deutsche Bank, BP Statistical Review Source: Deutsche Bank, BP Statistical Review

1 September 2014
The Wide Angle: India 2020: The Road to East Asia
Page 50 Deutsche Bank AG/Hong Kong
Figure 60: Diesel consumption: Over 80% is in
transportation
Figure 61: Fertilizer and power account for 61% of
Natural gas consumption in India
Cars & UVs - Private
13%Cars & UVs -Commercial
9%
3 Wheelers-Passenger/Goods
6%
HCV/LCV28%
Buses9%
Aviation/Shipping1%
Railw ays3%
Tractors13%
Industry - Genset4%
Industry - Other Purpose
5%
Mobile Tow er2%
Others7%
Pow er Generation33%
Industrial Fuel3%
Tea Plantation1%
Domestic Fuel5%
Captive use/LPG
Shrinkage15%
Fertilizer Industry28% Petro-Chemicals
1%
Others14%
Source: Deutsche Bank, Petroleum Planning and Analysis Cell, Pertains to three time periods- July – September 2012, October – December 2012, April – June 2013 Source: Deutsche Bank, Petroleum and Natural Gas Regulatory Board, Pertains to FY 2012 – 13
Figure 62: Refining Capacity (kb/d) has risen at 6.5% CAGR over last ten years
1,500
2,000
2,500
3,000
3,500
4,000
4,500
2000 2002 2004 2006 2008 2010 2012
Source: Deutsche Bank, BP Statistical Review
Economic growth to keep India’s oil & natural gas import intensity above 80%
India’s energy intensity has been coming down over the years as its GDP growth in the last decade has largely been driven by the services sector. Ratio of India’s oil consumption growth to GDP growth has fallen to 0.5x in the last decade as against 0.7-0.8x earlier. On the other hand energy intensity in China led by its manufacturing driven GDP growth has been much higher. As India gradually moves to manufacturing led growth under the BJP-led NDA government, we expect India’s energy intensity and in particular hydrocarbon (oil & gas) consumption growth to increase, compelling the government to focus on improving country’s energy security.
India imports c.85% of its crude oil and c.35% of its natural gas requirement. Hydrocarbon (oil and gas) imports at USD152bn accounted for 33% of India's total import bill in FY14 and constituted 103% of the trade deficit. Assuming an 8% CAGR in real GDP and 6% CAGR in oil consumption over FY14-20E, we estimate India’s hydrocarbon consumption to increase by c.44% or 95 MMTOE. We estimate domestic hydrocarbon production to increase by 30% or 20

1 September 2014
The Wide Angle: India 2020: The Road to East Asia
Deutsche Bank AG/Hong Kong Page 51
MMTOE over FY14-20E which should save India USD13bn in annual import bill. However, hydrocarbon imports are still expected to increase by 37% or 75 MMTOE which we estimate will increase the import bill by c.USD50bn.
Gas price hike could actually save the country USD9.5bn p.a. of gas imports We expect the government of India to nearly double the regulated price of domestic natural gas from the existing USD4.2/mmbtu to ensure commercial viability of the new deepwater gas discoveries and incentivize higher production. Higher domestic gas prices to at least a breakeven level of US$6.5/mmbtu should help raise domestic gas production by 50% or about 40mmscmd by FY20 in our view. By 2020 If domestic gas producers are not incentivized to raise production through higher prices, India’s annual import bill – only on gas imports- could double to US$20bn.
Too many hurdles for Shale gas to be a game changer in India Despite its huge success in the US, shale gas with all its potential and technological evolution is still not expected to take off in India in a meaningful way because of constraints on land acquisition, water availability and the oil & gas exploration infrastructure. Shale gas production requires large amounts of water for injection in order to frac wells for gas extraction. Reportedly, water and polymer injections have been argued to contaminate ground water raising doubts about viability given the damage to watertable. We therefore do not expect shale gas to be a meaningful contributor to India’s energy production in the medium term.
What can reduce India’s hydrocarbon import intensity? Increasing domestic production is the only way to reduce import intensity of hydrocarbons in the long term especially with expectations of higher energy intensive manufacturing led economic growth going ahead. Measures like market linked realization for natural gas (especially when crude oil realization is linked to market prices) will go a long way to incentivize incremental investments leading to higher production. Apart from remunerative realization, the government needs to play an enabling role in terms of faster approvals and transparent decision making to hasten the process from awarding an E&P block from exploration to production. India’s experience here – especially in deepwater blocks - has been abysmal with the total process from awarding a block to actual production taking longer than a decade. This process must be streamlined urgently to boost production. Increased coordination between the defense, environment and oil ministries will be crucial in achieving this objective.
Some of the basins off the eastern coast of India like the Krishna Godavari, Mahanadi, Andaman-Nicobar, etc have elicited responses from various companies but await a landmark hydrocarbon discovery to convert that excitement to investments.
Zero Fuel Subsidies by 2020? – Its no dream!
Fuel subsidies in India touched a high of USD30bn in FY13 (equivalent to 1.3% of GDP), with government’s outgo on fuel subsidies alone accounting for 20% of fiscal deficit that year. Fuel subsidies have subsequently reduced to USD23bn in FY14 with government’s outgo at 14% of fiscal deficit, as oil prices have receded from the highs of over USD120/bbl during FY13 and diesel prices have become more market linked.

1 September 2014
The Wide Angle: India 2020: The Road to East Asia
Page 52 Deutsche Bank AG/Hong Kong
Figure 63: Governments Fuel bill can extinguish by FY21
0.0%
5.0%
10.0%
15.0%
20.0%
25.0%
FY13 FY14 FY15 FY16 FY17 FY18 FY19 FY20 FY21
Source: Deutsche Bank
The Roadmap for achieving zero fuel subsidies by 2020 Of the total fuel subsidies in FY13, diesel accounted for 57% (USD17bn), LPG 25% (USD7.3bn) and Kerosene 18% (USD5.4bn). We believe fuel subsidies can fall to below USD 7bn annually and potentially extinguish government’s fuel subsidy expenditure by 2020 with proactive government decisions aligning domestic prices with market prices.
The moderate monthly diesel price hikes, implemented since Jan 2013, have reduced subsidy on diesel to INR1.8/lit from as high as INR14.5/lit in Sep 2013. We estimate diesel subsidies to be extinguished by the end of the current year. This will reduce the fuel subsidy burden by as much as USD17bn compared to FY13 and helping the Indian government move further towards its articulated intent of cutting fiscal deficit to 3% by FY17.
A mix of capping subsidized cylinders, direct benefit transfer (DBT) and moderate monthly price increases, could reduce subsidy on LPG (used as cooking fuel) by more than half over the next 6 years. Capping of subsidized cylinders to less than 8 units per year, per household from 12 currently could reduce LPG subsidy by as much as US$0.8 – 1.6bn per year. Additionally a modest, affordable 1% per month price increase in LPG prices starting FY16 and 2% from FY17 could reduce LPG subsidy to below USD4bn in FY21 from a forecast USD8.6bn in FY15, despite an 8% annual CAGR in LPG consumption.
Implementation of the Direct Benefit Transfer program will have a much bigger impact on Kerosene subsidy. DBT, we estimate, could reduce subsidy for Kerosene by as much as 50%, reducing the leakage of subsidized Kerosene in the system. Additionally just a 1% per month price increase in Kerosene prices starting FY17 would reduce kerosene subsidy to below USD1.7bn in FY21 from about USD5bn in FY15.
Challenges to fuel subsidy reduction not insurmountable Under the DBT scheme the subsidized commodity (LPG, Kerosene) will be available in the market only at one price i.e. the market determined import parity price. Subsidy will be transferred to the account of the beneficiary directly. This reduces leakages in the system, which exist today where the subsidized product eventually finds its way in the open market and is used by everyone and not just the intended recipient.
1 September 2014
The Wide Angle: India 2020: The Road to East Asia
Deutsche Bank AG/Hong Kong Page 53
Rollout of DBT to cover all districts over the next 3 years and political courage to implement moderate monthly price hikes for LPG cooking gas & Kerosene are now the only challenges to extinguishing fuel subsidies, following the bitter pill of eliminating diesel subsidies already having been achieved. The government’s plan to completely roll out DBT in 291 districts or 40% of the total 640 districts in India, indicates the political willingness to use DBT as a potent tool to target and rationalize subsidies. The success of moderate monthly diesel price hikes in potentially extinguishing diesel subsidies over FY13-FY16 without any major opposition should give the government confidence to implement the same for LPG and Kerosene. Over the last 18 months diesel prices have been raised by 23% without any significant political opposition.
Government to save USD18bn on fuel bill, Oil Upstream companies cashflow to improve An environment of zero fuel subsidies could dramatically improve the financials of state run oil and gas companies. The savings on unproductive and wasteful subsidy expenditure could be channelized towards higher expenditure on oil and gas exploration in India or abroad to help enhance India’s energy security.
By far the most dramatic outcome of a negligible fuel subsidy environment will be on diverting close to US$18bn of wasteful subsidy payments by the Indian government towards more productive uses like funding vital infrastructure.
Investing in overseas hydrocarbon assets: There is no other alternative for energy security
Despite rising domestic production, India’s import intensity for hydrocarbons will stay elevated above 80% in FY20 driven by the rising energy needs of a growing economy coupled with the constraints of limited options to add hydrocarbon resources within the country, owing to lower prospectivity of India’s hydrocarbon basins. We believe improving financial strength following elimination of subsidies and rising concerns about energy security will compel Indian energy companies to raise investments in oil equity overseas.
Over the last ten years, Indian state owned companies have lagged behind their Chinese counterparts in overseas acquisitions of hydrocarbon resources.

1 September 2014
The Wide Angle: India 2020: The Road to East Asia
Page 54 Deutsche Bank AG/Hong Kong
Figure 64: O&G Acquisitions (in US$mn) by India and China
0
5,000
10,000
15,000
20,000
25,000
30,000
35,000
2008 2009 2010 2011 2012 2013 2014
US
$ m
n
China India
Source: Wood Mackenzie
We expect a sharp pickup in investments overseas by the Indian energy companies (especially state owned) driven by:
Improving cashflows due to significant reduction in fuel subsidies and increase in gas price realisation
Limited lucrative large sized domestic investment opportunities in Upstream
Increasing awareness about need for Indian energy security within the government
Is China the role model for overseas acquisitions? Over the past six years the Chinese companies have been aggressive in acquiring oil resources overseas. Based on data from our technical partners Wood Mackenzie- a global research and consultancy firm for the Oil & Gas industry- acquisitions by state owned Chinese oil & gas companies aggregated to over $5bn p.a. in 2005. India managed to reach that number for the first time only in 2013. Since 2008 Chinese companies have invested close to USD95bn in overseas oil assets adding about 26 bnboe of reserves. Over the same period Indian companies have invested only about USD9.5bn adding about 4.5bn boe of reserves.

1 September 2014
The Wide Angle: India 2020: The Road to East Asia
Deutsche Bank AG/Hong Kong Page 55
Figure 65: Chinese SoEs have added 4x reserves compared to Indian SoEs
over 2008 – 2013
0
1500
3000
4500
6000
7500
9000
2008 2009 2010 2011 2012 2013 2014
Mm
boe
China India
Source: Wood Mackenzie
Expect more aggressive response from Indian companies As ONGC & Oil India’s operating cashflow improves due to reduction in fuel subsidy and gas price hike, we expect Indian acquisitions to nudge closer to the $10bn p.a. by FY21. If fuel subsides fall below $5bn, we estimate ONGC’s annual operating cashflows to rise over USD12bn giving it financial muscle to ensure energy security for India. Financial strength and faster decision making, will ensure a more aggressive response from the Indian state owned companies in their investments overseas.
ONGC has already invested USD22bn in overseas assets In its overseas foray, through its 100% subsidiary ONGC Videsh, from 1 asset in CY2000 now owns participating interest in 33 oil and gas assets in 16 countries and contributes 14.5% of oil and 8% of natural gas production of India.
Figure 66: ONGC’s Overseas Reserves: Majority from Russia and Africa
Russia40%
Myanmar6%
Sudan3%Venezuela
8%Colombia
3%
South Sudan2%
Mozambique31%
Brazil2%
Azerbaijan2%
Vietnam2%
Syria1%
Source: Deutsche Bank, ONGC Investor Presentation

1 September 2014
The Wide Angle: India 2020: The Road to East Asia
Page 56 Deutsche Bank AG/Hong Kong
Where can Indian companies buy oil assets? ONGC has been concentrating on Russia, Africa and Latin America – to add hydrocarbon resources since competition is lower and valuations more reasonable because of higher geopolitical risks at these locations. The Chinese companies have added assets all across the globe including Canada, USA, Africa, Latam, Russia and Australia. The deal sizes (and consequently resource addition) of the Chinese companies have also been significantly higher with 11 deals of more than $3bn indicating their balance sheet strength. Indian companies have been absent in Canada, US and Australia.
Due to its existing interest in Iranian assets, ONGC has been unable to invest in US shale gas assets because of the threat of US sanctions. With US – Iran relations on the mend and likely to be resolved over the next couple of years, ONGC could lead India’s investments in US and Canada where Shale gas has been one of the most exciting development in the oil world. This could reorient India’s focus especially for hydrocarbon investment towards North America, a more stable geography in terms of policies and geopolitics compared to its earlier focus areas of Russia, Africa and Latam.
Harshad Katkar
+91 22 7180 4029
Amit Murarka
+91 22 7180 4069
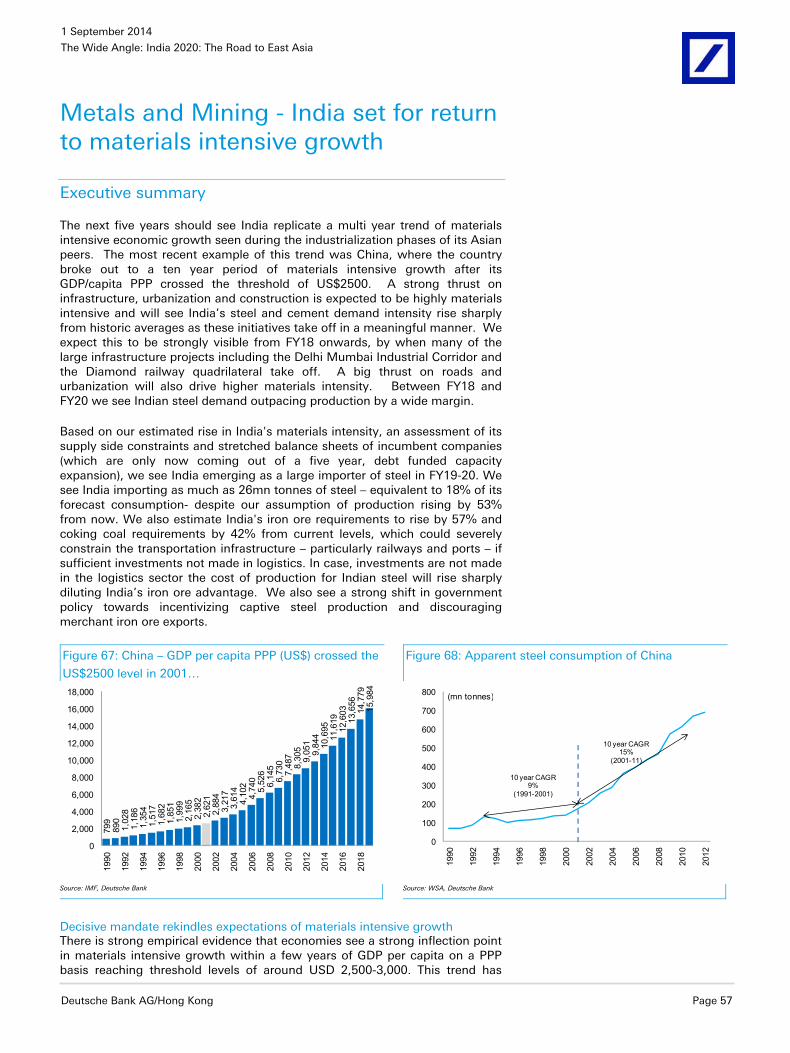
1 September 2014
The Wide Angle: India 2020: The Road to East Asia
Deutsche Bank AG/Hong Kong Page 57
Metals and Mining - India set for return to materials intensive growth
Executive summary
The next five years should see India replicate a multi year trend of materials intensive economic growth seen during the industrialization phases of its Asian peers. The most recent example of this trend was China, where the country broke out to a ten year period of materials intensive growth after its GDP/capita PPP crossed the threshold of US$2500. A strong thrust on infrastructure, urbanization and construction is expected to be highly materials intensive and will see India’s steel and cement demand intensity rise sharply from historic averages as these initiatives take off in a meaningful manner. We expect this to be strongly visible from FY18 onwards, by when many of the large infrastructure projects including the Delhi Mumbai Industrial Corridor and the Diamond railway quadrilateral take off. A big thrust on roads and urbanization will also drive higher materials intensity. Between FY18 and FY20 we see Indian steel demand outpacing production by a wide margin.
Based on our estimated rise in India's materials intensity, an assessment of its supply side constraints and stretched balance sheets of incumbent companies (which are only now coming out of a five year, debt funded capacity expansion), we see India emerging as a large importer of steel in FY19-20. We see India importing as much as 26mn tonnes of steel – equivalent to 18% of its forecast consumption- despite our assumption of production rising by 53% from now. We also estimate India's iron ore requirements to rise by 57% and coking coal requirements by 42% from current levels, which could severely constrain the transportation infrastructure – particularly railways and ports – if sufficient investments not made in logistics. In case, investments are not made in the logistics sector the cost of production for Indian steel will rise sharply diluting India’s iron ore advantage. We also see a strong shift in government policy towards incentivizing captive steel production and discouraging merchant iron ore exports.
Figure 67: China – GDP per capita PPP (US$) crossed the
US$2500 level in 2001…
Figure 68: Apparent steel consumption of China
799
890
1,02
81,
186
1,35
41,
517
1,68
21,
851
1,99
92,
165
2,38
22,
621
2,88
43,
217
3,61
44,
102
4,74
05,
526
6,14
56,
730
7,48
78,
305
9,05
19,
844
10,6
9511
,619
12,6
0313
,656
14,7
7915
,984
0
2,000
4,000
6,000
8,000
10,000
12,000
14,000
16,000
18,000
1990
1992
1994
1996
1998
2000
2002
2004
2006
2008
2010
2012
2014
2016
2018
0
100
200
300
400
500
600
700
800
1990
1992
1994
1996
1998
2000
2002
2004
2006
2008
2010
2012
(mn tonnes)
10 year CAGR 15%
(2001-11)
10 year CAGR 9%
(1991-2001)
Source: IMF, Deutsche Bank Source: WSA, Deutsche Bank
Decisive mandate rekindles expectations of materials intensive growth There is strong empirical evidence that economies see a strong inflection point in materials intensive growth within a few years of GDP per capita on a PPP basis reaching threshold levels of around USD 2,500-3,000. This trend has
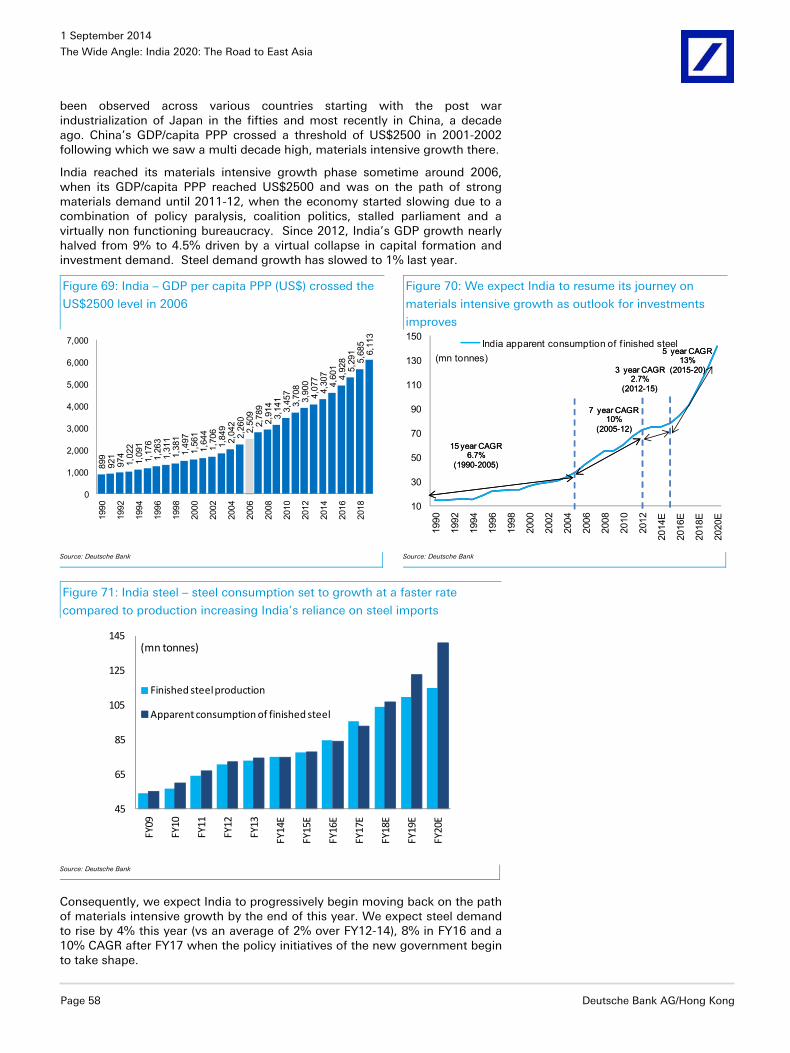
1 September 2014
The Wide Angle: India 2020: The Road to East Asia
Page 58 Deutsche Bank AG/Hong Kong
been observed across various countries starting with the post war industrialization of Japan in the fifties and most recently in China, a decade ago. China’s GDP/capita PPP crossed a threshold of US$2500 in 2001-2002 following which we saw a multi decade high, materials intensive growth there.
India reached its materials intensive growth phase sometime around 2006, when its GDP/capita PPP reached US$2500 and was on the path of strong materials demand until 2011-12, when the economy started slowing due to a combination of policy paralysis, coalition politics, stalled parliament and a virtually non functioning bureaucracy. Since 2012, India’s GDP growth nearly halved from 9% to 4.5% driven by a virtual collapse in capital formation and investment demand. Steel demand growth has slowed to 1% last year.
Figure 69: India – GDP per capita PPP (US$) crossed the
US$2500 level in 2006
Figure 70: We expect India to resume its journey on
materials intensive growth as outlook for investments
improves
899
921
974
1,02
21,
091
1,17
61,
263
1,31
11,
381
1,49
71,
561
1,64
41,
706
1,84
92,
042
2,26
02,
509
2,78
92,
914
3,14
13,
457
3,70
83,
900
4,07
74,
307
4,60
14,
928
5,29
15,
685
6,11
3
0
1,000
2,000
3,000
4,000
5,000
6,000
7,000
1990
1992
1994
1996
1998
2000
2002
2004
2006
2008
2010
2012
2014
2016
2018
10
30
50
70
90
110
130
150
1990
1992
1994
1996
1998
2000
2002
2004
2006
2008
2010
2012
2014
E
2016
E
2018
E
2020
E
India apparent consumption of f inished steel
15 year CAGR 6.7%
(1990-2005)
7 year CAGR 10%
(2005-12)
3 year CAGR 2.7%
(2012-15)
5 year CAGR 13%
(2015-20)(mn tonnes)
15 year CAGR 6.7%
(1990-2005)
7 year CAGR 10%
(2005-12)
3 year CAGR 2.7%
(2012-15)
5 year CAGR 13%
(2015-20)
Source: Deutsche Bank Source: Deutsche Bank
Figure 71: India steel – steel consumption set to growth at a faster rate
compared to production increasing India’s reliance on steel imports
45
65
85
105
125
145
FY09
FY10
FY11
FY12
FY13
FY14
E
FY15
E
FY16
E
FY17
E
FY18
E
FY19
E
FY20
E
Finished steel production
Apparent consumption of finished steel
(mn tonnes)
Source: Deutsche Bank
Consequently, we expect India to progressively begin moving back on the path of materials intensive growth by the end of this year. We expect steel demand to rise by 4% this year (vs an average of 2% over FY12-14), 8% in FY16 and a 10% CAGR after FY17 when the policy initiatives of the new government begin to take shape.

1 September 2014
The Wide Angle: India 2020: The Road to East Asia
Deutsche Bank AG/Hong Kong Page 59
We expect India’s steel consumption growth to rise to 141mn tonnes by FY20. Rising domestic demand will make the country the second fastest growing steel market globally and even position India as the world’s third largest steel consumer by FY15. Based on our growth forecasts, India has the potential to emerge as the second largest steel consuming market, behind China during FY15-20.
Figure 72: India steel – demand supply model (mn tonnes) FY09 FY10 FY11 FY12 FY13 FY14E FY15E FY16E FY17E FY18E FY19E FY20E
Finished steel production (Carbon)
54.1 56.8 64.1 70.7 73.0 75.1 77.5 84.8 95.6 103.7 109.5 114.9
Apparent consumption of finished steel
55.1 60.0 66.9 72.0 74.6 75.0 78.0 84.2 92.7 106.6 122.5 140.9
YoY growth (%) 0% 9% 11% 8% 3% 1% 4% 8% 10% 15% 15% 15%
Net exports (imports) (1.0) (3.2) (2.6) (1.3) (1.6) 0.1 0.5) 0.6 2.9 (2.8) (13.0) (26.0)Source: Deutsche Bank
Figure 73: FY14 – India’s steel consumption pattern
Figure 74: FY20 – Contribution from construction to
increase in India’s steel consumption pattern
Construction, 43%
Consumer durables, Mfg.
hardware & Fastener mfg.,
6%Auto/tractor/cycle Inds., 9%
General engineering
mfgs. & others, 19%
Tube makers CR units, 23%
Construction, 46%
Consumer durables, Mfg.
hardware & Fastener mfg.,
5%Auto/tractor/cycle Inds., 9%
General engineering
mfgs. & others, 17%
Tube makers CR units, 23%
Source: Deutsche Bank Source: Deutsche Bank
Will India have sufficient iron ore to meet domestic requirements?
Rich resource endowment, however, regulatory restrictions are challenging self-sufficiency India is among some of the most attractive geographies globally, for steel production. The attractiveness is manifested by not only the country’s compelling demand growth potential but also by its mineral endowment. India is blessed with large reserves of high grade iron ore – with eastern India having some of the finest reserves, globally (ferric content higher than 63%).
Figure 75: India is richly endowed with iron ore resources Reserves Resources Total R&R
Haematite 8.09 9.79 17.88
Magnetite 0.02 10.62 10.64
Total 8.12 20.41 28.53 Source: Ministry of mines, Deutsche Bank

1 September 2014
The Wide Angle: India 2020: The Road to East Asia
Page 60 Deutsche Bank AG/Hong Kong
However, regulatory restrictions on mining in key iron ore producing states (including bans) has led to severe iron ore supply constraints in the domestic market. India’s iron ore production has come off by 35% from peak production levels in FY10 with 76 mn tonnes going off the market on account of restriction on mining operations in Karnataka, Goa and Odisha.
Tightening supplies from top iron ore-producing regions, combined with record capacity expansion being undertaken by Indian steelmakers, is challenging the iron ore self-sufficiency and low cost positioning of Indian steelmakers, which have benefitted thus far from ready access to low-cost domestically mined iron ore. Indian steel makers are in the midst of their most aggressive capacity expansion and investment cycle. Based on our current estimates of steel production, annual domestic iron ore production will need to rise by ~70m tonnes by FY20 (+50% over FY14 production levels) for India to remain self sufficient on the iron ore front and retain India’s cost competitiveness in this very vital industry. In the absence of any regulatory respite, the iron growth in iron ore production is likely to trail that in the demand for steelmaking raw material, thus increasing the reliance on imports. In fact, many Indian steel makers are being forced to rely on high-cost iron ore imports in order to sustain their utilization rates.
If the Indian regulatory scenario remains challenging, we believe that India’s dependence on iron ore imports is likely to increase further in order to feed incremental steelmaking capacities, and there is a real risk of India turning into a net importer of iron ore from a net exporter (117m tonnes of exports in FY10) historically.
Figure 76: Domestic annual iron ore requirement to rise
by 72mn tonnes over FY14-20
Figure 77: Annual coking requirement to rise by 30mn
tonnes over FY14-20 which will primarily be met by
imports
75
100
125
150
175
200
225
FY09
FY10
FY11
FY12
FY13
FY14
E
FY15
E
FY16
E
FY17
E
FY18
E
FY19
E
FY20
E
India - iron ore requirement
(mn tonnes)
50
60
70
80
90
100
110
FY09
FY10
FY11
FY12
FY13
FY14
E
FY15
E
FY16
E
FY17
E
FY18
E
FY19
E
FY20
E
India - coking coal requirement
(mn tonnes)
Source: Deutsche Bank Source: Deutsche Bank
Reliance on coking coal imports to increase as well
While India is blessed with high grade iron ore reserves, it lacks coking coal reserves, also necessary for steel making. India’s coking coal reserves are high in ash content, which forces Indian steel producers to blend domestic coking coal with imported coking coal. Consequently, the dependence on coking coal imports will rise as Indian steel production increases. Assuming even a very efficient usage of coking coal (given new technologies), we estimate that India will need to import an incremental 30mn tonnes per annum to meet the requirements from domestic steelmakers. We estimate that India’s total coking coal requirement on an annual basis will rise from 72 mn tonnes currently to 102 mn tonnes in FY20.
Abhay Laijawala
+91 22 7180 4031
Anuj Singla
+91 22 7180 4172

1 September 2014
The Wide Angle: India 2020: The Road to East Asia
Deutsche Bank AG/Hong Kong Page 61
Indian auto sector – a template for successful liberalization
Executive summary
The Indian auto is a case study for successful liberalisation of a sector. The central government set the ball rolling around 1985 as it eased quantitative restrictions and progressively relaxed licensing norms. It culminated with automatic approval for 100% FDI in 2000. Today, the sector boasts of a presence of strong domestic players and most global OEMs. It has also catalysed a thriving auto component industry. Looking forward, GDP growth will provide a natural impetus to domestic demand to grow at 12-14% p.a. In exports space, India’s key competitior is Thailand, which has risen to become a global top-10 auto exporter on the back a focussed government policies.
Indian Auto sector – The roadmap for liberalisation The progressive liberalisation of Indian auto sector began around 1985. Prior to that, the government imposed quantitative restrictions on a gamut of aspects including capacity, annual production, import of machines and a punitive tax structure which restricted market size.
In the first phase, the government set forth a series of measures for 'domestic liberalisation'. This included easing of license norms for capacity expansion, foreign collaborations etc.
In 1991, during the first phase of liberalisation of the Indian economy, the auto sector was one of the major sectors to be gain freedom from 'license raj'. Government allowed 51% FDI in the sector and incentivised set-up of production facilities in the country. Further, in 2002, the government allowed 100% FDI in the automotive sector.
The benefits of early liberalisation is evident in the Indian automotive sector The share of the road transport sector in GDP stands at around 4.8%. Crucially it has maintained an upward trajectory despite share a falling share of the overall manufacturing sector.
Figure 78: Road transportation sector share of GDP
(constant prices)
Figure 79: Manufacturing sector share of GDP (constant
prices)
3.8% 3.9% 3.9%
4.1%4.3%
4.8% 4.8% 4.8%
4.7%
4.8% 4.7%
4.6%
4.8%
3.0%
3.5%
4.0%
4.5%
5.0%
5.5%
FY00
FY01
FY02
FY03
FY04
FY05
FY06
FY07
FY08
FY09
FY10
FY11
FY12
Road transport share of GDP (%)
15.1%
15.5%
15.0%
15.4%
15.2%
15.3%
15.3%
16.0%16.1%
15.8%
16.2% 16.2%
15.7%
15.1%
14.0%
14.5%
15.0%
15.5%
16.0%
16.5%
17.0%
FY00
FY01
FY02
FY03
FY04
FY05
FY06
FY07
FY08
FY09
FY10
FY11
FY12
FY13
Manufacturing sector share of GDP (%)
Source: Government of India, Deutsche Bank Source: Government of India, Deutsche Bank

1 September 2014
The Wide Angle: India 2020: The Road to East Asia
Page 62 Deutsche Bank AG/Hong Kong
The impact of the liberalisation is also reflected in the volume growth of 2-wheelers and 4-wheelers. Over the last 25 years (1991-2014), the 2-wheeler and 4-wheeler segments have grown at 10% and 11%, higher than that of a basic industry such as steel (8%).
Figure 80: India two-wheeler sector – long term growth
trend
Figure 81: India four-wheeler sector – long term growth
trend
-15%
-10%
-5%
0%
5%
10%
15%
20%
25%
30%
35%
FY91
FY93
FY95
FY97
FY99
FY01
FY03
FY05
FY07
FY09
FY11
FY13
Two-wheeler volumes - YoY growth (%)
-20%
-10%
0%
10%
20%
30%
40%
50%
60%
FY91
FY93
FY95
FY97
FY99
FY01
FY03
FY05
FY07
FY09
FY11
FY13
Four-wheeler volumes - YoY growth (%)
Source: Society of Indian Automobile Manufacturers (SIAM), Deutsche Bank Source: Society of Indian Automobile Manufacturers (SIAM), Deutsche Bank
Significant demand potential due to low penetration of 4W and 2W in rural markets
Household penetration of 4W and 2W stood at 4% and 25% respectively in FY12. For 4Ws, the penetration was 8% and 2% in urban and rural markets. We believe the penetration for 4W could accelerate especially in urban areas given the focus of the new government on urbanisation..
Figure 82: India two-wheeler household penetration
trend
Figure 83: India four-wheeler household penetration
trend
2.1%4.5%
7.7%
13.9%
18.4%
11.6%
18.4%
26.0%
33.0%
37.8%
0.0%
5.0%
10.0%
15.0%
20.0%
25.0%
30.0%
35.0%
40.0%
FY94 FY00 FY05 FY10 FY12
Rural Urban
0.2% 0.4%0.8%
1.4%2.0%
1.2%
2.7%
4.6%
6.5%
8.0%
0.0%
1.0%
2.0%
3.0%
4.0%
5.0%
6.0%
7.0%
8.0%
9.0%
FY94 FY00 FY05 FY10 FY12
Rural Urban
Source: Government of India, Deutsche Bank Source: Government of India, Deutsche Bank
We expect overall 4W household penetration to reach 12% over the next decade. This implies annual sales of 6.2m by FY2022 and an implied growth rate of 9% p.a. For 2W, we believe rural and urban penetration can scale to 30% and 60% of households over the next decade. This implies annual sales of around 19m by FY2022 and growth rate of 4% p.a.
The sector needs predictable policy on fuel pricing and emission norms The government policy on fuel pricing has presented one of the steepest challenges for the auto sector. Engine design & development has one of the

1 September 2014
The Wide Angle: India 2020: The Road to East Asia
Deutsche Bank AG/Hong Kong Page 63
longest lead times in automotive manufacturing (typically 5-8 years) and hence consistent fuel policy is crucial for companies to engage in viable long-term planning.
Over the last few years, the government’s stance on retail pricing of diesel had a significant impact on the relative demand of gasoline and diesel vehicles. While the retail price of gasoline was ‘deregulated’ to reflect the impact of crude price, diesel price was increased sporadically. It led to a demand surge for diesel cars and a demand shock for gasoline cars particularly in the the entry level which only have a gasoline option. More recently the government has embarked on a policy of ‘calibrated’ increase in diesel price to minimise the fuel subsidy burden. This has helped nomalise the demand for diesel cars.
Figure 84: Petrol and diesel price trend Figure 85: Petrol price premium over diesel
20
30
40
50
60
70
80
1-Ja
n-10
1-A
pr-1
0
1-Ju
l-10
1-O
ct-1
0
1-Ja
n-11
1-A
pr-1
1
1-Ju
l-11
1-O
ct-1
1
1-Ja
n-12
1-A
pr-1
2
1-Ju
l-12
1-O
ct-1
2
1-Ja
n-13
1-A
pr-1
3
1-Ju
l-13
1-O
ct-1
3
1-Ja
n-14
1-A
pr-1
4
1-Ju
l-14
Petrol Prices (INR/ltr) Diesel prices (INR/ltr)
0%
10%
20%
30%
40%
50%
60%
70%
80%
90%
1-Ja
n-10
1-A
pr-1
0
1-Ju
l-10
1-O
ct-1
0
1-Ja
n-11
1-A
pr-1
1
1-Ju
l-11
1-O
ct-1
1
1-Ja
n-12
1-A
pr-1
2
1-Ju
l-12
1-O
ct-1
2
1-Ja
n-13
1-A
pr-1
3
1-Ju
l-13
1-O
ct-1
3
1-Ja
n-14
1-A
pr-1
4
1-Ju
l-14
Petrol diesel price difference (%)
Source: Companies, Deutsche Bank Source: Companies, Deutsche Bank
Figure 86: India four wheeler – vehicle mix
65% 64%52%
42% 47%
35% 36%48%
58% 53%
0%
20%
40%
60%
80%
100%
FY10 FY11 FY12 FY13 FY14
Petrol vehicles Diesel vehicles
Source: Industry, Deutsche Bank
India’s emission norms are currently split – Bharat stage IV (equivalent to Euro IV) is applicable in 13 cities & the NCR and BSIII is applicable in rest of the country. This leads to fragmentation of production capacity and consequent increase in costs. Further there is no definitive timeframe for transition to next level of emission norms. This creates significant uncertainty into the timing of investments for emission compliance by the automotive companies.

1 September 2014
The Wide Angle: India 2020: The Road to East Asia
Page 64 Deutsche Bank AG/Hong Kong
Can India emulate Thailand, the Detroit of Asia
Thailand responded to the Asian financial crisis by focusing o developing its exports. The pre-crisis boom had led to significant capacity build-up in the automotive sector. The demand destruction due to crisis forced the players to focus on exports. The government aided the efforts by signing bilateral and multilateral trade agreements.
Thailand’s top 10 status in automotive exports in remarkable Thailand currently exports around 1m vehicles annually making it the largest exporter in Asia and among the top-10 globally. Crucially, Thailand has achieved this distinction without proximity to any large market or as a home-base to any global company. Mexico and Canada have benefitted from the proximity to the large US market. Japan, Korea and EU are the home base for global automakers.
Figure 87: Top 10 4W exporters (by units) CY13/FY14 (in mn units)
EU 5.91
Japan 4.07
Korea 3.17
Mexico 2.42
Canada 2.00
United states 1.93
Thailand 1.13
China 0.60
India 0.59
Indonesia 0.28 Source: Industry data, Deutsche Bank
Figure 88: Four wheeler exports comparison – India and Thailand
0
200,000
400,000
600,000
800,000
1,000,000
1,200,000
CY04
/FY0
5
CY05
/FY0
6
CY06
/FY0
7
CY07
/FY0
8
CY08
/FY0
9
CY09
/FY1
0
CY10
/FY1
1
CY11
/FY1
2
CY12
/FY1
3
CY13
/FY1
4
India 4W exports Thailand 4W exports
Source: Society of Indian Automobile Manufacturers (SIAM, Deutsche Bank
India’s key competitor in automotive sector
Thailand’s success as an export base is largely due to effective government policies and good infrastructure. The relative rankings of India and Thailand in the Global Competitiveness Index from the WEF reflect the challenge faced by India. India is ranked 60th compared to 37th for Thailand and the key difference is on account of infrastructure which WEF includes in basic requirements for competitiveness. On efficiency and innovation indices, India’s rank is comparable to Thailand.

1 September 2014
The Wide Angle: India 2020: The Road to East Asia
Deutsche Bank AG/Hong Kong Page 65
Figure 89: The Global Competitiveness Index 2013–2014 SUBINDEXES
Overall index Basic requirements
Efficiency enhancers
Innovation and sophistication
factors
Rank Score Rank Score Rank Score Rank Score
India 60 4.28 96 4.23 42 4.41 41 4
Thailand 37 4.54 49 4.86 40 4.43 52 3.83Source: World Economic Forum, Deutsche Bank
Figure 90: The Global Competitiveness Index 2013–2014: Basic requirements PILLARS
Basic requirements 1. Institutions 2. Infrastructure 3. Macroeconomic environment
4. Health and primary education
Rank Score Rank Score Rank Score Rank Score Rank Score
India 96 4.23 72 3.86 85 3.65 110 4.1 102 5.3
Thailand 49 4.86 78 3.79 47 4.53 31 5.61 81 5.52Source: Deutsche Bank
Figure 91:Cost Comparison of the Top 25 Export Economies
96
121
100
111
102
124 123
111
123
109115
99
9197
87
125130
109
123
91
83
101
116111
107
70
80
90
100
110
120
130
140
Chin
a
Ger
man
y
Uni
ted
Stat
es
Japa
n
Sout
h Ko
rea
Fran
ce
Ital
y
Net
herl
ands
Belg
ium
Uni
ted
King
dom
Cana
da
Russ
ia
Mex
ico
Taiw
an
Indi
a
Switz
erla
nd
Aus
tral
ia
Spai
n
Braz
il
Thai
land
Indo
nesi
a
Pola
nd
Swed
en
Aus
tria
Czec
h Re
publ
ic
Manufacturing cost index, 2014 (US=100)
Labour Electricity Natural gas Others Total Source: BCG Perspectives - Cost Competitiveness: A Country Review. US Economic Census; US Bureau of Labour Statistics; US Bureau of Labout Analysis; International Labour Organisation; Euromonitor International; Economist Intelligence Unit; BCG analysis. NOTE: The index covers four direct costs only. No difference is assumed for other costs, such as raw-material inputs and machine and tool depreciation. Cost structure is calculated as a weighted avereage across all industries.
Srinivas Rao
91 22 7180 4210
1 September 2014
The Wide Angle: India 2020: The Road to East Asia
Page 66 Deutsche Bank AG/Hong Kong
Banks
Executive summary
How will India fund the proposed mega investments in infrastructure, commensurate with the needs that accompany its transition towards an East Asian manufacturing model? This is the most crucial issue ahead of Indian policy makers. With rising fiscal constraints, an increasing onus of financing these investments will progressively lie on the private sector and in turn on the banking system, until new financial products for infrastructure financing take shape. In the absence of deep and liquid bond markets and alternate modes of financing, the banking sector has been the key provider of finance to the infrastructure sector. This is clearly not a sustainable mechanism given the asset liability mismatches that accrue from financing long gestation infrastructure projects. Indian policy makers will hence need to come up with innovative solutions to unlock longer term sources of capital beyond the traditional reliance on the banking sector, accompanied by lower cost funding, particularly for infrastructure projects.
We also believe that India must enact policy that is conducive for deeper and more liquid bond markets which would allow greater facilitation of investment flows to infrastructure projects. Increasing the FDI limit in insurance as proposed by the new government would be a very good starting point in achieving this objective. The new RBI administration under Dr Raghuram Rajan has demonstrated that they are competent of rising up to this challenge and we expect a progressive policy roadmap towards achieving the end objective of financing infrastructure growth at an optimal cost and through avenues beyond the banking sector.
In due course, as the bond markets deepen, companies may find it cheaper to borrow from the bond markets rather than bank loans. However, banks would continue to be key investors in the bond markets along with other entities like insurance companies, mutual funds and pension funds. Disintermediation via a deeper and stronger bond markets should further lower funding costs for borrowers.
Strong loan growth over the coming years will require proportionate increase in capital levels of banks. Government may find it difficult to hold on to its current shareholding in PSU banks as it will need to inject large doses of capital. Consequently we expect the government to consider diluting its stake in PSU banks initially to ~51% and eventually even below that threshold. While building a political consensus on diluting government stake below 51% will need considerable effort, we see this initiative being taken up earnestly by the middle of the government's current term.
Big lending opportunity: Expect loan growth of 19% CAGR over next five years- mortgages, infra will be key drivers
Housing and infrastructure - strategic to the new government’s political and economic agenda - will be the key growth drivers for loan growth over the next few years. We expect banking system loans to grow at a CAGR of 19% over FY14-20. By 2020, we expect credit to GDP ratio for India to rise to 73% from 55% levels currently. This will still be lower than current penetration at India’s Asian Peers, providing further growth opportunities

1 September 2014
The Wide Angle: India 2020: The Road to East Asia
Deutsche Bank AG/Hong Kong Page 67
The new government has made its intentions very clear about the thrust it plans to give to mortgages and infrastructure. In the budget, the finance minister and subsequently the RBI have offered incentives for mortgage and infra financing. These initiatives, accompanied by the legacy under penetration in these segments means that the demand emanating from these segments will only increase further.
Figure 92: Loan and deposit growth
30%
40%
50%
60%
70%
80%
90%
100%
0
50,000
100,000
150,000
200,000
250,000
2007 2009 2011 2013 2015 2017 2019
% o
f GD
P
INR
bill
ions
Total credit (LHS) Deposits (LHS)
Credit to GDP (RHS) Deposits to GDP (RHS)
Source: Deutsche Bank

1 September 2014
The Wide Angle: India 2020: The Road to East Asia
Page 68 Deutsche Bank AG/Hong Kong
Figure 93: Sectoral deployment of bank credit FY01 FY02 FY03 FY04 FY05 FY06 FY07 FY08 FY09 FY10 FY11 FY12 FY13 FY14
Industry 37.9% 35.7% 35.3% 53.5% 45.8% 39.1% 38.8% 39.6% 40.5% 43.1% 44.2% 45.2% 45.8% 45.3%
Food Processing 1.5% 1.5% 1.5% 1.4% 2.6% 2.2% 2.2% 2.2% 2.1% 2.2% 2.3% 2.2% 2.4% 2.7%
Textiles 6.1% 5.4% 5.6% 4.7% 4.7% 3.9% 4.2% 4.4% 3.9% 4.0% 3.9% 3.7% 3.8% 3.7%
Petroleum, Coal Products etc
2.7% 2.3% 2.6% 1.7% 1.7% 1.7% 2.0% 1.9% 2.6% 2.6% 1.6% 1.4% 1.3% 1.1%
Chemicals & Chemical Products
5.6% 5.4% 5.6% 4.2% 4.2% 3.5% 3.1% 2.8% 2.9% 2.8% 2.6% 3.0% 3.3% 3.0%
Basic Metal & Metal Product
6.0% 5.5% 6.5% 4.7% 5.1% 4.6% 4.7% 4.9% 4.9% 5.4% 5.7% 6.1% 6.5% 6.5%
All Engineering 5.5% 5.0% 4.6% 3.6% 3.2% 2.5% 2.5% 2.5% 2.5% 2.4% 2.5% 2.6% 2.6% 2.6%
Vehicles, Vehicle Parts & Transport Equipment
1.0% 0.9% 1.0% 0.7% 1.3% 1.3% 1.2% 1.3% 1.3% 1.3% 1.2% 1.2% 1.2% 1.2%
Gems & Jewellery 1.5% 1.3% 1.3% 1.3% 1.5% 1.4% 1.3% 1.1% 1.1% 1.0% 1.1% 1.2% 1.3% 1.3%
Construction 0.7% 0.8% 0.9% 0.8% 0.9% 1.0% 1.1% 1.3% 1.5% 1.5% 1.4% 1.1% 1.1% 1.1%
Infrastructure 2.6% 3.1% 4.6% 5.1% 8.5% 7.7% 8.0% 9.3% 10.4% 12.5% 14.4% 14.7% 15.0% 15.1%
Power 1.2% 1.5% 2.7% 2.7% 4.2% 4.1% 4.1% 4.3% 4.8% 6.2% 7.3% 7.7% 8.5% 8.8%
Telecommunications 0.8% 0.8% 1.0% 1.2% 1.7% 1.3% 1.1% 1.7% 1.9% 2.0% 2.7% 2.2% 1.8% 1.6%
Roads 0.6% 0.7% 1.0% 1.3% 1.6% 1.4% 1.4% 1.6% 1.8% 2.4% 2.5% 2.6% 2.7% 2.8%
Services 3.4% 3.3% 3.4% 0.0% 0.0% 24.8% 23.9% 24.6% 23.7% 23.7% 24.0%
Trade 6.3% 6.2% 5.8% 5.9% 5.6% 5.5% 5.4% 5.1% 5.2% 5.7% 5.8%
Commercial real estate 1.1% 1.4% 1.9% 2.5% 2.8% 3.5% 3.0% 3.0% 2.6% 2.6% 2.8%
NBFCs 1.8% 2.0% 2.5% 3.4% 2.4% 2.2% 2.7% 3.4% 3.8% 3.7% 4.8% 5.3% 5.3% 5.3%
Retail Loans 23.8% 26.3% 25.2% 25.4% 22.9% 21.6% 19.3% 18.7% 18.4% 18.4% 18.6%
Housing 12.9% 13.8% 13.3% 12.9% 11.6% 10.7% 9.9% 9.4% 9.4% 9.4% 9.7%
Auto loans 3.8% 4.4% 0.0% 0.0% 2.4% 2.1% 2.2% 2.1% 2.3% 2.3%
Agriculture & Allied Activities
12.1% 12.6% 12.6% 12.4% 13.1% 12.4% 12.8% 12.5% 13.0% 13.7% 12.6% 12.7% 12.1% 12.0%
Source: RBI, Deutsche Bank
Mortgage penetration levels remain low in India Mortgage to GDP in India is much below that of its Asian peers (Figure 94). Given the focus of the new government on affordable housing we expect mortgage to GDP to steadily rise from the current low levels driving higher loan demand.
Figure 94: India – Mortgage to GDP
0.0%
1.0%
2.0%
3.0%
4.0%
5.0%
6.0%
2000 2002 2004 2006 2008 2010 2012
Source: RBI, Deutsche Bank
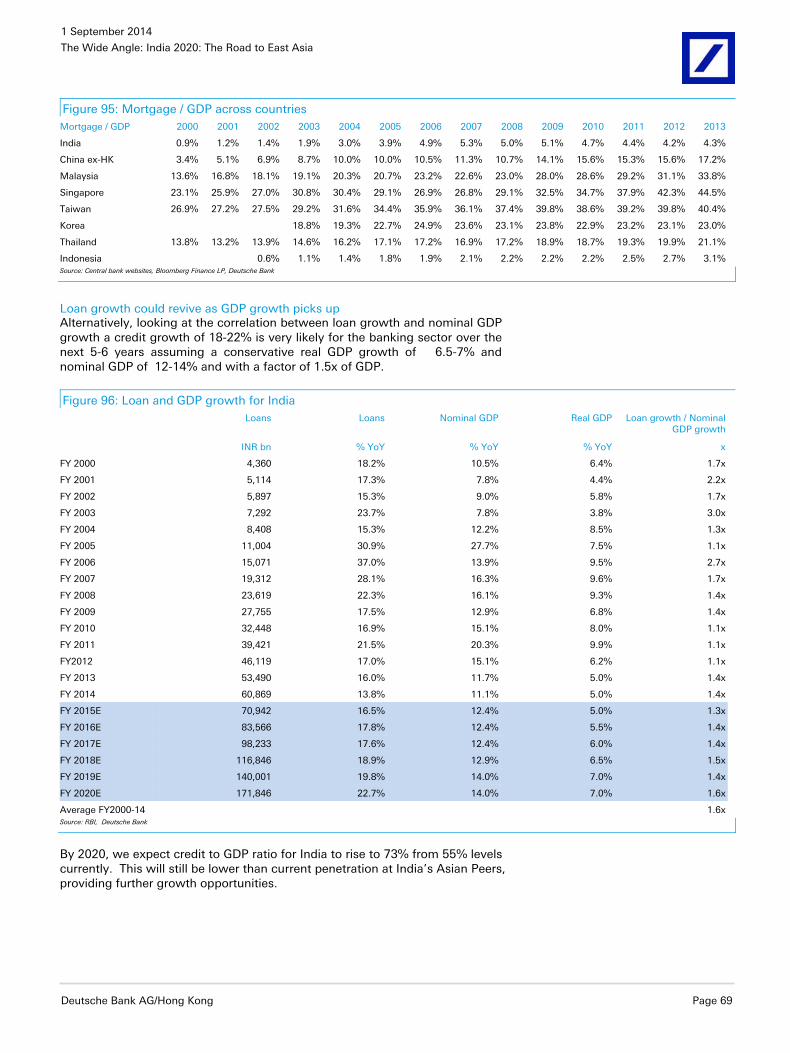
1 September 2014
The Wide Angle: India 2020: The Road to East Asia
Deutsche Bank AG/Hong Kong Page 69
Figure 95: Mortgage / GDP across countries Mortgage / GDP 2000 2001 2002 2003 2004 2005 2006 2007 2008 2009 2010 2011 2012 2013
India 0.9% 1.2% 1.4% 1.9% 3.0% 3.9% 4.9% 5.3% 5.0% 5.1% 4.7% 4.4% 4.2% 4.3%
China ex-HK 3.4% 5.1% 6.9% 8.7% 10.0% 10.0% 10.5% 11.3% 10.7% 14.1% 15.6% 15.3% 15.6% 17.2%
Malaysia 13.6% 16.8% 18.1% 19.1% 20.3% 20.7% 23.2% 22.6% 23.0% 28.0% 28.6% 29.2% 31.1% 33.8%
Singapore 23.1% 25.9% 27.0% 30.8% 30.4% 29.1% 26.9% 26.8% 29.1% 32.5% 34.7% 37.9% 42.3% 44.5%
Taiwan 26.9% 27.2% 27.5% 29.2% 31.6% 34.4% 35.9% 36.1% 37.4% 39.8% 38.6% 39.2% 39.8% 40.4%
Korea 18.8% 19.3% 22.7% 24.9% 23.6% 23.1% 23.8% 22.9% 23.2% 23.1% 23.0%
Thailand 13.8% 13.2% 13.9% 14.6% 16.2% 17.1% 17.2% 16.9% 17.2% 18.9% 18.7% 19.3% 19.9% 21.1%
Indonesia 0.6% 1.1% 1.4% 1.8% 1.9% 2.1% 2.2% 2.2% 2.2% 2.5% 2.7% 3.1%Source: Central bank websites, Bloomberg Finance LP, Deutsche Bank
Loan growth could revive as GDP growth picks up Alternatively, looking at the correlation between loan growth and nominal GDP growth a credit growth of 18-22% is very likely for the banking sector over the next 5-6 years assuming a conservative real GDP growth of 6.5-7% and nominal GDP of 12-14% and with a factor of 1.5x of GDP.
Figure 96: Loan and GDP growth for India Loans Loans Nominal GDP Real GDP Loan growth / Nominal
GDP growth
INR bn % YoY % YoY % YoY x
FY 2000 4,360 18.2% 10.5% 6.4% 1.7x
FY 2001 5,114 17.3% 7.8% 4.4% 2.2x
FY 2002 5,897 15.3% 9.0% 5.8% 1.7x
FY 2003 7,292 23.7% 7.8% 3.8% 3.0x
FY 2004 8,408 15.3% 12.2% 8.5% 1.3x
FY 2005 11,004 30.9% 27.7% 7.5% 1.1x
FY 2006 15,071 37.0% 13.9% 9.5% 2.7x
FY 2007 19,312 28.1% 16.3% 9.6% 1.7x
FY 2008 23,619 22.3% 16.1% 9.3% 1.4x
FY 2009 27,755 17.5% 12.9% 6.8% 1.4x
FY 2010 32,448 16.9% 15.1% 8.0% 1.1x
FY 2011 39,421 21.5% 20.3% 9.9% 1.1x
FY2012 46,119 17.0% 15.1% 6.2% 1.1x
FY 2013 53,490 16.0% 11.7% 5.0% 1.4x
FY 2014 60,869 13.8% 11.1% 5.0% 1.4x
FY 2015E 70,942 16.5% 12.4% 5.0% 1.3x
FY 2016E 83,566 17.8% 12.4% 5.5% 1.4x
FY 2017E 98,233 17.6% 12.4% 6.0% 1.4x
FY 2018E 116,846 18.9% 12.9% 6.5% 1.5x
FY 2019E 140,001 19.8% 14.0% 7.0% 1.4x
FY 2020E 171,846 22.7% 14.0% 7.0% 1.6x
Average FY2000-14 1.6xSource: RBI, Deutsche Bank
By 2020, we expect credit to GDP ratio for India to rise to 73% from 55% levels currently. This will still be lower than current penetration at India’s Asian Peers, providing further growth opportunities.

1 September 2014
The Wide Angle: India 2020: The Road to East Asia
Page 70 Deutsche Bank AG/Hong Kong
Figure 97: Loans to GDP across countries Loans/GDP 2001 2002 2003 2004 2005 2006 2007 2008 2009 2010 2011 2012 2013
India 26.7% 30.3% 30.4% 51.0% 43.4% 48.5% 50.6% 52.6% 52.9% 55.9% 55.4% 56.8% 58.1%
Australia 90.3% 95.2% 99.7% 103.5% 108.6% 113.6% 123.4% 126.4% 130.7% 127.8% 126.3% 128.2% 130.6%
China 102.4% 109.1% 117.1% 111.5% 105.3% 104.2% 98.5% 96.6% 117.2% 119.3% 115.8% 121.3% 83.6%
Hong Kong 165.4% 160.0% 161.9% 163.7% 163.7% 164.2% 179.4% 192.4% 198.2% 238.0% 262.6% 273.3% 304.2%
Indonesia 20.0% 21.7% 23.7% 25.2% 23.6% 25.4% 26.5% 25.8% 27.7% 30.0% 33.3% 36.6%
Japan 89.8% 86.6% 82.2% 79.1% 79.2% 80.3% 80.1% 85.2% 89.5% 85.7% 88.3% 89.5% 91.1%
Korea 54.9% 65.5% 70.2% 68.4% 71.0% 77.0% 82.4% 89.3% 89.5% 84.1% 86.1% 86.4% 118.8%
Malaysia 102.7% 99.4% 96.8% 94.4% 109.9% 110.8% 113.5% 117.7% 124.5%
Philippines 0.0% 0.0% 32.2% 30.9% 31.5% 30.5% 31.3% 32.8% 30.1% 32.3% 33.3% 35.7%
Singapore 103.7% 99.4% 102.6% 94.0% 87.7% 83.9% 86.9% 101.1% 101.7% 101.5% 122.8% 138.1% 155.2%
Taiwan 131.9% 123.6% 126.3% 130.8% 137.1% 134.8% 131.2% 137.7% 140.6% 138.2% 144.6% 144.7% 144.0%
Thailand 80.4% 80.1% 75.1% 73.1% 83.1% 86.3% 86.7% 92.8% 99.1% 103.7%Source: Central bank websites, Bloomberg Finance LP, Deutsche Bank
Banks currently account for 67% of debt funding - this should trend lower over time The various debt funding sources for Indian corporates are banks, insurance companies, pension funds, mutual funds and FIIs. We estimate that banks currently account for ~2/3rd of the total debt pool. Over the next five years we expect the government to take firm steps to develop vibrant corporate debt markets while also boosting the growth of insurance, mutual fund and pension fund sectors. India’s rising middle class, increasing financial intermediation and rising propensity to save, should boost these initiatives. Progressively, the share of banks in the total debt pie should trend to below 50% - the pace and quantum of this would be determined by the growth in other avenues.
Capital requirements could be large for banking sector mainly public banks
PSU Banks still dominate the system; Private banks are consistently taking away market share Public Sector Unit banks currently have 75% loan market share relative to 82% in FY96, it had dipped to 72% in FY08 but has risen again post the global financial crisis.
Figure 98: Loan market share
0%10%20%30%40%50%60%70%80%90%
100%
FY96 FY98 FY00 FY02 FY04 FY06 FY08 FY10 FY12 Dec'13PSU Private Foreign
Source: RBI, Deutsche Bank

1 September 2014
The Wide Angle: India 2020: The Road to East Asia
Deutsche Bank AG/Hong Kong Page 71
Figure 99: Deposits market share
0%10%20%30%40%50%60%70%80%90%
100%
FY96 FY98 FY00 FY02 FY04 FY06 FY08 FY10 FY12 Dec'13PSU Private Foreign
Source: RBI, Deutsche Bank
Figure 100: CASA market share
0%10%20%30%40%50%60%70%80%90%
100%
FY96 FY98 FY00 FY02 FY04 FY06 FY08 FY10 FY12PSU Private Foreign
Source: RBI, Deutsche Bank
Capital requirement will be large – Private banks well positioned, PSU banks will have to raise capital In our view, capitalization of Public Sector Banks remains the only meaningful constraint on the future growth of the Indian banking system. PSU banks which account for ~70% of banking system assets will require large doses of capital. We estimate that PSU banks will require total capital infusion of USD 30bn over the next five years. In comparison private banks are better positioned and would require capital to the tune of USD 1bn.

1 September 2014
The Wide Angle: India 2020: The Road to East Asia
Page 72 Deutsche Bank AG/Hong Kong
Figure 101: Capital requirements – Annual and Total INR m FY15E FY16E FY17E FY18E TOTAL (FY15E-
FY18E) TOTAL CAPITAL
REQUIRED / CURRENT MARKET
CAP
PSU BANKS
Bank of Baroda 0 51,311 80,790 159,096 291,197 81.0%
Bank of India 21,020 68,986 112,181 190,136 392,323 214.3%
Canara Bank 0 34,805 58,548 110,562 203,914 106.6%
Punjab National Bank 0 20,629 66,760 107,499 194,888 57.7%
SBI 0 0 149,542 336,001 485,544 25.3%
Union Bank 9,354 32,124 48,782 82,775 173,035 135.3%
PRIVATE BANKS
Axis Bank 0 0 0 0 0 0.0%
HDFC Bank 0 0 0 0 0 0.0%
ICICI Bank 0 0 0 46,986 46,986 2.8%
Indusind Bank 0 0 0 0 0 0.0%
Kotak Bank 0 0 0 0 0 0.0%
Yes Bank 0 0 0 0 0 0.0%Source: Deutsche Bank
Need deposits to grow much faster One of the key concerns that could emerge for the sector is whether the system has enough deposits to keep growing. Deposit growth has slowed down from a high of 20%+ to only 12% currently. This will fall short of funding the likely credit growth, envisaged over next five years, as India’s funding needs rise. India will either need to improve its financial savings for deposit creation (discussed in the next section) or rely more on foreign sources of funds (discussed below).
The good part about Indian banking system is that it is largely a domestic banking system and the big global crisis like Asian crisis of 1977, US banking crisis of 2008 or European crisis of 2012 had negligible impact on Indian banks. While for growth, the system may have to look globally to raise resources (RBI also needs to ease norms), it will also bring along the global risks along with it.
Tapping international savings Given the huge needs for India’s credit, the government will have to find means to channelize global savings to fund India’s credit needs. Slowly and gradually, it will have to open up the corporate bond market, remove restrictions on FDI / FIIs. Low global interest rates, a stable Indian currency and the likely growth prospects of India could result in international capital funding India’s growth potential.
Key risk of tapping global savings is that money can move out also very quickly and may create unnecessary volatility in India’s debt and currency markets. It will be ideal for RBI to have larger forex resources and the preference should be for long term orientation of foreign flows both in terms of debt and equity. Liberalizing FDI and the longer end of corporate bond market is very crucial in this aspect.
Bankruptcy laws One of the key aspects that may restrict large scale investment in manufacturing and infrastructure is the absence of bankruptcy laws in India. This results in the banking system not willing to take big bets on infrastructure as at times of stress, it is difficult for them to have their influence on promoters and are generally at the mercy of promoters. Having strong bankruptcy laws
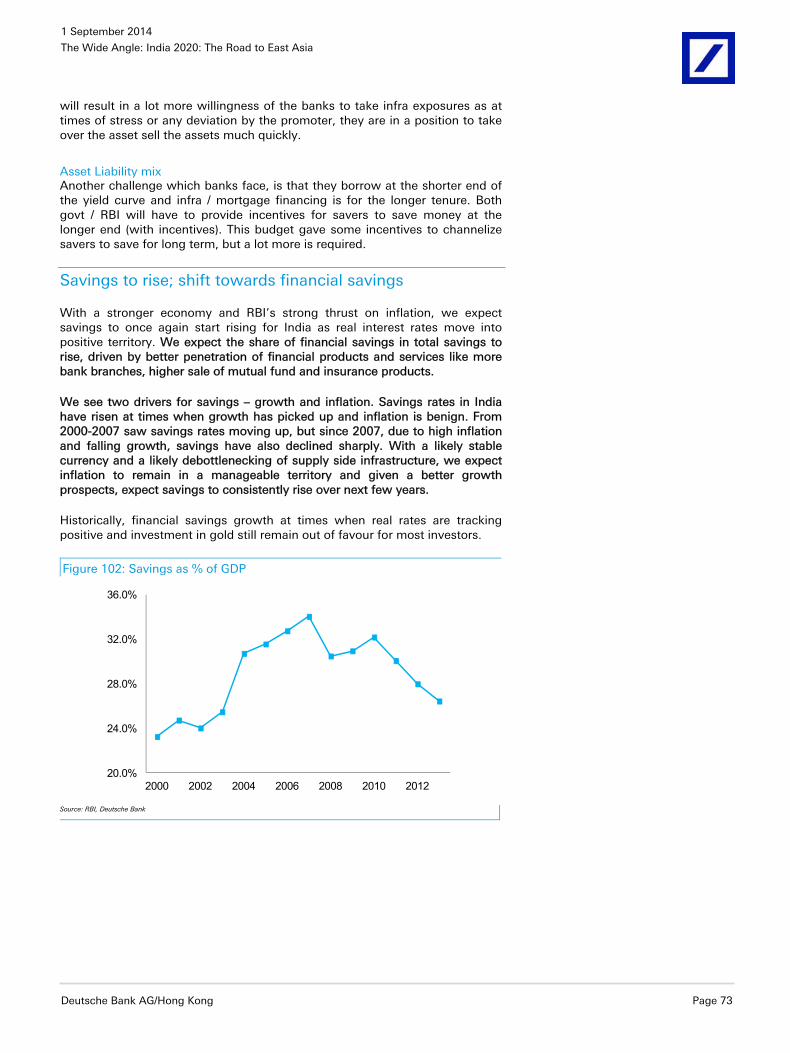
1 September 2014
The Wide Angle: India 2020: The Road to East Asia
Deutsche Bank AG/Hong Kong Page 73
will result in a lot more willingness of the banks to take infra exposures as at times of stress or any deviation by the promoter, they are in a position to take over the asset sell the assets much quickly.
Asset Liability mix Another challenge which banks face, is that they borrow at the shorter end of the yield curve and infra / mortgage financing is for the longer tenure. Both govt / RBI will have to provide incentives for savers to save money at the longer end (with incentives). This budget gave some incentives to channelize savers to save for long term, but a lot more is required.
Savings to rise; shift towards financial savings
With a stronger economy and RBI’s strong thrust on inflation, we expect savings to once again start rising for India as real interest rates move into positive territory. We expect the share of financial savings in total savings to rise, driven by better penetration of financial products and services like more bank branches, higher sale of mutual fund and insurance products.
We see two drivers for savings – growth and inflation. Savings rates in India have risen at times when growth has picked up and inflation is benign. From 2000-2007 saw savings rates moving up, but since 2007, due to high inflation and falling growth, savings have also declined sharply. With a likely stable currency and a likely debottlenecking of supply side infrastructure, we expect inflation to remain in a manageable territory and given a better growth prospects, expect savings to consistently rise over next few years.
Historically, financial savings growth at times when real rates are tracking positive and investment in gold still remain out of favour for most investors.
Figure 102: Savings as % of GDP
20.0%
24.0%
28.0%
32.0%
36.0%
2000 2002 2004 2006 2008 2010 2012
Source: RBI, Deutsche Bank

1 September 2014
The Wide Angle: India 2020: The Road to East Asia
Page 74 Deutsche Bank AG/Hong Kong
Figure 103: Gross domestic savings (% of GDP) 2000 2001 2002 2003 2004 2005 2006 2007 2008 2009 2010 2011 2012 2013
India 23.2% 24.7% 24.0% 25.5% 30.7% 31.5% 32.7% 34.0% 30.5% 30.9% 32.2% 30.0% 28.0% 26.4%
Korea 35.0% 33.1% 32.4% 34.0% 35.9% 34.6% 33.5% 33.7% 33.0% 33.2% 35.2% 34.5% 33.8% 34.1%
China 37.5% 38.4% 40.4% 43.4% 45.9% 47.6% 50.7% 50.5% 51.8% 52.7% 52.0% 50.7% 51.5% 51.8%
Indonesia 32.8% 30.8% 27.7% 32.9% 28.7% 29.2% 30.8% 29.0% 28.9% 33.8% 34.0% 34.3% 33.2% 31.6%
Malaysia 46.1% 41.8% 42.0% 42.5% 43.4% 44.3% 44.5% 43.3% 43.8% 38.1% 40.3% 39.7% 37.6% 35.4%
Singapore 47.2% 44.0% 43.1% 45.2% 49.5% 51.2% 52.2% 53.9% 51.3% 51.2% 54.3% 53.7% 52.8% 52.1%
Thailand 31.5% 30.6% 30.5% 31.8% 31.6% 30.3% 31.8% 34.8% 31.7% 31.8% 33.4% 31.2% 30.9% 32.5%Source: RBI, Deutsche Bank
Figure 104: Financial savings as % of gross domestic savings
0%
5%
10%
15%
20%
25%
30%
35%
40%
45%
2001 2003 2005 2007 2009 2011 2013 2015 2017 2019
Source: RBI, Deutsche Bank
Financial intermediation business will be big – broking, insurance will grow.
Over the past few years share of financial savings in total savings have been declining, we expect this trend to reverse over the next few years.
Life insurance penetration in India has declined from a peak of 4.6% in 2009 to 3.1% in 2013. With equity markets looking up and the overhang of adverse regulation now behind, insurance premiums could grow at least in line with GDP growth – in which case premium growth could be ~15%; but if insurance penetration levels were to inch up to 4%+ levels then premium growth for the industry could exceed 20%.

1 September 2014
The Wide Angle: India 2020: The Road to East Asia
Deutsche Bank AG/Hong Kong Page 75
Figure 105: Insurance penetration (%) 2001 2002 2003 2004 2005 2006 2007 2008 2009 2010 2011 2012 2013
India Life 2.2 2.6 2.3 2.5 2.5 4.1 4.0 4.0 4.6 4.4 3.4 3.2 3.1
Non life 0.6 0.7 0.6 0.7 0.6 0.6 0.6 0.6 0.6 0.7 0.7 0.8 0.8
Total 2.7 3.3 2.9 3.2 3.1 4.8 4.7 4.6 5.2 5.1 4.1 4.0 3.9
China Life NA NA NA 2.2 1.8 1.7 1.8 2.2 2.3 2.5 1.8 1.7 1.6
Non life NA NA NA 1.1 0.9 1.0 1.1 1.0 1.1 1.3 1.2 1.3 1.4
Total NA NA NA 3.3 2.7 2.7 2.9 3.3 3.4 3.8 3.0 3.0 3.0
South Korea Life NA NA NA 6.8 7.3 7.9 8.2 8.0 6.5 7.0 7.0 6.9 7.5
Non life NA NA NA 2.8 3.0 3.2 3.6 3.7 3.9 4.2 4.6 5.3 4.4
Total NA NA NA 9.5 10.3 11.1 11.8 11.8 10.4 11.2 11.6 12.1 11.9
Malaysia Life NA NA NA 3.5 3.6 3.2 3.1 2.8 2.9 3.2 2.8 3.1 3.2
Non life NA NA NA 1.9 1.8 1.7 1.5 1.5 1.6 1.6 2.4 1.7 1.7
Total NA NA NA 5.4 5.4 4.9 4.6 4.3 4.4 4.8 5.1 4.8 4.8
Singapore Life NA NA NA 6.0 6.0 5.4 6.2 6.3 5.1 4.6 4.3 4.4 4.4
Non life NA NA NA 1.5 1.5 1.1 1.5 1.6 1.7 1.6 1.5 1.6 1.6
Total NA NA NA 7.5 7.5 6.5 7.6 7.8 6.8 6.1 5.9 6.0 5.9
Indonesia Life NA NA NA 0.6 0.8 0.8 1.1 0.9 0.9 1.0 1.1 1.2 1.6
Non life NA NA NA 0.7 0.7 0.6 0.5 0.4 0.4 0.5 0.6 0.5 0.5
Total NA NA NA 1.3 1.5 1.3 1.6 1.3 1.3 1.5 1.7 1.8 2.1Source: Deutsche Bank
Similarly, continued buoyancy in capital markets should drive heightened activity on the investment banking and broking side. Currently, retail participation in Indian equity markets (direct as well as indirect via mutual funds) is at fairly low level. This should go up as investor confidence in equity markets goes up.
Asset quality is the key challenge currently – there may be ways to tackle that
The economic downturn of the past three years has created elevated asset quality stress in the banking system with both gross NPL and restructured loans rising sharply. We believe that it will be some time before situation improves on this front. We are already witnessing deleveraging by way of asset sales and equity raising. This should reduce the stress at some of the levered corporates, improving their cash flows and reducing NPL risks.
Government could also consider options like creating a bad bank which will hold all the stressed assets of the PSU banks. This will help to reduce earnings and capital pressure at PSU banks.
Evaluating a holding company structure for PSU banks
The P J Nayak Committee report on banking reforms recommended constituting a Bank Investment Company (BIC) Structure for Public Sector Banks (PSBs). This was in line with thee
ir thought process that the Government should distance itself from bank governance functions which it presently discharges and transfers its holdings in banks to the BIC. The report also drew parallels of such an arrangement with similar structures across other countries, namely China, UK, Singapore and Belgium (Table 1).

1 September 2014
The Wide Angle: India 2020: The Road to East Asia
Page 76 Deutsche Bank AG/Hong Kong
Figure 106: Types of government interventions in public sector banks Structure Government-as-Investor: Government-as-Owner: Government-as-Sovereign:
Case Study Singapore, UK, Brazil Followed in Brazil Followed in China
Role of Government Maximizing return on equity Operational control Extension of state policy
Role of Investment company
Operationally distances the Governments from the banks
NA Present but largely considered as a bureaucratic function
Freedom to Investment company
The independence to divest NA •Low/No independence
Independence of members of the Board of the Bank
The board is fully empowered and carries out management and governance
Government appointees; boards less empowered
Government appointees; boards less empowered
Regulation Only by the central bank Dual; from Government as well as the central bank
Dual; from Government as well as the central bank of the country
Suggested by RBI to be implemented in India
Source: Deutsche Bank, RBI Report of The Committee to Review Governance of Boards of Banks in India, May 2014
Axis Bank governance structure could serve as a role model Axis Bank was initially owned by UTI and a clutch of public sector insurance companies. Although ownership was 100% in the public sector, it was awarded a private sector bank license. Even after the bank was listed in 1998, it continued with a majority public sector shareholding, right upto February 2003, when the UTI shareholding was transferred to the Special Undertaking of the Unit Trust of India (SUUTI). Since then, the Government-as-Investor stance has characterised the control of the Bank, with SUUTI acting as a special purpose vehicle holding the investment on behalf of the Government. The CEO is appointed by the bank's board, and because the bank was licensed in the private sector, it sets its own employee compensation. SUUTI appoints the non-executive Chairman and upto two directors on the Board, and there is no direct intervention by the Finance Ministry.
Multiple hurdles to clear in the way of proposed structure The proposed structure would require the Government to move Parliament to enact legislative action to repeal Acts through which public sector banks are set up as statutory bodies, incorporating these banks thereafter under the Companies Act. The government’s stakes in these banks would then be transferred to the BIC, with the Government initially holding the entire equity in the investment vehicle. This phase will also see the constitution of a professional board for BIC. All existing ownership functions presently undertaken in relation to banks could get transferred from the Government to the BIC.
We also see potential for empowerment of bank boards, through the transfer of all ownership functions from BIC to the bank boards. The appointments of independent bank directors, CEOs and other wholetime directors would become the responsibility of the bank boards, guided by BIC, which would continue to have a limited number of nominee directors on each bank board.
Evaluating TARP mechanism to address bad debts concerns
A benchmark for India to approach the issue of rising NPAs, especially within PSU banks would be to adopt a similar approach as the Troubled Assets Relief Program (TARP) in the US. However, this requires a deep understanding of how TARP functioned in the US and its success factors.

1 September 2014
The Wide Angle: India 2020: The Road to East Asia
Deutsche Bank AG/Hong Kong Page 77
The US announced the Troubled Asset Relief Pogram (TARP) on October 14, 2008, in response to the financial crisis which had elevated to dangerous levels by then. TARP initially authorized a purchase or insurance of USD 700 billion of toxic assets held by banks/financial institutions (which was later lowered to $475 billion with the passing of the Dodd-Frank Act in 2010). Even prior to implementation, the objective of TARP was revised from the purchase of toxic assets to capital injections which would help shore up the banking system’s balance sheets and provide cushion against losses on toxic assets.
The cost of the Program was eventually very low The budgeted cost of TARP has fallen significantly since it was first introduced by the government. From an initial budgeted estimate of $356 billion in FY09, the cost was revised down to $109 billion in March 2010 and further lowered to $21 billion (excluding effects of time-value) in April 2013. The cost of support for AIG, auto manufacturers and home owners was $48 billion while on the banks it resulted in a gain of $28 billion. If we draw parallels to the savings and loan banks crisis during 1986 to 1995, where about 1,043 or a third of all such institutions failed, the cost of bailout was $160 billion, of which $132.1 billion was taken from tax payers’ funds.
Key takeaways – The benefits from TARP It was successful due to the following factors:
It instantly helped restore market confidence and gradually opened up the interbank markets which were virtually frozen
All big banks were forced to take infusion together so that only the banks that requested for TARP are not perceived as relatively weaker/risker by the market
The Treasury funded 707 banks and only 30 of these had failed
Since the implementation of TARP, US commercial banks have significantly improved their capital strength on the balance sheet, with the equity to assets ratio improving from 9.6% at the end of Q3 2009 to 10.5% at the end of Q2 2009 and 11.2% at the end of Q1 2014.
Manish Karwa
+91 22 7180 4212
Manish Shukla
+91 22 7180 4211
1 September 2014
The Wide Angle: India 2020: The Road to East Asia
Page 78 Deutsche Bank AG/Hong Kong
The Wide Angle Series

1 September 2014
The Wide Angle: India 2020: The Road to East Asia
Deutsche Bank AG/Hong Kong Page 79
The Wide Angle Series (contd…)
The Random Walk Series

1 September 2014
The Wide Angle: India 2020: The Road to East Asia
Page 80 Deutsche Bank AG/Hong Kong
Appendix 1
Important Disclosures Additional information available upon request For disclosures pertaining to recommendations or estimates made on securities other than the primary subject of this research, please see the most recently published company report or visit our global disclosure look-up page on our website at http://gm.db.com/ger/disclosure/DisclosureDirectory.eqsr Analyst Certification
The views expressed in this report accurately reflect the personal views of the undersigned lead analyst(s). In addition, the undersigned lead analyst(s) has not and will not receive any compensation for providing a specific recommendation or view in this report. Sanjeev Sanyal/Abhay Laijawala/Michael Spencer/Taimur Baig/Manish Saxena/Abhishek Puri/Harshad Katkar/Manish Karwa/Srinivas Rao

1 September 2014
The Wide Angle: India 2020: The Road to East Asia
Deutsche Bank AG/Hong Kong Page 81
Regulatory Disclosures
1. Important Additional Conflict Disclosures Aside from within this report, important conflict disclosures can also be found at https://gm.db.com/equities under the "Disclosures Lookup" and "Legal" tabs. Investors are strongly encouraged to review this information before investing.
2. Short-Term Trade Ideas
Deutsche Bank equity research analysts sometimes have shorter-term trade ideas (known as SOLAR ideas) that are consistent or inconsistent with Deutsche Bank's existing longer term ratings. These trade ideas can be found at the SOLAR link at http://gm.db.com.
3. Country-Specific Disclosures
Australia and New Zealand: This research, and any access to it, is intended only for "wholesale clients" within the meaning of the Australian Corporations Act and New Zealand Financial Advisors Act respectively. Brazil: The views expressed above accurately reflect personal views of the authors about the subject company(ies) and its(their) securities, including in relation to Deutsche Bank. The compensation of the equity research analyst(s) is indirectly affected by revenues deriving from the business and financial transactions of Deutsche Bank. In cases where at least one Brazil based analyst (identified by a phone number starting with +55 country code) has taken part in the preparation of this research report, the Brazil based analyst whose name appears first assumes primary responsibility for its content from a Brazilian regulatory perspective and for its compliance with CVM Instruction # 483. EU countries: Disclosures relating to our obligations under MiFiD can be found at http://www.globalmarkets.db.com/riskdisclosures. Japan: Disclosures under the Financial Instruments and Exchange Law: Company name - Deutsche Securities Inc. Registration number - Registered as a financial instruments dealer by the Head of the Kanto Local Finance Bureau (Kinsho) No. 117. Member of associations: JSDA, Type II Financial Instruments Firms Association, The Financial Futures Association of Japan, Japan Investment Advisers Association. This report is not meant to solicit the purchase of specific financial instruments or related services. We may charge commissions and fees for certain categories of investment advice, products and services. Recommended investment strategies, products and services carry the risk of losses to principal and other losses as a result of changes in market and/or economic trends, and/or fluctuations in market value. Before deciding on the purchase of financial products and/or services, customers should carefully read the relevant disclosures, prospectuses and other documentation. "Moody's", "Standard & Poor's", and "Fitch" mentioned in this report are not registered credit rating agencies in Japan unless "Japan" or "Nippon" is specifically designated in the name of the entity. Malaysia: Deutsche Bank AG and/or its affiliate(s) may maintain positions in the securities referred to herein and may from time to time offer those securities for purchase or may have an interest to purchase such securities. Deutsche Bank may engage in transactions in a manner inconsistent with the views discussed herein. Qatar: Deutsche Bank AG in the Qatar Financial Centre (registered no. 00032) is regulated by the Qatar Financial Centre Regulatory Authority. Deutsche Bank AG - QFC Branch may only undertake the financial services activities that fall within the scope of its existing QFCRA license. Principal place of business in the QFC: Qatar Financial Centre, Tower, West Bay, Level 5, PO Box 14928, Doha, Qatar. This information has been distributed by Deutsche Bank AG. Related financial products or services are only available to Business Customers, as defined by the Qatar Financial Centre Regulatory Authority. Russia: This information, interpretation and opinions submitted herein are not in the context of, and do not constitute, any appraisal or evaluation activity requiring a license in the Russian Federation. Kingdom of Saudi Arabia: Deutsche Securities Saudi Arabia LLC Company, (registered no. 07073-37) is regulated by the Capital Market Authority. Deutsche Securities Saudi Arabia may only undertake the financial services activities that fall within the scope of its existing CMA license. Principal place of business in Saudi Arabia: King Fahad Road, Al Olaya District, P.O. Box 301809, Faisaliah Tower - 17th Floor, 11372 Riyadh, Saudi Arabia. United Arab Emirates: Deutsche Bank AG in the Dubai International Financial Centre (registered no. 00045) is regulated by the Dubai Financial Services Authority. Deutsche Bank AG - DIFC Branch may only undertake the financial services activities that fall within the scope of its existing DFSA license. Principal place of business in the DIFC: Dubai International Financial Centre, The Gate Village, Building 5, PO Box 504902, Dubai, U.A.E. This information has been distributed by Deutsche Bank AG. Related financial products or services are only available to Professional Clients, as defined by the Dubai Financial Services Authority.

1 September 2014
The Wide Angle: India 2020: The Road to East Asia
Page 82 Deutsche Bank AG/Hong Kong
Risks to Fixed Income Positions Macroeconomic fluctuations often account for most of the risks associated with exposures to instruments that promise to pay fixed or variable interest rates. For an investor that is long fixed rate instruments (thus receiving these cash flows), increases in interest rates naturally lift the discount factors applied to the expected cash flows and thus cause a loss. The longer the maturity of a certain cash flow and the higher the move in the discount factor, the higher will be the loss. Upside surprises in inflation, fiscal funding needs, and FX depreciation rates are among the most common adverse macroeconomic shocks to receivers. But counterparty exposure, issuer creditworthiness, client segmentation, regulation (including changes in assets holding limits for different types of investors), changes in tax policies, currency convertibility (which may constrain currency conversion, repatriation of profits and/or the liquidation of positions), and settlement issues related to local clearing houses are also important risk factors to be considered. The sensitivity of fixed income instruments to macroeconomic shocks may be mitigated by indexing the contracted cash flows to inflation, to FX depreciation, or to specified interest rates - these are common in emerging markets. It is important to note that the index fixings may -- by construction -- lag or mis-measure the actual move in the underlying variables they are intended to track. The choice of the proper fixing (or metric) is particularly important in swaps markets, where floating coupon rates (i.e., coupons indexed to a typically short-dated interest rate reference index) are exchanged for fixed coupons. It is also important to acknowledge that funding in a currency that differs from the currency in which the coupons to be received are denominated carries FX risk. Naturally, options on swaps (swaptions) also bear the risks typical to options in addition to the risks related to rates movements.

GRCM2014PROD032680
David Folkerts-Landau
Group Chief Economist Member of the Group Executive Committee
Guy Ashton
Global Chief Operating Officer Research
Marcel Cassard Global Head
FICC Research & Global Macro Economics
Richard Smith and Steve Pollard Co-Global Heads Equity Research
Michael Spencer Regional Head
Asia Pacific Research
Ralf Hoffmann Regional Head
Deutsche Bank Research, Germany
Andreas Neubauer Regional Head
Equity Research, Germany
Steve Pollard Regional Head
Americas Research
International Locations
Deutsche Bank AG Deutsche Bank Place Level 16 Corner of Hunter & Phillip Streets Sydney, NSW 2000 Australia Tel: (61) 2 8258 1234
Deutsche Bank AG Große Gallusstraße 10-14 60272 Frankfurt am Main Germany Tel: (49) 69 910 00
Deutsche Bank AG Filiale Hongkong International Commerce Centre, 1 Austin Road West,Kowloon, Hong Kong Tel: (852) 2203 8888
Deutsche Securities Inc. 2-11-1 Nagatacho Sanno Park Tower Chiyoda-ku, Tokyo 100-6171 Japan Tel: (81) 3 5156 6770
Deutsche Bank AG London 1 Great Winchester Street London EC2N 2EQ United Kingdom Tel: (44) 20 7545 8000
Deutsche Bank Securities Inc. 60 Wall Street New York, NY 10005 United States of America Tel: (1) 212 250 2500
Global Disclaimer The information and opinions in this report were prepared by Deutsche Bank AG or one of its affiliates (collectively "Deutsche Bank"). The information herein is believed to be reliable and has been obtained from public sources believed to be reliable. Deutsche Bank makes no representation as to the accuracy or completeness of such information.
Deutsche Bank may engage in securities transactions, on a proprietary basis or otherwise, in a manner inconsistent with the view taken in this research report. In addition, others within Deutsche Bank, including strategists and sales staff, may take a view that is inconsistent with that taken in this research report.
Opinions, estimates and projections in this report constitute the current judgement of the author as of the date of this report. They do not necessarily reflect the opinions of Deutsche Bank and are subject to change without notice. Deutsche Bank has no obligation to update, modify or amend this report or to otherwise notify a recipient thereof in the event that any opinion, forecast or estimate set forth herein, changes or subsequently becomes inaccurate. Prices and availability of financial instruments are subject to change without notice. This report is provided for informational purposes only. It is not an offer or a solicitation of an offer to buy or sell any financial instruments or to participate in any particular trading strategy. Target prices are inherently imprecise and a product of the analyst judgement. The financial instruments discussed in this report may not be suitable for all investors and investors must make their own informed investment decisions. Stock transactions can lead to losses as a result of price fluctuations and other factors. If a financial instrument is denominated in a currency other than an investor's currency, a change in exchange rates may adversely affect the investment. Past performance is not necessarily indicative of future results. Deutsche Bank may with respect to securities covered by this report, sell to or buy from customers on a principal basis, and consider this report in deciding to trade on a proprietary basis.
Derivative transactions involve numerous risks including, among others, market, counterparty default and illiquidity risk. The appropriateness or otherwise of these products for use by investors is dependent on the investors' own circumstances including their tax position, their regulatory environment and the nature of their other assets and liabilities and as such investors should take expert legal and financial advice before entering into any transaction similar to or inspired by the contents of this publication. Trading in options involves risk and is not suitable for all investors. Prior to buying or selling an option investors must review the "Characteristics and Risks of Standardized Options," at http://www.theocc.com/components/docs/riskstoc.pdf . If you are unable to access the website please contact Deutsche Bank AG at +1 (212) 250-7994, for a copy of this important document.
The risk of loss in futures trading and options, foreign or domestic, can be substantial. As a result of the high degree of leverage obtainable in futures and options trading losses may be incurred that are greater than the amount of funds initially deposited.
Unless governing law provides otherwise, all transactions should be executed through the Deutsche Bank entity in the investor's home jurisdiction. In the U.S. this report is approved and/or distributed by Deutsche Bank Securities Inc., a member of the NYSE, the NASD, NFA and SIPC. In Germany this report is approved and/or communicated by Deutsche Bank AG Frankfurt authorized by the BaFin. In the United Kingdom this report is approved and/or communicated by Deutsche Bank AG London, a member of the London Stock Exchange and regulated by the Financial Conduct Authority for the conduct of investment business in the UKand authorized by the BaFin. This report is distributed in Hong Kong by Deutsche Bank AG, Hong Kong Branch, in Korea by Deutsche Securities Korea Co. This report is distributed in Singapore by Deutsche Bank AG, Singapore Branch or Deutsche Securities Asia Limited, Singapore Branch (One Raffles Quay #18-00 South Tower Singapore 048583, +65 6423 8001), and recipients in Singapore of this report are to contact Deutsche Bank AG, Singapore Branch or Deutsche Securities Asia Limited, Singapore Branch in respect of any matters arising from, or in connection with, this report. Where this report is issued or promulgated in Singapore to aperson who is not an accredited investor, expert investor or institutional investor (as defined in the applicable Singapore laws and regulations), Deutsche Bank AG, Singapore Branch or Deutsche Securities Asia Limited, Singapore Branch accepts legal responsibility to such person for the contents of this report. In Japan this report is approved and/or distributed by Deutsche Securities Inc. The information contained in this report does not constitute the provision of investment advice. In Australia, retail clients should obtain a copy of a Product Disclosure Statement (PDS) relating to any financial product referred to in this report and consider the PDS before making any decision about whether to acquire the product. Deutsche Bank AG Johannesburg is incorporated in the Federal Republic of Germany (Branch Register Number in South Africa: 1998/003298/10). Additional information relative to securities, other financial products or issuers discussed in this report is available upon request. This report may not be reproduced, distributed or published by any person for any purpose without Deutsche Bank's prior written consent. Please cite source when quoting.
Copyright © 2014 Deutsche Bank AG