The Westerbork SINGS Survey II. - ASTRONheald/papers/wsrtsings2.pdf · The Westerbork SINGS Survey...
27
Astronomy & Astrophysics manuscript no. sings c ESO 2009 May 25, 2009 The Westerbork SINGS Survey II. Polarization, Faraday Rotation, and Magnetic Fields G. Heald 1 , R. Braun 2 , and R. Edmonds 3 1 Netherlands Institute for Radio Astronomy (ASTRON), Postbus 2, 7990 AA Dwingeloo, The Netherlands 2 CSIRO-ATNF, PO Box 76, Epping, NSW 1710, Australia 3 New Mexico State University, Department of Astronomy, PO Box 30001, MSC 4500, Las Cruces, New Mexico, 88003-8001, USA Received 1 April 2009 / Accepted 20 May 2009 ABSTRACT A sample of large northern Spitzer Infrared Nearby Galaxies Survey (SINGS) galaxies has recently been observed with the Westerbork Synthesis Radio Telescope (WSRT). We present observations of the linearly polarized radio continuum emission in this WSRT-SINGS galaxy sample. Of the 28 galaxies treated in this paper, 21 are detected in polarized radio continuum at 18- and 22-cm wavelengths. We utilize the rotation measure synthesis (RM-Synthesis) method, as implemented by Brentjens & de Bruyn, to coherently detect polarized emission from a large fractional bandwidth, while simultaneously assessing the degree of Faraday rotation experienced by the radiation along each line-of-sight. This represents the first time that the polarized emission and its Faraday rotation have been systematically probed down to ∼ 10 μJy beam −1 RMS for a large sample of galaxies. Non-zero Faraday rotation is found to be ubiquitous in all of the target fields, from both the Galactic foreground and the target galaxies themselves. In this paper, we present an overview of the polarized emission detected in each of the WSRT-SINGS galaxies. The most prominent trend is a systematic modulation of the polarized intensity with galactic azimuth, such that a global minimum in the polarized intensity is seen toward the kinematically receding major axis. The implied large-scale magnetic field geometry is discussed in a companion paper. A second novel result is the detection of multiple nuclear Faraday depth components that are offset to both positive and negative RM by 100 − 200 rad m −2 in all targets that host polarized (circum-)nuclear emission. Key words. ISM: magnetic fields – Galaxies: magnetic fields – Radio continuum: galaxies 1. Introduction In the study of star formation properties and evolution of galax- ies, an important ingredient is the magnetic field content of the ISM. Yet the precise role that magnetic fields play in regulating star formation, and the role of magnetic fields in the evolution of galaxy disks, is still far from well understood. One reason for this gap is that a systematic survey of magnetic field content in galaxies over a range of Hubble type and star formation proper- ties had, until recently, not been performed. Magnetic fields are expected to play an important role in sev- eral aspects of star formation and galaxy evolution. First, mag- netic fields are a crucial consideration in the energy balance of the ISM (e.g., Beck 2007), and in particular are likely important in determining the conditions for gravitational instability that lead to the inital stages of star formation (McKee & Ostriker 2007). Magnetic fields are expected to be important agents in helping to shape galactic evolution on large scales (Boulares & Cox 1990), while the longevity of familiar morphological features such as spiral arm “spurs” may be dependent on the presence of ordered magnetic fields (Shetty & Ostriker 2006). Finally, magnetic fields may be an important piece of the puzzle in understanding how the disk-halo interaction proceeds (e.g., T¨ ullmann et al. 2000), and thus in determining how matter and energy are redistributed throughout a galactic disk and indeed within galaxy groups and clusters by feedback processes. Clearly, magnetic fields should be a major consideration in the study of star formation and galaxy evolution. However, Send offprint requests to: George Heald, e-mail: [email protected] observational measurements of the magnetic fields in nearby galaxies are relatively few. A review of the available observa- tions is not warranted here, but some of the most recent stud- ies, obtained with widely varying observational setups, include those of: NGC 6946 (Beck 2007); NGC 5194 (Berkhuijsen et al. 1997); NGC 4254 (Chy˙ zy et al. 2007); and the Large Magellanic Cloud (Gaensler et al. 2005). Taken together, all of the observa- tions indicate a tendency for magnetic fields to be oriented in spiral patterns in disk galaxies, even in galaxies with no spi- ral structure visible in the gaseous or stellar morphology (e.g. NGC 4414; Soida et al. 2002). Where spiral arms are visible, the fields tend to be more ordered in the interarm regions. Halos seem to have large-scale magnetic fields; the ordered fields typi- cally lie parallel to the disk in edge-on galaxies, and then turn to a more perpendicular orientation as distance from the midplane increases. Information about the magnetic fields in galaxies is most effi- ciently obtained using two complementary techniques. The non- thermal synchtrotron emission generated by relativistic electrons spiraling in a magnetic field oriented perpendicular to the line of sight (LOS) is linearly polarized. The electric field vector of the polarized radiation is oriented perpendicular to the magnetic field that accelerates the source electrons, and the radiation it- self is beamed parallel to the trajectory of the ultra-relativistic electron. Thus, the plane of polarization of the observed syn- chrotron radiation is directly related to the component of the magnetic field perpendicular to the LOS ( B ⊥ ) in the observed object. Moreover, the synchrotron emissivity is proportional to the product of B 1+α ⊥ and the relativistic electron density n CR ,
Transcript of The Westerbork SINGS Survey II. - ASTRONheald/papers/wsrtsings2.pdf · The Westerbork SINGS Survey...
Astronomy & Astrophysicsmanuscript no. sings c© ESO 2009May 25, 2009
The Westerbork SINGS Survey II.Polarization, Faraday Rotation, and Magnetic Fields
G. Heald1, R. Braun2, and R. Edmonds3
1 Netherlands Institute for Radio Astronomy (ASTRON), Postbus 2, 7990 AA Dwingeloo, The Netherlands2 CSIRO-ATNF, PO Box 76, Epping, NSW 1710, Australia3 New Mexico State University, Department of Astronomy, PO Box 30001, MSC 4500, Las Cruces, New Mexico, 88003-8001, USA
Received 1 April 2009/ Accepted 20 May 2009
ABSTRACT
A sample of large northern Spitzer Infrared Nearby GalaxiesSurvey (SINGS) galaxies has recently been observed with theWesterborkSynthesis Radio Telescope (WSRT). We present observationsof the linearly polarized radio continuum emission in this WSRT-SINGSgalaxy sample. Of the 28 galaxies treated in this paper, 21 are detected in polarized radio continuum at 18- and 22-cm wavelengths.We utilize the rotation measure synthesis (RM-Synthesis) method, as implemented by Brentjens & de Bruyn, to coherentlydetectpolarized emission from a large fractional bandwidth, while simultaneously assessing the degree of Faraday rotation experienced bythe radiation along each line-of-sight. This represents the first time that the polarized emission and its Faraday rotation have beensystematically probed down to∼ 10 µJy beam−1 RMS for a large sample of galaxies. Non-zero Faraday rotation is found to beubiquitous in all of the target fields, from both the Galacticforeground and the target galaxies themselves. In this paper, we presentan overview of the polarized emission detected in each of theWSRT-SINGS galaxies. The most prominent trend is a systematicmodulation of the polarized intensity with galactic azimuth, such that a global minimum in the polarized intensity is seen towardthe kinematically receding major axis. The implied large-scale magnetic field geometry is discussed in a companion paper. A secondnovel result is the detection of multiple nuclear Faraday depth components that are offset to both positive and negative RM by100− 200 rad m−2 in all targets that host polarized (circum-)nuclear emission.
Key words. ISM: magnetic fields – Galaxies: magnetic fields – Radio continuum: galaxies
1. Introduction
In the study of star formation properties and evolution of galax-ies, an important ingredient is the magnetic field content oftheISM. Yet the precise role that magnetic fields play in regulatingstar formation, and the role of magnetic fields in the evolutionof galaxy disks, is still far from well understood. One reason forthis gap is that a systematic survey of magnetic field contentingalaxies over a range of Hubble type and star formation proper-ties had, until recently, not been performed.
Magnetic fields are expected to play an important role in sev-eral aspects of star formation and galaxy evolution. First,mag-netic fields are a crucial consideration in the energy balance ofthe ISM (e.g., Beck 2007), and in particular are likely importantin determining the conditions for gravitational instability thatlead to the inital stages of star formation (McKee & Ostriker2007). Magnetic fields are expected to be important agents inhelping to shape galactic evolution on large scales (Boulares& Cox 1990), while the longevity of familiar morphologicalfeatures such as spiral arm “spurs” may be dependent on thepresence of ordered magnetic fields (Shetty & Ostriker 2006).Finally, magnetic fields may be an important piece of the puzzlein understanding how the disk-halo interaction proceeds (e.g.,Tullmann et al. 2000), and thus in determining how matter andenergy are redistributed throughout a galactic disk and indeedwithin galaxy groups and clusters by feedback processes.
Clearly, magnetic fields should be a major considerationin the study of star formation and galaxy evolution. However,
Send offprint requests to: George Heald, e-mail:[email protected]
observational measurements of the magnetic fields in nearbygalaxies are relatively few. A review of the available observa-tions is not warranted here, but some of the most recent stud-ies, obtained with widely varying observational setups, includethose of: NGC 6946 (Beck 2007); NGC 5194 (Berkhuijsen et al.1997); NGC 4254 (Chyzy et al. 2007); and the Large MagellanicCloud (Gaensler et al. 2005). Taken together, all of the observa-tions indicate a tendency for magnetic fields to be oriented inspiral patterns in disk galaxies, even in galaxies with no spi-ral structure visible in the gaseous or stellar morphology (e.g.NGC 4414; Soida et al. 2002). Where spiral arms are visible,the fields tend to be more ordered in the interarm regions. Halosseem to have large-scale magnetic fields; the ordered fields typi-cally lie parallel to the disk in edge-on galaxies, and then turn toa more perpendicular orientation as distance from the midplaneincreases.
Information about the magnetic fields in galaxies is most effi-ciently obtained using two complementary techniques. The non-thermal synchtrotron emission generated by relativistic electronsspiraling in a magnetic field oriented perpendicular to the lineof sight (LOS) is linearly polarized. The electric field vector ofthe polarized radiation is oriented perpendicular to the magneticfield that accelerates the source electrons, and the radiation it-self is beamed parallel to the trajectory of the ultra-relativisticelectron. Thus, the plane of polarization of the observed syn-chrotron radiation is directly related to the component of themagnetic field perpendicular to the LOS (B⊥) in the observedobject. Moreover, the synchrotron emissivity is proportional tothe product ofB1+α
⊥ and the relativistic electron densitynCR,

2 G. Heald et al.: The Westerbork SINGS Survey II.
whereα is the spectral index (e.g., Longair 1994). This makesthe observed polarized intensity itself a good tracer ofB⊥. Thisstraightforward correspondence is complemented by the secondtechnique for measuring magnetic fields: Faraday rotation.Thiseffect is produced when polarized radiation passes through amagnetized plasma, which is birefringent (Gardner & Whiteoak1963). The intrinsic linear polarization angles of the radiationare rotated by a different angle depending on the wavelength ofthe radiation. The effect is characterized by the Faraday “rota-tion measure”. The value of the rotation measure (RM) is depen-dent on the electron densityne in the magnetized plasma, and thecomponent of the magnetic field along the LOS (B‖). The signof RM is determined by whetherB‖ points toward or away fromthe observer. See§ 2.2 for an in-depth discussion.
The Spitzer Infrared Nearby Galaxies Survey (SINGS;Kennicutt et al. 2003) was conceived as a multi-wavelengthLegacy program intended to address the question of how starsform in a wide range of galactic ISM environments. The strengthof such a concerted survey campaign is that it draws togetherdata over the widest possible range of observing bands to pro-vide as much information as possible about the physical condi-tions in the galaxy ISM being investigated. Gaps in the coverageare generally covered by supplementary surveys such as The Hi
Nearby Galaxy Survey (THINGS; Walter et al. 2008).One such supplementary survey is the Westerbork SINGS
survey (WSRT-SINGS; Braun et al. 2007), which provides 18-and 22-cm radio continuum data, in all four Stokes parameters,for a subset of the SINGS galaxies (the survey selection criteriaare discussed below). Together with the SINGS survey itself, thedata provided by the WSRT supplement enable, for example, in-vestigation into the origin of the FIR-radio correlation (Murphyet al. 2006). In this paper and a companion work (Braun, Heald& Beck 2009; hereafter Paper III), we utilize the linear polariza-tion products of the WSRT-SINGS data to investigate the mag-netic field content of the ISM in the subsample galaxies.
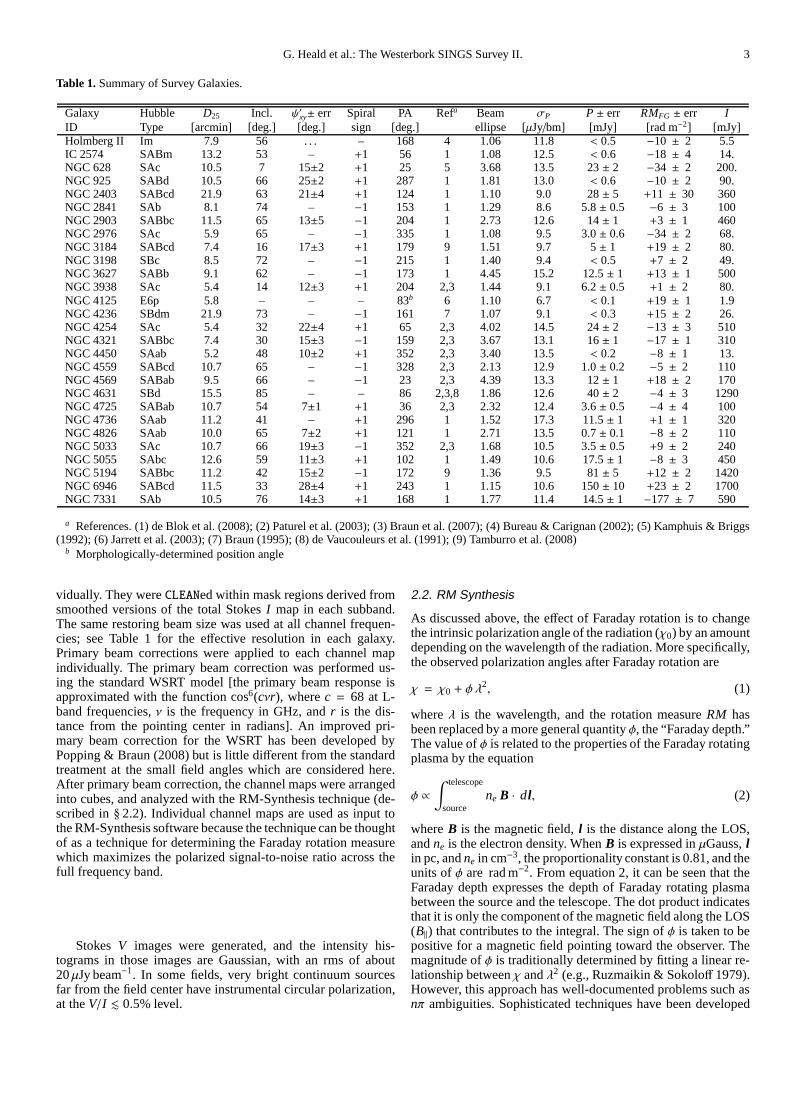
Of the galaxies that make up the SINGS sample, not all areobservable with the WSRT. Because the individual antennas arearranged in a linear east-west array, the synthesized beam is sig-nificantly extended in the north-south direction when observingobjects at low declination. At the frequencies observed in thissurvey, the synthesized beam would be& 1′ for sources atδ <12.5◦; we therefore exclude galaxies below this declination limit.Furthermore, in order to ensure that the galaxies themselves arelarge enough on the sky that they are spatially resolved, thead-ditional criterion was adopted that the optical B band diameter ata surface brightness of 25 mag arcsec−2, D25 > 5′. With the ad-dition of four galaxies in the Starburst sample of G. Rieke, ato-tal of 34 galaxies were observed in the WSRT-SINGS program.Twenty-eight of those galaxies are studied here; their proper-ties are summarized in Table 1. The columns are (1) Galaxy ID;(2) RC3 Hubble type; (3)D25; (4) Inclination; (5) Spiral pitchangle (from Kennicutt (1981)); (6) Spiral sense (+1 for counter-clockwise,−1 for clockwise); (7) Kinematic PA (measured eastof north) of the receding major axis; (8) Reference for inclina-tion and PA values; (9) Synthesized beam ellipticity (a/b, wherethe minor axis of the beam is in all casesb = 15′′, and the beamposition angle is 0◦; (10) Noise levels inP; (11) Integrated fluxin P with an estimated error; (12) Estimated foreground RM thatapplies to the target field; (13) Integrated 1365 MHz flux inI(from Braun et al. (2007)).
This paper is organized as follows. We describe the observa-tions and data reduction steps in§2, with a particular emphasison describing the RM-Synthesis method (§2.2), which is a criti-cal component of the analysis utilized in this work. An overview
of the polarized emission detected in each of the survey galax-ies is presented in§3. For those galaxies with detected polar-ized emission, a discussion of some derivable characteristics isgiven in§4. Properties of the global magnetic field geometriesrevealed by these observations are treated in detail in Paper III.A more detailed study of individual galaxies will form the basisof forthcoming work. We conclude the paper in§ 5 and providean outlook for future investigations.
2. Observations and Data Reduction
2.1. Data collection and ‘standard’ data reduction
The observational parameters of the WSRT-SINGS survey werepresented in detail by Braun et al. (2007), and we list the mostrelevant points here. Each galaxy was observed for at least 12hr in two bands covering the ranges 1300–1432 and 1631–1763MHz (22- and 18-cm, respectively). The observing band wasswitched every 5 minutes during an individual synthesis. Ineachband, the correlator was set up to provide 512 channels separatedby 312.5 kHz. Eight 20-MHz subbands (64 channels each) wereused at each observing frequency, and the central subband fre-quencies were arranged to be separated by 16 MHz. This setupallows us to disregard frequency channels suffering from band-pass rolloff (which affects each of the individual subbands), andmaximizes the continuity of the frequency coverage while stillproviding a large total bandwidth. Data were obtained in allfourStokes parameters.
The basic data reduction steps of each 20 MHz subband arealso discussed by Braun et al. (2007); we repeat the most rel-evant details here. After careful editing of incidental radio fre-quency interference (RFI) the bandpass calibration in amplitudeand phase was determined using the calibration sources 3C147,3C286, CTD93 and 3C138 within theAIPS package (Greisen2003). Relative broadband gains in the two perpendicular linearpolarizations (X and Y) were then determined, after modifica-tions to several key tasks (SETJY andCALIB) to enable the rep-resentation of source models, and the calculation of gain solu-tions, with arbitrary values of the Stokes parameters (I,Q,U,V).This was necessary to permit an equivalent representation ofthe measured linear polarization products (with an unchang-ing parallactic angle) within a software package that normallyassumes right- and left-handed circular polarization products.Basic polarization calibration was then accomplished by deter-mining the cross-polarization leakage from 3C147, under the as-sumption that this source is intrinsically unpolarized. The phaseoffset of the X and Y polarizations (which is assumed to re-main constant during each 12 hr track) was then determined us-ing the linearly polarized emission properties of either 3C286[e.g. (I,Q,U,V)=(14.65,0.56,1.26,0.00) Jy near 1400 MHz] or3C138. In cases where both 3C286 and 3C138 were observedbracketing the 12 hr target track, it was possible to determinethe consistency of the phase offset, which was found to be con-stant to better than 1–2 degrees. After a final check that the cor-rect Stokes parameters were recovered for all calibration sources(both polarized and unpolarized), the calibrated data wereex-ported from theAIPS package. Further refinement of the polar-ization calibration was accomplished via self-calibration of each20 MHz subband within the Miriad package (Sault et al. 1995)using the detected emission in each target field in StokesI,QandU. This step corrects for time-variable instrumental or iono-spheric phase errors.
Following these reduction steps, theQ andU maps in eachnarrowband frequency channel (of 312.5 kHz) were imaged indi-
G. Heald et al.: The Westerbork SINGS Survey II. 3
Table 1. Summary of Survey Galaxies.
Galaxy Hubble D25 Incl. ψ′xy± err Spiral PA Refa Beam σP P ± err RMFG ± err IID Type [arcmin] [deg.] [deg.] sign [deg.] ellipse [µJy/bm] [mJy] [rad m−2] [mJy]Holmberg II Im 7.9 56 . . . – 168 4 1.06 11.8 < 0.5 −10 ± 2 5.5IC 2574 SABm 13.2 53 – +1 56 1 1.08 12.5 < 0.6 −18 ± 4 14.NGC 628 SAc 10.5 7 15±2 +1 25 5 3.68 13.5 23± 2 −34 ± 2 200.NGC 925 SABd 10.5 66 25±2 +1 287 1 1.81 13.0 < 0.6 −10 ± 2 90.NGC 2403 SABcd 21.9 63 21±4 +1 124 1 1.10 9.0 28± 5 +11 ± 30 360NGC 2841 SAb 8.1 74 – −1 153 1 1.29 8.6 5.8± 0.5 −6 ± 3 100NGC 2903 SABbc 11.5 65 13±5 −1 204 1 2.73 12.6 14± 1 +3 ± 1 460NGC 2976 SAc 5.9 65 – −1 335 1 1.08 9.5 3.0± 0.6 −34 ± 2 68.NGC 3184 SABcd 7.4 16 17±3 +1 179 9 1.51 9.7 5± 1 +19 ± 2 80.NGC 3198 SBc 8.5 72 – −1 215 1 1.40 9.4 < 0.5 +7 ± 2 49.NGC 3627 SABb 9.1 62 – −1 173 1 4.45 15.2 12.5± 1 +13 ± 1 500NGC 3938 SAc 5.4 14 12±3 +1 204 2,3 1.44 9.1 6.2± 0.5 +1 ± 2 80.NGC 4125 E6p 5.8 – – – 83b 6 1.10 6.7 < 0.1 +19 ± 1 1.9NGC 4236 SBdm 21.9 73 – −1 161 7 1.07 9.1 < 0.3 +15 ± 2 26.NGC 4254 SAc 5.4 32 22±4 +1 65 2,3 4.02 14.5 24± 2 −13 ± 3 510NGC 4321 SABbc 7.4 30 15±3 −1 159 2,3 3.67 13.1 16± 1 −17 ± 1 310NGC 4450 SAab 5.2 48 10±2 +1 352 2,3 3.40 13.5 < 0.2 −8 ± 1 13.NGC 4559 SABcd 10.7 65 – −1 328 2,3 2.13 12.9 1.0± 0.2 −5 ± 2 110NGC 4569 SABab 9.5 66 – −1 23 2,3 4.39 13.3 12± 1 +18 ± 2 170NGC 4631 SBd 15.5 85 – – 86 2,3,8 1.86 12.6 40± 2 −4 ± 3 1290NGC 4725 SABab 10.7 54 7±1 +1 36 2,3 2.32 12.4 3.6± 0.5 −4 ± 4 100NGC 4736 SAab 11.2 41 – +1 296 1 1.52 17.3 11.5± 1 +1 ± 1 320NGC 4826 SAab 10.0 65 7±2 +1 121 1 2.71 13.5 0.7± 0.1 −8 ± 2 110NGC 5033 SAc 10.7 66 19±3 −1 352 2,3 1.68 10.5 3.5± 0.5 +9 ± 2 240NGC 5055 SAbc 12.6 59 11±3 +1 102 1 1.49 10.6 17.5± 1 −8 ± 3 450NGC 5194 SABbc 11.2 42 15±2 −1 172 9 1.36 9.5 81± 5 +12 ± 2 1420NGC 6946 SABcd 11.5 33 28±4 +1 243 1 1.15 10.6 150± 10 +23 ± 2 1700NGC 7331 SAb 10.5 76 14±3 +1 168 1 1.77 11.4 14.5± 1 −177 ± 7 590
a References. (1) de Blok et al. (2008); (2) Paturel et al. (2003); (3) Braun et al. (2007); (4) Bureau & Carignan (2002); (5)Kamphuis & Briggs(1992); (6) Jarrett et al. (2003); (7) Braun (1995); (8) de Vaucouleurs et al. (1991); (9) Tamburro et al. (2008)
b Morphologically-determined position angle
vidually. They wereCLEANed within mask regions derived fromsmoothed versions of the total StokesI map in each subband.The same restoring beam size was used at all channel frequen-cies; see Table 1 for the effective resolution in each galaxy.Primary beam corrections were applied to each channel mapindividually. The primary beam correction was performed us-ing the standard WSRT model [the primary beam response isapproximated with the function cos6(cνr), wherec = 68 at L-band frequencies,ν is the frequency in GHz, andr is the dis-tance from the pointing center in radians]. An improved pri-mary beam correction for the WSRT has been developed byPopping & Braun (2008) but is little different from the standardtreatment at the small field angles which are considered here.After primary beam correction, the channel maps were arrangedinto cubes, and analyzed with the RM-Synthesis technique (de-scribed in§ 2.2). Individual channel maps are used as input tothe RM-Synthesis software because the technique can be thoughtof as a technique for determining the Faraday rotation measurewhich maximizes the polarized signal-to-noise ratio across thefull frequency band.
Stokes V images were generated, and the intensity his-tograms in those images are Gaussian, with an rms of about20µJy beam−1. In some fields, very bright continuum sourcesfar from the field center have instrumental circular polarization,at theV/I . 0.5% level.
2.2. RM Synthesis
As discussed above, the effect of Faraday rotation is to changethe intrinsic polarization angle of the radiation (χ0) by an amountdepending on the wavelength of the radiation. More specifically,the observed polarization angles after Faraday rotation are
χ = χ0 + φ λ2, (1)
whereλ is the wavelength, and the rotation measureRM hasbeen replaced by a more general quantityφ, the “Faraday depth.”The value ofφ is related to the properties of the Faraday rotatingplasma by the equation
φ ∝∫ telescope
sourcene B · dl, (2)
whereB is the magnetic field,l is the distance along the LOS,andne is the electron density. WhenB is expressed inµGauss,lin pc, andne in cm−3, the proportionality constant is 0.81, and theunits ofφ are rad m−2. From equation 2, it can be seen that theFaraday depth expresses the depth of Faraday rotating plasmabetween the source and the telescope. The dot product indicatesthat it is only the component of the magnetic field along the LOS(B‖) that contributes to the integral. The sign ofφ is taken to bepositive for a magnetic field pointing toward the observer. Themagnitude ofφ is traditionally determined by fitting a linear re-lationship betweenχ andλ2 (e.g., Ruzmaikin & Sokoloff 1979).However, this approach has well-documented problems such asnπ ambiguities. Sophisticated techniques have been developed

4 G. Heald et al.: The Westerbork SINGS Survey II.
to overcome these difficulties (e.g. Pacerman, Dolag et al. 2005;Vogt et al. 2005), but these still suffer from the same fundamentalproblem. Moreover, by fitting the change in the observed polar-ization angle withλ2, one is faced with the implicit constraintthat the polarized signal must be bright enough at each observ-ing frequency to allow a significant fit. For the faintest polar-ized emission this would not be possible. A different method fordetermining the effect on the polarized radiation produced bythe magnetized plasmas along the LOS, first described by Burn(1966) and now called the RM-Synthesis method (Brentjens &de Bruyn 2005), can overcome the weaknesses in the traditionaltechniques for determining RM, and will be used in this paper.
Equation 1 is valid only in physical situations where all ofthe polarized emission is observed at a single Faraday depthφ.In more complicated circumstances (for instance, emissionthatarises both beyond and between two distinct Faraday rotatingclouds along the LOS; for an in-depth discussion see Sokoloff
et al. 1998), the simple relation is no longer valid. By express-ing the polarization vector as an exponential (P = p e2iχ), usingequation 1 forχ, and integrating over all Faraday depths, Burn(1966) shows that
P(λ2) =∫ +∞
−∞F(φ) e2iφλ2
dφ, (3)
where P(λ2) is the (complex) observed polarization vector[P(λ2) = Q(λ2) + iU(λ2)], and F(φ), the “Faraday dispersionfunction,” describes theintrinsic polarization vector at eachFaraday depth.
Under the assumption thatχ0 is constant for allφ, the Fouriertransform-like eqn. 3 can be inverted to give an expression forthe Faraday dispersion function:
F(φ) =∫ +∞
−∞P(λ2) e−2iφλ2
dλ2. (4)
Everything on the right-hand side of eqn. 4 is observable.However, we only measure discrete (positive) values ofλ2. Theform that is used in practice (e.g., Brentjens & de Bruyn 2005)is therefore expressed as a discrete sum,
F(φ) ≈ KN
∑
i=1
Wi Pi e−2iφ(λ2i −λ
20), (5)
whereWi are weights which are allowed to differ from unity,and the normalization factorK is the inverse of the discrete sumoverWi. Note that the termλ2
0 has been added to the exponential.Brentjens & de Bruyn (2005) demonstrate that whenλ2
0 is takento be the weighted mean of theN individual observedλ2
i , a bet-ter behaved response function results. That response function, orrotation measure spread function (RMSF)1, is formally given by
R(φ) ≈ KN
∑
i=1
Wi e−2iφ(λ2i −λ
20) (6)
and is conceptually equivalent to the dirty beam encounteredwhen performing image synthesis with an array of radio tele-scopes. Just as a radio interferometer discretely samplesuv-space, here we discretely sampleλ2-space. Examples of the
1 This function was originally referred to as the rotation measuretransfer function (RMTF) by Brentjens & de Bruyn (2005), buthassince been relabeled to more accurately reflect its mathematical rela-tionship to the Faraday dispersion function.
RMSF, specific to the observations presented in this paper, areshown in Fig. 1.
Previous rotation measure experiments have had to rely onrelatively few measurements in frequency space. But with mod-ern correlator backends like the one at the WSRT, the techniqueof determiningF(φ) as shown in equation 5 is made possible.The practical aspects of this technique have been developedbyBrentjens & de Bruyn (2005). We use software developed by M.Brentjens to perform the inversion shown in Eqn. 5 and obtaina reconstruction ofF(φ). The software takes cubes of StokesQandU images in single frequency channels as input, along witha specification of the frequency at each plane of the cubes. Asoutput, cubes of StokesQ andU in planes of constantφ are ob-tained. Simply put, the inversion amounts to the computation ofthe implied values ofQ andU for a whole series of trial valuesof the Faraday depth,φ. In this way, the coherent sensitivity ofthe entire observing band to polarized emission is retained, irre-spective of possible Faraday rotation within the band, as long assuch rotation is well resolved by theλ2 sampling.
The polarization vectors described by the values ofQ andU in each plane can be thought of as having been correctedfor Faraday rotation – but note that the vectors have been dero-tated to a common non-zero value ofλ2, namely toλ2 = λ2
0,as shown in Eqn. 5. Hence, to obtain theintrinsic polarizationangle at each value ofφ, multiplication of our reconstructedF′(φ) = Q(φ) + iU(φ) by e−2iφλ2
0 must be performed. Furtherexplanation regarding this detail is provided in Appendix A.
The frequency sampling provided by the WSRT-SINGS sur-vey gives sensitivity to polarized emission up to a maximumFaraday depth of|φmax| ≈
√3/δλ2 ≈ 1.7× 10⁵ rad m−2 (see
Brentjens & de Bruyn 2005), whereδλ2 refers to the chan-nel separation. A search for large rotation measure emissionwas performed for each of the galaxy fields, by performingRM-Synthesis on the observedQ and U cubes in the range|φ| < 1.7× 10⁵ rad m−2 (albeit with coarseφ sampling). Noemission at high values of Faraday depth was found in any of thetarget fields. Next, RM-Synthesis was performed on the 22cmdata alone, from−1500 rad m−2 to+1500 rad m−2 with fine sam-pling (50 rad m−2). Given theλ2 width of the 22cm band, theφ resolution element (FWHM) is 450 rad m−2. The first side-lobe of the RMSF is at 24% of the main lobe. The sidelobelevel can be reduced, at the expense of lowerφ resolution, bytapering inλ2 space (by allowingWi to deviate from unity inequation 5, and as illustrated in Figure 1). After tapering with aGaussian withσ = 1
2(λ2max−λ2
min), the width of the main lobe is650 rad m−2, and the first sidelobe is reduced to 2% of the RMSFpeak. Increasing the denominator in the tapering function servesto further decrease the sidelobe level, while increasing the widthof the main lobe. After testing a series of different tapers, thisparticular choice was selected as a reasonable tradeoff betweensidelobe height and RMSF width. The cubes produced in thisway can be used as a (very) low resolution verification of com-plicatedF(φ) spectra.
RM-Synthesis was also performed on the combination of the18cm and 22cm data. The results of this operation were used formost of the subsequent analysis. Together, the two bands pro-vide aφ resolution of 144 rad m−2. This is comparable to themaximum Faraday depth to which about 50% sensitivity to thepolarized intensity is retained of aboutπ/λ2
min = 110 rad m−2.However, due to the large gap in frequency coverage between thetwo bands, the RMSF has large sidelobes, as shown in Figure 1.The first sidelobes are at about the 78% level in P, which canpotentially cause serious confusion, particularly in cases where

G. Heald et al.: The Westerbork SINGS Survey II. 5
Fig. 1. RMSFs corresponding to the frequency coverage in the obser-vations of NGC 628. RMSF values were calculated using the 22cmband alone (untapered:a,b; tapered:c,d) and in the combination of the18cm and 22cm bands (e,f ). In each row, the left panel shows the valueof the weight functionW(λ2) for each of the sampled frequency chan-nels, and the right panel shows the corresponding RMSF (realpart:longdashed lines; imaginary part:dotted lines; absolute value:solid lines).Matching ranges ofλ2 are illustrated by diagonal lines between panelsc ande, and matching ranges ofφ between panelsd andf.
polarized emission is detected at multipleφ along a single LOS.This difficulty can be alleviated by using a deconvolution tech-nique similar to the HogbomCLEAN algorithm (§2.3).
2.3. Faraday dispersion function deconvolution
Once the RM-Synthesis was performed for each field, theF(φ)spectra were deconvolved using a variation of the HogbomCLEAN, as outlined by Brentjens (2007). The deconvolution iscomplex-valued and operates along theφ dimension, which isthe third axis of theQ(φ) and U(φ) cubes produced by theRM-Synthesis technique. The steps of the procedure, calledRM-CLEAN, are described in detail in Appendix A. Briefly, oneiteratively subtracts scaled versions of the RMSF from the re-constructed Faraday dispersion function until the noise floor isreached, after which a smoothed representation of the “CLEAN
model” is used as the approximate true Faraday dispersion func-tion. In this paper, we take theRM-CLEAN cutoff to be equal tothe noise in the individualQ(φ) and U(φ) maps, and the gainfactor is 0.1 (see Appendix A for a more extensive descriptionof these parameters).
Fig. 2. Demonstration of theRM-CLEAN process for a relatively brightpoint source in the field of NGC 4125. Top:P, middle: Q, bottom:U.Gray lines are the dirty spectra; black lines are the cleanedspectra. Arestoring RMSF with FWHM 144 rad m−2 was used to produce the de-convolved spectra. The resultingF(φ) spectrum shows a single compo-nent at a centralφ = +33 rad m−2.
Examples of the result of runningRM-CLEAN on dirty F(φ)spectra are shown in Figures 2 and 3. In Fig. 2, a single-valuedF(φ) spectrum has beenRM-CLEANed. The only benefit is thatthe sidelobe structure has been significantly reduced. Notethatthe deconvolution routine is unable to improve theφ resolution,which is determined by the spread of sampled frequencies. Inthe right-hand panels, the data are compared to theλ2 represen-tation of theRM-CLEAN components found during the procedure.A solution equivalent to the best linear fit toχ-vs-λ2 has beendetermined. That this type of deconvolution is mathematicallyidentical to a least-squares fit in the inverse Fourier domain hasbeen shown by Schwarz (1978). In Fig. 3, a more complicatedF(φ) is shown. Note that in cases such as this, where multiplestructures are detected, the location of the peak of the faintercomponent is shifted relative to its true position because of con-fusion with sidelobes from the brighter component. Particularlyin such cases, deconvolution is required to recover source pa-rameters.
Final on-axis sensitivities in the deconvolvedF(φ) cubes arelisted in Table 1 for each galaxy. In view of the combined fre-quency coverage contributing toP (1300–1432 and 1631–1763MHz), the effective center frequency is about 1530 MHz.

6 G. Heald et al.: The Westerbork SINGS Survey II.
Fig. 3. Demonstration of theRM-CLEAN process for a relatively brightpoint source in the field of NGC 7331. Top:P, middle: Q, bottom:U.Gray lines are the dirty spectra; black lines are the cleanedspectra. Arestoring RMSF with FWHM 144 rad m−2 was used to produce the de-convolved spectra. The resultingF(φ) spectrum shows two componentsat centralφ = −185,+170 rad m−2.
2.4. Analysis of deconvolved Faraday depth cubes
The spatial distribution of polarized emission was determinedby selecting the peak in eachP(φ) ≡ ||F(φ)|| spectrum. Thegrayscale maps of these images are shown in Figure 4, with over-laid contours of the 22cm Stokes-I maps for comparison. Sincepolarized intensity has Ricean, rather than Gaussian statistics(see Wardle & Kronberg 1974), some care needs to be taken indetermining the integrated value ofP. In the absence of sourcesignal, the noise has a Rayleigh distribution with a mean (the“Ricean bias”) and variance of
〈P〉n = σQ,U
√
π
2= 1.25 · σQ,U , (7)
and
σP =
√
4− π2
σQ,U = 0.66 · σQ,U , (8)
for an RMS noise inQ andU of σQ,U . In the case of high signal-to-noise, the noise statistics become Gaussian with the mean Pin agreement with its noise-free value andσP = σQ,U .
We have carefully determined the noise level and Ricean biasin each target. To do this, we have determined the mean and vari-ance in each image of peakP within a central, polygonal region(free of emission). The variances that we measure (and list inTable 1) are in good agreement with the expectation noted above,σP = 0.66·σQ,U , for a Rayleigh distribution. However, the biasvalues that we measure are in all cases enhanced by a factorof about two over the simple expectation,〈P〉n = 1.25 · σQ,U .The cause of this high Ricean bias level is that the peak valueof P(φ) has been extracted from a cube covering Faraday depthsbetween−500 and+500 rad m−2 with an effective resolution ofabout 144 rad m−2, and has thus been chosen from some 7 in-dependent samples. The Rayleigh distribution function is givenby
D(r) = 1 − exp
−r2
2σ2Q,U
, (9)
wherer represents the flux in a given sample. In a Faraday dis-persion function which contains only noise (no signal), theex-pectation value for the largest (ˆr) of N independent samples oc-curs for
exp
−r2
2σ2Q,U
=1N, (10)
or
r = σQ,U [2 ln(N)]0.5. (11)
This should be a good estimator of the Ricean bias in our maps.Since we haveN = 7, we obtain ˆr = 2.0 · σQ,U , in good agree-ment with what is measured for the on-axis background level inall cases except NGC 6946 and NGC 7331, where patchy fore-ground emission from the Galaxy is apparent in the fields. Themean noise floor increases radially away from the field centerdue to the primary beam correction which has been applied toeach original frequency channel during processing. For thepur-poses of display and the measurement of azimuthal trends, wehave subtracted out a primary beam-corrected noise floor fromthe peakP images shown in Figure 4.
For determination of the integratedP (or useful limits onP)for each target (as listed in Table 1), we have not carried outa spatial background subtraction of the noise floor, but insteadhave simply blanked the images at a level of 3σQ,U ∼ 4.5σP. Atthese brightnesses, the Ricean bias has already declined tobe-low about 5% (Wardle & Kronberg 1974), so that no further biascorrection of the integratedP was applied. TheP emission wasintegrated within the smallest possible polygonal region whichenclosed the region of significant target emission while exclud-ing any apparent background sources. For comparison, we alsolist the integratedI of each target at 1365 MHz from Braun et al.(2007).
Polarized emission maps were also produced (using only the22cm data) for the purpose of determining the polarized fractionin these galaxies. The peak polarized intensity was extracted foreach spatial pixel, and then divided by the corresponding 22cmStokes-I value. Clip levels were set at 4 times the noise level inboth maps. Thus, polarization fraction estimates are not avail-able for the faintest emission detected in the sample. The polar-ized fraction values are discussed in§ 3.2.
In order to determine the Faraday depth at the peak of theP(φ) spectra, we fit a parabola to the top three points in the over-sampled,RM-CLEANedP(φ) spectra. The result is calledφ.

G. Heald et al.: The Westerbork SINGS Survey II. 7
The polarization angle at the Faraday depth thus determinedwas obtained via
χ0 =12
arctan
(
U(φ)
Q(φ)
)
. (12)
We refer to this as the intrinsic polarization angle (χ0) becausethe effect of Faraday rotation has already been corrected for, viathe RM-Synthesis technique. The magnetic field orientationisobtained by simply rotating the polarization angle by 90◦.
Errors associated with the magnetic field orientations wereestimated by propagating errors through the mathematical oper-ations required to calculate the quantity. Since
χ0 = χ − φλ20, (13)
error propagation yields the uncertainty in our determination ofthe intrinsic polarization angle,
σ2χ0= σ2
χ + λ40σ
2φ. (14)
The quantityσχ, the uncertainty in the observed (Faraday ro-tated) polarization angle can be shown to be given by (Brentjens2007)
σ2χ =
14σ2
|P|2, (15)
whereσ = σQ ≈ σU is the noise in the individualQ(λ2) andU(λ2) maps. The uncertainty inφ can be estimated by propagat-ing errors in the equation for fitting a parabola to the peak ofthe P(φ) profile, and is dominated by the RMSF resolution. Wehave calculated these uncertainties for all of the galaxieswhichhave magnetic field vectors plotted in Figure 4, and are typically. 10◦ in locations where the brightestP emission is detected.
Note that magnetic field orientations are easily interpretedonly if the deconvolvedF(φ) spectrum is single-valued. If thereis more than oneφ component, then the magnetic field ori-entations determined in this way only apply to the brightestcomponent of polarized emission. The deconvolved Faradaydepth cubes were analyzed to identify locations where multi-ple Faraday depths might be present (§4.3). These are notedthroughout the paper, where appropriate.
3. Overview
Here, we summarize the main features of interest observed foreach galaxy field based on a comparison of the polarized andtotal continuum brightness, together with the (Faraday rotationcorrected) magnetic field orientation shown in Fig. 4, and theFaraday depth where peak polarized intensity is detected inFig. 6.
3.1. Rotation measures of discrete background sources
In addition to the primary targets of our program, each observedfield also contains a number of background sources with sig-nificant polarized brightness. While many of these sources areunresolved at the modest angular resolution of our study (≥15”),a significant number are also resolved into the classical edge-brightened double morphology associated with high luminosityradio galaxies (e.g. Miley 1980). Lobe separations of 1–2 ar-cmin are common, while a handful of objects with 5–10 arcminangular size are detected. We have determined the Faraday depthand the associated error for the significantly detected polarized
sources in the central 34′ × 34′ of our fields, making a partic-ular note of the source morphology and classifying sources asunresolved, double, triple (double plus core), extended orcom-plex. The individual lobes of double radio sources were mea-sured separately where practical. The rotation measures listed inTable 2 were determined for each source from a plot of Faradaydepth versus polarized brightness within a rectangular boxthatisolated the source (component). The listed RM is that of thepeak inP while the error corresponds to the HWHM of the dis-tribution. The columns are (1) Galaxy field; (2) Discrete sourceposition; (3) Morphology; (4) Rotation measure with estimatederror. Morphologies are classified as unresolved: UNR, double:DBL, triple: TRPL, complex: CMPLX and extended: EXT. ForDBL and TRPL sources, the individual lobes (N, S, E or W) aremeasured where possible, always begining with the brightest one(in Stokes P). The weaker lobe is prefaced by its flux ratio withrespect to the brighter. When the source is (possibly) affectedby the target galaxy disk the morphology is further flagged asFG(?).
From the values in Table 2 it is apparent that when multiple,double-lobed sources are detected in an individual galaxy fieldthen they generally have RMs that are in good agreement withone another. Unresolved sources in the field have RMs which aresometimes consistent, but seem to have a larger intrinsic scat-ter. Furthermore, when the lobes of double-lobed sources arewithin a factor of two in brightness they generally have betterRM agreement, often as good as 1–2 rad m−2. For more extremelobe brightness ratios, this consistency declines. To the extentthat a single Galactic foreground RM contribution is appropri-ate in a particular field, the scatter in the measured RMs of thebackground sources is likely caused by variations in the intrinsicRMs of the sources themselves.
Since the likely red-shift of the luminous edge-brighteneddouble sources we detect is greater than about z= 0.8 (Condonet al. 1998), the associated physical sizes are likely in therange0.5–5 Mpc. The large physical separation of such radio lobesfrom the host galaxy makes it unlikely that high densities ofther-mal electrons will be mixed with the emitting regions. A relevantphenomenon which has been documented is the tendency for en-hanced Faraday depolarization and RM fluctuations to be seentoward the fainter lobe of a pair (in both StokesI and particularlyP) (Laing 1988; Garrington et al. 1988; Laing et al. 2006). Thisphenomenon is consistent with the fainter lobe being the moredistant one and its radiation suffering additional propagation ef-fects while passing through the magneto-ionic halo of the hostgalaxy. A prediction of this interpretation is that edge-brighteneddoubles with equal brightness lobes are least likely to havedif-ferences in their associated Faraday depth, as we confirm. Inany case, it is likely that well-separated lobes of luminousradiogalaxies can provide a good estimate of the line-of-sight rotationmeasure with a minimal intrinsic contribution, in contrastto un-resolved and possibly core-dominated AGN, for which a localhost contribution to the Faraday depth is more likely.
A plausible method of estimating the Galactic foregroundcontribution to the RM in each field seems to be a weighted me-dian value whereby double-lobed sources, particularly those ofsimilar lobe brightness, are given a very high weight. Some dis-cussion of these considerations is given below for each targetfield in turn, with the result listed in Table 1. While the majorityof our target galaxies are well-removed from the Galactic plane(|b| > 25◦), where it is plausible that a single foreground RMmay be expected to apply to a region of 34′ × 34′, the two ex-ceptions are the fields containing NGC 7331 (b = − 21◦) andNGC6946 (b = +12◦). Diffuse, patchy polarized emission from

8G
.Hea
ldet
al.:
The
Wes
terb
ork
SIN
GS
Sur
vey
II.
Table 2. Discrete Source Rotation Measures.
Galaxy Field (RA, Dec)J2000 Morphology RM Galaxy Field (RA, Dec)J2000 Morphology RM Galaxy Field (RA, Dec)J2000 Morphology RMHolmberg II 08:16:06, 70:47:00 UNR −18± 2 NGC 3627 11:19:28, 13:02:50 TRPL W+13± 1 NGC 4725 12:49:17, 25:33:10 UNR +15± 2
08:17:24, 70:38:03 DBL S −13± 2 0.15 E +23± 3 12:50:40, 25:28:05 DBL E +4± 40.95 N −8± 5 11:20:41, 13:05:20 UNR +3± 2 12:50:49, 25:35:10 UNR +4± 3
08:19:18, 70:55:00 EXT +27± 5 11:21:21, 12:51:50 UNR +23± 3 12:51:18, 25:31:05 UNR +2± 208:20:16, 70:52:15 EXT −8± 2 NGC 3938 11:52:13, 44:09:05 DBL N +1± 2 NGC 4736 12:50:55, 41:23;00 DBL W +1± 108:20:25, 70:53:10 TRPL S −8± 4 0.6 S +7± 2 12:51:17, 40:57:30 DBL N −8± 10
IC 2574 10:26:28, 68:19:10 UNR −12± 3 11:52:28, 44:21:50 CMPLX +6± 2 12:51:50, 41:02:10 DBL W −8± 510:26:54, 68:24:35 UNR −24± 3 11:53:10, 44:14:25 UNR (D?) +2± 2 NGC 4826 12:56:09, 21:43:34 DBL E −8± 210:29:17, 68:13:20 UNR −17± 2 NGC 4125 12:07:03, 65:24:35 DBL S+20± 2 0.15 W −1± 3
NGC 628 01:35:42, 15:37:10 DBL W −36± 3 12:07:33, 65:18:10 UNR +31± 3 12:56:19, 21:42:25 UNR −13± 401:36:16, 15:41:40 DBL N −28± 3 12:07:37, 65:15:35 UNR 0± 2 12:56:59, 21:52:35 UNR +8± 301:36:58, 15:44:20 UNR FG? −39± 3 12:07:51, 65:21:20 DBL E +16± 2 12:57:26, 21:47:30 UNR +4± 401:37:43, 15:42:35 DBL E −38± 4 12:08:02, 65:10:10 DBL S +20± 2 NGC 5033 13:12:05, 36:23:20 UNR +3± 1
0.5 W −23± 3 12:08:10, 65:00:30 UNR +32± 2 13:12:25, 36:40:50 UNR +13± 1NGC 925 02:28:23, 33:18:45 DBL W −8± 3 NGC 4236 12:15:30, 69:31:50 DBL W +16± 1 13:13:16, 36:24:50 EXT +9± 2
02:28:25, 33:26:15 UNR −18± 3 0.2 E +20± 5 13:13:39, 36:50:20 UNR +16± 202:28:26, 33:21:10 UNR −12± 3 12:16:35, 69:28:15 DBL S FG −3± 2 13:14:18, 36:49:15 UNR −3± 2
NGC 2403 07:34:18, 65:28:05 UNR +13± 3 12:16:36, 69:33:40 UNR +23± 2 13:14:44, 36:39:00 UNR −29± 107:38:00, 65:49:05 UNR −22± 3 12:18:50, 69:34:35 DBL S +13± 2 NGC 5055 13:15:18, 41:49:25 DBL N/S −5± 207:38:45, 65:37:45 UNR +42± 2 0.4 N +17± 5 13:15:33, 41:56:15 EXT −18± 3
NGC 2841 09:20:56, 51:13:50 UNR −6± 3 NGC 4254 12:18:10, 14:15:40 DBL E −13± 3 13:16:25, 41:51:30 DBL S −13± 209:21:18, 51:02:45 UNR −28± 2 0.7 W 0± 5 0.5 N +1± 409:21:25, 50:46:15 DBL S −12± 3 12:19:13, 14:40:10 UNR −11± 3 13:16:36, 42:08:55 UNR −10± 209:22:27, 50:53:50 DBL E −25± 2 NGC 4321 12:21:50, 15:36:10 UNR−12± 2 NGC 5194 13:29:34, 46:58:50 DBL E +14± 109:23:47, 51:02:40 DBL E −5± 3 12:23:04, 15:36:50 UNR −8± 2 13:29:41, 47:17:35 UNR FG? +20± 1
0.6 W −6± 4 12:23:15, 15:41:40 DBL W −7± 1 13:30:16, 47:10:25 EXT FG +28± 4NGC 2903 09:31:00, 21:35:30 DBL W +20± 2 0.75 E −7± 2 13:30:45, 47:03:10 EXT +17± 2
09:31:13, 21:28:00 DBL W +4± 2 NGC 4450 12:27:35, 17:07:00 DBL E −8± 5 13:31:25, 47:13:10 DBL W +9± 10.6 E +2± 2 0.95 W −10± 5 1.0 E +3± 1
09:31:37, 21:34:20 UNR +8± 2 12:28:15, 17:05:00 TRPL SE −8± 1 NGC 6946 20:33:09, 60:00:30 DBL E −14± 209:32:23, 21:36:20 UNR −8± 2 SW −15± 5 0.4 W +67± 5
NGC 2976 09:46:18, 67:49:25 UNR −44± 4 0.4 N +12± 2 20:35:19, 60:02:05 DBL FG? +23± 209:46:37, 67:46:30 UNR −37± 8 NGC 4559 12:35:48, 28:05:50 UNR +4± 1 20:36:09, 59:53:20 EXT +14± 209:48:12, 67:44:15 UNR −26± 3 12:35:58, 27:43:15 DBL E −6± 3 20:36:15, 60:07:30 UNR FG? +56± 309:48:35, 67:53:10 DBL E −34± 2 1.0 W −4± 3 NGC 7331 22:35:51, 34:30:10 UNR−143± 309:48:41, 68:04:15 UNR +24± 6 12:36:21, 27:57:30 UNR +6± 2 22:35:55, 34:14:25 DBL N −169± 1
NGC 3184 10:17:05, 41:15:10 DBL W +19± 2 12:37:05, 27:55:05 UNR +8± 2 0.7 S −153± 210:17:23, 41:30:50 UNR +29± 2 12:37:12, 27:44:30 UNR +5± 2 22:35:55, 34:18:40 UNR −10± 410:18:19, 41:09:40 UNR +12± 3 NGC 4569 12:36:38, 12:58:55 DBL W +18± 2 22:36:53, 34:20:45 DBL N −184± 210:19:01, 41:27:35 UNR +11± 3 0.2 E +12± 2 0.2 S −176± 310:19:09, 41:41:25 UNR +2± 2 12:36:52, 13:01:05 UNR +13± 2 22:36:58, 34:16:55 UNR −178± 3
NGC 3198 10:19:17, 45:28:40 UNR +25± 3 NGC 4631 12:41:10, 32:45:10 DBL S −4± 3 22:38:08, 34:17:50 UNR −161± 310:19:32, 45:37:35 DBL N +7± 2 12:41:33, 32:46:30 CMPLX −2± 3
0.8 S +8± 2 12:41:53, 32:27:15 DBL W FG? −38± 210:21:06, 45:23:30 CMPLX +3± 3 0.6 E FG? −28± 3
12:43:25, 32:25:40 UNR +4± 1

G. Heald et al.: The Westerbork SINGS Survey II. 9
the Galaxy is apparent in these fields, accentuating the likelihoodthat foreground RM fluctuations may also be present. We stressthat we have in no case made use of polarized emission fromthe target galaxy itself to estimate the Galactic foreground RM,since this would bias the outcome by artificially imposing a zeromean RM on the target galaxy. For those targets in the directionof the Virgo cluster, or more generally along the Super-galacticplane, there is also the possibility that a non-zero contributionto the RM seen toward the distant background radio galaxies ofTable 2 arises within these media. Detection of such a contribu-tion would require a much more extensive sampling of the RMsky, such as envisioned for the Square Kilometre Array and itsPathfinders (e.g. Johnston et al. 2008).
3.2. Notes on Individual Galaxies
Here, we discuss the polarized features detected in each of thetarget fields. For much of the analysis, we utilize the 18+22cm(deconvolved) Faraday cubes, and the associated peakP andφ maps shown in Figures 4 and 6. Comparisons with opticalimages are shown in Figure 5. We occasionally refer to theFaraday cubes produced using the 22cm data alone. Trends inthe azimuthal and radial variations in polarized flux and FaradayRM lead to a generic, consistent picture of the global magneticfield geometry in the spiral galaxies included in our sample (see§4.2). These trends and the global magnetic field geometry arediscussed in detail in Paper III. Most galaxies with extended po-larized flux show signs of broadened Faraday dispersion func-tions in small localized regions; see§ 4.3 for details. All galaxieswith compact (circum-)nuclear polarized emission show signs ofsignificant Faraday structure in their nuclei. This is discussed in§4.4.
Holmberg II There is no convincingly detected polarized emis-sion from Holmberg II. There is possibly very faint (at/belowabout the 4σ level) emission at the location of the higher bright-ness features in the eastern part of the galaxy which, as discussedby Braun et al. (2007), are associated with Hα-emitting regions.This possible emission is not seen in the map produced usingonly the 22cm data. However, to the southwest (visible in Figure4) is a classic double-lobed radio source which is strongly polar-ized. The source is catalogued as 6C B081222.3+704711. Themorphology of the polarized emission mostly fills the regionofcontinuum emission, but with strong depolarization channels inthe northern lobe. The southern lobe is somewhat brighter inboth polarized and unpolarized emission. The polarized fractionis about 3–4% in the core, and about 10–20% along the jet axis.There are localized regions of higher polarized fraction, at aboutthe 40% level, and even reaching as high as 50%. The magneticfield orientation is parallel to the northern and southern lobes ontheir western edges, but on the eastern edges is perpendicular tothe lobes, where the total continuum morphology also suggestsa smooth decline toward the east. Despite the fact that the twolobes have nearly equal integrated brightness inP, they displayRMs which follow the pattern noted above in§3.1 for a largerdegree of RM fluctuations to be seen toward the fainter, northernlobe. Given the obvious depolarization channels, this differenceis perhaps not too surprising. In view of the 1.5 arcminute an-gular separation of the depolarization channels in the northernlobe from the nuclear position, it would require either a very ex-tended dispersive halo of the host galaxy, a localized source ofsignificant rotation, or internal depolarization to account for boththe RM fluctuations and depolarization. Unfortunately no red-
shift information is available for this source, although the nu-cleus appears to be coincident with a moderately bright, butun-catalogued Digital Sky Survey source. The most likely Galacticforeground RM for this field seems to be about−10± 2 rad m−2.
IC 2574 IC 2574 does not show evidence for significant po-larized emission in either the 22cm map or the 18+22cm map.Since only unresolved polarized background sources are de-tected in this field, the Galactic foreground RM remains quiteuncertain at about−18 ± 4 rad m−2.
NGC 628 (M74) This relatively face-on spiral galaxy showssubstantial polarized emission in the form of an incompletering near the edge of the optical disk which is brightest at PA∼ 80◦ − 340◦ (Position Angles measured east of north). Theminimum in polarized intensity occurs at the PA of the reced-ing major axis (PA= 25◦, as tabulated in Table 1). The brightestemission is associated with two inter-arm regions in the outergalaxy; one extending from PA∼ 80◦ to 210◦ and the otherfrom PA ∼ 200◦ to 340◦. These seem to be continuations intothe outer disk of the inner disk interarm regions. The polarizedfraction at 22cm in these regions is approximately 10–20% atsmall radii; increasing to 40–50% at the largest radii, indicat-ing an exceptionally well-ordered magnetic field. The magneticfield vectors are closely aligned with the features themselves.The Faraday depth distribution shows some systematic variationwith PA which we will discuss in Paper III. Based on the brighterlobes of the three polarized double sources detected in thisfield,the likely Galactic foreground RM is about−34 ± 2 rad m−2.
NGC 925 There is no polarized emission detected in thisgalaxy. However, several faint background sources are seento-ward the edges of the field. Excluding the unresolved polarizedsource most discrepant from the single double source lobe, weobtain an estimate of the Galactic foreground RM with a valueof about−10 ± 2 rad m−2.
NGC 2403 There is a faint polarized component which is pre-dominantly diffuse, but is too faint to characterize well with thecurrent observations. Smoothing to a beam size of 45′′ × 45′′
enhances the signal to noise ratio of some of the polarized emis-sion, which is concentrated in the western half of the galaxy,with some localized enhancements at the eastern and west-ern edges of the optical disk. But even after application ofsmoothing, it is still extremely faint (typical surface brightness≈ 30− 50µJy/beam, reaching as high as≈ 100µJy/beam). Thelowest brightness of polarized emission occurs on the recedingmajor axis (PA= 125◦, as tabulated in Table 1). Deeper obser-vations would be required to further constrain the magneticfieldproperties in this target. The three unresolved polarized sourceswhich are detected in the field do not permit a good estimationof the Galactic foreground RM in view of their large scatter.
NGC 2841 In StokesI, Braun et al. (2007) note a diffuse “hour-glass” structure, with the long axis of the hourglass oriented per-pendicular to the disk major axis. In the polarized emission, thehighest brightnesses are seen along the minor axis trailingawayslowly to the northwest and more rapidly to the southeast. Thelowest brightness of polarized emission occurs near the recedingmajor axis (PA= 153◦, as tabulated in Table 1). The directions ofthe magnetic field vectors are primarily aligned along the polar-

10 G. Heald et al.: The Westerbork SINGS Survey II.
Fig. 4. Images of sample galaxies. Contour levels (white) in Stokes I run from 0.1 mJy beam−1 in powers of two. The color range of the peakpolarized intensity in eachF(φ) spectrum is displayed in the colorbar at the top of each panel, in units of Jy beam−1. The galaxy ID is indicated inthe upper left of each panel. In targets with sufficient polarized emission, the magnetic field orientations are displayed with blue vectors. The cyanellipse indicatesD25.

G. Heald et al.: The Westerbork SINGS Survey II. 11
Fig. 4. (continued) Images of sample galaxies.

12 G. Heald et al.: The Westerbork SINGS Survey II.
Fig. 4. (continued) Images of sample galaxies.

G. Heald et al.: The Westerbork SINGS Survey II. 13
Fig. 4. (continued) Images of sample galaxies.

14 G. Heald et al.: The Westerbork SINGS Survey II.
Fig. 4. (continued) Images of sample galaxies.
ized arcs. The three polarized background doubles in this fielddisplay substantial differences in their RMs. The greatest con-sistency is seen between the two lobes of one of the doubles,at −6 ± 3 rad m−2. There may be significant structure of theforeground RM in this field.
NGC 2903 In this galaxy, one of the Starburst supplement tothe basic SINGS sample, bright polarized arcs are detected alongboth sides of the minor axis trailing away in brightness slowlyto the northeast and more rapidly to the southwest. The lowestbrightness of polarized emission occurs on the receding majoraxis (PA= 204◦, as tabulated in Table 1). The polarized fractionincreases from about 1% in the inner parts to about 5–15% atintermediate radii, to as high as 40%. The magnetic field vec-tors are roughly parallel to optical spiral arm structures for theminor axis features, although generally with a slightly larger ra-dial component. Field lines run almost perpendicular to thelin-ear major axis feature. The Faraday depth distribution shows asmall systematic variation with PA in the minor axis features
which we will comment on in Paper III, together with a largesystematic offset of these (by 60 rad m−2) relative to the majoraxis feature. Very good consistency is found for the RMs towardboth lobes of a double source in the field, suggesting a value of+3 ± 1 rad m−2 for the Galaxy in this direction.
NGC 2976 There is very faint diffuse polarized emission as-sociated with this galaxy, together with a modest enhancementalong the southwestern edge of the optical disk. Only a singlelobe of one double source is detected in this field, yielding aGalactic foreground RM of−34 ± 2 rad m−2. The unresolvedsources in the field show significant scatter about this value.
NGC 3184 In this galaxy, faint polarized emission is apparentover much of the northern half of the disk. The lowest bright-ness of polarized emission occurs near the receding major axis(PA= 179◦, as tabulated in Table 1). Interarm regions may be en-hanced relative to the spiral arms, but deeper observationswould

G. Heald et al.: The Westerbork SINGS Survey II. 15
be required for a definitive analysis. Only a single lobe of onedouble source is detected in this field, yielding a Galactic fore-ground RM of+19 ± 2 rad m−2. The unresolved sources in thefield show significant scatter about this value.
NGC 3198 No significant polarized emission is detected in thistarget, apart from a possible detection of the nucleus. An equalbrightness double source in the field allows a very consistentassessment of the Galactic foreground RM of+7 ± 2 rad m−2.
NGC 3627 (M66) Bright polarized emission is detected thisgalaxy, with a conspicuous north-south gradient of the fractionalpolarization. It originates in both optical spiral arm and in inter-arm regions. The polarized fraction at 22cm is less than 1% inthe bright optical bar and inner disk of the galaxy, and increasesin the regions outside of the spiral arms to as much as 15% on theeastern minor axis. The lowest brightness of polarized emissionoccurs near the receding major axis (PA= 173◦, as tabulated inTable 1). The magnetic field orientation closely follows theopti-cal spiral structure, except at the largest radii where it generallybecomes more radial. Some possible systematic variation intheFaraday depth can be discerned which we will comment on inPaper III. Note that Soida et al. (2001) have published VLA andEffelsberg observations of this galaxy at 4.8 and 8.5 GHz whichdetect many of the same trends, although not detecting the samenorthern extent. The brighter lobe of a background triple sourcepermits assessment of the Galactic foreground RM of+13 ± 1rad m−2. Other field sources are scattered around this value.
NGC 3938 Moderately faint polarized emission is detected inthis almost face-on spiral. The polarized emission is concen-trated to the outer disk and is enhanced in inter-arm regions. Incontrast to other galaxies in our sample, the lowest brightnessof polarized emission seem to occur near theapproaching ratherthan the receding major axis (i.e., opposite to PA= 204◦, as tab-ulated in Table 1). However, as apparent in the StokesI imaging(Braun et al. 2007), there is also a minimum in the total intensityon the approaching major axis, so that this object does not repre-sent a counter-example to the trend we see in the azimuthal mod-ulation ofP. The polarized fraction (where detected) is about 10-25%. In the few regions where there is enough signal to deter-mine the magnetic field orientation, the field lines run parallel tothe spiral arms. The brighter lobe of a double source in the fieldpermits assessment of the Galactic foreground RM of+1 ± 2rad m−2. Other field sources display only a small scatter aroundthis value.
NGC 4125 In this elliptical galaxy, Braun et al. (2007) report acontinuum source at the nucleus, which we find is not polarized.They also report a double radio galaxy just to the southwest,thesouthern component of which is polarized at about the 5% level.The three double sources in this field provide a very consistentmeasurement of the Galactic foreground RM of+19± 1 rad m−2.
NGC 4236 In this galaxy, Braun et al. (2007) report detectingcontinuum emission from the bright knots in the disk. There isno polarized counterpart associated with these features. The dou-ble background radio source behind the disk of NGC 4236 isdetected in polarization, at about the 7% polarized fraction levelwith an RM of−3 ± 2 rad m−2. The two unconfused backgrounddouble sources in the field provide a consistent estimate of the
Galactic foreground RM of+15 ± 2 rad m−2. The differencemay well be due to the magneto-ionic ISM of NGC 4236.
NGC 4254 (M99) Bright polarized emission is detected froman incomplete ring extending from PA∼ 90 – 330◦. The peakof the polarized continuum is to the south of the southern spiralarm. The StokesI peak is also slightly offset to the south fromthe nucleus of the galaxy, though not as far as the peak of thepolarized emission. The lowest brightness of polarized emissionoccurs near the receding major axis (PA= 65◦, as tabulated inTable 1). Both the interior and exterior of the unusual westernspiral arm display bright polarized emission that subsequentlyextends far to the north of the optical disk. The polarized fractionis only moderate in the vicinity of the southern peak; 4% at thepeak and 1–10% elsewhere in that region. Polarized fractions arealso low in the inner spiral arm region; below one percent rang-ing up to a few percent. Along the outer western edge and in thenorthern polarized extension, the polarized fraction is generallyin the range 10–15%, but in some areas as high as 20–25%. Themagnetic field lines follow the spiral arm structure very well, es-pecially in the southern region where the polarized emission isbrightest. To the north, at the location of the radio continuumextension, the magnetic fields continue to follow the directiondefined by the optical spiral arm structure, even though the opti-cal arm is no longer detected. The apparent departure from thissimple pattern in the southwest is due to a polarized backgroundsource. The Faraday depth distribution shows some interestingsystematic variation: the Faraday depth tends to be negative onthe outside of the spiral arms, and positive on the inside. Withinthe bright radio continuum disk there may be evidence for someazimuthal variation, while the western and northern polarizedextensions do not participate in this pattern. This galaxy has re-cently been studied by Chyzy et al. (2007) and Chyzy (2008),who report on VLA and Effelsberg polarimetric observations at1.4, 4.8 and 8.5 GHz. A single double source in the field allowsreasonable assessment of the Galactic foreground RM (from thebrighter lobe) of−13 ± 3 rad m−2.
NGC 4321 (M100) In this spiral galaxy, polarized emission isclearly detected throughout most of the disk. In the northwest,bright polarized emission is present throughout the interarm re-gions. But in the southeast the polarized surface brigntessde-clines dramatically. The lowest brightness of polarized emissionoccurs near the receding major axis (PA= 159◦, as tabulated inTable 1). The polarized fraction in this disk is generally ratherlow, ranging from less than or about 2% in the inner regions toabout 5–10% in the interarm regions, with the polarized frac-tion tending to be higher outside of the arm than inside the arm.At the edges, the polarized fraction is higher at about the 15%level, and localized spots where the fraction reaches 30%. Theappearance of the magnetic field lines is highly ordered, andfol-lows the orientations of the optical spiral arms. An almost equaldouble in the field allows consistent assessment of the Galacticforeground RM of−17 ± 1 rad m−2.
NGC 4450 No significant polarized emission is detected in thisgalaxy. The almost equal double and brighter lobe of a tripleinthe field allow consistent assessment of the Galactic foregroundRM of −8 ± 1 rad m−2.

16 G. Heald et al.: The Westerbork SINGS Survey II.
Fig. 5. Optical images of sample galaxies with extended polarized flux. The background images are red plates from the DSS-2, and are presentedwith a square-root color transfer to bring out the faint structures. Contour levels (white) of polarized intensity run from 50µJy beam−1 in powersof 2. The galaxy ID is indicated in the upper left of each panel. The magnetic field orientations are displayed with red vectors.

G. Heald et al.: The Westerbork SINGS Survey II. 17
Fig. 5. (continued) Optical images of sample galaxies with extended polarized flux.

18 G. Heald et al.: The Westerbork SINGS Survey II.
NGC 4559 In this spiral galaxy, diffuse continuum emissionis detected, but the polarized component is extremely faintandonly detected in a small region in the southeast portion of thedisk. This asymmetry is again consistent with the lowest polar-ized intensity to be seen on the receding major axis. Deeper ob-servations would be needed to better characterize the polarizedemission. The equal double in the southern part of the field pro-vides a consistent estimate of the Galactic foreground RM of−5 ± 2 rad m−2, while the remaining four unresolved sources inthe north and east of the field are all tightly clustered around anRM of +6 ± 2 rad m−2. This systematic difference of the RM byof ∼ 10 rad m−2 over∼ 15′ in a field so near the Galactic pole(b = 86◦) is surprising.
NGC 4569 (M90) In this moderately inclined spiral galaxy, po-larized emission is detected in the central disk region on eitherside of the minor axis. Polarized intensity declines more slowlyto the southwest and more rapidly to the northeast (where there-ceding major axis is located (PA= 23◦, as tabulated in Table 1).Moreover, the spectacular double lobe extension which is ori-ented roughly along the minor axis is also detected in polariza-tion, particularly along its edges. Even more interesting is thecontinuum bridge connecting the galaxy to its small compan-ion, IC 3583 (located about 6 arcminutes to the northwest, andvisible in both Figures 4 and 5), which also has a polarized coun-terpart. The large-scale structures in our map have alreadybeenobserved at lower spatial resolution and analyzed by Chyzyet al.(2006), who observed this system with the Effelsberg telescope.The polarized bridge and the lobe extensions have rather highpolarized fractions. The bridge is polarized at the 20–30% level,the lobes at the 10-20% level, with localized hot-spots of higherpolarized fraction, of about 40%. The disk itself has polarizedfractions of only about 1-2%. As for the magnetic field orien-tations, the situation is confused in the disk due to the modestangular resolution, but there seems to be a slight tendency forfield lines to follow the optical spiral arms. In the radio lobes, thefield lines appear to trace the edges of apparent cavities. Finally,in the extension toward IC 3583, the magnetic field lines runroughly along the direction of the extension. The brighter lobe ofa background double source provides an estimate of the Galacticforeground RM in this direction of+18 ± 2 rad m−2.
NGC 4631 In this edge-on interacting spiral, the polarizedemission is found in a roughly X-shaped morphology, and comesmainly from the extraplanar regions. The disk itself seems to belargely depolarized. Polarized emission is detected in thecen-tral region and in each of the four extraplanar galaxy quadrants.The north side is brighter in polarization than the south side.The brightest polarized intensity is from the northeast quadrant,which is the region where the dramatic HI extension studied byRand (1994) is located. The polarized structure runs roughly par-allel with the HI extension, but fills the region between the diskand the HI filament. The polarized fraction in this galaxy is lessthan one percent in the central regions and increases with heightabove the midplane. At the largestz-heights, the polarized frac-tion reaches as high as 30–40% in some places. The magneticfield lines run along the X-shaped polarized morphology. In thenortheast quadrant, they run almost parallel to the HI extension,but these seem to be unrelated. The polarized structures reportedhere have been observed previously by Hummel et al. (1991) andGolla & Hummel (1994). The best estimate of the Galatic fore-ground RM in this direction comes from the unconfused doublesource in the field with an RM of−4± 3 rad m−2; consistent with
several other sources in the field. The double background sourcelying just south of NGC 4631 is likely to be strongly affected bythe halo of that galaxy, the brighter lobe of which displays anRM of −38 ± 2 rad m−2.
NGC 4725 Extremely faint polarized emission is detected inthis moderately inclined barred spiral galaxy, with the polar-ized emission originating at both ends of the minor axis. Thepolarized emission avoids the bar, which is at a position angleof about 45 degrees, and is mostly found on the outer periph-ery of the ring-like structure. The polarized emission is too faintto allow investigation of its detailed properties; deeper observa-tions would be required. It is not possible to say anything aboutthe magnetic field orientation, as too little signal is available.The foreground RM from the Galaxy in this direction can beestimated from the double radio source in the field at+4 ± 4rad m−2; a value consistent with several other unresolved sourcesin the field.
NGC 4736 (M94) The polarized emission in this galaxy is seenfrom both the inner star-forming disk and also concentratedalong the minor axis, particularly in the form of a possible polar-ized lobe directed toward the southwest. Within the centraldisk,the polarized intensity declines to a minimum in the directionof the receding major axis (PA= 296◦, as tabulated in Table 1).The central source is polarized at about the 2% level. The innerring is polarized on the south side, at about the same fraction.The polarized fraction increases at large radii up to about 40%.Magnetic field lines in the possible lobe structure are alignedradially away from the nucleus. Since the near-side of the stel-lar disk in this system (as determined from optical dust lanes)is in the northeast, the location of the southwestern lobe iscon-sistent with it being the closer of a pair of symmetric nuclearoutflows, in which the more distant lobe suffers greater depolar-ization from the intervening disk. This, together with the lackof a conspicuously distinct feature in the StokesI map at thesame location, points to the lobe structure being intrinsicto NGC4736 (as opposed to an extended, polarized, background source).Galactic foreground RM in the field can be estimated from sev-eral double sources which are detected in polarization. Twoofthese are rather faint and have large uncertainty, while thehighsignal-to-noise detection yields a value of+1 ± 1 rad m−2. Avery extended (6 arcmin) background double radio galaxy is alsoseen in the southwest portion of the field. Although both lobeshave similar brightness in bothI and P, the polarized surfacebrightness is so faint that an accurate RM determination is notpractical.
NGC 4826 (M64) There is a low level of polarized emissiondetected in the southern quadrant of this system that nowhereexceeds 4σ. The best estimate of the Galactic foreground RM inthis field comes from the brighter lobe of a double radio sourceyielding−8 ± 2 rad m−2.
NGC 5033 The polarized emission in this galaxy is associatedwith the bright inner continuum disk reported by Braun et al.(2007). It has a roughly X-shaped appearance, which may be in-dicative of minor axis outflows, as seen elsewhere in our sample.The polarized brightness declines to a minimum in the directionof the receding major axis (PA= 352◦, as tabulated in Table 1).In the central parts the polarized fraction is of the order of. 1%.

G. Heald et al.: The Westerbork SINGS Survey II. 19
At larger radii the polarized fraction increases to about 5-7%.Although there are no well resolved double radio sources in thefield, at least one source is observed to be somewhat extendedwith an RM of+9 ± 2 rad m−2. The various other unresolvedsources in the field show scatter about this value.
NGC 5055 (M63) Diffuse polarized emission is detected fromthe disk of this inclined galaxy on both sides of the minor axis.The highest brightnesses are associated with the zone of strongwarping of the gaseous disk in the southwest at the edge of thestar-forming disk. A fainter counterpart is seen in the northeast.The minimum in polarized intensity occurs at the PA of the re-ceding major axis (PA= 102◦, as tabulated in Table 1). The po-larized fraction of the brightest feature is mainly in the rangeof 5–10%, but at the southernmost end (where the contributionfrom the bright inner disk is significantly fainter) the fraction in-creases to 15–25%. The magnetic field lines closely follow thespiral arm structure observed in the optical image. Two back-ground double sources yield an estimate of the background RMin this field of about−8 ± 3 rad m−2.
NGC 5194 (M51) In M51, the polarized emission is clearly de-tected throughout the disk, though there are large variations inthe polarized fraction. The bright polarized emission traces outa spiral pattern that runs parallel to the optical arms. The min-imum in polarized intensity occurs at the PA of the recedingmajor axis (PA= 172◦, as tabulated in Table 1). The compan-ion, NGC 5195, is not detected in polarization. The polarizationfraction at 22cm in M51 is variable, remaining lower than 5%within most of the optical disk, and increasing at large radii, be-yond the outer spiral arms, to as much as 25–30%. The orien-tation of the magnetic field lines closely tracks both the large-scale spiral pattern (as also seen by Horellou et al. 1992, seetheir Figure 10), as well as small-scale features that oftenhavedust-lane counterparts in the optical imagery. In two locationson the eastern side of the disk, the polarized emission crossesfrom the inside of the optical arm to the outside; at the crossingpoint, the magnetic field vectors turn from running paralleltothe spiral to follow the polarized emission across the arm. Thesefeatures occur near (αJ2000, δJ2000) = (13:30:1.5,47:12:15) and(13:30:5.4,47:10:30). Systematic variation in the Faraday depthis seen as function of azimuth, which will be discussed in PaperIII. Two background double radio sources are detected with veryhigh signal-to-noise, including one with comparable integratedP from each lobe. In StokesI, the brightness ratio of the twolobes in that source is actually 0.75, with the western lobe beingthe brighter. The best estimate of the Galactic foreground RMfor this field is+12 ± 2 rad m−2.
NGC 6946 The polarized emission is strongly detected fromthe northeast half of this galaxy, tapering away toward the south-west. The minimum in polarized intensity occurs at the PA ofthe receding major axis (PA= 243◦, as tabulated in Table 1).The polarized fraction (in the northeast) is quite low in theinnerparts at less than 10%, moderate at intermediate radii at about20–30%, and very high in the outer parts, reaching up to (andperhaps above) 40–50%. The magnetic field lines are closely re-lated to the large-scale spiral morphology traced by massive starformation and dust lanes, running largely parallel to the opticalarms. As has been pointed out by Beck (2007), the peaks in po-larized emission originate in the interarm regions. The Faradaydepth distribution shows a very clear systematic variationwith
azimuth, and will be discussed in Paper III. Beck (2007) havere-cently reported VLA and Effelsberg observations of this galaxyat 1.4, 2.6, 4.8, 8.5 and 10.6 GHz. They demonstrate that thereis substantial depolarization at 20cm in the southwest quadrantrelative to higher frequencies. The large-scale features that hediscusses are very similar to this work.
Unfortunately only a single well-resolved double back-ground source is detected in this field (about 10′ southwest ofNGC 6946), and this source is quite asymmetric. The brighterlobe has a well-defined RM of−14 ± 2 rad m−2. Several othersources in the field are possibly influenced by RM contributionsfrom the disk of NGC 6946 itself; including the extended back-ground source at (α 20:35:19,δ +60:02:05) just 2′ south of theNGC 6946 disk that appears to be a barely resolved (30′′) dou-ble with a well-defined RM of+23 ± 2 rad m−2. As previouslynoted, the low Galactic latitude of this field (b = +12◦, decreas-ing to the southeast) enhances the likelihood of fluctuations inthe foreground RM. We suggest that the most likely value of theforeground affecting NGC 6946 is an RM of+23 ± 2 rad m−2,but stress that there is a substantial systematic uncertainty in thisvalue. Ehle & Beck (1993) and Beck (2007) have previously de-termined a value of≈ +40 rad m−2 in this field, which is consis-tent with the mean Faraday depth that we have observed in thedisk of NGC 6946 (see Figure 6). We note that their foregroundRM value is derived using the diffuse emission of NGC 6946 it-self, while our derivation was performed using only backgroundsources in the field. We postulate that the difference may be dueto a non-zero contribution to the rotation measures in NGC 6946from a vertical component of the magnetic field in the halo ofthat galaxy. We return to this possibility in Paper III.
NGC 7331 The bright inner disk of this highly inclined spi-ral disk is highly polarized, and polarization is also detected inthe outer disk on both sides of the minor axis, extending wellout into the low surface brightness outer disk. The polarizedfraction is quite low in the inner parts, at about 1–3%, but itincreases rapidly toward the outer parts up to about 20–40%.This is a galaxy in which multiple Faraday depth componentsare encountered along some lines-of-sight, implying large-scaleinterspersal of emitting and rotating media. Magnetic fieldori-entations of the single brightest polarized component along eachline-of-sight show some tendency to be aligned with the star-forming disk at small radii, but become increasingly radialinthe minor axis extensions. The peak Faraday depth distribution isbi-modal, with two dominant ranges occurring, one nearφ = 0rad m−2 in the inner disk and the other near−150 rad m−2 associ-ated with the minor axis structures. The Galactic foreground RMin this general direction is known to be quite extreme (cf. Brotenet al. 1988; Han & Qiao 1994), even at tens of degrees fromthe Galactic plane. The brighter lobes of two resolved doublesources in the field suggest a value of about−177 ± 7 rad m−2.As was the case for NGC 6946, the relatively low Galactic lat-itude (b = − 21◦) increases the likelihood of fluctuations inthe foreground RM. This is reflected in the larger scatter of RMvalues of even the most reliable of probes.
4. Discussion
4.1. Circular polarization
In cases of extreme Faraday rotation, linearly polarized emis-sion can beFaraday converted into circular polarization (e.g.,Jones & O’Dell 1977). StokesV images (created as part of the

20 G. Heald et al.: The Westerbork SINGS Survey II.
Fig. 6. Images of peakφ in some of the survey galaxies. The colorbar at the top edge shows the range ofφ [rad/m2] displayed with the colormap.Galaxy ID is indicated in the upper left of each panel.

G. Heald et al.: The Westerbork SINGS Survey II. 21
Fig. 6. (continued) Images of peakφ in some of the survey galaxies.
22 G. Heald et al.: The Westerbork SINGS Survey II.
pipeline described in§2.1) were examined for signs of any cir-cularly polarized emission associated with the target galaxies.No detections were made.
4.2. Magnetic field distributions
In § 3.2, a few general trends can be discerned in the samplespiral galaxies. The most obvious of these is that the polarizedintensity is minimized along the receding major axis. This pointsto a common global magnetic field geometry which is tied notonly to the morphology of the galaxy, but also to the dynamicsof the galaxy. In Paper III, we discuss a quite general and simplemodel which may be at the origin of the observed patterns.
4.3. Extended Faraday depth profiles
The frequency coverage obtained in the WSRT-SINGS surveyis sufficient for excellent recovery of polarized emission at asingle Faraday depth or multiple well-separated Faraday depths.Well-separated regions of synchrotron emission and Faraday ro-tation lead to “Faraday thin” emission, which appears as oneor more unresolved features in the Faraday dispersion func-tion. The WSRT-SINGS frequency coverage is however insuf-ficient for recovery of polarized emission at a continuous rangeof Faraday depth. Such circumstances occur in regions referredto as “Faraday thick”. In Faraday thick regions, emitting and ro-tating plasmas with regular magnetic fields may be uniformlycollocated along the LOS, such that synchrotron emission fromthe far side of the volume suffers more Faraday rotation than thesynchrotron emission from the near side. In the simplest suchcase, a constant level of polarized flux will be detected at a con-tinuous range of Faraday depth. Faraday thickness can also orig-inate in volumes in which the Faraday rotation is generated byturbulent magnetic fields. This will also lead to polarized fluxbeing distributed over a range of Faraday depth (Burn 1966).Berkhuijsen et al. (1997) describes how this latter mechanismcan cause depolarization of the synchrotron emission within thedisk at 18- and 20-cm wavelengths in the particular case of NGC5194. In this picture, the intervening halo is transparent to polar-ized emission, and acts as a “Faraday screen”.
Recall that the resolution in Faraday depth space,∆φ, is in-versely proportional to the width of the sampling inλ2 space,∆λ2. The offset of theλ2 sampling fromλ2 = 0 does not af-fect the resolution. However, the ability to detect polarizationin the presence of internal Faraday depolarization (eithercausedby regular or turbulent fields, as described above) is determinedby the actual values ofλ2. As shown by Burn (1966), when ob-serving a Faraday thick region with regular magnetic fields,the||P(λ2)|| distribution is a sinc function. Differential Faraday rota-tion within the emitting and rotating region depolarizes the emis-sion to some degree at all non-zero wavelengths, and the effectis generally stronger at largerλ2. The depolarization takes placewithin the volume and not at the telescope. It is thus independentof the channel width used in performing the observation, butitis dependent on the frequency band itself. The fractional recov-ery of the polarized flux by RM-Synthesis is determined by thesampled values ofλ2. A smaller value ofλ2
min means sampling||P(λ2)|| closer to its peak, and thus recovering more of the intrin-sic polarized flux. With observations made atλ2 ≫ 0, neither theRM-Synthesis technique nor a subsequentRM-CLEAN operationwill completely recover the intrinsic degree of polarization (i.e.,P(λ2 = 0)) if internal depolarization has been present. There isno substitute for obtaining the required full sampling ofλ2.
The reconstruction of the intrinsic polarized flux in Faradaythick regions is incomplete because of the Fourier transform atthe heart of RM-Synthesis. Large-scale structures inP(φ) are re-covered by observations at smallλ2. Thus the consequence ofλ2
min ≫ 0 in a given observation is that only the high-frequencystructures inP(φ) are sampled. The front and back “skins” of aFaraday thick region will be detected in polarization, eachwitha depth inφ of aboutπ/λ2
min (the largest scale that we are able torecover with our frequency sampling). For the current observa-tions withλmin = 17 cm, this corresponds to a skin depth of about108 rad m−2, while our resolution is about∆φ ≈ 144 rad m−2.If we imagine a uniform slab with a Faraday depth exceeding2π/λ2
min, we might begin to resolve the front and back skins ofsuch a structure, albeit with the inevitable reduction of polarizedintensity from its intrinsic value.
Although we are unable to reconstruct the intrinsic degreeof polarization for arbitrary Faraday thick structures with thepresent frequency coverage, we can look for indications thatFaraday thick regions are present. The most obvious of thesewould be the detection ofφ-broadening, or even resolvedφ-splitting in Faraday depth. The amount of broadening or splittingwould begin to constrain the likely degree of depolarization thataffects the current observations. A systematic decrease of polar-ized emission, such as seen toward the southwest half of NGC6946, would be a more ambiguous indicator. This form of differ-ential depolarization would require a systematic increasein theFaraday depth of some regions relative to others. In the caseofNGC 6946 this seems rather unlikely to be due to the distribu-tion of electron density, as also concluded by Beck (2007), butmay instead be due to a large-scale pattern in the field geometrywhich might lead to both a systematic increase of the Faradaydepth as well as a decrease in the intrinsic degree of polarization(given their orthogonal dependence on the field orientation). Wereturn to this discussion in Paper III.
To assess the presence of broadened and/or split Faraday dis-persion function profiles, we adapt the so-called “velocityco-herence” technique described by, e.g., Braun et al. (2009).TheRM-CLEANed P(φ) cubes were smoothed along theφ axis witha boxcar kernel, of width 143 rad m−2, which is similar to theFWHM of the Faraday resolution. After this smoothing oper-ation, an unresolved Faraday dispersion function will peakatabout 81% of its original amplitude. Broadened profiles willhave a higher relative peak amplitude. Images of the Faradaydepth coherence,φC ≡ P(φbc)/P(φ), were produced for eachgalaxy, whereP(φbc) is the peak polarized flux in each pixel ofthe boxcar-smoothedP cube, andP(φ) is the same quantity inthe original cube. Inspection of these images did not revealanyglobal systematic patterns, but some small-scale localized fea-tures are of note.
In galaxies with distributed polarized flux, small localizedFaraday thick regions tend to appear in interarm regions. InNGC4254, the region between the nucleus and the large northwesternspiral arm is significantly Faraday thick compared to the rest ofthe disk. In NGC 4631, the averageφC is somewhat higher thanin the other sample galaxies. This is not unexpected, since itsedge-on orientation may cause a significant amount of Faradaydepolarization. The largest values ofφC (corresponding to thebroadestP(φ) profiles) appear along the southern edge of thepolarized extension in the northeast quadrant of the galaxy. Inother targets, there does not appear to be a recognizable structurein φC which can be associated with morphological features.

G. Heald et al.: The Westerbork SINGS Survey II. 23
Fig. 7. RM spectra extracted from the central regions of the indicatedgalaxies (coordinates are listed in Table 3). Features withtabulated char-acteristics are indicated with solid lines; the polarization angle at thatvalue of RM is indicated. The Galactic foreground contribution (fromTable 1) is indicated with dotted lines.
4.4. Nuclear Faraday dispersion functions
In all of the galaxies with compact, (circum-)nuclear polarizedemission, the nucleus is detected at two distinct Faraday depths(and perhaps three in the case of NGC 6946) which are offsetto both positive and negative values from the estimated Galacticforeground RM by about 100 rad m−2. Recall that this splittingcorresponds almost exactly with the condition noted above forresolving the two skins of an intrinsically Faraday deep distri-bution with our observing setup, of 2π/λ2
min ∼ 200 rad m−2. Apossible exception is NGC 4569, for which the polarized emis-sion appears to be associated with the nucleus, but shows onlya hint of a broadened feature in the Faraday dispersion function.Table 3 lists the characteristics of the polarized nuclear emissionin the targets with polarized emission at multiple Faraday depths.The columns are (1) Galaxy ID; (2,3) RA (J2000.0) and Dec.(J2000.0) from which the Faraday dispersion functions wereex-tracted; (4) Nucleus classification from Ho et al. (1997), whereH indicates HII nucleus, S indicates Seyfert nucleus, L indicatesLINER nucleus, T indicates transition nucleus, and numbersin-dicate subclasses; (5) RM feature number; (6)φ value at the lo-cation of the RM feature; (7) Total polarized flux at that RM;(8,9) Stokes Q and U values at that RM; (10) Polarization an-gle derived from Q and U. The deconvolved Faraday dispersionfunctions are plotted in Figure 7. Note that in Figure 4, onlythepolarized flux (and polarization angle) of the brightest of thesecomponents is plotted.
What is the origin of the split Faraday dispersion functions?Given theλ2 coverage of the observations, there are two possi-bilities. Either polarized emission with two distinct rotation mea-sures originates within the spatial beam of our observations, orwe are detecting Faraday thick emission. In the latter case (asnoted in§4.3), our observational setup is unable to recover ex-tended features in the Faraday depth domain. We would recoveremission only from the edges of such a structure, giving the ap-pearance of two distinct features. In either case, the physical ori-gin must be a characteristic geometry of the nuclear magneticfield and ionized gas distribution common to all galactic nucleiwith such Faraday dispersion functions. Understanding these nu-clear Faraday dispersion functions may therefore illuminate thephysics in the central regions of these galaxies. The rathergen-eral detection of both positive and negative net Faraday depthsis already indicative of both positive and negative signs ofB‖.Such a sign change of the LOS field, seen from galaxies in-clined between 30 and 85 degrees, might be understood witha radially directed (outward or inward) field geometry in eitheror both of the galaxy mid-plane or parallel to the rotation axis.We note that somewhat higher resolution observations of NGC6946 (Beck 2007, see his Figure 11) show a continuation of thespiral pattern all the way into the nuclear regions, but perhapswith a greater radial component than at larger radii. Since,in thenuclear Faraday dispersion functions, comparable levels of po-larized intensity are seen from both the negative and positive RMcomponents, it seems plausible that the synchrotron emitting re-gion has a significant radial extent that is relatively symmetricabout the origin of the sign change ofB‖, which presumablycorresponds to the galaxy nucleus. It is worth mentioning thata global magnetic field geometry which is everywhere inward-or outward-directed would, in the spatially unresolved centralregion, show at least a double-peaked Faraday dispersion func-tion. However, the magnitude of theφ values that we observein the nuclear regions are much larger than the typicalφ valueselsewhere in the disks, suggesting either that an additional mag-netic field component is present in the nuclei, or that enhancedmagnetic field strengths and/or electron densities are present inthe nuclear regions.
In the case of NGC 4631, the split Faraday dispersion func-tion may be influenced by the almost edge-on aspect of thegalaxy. The orientation could lead to a large Faraday depth to-ward the nucleus, which might also be responsible for the promi-nent areas of likely depolarization throughout the disk plane. Aconnection of Faraday depth with the outer disk orientationisnot as obvious for the more face-on targets. In fact, the largestobserved splitting between the two detected components is seenin NGC 6946, for which the disk inclination is only 33◦. Fora circum-nuclear dipole field, a sign reversal would not occurin the vertical component, but would only be expected to oc-cur in the radial component. This would be most apparent in anedge-on viewing geometry. For a quadrupole field a sign rever-sal would be expected to occur in both the radial and verticaldirections, and thus might be seen independent of the viewingangle. Although neither edge-on nor face-on viewing geometriesof the outer disk are strongly preferred for witnessing thisphe-nomenon, our sample size is not large enough to draw generalconclusions on a preferred circum-nuclear field configuration.There is also no immediately apparent trend with the type ofnucleus. Nuclei with optical (Ho et al. 1997) and MIR (Daleet al. 2006) emission consistent with an AGN are just as likelyto show split profiles (4/11) when compared to nuclei which areclassified as non-AGN (3/10). Similar analysis, using the RM-

24 G. Heald et al.: The Westerbork SINGS Survey II.
Table 3. Characteristics of Split RM Profiles in Galaxy Cores.
Galaxy RA Dec Nucleus Feature φ P(φ) Q(φ) U(φ) χ(φ)ID J2000 J2000 Type no. [ rad m−2] [µJy] [µJy] [µJy] [deg.]NGC 2903 09 32 09.8 21 30 00 H 1 -93 143.0 -102.4 18.3 84.9NGC 2903 2 +70 276.0 141.3 -245.6 -30.0NGC 3627 11 20 15.8 12 59 26 T2/S2 1 -133 144.0 111.7 -39.5 -9.7NGC 3627 2 +55 153.0 146.8 44.1 8.4NGC 4321 12 22 54.9 15 49 21 T2 1 -103 191.0 -149.6 -40.6 -82.4NGC 4321 2 +150 135.0 9.6 -136.6 -43.0NGC 4631 12 42 07.7 32 32 26 H 1 -108 88.0 -57.5 -60.1 -66.9NGC 4631 2 +73 87.0 33.1 -74.9 -33.1NGC 4736 12 50 53.1 41 07 14 L2 1 -128 178.0 268.3 -63.1 -6.6NGC 4736 2 +135 184.0 164.6 -66.5 -11.0NGC 5194 13 29 52.7 47 11 47 S2 1 -28 91.0 12.7 -4.1 -8.9NGC 5194 2 +128 97.0 73.7 9.3 3.6NGC 6946 20 34 52.3 60 09 22 H 1 -208 122.0 -53.1 -45.4 -69.7NGC 6946 2 +15 74.0 26.2 50.9 31.4NGC 6946 3 +233 110.0 68.3 -30.4 -12.0
Synthesis technique, of a larger number of galaxies would helpto clarify the situation.
Based on our sample, a sufficient condition for the existenceof a multiply peaked nuclear Faraday disperion function is sim-ply the presence of a compact, polarized nuclear source. Thereare two apparent exceptions to this pattern which deserve furthercomment. NGC 7331 has split profiles but no compact nuclearsource. This particular galaxy exhibits split Faraday dispersionfunctions throughout the inner disk, so the splitting notedheredoes not apply to a nucleus. Moreover, only one of the RM com-ponents in NGC 7331 (the inner disk) is displaced significantlyfrom the Galactic foreground value, rather than both as seento-ward polarized nuclear sources. On the other hand, NGC 4569has what appears to be a compact, polarized nuclear source, butthe nuclear Faraday dispersion function is not obviously split.In this case there is some indication for broadening of the pro-file toward the nucleus in the Faraday depth coherence imagedescribed in§ 4.3; it may be that there is splitting which is onlybarely resolved with our RM resolution (∼ 144 rad m−2). Furtherwork to investigate nuclear polarization should be performed athigher frequency, where the effects of internal Faraday depolar-ization are less important, and Faraday thick regions can beun-ambiguously distinguished from regions with multiple distinctFaraday depths. At higher frequencies, the width of the RMSFwill likely be broader than we have obtained here. Judiciouscombinations of observations at low and high frequency can leadto the recovery of Faraday thick polarized flux. As pointed outby Brentjens & de Bruyn (2005), the condition for recoveringsuch flux isλ2
min < ∆λ2.
5. Conclusions and Outlook
We have presented linear polarization data measured in twobroad frequency bands near 1400 and 1700 MHz in the WSRT-SINGS survey. The RM-Synthesis method was used to recon-struct the intrinsic properties of the polarized emission,obtain-ing and correcting for the Faraday depth contributions fromboththe Milky Way and the target galaxies themselves. The recon-structed Faraday dispersion functions were deconvolved usinga technique similar to theCLEAN algorithm commonly utilizedin synthesis imaging. The deconvolution was particularly im-portant with the present observations, because the gap in fre-quency coverage between our two frequency bands causes the
RM spread function (RMSF) to exhibit sidelobes at nearly the80% level.
The results of these processing steps were used to derivemaps of the linearly polarized flux in each of the target galaxies,and, in cases where sufficient flux was measured, to analyze thespatial distributions of Faraday rotation measures, whichprobethe component of the magnetic field along the line of sight, andpolarization vectors, which probe the component of the mag-netic field perpendicular to the line of sight. The Faraday rota-tion corrected polarization angles were used to generate maps ofthe magnetic fields perpendicular to the line of sight.
Linearly polarized emission was detected in 21 of the 28galaxies considered in this investigation. The detected galaxiesall have Hubble type between Sab and Sd; only three galaxies(out of 24) in this range of classification were undetected inpo-larized flux. All of the (albeit few) sample galaxies with Hubbletype later than Sd or earlier than Sa were all undetected. Wehave not detected any circularly polarized emission from any ofthe galaxies.
The most prominent trend which has emerged through thisanalysis is that in all galaxies with spatially extended polarizedemission, the azimuthally-binned polarized flux is consistentlylowest along the receding major axis. For such a trend to appearin such a large and diverse sample of spiral galaxies impliesthata common magnetic field geometry has been revealed. In PaperIII, we attempt to model the observed azimuthal variations inboth rotation measure and polarized flux, using toy models ofaxi- and bi-symmetric magnetic field configurations, with the ad-ditional possibility of a non-zero vertical component to the field.We find that such a magnetic field geometry can explain the az-imuthal variation in polarized flux, its dependence on inclina-tion, as well as the azimuthal variation in the rotation measuresattributed to the target galaxies.
Another interesting feature was discovered in the galaxieswith prominent nuclear emission in both total power and lin-early polarized flux. The Faraday dispersion functions in thosegalaxies’ cores show indications of significant broadeningand/orsplitting, indicating the presence either of spatially collocatedsynchrotron-emitting and Faraday-rotating plasma, or distinctFaraday thin emitting regions within the resolution element. Atthe wavelengths observed in this survey, we are rather insensi-tive to significantly broadened Faraday dispersion functions –these would appear (at best) as double-peaked profiles. It ispos-sible that all of these galaxies hostFaraday thick regions in their

G. Heald et al.: The Westerbork SINGS Survey II. 25
cores, but we are unable to make this distinction. Observationsat higher radio frequencies, where depolarization issues are lesssignificant, would clarify the situation. What is clear, from theoccurence of both positive and negative net RMs (after account-ing for the Galactic foreground contribution), is that the polar-ized emission arises on either side of a reversal of the LOS field,presumably reflecting a radially directed field (either inward oroutward) centered on the nucleus. Whether the LOS magneticfield simply changes sign near the nucleus, or polarized flux ispresent at an extended range of Faraday depth (centered nearφ = 0 rad m−2), is not clear with the present observations.
The techniques used here can be extended to observationsperformed at other radio telescopes. In particular, the newclassof telescopes which are being built now and into the era of theSKA, will all provide polarization data at excellent frequencyresolution covering wide bandwidth. These telescopes willpro-vide data which is excellently suited for use with the RM-Synthesis method, and will enable the study of a larger sampleof galaxies at greater sensitivity, and improved resolution in theFaraday domain. Of particular interest is the LOw FrequencyARray (LOFAR; Falcke et al. 2007) array which is presently be-ing built, and will operate at frequency ranges between 30− 80and 120− 240 MHz. At these low frequencies, we will have RMresolutions of order 1 rad m−2 and better (cf. the WSRT-SINGSRM resolution≈ 144 rad m−2), yielding sensitivity to far weakermagnetic field structures in nearby galaxies (Beck 2008).
Acknowledgements. We thank Michiel Brentjens for providing his RM-Synthesis software, and for several enlightening discussions. The WesterborkSynthesis Radio Telescope is operated by ASTRON (The Netherlands Institutefor Radio Astronomy) with support from the Netherlands Foundation forScientific Research (NWO). The Digitized Sky Surveys were produced at theSpace Telescope Science Institute under U.S. Government grant NAG W-2166.The images of these surveys are based on photographic data obtained using theOschin Schmidt Telescope on Palomar Mountain and the UK Schmidt Telescope.The plates were processed into the present compressed digital form with the per-mission of these institutions. We thank the anonymous referee for carefully read-ing the manuscript, and providing helpful comments which have improved thepaper.
ReferencesBeck, R. 2007, A&A, 470, 539Beck, R. 2008, Rev. Mex. AyA (arXiv: 0804.4594)Berkhuijsen, E. M., Horellou, C., Krause, M., et al. 1997, A&A, 318, 700Boulares, A. & Cox, D. P. 1990, ApJ, 365, 544Braun, R. 1995, A&AS, 114, 409Braun, R., Oosterloo, T. A., Morganti, R., Klein, U., & Beck,R. 2007, A&A,
461, 455Braun, R., Thilker, D., Walterbos, R., & Corbelli, E. 2009, ArXiv e-printsBrentjens, M. A. 2007, PhD thesis, Rijksuniversiteit Groningen, NetherlandsBrentjens, M. A. & de Bruyn, A. G. 2005, A&A, 441, 1217Broten, N. W., MacLeod, J. M., & Vallee, J. P. 1988, Ap&SS, 141, 303Bureau, M. & Carignan, C. 2002, AJ, 123, 1316Burn, B. J. 1966, MNRAS, 133, 67Chyzy, K. T. 2008, A&A, 482, 755Chyzy, K. T., Ehle, M., & Beck, R. 2007, A&A, 474, 415Chyzy, K. T., Soida, M., Bomans, D. J., et al. 2006, A&A, 447,465Condon, J. J., Cotton, W. D., Greisen, E. W., et al. 1998, AJ, 115, 1693Dale, D. A., Smith, J. D. T., Armus, L., et al. 2006, ApJ, 646, 161de Blok, W. J. G., Walter, F., Brinks, E., et al. 2008, AJ, 136,2648de Vaucouleurs, G., de Vaucouleurs, A., Corwin, Jr., H. G., et al. 1991, Third
Reference Catalogue of Bright Galaxies (Volume 1-3, XII, 2069 pp. 7figs.. Springer-Verlag Berlin Heidelberg New York)
Dolag, K., Vogt, C., & Enßlin, T. A. 2005, MNRAS, 358, 726Ehle, M. & Beck, R. 1993, A&A, 273, 45Falcke, H. D., van Haarlem, M. P., de Bruyn, A. G., et al. 2007,Highlights of
Astronomy, 14, 386Gaensler, B. M., Haverkorn, M., Staveley-Smith, L., et al. 2005, Science, 307,
1610Gardner, F. F. & Whiteoak, J. B. 1963, Nature, 197, 1162
Garrington, S. T., Leahy, J. P., Conway, R. G., & Laing, R. A. 1988, Nature, 331,147
Golla, G. & Hummel, E. 1994, A&A, 284, 777Greisen, E. W. 2003, in Astrophysics and Space Science Library, Vol. 285,
Astrophysics and Space Science Library, ed. A. Heck, 109Han, J. L. & Qiao, G. J. 1994, A&A, 288, 759Ho, L. C., Filippenko, A. V., & Sargent, W. L. W. 1997, ApJS, 112, 315Horellou, C., Beck, R., Berkhuijsen, E. M., Krause, M., & Klein, U. 1992, A&A,
265, 417Hummel, E., Beck, R., & Dahlem, M. 1991, A&A, 248, 23Jarrett, T. H., Chester, T., Cutri, R., Schneider, S. E., & Huchra, J. P. 2003, AJ,
125, 525Johnston, S., Taylor, R., Bailes, M., et al. 2008, Experimental Astronomy, 22,
151Jones, T. W. & O’Dell, S. L. 1977, ApJ, 214, 522Kamphuis, J. & Briggs, F. 1992, A&A, 253, 335Kennicutt, Jr., R. C. 1981, AJ, 86, 1847Kennicutt, Jr., R. C., Armus, L., Bendo, G., et al. 2003, PASP, 115, 928Laing, R. A. 1988, Nature, 331, 149Laing, R. A., Canvin, J. R., Cotton, W. D., Bridle, A. H., & Parma, P. 2006,
Astronomische Nachrichten, 327, 533Longair, M. S. 1994, High energy astrophysics. Vol.2: Stars, the galaxy and the
interstellar mediumMcKee, C. F. & Ostriker, E. C. 2007, ARA&A, 45, 565Miley, G. 1980, ARA&A, 18, 165Murphy, E. J., Helou, G., Braun, R., et al. 2006, ApJ, 651, L111Paturel, G., Petit, C., Prugniel, P., et al. 2003, A&A, 412, 45Popping, A. & Braun, R. 2008, A&A, 479, 903Rand, R. J. 1994, A&A, 285, 833Ruzmaikin, A. A. & Sokoloff, D. D. 1979, A&A, 78, 1Sault, R. J., Teuben, P. J., & Wright, M. C. H. 1995, in Astronomical Society of
the Pacific Conference Series, Vol. 77, Astronomical Data Analysis Softwareand Systems IV, ed. R. A. Shaw, H. E. Payne, & J. J. E. Hayes, 433
Schwarz, U. J. 1978, A&A, 65, 345Shetty, R. & Ostriker, E. C. 2006, ApJ, 647, 997Soida, M., Beck, R., Urbanik, M., & Braine, J. 2002, A&A, 394,47Soida, M., Urbanik, M., Beck, R., Wielebinski, R., & Balkowski, C. 2001, A&A,
378, 40Sokoloff, D. D., Bykov, A. A., Shukurov, A., et al. 1998, MNRAS, 299, 189Tamburro, D., Rix, H.-W., Walter, F., et al. 2008, AJ, 136, 2872Tullmann, R., Dettmar, R.-J., Soida, M., Urbanik, M., & Rossa, J. 2000, A&A,
364, L36Vogt, C., Dolag, K., & Enßlin, T. A. 2005, MNRAS, 358, 732Walter, F., Brinks, E., de Blok, W. J. G., et al. 2008, AJ, 136,2563Wardle, J. F. C. & Kronberg, P. P. 1974, ApJ, 194, 249
Appendix A: Deconvolution of the Faradaydispersion function
The Faraday dispersion function recovered using RM-Synthesishas undesirable features resulting from the incomplete samplingin theλ2 domain. These effects can be reduced using a deconvo-lution procedure, similar to what is done in the synthesis imagingcase. Here, we outline and justify our procedure in greater detailthan was provided in§2.3.
There are two salient features of the RMSF: the width ofthe main lobe (∆φ), and the sidelobe structure. In the WSRT-SINGS survey, the sampling function (see Figure 1, panele) canbe described as two windows. The form of our RMSF can belikened to the interference pattern in a double-slit experiment. Ifthe windows (slits) were infinitely narrow, the sidelobes wouldhave unit amplitude and the spacing would be inversely relatedto the distance inλ2 between the windows. In fact, the loca-tions on theφ-axis of the sidelobes would be identical to thenπ ambiguity which would result from a standard rotation mea-sure determination using the twoλ2 frequency samples alone.In actuality, the windows are made up of many individual fre-quency measurements, and therefore each effectively have a fi-nite width. This provides a taper to damp down the sidelobes.But the windows are still relatively narrow compared to the dis-tance between them, so the sidelobes remain rather high. It is

26 G. Heald et al.: The Westerbork SINGS Survey II.
therefore desirable to remove these sidelobes from the recov-ered Faraday dispersion function, particularly in cases whichmay potentially contain multiple distinct sources or broadeningalong theφ axis. Before deconvolution, the sidelobe structure ofa brighter component contaminates the response to fainter com-ponents, and may shift the location of peaks relative to their trueposition.
The mechanism for performing this deconvolution is quitesimilar to theCLEAN algorithm which is already well knownfrom the synthesis imaging case. We first describe the algorithm.Then we move on to justifying our choice of working in a do-main in whichλ2
0 , 0 (see equation 5). Here we demonstratethat deconvolution in that space is equivalent to deconvolution inthe “true” measurement space. Next we describe how a restoringRMSF was selected, and conclude with some general remarksabout the routine.
A.1. The deconvolution procedure
The algorithm, also described by Brentjens (2007), consists ofthe following steps:
1. In each spatial pixel, the complex (Q(φ),U(φ)) spectrum iscross-correlated with the complex RMSF. The location of thepeak absolute value of the cross-correlation,φm, is noted.
2. If P(φm) is greater than a user-defined cutoff, a shifted andscaled version of the complex RMSF is subtracted fromthe complex (Q(φ),U(φ)) spectrum. The scaled RMSF isgP(φm)R(φ − φm), whereg is a (real) gain factor.
3. The valuegP(φm) is stored as a “clean component”.4. Steps 1–3 are repeated until the value ofP(φm) is no longer
higher than the cutoff, or a maximum number of iterationshave been performed.
5. Finally, the clean components are convolved with a restoringGaussian beam with a FWHM equal to 2
√3/∆λ2 (see A.3),
and added to the residualF(φ). The result is the deconvolvedF(φ) spectrum.
The reason for using a cross-correlation in step (1), ratherthansimply searching for the peakP(φ) (in analogy to imaging de-convolution), is the hope that incorrect component localizationdue to possible sidelobe confusion will be eliminated. In prac-tice, the two techniques were found to yield the same resultsinour data.
A.2. Deconvolution in the “shifted” domain
We begin with the definitions of the dirty Faraday dispersionfunction in its unshifted (pure) form:
F(φ) = F(φ) ∗ R(φ) = K∫ +∞
−∞P(λ2)e−2iφλ2
dλ2 (A.1)
and its shifted form:
F′(φ) = K∫ +∞
−∞P(λ2)e−2iφ(λ2−λ2
0) dλ2 (A.2)
F′(φ) = K∫ +∞
−∞P(λ2)e−2iφλ2
e+2iφλ20 dλ2 (A.3)
Noting that the factore2iφλ20 is constant inλ2, we can pull it out
of the integral as a constant factor.
F′(φ) = K e2iφλ20
∫ +∞
−∞P(λ2)e−2iφλ2
dλ2, (A.4)
which is seen to be equivalent to:
F′(φ) = e2iφλ20 F(φ). (A.5)
In exactly the same way, it can be shown that the same relationholds for the RMSF:
R′(φ) = e2iφλ20 R(φ). (A.6)
We also must define
F′(φ) ≡ e2iφλ20 F(φ), (A.7)
which is just theactual Faraday dispersion function multipliedby the “shift” factor.
Again beginning with the shifted, dirty Faraday dispersionfunction,
F′(φ) = e2iφλ20 F(φ) = e2iφλ2
0 ×[
F(φ) ∗ R(φ)]
(A.8)
and incorporating the definition of a convolution,
F′(φ) = e2iφλ20
∫ +∞
−∞F(φ − u) R(u) du. (A.9)
We can now move the exponential inside the integral, and intro-duce two exponentials whose product is unity:
F′(φ) =∫ +∞
−∞
(
e2iuλ20 e−2iuλ2
0
)
e2iφλ20 F(φ − u) R(u) du. (A.10)
Rearranging,
F′(φ) =∫ +∞
−∞
(
F(φ − u)e2i(φ−u)λ20
) (
R(u)e2iuλ20
)
du (A.11)
F′(φ) =∫ +∞
−∞F′(φ − u) R′(u) du (A.12)
which is just
F′(φ) = F′(φ) ∗ R′(φ). (A.13)
This means that the shifted, dirty Faraday dispersion function isthe convolution of the shifted RMSFR′(φ) with the “rolled-up”Faraday dispersion functionF′(φ). After deconvolution, then,we will have determinedF′(φ). Recovery of the actual goal,F(φ), can be realized by multiplying by the “inverse shift fac-tor,” e−2iφλ2
0.
A.3. Selection of a restoring beam
The width of the main lobe of the RMSF,∆φ, reflects the factthat we have only limited precision in our determination of theFaraday depth of a polarized source. This is fundamentally re-lated to the sampling function. Thus, once we have extractedpoint source components during the deconvolution routine,theymust be replaced at a resolution appropriate to the measuredfre-quency domain. In other words the point source model is con-volved with a “restoring beam”. How does one choose the formof this restoring function?
By derotating toλ20 , 0, Brentjens & de Bruyn (2005) show
that the variation in the imaginary part of the RMSF is mini-mized. In a sense, we have selected a frame which rotates as afunction of λ2 in (Q,U) space such that the polarization vec-tor stays along theQ axis as much as possible. We would liketo choose a restoring function which is equivalent to zeroing out

G. Heald et al.: The Westerbork SINGS Survey II. 27
the residualU response in this rotating frame: in other words, as-serting that we have in fact determined the true rotation measureof the polarized source. (Recall, this is equivalent to eliminatingthe sidelobes of the RMSF.) Thus, we set the imaginary part ofthe restoring function to zero, and the real part to a Gaussiansimilar to the central lobe of the real part of the RMSF,in therotating frame λ2 − λ2
0. Formally, we choose
R(φ) = e−φ2/2σ2
, (A.14)
a real-valued function, whereσ is selected to match the widthof the real part of the shifted RMSF. As in the case of imageplane deconvolution, it has proven to be useful to retain a mainlobe width that is matched to the “dirty” image. While a nar-rower restoring RMSF might be selected, this would result ina mismatched resolution when compared to the deconvolutionresiduals. After the restoring function in eqn. A.14 is usedtosmooth the point source model to the appropriate resolution, it isput back into the measurement domain by multiplying with theinverse shift factor.
A.4. Practical considerations
Formally, this technique is straightforward. In the presence ofnoise, however, one must take care to properly treat the resid-uals and theCLEAN components which are returned by the de-convolution algorithm. In practice, the residuals are multipliedby the inverse shift factor (described above) separately. Then,the model is convolved with the restoring beam selected above,multiplied by the inverse shift factor, and added to the residuals.The final result is our deconvolved Faraday dispersion function,as used in this paper.
A final consideration is that the cubes should be reorderedprior to performing the deconvolution routine. This is becausethe routine works not on individual image slices, but ratheronspectra along theφ axis. Therefore it is considerably more effi-cient for the routine to be able to read out spectra sequentially,instead of having to read through the full cube to construct eachspectrum.
This RM-CLEAN algorithm has been implemented by us asa MIRIAD task and has been made publically available2. Thetask typically takes less than 20 minutes to operate on a pairof (Q(φ),U(φ)) cubes with dimensions (512× 512 × 401) ona dual 1.8 GHz Opteron system, to the cutoff level described inSection 2.3.
2 The RM-CLEAN procedure is available for download from<http://www.astron.nl/∼heald/software>.


![The Westerbork SINGS survey III. - arXiv · 2018. 11. 27. · arXiv:1002.1776v2 [astro-ph.CO] 26 Feb 2010 Astronomy & Astrophysicsmanuscript no. singsintrp c ESO 2018 November 24,](https://static.fdocuments.us/doc/165x107/60c0ed0d17eb9f6d201f300c/the-westerbork-sings-survey-iii-arxiv-2018-11-27-arxiv10021776v2-astro-phco.jpg)