Disaster Impacts and Children Welfare in West Java Province ...
The Welfare Impacts of Restructuring and Environmental Regulatory
Reform in the Electric Power Sector
Dallas BurtrawKaren Palmer
Anthony PaulΨ
Resources for the Future1616 P Street, NW, Washington DC 20036
October, 1998
Preliminary version prepared for presentation to the Southern Economics Association Meetings, November 8-10, 1998 in Baltimore, Maryland.
Abstract:The American electric power industry is undergoing dramatic changes in the way it is
structured and regulated. As of September of 1998, state utility regulators, state legislatures orboth in 18 states had made the decision to implement retail competition within 5 years or less.Competition in electricity markets and associated new opportunities for expanded inter-regionalelectricity trading could result in substantial changes in the mix of generation technologiesemployed to produce electricity, in the efficiency of power plant operations, and in the price andquantity of electricity traded in the marketplace.
This study evaluates potential retail competition and proposed new regulations to reduceNOX emissions. We present estimates of changes in economic welfare resulting from projectedchanges for the year 2003 in electricity consumption and generation and associatedenvironmental effects. We find that retail restructuring would produce customer and producersurplus benefits that substantially outweigh health damages from the slight increases in NOX
emissions. On the other hand, NOX emission reductions enforced under an average cost pricingscenario (traditional cost of service regulation absent retail competition) would lead to customerand producer surplus losses that are only slightly less than their environmental benefits.
The NOX emission reductions are less costly in terms of foregone customer and producersurplus when initiated in a restructured electricity industry. In this institutional setting, theadditional effect of policies enforcing NOX reductions is positive and substantial. Hence, we findretail restructuring has potentially important positive environmental benefits because it improvesthe affordability of NOX emission reductions. Finally, we find that allowing NOX trading, asopposed to uniform performance standards, can lead to a $200 million increase in consumer andproducer surplus in electricity markets with virtually no change in aggregate health relatedbenefits.
Ψ The authors are grateful to the U.S. Department of Energy, the U.S. Environmental Protection Agency, and theState of Maryland Department of Natural Resources for support of this project. Also, the authors are indebted toCary Bloyd, Martin Heintzelman and Evelyn Wright for technical assistance, and to Lumina Decision Systems formodeling assistance.

Burtraw, Palmer and Paul October, 1998
2
I. Introduction
The American electric power industry is undergoing dramatic changes in the way it is
structured and regulated. For much of its 100 year history, the industry has been organized
largely as a collection of local integrated monopolies that generate, transmit, distribute and sell
electricity at regulated prices to captive customers within a franchised service territory.
Currently the industry is going through a period of unbundling of functions whereby the
generation and retail sales markets are increasingly being opened up to competition. As of
September of 1998, state utility regulators, state legislatures or both in 18 states had made the
decision to implement retail competition within 5 years or less. Under retail competition,
electricity consumers will be allowed to pick their electricity suppliers, but the delivery of that
electricity to the customer’s premises will continue to be handled by the regulated local
distribution utility.
Allowing competition in electricity markets and associated new opportunities for
expanded inter-regional electricity trading could result in substantial changes in the mix of
generation technologies employed to produce electricity, in the efficiency of power plant
operations, and in the price and quantity of electricity traded in the marketplace. These changes
in turn could have potential implications for emissions, particularly of NOX and CO2, for
environmental quality and for economic welfare.1 For example, if competition results in
accelerated turnover of the generating capacity stock, then NOX emissions could be expected to
drop as newer gas combined cycle units have substantially lower NOX emission rates than older
units, particularly coal-fired units. On the other hand, if competition leads to more generation at
older, higher-emitting coal-fired facilities, as some predict it will, then emissions of NOX could
increase as a result of restructuring. Electricity consumers will be better off as a result of

Burtraw, Palmer and Paul October, 1998
3
expected reductions in electricity prices, but related increases in electricity demand could yield
higher NOX emissions and associated increases in environmental damages. The net effect of
these changes in the industry is uncertain. Brennan (1998) illustrates how lower prices for
polluting goods will lead to increased consumption of that good that can have ambiguous
implications for social welfare.
At the same time that the industry is moving towards retail competition, it is also facing
the prospect of new environmental regulations to restrict emissions of NOx. Some proposals
would use the occasion of electricity restructuring to expand environmental regulations to ensure
that NOX emissions do not increase as a consequence of restructuring. Another proposal is
embodied in the September 1998 EPA notice for revision of state implementation plans (the so-
called “SIP call”). This proposal requires substantial reductions in total NOX emissions from the
generation sector, but also holds out the promise of a NOX emissions trading program as a means
for reducing the cost of achieving this emission reduction goal. Like industry restructuring, these
new environmental regulations will have effects on electricity prices, consumer and producer
welfare, pollutant emissions and environmental quality.
The combined effect of these changes is uncertain. The author of one recent study warns
“It,s a double-whammy…(The NOX regulations) coupled with deregulation will have an
unprecedented impact on the industry.”2 This study concludes that older, less efficient coal-fired
electric generating plants will find it difficult to compete with new NOX regulations in a
restructured industry (RDI, 1998). Meanwhile, another study that looked at reductions in NOX
emissions coupled with reductions in SO2 in a restructured industry concluded that at least 94
percent of existing coal capacity would remain competitive with new gas-fired units (Biewald, et
1 Total emissions of SO2 are capped under the requirements of Title IV of the 1990 Clean Air Act Amendments.

Burtraw, Palmer and Paul October, 1998
4
al., 1998). Both of these studies consider only the compliance cost of the proposed
environmental regulations; and, neither considers the economic cost from a welfare theoretic
perspective. Also, neither of these studies considers the benefits of the regulation in an economic
metric comparable to costs.
The purpose of this study is to analyze the separate and combined effects of retail
restructuring of electricity markets and new NOX regulations applied to the electric power sector.
We evaluate these effects from the broad standpoint of economic welfare. The measures
employed are changes in customer and producer surplus in the electric power industry, and the
monetary value of changes in health effects stemming from changes in NOX emissions that are
likely to result from these regulatory initiatives. The study employs an electricity market
equilibrium model called HAIKU to simulate pre- and post-retail restructuring scenarios in
combination with different environmental policy scenarios posited to occur by the year 2003.
The emission changes that are projected are fed into the Tracking and Analysis Framework
(TAF) to model atmospheric dispersion, health effects and health valuation.
The findings suggest that customer and producer surplus benefits substantially outweigh
health damages from the slight increases in NOX emissions that can be expected from retail
restructuring. On the other hand, NOX emission reductions enforced under an average cost
pricing scenario (traditional cost of service regulation) would lead to customer and producer
surplus losses that are only slightly less than their environmental benefits.
However, the NOX emission reductions are less costly in terms of foregone customer and
producer surplus when initiated in a restructured electricity industry. In this institutional setting,
the additional effect of policies enforcing NOX reductions is positive and substantial. Hence,
2 “RDI says new emission rules will cost utilities $21.8 billion over next 10 years,” Electric Utility Week, October26, 1998, p. 10.

Burtraw, Palmer and Paul October, 1998
5
retail restructuring has potentially important positive environmental benefits because it improves
the affordability of NOX emission reductions. Finally, the study finds that allowing NOX trading,
as opposed to imposing uniform performance standards, can lead to a $200 million increase in
consumer and producer surplus in electricity markets with virtually no change in aggregate
health related benefits.
The remainder of this report is organized as follows. The next section briefly describes
the two models used in this study - the HAIKU electricity market model and the Tracking and
Analysis Framework (TAF) health benefits model. We also describe how these models are used
to calculate measures of economic welfare. Sections III and IV describe the electricity
restructuring scenarios and the environmental policy scenarios analyzed in this study. Section V
presents the results and section VI concludes. An appendix provides further detail on the
modeling structure.
II. The Modeling Framework
This study employs two models to simulate the impacts of retail restructuring and new
NOX regulations on electricity customers, electricity suppliers and environmental quality. This
section introduces these models and explains how each model contributes to the calculation of
the net economic welfare impacts of retail restructuring and changes in environmental regulation.
The HAIKU Model
The HAIKU Model is a simulation model of regional electricity markets and inter-
regional electricity trade with a fully integrated algorithm for NOX emission control technology
choice, constructed with the Analytica modeling software. The model can be used to simulate
changes in electricity markets stemming from public policy associated with increased
competition or environmental regulation. The model simulates electricity demand, electricity

Burtraw, Palmer and Paul October, 1998
6
prices, the composition of electricity supply, inter-regional electricity trading activity among
NERC regions, and emissions of key pollutants such as NOX and CO2 from electricity
generation. The model can also be used to identify the NOX emission control technologies on
generators that achieve specified target levels of emissions under various environmental policies
(technology-based policies, emissions taxes or regional emissions trading).
Two components of the HAIKU model are the Intra-regional Electricity Market
Component and the Inter-regional Power Trading Component. The Intra-regional Electricity
Market Component solves for a market equilibrium identified by the intersection of electricity
demand and supply curves for each of three time periods (peak, middle and off-peak hours) in
each of three seasons (summer, winter, and spring/fall) within each of 9 NERC regions.3 The
Inter-regional Power Trading Component solves for the level of inter-regional power trading
necessary to equilibrate regional electricity prices (gross of transmission costs and power losses),
but allowing for price discrimination in favor of native customers. These inter-regional
transactions are constrained by the assumed level of available inter-regional transmission
capability as reported by NERC. Each of these components is described in more detail in the
Appendix.
The electricity demand functions from the intra-regional market component are used to
calculate partial equilibrium changes in customer surplus for each region. In a partial equilibrium
setting, the surplus for residential customers is calculated as the area under the demand curve less
revenues. However, commercial and industrial customers consume sixty percent of the
electricity sold in this country. Absent a detailed sectoral model of the downstream product
markets or a general equilibrium model of the economy, it is an open question to what extent

Burtraw, Palmer and Paul October, 1998
7
changes in customer surplus for these classes of customers are actually passed on to final
consumers. Depending on the market structure and nature of pricing in downstream markets, and
on the elasticity of demand for products and services in these markets, total consumer surplus
could be greater or less than surplus associated with the commercial and industrial customers in
the electricity market. Nevertheless, rather than ignore changes in customer surplus for these
classes of customers, we report changes in total “customer surplus” for all customer classes.
Changes in residential customer surplus typically account for 39% of changes in total customer
surplus.
Producer surplus is the difference between revenues and costs, both outputs of the
HAIKU model. In the baseline market structure scenario most of the country is modeled as
average cost pricing, and for these regions this difference should be zero by construction.
Nonzero producer surplus should characterize only the regions that are modeled as already
having embraced retail competition in the baseline.
In the market restructuring scenarios, all of the country is assumed to practice marginal
cost pricing. The issue of stranded costs is addressed explicitly by allowing for some fraction of
stranded cost recovery. The current version of HAIKU takes investment and retirement as
parametric, so we rely on estimates of stranded costs that have been developed in other studies
under comparable assumptions to measure changes in producer surplus resulting from the
introduction of competition.
The change in producer surplus resulting from the introduction of new NOX restrictions
can be calculated using the HAIKU model because investment in NOX control technologies is
determined endogenously. Under a particular market structure assumption (e.g. average cost
3 The current version of the HAIKU model includes the 9 NERC regions: NPCC, MAAC, ECAR, SERC, MAIN,MAPP, SPP, ERCOT and WSCC, as they were defined in 1997. Recently, Florida has split from SERC to form its

Burtraw, Palmer and Paul October, 1998
8
pricing or marginal cost pricing), the model captures the relevant changes in producer behavior
and calculates changes in revenues and costs to provide an estimate of changes in producer
surplus.
The HAIKU model also calculates emissions of NOx, as well as other pollutants, from
the electricity sector under different market structure and environmental policy scenarios.
Changes in NOX emissions resulting from retail restructuring or new environmental restrictions
serve as inputs to the TAF health benefits model described next.
The Tracking and Analysis Framework
The Tracking and Analysis Framework (TAF) is used to translate the effects of changes
in emissions into changes in human health. TAF integrates pollutant transport including
formation of secondary particulates but excluding ozone to calculate human health effects and
valuation of changes in health status, aggregated at the state level.4
TAF includes a separate Health Effects Module and Health Benefits Module, both of
which are described in detail in the Appendix. The Health Effects Module is designed to
estimate the changes in health status resulting from changes in air pollution concentrations.
Impacts are expressed as the number of days of acute morbidity effects of various types, the
number of chronic disease cases, and the number of statistical lives lost to premature death. The
model output corresponds to change in the annual number of impacts of each health endpoint.
From an economic perspective, values are measured by how much of an asset or service
individuals are willing to sacrifice in order to obtain or preserve another. The Health Valuation
Module assigns monetary values taken from the environmental economics literature (e.g., Lee et
own NERC region, FRCC, but this region is included in SERC for this analysis.4TAF was developed on behalf of the National Acid Precipitation Assessment Program (NAPAP) using theAnalytica modeling platform (Bloyd et al. 1996). TAF also accounts for visibility and aquatic effects which are notincluded as part of this study.

Burtraw, Palmer and Paul October, 1998
9
al. 1994) to the health effects estimates produced by the Health Effects Module. The benefits are
totaled to obtain annual health benefits for each year modeled.
III. Market Structure Scenarios
The ultimate effect of electric power industry restructuring on consumer and producer
surplus in electricity markets and on environmental quality and associated health benefits will
depend on a number of factors. Restructuring is expected to lead to greater efficiencies in the
generation sector that ultimately should translate into lower prices for consumers. The effect of
restructuring on existing electricity producers will depend in part on the provisions that are made
for the recovery of stranded costs.
The health effects of electricity restructuring appear more uncertain both with respect to
their direction and relative order of magnitude. Some of the expected changes arising from
restructuring are likely to lead to higher emissions of NOX and therefore negative health benefits.
For example, higher levels of electricity consumption in response to lower electricity prices
could result in higher emissions than would have occurred absent restructuring. On the other
hand, restructuring also is expected to result in efficiency improvements at existing generating
facilities such as declines in heat rates that could reduce emissions yielding positive
environmental benefits.
A priori, the characteristics of the post-restructuring electricity industry and market are
highly uncertain. We characterize that uncertainty in a limited fashion by considering two
different restructuring scenarios. One represents relatively moderate impacts of restructuring on a
variety of technological parameters and market institutions; and, another represents more
dramatic impacts. These two scenarios are called “Moderate Restructuring” and “Aggressive

Burtraw, Palmer and Paul October, 1998
10
Restructuring.” These scenarios are contrasted to an Average Cost Baseline scenario and all
three scenarios are set in the year 2003.
Table III.1 contains an overview of the assumptions that characterize each market
structure scenario. Each scenario is defined by a number of technological and demand-related
parameters that are expected to change as a result of restructuring. The technological parameters
that vary across scenarios include: the rate of retirement and new investment in fossil-fueled
generating units, the rate of retirement of nuclear power plants, the reduction in unscheduled
outages, the rate of improvement in the availability factor (reduction in scheduled outages), the
heat rate and operating cost at existing plants, and the rate of growth in transmission capability.
The demand-related parameters include the method of determining prices and the extent of
stranded cost recovery. The subsequent three sub-sections describe the three market structure
scenarios we investigate.

Burtraw, Palmer and Paul October, 1998
11
Baseline
(incorporateswholesale
competition)
Retail Restructuringwith Moderate
Efficiency Effects
Retail Restructuringwith Aggressive
Efficiency Effects
Pricing Assumptions
Stranded cost recovery 90% recovery inregions (NPCC
and WSCC) withcompetition
90% recovery (restlargely mitigated)
75% recovery (restlargely mitigated)
Method of calculatingprices
average costpricing under
traditional ratedesign by
customer class(time of daypricing for
industrials only)
(except in NPCCand WSCC)
variable cost pricingof generation with
substantial fixed costrecovery (see
above); time of daypricing for
industrials only
variable cost pricingof generation withlimited fixed cost
recovery (see above)and time of daypricing for all
customer classes
Technology Parameters
Fossil Steam UnitRetirements
based on AEO 98reference case(RC) aggregate
retirement of 50.8GW by mid
2000’s; replace bymix of coal andgas per AEO 98
accelerate fossilsteam retirements
from AEO 98 RC to53.5 GW total by
mid 2000’s; replaceby mix of coal and
gas per AEO 98
accelerate fossilsteam retirementsfrom AEO 98 RCeven more to 56.3GW total by mid
2000’s; replace bymix of coal and gas
per AEO 98
Nuclear Unit Retirements based on AEO 98RC; 9.6 GW
retired nationally
1/2 of AEO 98 “lownuclear case”; 16.2
GW retirednationally
full AEO 98 “lownuclear case”; 22.8
GW retired nationally
Table III.1 Assumptions characterizing different market structure scenarios.

Burtraw, Palmer and Paul October, 1998
12
Baseline
(incorporateswholesale
competition)
Retail Restructuringwith Moderate
Efficiency Effects
Retail Restructuringwith Aggressive
Efficiency Effects
Technology Parameters
Net New Investment inGenerating Capacity
based on AEO 98RC; 98.3 GW
added nationally;71% gas turbine
(GT), 22%combined cycle
(CC), 7% scrubbedcoal
91.7 GW addednationally (lower net
investment due tohigher nuclear
retirement) (sametechnology
percentages apply)
based on 75% ofAEO 98 RC; 73.2
GW nationally (sametechnology
percentages apply)
Rate of Improvement inMaximum Capacity Factor
AEO 98 RCassumes 82% max.capacity factor for
steam unitsbeginning in 1998;we assume 82.6%
3% improvementover forecast perioddue to consolidationof scheduled outages
and reduction offorced outages
5% improvementover forecast perioddue to consolidationof scheduled outages
and reduction offorced outages
Rate of Improvement inCoal-Fired Unit Heat Rate
none per AEO 98RC
2% reduction inaverage heat rate
over forecast
4% reduction inaverage heat rate over
forecast
Improvement in FossilGenerating Unit OperatingCosts
18% decline forO&M and G&A
over entire forecastperiod (AEO 98)
25% decline inO&M and G&A
over entire forecastperiod
35% decline in O&Mand G&A over entire
forecast period
Transmission CapacityGrowth
(Inter-region transmissioncapacity defined as.75*season-specificFCTTC in 1997)
7.5% growth overforecast period
24% growth overforecast period
43% growth overforecast period
Table III.1 Assumptions Characterizing Different Market Structure Scenarios(cont’d).

Burtraw, Palmer and Paul October, 1998
13
Baseline Scenario
A defining feature of electricity restructuring is the institution that governs the pricing of
electricity. In the baseline scenario we assume that the electricity market continues to be
predominantly served by regulated entities that price at average cost. In this case the penetration
of retail competition and associated marginal cost pricing of electricity is limited to the two
regions of the country that are already well on their way toward retail competition: NPCC and
WSCC.5 In the two regions that have marginal cost pricing, we assume that 90% of stranded
costs (the portion of annualized fixed costs for sunk investments not recovered through the
market price) will be recovered in electricity rates through access charges spread uniformly over
all kWh sales. We also assume that only industrial customers have access to time-of-day pricing
of electricity.
The technology assumptions for the average cost baseline including the assumptions
regarding fossil steam unit and nuclear unit retirement as well as investment in new capacity are
specified parametrically and taken largely from the 1998 Annual Energy Outlook (“AEO 98”)
(EIA, 1997) reference case.6 The AEO 98 reference case retires existing generating units as
scheduled, plus all other generating units with operating costs in excess of 4 cents per kWh
evenly over a ten year period. In our baseline scenario, we adopt the AEO 98 retirement
assumptions of 50.8 GW of fossil steam capacity by 2003, replacing it with a mixture of 7%
scrubbed coal-fired and 93% gas-fired capacity. We also assume that 9.6 GW of nuclear
capacity will be retired nationally. In addition to the capacity necessary to replace retirements,
5 As of September of 1998, PUCs, state legislatures or both in all of the states of NPCC (which includes all of NewEngland and New York State) had decided to implement retail competition by or before the middle of the nextdecade, the time period modeled in this study (The Vermont State Corporation Commission’s restructuring planrequires legislative approval which is still forthcoming). In the WSCC, the states of California, Nevada, Montanaand Arizona ,which constitute well over 50% of the electricity consumption in the region, have all either alreadyimplemented retail competition (California) or are expected to have done so by the middle of the next decade.

Burtraw, Palmer and Paul October, 1998
14
we adopt the AEO 98 assumptions that 98.3 GW of net new generating capacity will be added
nationally with 71% gas turbine, 22% gas-fired combined cycle and 7% scrubbed coal-fired
capacity.
For the baseline scenario, we adopt the AEO 98 assumption that the availability factor of
existing fossil fuel units will not improve over time.7 We also adopt the AEO assumption that
recent declines in O&M costs at utility generators will continue into the future producing an 18%
decline in O&M costs between 1995 (the year of our data) and 2003. We also assume that the
recent 1.2% per year rate of growth in overall transmission capability will continue into the
future yielding a 7.5% cumulative increase in transmission capability between 1998 (the year for
which we have data) and 2003.8
Moderate Restructuring Scenario
This scenario adopts a variable cost pricing approach to electricity pricing for all NERC
regions. The generation portion of the electricity price is defined by marginal cost (or, in the
absence of time-of-day pricing, the weighted average of marginal costs that obtain across load
blocks within a season) while the transmission and distribution portion of price is still defined on
the basis of average cost. Time-of-day pricing remains available only to industrial customers.
The short-run price impact of allowing competition on electricity prices is muted somewhat by
the assumption that 90% of the utilities’ stranded costs are recovered in retail prices. In the case
of electricity traded between regions, stranded cost recovery is applied in the importing region.
6 The EIA only reports national retirements by capacity type in the published AEO 98 report. We obtained a NERCregional breakdown of retirement data from the EIA.7 In HAIKU, the maximum capacity factor is defined at the model plant level by combining information on plannedand unplanned outage rates by technology from the NERC GADS data base (NERC 1997). We assume that about10% of planned outages occur in the summer, about 25% in the winter and about 65% in the Spring/Fall.Unplanned outages are allocated equally to all seasons according to the season’s length. Using this method, theavailability factor for a steam-fired generator in 1998 is 82.6% which is approximately equal to the 82% levelassumed in the AEO 98.8 This estimate comes from the EPA’s comments on the FERC EIS of Order 888 (EPA 1996).
Burtraw, Palmer and Paul October, 1998
15
Compared to the baseline scenario, the retail restructuring scenario assumes more
aggressive retirement of both fossil-steam units and of nuclear plants. Under this scenario, 50%
of the remaining quantity of fossil capacity with costs in excess of 4 cents per kWh are assumed
to retire by 2003 bringing total fossil retirements to 53.5 GW. Nuclear retirements are pegged at
a level that results in a level of nuclear capacity half way between that assumed under the AEO
98 reference case and that assumed in the AEO 98 “low nuclear” scenario. Net additions to
capacity are somewhat lower as a result of this increased level of nuclear retirement, but the
technology and fuel composition of replacement and net new capacity is the same as in the
baseline.
This scenario also assumes that retail restructuring will lead to reductions in plant
outages, improvements in heat rates and more aggressive reductions in operating costs compared
to the baseline scenario. Specifically, we assume that reductions of scheduled and forced
outages will lead to a 3% improvement in availability factors over the forecast period. We also
assume that as a result of increased competitive pressures, heat rates will improve on average by
2% and operating costs at all existing units will fall by 25%, 7% more than under the baseline.
Transmission capability is also expected to grow by 16.5% more under moderate restructuring,
resulting in a 25% increase in transmission capability between all NERC regions over the
forecast period.
Aggressive Restructuring Scenario
Under this scenario, retail competition and time-of-day pricing of electricity are assumed
to be pervasive. It is assumed that all customer classes in all NERC regions buy electricity in
competitive markets and face time-varying electricity prices. The amount of stranded costs is
greater in the Aggressive Restructuring scenario than in the Moderate Restructuring scenarios

Burtraw, Palmer and Paul October, 1998
16
due to the pace of technological change, the pace of retirement and investment, and several other
factors. The impacts of competition on retail prices are also larger under this scenario due to the
assumption that only 75% of stranded costs are recovered. Again, in the case of electricity traded
between regions, stranded cost recovery is applied in the importing region.
This scenario assumes more aggressive retirements and less aggressive investment, due in
part to higher expected capital costs. Under aggressive restructuring, the total amount of fossil
generation with operating costs in excess of 4 cents per kWh is assumed to retire by 2003
resulting in 5.5 additional GW of retirement relative to the baseline scenario. In addition,
nuclear retirements are assumed to mirror those assumed in the AEO 98 “Low Nuclear” scenario
yielding a total of 22.8 GWs of retirement nationally, 13.2 GW more than in the baseline. Net
new investment is about 75% of the level assumed in the baseline scenario due largely to a
reduction in reserve margins.
Improvements in generating unit performance and cost, and growth in transmission
capability are also larger under aggressive restructuring than under moderate restructuring or the
baseline. A 5% improvement in availability factors is assumed and average heat rates at fossil-
fired units are assumed to improve by a full 4% by 2003.9 Also, unit-level operating costs
(excluding fuel costs) are assumed to fall by 35% between 1995 and 2003.10 Inter-regional
transmission capability is assume to grow by 43% which is consistent with the high transmission
growth scenario in the FERC EIS (1996) and in Palmer and Burtraw (1997). This higher rate of
transmission capacity growth is almost twice as fast as that assumed under moderate
restructuring and nearly 6 times as fast as that assumed under the baseline.
9 The DOE policy office also assumes a 4% improvement in average heat rates in its analysis of the President’sComprehensive Electricity Competition Plan which envisions nationwide adoption of competitive retail electricitymarkets by 2003. Roberts and Goudarzi (1998) find that average heat rates could improve by as much as 8% toachieve industry best practice.

Burtraw, Palmer and Paul October, 1998
17
IV. Environmental Policy Scenarios
A second focus of this study is on the relationship between electricity restructuring and
NOX emissions from the electric power sector, and new proposed environmental policies to limit
emissions. Increased competition and increased inter-regional power trading is expected by
some to lead to increases in NOX emissions, at least in the short run. However, new
environmental regulations proposed to take effect over roughly the same time period could lead
to substantial reductions in NOX emissions from the electric power sector while imposing greater
costs on the electricity sector and consumers. Some proposals would use the occasion of
electricity restructuring to expand environmental regulations to ensure that NOX emissions do not
increase as a consequence of restructuring.
Several proposals have been put forward. One current proposal is the so-called “NOX
budget” specified in a memorandum of understanding (MOU) among members of the
northeastern Ozone Transport Commission (OTC). The MOU establishes a budget for NOX
emissions from large stationary sources for the northeastern states in an 11 state region and the
District of Columbia stretching from the District to Maine.11 Another proposal is the EPA’s Final
Rule for Reducing Regional Transport of Ground-Level Ozone (September, 1998) that
establishes seasonal (five-month) NOX emission reduction targets for large stationary sources in
an expanded set of 22 states (plus the District of Columbia) that lie east of the Mississippi
(excluding Maine and Florida). The rule sets state-level NOX emission budgets, but also
encourages the states to develop a regional emissions allowance trading market to reduce the
costs of achieving the required emissions reductions within the region. In addition, some of the
proposed legislation now before congress that would establish retail electricity competition
10 EIA (1997) assumes a 40% decline in operating costs as a result of the move to retail competition over the sameperiod.
Burtraw, Palmer and Paul October, 1998
18
includes provisions to require reductions in emissions of NOX and other pollutants from existing
generators. Other proposals that have been suggested would establish an “old source
performance standard” (OSPS) by extending performance standards that are applied to new
stationary sources to existing sources. This would essentially treat all sources in a comparable
fashion with respect to an allowable emission rate, with or without the possibility for trading.
To capture the features of these various proposals, this analysis considers three
environmental regulatory scenarios. One is a baseline that characterizes only the 1990 Clean Air
Act Amendments (CAAA). The second is an old source performance standard (OSPS)
requirement, without NOX emission allowance trading, affecting all generators in the five eastern
NERC regions (approximately equal to the 22 eastern states and DC). The third is a NOX
emission allowance trading regime (based on the quantity of NOX emissions resulting from the
OSPS regime) across generators in the same five eastern NERC regions. All of the
environmental policy scenarios considered in this study assume a NOX policy that is applicable
year round. Relevant features of each of these scenarios appear in the following several
paragraphs and are summarized in Table IV.1.
11 The state of Virginia is part of the OTC, but they have not yet signed on to the MOU.

Burtraw, Palmer and Paul October, 1998
19
Scenario Name
NERC RegionsCovered
NOX
ComplianceOptions
AverageEmission Rate
Goal
NOX Trading?
1990 CAAABaseline
All. Combustioncontrols only; see
Appendix A.
varies bytechnology; see
Appendix A.
NO.
OSPS inEastern States
NPCC, MAAC
SERC, ECARMAIN.
Post combustionoptions include
SCR, SNCR, andHybrid methods.
.15 lbs. permmBtu heat
input.
NO.
NOX AllowanceTrading in
Eastern States
NPCC, MAAC
SERC, ECARMAIN.
Post combustionoptions includeSCR, SNCR,
Hybrid methods,and allowance
purchases.
.15 lbs. permmBtu heat
input.
Yes, among allutility sources in
region.
Table IV.1 Overview of environmental policy scenarios.
1990 CAAA Baseline
In this scenario we assume that by 2003 all coal-fired generating units have adopted
relevant controls necessary to comply on a unit-by-unit basis with emission reductions required
under phase II of Title IV of the 1990 CAAA.12 This is a fairly restrictive representation of
strategies to achieve these goals since the EPA actually does allow interstate averaging of NOX
emission across facilities owned by the same utility. This scenario does not incorporate
additional NOX controls required under the OTC MOU. Also, these controls are based on
emission rates applicable to individual units. Since there is no emissions cap, total emissions
grow with increases in generation or the addition of new capacity, which is assumed to comply
with NSPS for NOx.
12 For a discussion of the necessary controls, see Appendix A in Burtraw, Palmer and Paul (1998).

Burtraw, Palmer and Paul October, 1998
20
OSPS in Eastern States (without trading)
This scenario imposes an emission rate standard of 0.15 lbs. of NOX per mmBtu on all
existing fossil steam generators in the five eastern NERC regions (NPCC, MAAC, SERC, ECAR
and MAIN) which is applied throughout the year. This group of NERC regions corresponds
closely to the 22 states included in the ozone transport rulemaking region.13 The emission rate
standard is implemented in the model by forcing all fossil-fuel boilers in these five regions to
adopt the least expensive NOX control technologies that will bring them to a NOX emission rate
no greater than 0.15 lbs. of NOX per mmBtu. For those units that are unable to reduce NOX
emissions to that level, we require them to reduce as much as possible. All of these additional
controls are post-combustion controls and are added on top of the controls assumed in the 1990
CAAA baseline scenarios. We assume that existing generators will be able to recover the cost of
these additional controls. Even under competition, they are assumed recoverable as a part of a
stranded cost recovery package.14 The resulting level of NOX emissions from the electricity
sector in this eastern region (and across the country) will differ across the three market structure
scenarios because of the variation in generating plant performance and costs, in electricity
demand, and in transmission capability.
NOX Allowance Trading in Eastern States
The level of the NOX cap under each market structure scenario (baseline and retail
restructuring) is determined from the prior set of OSPS scenarios without trading. In this
scenario electricity generators (model plants) are allowed to trade emission allowances. The
model identifies a solution wherein plants with high marginal abatement costs obtain allowances
13 The five NERC regions exclude from the 22 states region a small portion of western Missouri. It includes theeastern half of Mississippi, Florida, Vermont, New Hampshire and Maine, which are not part of the 22 state region.However, the three included New England states are part of the eastern region covered by the OTC MOU and thereconciliation of these two programs may involve their ultimate participation.

Burtraw, Palmer and Paul October, 1998
21
from plants with low marginal abatement costs, and plants with low marginal abatement costs
“over-comply” to free up the allowances that are transferred. The cost of investment in NOX
abatement and additional operating costs of generation are reflected in the dispatch order by
increases in marginal cost, allowing the utilization of facilities to adjust as another means of
compliance. A third means of compliance can occur through reduced electricity demand, to the
extent NOX control increases the price of electricity. Hence, the model identifies a least cost
solution for obtaining the specified level of NOX emissions, with the cost born by NOX
abatement, changes in dispatch order, and changes in demand. This approach will yield an
estimate of control costs that is biased low to the extent emission allowance markets work less
efficiently than a textbook model would suggest. There is evidence of this in the context of SO2
controls under cost of service regulation (Carlson, et al. 1998). This bias should be less apparent
as we move into retail restructuring.
While the approach to modeling NOX trading does not differ across the different market
structure scenarios, the way NOX allowance costs and other NOX control costs affect the price of
electricity does vary across scenarios. Under average cost pricing (baseline), we assume that
NOX allowances are distributed for free (grandfathered) and that state regulatory commissions
would not allow utilities to keep any profits associated with allowance transactions. That is,
allowances are valued at original cost of zero (rather than market value) for cost recovery
purposes. Also, utilities would be allowed to recover the cost of permits purchased for
compliance but this is offset by revenue accruing to the selling utility that is used to offset
investment in emission control at its sites. This means that by allowing utilities to recover only
14 Unlike other stranded costs, we assume that NOX control costs are fully recovered under an OSPS regulationwithout emissions trading.

Burtraw, Palmer and Paul October, 1998
22
the costs of emission control equipment and its operation, the total cost recovery for NOX a
trading program is accurate for the industry as a whole.
Under both retail competition scenarios, we assume that electricity generators will fold
the full opportunity cost of NOX allowances into the price of electricity and thus prices charged
to electricity customers will reflect this opportunity cost. Therefore, while NOX trading should
reduce the aggregate compliance costs of achieving the NOX emissions cap, trading could have a
greater impact on electricity prices, at least under competitive electricity pricing, than a uniform
emission rate standard. Because the granting of allowances at zero cost based on a fraction of
historic emissions constitutes a significant compensation to the utility, we do not allow for
recovery of fixed NOX control costs under the permit trading regime.15
V. Results
The HAIKU and TAF models are used to estimate the impacts of restructuring and new
NOX policies. First we present the impacts of restructuring in the absence of additional NOX
policies. These impacts include effects on the price of electricity, the quantity of generation, and
tons of NOX emissions. Then we evaluate these impacts by calculating the associated changes in
economic welfare that are expected to result. Next, we discuss the impacts and the welfare
implications of new NOX policies and the implications of allowing NOX trading. Last, we
discuss the impacts and welfare effects of combining restructuring and NOX policies. All results
are for the year 2003 and all dollar amounts are reported in 1995 dollars.
The Impact and Welfare Effects of Retail Restructuring
Retail restructuring is expected to lower the average price of electricity and increase the
quantity of electricity generation. Table V.1 shows that the average national price should decline

Burtraw, Palmer and Paul October, 1998
23
by just over 6% for the moderate restructuring scenario and nearly 11% for the aggressive
scenario.16 These decreases in electricity prices yield increases in electricity demand and in
generation. The retail restructuring scenarios also assume increases in transmission capability
and accelerated rates of retirement for nuclear and old coal-fired facilities, which would be likely
to produce changes in the composition of electricity generation even in the absence of an
increase in demand. All of these influences combine to produce the 1.8% and 3.2% increases in
national electricity generation reported in the second row of Table V.1.
Baseline Moderate Aggressive
Average Price (cents/kWh) 6.79 NA 6.36 -6.3% 6.05 -10.8%
Total Generation (TWh/yr) 3,464 NA 3,526 1.8% 3,575 3.2%Table V.1 Impact of Retail Restructuring scenarios on national electricity marketsand percent change from market structure baseline.
The changes in generation are expected to result in changes in NOX emissions, and these
estimated changes are summarized in Table V.2. This table reveals that restructuring will
increase emissions in the year 2003, and increase more with aggressive restructuring. In this
relatively short time horizon the accelerated retirement of inefficient coal facilities will not offset
the increased use of other older coal generators due to expanded transmission capability and
higher electricity demand. Without new NOX regulation, we expect electricity restructuring to
result in up to 4% more NOX emissions from the electric power sector nationally per year. The
15 To both give the utilities valuable NOX permits for free and to allow full recovery of NOX control costs createspotentially large profit making opportunities for utilities that install large amounts of control equipment (with fullcost recovery) and then sell permits and keep the revenue.16 These estimates are within the range of prior studies. A recent analysis of the Clinton Administration’sComprehensive Electricity Competition Act (DOE 1998) finds that national average electricity prices are 12% lowerin 2010 as a result of the plan. In another study of the price impacts of electricity restructuring, which assumes that

Burtraw, Palmer and Paul October, 1998
24
entirety of this increase will occur in the five eastern NERC regions (NPCC, MAAC, SERC,
ECAR and MAIN) where NOX emissions will increase by 2.8% under moderate restructuring
and 5.6% under aggressive restructuring. Thus NOX increases are greater than average in the
densely populated eastern section of the country.
Geographic Region Baseline Moderate Aggressive
Nation 4,605 NA 4,683 1.7% 4,783 3.9%
East 3,202 NA 3,291 2.8% 3,380 5.6%Table V.2 NOX emissions (thousand tons/year) and percent change for industryfrom market structure baseline given 1990 CAAA scenario.
The impacts we discover are listed in the disparate metrics of cents, kilowatt-hours and
tons. To compare these impacts we evaluate the changes in the single measure of economic
welfare. Changes in price and consumption in the electricity market lead to substantial gains in
customer surplus. Table V.3 indicates that total customer surplus gains range from $14.3 billion
with moderate restructuring to roughly $24.9 billion with aggressive restructuring. In both cases,
roughly 39% of the customer surplus accrues to residential customers. These gains in customer
surplus represent a substantial fraction of total electric industry revenue. Under the baseline
scenario, total industry revenues for 2003 are $228 billion and the gains to electricity customers
from restructuring represent over 6% of that total revenue under the moderate restructuring
scenario and over 10% under the aggressive scenario.
While restructuring promises gains to customers, it is likely to lead to losses for some
existing electricity suppliers and for the industry as a whole as many producers will be unable to
recover the costs of many generating assets (or of some outstanding power purchase contracts) at
only the 25-30 higher cost states allow retail competition, SAIC (1998) predicts that the national average price levelfor 2005 will be 6.2 cents per kWh (1996$).

Burtraw, Palmer and Paul October, 1998
25
competitive electricity prices. We draw on estimates of stranded costs under comparable market
structure scenarios as a basis for evaluation of changes in producer surplus. We combine these
estimates with our assumptions about the aggressiveness of the efficiency effects of restructuring
and about the allowed rate of stranded cost recovery. Table V.3 indicates that the decline in
producer surplus ranges from $1.3 billion to $4.4 billion under the alternative scenarios.17 These
values are significant, but small relative to the expected gains in customer surplus. The sum of
customer and producer surplus changes is positive and substantial, ranging from $13 billion to
$20.5 billion.
The increased NOX emissions reported in Table V.2 are expected to lead to health
damages that further offset the customer surplus gains. Table V.3 reports the monetary value of
expected health damages due to additional NOX emissions and contrasts these with the change in
customer surplus and producer surplus. The value of the increased health damages from NOX
emission changes are two orders of magnitude less than the gains in customer and producer
surplus resulting from restructuring.
Moderate Restructuring Aggressive Restructuring
Customer SurplusComponent 14,331 24,858
Producer Surplus 17 The producer surplus impacts reported in this table are calculated as follows. For moderate restructuring weadopt the $122 billion dollar estimate of stranded cost reported by Resource Data International (RDI 1996).Assuming that those stranded costs are incurred over a 20 year period, we calculate the annualized losses associatedwith this stock of stranded costs assuming a 9% annual interest rate. This yields a total annual flow of strandedcosts equal to $ 13.36 billion. In our moderate restructuring case, we assume that 90% of total stranded costs arerecovered through prices. Therefore, we assume that lost producer surplus associated with moderate restructuring isequal to 10% of this $13.36 billion annual flow or $ 1.336 billion. Under aggressive restructuring, electricity pricesare expected to be even lower and therefore stranded costs should be even higher. To construct an upper bound onstranded cost we inflate the $122 to $160 billion (The ratio of $160 to $122 is equal to the ratio of the high estimatesof stranded cost to the expected levels of total stranded costs reported in an EIA study of the impacts of restructuringon electricity prices (EIA 1997).) We then apply the same procedures to get an annual flow of stranded cost of$17.53 billion per year. Under aggressive restructuring we assume that 75% of stranded cost is recovered inelectricity prices which leaves the remaining 25% or $4.383 billion as lost producer surplus.

Burtraw, Palmer and Paul October, 1998
26
Component -1,336 -4,383
Sum of Customer andProducer Surplus 12,995 20,475
NOX Health Benefits -65 -136Table V.3 Customer and producer surplus and NOX health damages from retailrestructuring relative to the baseline market structure (million 1995$). Negativehealth benefits indicate damages.
The Impact and Welfare Effects of New NOX Emission Policies
The previous section discussed results of alternative market structure scenarios under the
single environmental policy regime of full compliance with Title IV of the 1990 Clean Air Act
Amendments. In this section we explore the potential impact of alternative environmental
policies regarding NOX emissions from electricity generation. We compare the change in
emissions that can be expected from NOX emission reductions with changes in electricity prices
and generation. We also compare the monetary value of changes in health status associated with
changes in NOX emissions with producer and customer surplus to obtain a measure of economic
welfare changes.
Table V.4 presents the effects of an annual NOX trading program in the eastern 22 states
and DC on total electricity sector NOX emissions nationwide and in the east. Under both the
baseline (average cost pricing) and the moderate restructuring market structures the emission
reductions are in excess of 50% nationwide and approximately to 75% in the targeted region.
The percent change in each case is relative to the environmental baseline (1990 CAAA) for the
specified market structure. Hence, the comparisons in the two sets of columns are relative to
different baselines since total NOX emissions under the 1990 CAAA depend on the market
structure assumption.

Burtraw, Palmer and Paul October, 1998
27
Geographic Region Baseline Market Structure Moderate Restructuring
Nation 2,208 -52.1% 2221 -52.6%
East 805 -74.9% 821 -75.1%Table V.4 Annual NOX emissions (thousand tons/year) with NOX trading in theeast, and percent change for industry from 1990 CAAA scenario under twoalternative market structure scenarios.
The human health benefits associated with these declines in NOX emissions are also
substantial. The value of health benefits under emissions trading for the baseline and moderate
restructuring scenarios are presented in Table V.5. These benefits are compared with those that
would obtain under an old source performance standard (OSPS) that achieved the same
aggregate emission reductions without trading. The opportunity to trade emission allowances
leads to virtually identical health benefits as the OSPS regime under the baseline and moderate
restructuring scenarios. The slight changes result from a shift in the regional distribution of
emissions that arise with NOX trading.18
NOX Policy Regime Baseline Market Structure Moderate Restructuring
Trading 1,856 1,908
OSPS 1,858 1,912Table V.5 National health benefits of NOX policies affecting five eastern NERCregions (million 1995$/year).
The HAIKU model allows us to compare estimates of the health benefits with estimates
of the costs of achieving these emission reductions to do a first-order cost-benefit analysis of
these policies. The traditional approach to measuring the costs of environmental regulations is to
use estimates of the out-of-pocket costs of complying with the regulation. However, these costs
do not reflect the full economic costs of the regulation. One measure that is closer to the full

Burtraw, Palmer and Paul October, 1998
28
economic costs is an estimate of the sum of customer and producer surplus losses in electricity
markets associated with the introduction of the environmental policy. We look at both types of
cost estimates below.
In order to calculate the impacts of the NOX policies on producer and consumer surplus,
we must calculate the effects of these policies on electricity prices. Table V.6 shows that the
NOX policies result in fairly small changes in electricity prices, always less than 1%. The table
also shows that the combined flexibility afforded by retail restructuring and allowing NOX
trading leads to the smallest impact on electricity prices.
NOX Policy Regime Baseline Market Structure Moderate Restructuring
Trading 6.84 0.8% 6.39 0.5%
OSPS 6.84 0.9% 6.42 0.9%Table V.6 Average retail electricity price (cents/kWh) and percent change from1990 CAAA baseline for two environmental scenarios, under two alternativemarket structure scenarios.
Table V.7 presents a comparison of the health benefits to two measures of the costs of the
new NOX restrictions in the East under a NOX emissions trading program, under two alternative
market structure scenarios. This table shows that under both the baseline market structure and
the moderate restructuring case, the health benefits of the NOX policy exceed either measure of
the costs.
In comparing the two measures of cost, we note that under the baseline market structure,
losses in surplus exceed control costs. In this case, most of the country practices average cost
pricing, so changes in producer surplus are necessarily zero or small by construction. Hence,
most of the difference stems from the loss of customer surplus resulting from increased price and
18 For more information on these regional shifts, see Burtraw, Palmer and Paul (1998).

Burtraw, Palmer and Paul October, 1998
29
lower consumption of electricity. This illustrates the common criticism that measures of
compliance cost do not equal economic cost, and in most cases are thought to under-represent
full economic cost, because they fail to account for losses in consumer surplus.
Under the moderate restructuring scenario this comparison is reversed, and compliance
costs exceed the measure of economic surplus. The reason is that under marginal cost pricing,
compliance costs are not automatically passed through to consumers in setting the price of
electricity, as is the case with average cost pricing. Instead, under marginal cost pricing,
compliance costs are recovered only when the price of electricity reflects the marginal cost of
compliance. This occurs only when the marginal generating unit in the dispatch order must
engage in compliance activity (or use emission allowances in a trading program).19
In a marginal cost pricing scenario, the environmental regulation could lead to an effect
on revenues that is greater or less than the cost of compliance, depending on the dispatch order of
facilities. In the present example, it appears that producers fail to recover fully their compliance
costs through marginal cost pricing, because, during a nontrivial fraction of the year the unit that
is marginal has zero or relatively small compliance costs. This yields a smaller increase in
electricity prices than under the baseline market structure. The lower price leads to greater
generation and greater customer surplus (or smaller declines in customer surplus as a result of
the environmental regulation), and the sum of changes in customer and producer surplus is less
than compliance cost. Hence, in this case we find that compliance cost over-estimates the
economic cost of the regulation.
Baseline Market Structure Moderate RestructuringHealth Benefits 1,882 1,908 19 When the marginal unit faces regulatory compliance costs, there are two effects on price. One is direct compliancecost, and a second is the opportunity cost of permits used to cover emissions from that facility.

Burtraw, Palmer and Paul October, 1998
30
Two AlternativeMeasures of Cost:
Compliance Costs 1,680 1,671Losses in Customerand Producer Surplus 1,747 1,334
Table V.7 The benefits and costs of a NOX trading program under two alternativemarket structure scenarios (million 1995$).
The main point to note in Table V.7 is the difference in cost between the two market
structure scenarios. While NOX policies have significant costs in both cases, the costs are
substantially less in the moderate restructuring case. In a sense, one can conclude that
environmental policy is less expensive with a restructured market. Meanwhile, benefits are
slightly greater under moderate restructuring due primarily to the increase in emissions that
would occur in the absence of a NOX policy.
Table V.8 provides insight into how the benefits and costs would change if the OSPS
approach were substituted for the NOX trading approach, thereby eliminating the opportunity for
emission allowance trading. The first row indicates that the health benefits of NOX reductions are
virtually identical under the two policies. Calculated from Table V.5, the health benefits from
NOX controls are $2 million (0.1%) greater with OSPS than with trading under the baseline
market structure, and $4 million (0.2%) greater under moderate restructuring. However, the
measures of the costs of the NOX policy differ substantially under OSPS compared to trading.
Using either measure of cost, Table V.8 indicates that an OSPS would cost over $200 million
more than a program that relied on trading.
Baseline Market Structure Moderate Restructuring
Health Benefits 2 4
Two Alternative Measures of Relative Costs:
Compliance Costs 201 220

Burtraw, Palmer and Paul October, 1998
31
Losses in Customerand Producer Surplus
243 219
Table V.8 The benefits and costs of OSPS compared to trading policies for NOX
emission reductions (million 1995$).
NOX Policies in a Restructuring Electricity Industry
The final question that we seek to address is how well NOX policy is likely to perform in
a restructuring electricity industry. We explore what happens to customer and producers surplus
and to health benefits when we simultaneously impose moderate restructuring and a NOX cap and
trade program. This section reports on the results of that analysis.
Baseline Market Structure1990 CAAA Only
Moderate RestructuringNOX Trading in East
PercentChange
Price(cents/kWh)
6.79 6.39 -5.9%
Generation(TWh/yr)
3,464 3,520 +1.6%
NOX
Emissions(thousand tons/yr)
4,605 2,216 -51.9%
Table V.9 Impacts of combining NOX cap and trade with moderate restructuringscenario, compared to baseline environmental and market structure scenario.
Table V.9 reveals the changes in electricity price, electricity generation , and NOX
emissions from electricity generators associated with these changes in market and regulatory
structure. Introducing the new NOX restrictions simultaneously with retail restructuring has a
slight dampening effect on the decline in electricity prices, but still yields an increase in
electricity demand combined with a substantial decrease in total NOX emissions.
Burtraw, Palmer and Paul October, 1998
32
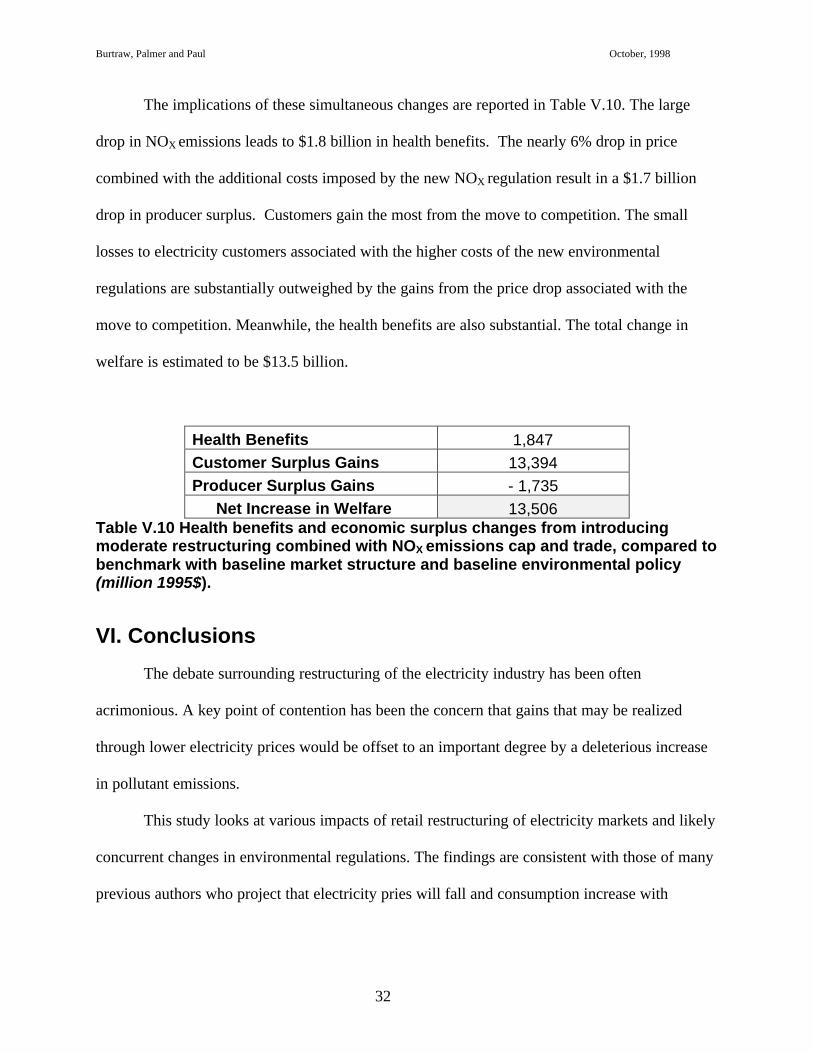
The implications of these simultaneous changes are reported in Table V.10. The large
drop in NOX emissions leads to $1.8 billion in health benefits. The nearly 6% drop in price
combined with the additional costs imposed by the new NOX regulation result in a $1.7 billion
drop in producer surplus. Customers gain the most from the move to competition. The small
losses to electricity customers associated with the higher costs of the new environmental
regulations are substantially outweighed by the gains from the price drop associated with the
move to competition. Meanwhile, the health benefits are also substantial. The total change in
welfare is estimated to be $13.5 billion.
Health Benefits 1,847Customer Surplus Gains 13,394Producer Surplus Gains - 1,735
Net Increase in Welfare 13,506Table V.10 Health benefits and economic surplus changes from introducingmoderate restructuring combined with NOX emissions cap and trade, compared tobenchmark with baseline market structure and baseline environmental policy(million 1995$).
VI. Conclusions
The debate surrounding restructuring of the electricity industry has been often
acrimonious. A key point of contention has been the concern that gains that may be realized
through lower electricity prices would be offset to an important degree by a deleterious increase
in pollutant emissions.
This study looks at various impacts of retail restructuring of electricity markets and likely
concurrent changes in environmental regulations. The findings are consistent with those of many
previous authors who project that electricity pries will fall and consumption increase with
Burtraw, Palmer and Paul October, 1998
33
restructuring, and that emissions of NOX are likely to increase as well.20 We also look at the role
of NOX policy taken in isolation from changes in market structure and find the converse. NOX
policy is likely to lead to an increase in electricity prices and a decrease in generation, as well as
a decrease in NOX emissions. Finally we examine the effects restructuring in tandem with new
NOX regulation.
Evaluation of these expected changes is difficult absent a single metric for comparison.
We use the common metric of economic welfare to calculate changes in consumer and producer
surplus and the monetary value of changes in health status predicted to result from these policies.
The study presents four main findings. First, we find that retail restructuring would
produce combined customer and producer surplus benefits that substantially outweigh health
damages from slight increases in NOX emissions. The majority of these benefits accrue to
customer groups, roughly in proportion to their share of electricity consumption.
Second, under the baseline market structure of average cost pricing for most of the
nation, new NOX emission reduction efforts lead to substantial losses in combined customer and
producer surplus. These losses are only slightly less in magnitude than the public health benefits
that would follow from emission reductions.
Our third finding concerns the confluence of restructuring and environmental policy.
Under retail competition, new NOX regulations are less costly in terms of foregone customer and
producer surplus. Under this new market institution, the net impact of NOX reductions on
economic welfare is positive as the large health benefits from the emission reductions outweigh
losses in combined customer and producer surplus. Furthermore, the economic cost of NOX
reductions are substantially less than in the baseline market structure of average cost pricing.
20 See Lee and Darani (199), Center for Clean Air Policy (1996a, 1996b, 1996c), Rosen et al. (1995), EIA (1996).

Burtraw, Palmer and Paul October, 1998
34
Finally, we make the observation that using NOX trading instead of a uniform emission
rate standard (OSPS) to achieve substantial NOX emission reductions in the eastern U.S. leads to
annual economic welfare gains in excess of $200 million. These gains result from a decrease in
the economic cost of compliance due to the flexibility afforded by an emission allowance trading
program. In the aggregate, health benefits are virtually unchanged by a trading program,
although some geographic redistribution of emissions and health benefits is expected.
Environmental considerations provide an important obstacle to restructuring the
electricity industry. From the perspective of welfare economics, we find that the environmental
costs of restructuring are likely to be swamped by the economic gains of restructuring.
Nonetheless, these environmental concerns have a serious role in the political debate. This study
finds that NOX reduction policy is made less costly and the benefits are amplified in a
restructured industry.

Burtraw, Palmer and Paul October, 1998
35
References
Biewald, Bruce, David White, Tim Woolf, Frank Ackerman and William Moomaw. 1998.Grandfathering and Environmental Comparability: An Economic Analysis of Air EmissionRegulations and Electricity Market Distortions, Prepared for the National Association ofRegulatory Utility Commissioners; Cambridge MA: Synapse Energy Economics, Inc. (June11).
Bohi, Douglas and Karen Palmer. 1996. “The Efficiency of Wholesale versus RetailThe Electricity Journal, 9: 12-20.
Bloyd, Cary, et al. 1996. Tracking and Analysis Framework (TAF) Model Documentation andUser’s Guide, ANL/DIS/TM-36, Argonne National Laboratory, December.
Brennan, Tim, 1998. “Do Lower Prices for Polluting Goods Make Environmental ExternalitiesWorse?” Resources for the Future unpublished manuscript (August 20).
Burtraw, Dallas, Karen Palmer and Anthony Paul. 1998 “The Impact of ElectricityRestructuring on NOX Emissions Affecting the Environment in Maryland,” Draft FinalReport, September 25.
Burtraw, Dallas, Alan Krupnick, Erin Mansur, David Austin and Deirdre Farrell. 1998. “Costsand benefits of Reducing Air Pollutants Related to Acid Rain,” Contemporary EconomicPolicy, Vol. XVI (October), 379-400.
Carlson, Curtis, Dallas Burtraw, Maureen Cropper and Karen Palmer. 1998. “Sulfur DioxideControls by Electric Utilities: What are the Gains from Trade?” Resources for the FutureDiscussion Paper 98-44, (July).
Center for Clean Air Policy. 1996a. Comments of the Center for Clean Air Policy on the DraftEnvironmental Impact Statement on Open Access for Transmission Service, February(Washington, DC: Center for Clean Air Policy).
Center for Clean Air Policy. 1996b. “Emission Impacts of Increased Energy Exports from theAmerican Electric Power (AEP) System,” (Washington, DC: draft discussion paper)February 2.
Center for Clean Air Policy. 1996c. “Emissions Impacts of Competition: Further Analysis inConsideration of Putnam, Hayes and Bartlett, Inc.’s Critique,” (Washington, DC: report),June 17.
Congressional Budget Office. 1998. “Electric Utilities: Deregulation and Stranded Costs,”(Washington DC, draft discussion paper), October.
Dennis, R. L. 1997. “Using the Regional Acid Deposition Model to Determine the Nitrogendeposition Airshed of the Chesapeake Bay Watershed.” In Atmospheric Deposition to theGreat Lakes and Coastal Waters, ed. Joel Baker (Pensacola, FL: Society of EnvironmentalToxicology and Chemistry), 393-413.
Energy Modeling Forum. 1998. A Competitive Electricity Industry, EMF Report 15, Volume I,March, Stanford, CA: Stanford University.

Burtraw, Palmer and Paul October, 1998
36
Lee, Henry and Negeen Darani. 1995. “Electricity Restructuring and the Environment.” CSIADiscussion Paper 95-13, Kennedy School of Government, Harvard University, December.
North American Electric Reliability Council (NERC). 1997. Generation Unit StatisticalBrochure 1992-1996, August.
Palmer, Karen and Dallas Burtraw. 1997. “Electricity Restructuring and Regional AirResource and Energy Economics 19: 139-174.
Palmer, Karen. 1997. “Electricity Restructuring: Environmental Impacts,” Forum for AppliedResearch and Public Policy, 11: 28-33.
Putnam, Hayes and Bartlett. 1996. “Review of Center for Clean Air Policy’s Paper Entitled:‘Emission Impacts of Increased Energy Exports From the American Electric Power (AEP)System.’” Report prepared form the American Electric Power System (April 12).
Resource Data International (RDI). 1998. Energy, Economics & the Environment; Boulder,Colorado.
Roberts, B.F. and Lessly Goudarzi. 1998 “Efficient Heat Rate Benchmarks for Coal-FiredGenerating Units,” Economic Sciences Corporation Working Paper (Berkeley, CA)(obtained from url http://www.econsci.com/euar9801.html)
Rosen, Richard, Tim Woolf, Bill Dougherty, Bruce Biewald, Stephen Bernow and RegulatoryAssistance Project. 1995. Promoting Environmental Quality in a Restructured ElectricIndustry. Prepared for the National Association of Regulatory Utility Commissioners(Boston: Tellus Institute), December 15.
Science Application International Corporation (SAIC). 1998. The Impact of IndustryRestructuring on Electricity Prices, prepared for The Policy Analysis Group American GasAssociation, July.
Sonnenblick, Richard, and Max Henrion. 1997. “Uncertainty in the Tracking and AnalysisFramework Integrated Assessment,” Acid Rain & Electric Utilities II ConferenceProceedings, Air and Waste Management Association, January 21-22.
U.S. Department of Energy (DOE). 1998. Comprehensive Electricity Competition Act:Supporting Analysis, (DOE/PO-0057) July.
U.S. Energy Information Administration (EIA). 1996. “An Analysis of FERC’s FinalEnvironmental Impact Statement for Electricity Open Access and Recovery of StrandedCost.” prepared for Senator James Jeffords, Vice Chair, Subcommittee on EnergyProduction and Regulation, Senate Energy and Natural Resources Committee, U.S. Senate,September.
U.S. Energy Information Administration (EIA). 1997. Electricity Prices in a CompetitiveEnvironment: Marginal Cost Pricing of Generation Services and Financial Status ofElectric Utilities (DOE/EIA-0614) August.
U.S. Energy Information Administration (EIA). 1997. Annual Energy Outlook 1998, (DOE/EIA-0383(98) December.
U.S. Environmental Protection Agency (EPA). 1998. Analyzing Electric Power Generationunder the CAAA, March.

Burtraw, Palmer and Paul October, 1998
37
U.S. Environmental Protection Agency (EPA). 1996. Comments on the Draft EnvironmentalImpact Statement. February.
U.S. Federal Energy Regulatory Commission (FERC). 1996a. Promoting WholesaleCompetition Through Open Access Non-Discriminatory Transmission Services by PublicUtilities (RM95-8-000) and Recovery of Stranded Costs by Public Utilities and TransmittingUtilities (RM94-7-001), FERC/EIS-0096 Washington, DC: April
U.S. Federal Energy Regulatory Commission (FERC). 1996b. Environmental ImpactStatement, Promoting Wholesale Competition through Open Access Non-DiscriminatoryTransmission Services by Public Utilities and Recovery of Stranded Cost by Public Utilitiesand Transmitting Utilities, April.

Burtraw, Palmer and Paul October, 1998
38
Appendix: Details of the Modeling Framework
This analysis uses two models - The HAIKU Model and the TAF Health Benefits Model
- to simulate the effects of different restructuring and environmental policy scenarios on a host of
electricity market and environmental variables. Each of these models is described below.
The HAIKU Model
The HAIKU Model is a simulation model of regional electricity markets and inter-
regional electricity trade with a fully integrated algorithm for NOX emission control technology
choice, constructed with the Analytica modeling software. The two components of the HAIKU
model are the Intra-regional Electricity Market Component and the Inter-regional Power Trading
Component.
Intra-regional Electricity Market Component
This model component uses a reduced-form dispatch algorithm to develop electricity
supply curves for each NERC region during three time periods (peak, middle and off-peak hours)
for each of three seasons (summer, winter, and spring/fall). The supply curves are constructed
using information on capacity (net of planned and unplanned outages), operating and
maintenance costs (including pollution control costs) and fuel costs for several “model plants”
each of which represents a group of generating units aggregated by region, fuel type, technology
and vintage classifications. The operation of model plants in each time period is determined
according to a market equilibrium identified by the intersection of the supply and demand curves
for that time period (and subsequent opportunities for inter-regional power trading that are
described below). The market price of electricity is determined according to the specified
regulatory institution in the scenario. Average cost pricing and marginal cost pricing can both be
represented. Under marginal cost pricing, for example, the equilibrium price is equal to the sum
Burtraw, Palmer and Paul October, 1998
39
of the market clearing price of electricity generation and the additional costs of transmission and
distribution services, including intra-regional transmission losses.21 The demand, supply and
emissions components of this model and the underlying data are described in more detail next.
Demand
Using data from the U.S. Energy Information Administration (EIA), the demand
component classifies annual electricity demand by three customer types (residential, commercial
and industrial), by three seasons (summer, winter, fall/spring), and by three time blocks (peak,
middle and off-peak hours). Demand within each block is represented by a price-sensitive
demand function where each customer/season/time block is characterized by an elasticity value
that is usually unique.
Supply
The model plants that populate the supply component of HAIKU are constructed using
information at the generating unit level on generating capacity and engineering characteristics
drawn from three different EIA databases: EIA 860, EIA 759 and EIA 767. This information is
aggregated to the “model plant” level based on the fuel type, technology (including boiler type
for some coal-fired boilers) and vintage of each unit. The model plant definitions used in this
model are adapted from those developed by the U.S. EPA for the Clean Air Power Initiative
project (EPA 1998). As a part of that project, EPA’s contractor, ICF, Inc., developed
prototypical operating cost information for each model plant category. This information is
combined with regional fuel cost, the costs associated with endogenously selected NOX control
technologies (and, in the case of emission allowance trading, the cost of NOX allowances) and
unit availability (reflecting planned and unplanned outages) to develop regional supply curves.
The geographic location of emissions are determined by portioning out total generation and total
21 For purposes of setting electricity prices, intra-regional transmission losses are assigned to the exporting regions.
Burtraw, Palmer and Paul October, 1998
40
emissions from each model plant to its constituent plant locations according to each constituent
plant’s share of 1995 generation.
The version of the HAIKU model employed in this study does not incorporate
endogenous investment and retirement decisions, except with respect to investments in NOX
control technology.22 This means that the model in unable to shed light on how changes in
electricity market policy or environmental policy will affect retirement of older generating
facilities or investment in new generating facilities. However, the model does incorporate
parametric assumptions about plant retirement and investment and these assumptions vary under
different restructuring scenarios. Since this study looks at the effects of restructuring in the early
part of the next decade (2003), it incorporates changes in the stock of generating capital currently
planned or that are likely to take place in the interim, and these assumptions are varied within the
analysis.
Emissions
The model contains emission factors for NOx, SO2 and CO2 for each model plant that is
constructed using information from U.S. EPA and EIA on plant performance and total emissions.
This project focuses primarily on NOX emissions.23 Information on the costs of NOX emission
control is obtained for all generating facilities and aggregated to the model plant level. NOX
control strategies are chosen endogenously and the costs of these controls feed into the
calculation of NERC region-wide electricity supply functions. This interaction between
endogenously chosen emission control costs and emission factors with electricity supply
22 A longer-run version of the model that incorporates endogenous generating plant retirement and investment iscurrently under development.23 Electric power industry-wide emissions of SO2 are capped under Title IV of the 1990 Clean Air Act Amendmentsand CO2 emissions are a global environmental issue, that is outside the scope of this project.

Burtraw, Palmer and Paul October, 1998
41
illustrates the effect of alternative environmental policies on inter-regional power trading and
other market outcomes, as well as their effect on emissions.
The effects of alternative environmental policies are indicated by changes in electricity
prices, quantity of electricity produced, amount of electricity generated using each model plant
technology and levels of emissions of NOX and other pollutants by model plant and by region.
Regional information on NOX emissions are used as inputs to the TAF for calculation of health
effects and health benefits.
Inter-regional Power Trading Component.
This model component solves for the level of inter-regional power trading necessary to
equilibrate differences in regional equilibrium electricity prices (gross of transmission costs and
power losses) across different NERC regions. These transactions are constrained by the assumed
level of available inter-regional transmission capability as reported by NERC. This capability is
assumed to grow at different rates under different market structure scenarios. Transactions are
determined by the excess energy supply function for exporting regions and the excess energy
demand functions for importing regions. The marginal cost of generation for export in supplying
regions is determined after solving (or resolving) for equilibrium prices within the region. Hence,
price discrimination is assumed in that native customers within a supplying region pay a different
(lower) price for generation than customers in other regions that receive imports from the
supplying region.
The Tracking and Analysis Framework
The Tracking and Analysis Framework (TAF) is used to translate the effects of changes
in emissions on changes in human health. TAF is constructed with the Analytica modeling
software and integrates pollutant transport including formation of secondary particulates but
Burtraw, Palmer and Paul October, 1998
42
excluding ozone, human health effects, and valuation of benefits (Bloyd et al. 1996).24 TAF was
developed on behalf of the National Acid Precipitation Assessment Program (NAPAP). Each
module of TAF was constructed and refined by a group of experts in that field, and draws
primarily on peer reviewed literature to construct the integrated model. TAF was subject to an
extensive peer review in December 1995, which concluded that “TAF represent(s) a major
advancement in our ability to perform integrated assessments” and that the model was ready for
use by NAPAP (ORNL, 1995).
TAF characterizes emissions, emission transport, atmospheric concentrations of
pollutants and health effects at the state level. Changes outside the U.S. are not evaluated. The
considerable uncertainty in parameters in each of the modeled domains and in the underlying
scientific and economic literature is at least partly captured through Monte Carlo simulation, and
has been explored elsewhere (Burtraw et al., 1998; Sonnenblick and Henrion, 1997).
The Health Effects Module
The Health Effects Module in TAF is designed to estimate the health impacts of changes
in air pollution concentrations. Impacts are expressed as the number of days of acute morbidity
effects of various types, the number of chronic disease cases, and the number of statistical lives
lost to premature death. The change in the annual number of impacts of each health endpoint is
the output. Inputs consist of changes in ambient concentrations of SO2 and NOx, demographic
information on the population of interest, and miscellaneous additional information such as
background PM10 levels for analysis of thresholds.
The module is based on concentration-response (C-R) functions found in the peer-
reviewed literature. The C-R functions are taken, for the most part, from articles reviewed in the
U.S. Environmental Protection Agency (EPA) Criteria Documents (see, for example, USEPA
24 TAF also accounts for visibility and aquatic effects which are not included as part of this study.

Burtraw, Palmer and Paul October, 1998
43
1995). These documents are outcomes of a recurring comprehensive process initiated by the
Clean Air Act and its Amendments for reviewing what is known about the health effects of the
so-called "criteria" air pollutants. The Health Effects Module contains C-R functions morbidity
and mortality endpoints for PM10, total suspended particulates (TSP), SO2, sulfates (SO4),
NO2, and nitrates (NO3). Since nitrates are particulates, and no independent effect of nitrates on
health has been established, they are treated as a component of PM10. In this study only NOX
emissions, and their role as secondary particulates is investigated. SO2 emission changes are not
modeled under the assumption they are held fixed at an aggregate level under the 1990 Clean Air
Act Amendments.
The mortality endpoint is the most significant in terms of estimated health effects. The
default option assumes that sulfates are distinct and associates them with relatively greater
potency in comparison with other constituent particles of 10 microns or less in diameter (PM10),
while nitrates are treated as PM10. This characterization is the most representative of the
evidence currently, but it is uncertain and other assumptions can be represented in the model.
The morbidity module considers the effects of PM10 on endpoints such as symptom days and
restricted activity days. NOX is included for eye irritation and phlegm days.
The Benefits Valuation Module
From an economic perspective, values are measured by how much of one asset or service
individuals are willing to sacrifice in order to obtain or preserve another. The Health Valuation
Submodule of TAF assigns monetary values taken from the environmental economics literature
(e.g., Lee et al. 1994) to the estimated changes in health status produced by the Health Effects
Module. The benefits are totaled to obtain annual health benefits for each year modeled.