
The web of things - SensorLabsensorlab.ijs.si/files/publications/2011-June-29-Fortuna... ·...
184
The web of things CAROLINA FORTUNA AND MARKO GROBELNIK [email protected] [email protected] JOŽEF STEFAN INSTITUTE, LJUBLJANA, SLOVENIA HTTP://SENSORLAB.IJS.SI
Transcript of The web of things - SensorLabsensorlab.ijs.si/files/publications/2011-June-29-Fortuna... ·...
The web of things
CAROLINA FORTUNA AND MARKO GROBELNIK
[email protected] [email protected]
JOŽEF STEFAN INSTITUTE, LJUBLJANA, SLOVENIA
HTTP://SENSORLAB.IJS.SI
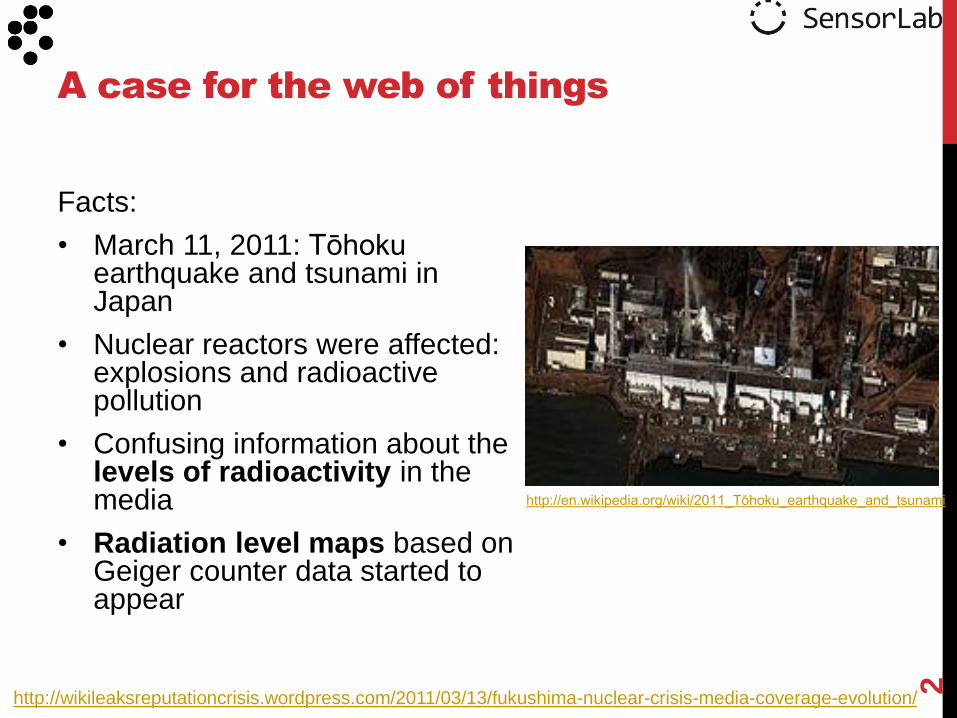
Facts:
• March 11, 2011: Tōhoku earthquake and tsunami in Japan
• Nuclear reactors were affected: explosions and radioactive pollution
• Confusing information about the levels of radioactivity in the media
• Radiation level maps based on Geiger counter data started to appear
A case for the web of things
2
http://en.wikipedia.org/wiki/2011_Tōhoku_earthquake_and_tsunami
http://wikileaksreputationcrisis.wordpress.com/2011/03/13/fukushima-nuclear-crisis-media-coverage-evolution/

Radiation level map
3
http://blog.pachube.com/2011/03/real-time-radiation-monitoring-in-japan.html
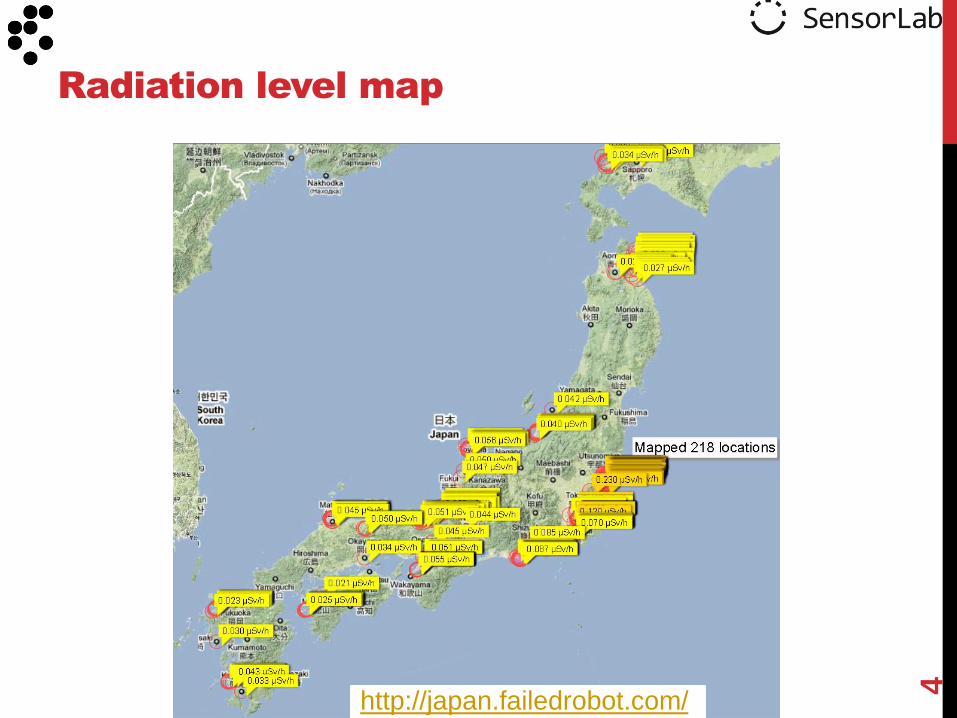
http://japan.failedrobot.com/
Radiation level map
4
Outline
Part I. Motivation & background
Part II. Technology and tools for exploiting the WoT
Part III. Demos, tools & research directions
6
Web Of Things
• What is it? What problems can it solve?
Architectural considerations
• How it looks like? What are its components?
The “Things”
• What are the ingredients?
The “Glue”
• How do things stick together?
Applications and services
• What can be built on top of it?
Quick start recipes
• How does the “Hello World!” look like?
Part I. Motivation & background
outline
7
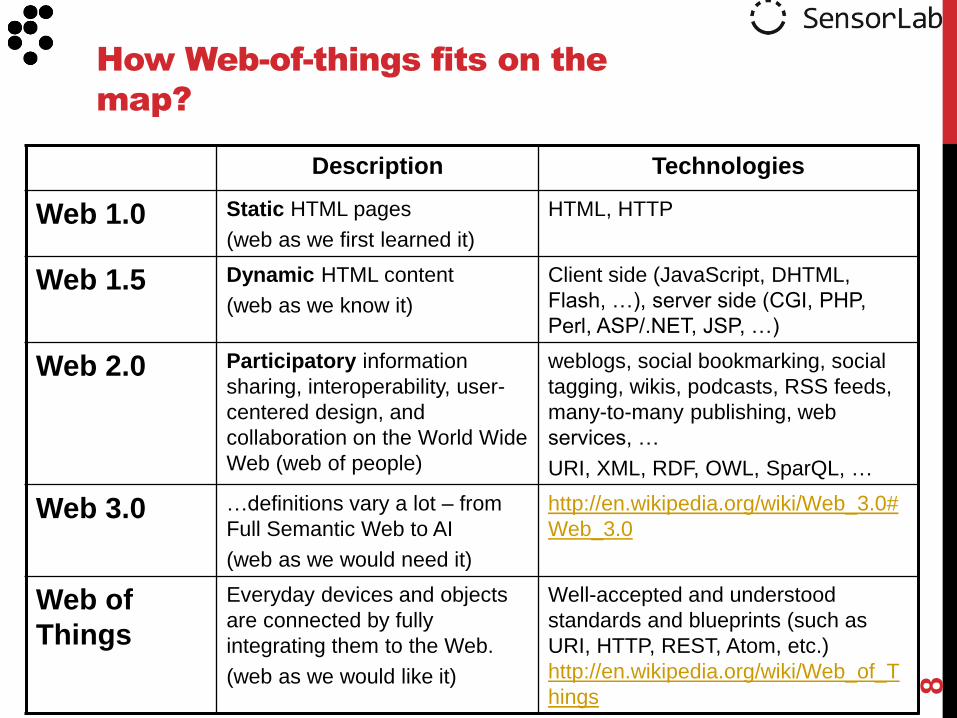
How Web-of-things fits on the
map?
8
Description Technologies
Web 1.0 Static HTML pages
(web as we first learned it)
HTML, HTTP
Web 1.5 Dynamic HTML content
(web as we know it)
Client side (JavaScript, DHTML,
Flash, …), server side (CGI, PHP,
Perl, ASP/.NET, JSP, …)
Web 2.0 Participatory information
sharing, interoperability, user-
centered design, and
collaboration on the World Wide
Web (web of people)
weblogs, social bookmarking, social
tagging, wikis, podcasts, RSS feeds,
many-to-many publishing, web
services, …
URI, XML, RDF, OWL, SparQL, …
Web 3.0 …definitions vary a lot – from
Full Semantic Web to AI
(web as we would need it)
http://en.wikipedia.org/wiki/Web_3.0#
Web_3.0
Web of
Things
Everyday devices and objects
are connected by fully
integrating them to the Web.
(web as we would like it)
Well-accepted and understood
standards and blueprints (such as
URI, HTTP, REST, Atom, etc.)
http://en.wikipedia.org/wiki/Web_of_T
hings

BEGINNER LEVEL
Tweeting moisture sensor for houseplants
3High-power LED bike light
4Tweeting power meter
INTERMEDIATE LEVEL
RFID pet feeder
Earthquake detector/reflector
Multicolored door-lock keypad
ADVANCED LEVEL
Remote-controlled lawn mower
LED Cube
Mind-controlled RC helicopter
Examples of apps
9
http://www.wired.com/magazine/2011/03/ff_makestuff_projects/
Past:
“manual input of information by 500 million or a billion
users”1
Future:
“new information can be created automatically without
human data entry… the next generation of sensor
networks can monitor our environment and deliver
relevant information – automatically.1
10
Transition towards machine
generated information
1Pete Hartwell, How a Physically Aware Internet Will Change the World, Mashable, October 13, 2010.
Motivated by an increased interest in automatic management of large systems
• Commercial use cases1 (non-exhaustive list):
• Power grids
• Transport systems
• Water distribution
• Logistics
• Industrial automation
• Health
• Environmental intelligence
• Academic
• Distributed sensing infrastructure
Alternative solutions
Ethical issues and abuse1
Web of things use cases
11
1Ludwig Siegele, A special report on smart systems, The Economist, Nov. 4 2010.

“If the power grid in America alone were just 5% more efficient, it would save greenhouse emissions equivalent to 53m cars (IBM).“
Solutions:
• demand pricing – 10-15% peak hour demand cut
• Energy consumption monitoring with smart meters encourage shifting consumption to off-peak hours through personalized price plans
• demand response – extra 10-15% cut
• Save energy by sensing and actuation: smart meters + actuators turn off air-conditioning systems when demand for electricity is high
12
Commercial use case: Power
grids1
1Ludwig Siegele, A special report on smart systems, The Economist, Nov. 4 2010.
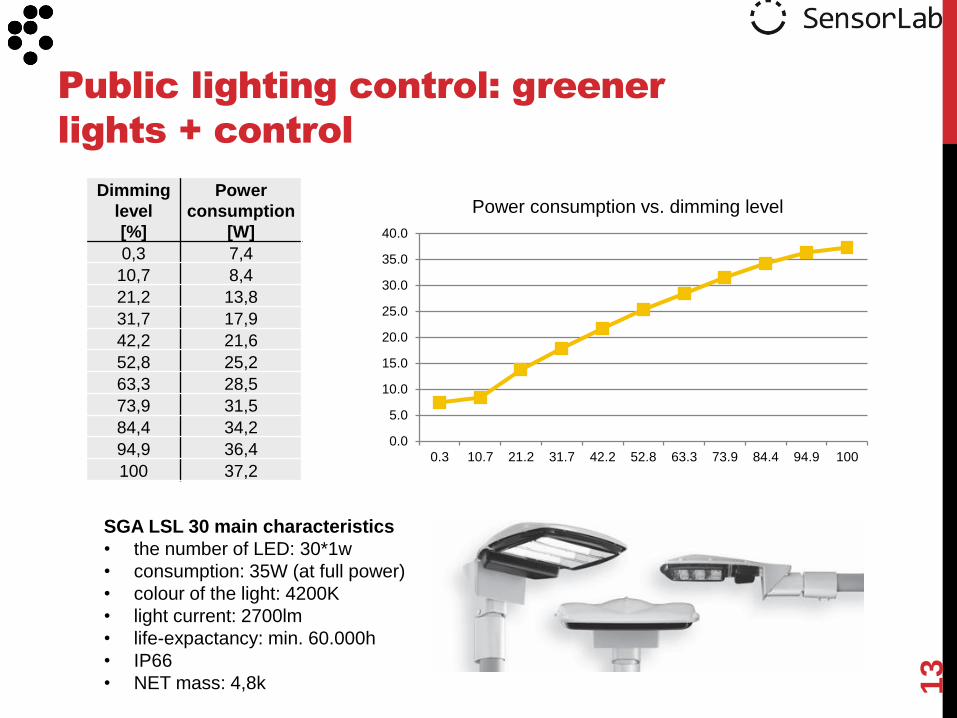
Public lighting control: greener
lights + control
13
Dimming
level
[%]
Power
consumption
[W]
0,3 7,4
10,7 8,4
21,2 13,8
31,7 17,9
42,2 21,6
52,8 25,2
63,3 28,5
73,9 31,5
84,4 34,2
94,9 36,4
100 37,2
0.0
5.0
10.0
15.0
20.0
25.0
30.0
35.0
40.0
0.3 10.7 21.2 31.7 42.2 52.8 63.3 73.9 84.4 94.9 100
Power consumption vs. dimming level
SGA LSL 30 main characteristics
• the number of LED: 30*1w
• consumption: 35W (at full power)
• colour of the light: 4200K
• light current: 2700lm
• life-expactancy: min. 60.000h
• IP66
• NET mass: 4,8k
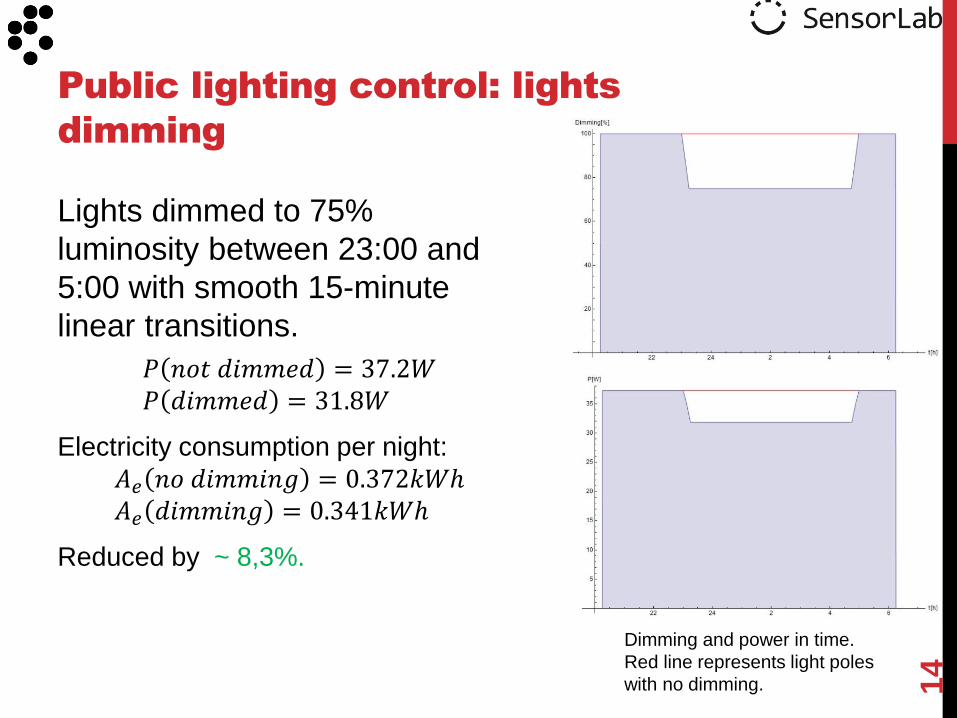
Lights dimmed to 75%
luminosity between 23:00 and
5:00 with smooth 15-minute
linear transitions.
𝑃 𝑛𝑜𝑡 𝑑𝑖𝑚𝑚𝑒𝑑 = 37.2𝑊 𝑃 𝑑𝑖𝑚𝑚𝑒𝑑 = 31.8𝑊
Electricity consumption per night: 𝐴𝑒 𝑛𝑜 𝑑𝑖𝑚𝑚𝑖𝑛𝑔 = 0.372𝑘𝑊ℎ 𝐴𝑒 𝑑𝑖𝑚𝑚𝑖𝑛𝑔 = 0.341𝑘𝑊ℎ
Reduced by ~ 8,3%.
Public lighting control: lights
dimming
14 Dimming and power in time.
Red line represents light poles
with no dimming.

“In 2007 its congested roads cost the country 4.2 billion working hours and 10.6 billion litres of wasted petrol (Texas Transportation Institute)” 1
Solutions:
• Charging for city centers and busy roads
• London, Stockholm, Singapore, etc.
• Green wave
• Adjustment of traffic lights to suit the flow of vehicles
• Automatic parking guidance
• Singapore is developing a parking-guidance system (cars looking for somewhere to park are now a big cause of congestion).
• Real-time dynamic pricing
• Singapore
Commercial use case: Transport
systems1
15
1Ludwig Siegele, A special report on smart systems, The Economist, Nov. 4 2010.
Utilities around the world lose between 25% and 50% of treated water to leaks (Lux Research).
Solutions:
• Renew infrastructure
• London, UK, Thames Water was losing daily nearly 900m litres of treated water and had to fix 240 leaks due to aging infrastructure1.
• Install sensors for monitoring the pipe system
• Automatically detect leaks fast (instead of customers calling and reporting leaks). London, Singapore, etc.
• Automate the management and maintenance process
• Automatic scheduling of work crews and automatic alerts (i.e. text messages to affected customers)
Commercial use case: Water
distribution1
16
1Ludwig Siegele, A special report on smart systems, The Economist, Nov. 4 2010.

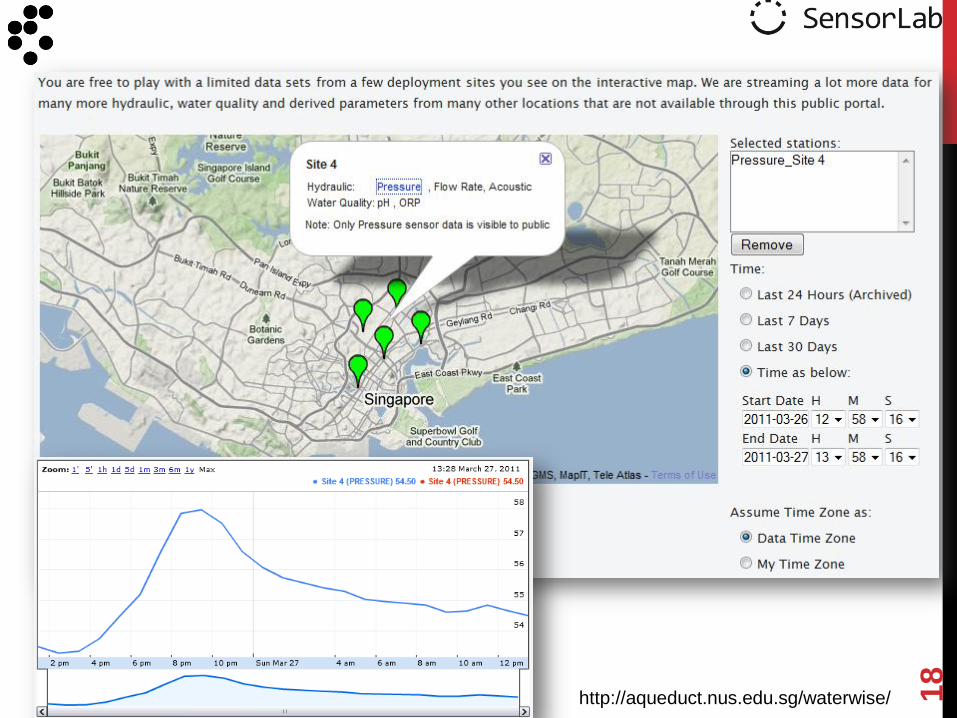
WaterWiSe in Singapore
• develop generic wireless sensor network
capabilities to enable real time monitoring of a
water distribution network.
• three main applications:
• On-line monitoring of hydraulic parameters within a
large urban water distribution system.
• Integrated monitoring of hydraulic and water quality
parameters.
• Remote detection of leaks and prediction of pipe
burst events.
17
Water distribution
http://aqueduct.nus.edu.sg/waterwise/
18
http://aqueduct.nus.edu.sg/waterwise/

Cargo loss due to theft or damage is significant, estimates that the global financial impact of cargo loss exceeds $50 billion annually (The National Cargo Security Council)1. The cost is eventually passed to the customers.
Solutions:
• Automatic track and trace
• Tag and trace their wares all along the supply chain (RFIDs and sensors) - and consumers to check where they come from (i.e. FoodLogiQ, SenseAware)2
• Event detection and mitigation
• Detect events that affect the cargo (i.e. delay, inappropriate transport conditions) and minimize damage (i.e. re-route)
19
Commercial use case: Logistics
1 Tom Hayes, The Full Cost of Cargo Losses
2Ludwig Siegele, A special report on smart systems, The Economist, Nov. 4 2010.
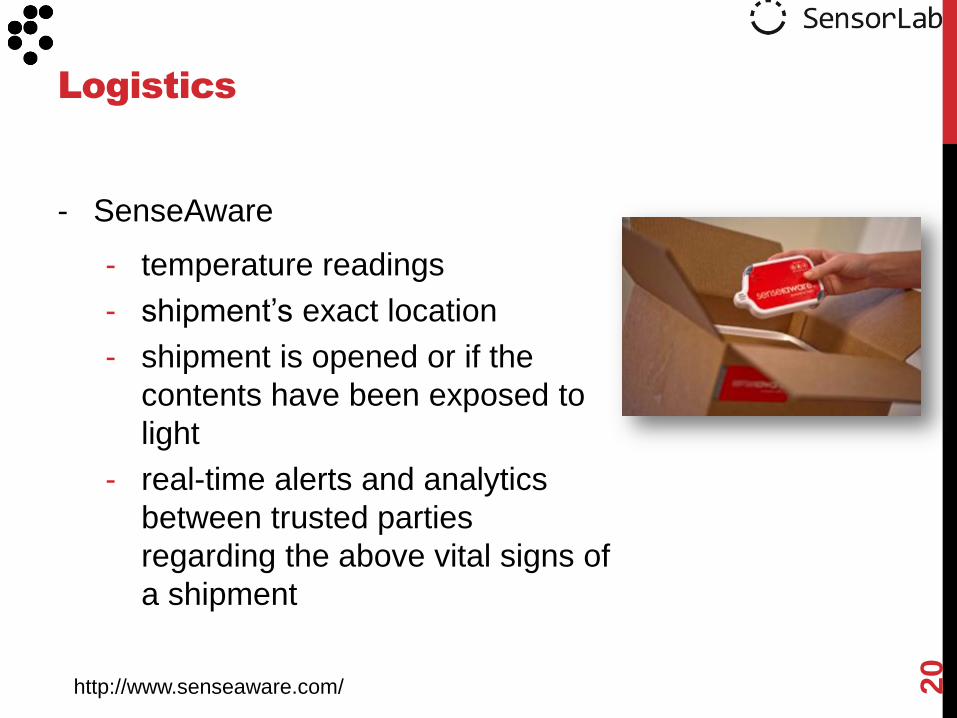
- SenseAware
- temperature readings
- shipment‟s exact location
- shipment is opened or if the
contents have been exposed to
light
- real-time alerts and analytics
between trusted parties
regarding the above vital signs of
a shipment
20
Logistics
http://www.senseaware.com/

21
Supply chain management
http://www.webofthings.com/
22
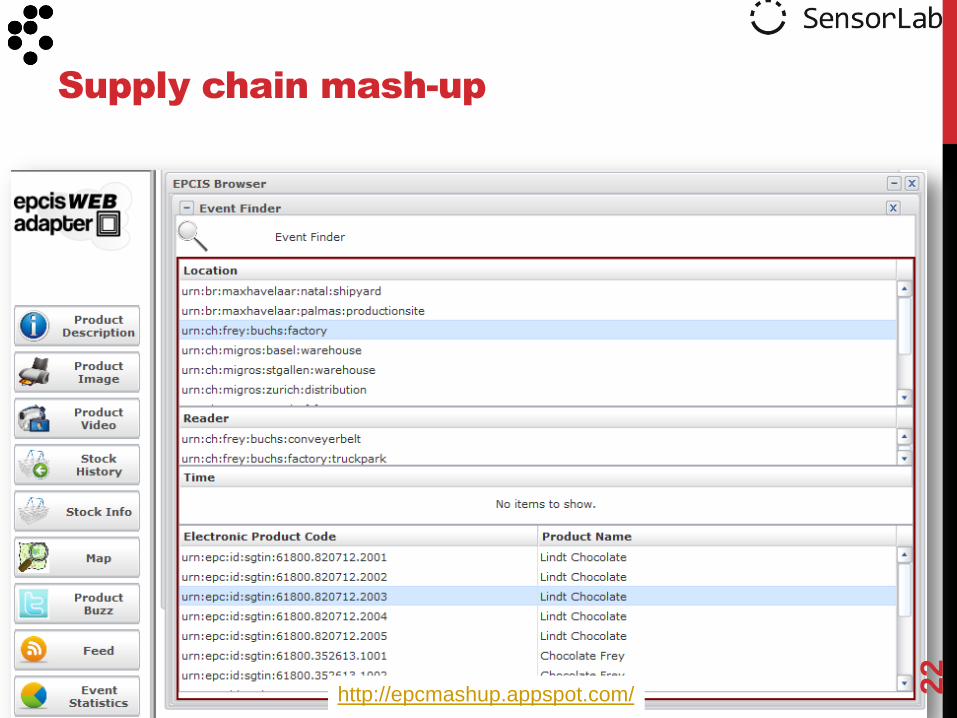
Supply chain mash-up
http://epcmashup.appspot.com/
Commercial use case:
Industrial automation
The integration gap between the production and business processes comes at a high cost, especially in multi-site enterprises.
Solutions:
• Automatic monitoring of the production process
• Monitor the devices on the production floor (i.e. robotic arm overheating)1
• Automatic event detection and notification
• Process the measurements, detect anomalies and notify the business process (i.e. production at site interrupted, relocate)
• Productivity comparison
• Machines equipped with sensors allow productivity comparison based on sensed data (i.e. Heidelberger Druckmaschinen)2
• Dynamic production optimization
• 5% increase in paper production by automatically adjusting the shape and intensity of the flames that heat the kilns for the lime used to coat paper2
23
1SOCRADES project, http://www.socrades.eu/
2Ludwig Siegele, A special report on smart systems, The Economist, Nov. 4 2010.

• SunSpot on Robotic ARM, exposing measurements as Web service
• SunSpot GW connected to Windows machine, then to the Enterprise Network or Internet
• Failure, production interruption alarm – moving to alternative production site
24
Process integration
Thing
(DPWS)
Thing
(REST)
SIA server
Enterprise Resource Planning
http://www.youtube.com/watch?v=K8OtFD6RLMM
1SOCRADES project, http://www.socrades.eu
2D. Guinard, V. Trifa, S. Karnouskos, P. Spiess, D. Savio, Interacting with the SOA-based Internet of
Things: Discovery, Query, Selection and On-Demand Provisioning of Web Services, IEEE
Transactions on Services Computing, Vol. 3, July-Sept 2010.
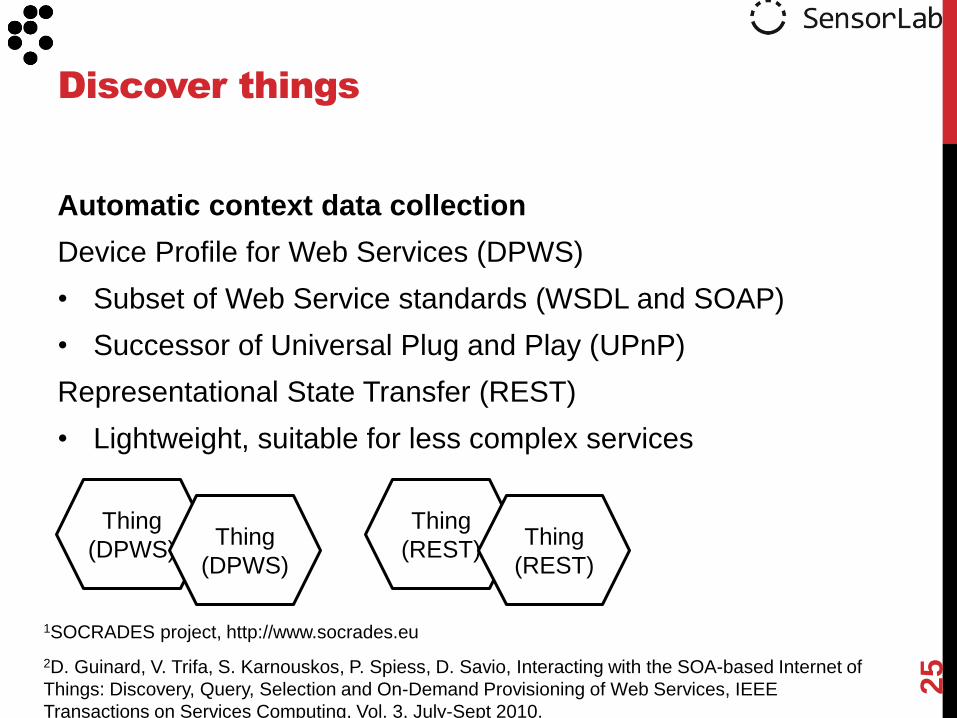
Automatic context data collection
Device Profile for Web Services (DPWS)
• Subset of Web Service standards (WSDL and SOAP)
• Successor of Universal Plug and Play (UPnP)
Representational State Transfer (REST)
• Lightweight, suitable for less complex services
Discover things
25
1SOCRADES project, http://www.socrades.eu
2D. Guinard, V. Trifa, S. Karnouskos, P. Spiess, D. Savio, Interacting with the SOA-based Internet of
Things: Discovery, Query, Selection and On-Demand Provisioning of Web Services, IEEE
Transactions on Services Computing, Vol. 3, July-Sept 2010.
Thing
(DPWS) Thing
(DPWS)
Thing
(REST) Thing
(REST)

- Insert search keywords, perform query enrichment (augmentation)
- Tested 2 strategies: Wikipedia and Yahoo! Search
- Manually tune the augmented query by adding/deleting keywords
- Search services in the store and rank them according to some criteria (i.e. QoS)
Query embedded services
26
Thing
(DPWS) Thing
(DPWS)
Thing
(REST) Thing
(REST)
Device and service store Wikipedia,
Yahoo!
Search
Search Keywords
Query Enrichment
Manual tuning
Service query
Service Ranking
Service Instances
Service testing
In health care, sensors and data links offer possibilities for monitoring a patient‟s behavior and symptoms in real time and at relatively low cost.1
Solutions:
• Patient monitoring
• When suffering from chronic illnesses can be outfitted with sensors to continuously monitor their conditions as they go about their daily activities.
• Asthma, diabetes, heart-failure
• Extended healthcare for elders
• Needs to extend from hospital to home care to ensure cost efficient provisioning and improve quality of living (ambient assisted living).
• Fall detection, emergency call, user localization, hazard monitoring (toxic gases, water, fire)
• Fitness monitoring for personalized fitness scenario
27
Commercial use case: Health

Data from large number of sensors deployed in
infrastructure (such as roads) or over other area of interest
(such as agriculture fields) can give decision makers a real-
time awareness on the observed phenomena and events.
Solutions:
• Remote monitoring of cultures, soil moisture, insect
infestations or disease infections
• Irrigation and pesticide spraying in precision agriculture
• Livestock monitoring for maximizing production (meat,
milk, eggs) and achieve higher reproduction rates
28
Commercial use case:
Environmental intelligence

29
Videk: mash-up for environmental
intelligence
http://sensors.ijs.si/

30
Environmental monitoring
http://www.swiss-experiment.ch/index.php/Main_Page
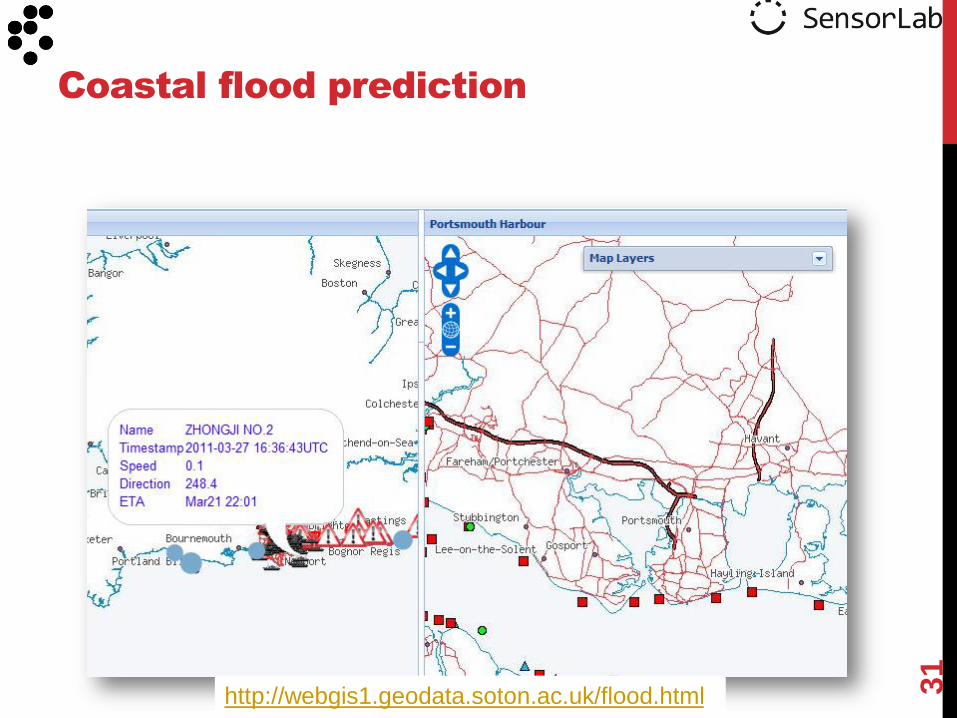
31
Coastal flood prediction
http://webgis1.geodata.soton.ac.uk/flood.html
Scientists defines their hypothesis, collect the necessary data and then try to validate the hypothesis. Manually collected data is generally expensive to get1 while access to large datasets is generally restricted by the owners.
Solution:
• Deploy sensors in small and medium size testbeds
• On a riverbed, volcano, mountain, etc.
• Build an open data publishing and sharing platform which can federate the testbeds
• Share your data with others so that also others share it with you
32
Academic: Distributed sensing
infrastructure
1Matt Welsh, Sensor Network for the Sciences, Communications of the ACM, November 2010, Vol.
53, No. 11.

Several of the previously mentioned use cases can be
solved by other approaches, crowdsourcing being on
the of most obvious.
Roadify, Waze are using real time traffic information
reported by participants in traffic may solve traffic
congestion problems
• Human “sensor” reporting and consuming via
handheld terminals
• Costs and benefits will determine the best
solution.
33
Use Cases: Alternative solutions

• For every technology created for a noble purpose,
less noble applications can be found and vice-versa.
• Smart systems may be used for privacy invading
applications, for restricting the liberty of people, for
creating chaos, misinformation, false alarms, etc.
34
Use Cases: Ethical issues and
abuse1
1Ludwig Siegele, A special report on smart systems, The Economist, Nov. 4 2010.

Web Of Things
• What is it? What problems can it solve?
Architectural considerations
• How it looks like? What are its components?
The “Things”
• What are the ingredients?
The “Glue”
• How do things stick together?
Applications and services
• What can be built on top of it?
Quick start recipes
• How does the “Hello World!” look lilke?
Part I. Motivation & background
outline
35

36
Architectural considerations
Applications
Web publishing
Data processing
Data storage
Data collection
Embedded software
Communication technology
Embedded device
Physical object
Traffic today app
RSS feed
Real time event detection software
Utility company data center
Utility company server
Proprietary firmware
6LoWPAN
Microcontroller with sensors
Public light pole

37
Architectural considerations
Applications
Web publishing
Data collection
Embedded software
Communication technology
Device
MyHome status page
Html
Home computer
RTOS
Bluetooth
Microcontroller with sensors

38
Main Components of a vertical
Applications
Web publishing
Data processing
Data storage
Data collection
Embedded software
Communication technology
Embedded device
Physical object
Traffic today app
RSS feed
Real time event detection software
Utility company data center
Utility company server
Proprietary firmware
6LoWPAN
Microcontroller with sensors
Public light pole “Things”
“Glue”
Apps and
Services
Web Of Things
• What is it? What problems can it solve?
Architectural considerations
• How it looks like? What are its components?
The “Things”
• What are the ingredients?
The “Glue”
• How do things stick together?
Applications and services
• What can be built on top of it?
Quick start recipes
• How does the “Hello World!” look lilke?
Part I. Motivation & background
outline
39

Embedded device
Physical object
40
The “things”
Microcontroller with sensors
Public light pole “Things”
= embedded device + physical object (smart public light pole)
= sensor node (SunSpot, MicaZ, Sensinode, VSN, WASPMote, etc)
= mobile phone
= a set of sensor nodes and/or embedded device + physical things which
are abstracted as one “thing” (large water tank + set of sensor nodes
monitoring water level, temperature and purity)

physical object
• An object built for fulfilling other tasks than computing
• Coffee mug, show, light pole, washing machine,
electric oven, fruit press, water tank
sensor
• a material or passive device which changes its
(conductive) properties according to a physical stimulus
• Thermo couple (temp->voltage), photo resistor (light-
>resistance variations), etc.
Definitions of components related
to things
41
embedded system
• A simple or complex system built into a physical device to perform dedicated functions and enhance the functionality through computation. It features actuators and/or sensors.
• Microprocessor, microcontroller, DSP, FPGA or PLC based system built into a variety devices, including washing machines, electric ovens, industrial robots etc.
sensor node
• A computing and communicating device equipped with sensors and possibly actuators whose functionality revolves around measuring, reporting and possibly actuating. It can be standalone or embedded into physical objects.
• Typically a device composed of microcontroller, power supply, communication interface and sensors/actuators.
Definitions of components related
to things
42

Sensor nodes and their structure
Pow
er
Sourc
e
Comm. Module
CPU & Memory
Sensor (Actuator)
43
= Sensors + Microcontroller + Communication Module
+ Power Source
Classification:
• adapted/augmented general-purpose computers
• embedded sensor modules
• system on chip (SoC) solutions
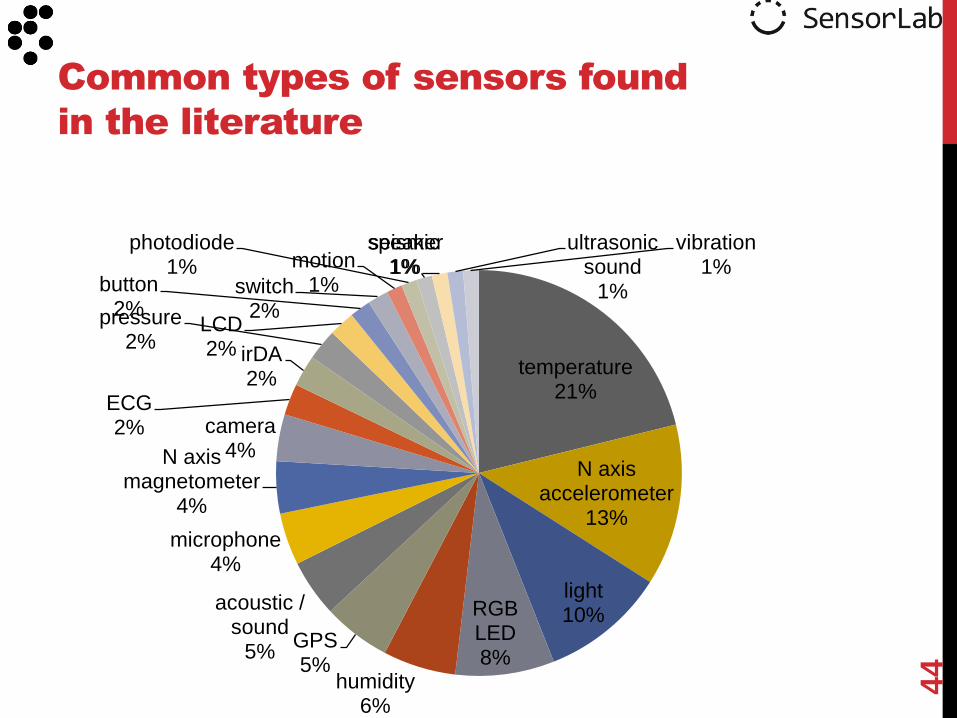
Common types of sensors found
in the literature
44
temperature 21%
N axis accelerometer
13%
light 10% RGB
LED 8%
humidity 6%
GPS 5%
acoustic / sound
5%
microphone 4%
N axis magnetometer
4%
camera 4%
ECG 2%
irDA 2%
pressure 2%
LCD 2%
button 2%
switch 2%
motion 1%
photodiode 1%
seismic 1%
speaker 1%
ultrasonic sound
1%
vibration 1%

Solutions developed in research community or by groups of enthusiasts.
• Combine HW components from different produces (for radio, it seems that TI chips are used in vast majority of ‚products„).
• open-source experimental software such as Contiki OS, TinyOS (& NesC), Nano-RK, FreakZ stack (except for Arduino/Libelium where OEM radio is used whilst crowdsourcing is happening on the level of easy microcontroller programming.
• open source development tools are usually used.
Commercial solutions from particular producers (TI, Atmel, Microchip,…)
• composed of components sold by produces themselves.
• development kits can usually be used with proprietary integrated development environments and allow compiling of certified stacks (most often Zigbee).
Modules assembled by companies trying to sell software solutions
• Sun is in this case promoting the use of Java for sensor networks
• Sensinode is selling one of the 6LoWPAN ports.
Existing solutions for sensor
nodes
45
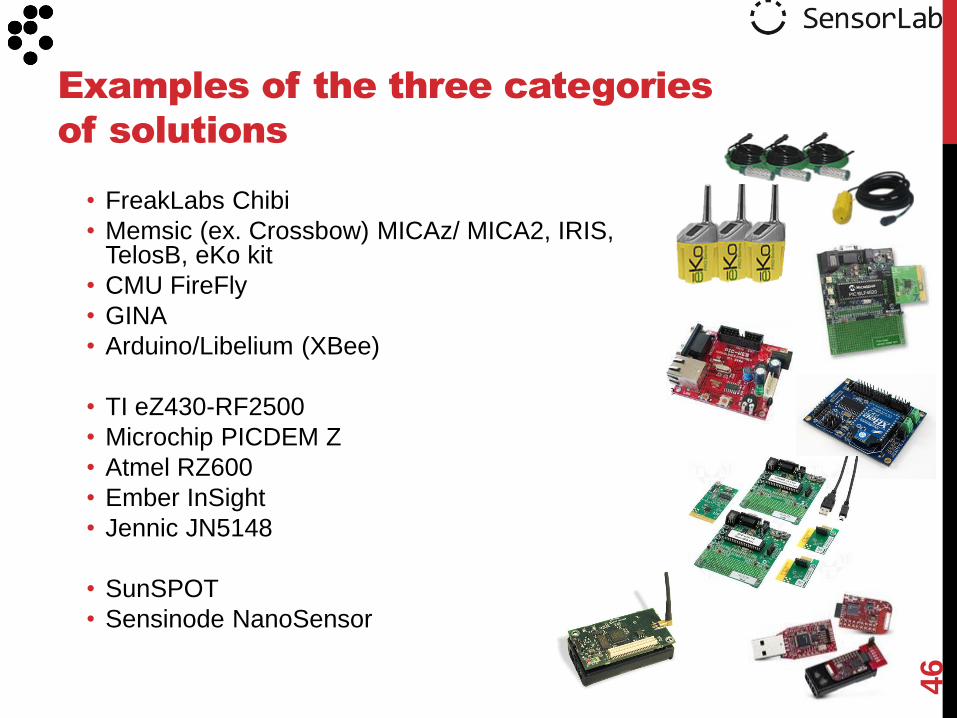
• FreakLabs Chibi
• Memsic (ex. Crossbow) MICAz/ MICA2, IRIS, TelosB, eKo kit
• CMU FireFly
• GINA
• Arduino/Libelium (XBee)
• TI eZ430-RF2500
• Microchip PICDEM Z
• Atmel RZ600
• Ember InSight
• Jennic JN5148
• SunSPOT
• Sensinode NanoSensor
46
Examples of the three categories
of solutions

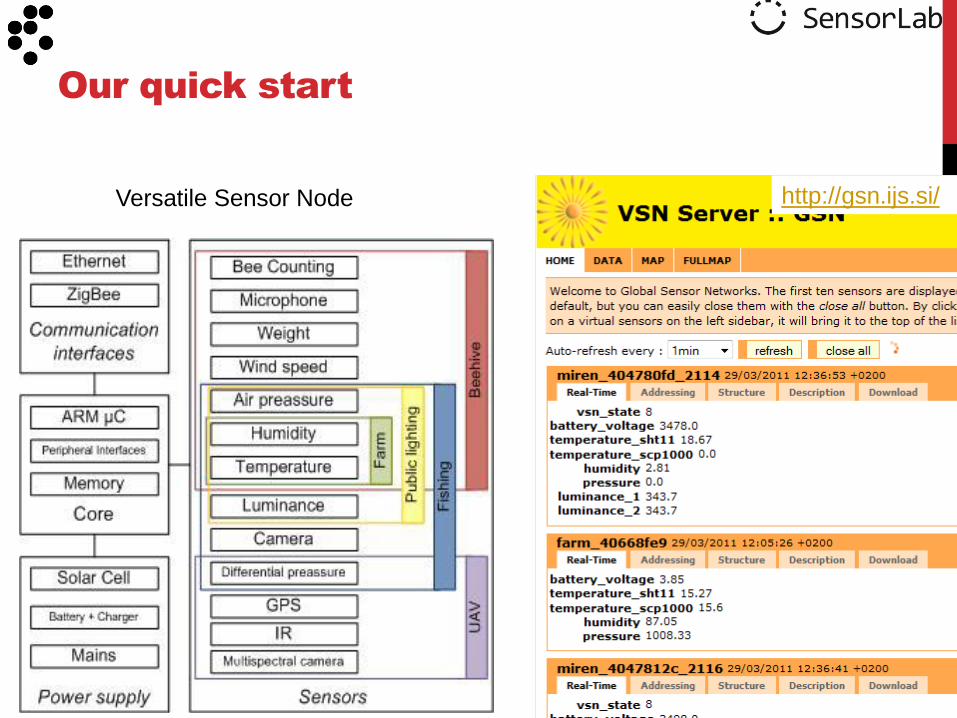
Built at JSI, used for some of the demos presented in Part 3 of the tutorial.
Modular platform for WSN (VSCore + VSRadio + VSApplication + VSPower = VSN)
• High processing power and low energy consumption • Sensor node & gateway (multi-tier / IP) capability • Battery, solar or external power supply • Re-configurable radio
Versatile Sensor Node
47
In collaboration with ISOTEL d.o.o.
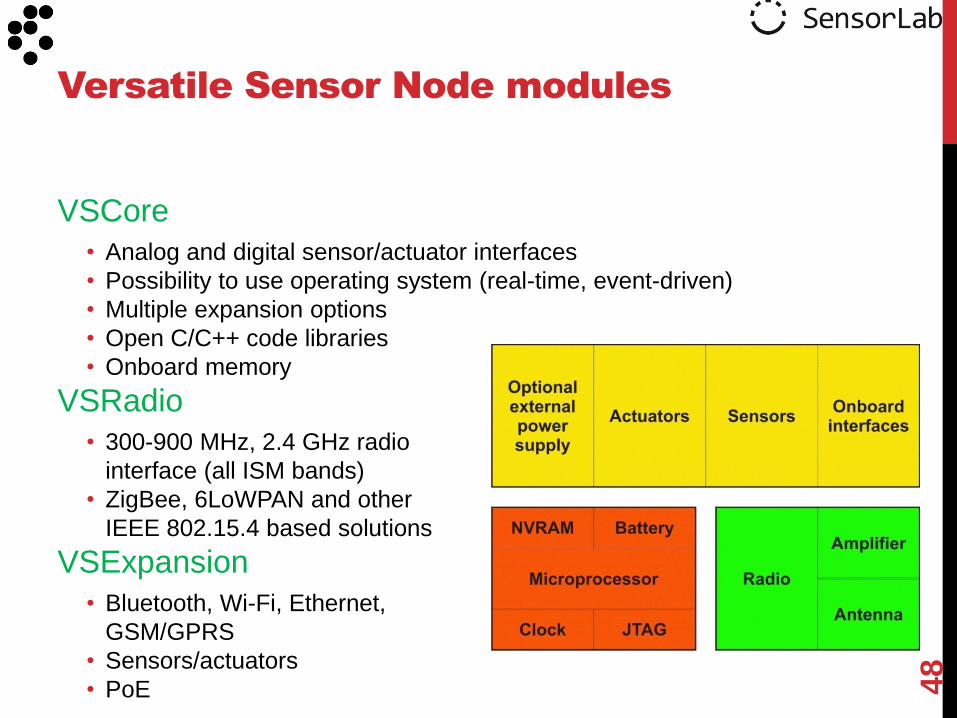
VSCore
• Analog and digital sensor/actuator interfaces
• Possibility to use operating system (real-time, event-driven)
• Multiple expansion options
• Open C/C++ code libraries
• Onboard memory
VSRadio
• 300-900 MHz, 2.4 GHz radio
interface (all ISM bands)
• ZigBee, 6LoWPAN and other
IEEE 802.15.4 based solutions
VSExpansion
• Bluetooth, Wi-Fi, Ethernet,
GSM/GPRS
• Sensors/actuators
• PoE 48
Versatile Sensor Node modules
• WSNs are destined to wide variety of applications.
• Asymmetric, highly directional information flow (data fusion).
• Energy is highly constrained.
• WSN may have huge amount of nodes.
• Application run-time is extremely long.
• Data aggregation (and network control) may be centralized, decentralized or hierarchical.
• Measurements reporting can be periodical, triggered by external event or on request by sink node.
49
Why WSNs are different?

Diminishing
maintenance costs:
• Integrating sensors
into personal
computing devices
such as
phones/laptops
• Efficient remote
configuration and
management
• Disposable
Sensor nodes vs computing
devices
50
Sensor nodes Personal devices

• Human as a sensor
• Spectrum sensors
• Virtual sensors
51
Beyond common sensors

Web Of Things
• What is it? What problems can it solve?
Architectural considerations
• How it looks like? What are its components?
The “Things”
• What are the ingredients?
The “Glue”
• How do things stick together?
Applications and services
• What can be built on top of it?
Quick start recipes
• How does the “Hello World!” look lilke?
Part I. Motivation & background
outline
52

The communication
• The communication medium
• The network
Node centric programming
• operating system
• virtual machine
The “glue”
53
Data processing
Data storage
Data collection
Embedded software
Communication technology
Real time event detection software
Utility company data center
Utility company server
Proprietary firmware
6LoWPAN
“Glue”
System level programming (macro-programming)
• distributed/centralized storage and retrieval
• content management

Wireless and/or Wired point-to-point or point-to-multipoint
B, C and D in the coverage range of A
• When A sends a message, B, C and D receive it
A, B in the range of C
• When C sends a message, only A and B receive it
Communication medium
54
A
D
B
C

Wireless
• Mostly performed in unlicensed bands according to open standards
• Standard: IEEE 802.15.4 - Low Rate WPAN • 868/915 MHz bands with transfer rates of 20 and 40 kbit/s, 2450 MHz
band with a rate of 250 kbit/s
• Technology: ZigBee, WirelessHART
• Standard: ISO/IEC 18000-7 (standard for active RFID) • 433 MHz unlicensed spectrum with transfer rates of 200 kbit/s
• Technology: Dash7
• Standard: IEEE 802.15.1 – High Rate WPAN • 2.40 GHz bands with transfer rates of 1-24 Mbit/s
• Technology: Bluetooth (BT 3.0 Low Energy Mode)
• Standard: IEEE 802.11x – WLAN • 2.4, 3.6 and 5 GHz with transfer rates 15-150 Mbit/s
• Technology: Wi-Fi
Communication medium
55
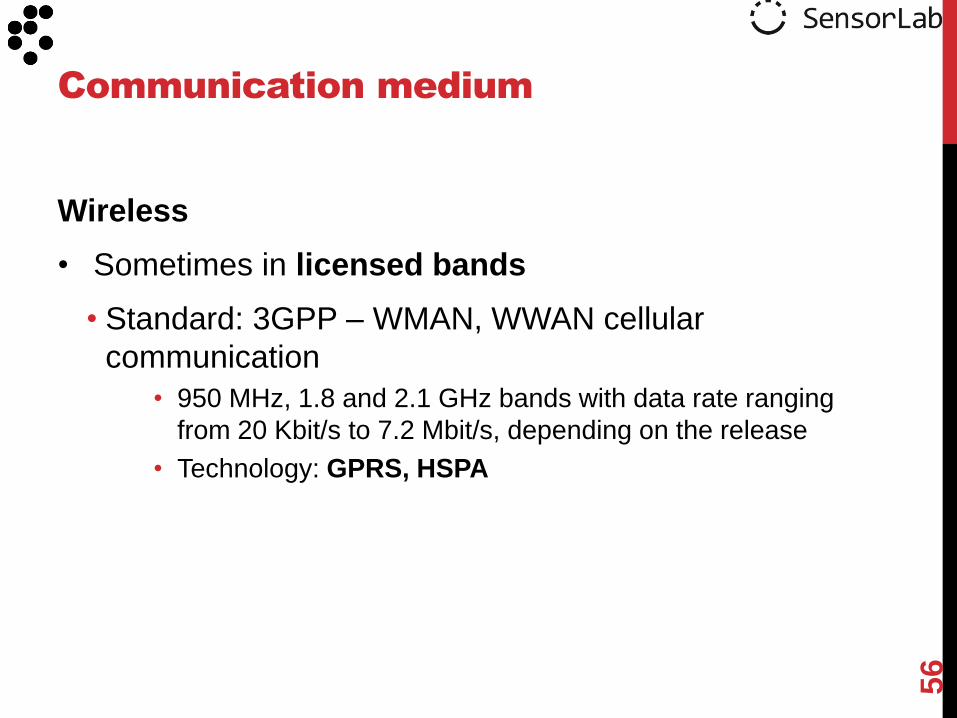
Wireless
• Sometimes in licensed bands
• Standard: 3GPP – WMAN, WWAN cellular
communication
• 950 MHz, 1.8 and 2.1 GHz bands with data rate ranging
from 20 Kbit/s to 7.2 Mbit/s, depending on the release
• Technology: GPRS, HSPA
Communication medium
56

Wireless
• Sometimes according to proprietary standards and protocols
• Z-Wave – for home automation • 900 MHz band (partly overlaps with 900 MHz cellular) with data
rates of 9.6 Kbit/s or 40 Kbit/s
• ANT – for sportsmen and outdoor activity monitoring, owned by Garmin
• 2.4 GHz and 1 Mbit/s data rates
• Wavenis – for M2M periodic low data rate communication • 868 MHz, 915 MHz, 433 MHz with data rates from 4.8 Kbits/s to
100 Kbits/s
• most Wavenis applications communicate at 19.2 kbits/s.
• MiWi, SimpliciTI, Digi xxx, …
Communication medium
57
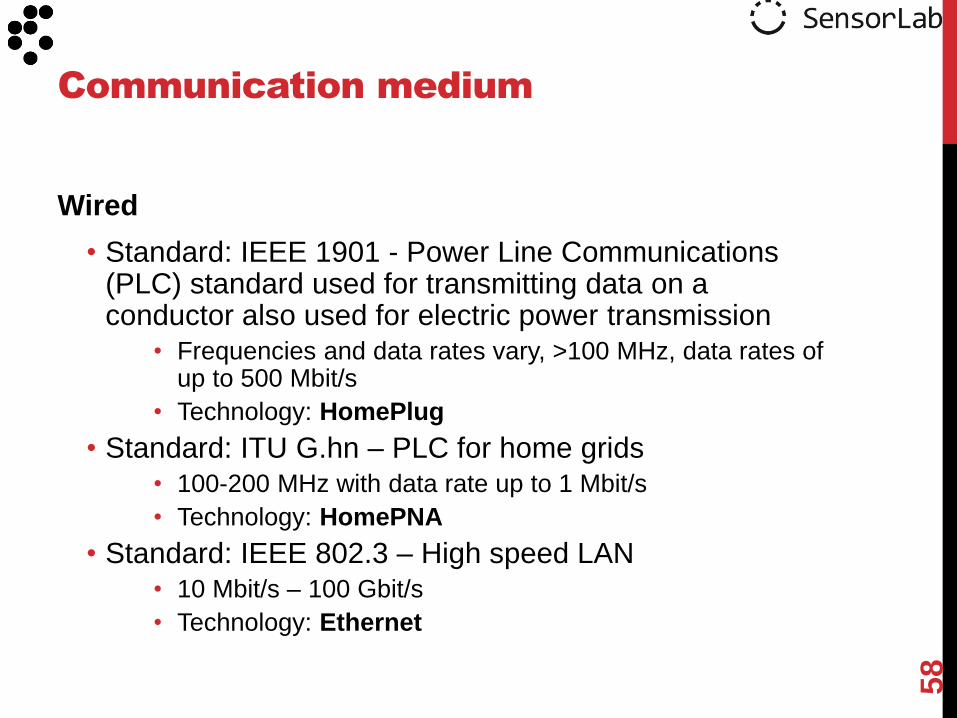
Wired
• Standard: IEEE 1901 - Power Line Communications (PLC) standard used for transmitting data on a conductor also used for electric power transmission
• Frequencies and data rates vary, >100 MHz, data rates of up to 500 Mbit/s
• Technology: HomePlug
• Standard: ITU G.hn – PLC for home grids
• 100-200 MHz with data rate up to 1 Mbit/s
• Technology: HomePNA
• Standard: IEEE 802.3 – High speed LAN
• 10 Mbit/s – 100 Gbit/s
• Technology: Ethernet
Communication medium
58
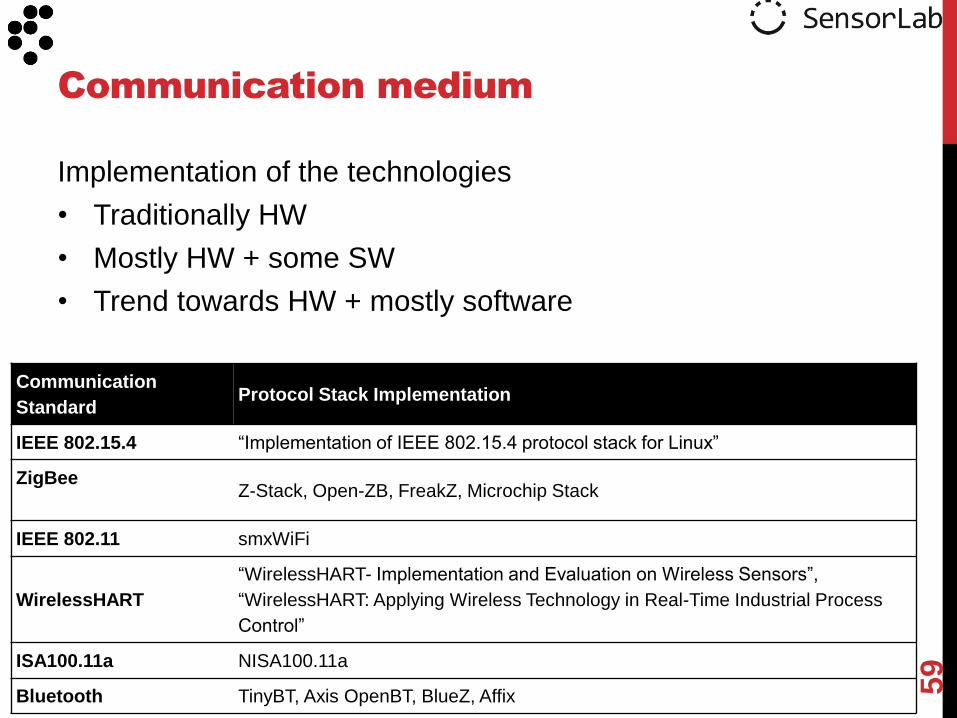
Implementation of the technologies
• Traditionally HW
• Mostly HW + some SW
• Trend towards HW + mostly software
Communication medium
59
Communication
Standard
Protocol Stack Implementation
IEEE 802.15.4 “Implementation of IEEE 802.15.4 protocol stack for Linux”
ZigBee
Z-Stack, Open-ZB, FreakZ, Microchip Stack
IEEE 802.11 smxWiFi
WirelessHART
“WirelessHART- Implementation and Evaluation on Wireless Sensors”,
“WirelessHART: Applying Wireless Technology in Real-Time Industrial Process
Control”
ISA100.11a NISA100.11a
Bluetooth TinyBT, Axis OpenBT, BlueZ, Affix
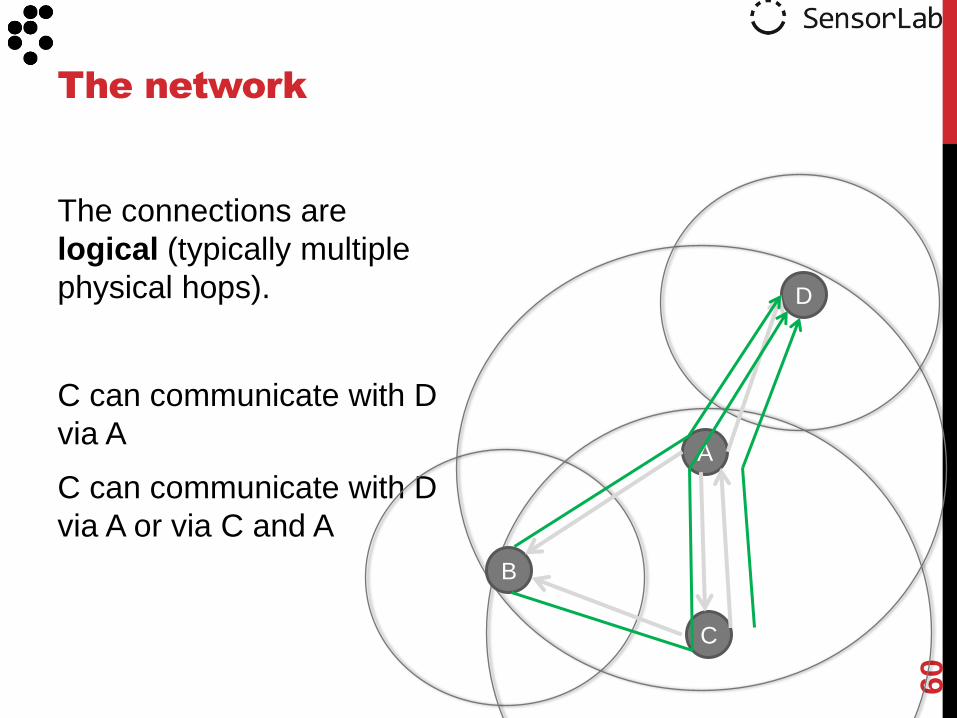
The connections are
logical (typically multiple
physical hops).
C can communicate with D
via A
C can communicate with D
via A or via C and A
The network
60
A
D
B
C

The network (or OSI Layer 3 abstraction) provides an abstraction of the physical world.
• Devices which are not physically “connected” via the communication medium can “talk” to each other
• At the network layer, only the devices and the links between them can be seen, the communication medium is hidden
• Communication protocol
• defines the functions that have to be implemented and services that have to be provided by the parties involved in the information exchange.
• In computer and sensor networks, protocols are organized as a stack and the number of layers in the stack is standard specific.
61
The network
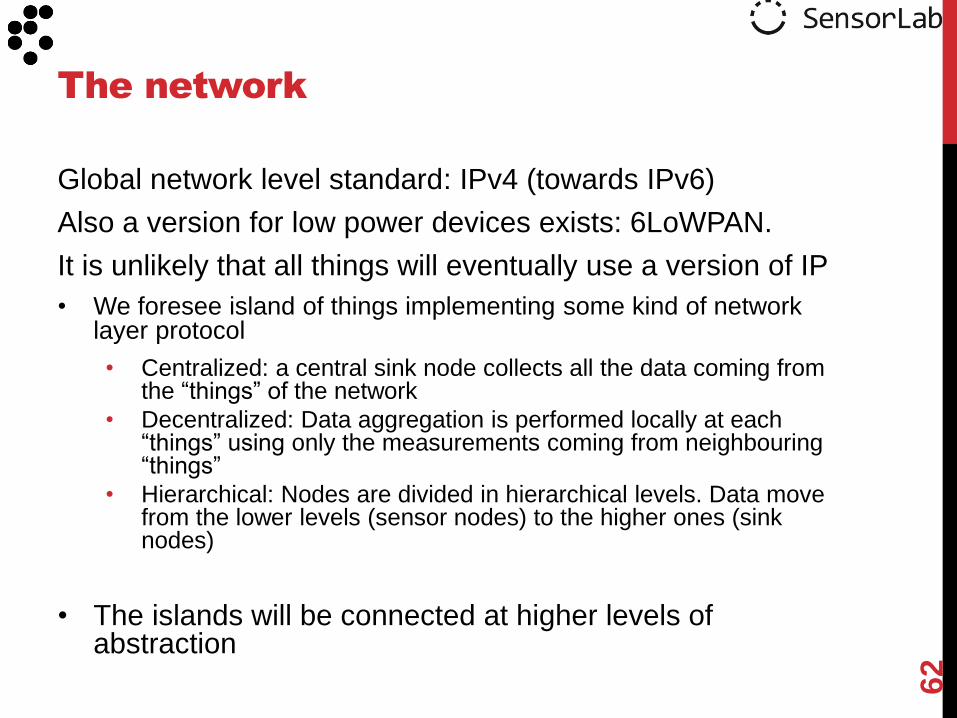
Global network level standard: IPv4 (towards IPv6)
Also a version for low power devices exists: 6LoWPAN.
It is unlikely that all things will eventually use a version of IP
• We foresee island of things implementing some kind of network layer protocol
• Centralized: a central sink node collects all the data coming from the “things” of the network
• Decentralized: Data aggregation is performed locally at each “things” using only the measurements coming from neighbouring “things”
• Hierarchical: Nodes are divided in hierarchical levels. Data move from the lower levels (sensor nodes) to the higher ones (sink nodes)
• The islands will be connected at higher levels of abstraction
62
The network

Implementation of the technologies
• SW
• On the microcontroller on the communication interface
(system on chip (SoC) and CPU+ OEM radio devices)
• On the device‟s CPU (Microcontroller + PHY/MAC Radio
devices)
• Stand alone protocol stack vs compatible/integrated
with the OS
63
The network
Communication
Standard
Protocol Stack Implementation
ZigBee
Z-Stack, Open-ZB, FreakZ, Microchip Stack
6LoWPAN NanoStack2.0, Mantus, μIPv6, BLIP

• Operating System (OS)
• abstracts task synchronization and memory
management among others from the
programmer
• Virtual Machine (VM)
• another level of abstraction which further hides
hardware specific issues from the programmer,
for instance abstracting while loops with listeners
Node centric abstractions
64

• OS running on devices with restricted
functionality
• In the case of sensor nodes, there devices
typically also have limited processing capability
• Restricted to narrow applications
• industrial controllers, robots, networking gear,
gaming consoles, metering, sensor nodes…
• Architecture and purpose of embedded OS
changes as the hardware capabilities change
(i.e. mobile phones)
Embedded Operating system
65
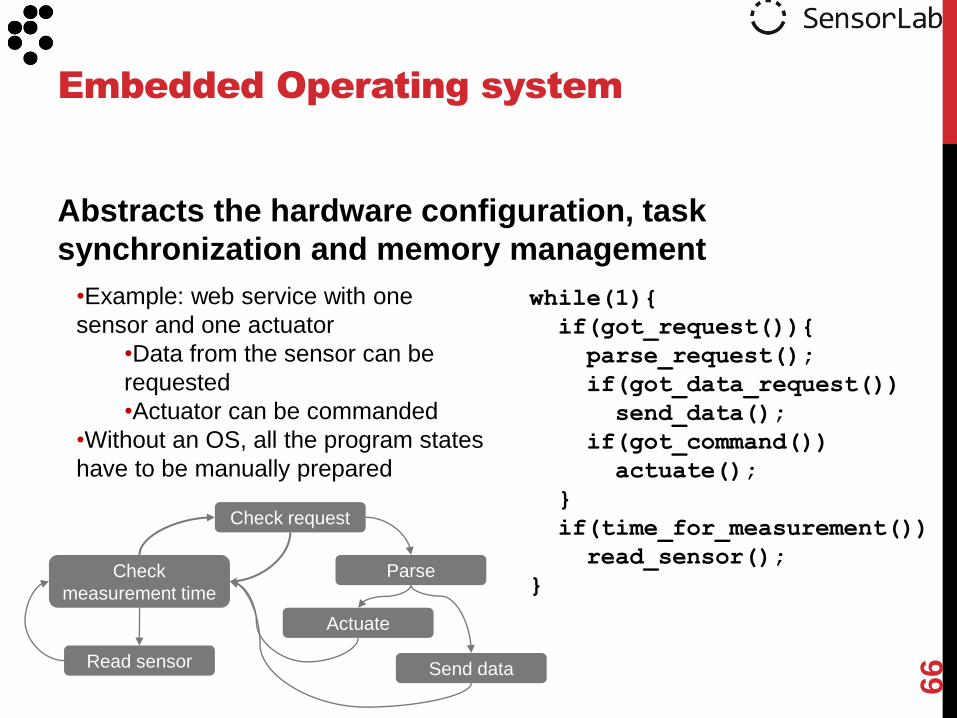
Abstracts the hardware configuration, task
synchronization and memory management
Embedded Operating system
66
while(1){
if(got_request()){
parse_request();
if(got_data_request())
send_data();
if(got_command())
actuate();
}
if(time_for_measurement())
read_sensor();
}
•Example: web service with one
sensor and one actuator
•Data from the sensor can be
requested
•Actuator can be commanded
•Without an OS, all the program states
have to be manually prepared
Check request
Check
measurement time
Parse
Send data
Actuate
Read sensor
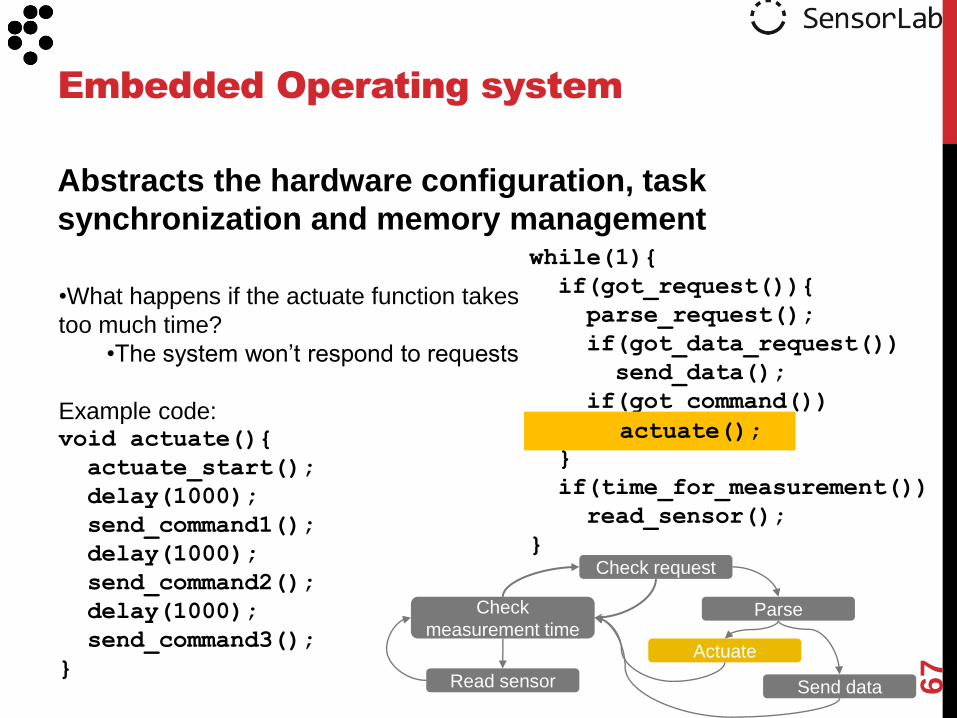
Abstracts the hardware configuration, task
synchronization and memory management
Embedded Operating system
67
while(1){
if(got_request()){
parse_request();
if(got_data_request())
send_data();
if(got_command())
actuate()
}
if(time_for_measurement())
read_sensor();
} Check request
Check
measurement time Parse
Send data
Actuate
Read sensor
actuate();
•What happens if the actuate function takes
too much time?
•The system won‟t respond to requests
Example code: void actuate(){
actuate_start();
delay(1000);
send_command1();
delay(1000);
send_command2();
delay(1000);
send_command3();
}

Abstracts the hardware configuration, task
synchronization and memory management
Embedded Operating system
68
Check request
Check
measurement time
Parse
Send data
Set actuate
Read sensor
•What happens if the actuate function takes
too much time?
•The system won‟t respond to requests
•Workaround is possible, but it needs a
lot of effort and it‟s error-prone
Check actuate
Actuate start
Send command1
Send command2
void actuate(){
actuate_start();
delay(1000);
send_command1();
delay(1000);
send_command2();
delay(1000);
send_command3();
}

Abstracts the hardware configuration, task
synchronization and memory management
Embedded Operating system
69
•With an OS, switching between tasks is
simple
PROCESS_THREAD(actuate){
while(1){
PROCESS_WAIT_EVENT();
actuate_init();
PROCESS_WAIT(1000);
send_command1();
PROCESS_WAIT(1000);
send_command2();
PROCESS_WAIT(1000);
send_command3();
}
}
Wait for request
Wait for
measurement time
Parse
Send data
Send event
Read sensor
Actuate start
Send command1 Send command2
Send command3
Wait
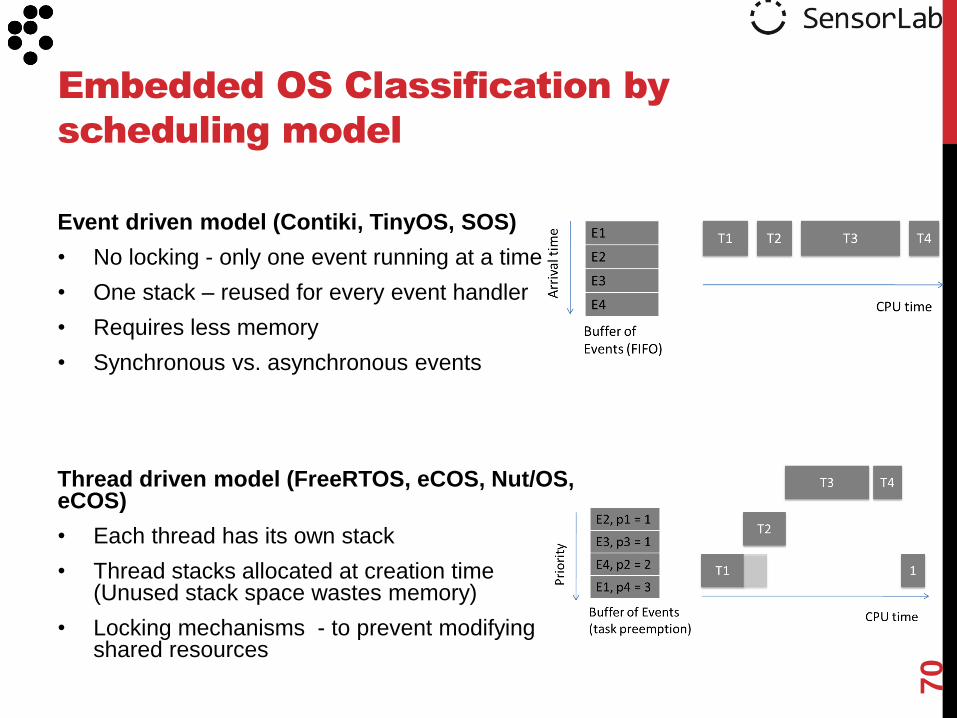
Event driven model (Contiki, TinyOS, SOS)
• No locking - only one event running at a time
• One stack – reused for every event handler
• Requires less memory
• Synchronous vs. asynchronous events
Thread driven model (FreeRTOS, eCOS, Nut/OS, eCOS)
• Each thread has its own stack
• Thread stacks allocated at creation time (Unused stack space wastes memory)
• Locking mechanisms - to prevent modifying shared resources
Embedded OS Classification by
scheduling model
70
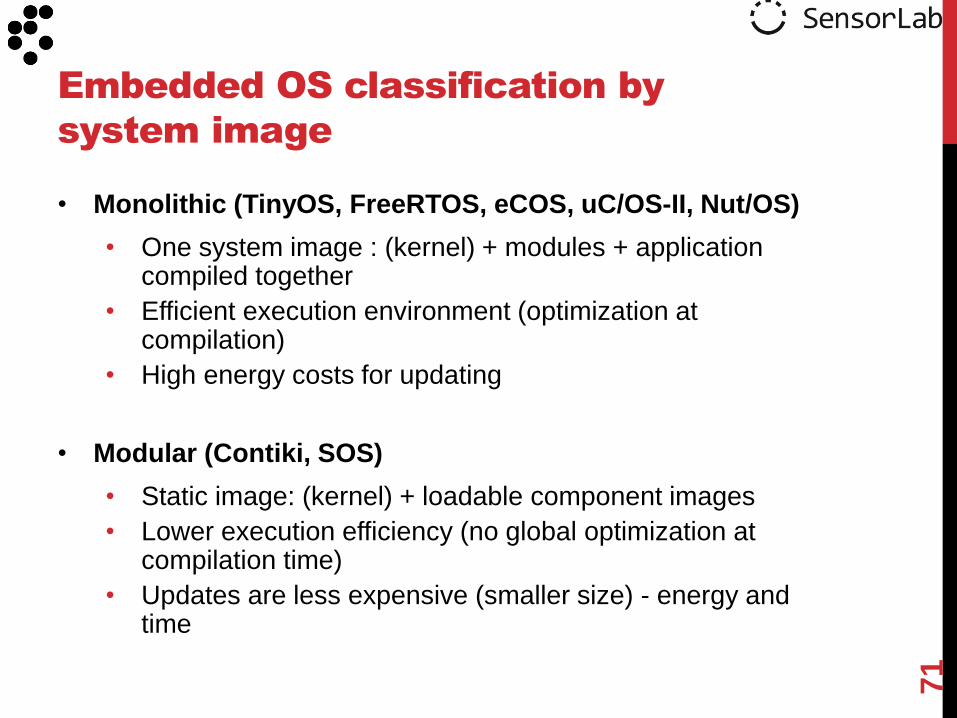
• Monolithic (TinyOS, FreeRTOS, eCOS, uC/OS-II, Nut/OS)
• One system image : (kernel) + modules + application compiled together
• Efficient execution environment (optimization at compilation)
• High energy costs for updating
• Modular (Contiki, SOS)
• Static image: (kernel) + loadable component images
• Lower execution efficiency (no global optimization at compilation time)
• Updates are less expensive (smaller size) - energy and time
Embedded OS classification by
system image
71

72
Embedded OS comparison
Name Sched. Mem.
Mgmt.
Kernel Image/Re
(programming)
Foot
Protocol stack VM Dev. status/
reliability
Doc
and
supp
eCOS Thread,
preempt
Multiple
stacks,
static
Yes Monolithic, no variable lwIP, FreeBSD
TCP/IP
(yes) Yes/(yes) yes
uC/OS-II Thread,
preempt
Multiple
stacks,
static
Yes (Monolithic, no) variable uC/TCP-IP (no) Yes/(yes) limited
FreeRTOS Thread,
preempt
(Multiple
stacks,
static)
Yes (Monolithic, no) variable lwIP (no) Yes/(yes) yes
Nut/OS Thread,
preempt
Multiple
stack,
Dynamic
Yes Monolithic, (no) variable BTNut, Nut/Net
(TCP/IP)
(no) Yes/(yes) limited
TinyOS Event,
(thread)
Single
stack,
Static
No Monolithic,
wireless
variable CC100, CC2420,
TinyBt, serial
yes Yes/yes yes
SOS Event Single,
dynamic
Yes Modular, variable message (no) No/no limited
Contiki Event,
thread
Yes Modular,
wireless
variable yes Yes/(no) yes
A virtual machine is a software implementation of a machine and
provides a level of abstraction over the physical machine.
VM for embedded systems
• Replace the operating system
• Add extra functionality to the operating system (memory management)
• Provide a friendlier application development environment
Virtual machine
73
• System VM
• virtualize hardware resources and can run directly on hardware.
• In embedded systems they implement functions of the OS and completely replace it
• Squawk, .NET Micro
• Application (process) VM
• typically run on top of an OS as an application and support a single process.
• Mate, Darjeeling, VM*, SwissQM, CVM, DVM
Classification of virtual machines
74
75
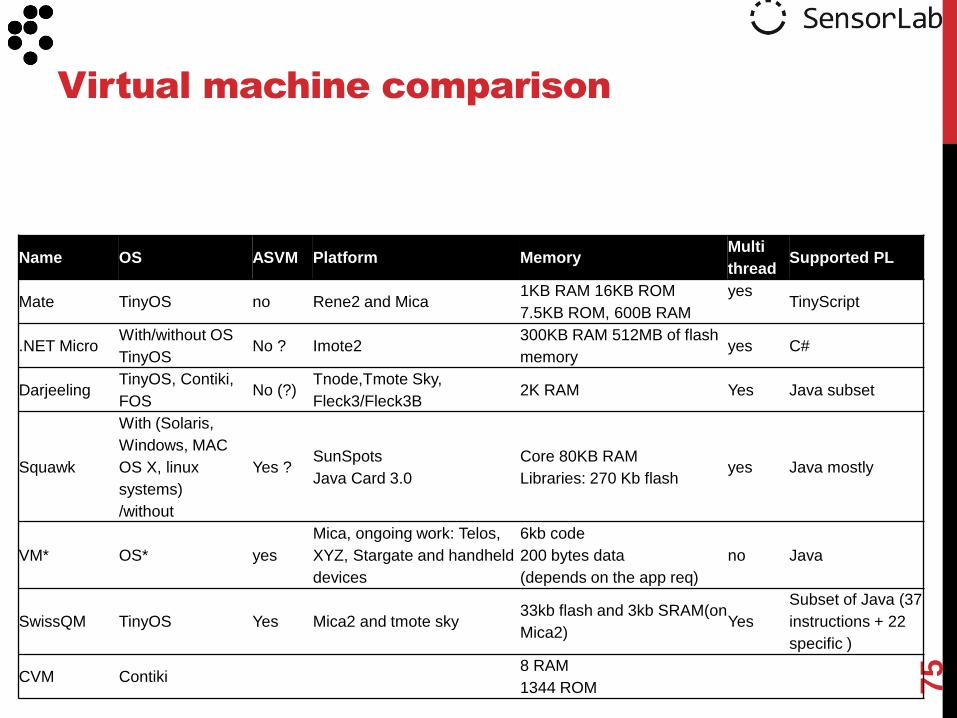
Virtual machine comparison
Name OS ASVM Platform Memory Multi
thread Supported PL
Mate TinyOS no Rene2 and Mica 1KB RAM 16KB ROM
7.5KB ROM, 600B RAM
yes
TinyScript
.NET Micro With/without OS
TinyOS No ? Imote2
300KB RAM 512MB of flash
memory yes C#
Darjeeling TinyOS, Contiki,
FOS No (?)
Tnode,Tmote Sky,
Fleck3/Fleck3B 2K RAM Yes Java subset
Squawk
With (Solaris,
Windows, MAC
OS X, linux
systems)
/without
Yes ? SunSpots
Java Card 3.0
Core 80KB RAM
Libraries: 270 Kb flash yes Java mostly
VM* OS* yes
Mica, ongoing work: Telos,
XYZ, Stargate and handheld
devices
6kb code
200 bytes data
(depends on the app req)
no Java
SwissQM TinyOS Yes Mica2 and tmote sky 33kb flash and 3kb SRAM(on
Mica2) Yes
Subset of Java (37
instructions + 22
specific )
CVM Contiki 8 RAM
1344 ROM
• Trade-off between the resources needed and the
services they provide
• Advantage
• Reduce the distribution energy costs for software
updates
• VM code smaller than native machine code
• Simpler reprogramming process
• Disadvantage
• Additional overhead
• Increased time and memory requirements for execution
• Increased energy spent in interpreting the code
Are virtual machines necessary?
76
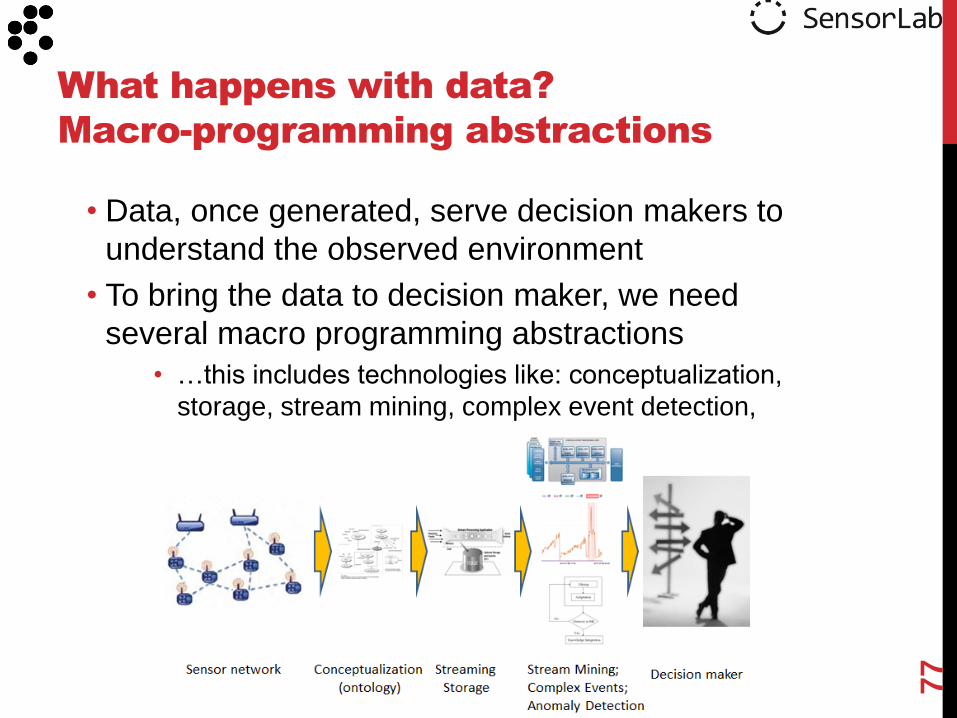
• Data, once generated, serve decision makers to
understand the observed environment
• To bring the data to decision maker, we need
several macro programming abstractions
• …this includes technologies like: conceptualization,
storage, stream mining, complex event detection,
anomaly detection
What happens with data?
Macro-programming abstractions
77

• Semantic streams
• K. Whitehouse, F. Zhao, J. Liu, Semantic Streams: a Framework for Composable Semantic Interpretation of Sensor Data, 2005.
• TinyDB
• A Declarative Databse for Sensor Networks, http://telegraph.cs.berkeley.edu/tinydb/
• Logical neighbourhoods
• L. Mottola, Programming Wireless Sensor Networks: From Physical to Logical Neighborhoods, PhD Thesis, 2009.
Macro-programming abstractions
78
Web Of Things
• What is it? What problems can it solve?
Architectural considerations
• How it looks like? What are its components?
The “Things”
• What are the ingredients?
The “Glue”
• How do things stick together?
Applications and services
• What can be built on top of it?
Quick start recipes
• How does the “Hello World!” look lilke?
Part I. Motivation & background
outline
79

Combine data, presentation or functionality from
several sources (mash-up) to create new services.
Things generate only part of the data sources
Apps and services
80
Applications
Web publishing
Traffic today app
RSS feed
Apps and
Services

81
Applications and services
Agriculture
eHealth
Sport
Military
Environmental monitoring
Smart House
Industrial Processes
Transportation
Logistics
Advertising
Social Networks Marketing
Security
Safety
Emergency
Smart infrastructures
Lighting
Electricity
Water
Gas
Web Of Things
• What is it? What problems can it solve?
Architectural considerations
• How it looks like? What are its components?
The “Things”
• What are the ingredients?
The “Glue”
• How do things stick together?
Applications and services
• What can be built on top of it?
Quick start recipes
• How does the “Hello World!” look like?
Part I. Motivation & background
outline
82
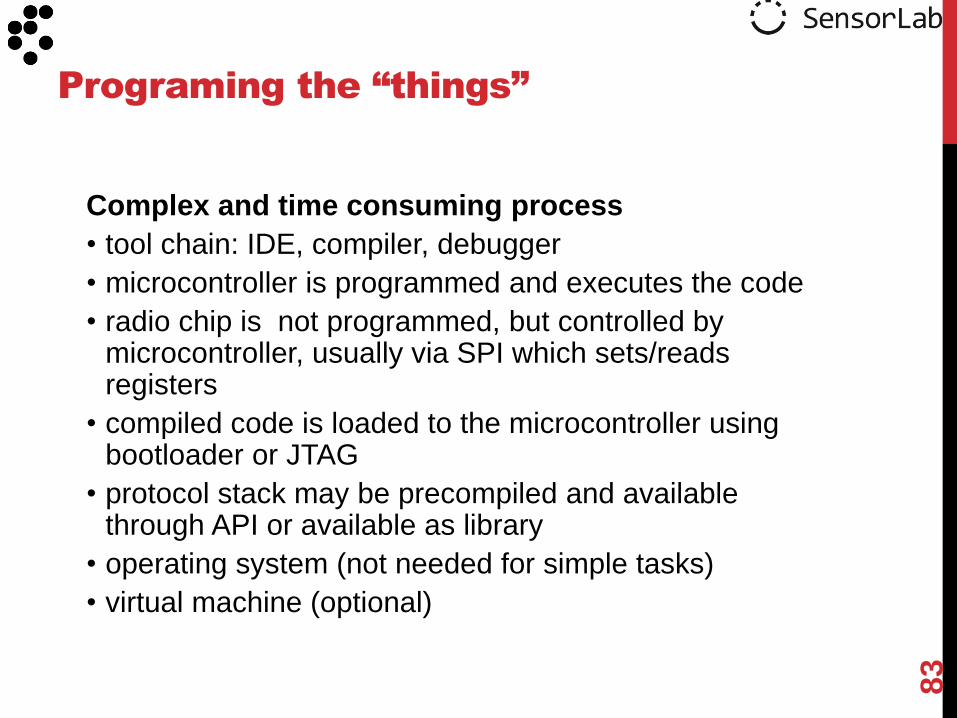
Complex and time consuming process
• tool chain: IDE, compiler, debugger
• microcontroller is programmed and executes the code
• radio chip is not programmed, but controlled by microcontroller, usually via SPI which sets/reads registers
• compiled code is loaded to the microcontroller using bootloader or JTAG
• protocol stack may be precompiled and available through API or available as library
• operating system (not needed for simple tasks)
• virtual machine (optional)
Programing the “things”
83

Before starting, the following questions should be answered:
What is the scope or application?
• Monitoring measurements?
What is the scenario?
• A thing with embedded web service?
• A set of things connected through a gateway?
What programming language?
• Options: C, nesC, Java. C#
What is the publishing infrastructure?
• None, custom, third party.
Decision process
84
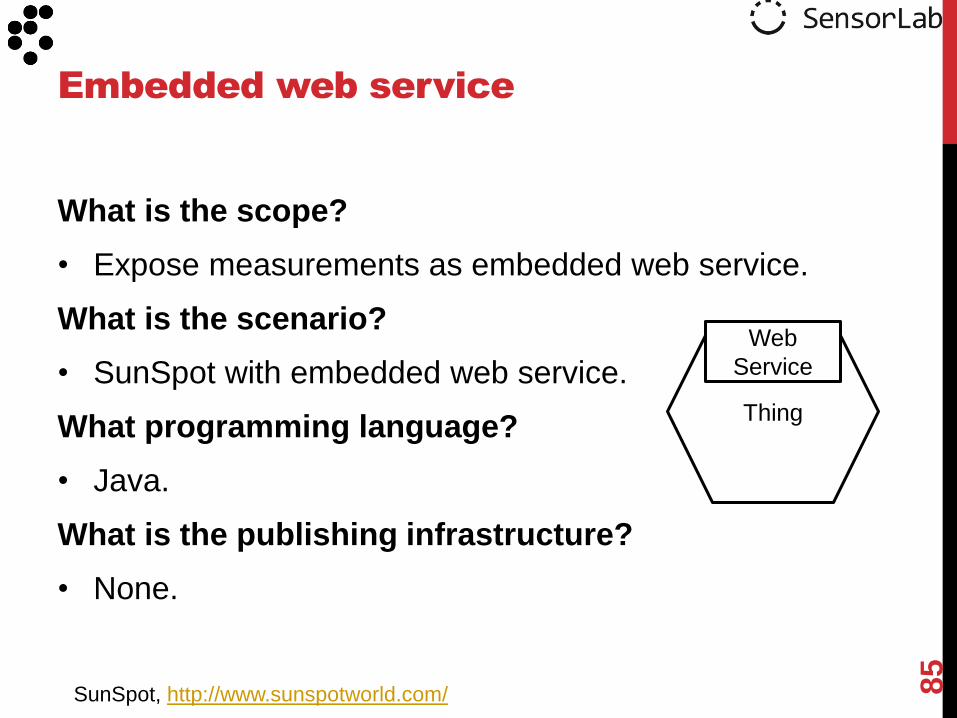
What is the scope?
• Expose measurements as embedded web service.
What is the scenario?
• SunSpot with embedded web service.
What programming language?
• Java.
What is the publishing infrastructure?
• None.
Embedded web service
85
SunSpot, http://www.sunspotworld.com/
Thing
Web
Service

• this is the simplest scenario
• the easiest implementation assumes connecting the thing to an IP enabled machine through which access to the embedded web service can be provided from the internet
• Request: http://.../spot1/sensors/temperature requests the resource “temperature” of the resource “sensor” of “spot1”1
86
Embedded web service
GET http://IP:Port/service
Non-IP
IP
SunSpot
Web
Service
Machine
(IP)
User
machine
(IP)
1D. Guinard, V. Trifa, S. Karnouskos, P. Spiess, D. Savio, Interacting with
the SOA-based Internet of Things: Discovery, Query, Selection and
On-Demand Provisioning of Web Services, IEEE Transactions on
Services Computing, Vol. 3, July-Sept 2010.

What is the scope?
• Publish measurements on the web.
What is the scenario?
• SunSpot.
• Pachube account, registered feed, API key.
What programming language?
• Java.
What is the publishing infrastructure?
• Pachube.
Publish measurements
87
Thing
IP
Web
Service
SunSpot, http://www.sunspotworld.com/
Pachube, http://www.pachube.com/
IP
88
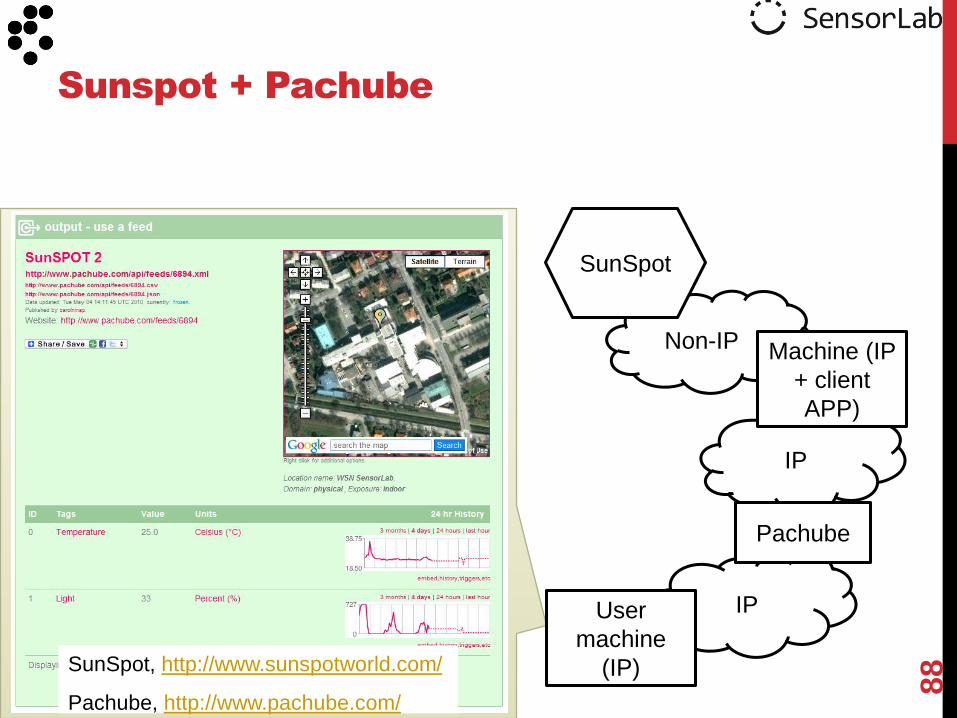
Sunspot + Pachube
IP
Pachube
Non-IP
SunSpot
Machine (IP
+ client
APP)
User
machine
(IP) SunSpot, http://www.sunspotworld.com/
Pachube, http://www.pachube.com/
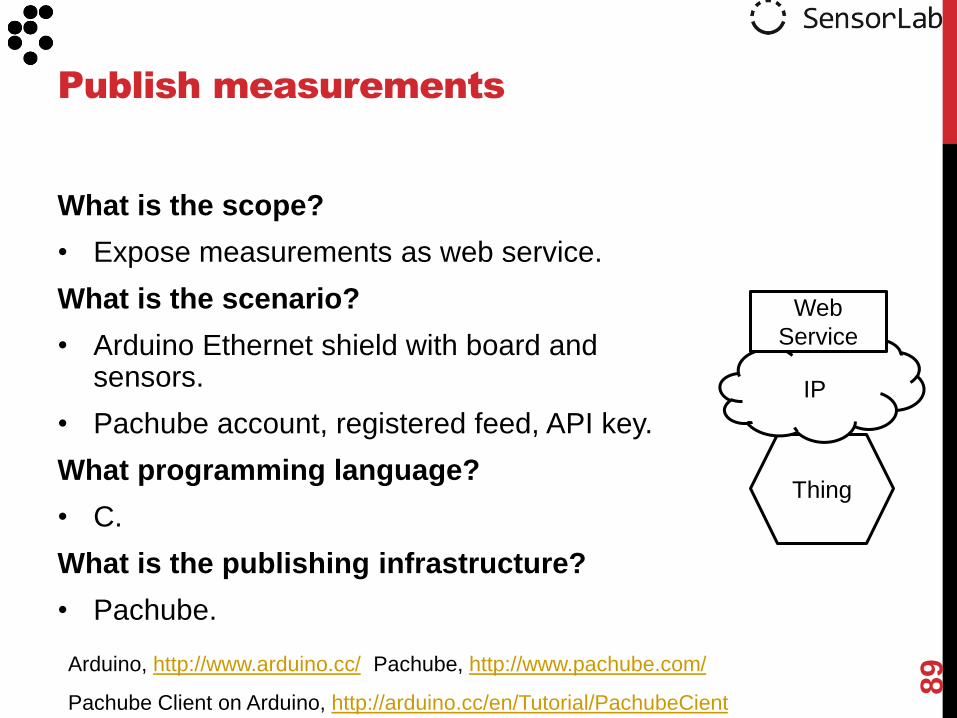
What is the scope?
• Expose measurements as web service.
What is the scenario?
• Arduino Ethernet shield with board and sensors.
• Pachube account, registered feed, API key.
What programming language?
• C.
What is the publishing infrastructure?
• Pachube.
Publish measurements
89
Thing
IP
Web
Service
Arduino, http://www.arduino.cc/ Pachube, http://www.pachube.com/
Pachube Client on Arduino, http://arduino.cc/en/Tutorial/PachubeCient

90
Arduino + Pachube
IP
IP
Pachube
Arduino
Ethershield
User
machine
(IP)
Arduino, http://www.arduino.cc/ Pachube, http://www.pachube.com/
Pachube Client on Arduino, http://arduino.cc/en/Tutorial/PachubeCient
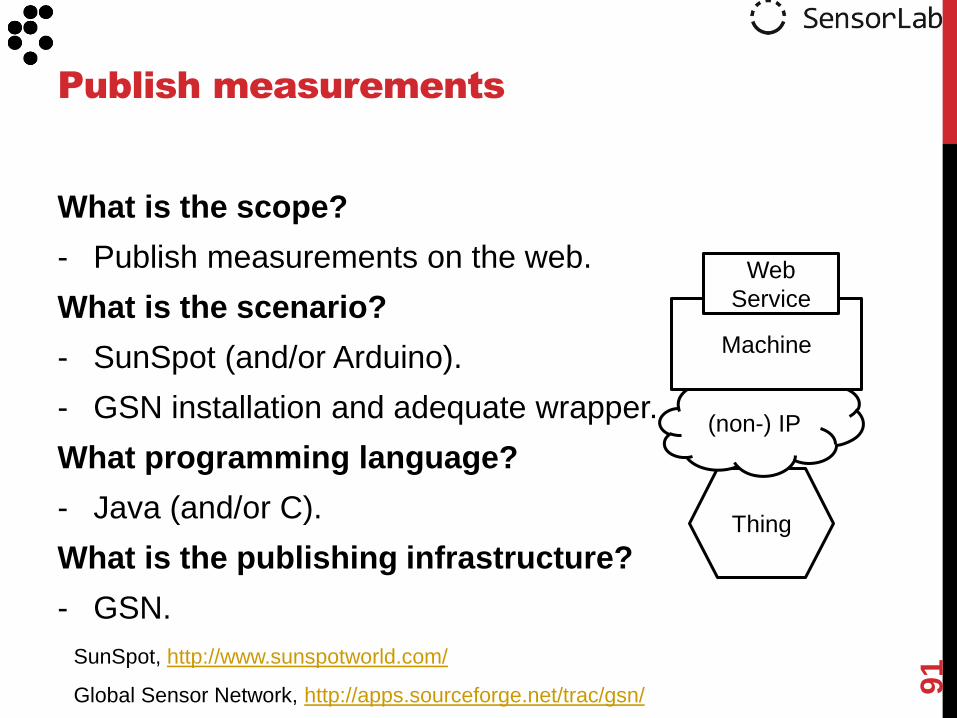
What is the scope?
- Publish measurements on the web.
What is the scenario?
- SunSpot (and/or Arduino).
- GSN installation and adequate wrapper.
What programming language?
- Java (and/or C).
What is the publishing infrastructure?
- GSN.
Publish measurements
91 SunSpot, http://www.sunspotworld.com/
Global Sensor Network, http://apps.sourceforge.net/trac/gsn/
Thing
(non-) IP
Machine
Web
Service
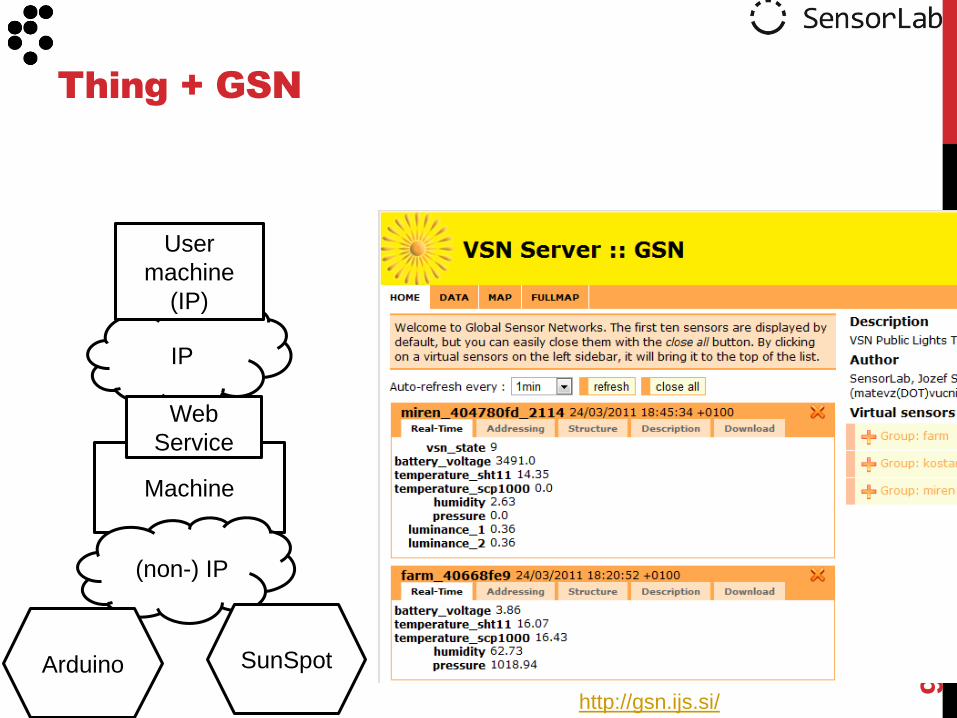
92
Thing + GSN
IP
Machine
Web
Service
(non-) IP
Arduino SunSpot
User
machine
(IP)
http://gsn.ijs.si/

Do you want to work with “things” that are under your
direct control?
Things:
• Easy to use with a wide community support are
Arduino and SunSpot.
• Crossbow, Libellium, Sensinode, etc. are also
possible solutions but may require more effort.
• For very specific solutions you may need to go for
hardware design.
93
How to start?
Do you want to just publish the data?
Solutions:
• Pachube is straightforward but functionality is
limited. There are various types of fee based
accounts which offer additional functionality.
• GSN is free and can be customized, the code is
open source.
• Sensorpedia, Sensor.Network and other solutions
are still in early stages.
94
How to start?

The concept of Web of Things was discussed
A list of relevant use cases and application areas
• Power grids
• Transport systems
• Water distribution
• Logistics
• Industrial automation
• Health
• Environmental intelligence
Architectural considerations and possible components of vertical systems were discussed and the components classified in:
• The “Things”
• The “Glue”
• Apps & Services
95
Summary

A decision process for how to start setting up a Web of
Things system
• Programming things is time consuming
Quick start scenarios were presented in increasing
order of complexity
• Things with embedded web services
• Things to an existing data management
infrastructure
• Things to self deployed data management
infrastructure
96
Summary

Part I. Motivation & background
Part II. Technology and tools for exploiting the WoT
Part III. Demos, Tools & Research directions
97
Outline

Part II. Technology and tools for WoT data
Information infrastructure for “Web of Things”
Conceptualization of sensors domain
Stream Data Processing
Stream Mining
Complex Event Processing
Anomaly Detection
98
Outline

INFORMATION INFRASTRUCTURE
FOR “WEB OF THINGS”

…the key objective is to make decision maker more
efficient by understanding observed environment
Why we need WoT?
Decision maker Sensor network
100
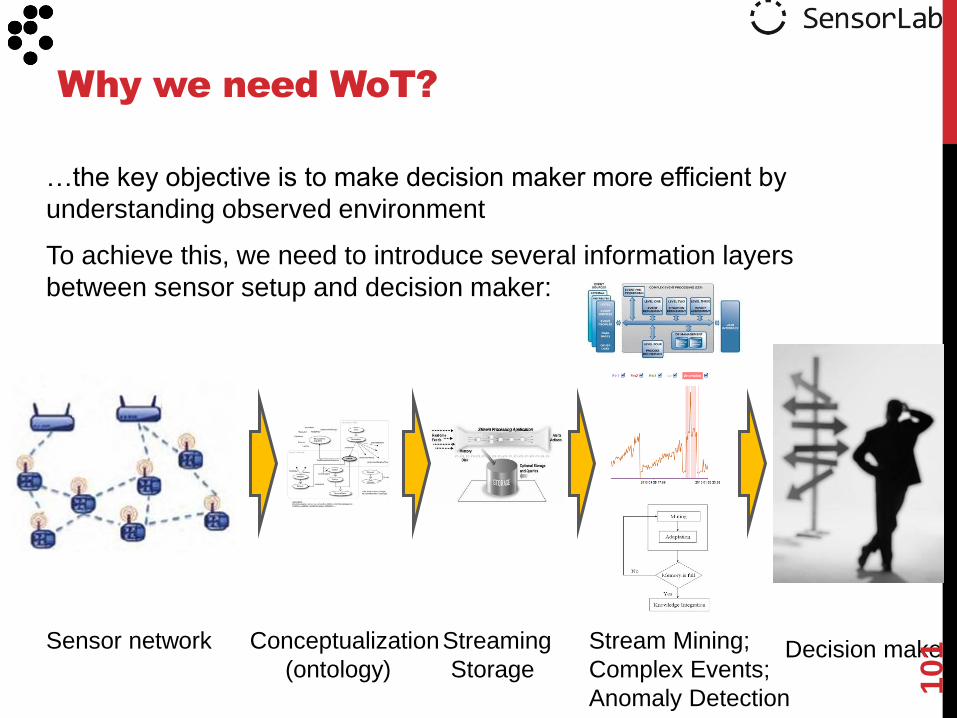
…the key objective is to make decision maker more efficient by
understanding observed environment
To achieve this, we need to introduce several information layers
between sensor setup and decision maker:
Why we need WoT?
Decision maker Sensor network Conceptualization
(ontology)
Streaming
Storage
Stream Mining;
Complex Events;
Anomaly Detection
101

In this part we will review approaches on
• How to conceptualize sensor domain?
• How to process streaming data?
• How to detect complex events?
• How to perform mining on streaming data?
• How to detect anomalies?
Outline of this part of the talk
102
CONCEPTUALIZATION OF SENSOR
DOMAIN
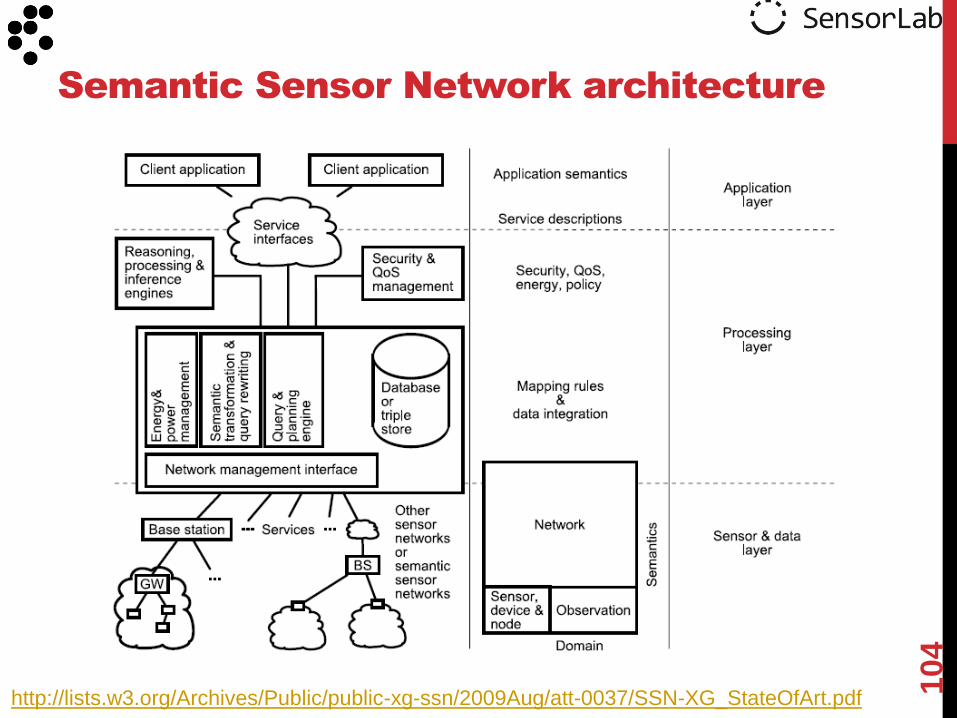
Semantic Sensor Network architecture
http://lists.w3.org/Archives/Public/public-xg-ssn/2009Aug/att-0037/SSN-XG_StateOfArt.pdf
104
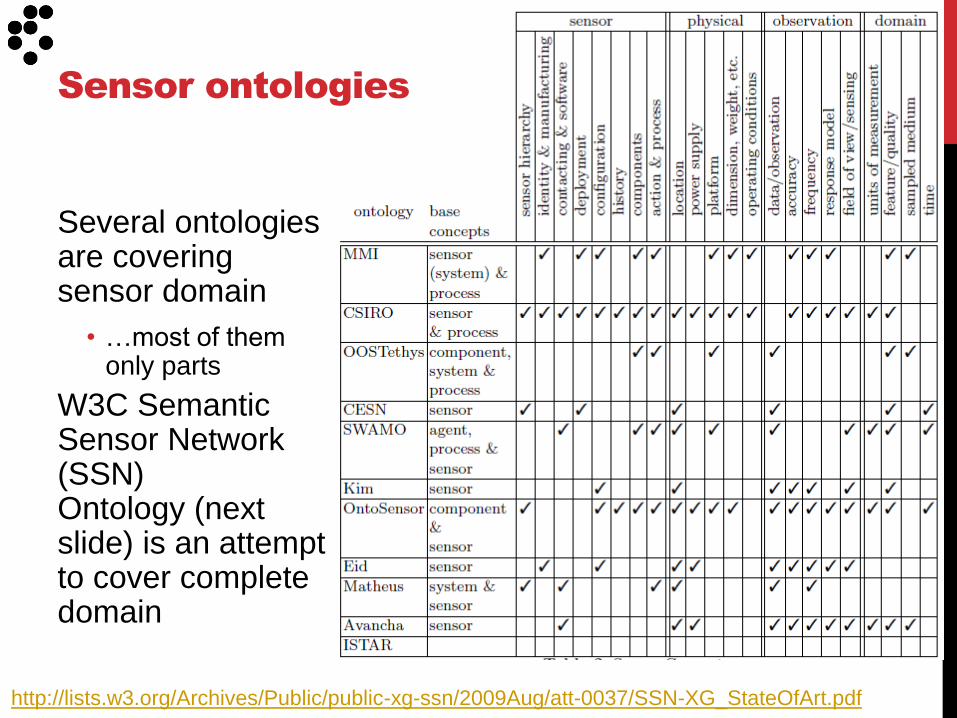
Several ontologies are covering sensor domain
• …most of them only parts
W3C Semantic Sensor Network (SSN) Ontology (next slide) is an attempt to cover complete domain
Sensor ontologies
http://lists.w3.org/Archives/Public/public-xg-ssn/2009Aug/att-0037/SSN-XG_StateOfArt.pdf

106
W3C Semantic Sensor Network (SSN)
ontology structure
http://www.w3.org/2005/Incubator/ssn/wiki/Main_Page
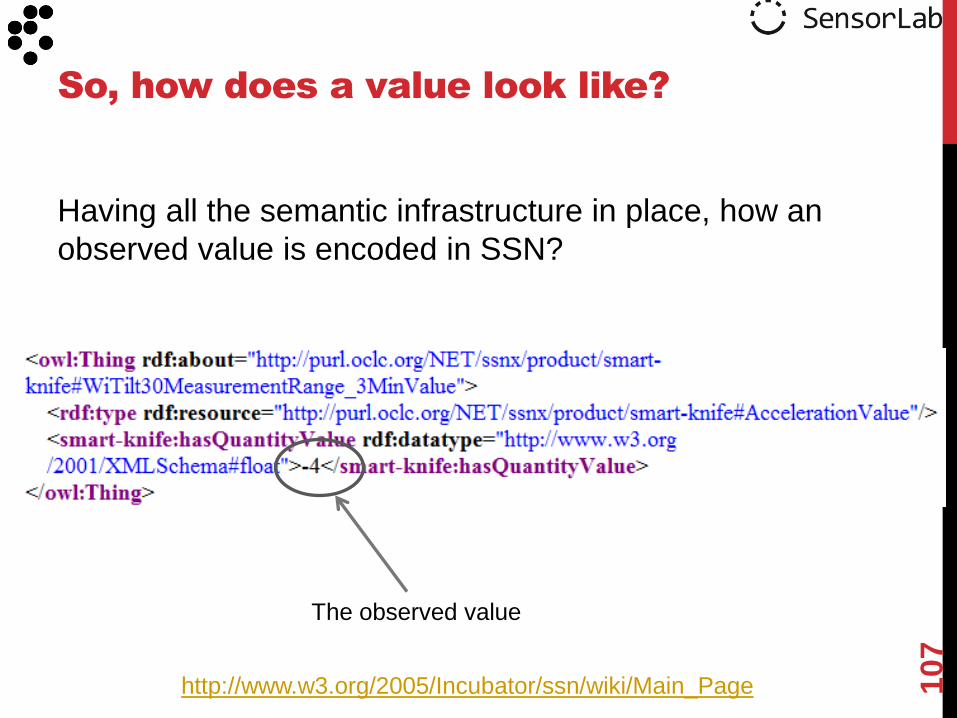
Having all the semantic infrastructure in place, how an
observed value is encoded in SSN?
107
So, how does a value look like?
http://www.w3.org/2005/Incubator/ssn/wiki/Main_Page
The observed value
STREAM DATA PROCESSING
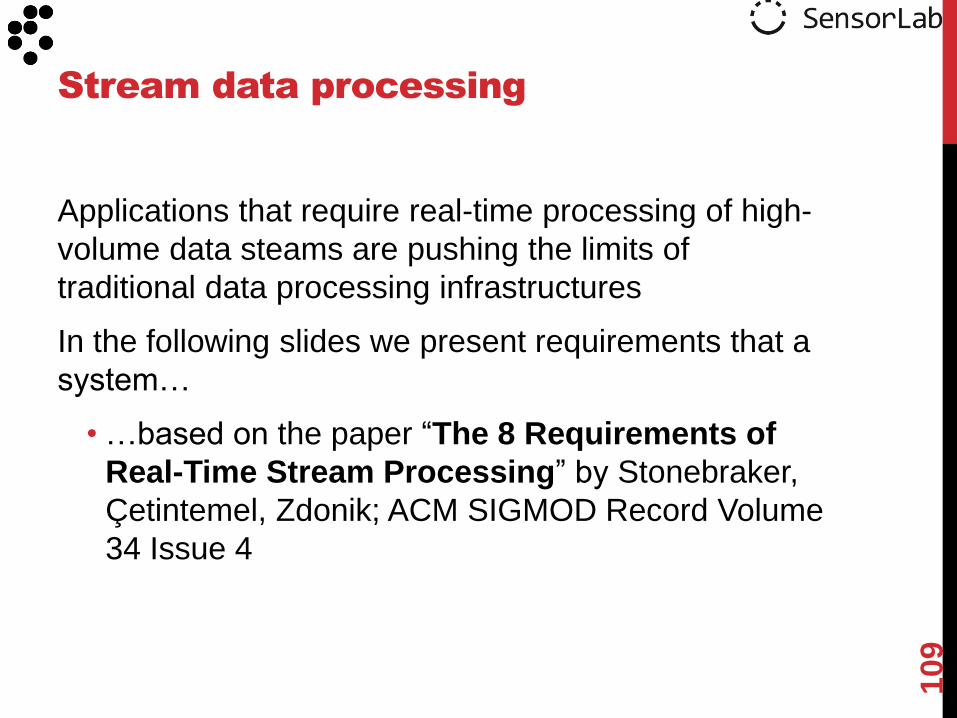
Applications that require real-time processing of high-
volume data steams are pushing the limits of
traditional data processing infrastructures
In the following slides we present requirements that a
system…
• …based on the paper “The 8 Requirements of
Real-Time Stream Processing” by Stonebraker,
Çetintemel, Zdonik; ACM SIGMOD Record Volume
34 Issue 4
Stream data processing
109

Rule 1: Keep the Data Moving
• Processing messages “in-stream”, without requirements to store them; ideally the system should also use an active (i.e., non-polling)
Rule 2: Query using SQL on Streams
• High-level SQL like language with built-in extensible stream oriented primitives and operators
Rule 3: Handle Stream Imperfections
• Dealing with stream “imperfections”, including missing and out-of-order data, which are commonly present in real-world data streams
Rule 4: Generate Predictable Outcomes
Eight rules for stream processing
(1/2)
11
0
http://www.complexevents.com/2006/06/30/the-eight-rules-of-real-time-stream-processing/

Rule 5: Integrate Stored and Streaming Data
• Combining stored with live streaming data
Rule 6: Guarantee Data Safety and Availability
• Integrity of the data maintained at all times, despite failures
Rule 7: Partition and Scale Applications Automatically
• Distribute its processing across multiple processors and machines to achieve incremental scalability
Rule 8: Process and Respond Instantaneously
• Minimal-overhead execution engine to deliver real-time response
Eight rules for stream processing
(2/2)
111
http://www.complexevents.com/2006/06/30/the-eight-rules-of-real-time-stream-processing/
11
2
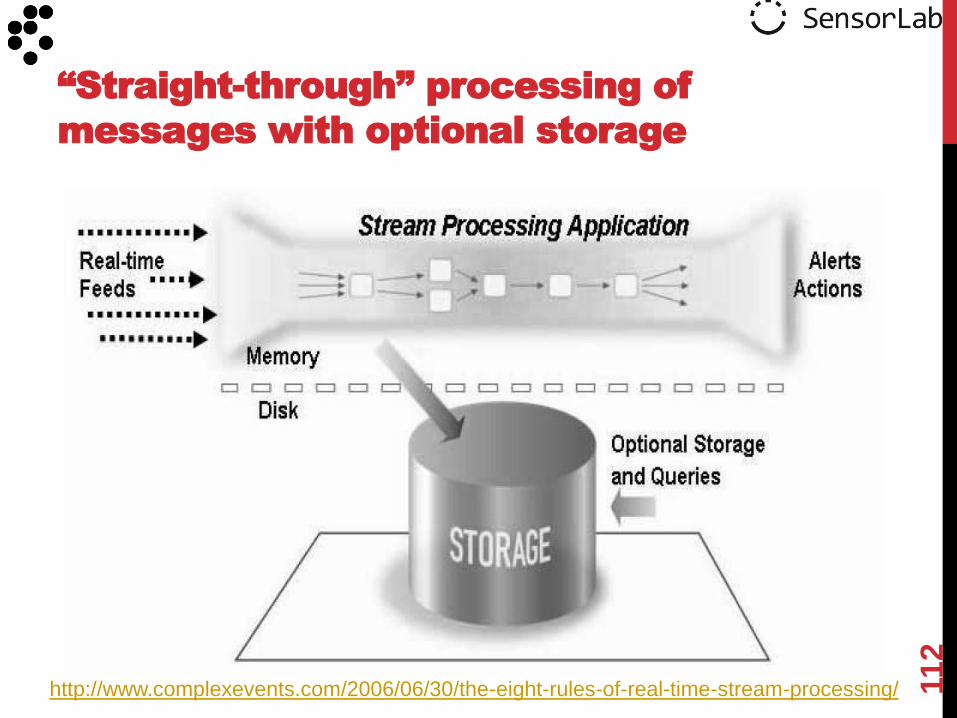
“Straight-through” processing of
messages with optional storage
http://www.complexevents.com/2006/06/30/the-eight-rules-of-real-time-stream-processing/
http://www.complexevents.com/2006/06/30/the-eight-rules-of-real-time-stream-processing/ 11
3
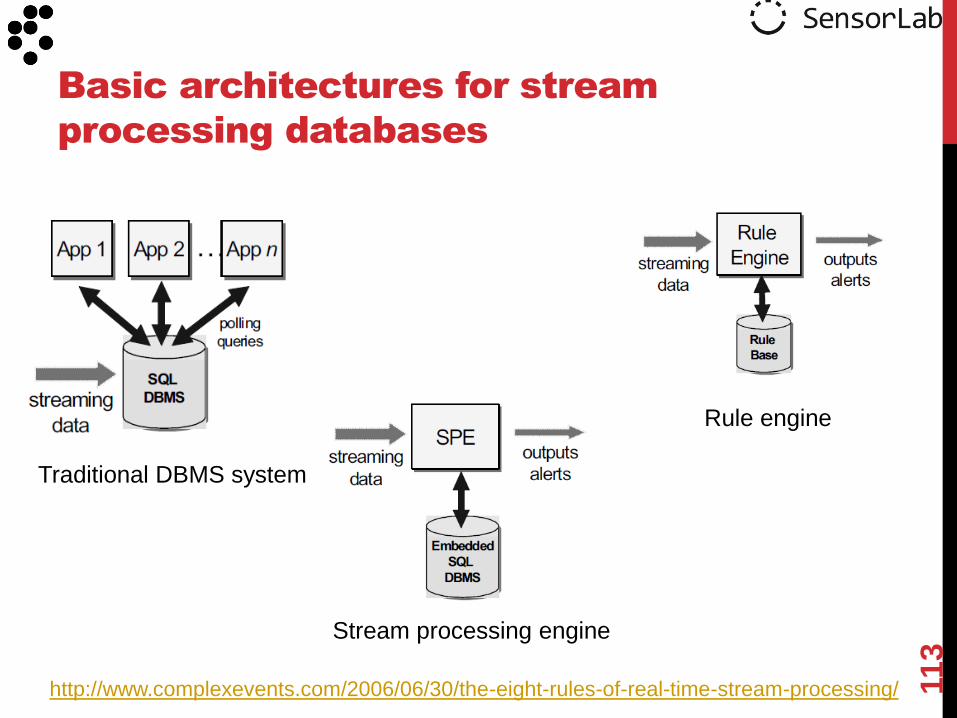
Basic architectures for stream
processing databases
Traditional DBMS system
Rule engine
Stream processing engine

11
4
The capabilities of various
systems software
http://www.complexevents.com/2006/06/30/the-eight-rules-of-real-time-stream-processing/

COMPLEX EVENT PROCESSING
11
6
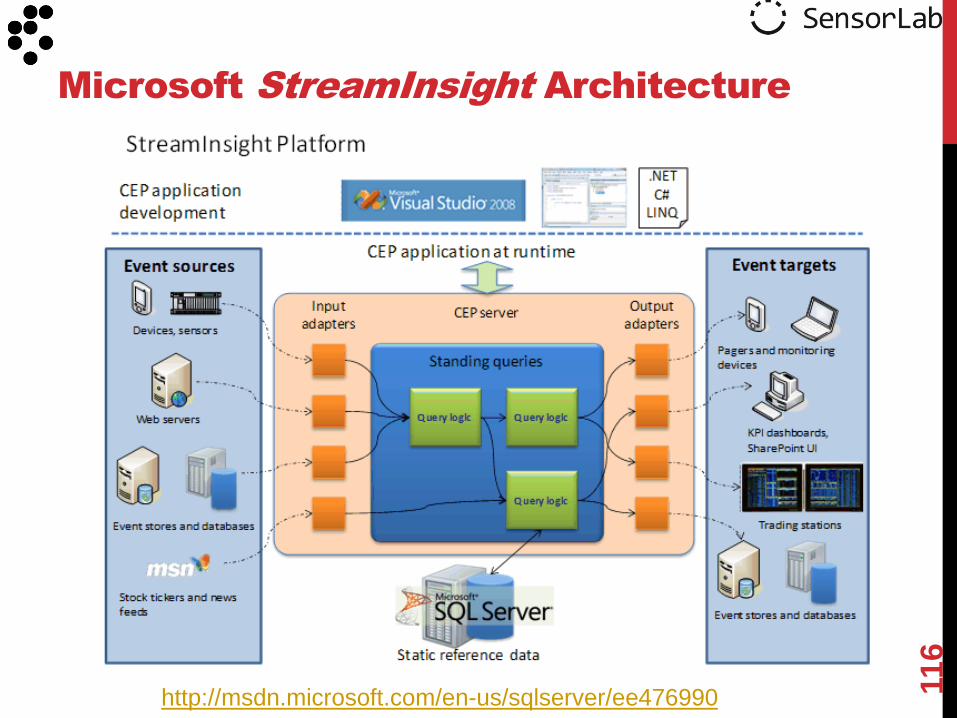
Microsoft StreamInsight Architecture
http://msdn.microsoft.com/en-us/sqlserver/ee476990
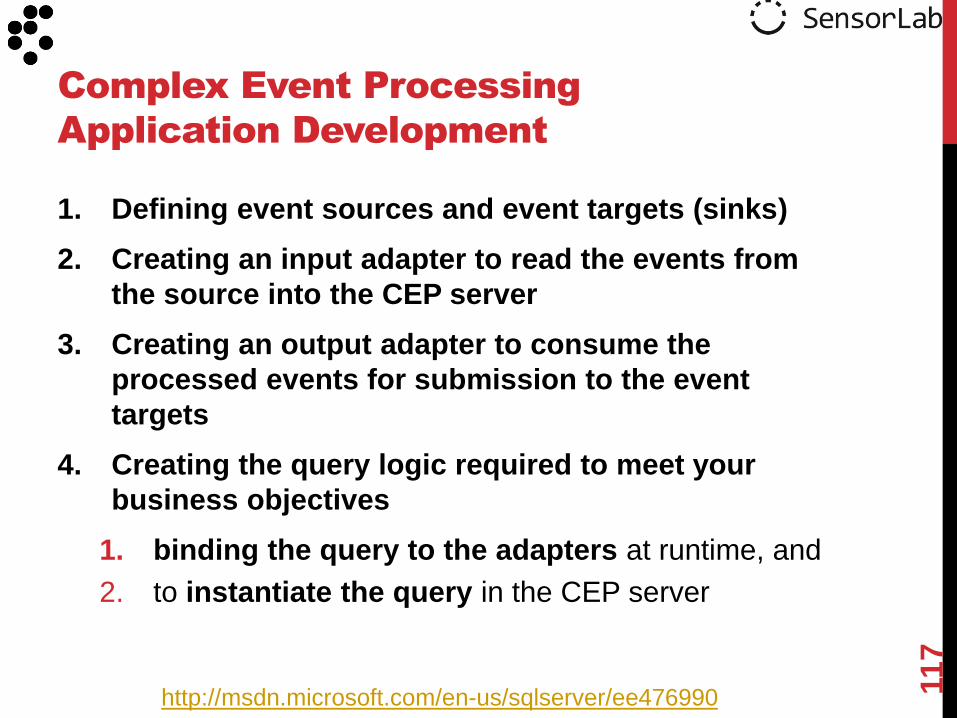
1. Defining event sources and event targets (sinks)
2. Creating an input adapter to read the events from
the source into the CEP server
3. Creating an output adapter to consume the
processed events for submission to the event
targets
4. Creating the query logic required to meet your
business objectives
1. binding the query to the adapters at runtime, and
2. to instantiate the query in the CEP server
Complex Event Processing
Application Development
11
7
http://msdn.microsoft.com/en-us/sqlserver/ee476990

Filtering of events
• from e in inputStream where e.value < 10 select e;
Calculations to introduce additional event properties
• from e in InputStream select new MeterWattage {wattage=(double)e.Consumption / 10};
Grouping events
• from v in inputStream group v by v.i % 4 into eachGroup from window in eachGroup.Snapshot() select new { avgNumber = window.Avg(e => e.number) };
Aggregation
• from w in inputStream.Snapshot() select new { sum = w.Sum(e => e.i), avg = w.Avg(e => e.f), count = w.Count() };
Examples of Queries in
Microsoft StreamInsight (1/2)
11
8
http://msdn.microsoft.com/en-us/sqlserver/ee476990
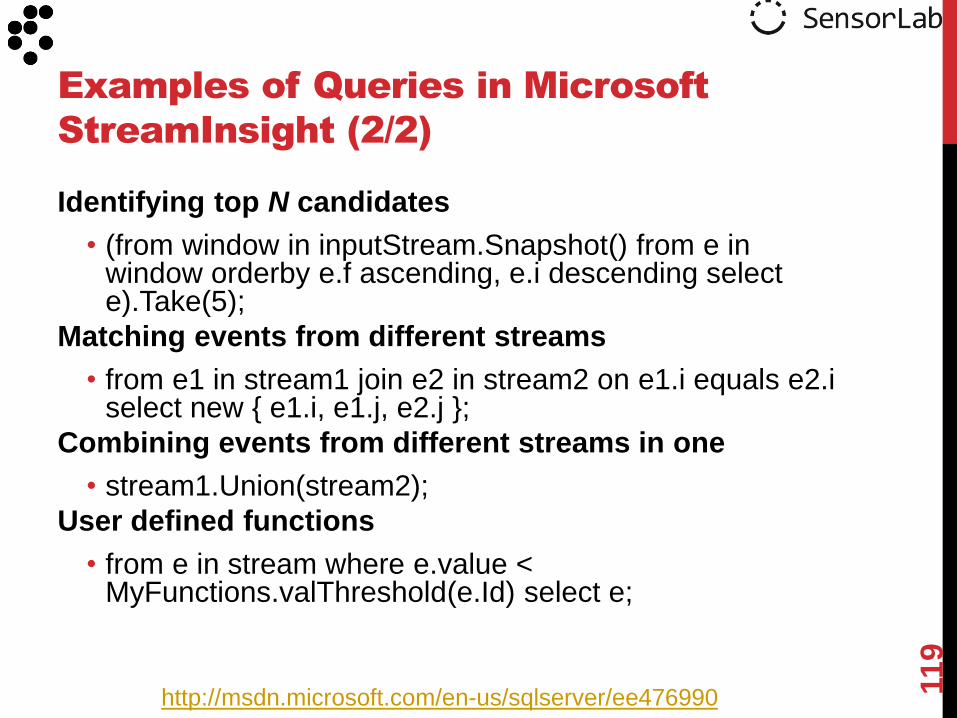
Identifying top N candidates
• (from window in inputStream.Snapshot() from e in window orderby e.f ascending, e.i descending select e).Take(5);
Matching events from different streams
• from e1 in stream1 join e2 in stream2 on e1.i equals e2.i select new { e1.i, e1.j, e2.j };
Combining events from different streams in one
• stream1.Union(stream2);
User defined functions
• from e in stream where e.value < MyFunctions.valThreshold(e.Id) select e;
Examples of Queries in Microsoft
StreamInsight (2/2)
11
9
http://msdn.microsoft.com/en-us/sqlserver/ee476990

Interval model
• Event has predefined duration
Point model
• Event is occurrence in a point in time
Edge model
• Only start time known upon arrival to server; end-time is updated later
Event Models in Microsoft
StreamInsight
120
Event Kind Start Time End Time Payload (Power Consumption)
INSERT 2009-07-15 09:13:33.317
2009-07-15 09:14:09.270
100
INSERT 2009-07-15 09:14:09.270
2009-07-15 09:14:22.253
200
INSERT 2009-07-15 09:14:22.255
2009-07-15 09:15:04.987
100
Event Kind Start Time End Time Payload (Consumption)
INSERT 2009-07-15 09:13:33.317
2009-07-15
09:13:33.317
100
INSERT 2009-07-15 09:14:09.270
2009-07-15
09:14:09.270
200
INSERT 2009-07-15 09:14:22.255
2009-07-15
09:14:22.255
100
Event Kind Edge Type Start Time End Time Payload INSERT Start t0 ∞ a INSERT End t0 t1 a INSERT Start t1 ∞ b INSERT End t1 t3 b INSERT Start t3 ∞ c
http://msdn.microsoft.com/en-us/sqlserver/ee476990

STREAM MINING

• Streams can
include
different types
of data
• We can prepare
system ahead
of time for
“Standing
Queries”
• We can prepare
only for certain
class of “Ad-
hoc Queries”
Typical stream mining architecture
122
http://infolab.stanford.edu/~ullman/mmds.html

• Maintain summaries of the streams, sufficient to answer the expected queries about the data
• …summaries can be in various forms: clusters (flat or hierarchic, statistical aggregates, …)
• Maintain a sliding window of the most recently arrived data
• …operations on a sliding window mimic more traditional database/mining operations
How we mine streams?
123

Example: Stream summarization by incremental hierarchical clustering
[Blaz Novak, 2008]
The goal is to maintain summary of data from stream in a form of a
taxonomy of prototype clusters – each new events updates the taxonomy
In the example below, events are
Reuters news articles coming in time,
Colors represent topics
0 500 1000 1500 2000 2500 3000 3500 4000 4500 5000-80
-60
-40
-20
0
20
40
11.3 9.0
6.0
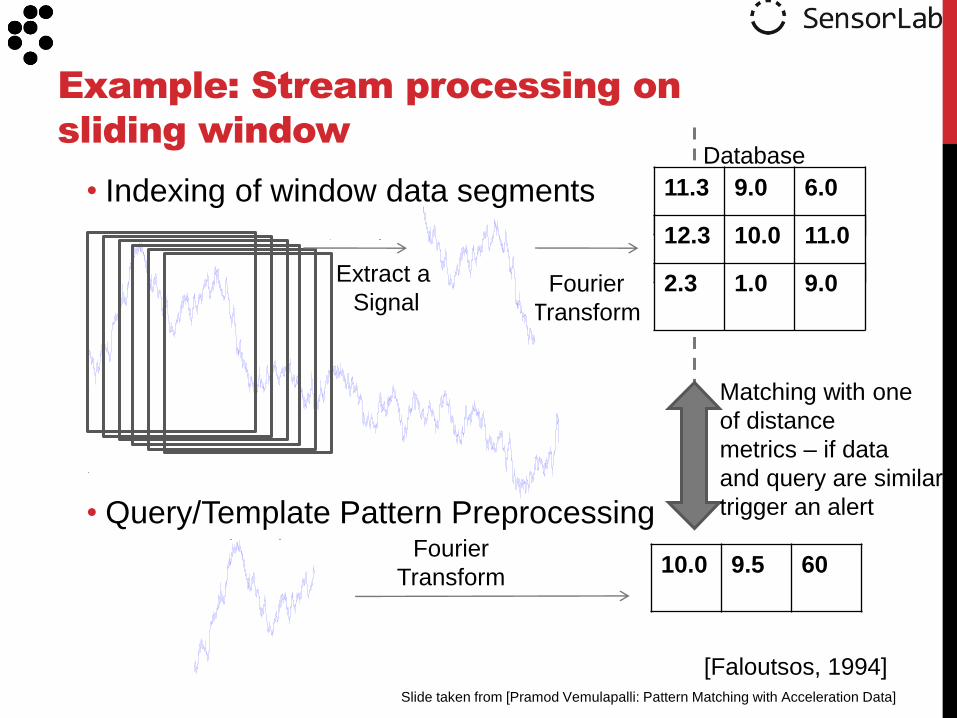
Example: Stream processing on
sliding window
0 500 1000 1500 2000 2500 3000 3500 4000 4500 5000-80
-60
-40
-20
0
20
40
Fourier
Transform
0 500 1000 1500 2000 2500 3000 3500 4000 4500 5000-80
-60
-40
-20
0
20
40
12.3 10.0
11.0
2.3 1.0
9.0
Fourier
Transform 10.0 9.5
60
Database
Slide taken from [Pramod Vemulapalli: Pattern Matching with Acceleration Data]
[Faloutsos, 1994]
Extract a
Signal
Matching with one
of distance
metrics – if data
and query are similar,
trigger an alert
• Indexing of window data segments
• Query/Template Pattern Preprocessing
• Sampling
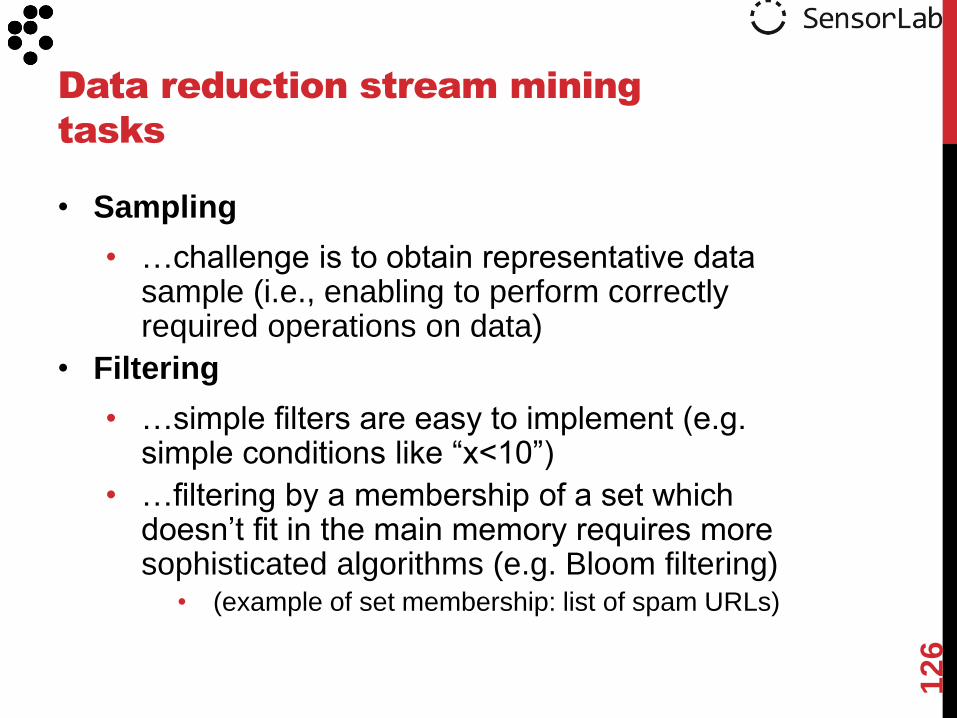
• …challenge is to obtain representative data sample (i.e., enabling to perform correctly required operations on data)
• Filtering
• …simple filters are easy to implement (e.g. simple conditions like “x<10”)
• …filtering by a membership of a set which doesn‟t fit in the main memory requires more sophisticated algorithms (e.g. Bloom filtering)
• (example of set membership: list of spam URLs)
Data reduction stream mining
tasks
126
ANOMALY DETECTION
128
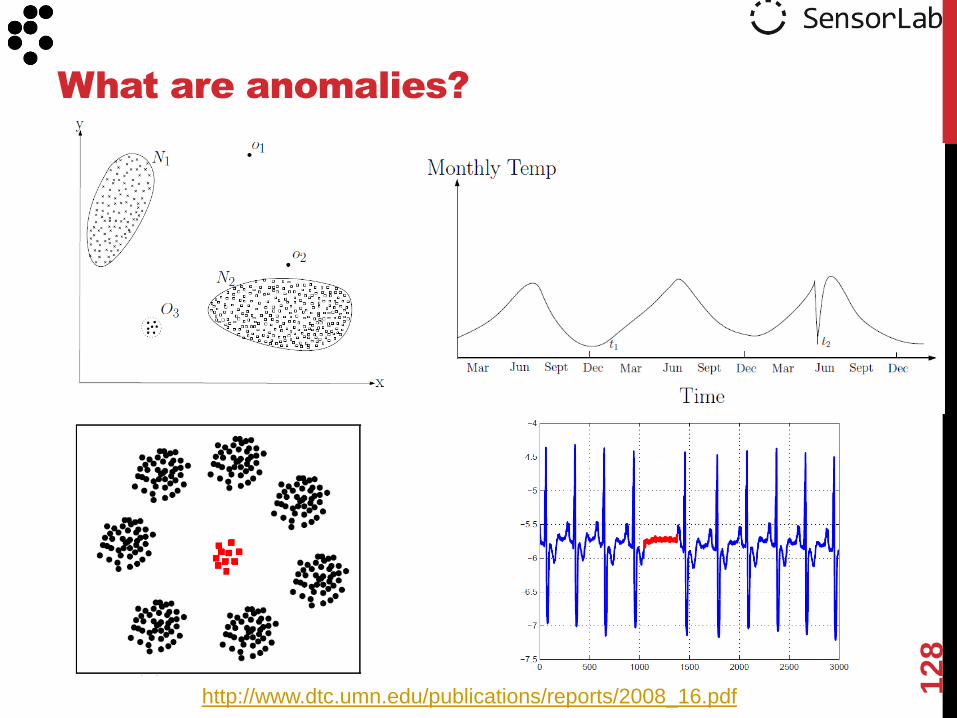
What are anomalies?
http://www.dtc.umn.edu/publications/reports/2008_16.pdf

Key components associated
with an anomaly detection
technique
129
Anomaly detection
http://www.dtc.umn.edu/publications/reports/2008_16.pdf

Classification based
• A pre-trained classifier can distinguish between normal and
anomalous classes
Clustering based
• Normal data instances belong to large and dense clusters,
while anomalies either belong to small or sparse clusters
Nearest neighbor approaches
• Normal data instances occur in dense neighborhoods,
while anomalies occur far from their closest neighbors
Statistical approaches
• Normal data instances occur in high probability regions of a
stochastic model, while anomalies occur in the low
probability regions
Information theoretic approaches
• Anomalies in data induce irregularities in the information
content of the data set
Spectral methods
• Normal instances appear in a lower dimensional subspace,
anomalies in the rest (noise)
Techniques to detect anomalies
http://www.dtc.umn.edu/publications/reports/2008_16.pdf 130

Anomalies are
detectable if data
instances are
represented in an
informative feature
space
The key to a successful anomaly
detection is proper feature
engineering!
Contextual anomaly t2 in a temperature
time series. Note that the temperature at
time t1 is same as that at time t2 but
occurs in a different context and hence is
not considered as an anomaly.
http://www.dtc.umn.edu/publications/reports/2008_16.pdf 131
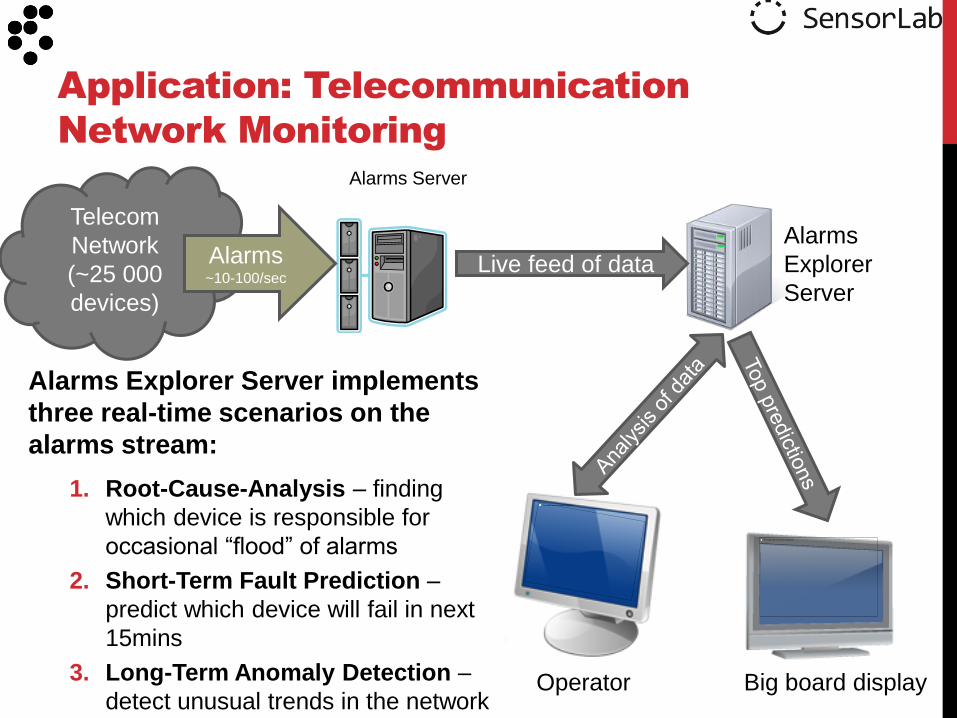
Alarms Explorer Server implements
three real-time scenarios on the
alarms stream:
1. Root-Cause-Analysis – finding
which device is responsible for
occasional “flood” of alarms
2. Short-Term Fault Prediction –
predict which device will fail in next
15mins
3. Long-Term Anomaly Detection –
detect unusual trends in the network
Application: Telecommunication
Network Monitoring
Alarms Server
Alarms
Explorer
Server
Live feed of data
Operator Big board display
Telecom
Network
(~25 000
devices)
Alarms ~10-100/sec
Part I. Motivation & background
Part II. Technology and tools for exploiting the WoT
Part III. Demos, Tools & Research directions
Outline
133
Part III. Demos, Tools & Research directions
Use cases
• What systems and prototypes exist?
Open problems
• Are there unsolved problems?
Summary
• What was this tutorial about?
List of sources for further studies
• Where to start digging?
Outline
134

Targeted Application areas
135
Agriculture
eHealth
Sport
Military
Environmental monitoring
Smart House
Industrial Processes
Transportation
Logistics
Advertising
Social Networks Marketing
Security
Safety
Emergency
Smart infrastructures
Lighting
Electricity
Water
Gas

Environmental intelligence
Others
• Intelligent buildings
• Smart cities
• Smart infrastructures
• …
Use cases
136
Data from large number of sensors deployed in
infrastructure (such as roads) or over other area of interest
(such as agriculture fields) can give decision makers a real-
time awareness on the observed phenomena and events.
Solutions:
• Remote monitoring of cultures, soil moisture, insect
infestations or disease infections
• Irrigation and pesticide spraying in precision agriculture
• Livestock monitoring for maximizing production (meat,
milk, eggs) and achieve higher reproduction rates
137
Environmental intelligence

• Location: Slovenia, Europe (project started August 2010)
• The “things”: public light poles + VSN sensor nodes
• Sensors: temperature, humidity, pressure, illuminance, etc.
• Actuator: dim the intensity of the light (pulse width modulation)
139
Environmental monitoring and
lights control testbed
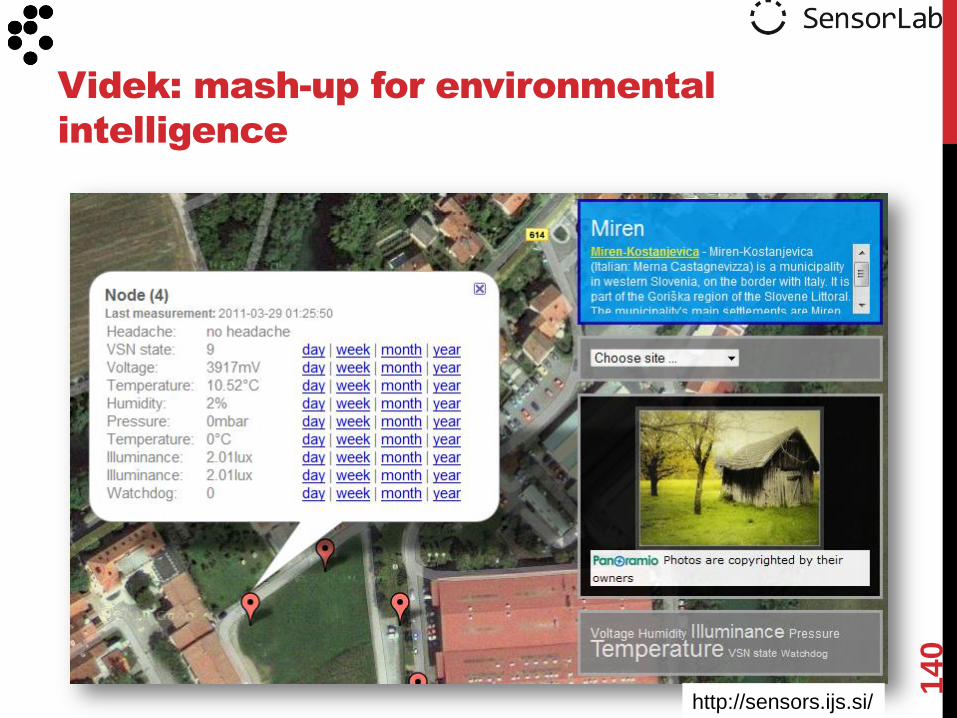
140
Videk: mash-up for environmental
intelligence
http://sensors.ijs.si/
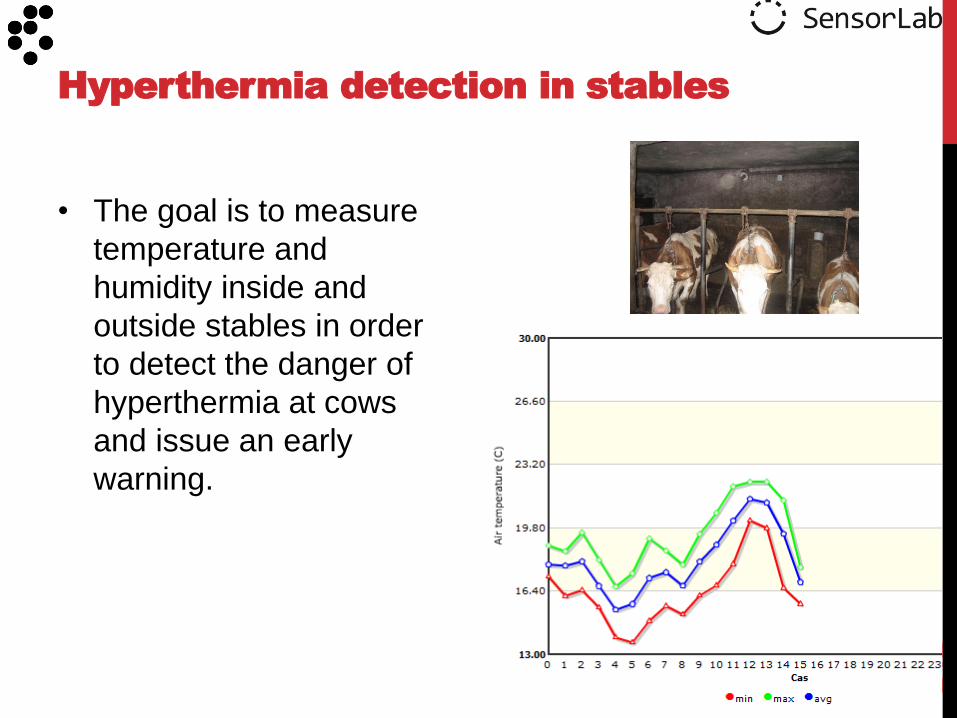
• The goal is to measure
temperature and
humidity inside and
outside stables in order
to detect the danger of
hyperthermia at cows
and issue an early
warning.
Hyperthermia detection in stables
141

Hyperthermia detection in stables
142
http://sensorlab.ijs.si/sl/demos.html
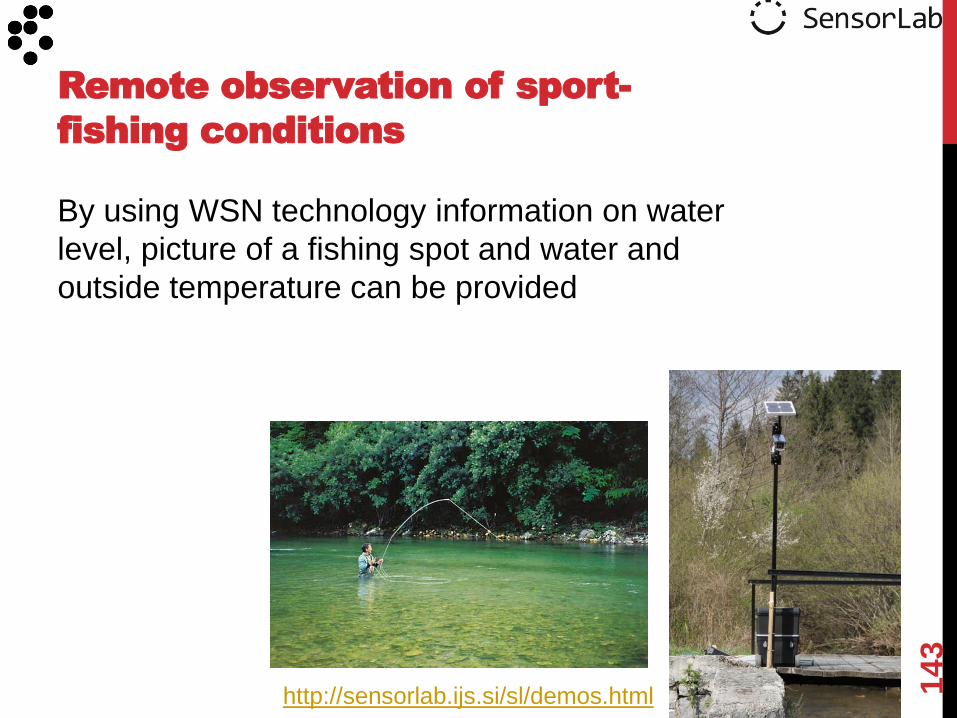
By using WSN technology information on water
level, picture of a fishing spot and water and
outside temperature can be provided
Remote observation of sport-
fishing conditions
143
http://sensorlab.ijs.si/sl/demos.html

Remote observation of sport-
fishing conditions
144
http://sensorlab.ijs.si/sl/demos.html

The purpose of this testbed is to monitor climate conditions inside (temperature and humidity) and outside (temperature, humidity, air pressure, wind direction and speed) of the beehives.
Through bee counting sensor presence of pesticides in the vicinity can be detected. For the test purposes also sound monitoring is possible
Beehive local climate conditions
145

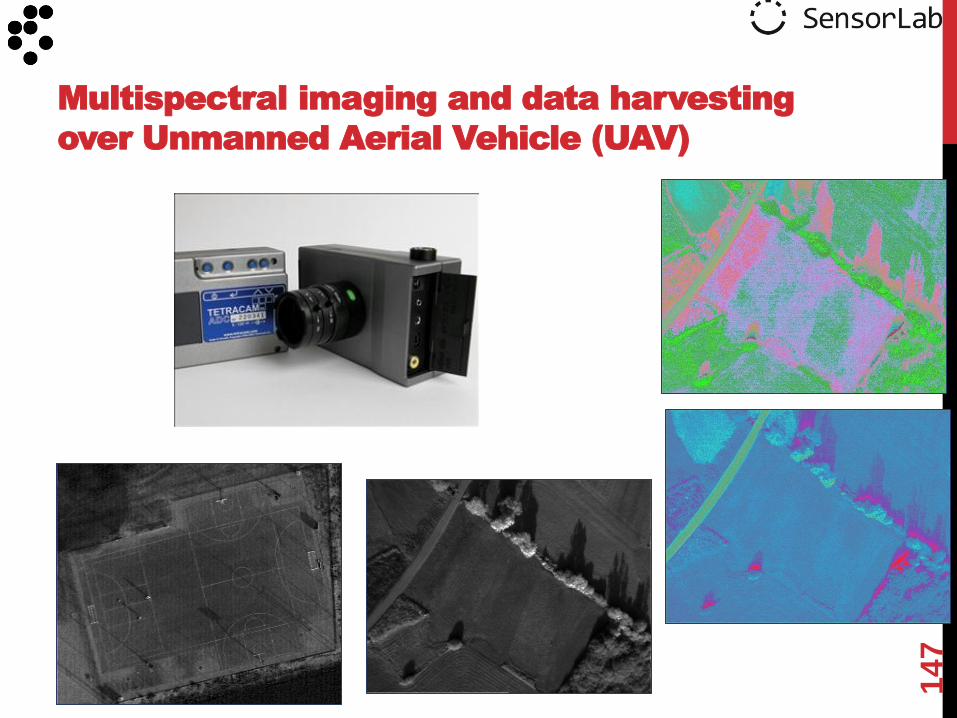
Data harvesting over large areas where deployed WSNs have
no Internet connection can be a very time consuming and
expensive task.
Our solution uses Unmanned Aerial Vehicles (UAV) equipped
with a gateway sensor node. In addition, UAV is used to collect
multispectral images with a Tetracam ADC camera.
Multispectral imaging and data harvesting
over Unmanned Aerial Vehicle (UAV)
146
Multispectral imaging and data harvesting
over Unmanned Aerial Vehicle (UAV)
147
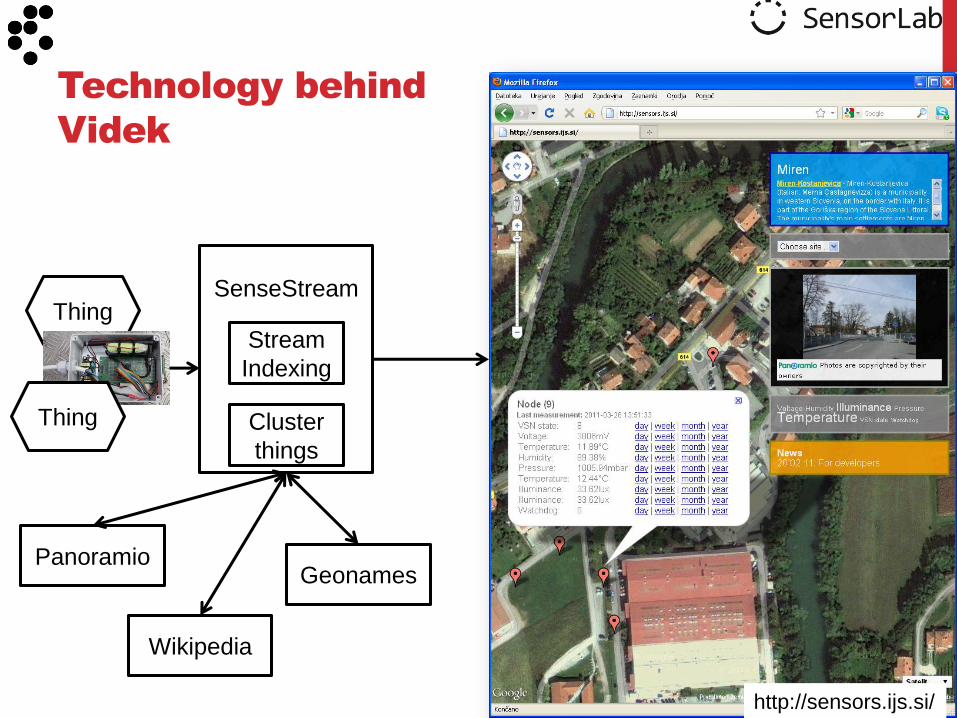
SenseStream
Thing
148
Technology behind
Videk
Thing
Stream
Indexing
Cluster
things
Geonames
Wikipedia
Panoramio
http://sensors.ijs.si/
149
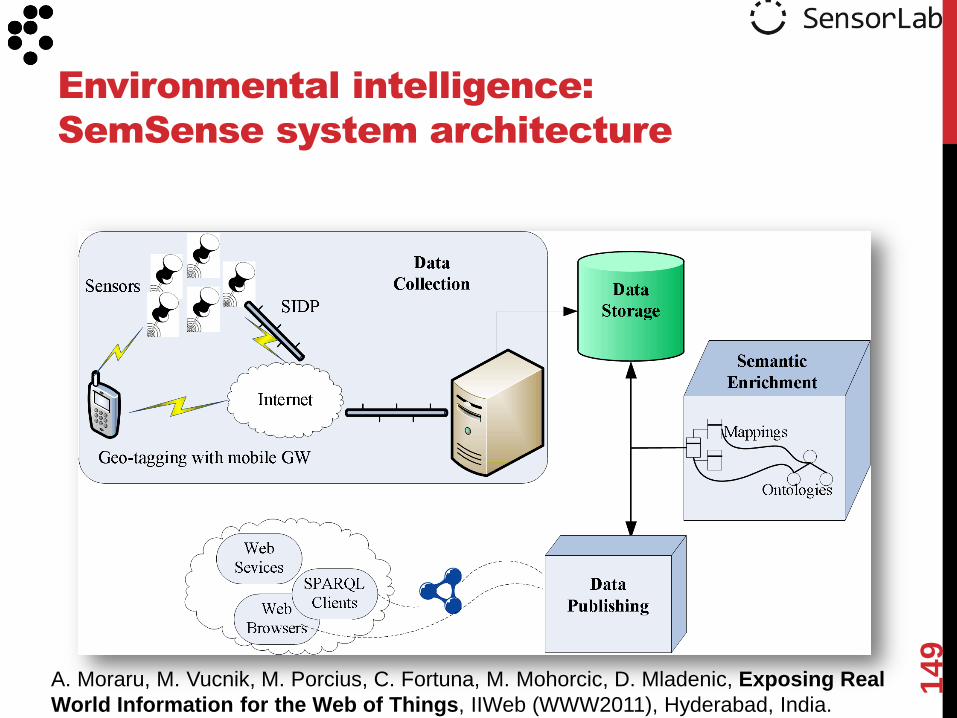
Environmental intelligence:
SemSense system architecture
A. Moraru, M. Vucnik, M. Porcius, C. Fortuna, M. Mohorcic, D. Mladenic, Exposing Real
World Information for the Web of Things, IIWeb (WWW2011), Hyderabad, India.

Scenario
• architecture for collecting real world data from a physical system of sensors and publishing it on the Web
Implementation:
• Versatile Sensor Nodes (VSN) platform are “things”
• Self-Identification Protocol
• Custom protocol for collecting meta-data and data
• MySQL database for storage of data and meta-data
• Meta-data semantic enrichment component
• RDF representation
• Semantic Sensor Network (SSN) ontology, Basic GeoWGS84 Vocabulary, GeoNames and FOAF as vocabulary
• Linking to Linked Opened Data Cloud
• D2R for mapping the database schema
150
Environmental intelligence:
SemSense implementation details
A. Moraru, M. Vucnik, M. Porcius, C. Fortuna, M. Mohorcic, D. Mladenic, Exposing Real
World Information for the Web of Things, IIWeb (WWW2011), Hyderabad, India.

151
Environmental intelligence: browse the
semantic representation
Browse at: http://sensors.ijs.si:2020/
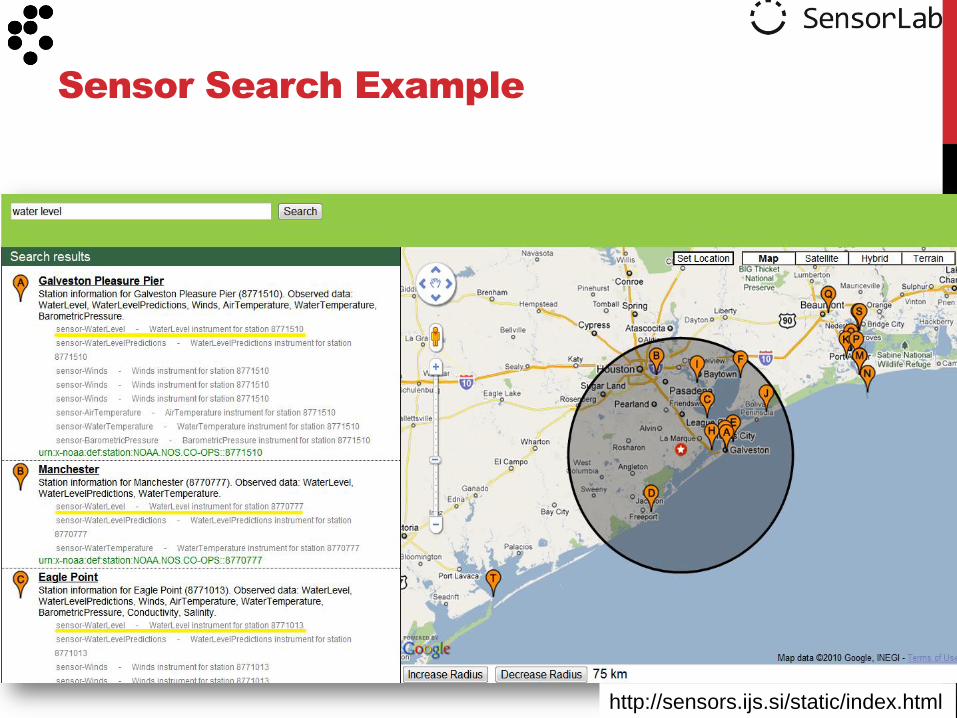
Sensor Search Example
http://sensors.ijs.si/static/index.html

The goal of the search
• retrieve and rank a list of sensors based on the
user‟s request
• Input:
• keyword query
• geographic location (given by latitude and longitude
coordinates)
• distance (interpreted as a radius around the location)
• Output:
• list of ranked sensors
Sensor search and ranking
L. Dali, A. Moraru, D. Mladenic , Using Personalized PageRank for Keyword Based
Sensor Retrieval, SemSearch (WWW2011), Hyderabad, India.
153
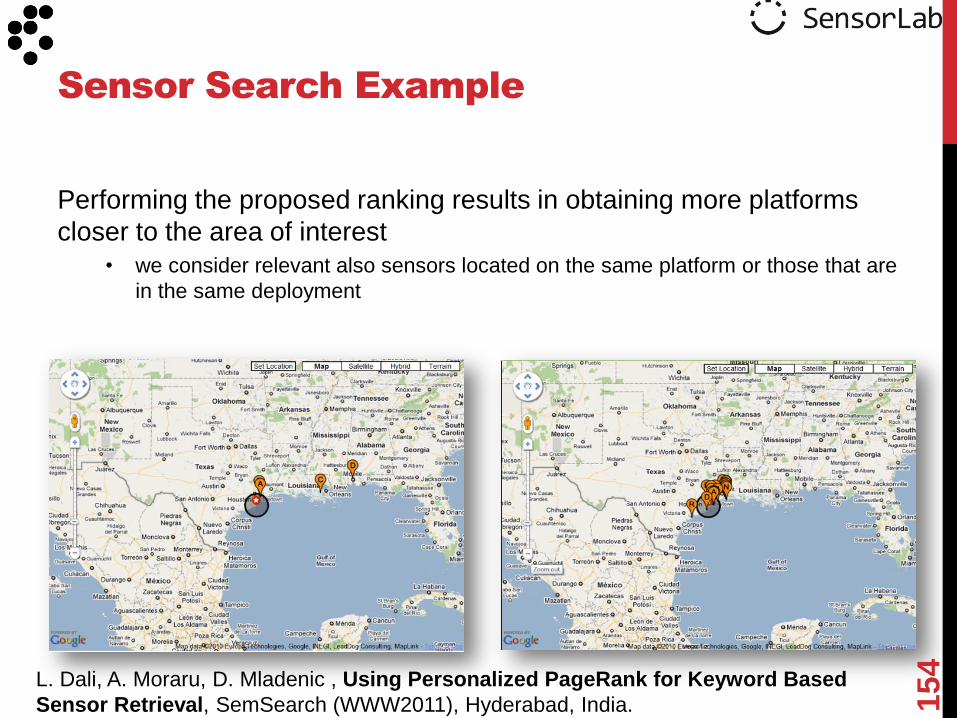
Sensor Search Example
Performing the proposed ranking results in obtaining more platforms
closer to the area of interest
• we consider relevant also sensors located on the same platform or those that are
in the same deployment
L. Dali, A. Moraru, D. Mladenic , Using Personalized PageRank for Keyword Based
Sensor Retrieval, SemSearch (WWW2011), Hyderabad, India.
154

Traffic Scene Object Detection

Traffic Scene Understanding
QUESTION: Image depicts Person?
ANSWER: PEDESTRIAN2A000282 is a person.
QUESTION: Image depicts UtilityPole?
ANSWER: UNCLASSIFIED0A000282 is a utility pole. POLE4A000282 is a utility pole. UNCLASSIFIED6A000282 is a utility pole. UNCLASSIFIED7A000282 is a utility pole. UNCLASSIFIED8A000282 is a utility pole. UNCLASSIFIED9A000282 is a utility pole. UNCLASSIFIED10A000282 is a utility pole.
QUESTION: Image depicts Automobile?
ANSWER: UNCLASSIFIED3A000282 is a car.
QUESTION: Image depicts Person?
ANSWER: PEDESTRIAN2A000283 is a person.
QUESTION: Image depicts UtilityPole?
ANSWER: UNCLASSIFIED0A000283 is a utility pole. POLE4A000283 is a utility pole. UNCLASSIFIED6A000283 is a utility pole. UNCLASSIFIED7A000283 is a utility pole. UNCLASSIFIED8A000283 is a utility pole. POLE9A000283 is a utility pole.
QUESTION: Image depicts Automobile?
ANSWER: UNCLASSIFIED3A000282 is a car.
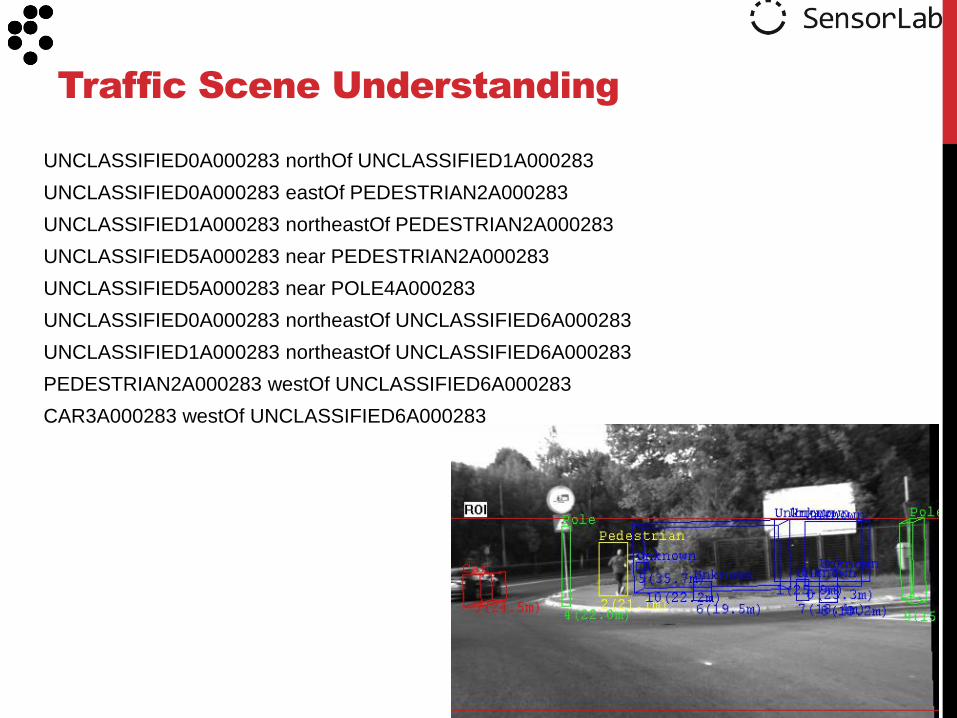
Traffic Scene Understanding
UNCLASSIFIED0A000283 northOf UNCLASSIFIED1A000283
UNCLASSIFIED0A000283 eastOf PEDESTRIAN2A000283
UNCLASSIFIED1A000283 northeastOf PEDESTRIAN2A000283
UNCLASSIFIED5A000283 near PEDESTRIAN2A000283
UNCLASSIFIED5A000283 near POLE4A000283
UNCLASSIFIED0A000283 northeastOf UNCLASSIFIED6A000283
UNCLASSIFIED1A000283 northeastOf UNCLASSIFIED6A000283
PEDESTRIAN2A000283 westOf UNCLASSIFIED6A000283
CAR3A000283 westOf UNCLASSIFIED6A000283
Traffic Scene Understanding
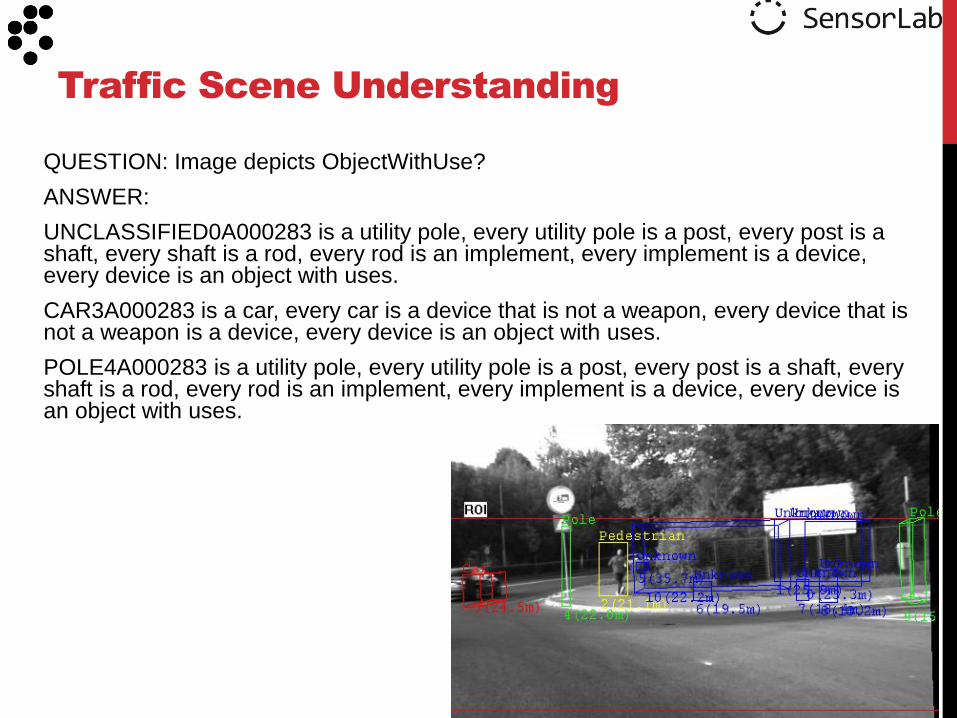
QUESTION: Image depicts ObjectWithUse?
ANSWER:
UNCLASSIFIED0A000283 is a utility pole, every utility pole is a post, every post is a shaft, every shaft is a rod, every rod is an implement, every implement is a device, every device is an object with uses.
CAR3A000283 is a car, every car is a device that is not a weapon, every device that is not a weapon is a device, every device is an object with uses.
POLE4A000283 is a utility pole, every utility pole is a post, every post is a shaft, every shaft is a rod, every rod is an implement, every implement is a device, every device is an object with uses.
Environmental intelligence
Others
• Intelligent buildings
• Smart cities
• Smart infrastructures
• …
Use cases
159
160
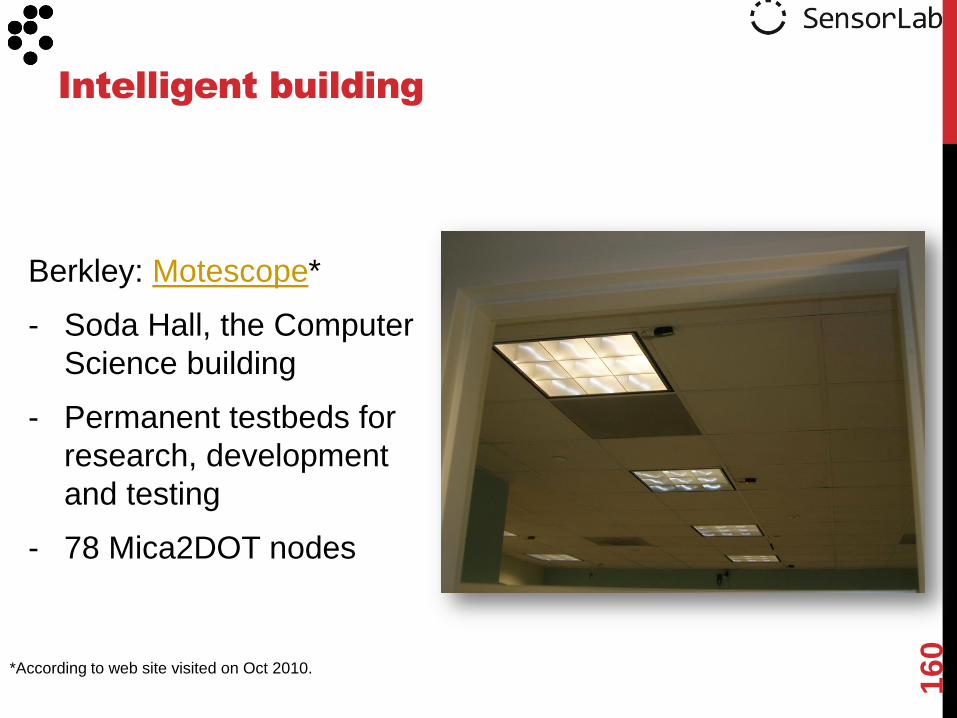
Intelligent building
Berkley: Motescope*
- Soda Hall, the Computer
Science building
- Permanent testbeds for
research, development
and testing
- 78 Mica2DOT nodes
*According to web site visited on Oct 2010.
161
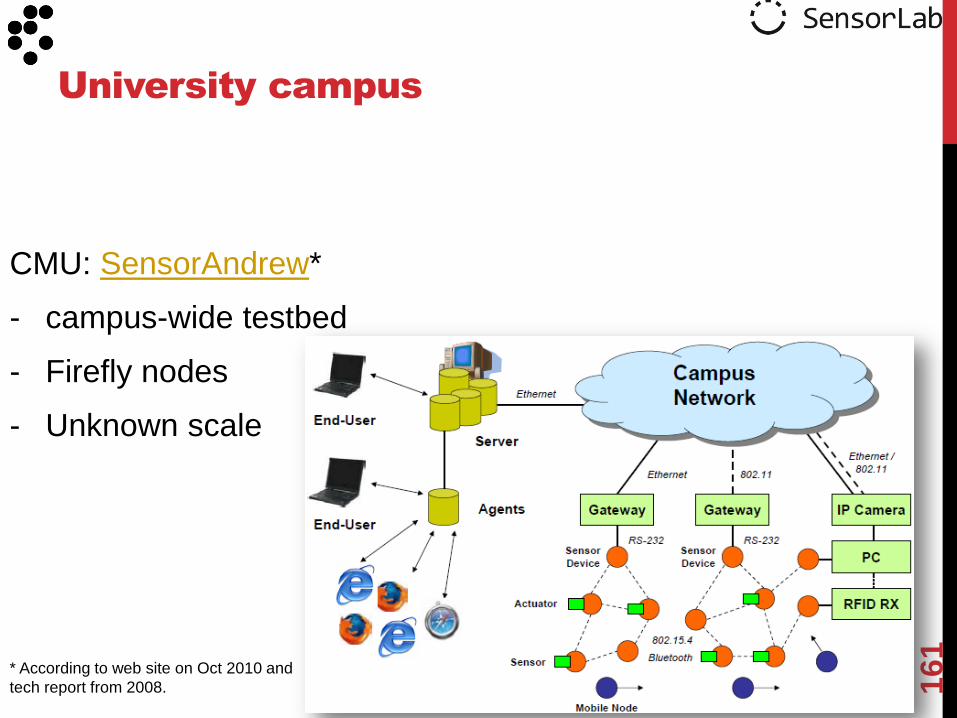
University campus
CMU: SensorAndrew*
- campus-wide testbed
- Firefly nodes
- Unknown scale
* According to web site on Oct 2010 and
tech report from 2008.
162
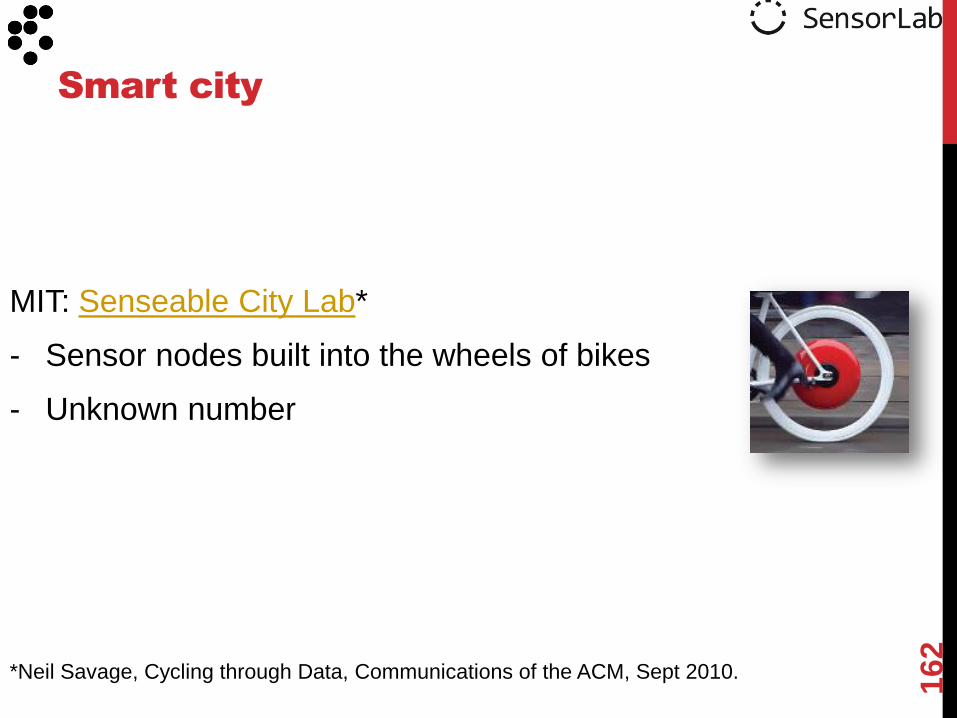
Smart city
MIT: Senseable City Lab*
- Sensor nodes built into the wheels of bikes
- Unknown number
*Neil Savage, Cycling through Data, Communications of the ACM, Sept 2010.
163
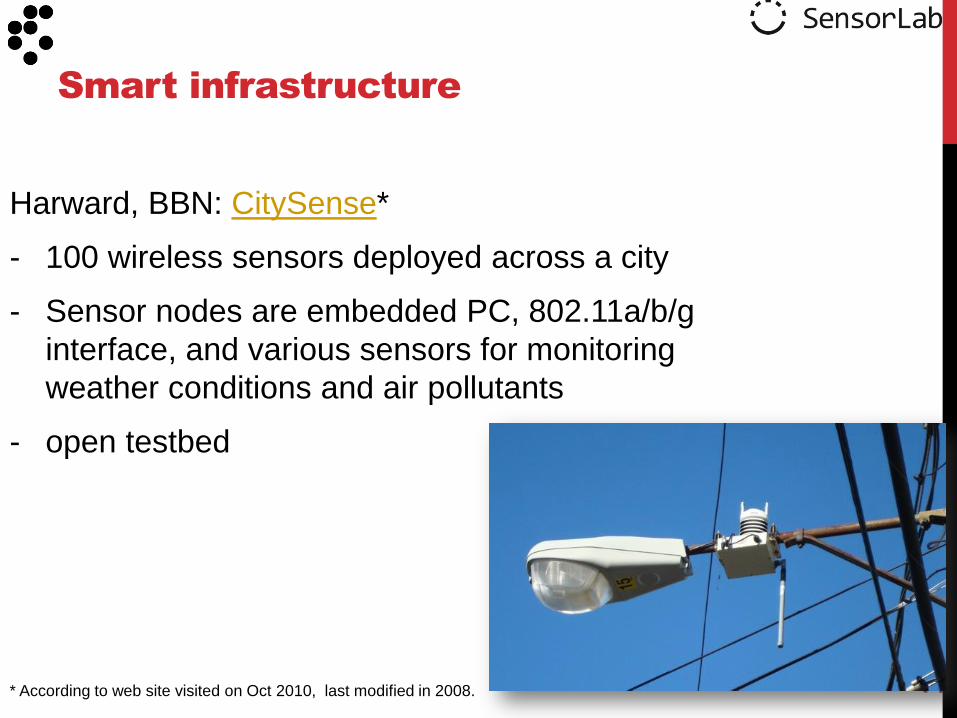
Smart infrastructure
Harward, BBN: CitySense*
- 100 wireless sensors deployed across a city
- Sensor nodes are embedded PC, 802.11a/b/g
interface, and various sensors for monitoring
weather conditions and air pollutants
- open testbed
* According to web site visited on Oct 2010, last modified in 2008.
Pachube*
- 3700 sensor nodes, over 9400 data streams (April 2010)
- Sensor data and meta-data
- Open to upload/download
Sensorpedia*
- Similar to Pachube, limited testing Beta
Global Sensor Network*
- Framework for federated testbeds
- Used in the Swiss Experiment
Federation of Sensor deployments
164
* According to web site visited on Oct 2010.

Part III. Demos, Tools & Research directions
Use cases
• What systems and prototypes exist?
Open problems
• Are there unsolved problems?
Summary
• What was this tutorial about?
List of sources for further studies
• Where to start digging?
Outline
165
WSN is
• Well developed field with many degrees of freedom
• Complex, large-scale, resource constrained systems
• Focus is on intra network communications
Efficient management and maintenance of the “things”
• Remote reconfiguration of parameters
• Remote software updates
• Real implementations solving real problems, particularly large scale
(see next slide)
166
Current state and open problems
in WSN area

Myth #1: Nodes are deployed randomly.
Myth #2: Sensor nodes are cheap and tiny.
Myth #3: The network is dense.
Lesson #1: It‟s all about the data.
Lesson #2: Computer scientists and domain scientists need common ground.
Lesson #3: Don‟t forget about the base station!
Myths & lessons regarding WSNs
167
M. Welsh, Sensor Networks for the Sciences, Communications of the
ACM, Nov. 2010.
WoT covers a long pipeline of technologies from
sensors to high level services
• ...current ontologies are covering just parts of the
space and are not interlinked
• ...ideally, sensor network domain should be linked to
general common-sense ontologies and further to
domain specific service ontologies
168
Challenges with respect to
conceptualization

• Traditional mining and analytic techniques are not
ready for the scale and complexity coming from large
sensor setups
• ...in particular:
• connection to background knowledge (ontologies)
for enrichment of sensor data for expressive feature
representations needed for analytic techniques
• "complex events" are in the context of WoT much
more complex compared to traditional "complex
events" research
• real-time response on complex events appearing in
WoT setups 169
Challenges with respect to
analytics & CEP

Part III. Demos, Tools & Research directions
Use cases
• What systems and prototypes exist?
Open problems
• Are there unsolved problems?
Summary
• What was this tutorial about?
List of sources for further studies
• Where to start digging?
Outline
170

The tutorial had 3 parts:
1. Motivation & background
• Problems that the Web of Things can solve
• Components and complexity of the system, from “Things” to Apps and Services
• Quick start recipes
2. Technology and tools for exploiting the WoT
• Semantic aspects
• Analytic aspects
• Services
3. Demos, Tools & Research directions
• Overview of existing setups and tools used for their implementation
• Research directions
Summary
171
Part III. Demos, Tools & Research directions
Use cases
• What systems and prototypes exist?
Open problems
• Are there unsolved problems?
Summary
• What was this tutorial about?
List of sources for further studies
• Where to start digging?
Outline
172

• WWW - International World Wide Web Conferences
• ICML – International Conference of Machine Learning
• NIPS – Neural Information Processing Systems
• KDD – ACM Knowledge Discovery in Databases
• ICWS - IEEE International Conference on Web Services
• ISWC – International Semantic Web Conference
• IPSN – Information Processing in Sensor Networks
• Percom - IEEE Pervasive Computing and Communication
• SenSys - ACM Conference on Embedded Networked Sensor Systems
• MobiSys - International Conference on Mobile Systems, Applications, and Services
• INSS – International Conference on Networked Sensing Systems
• DCOSS - International Conference on Distributed Computing in Sensor Systems
• iThings - IEEE International Conference on Internet of Things
Relevant Conferences
173
“Glue”
Apps and
Services

• WebOfThings - International Workshop on the Web of Things
• SensorKDD - International Workshop on Knowledge Discovery from Sensor Data
• PURBA - Workshop on Pervasive Urban Applications
• Urban-IOT – the Urban Internet of Things Workshop
• Web Enabled Objects - International Workshop on Web-Enabled Objects
• ….
Relevant Workshops
174
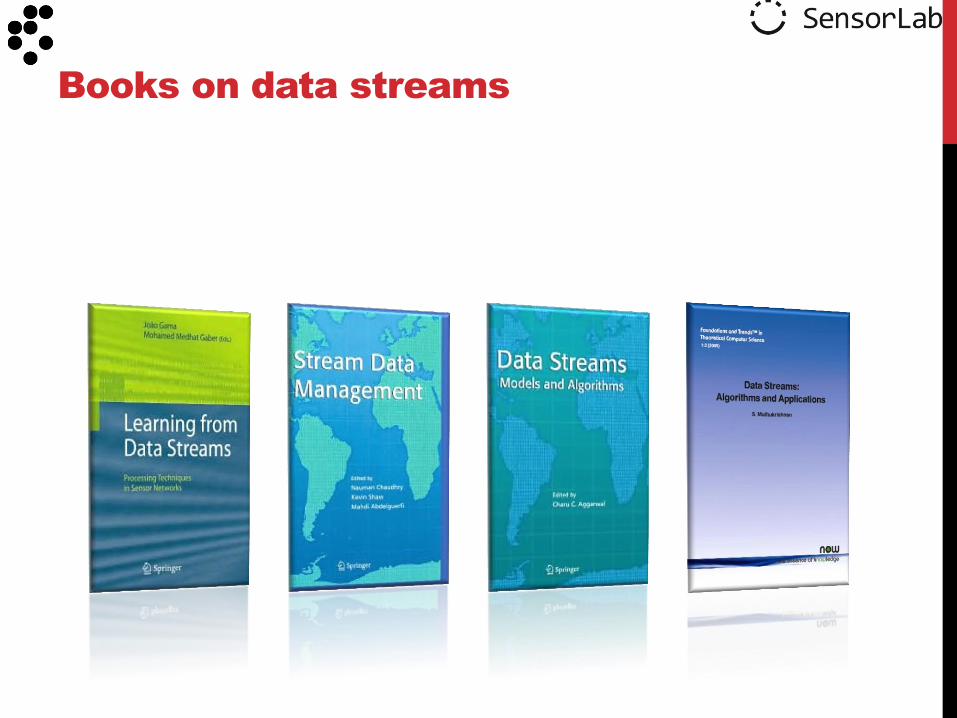
Books on data streams

Books on event processing

177
Books on sensor networks
• Web of Things Blog
• Wireless Sensor Network Blog
• The Internet of Things
• Dust Networks – In the News
• ReadWriteWeb
178
Relevant blogs

Related Wikipedia Links
Data Stream Mining:
http://en.wikipedia.org/wiki/Data_stream_mining
Complex Event Processing:
http://en.wikipedia.org/wiki/Complex_Event_Processing
Real Time Computing: http://en.wikipedia.org/wiki/Real-
time_computing
Online Algorithms:
http://en.wikipedia.org/wiki/Online_algorithms
Worst Case Analysis:
http://en.wikipedia.org/wiki/Worst-case_execution_time

Related Wikipedia Links
Web of Things:
http://en.wikipedia.org/wiki/Web_of_Things
Internet of Things:
http://en.wikipedia.org/wiki/Internet_of_Things
Wireless Sensor Networks:
http://en.wikipedia.org/wiki/Wireless_Sensor_Networks
Major Appliance:
http://en.wikipedia.org/wiki/Household_appliances
RFID – Radio Frequency Identification:
http://en.wikipedia.org/wiki/RFID
Video Tutorials
State of the Art in Data Stream Mining: Joao
Gama, University of Porto
• http://videolectures.net/ecml07_gama_sad/
Data stream management and mining: Georges
Hebrail, Ecole Normale Superieure
• http://videolectures.net/mmdss07_hebrail_dsmm/
Part III. Demos, Tools & Research directions
Use cases
• What systems and prototypes exist?
Open problems
• Are there unsolved problems?
Summary
• What was this tutorial about?
List of sources for further studies
• Where to start digging?
Outline
182

Thank you!
HTTP://SENSORLAB.IJS.SI

Help us improve the tutorial!
Send comments and relevant info to
Acknowledgements
We would like to thank Miha Smolnikar, Kemal Alic,
Zoltan Padrah, Klemen Kenda and Alexandra Moraru
for contributing some slides, and the SensorLab team
for their support.
184