THE WASHINGTON STATEBOARD OF EDUCATION Accountability...THE WASHINGTON STATEBOARD OF EDUCATION ......
41
THE WASHINGTON STATE BOARD OF EDUCATION A high-quality education system that prepares all students for college, career, and life. Prepared for the May, 2017 Board Meeting Title: Accountability Changes and ESSA As Related To: Goal One: Develop and support policies to close the achievement and opportunity gaps. Goal Two: Develop comprehensive accountability, recognition, and supports for students, schools, and districts. Goal Three: Ensure that every student has the opportunity to meet career and college ready standards. Goal Four: Provide effective oversight of the K-12 system. Other Relevant To Board Roles: Policy Leadership System Oversight Advocacy Communication Convening and Facilitating Policy Considerations / Key Questions: The State Board of Education is granted an important voice on the manner in which the Achievement Index is made compatible with the Every Student Succeeds Act (ESSA). The Board is collaborating with the Superintendent’s staff to ensure the redesigned Index meets the needs of the Superintendent and the Board’s vision for the Index. Key Questions: 1. Does the Board support a change in practice (supported by the Accountability Systems Workgroup (ASW)) to not publicly report a summative Index rating for schools? 2. Does the Board support a change in practice (supported by the ASW) to develop a four-tiered classification system for schools? 3. Does the Board support the manner in which schools are held accountable for low participation rates on the statewide assessments? Possible Board Action: Review Adopt Approve Other Materials Included in Packet: Memo Graphs / Graphics Third-Party Materials PowerPoint Synopsis: Since the March SBE meeting, the ESSA Accountabiltiy regulations were overturned by the U.S. House of Representatives, the U.S. Senate, and signed by President Trump. This means that states must only meet the requirements in the ESSA and provide only the information required in the Updated Consolidated State Plan template when submitting their ESSA plans to the U.S. Department of Education. The Superintendent reconvened the ESSA ASW and created an Accountability Technical Assistance Committee (TAC) to make recommendations on certain State Plan components prior to the submission of the Washington ESSA Consolidated State Plan. The memo provides an update on the work of the ESSA ASW and ASW TAC to further Board discussion.
Transcript of THE WASHINGTON STATEBOARD OF EDUCATION Accountability...THE WASHINGTON STATEBOARD OF EDUCATION ......

THE WASHINGTON STATE BOARD OF EDUCATION A high-quality education system that prepares all students for college, career, and life.
Prepared for the May, 2017 Board Meeting
Title: Accountability Changes and ESSA
As Related To:
Goal One: Develop and support policies to close the achievement and opportunity gaps.
Goal Two: Develop comprehensive accountability, recognition, and supports for students, schools, and districts.
Goal Three: Ensure that every student has the opportunity to meet career and college ready standards.
Goal Four: Provide effective oversight of the K-12 system.
Other
Relevant To Board Roles:
Policy Leadership System Oversight Advocacy
Communication Convening and Facilitating
Policy Considerations / Key Questions:
The State Board of Education is granted an important voice on the manner in which the Achievement Index is made compatible with the Every Student Succeeds Act (ESSA). The Board is collaborating with the Superintendent’s staff to ensure the redesigned Index meets the needs of the Superintendent and the Board’s vision for the Index. Key Questions:
1. Does the Board support a change in practice (supported by the Accountability Systems Workgroup (ASW)) to not publicly report a summative Index rating for schools?
2. Does the Board support a change in practice (supported by the ASW) to develop a four-tiered classification system for schools?
3. Does the Board support the manner in which schools are held accountable for low participation rates on the statewide assessments?
Possible Board Action:
Review Adopt Approve Other
Materials Included in Packet:
Memo Graphs / Graphics Third-Party Materials PowerPoint
Synopsis: Since the March SBE meeting, the ESSA Accountabiltiy regulations were overturned by the U.S. House of Representatives, the U.S. Senate, and signed by President Trump. This means that states must only meet the requirements in the ESSA and provide only the information required in the Updated Consolidated State Plan template when submitting their ESSA plans to the U.S. Department of Education. The Superintendent reconvened the ESSA ASW and created an Accountability Technical Assistance Committee (TAC) to make recommendations on certain State Plan components prior to the submission of the Washington ESSA Consolidated State Plan. The memo provides an update on the work of the ESSA ASW and ASW TAC to further Board discussion.

THE WASHINGTON STATE BOARD OF EDUCATION A high-quality education system that prepares all students for college, career, and life.
Prepared for the May, 2017 Board Meeting
ACCOUNTABILITY CHANGES AND THE ESSA
Board Authority and Responsibility
Among the many duties specified in 28A.657.110, Sections (2) (3) and (4) authorize the State Board of Education (SBE) to develop the Washington Achievement Index to identify schools and school districts for recognition, for continuous improvement, and for additional state support. In cooperation with the Office of the Superintendent of Public Instruction (OSPI), the SBE shall annually recognize schools for exemplary performance as measured on the Washington Achievement Index. In cooperation with the OSPI, the SBE shall seek approval from the United States Department of Education for use of the Washington Achievement Index and the state system of differentiated support, assistance, and intervention to replace the federal accountability system.
The State Board of Education is granted an important voice on the manner in which the Achievement Index is made compatible with the Every Student Succeeds Act (ESSA). The Board is collaborating with the Superintendent’s staff to ensure the redesigned Index is compatible with the ESSA to meet the needs of the Superintendent, but also meets the transparency and validity requirements insisted upon by the Board.
The Board should reflect on the fact that the ESSA Accountability Systems Workgroup (ASW) task is to make recommendations to the Superintendent, and on issues involving the Index, the Board and the Superintendent must jointly develop the new Index to meet the requirements of both entities. Over the course of this and the next two meetings, the Board will be hearing about recommendations and potential changes to the Index from the ESSA ASW and the ASW Technical Assistance Committee (TAC), and in the event the Board’s opinion is not in alignment with the ASW recommendation, the Board should be prepared to call out the misalignment and clearly articulate a preference or position and communicate that to the respective workgroups and the Superintendent.
The Three Big Ideas to Focus On for the May ESSA Discussion
The ASW supports the idea of not publicly reporting the summative Index ratings for schools. What is your opinion on this possible change?
The ASW supports the idea of four labels (Index tiers) for schools rather than the current six. What is your opinion on this possible change?
The No Child Left Behind Act imposed punitive sanctions for not meeting participation requirements. To what degree would you advocate for the
development of less punitive actions as a means to improve participation on statewide assessments?

Prepared for the May, 2017 Board Meeting
Summary and Key Questions
In April and September of 2017, states will submit their consolidated state plans describing statewide accountability systems and how they will spend federal funding under the Every Student Succeeds Act. The state education agencies (SEAs) are assigned the primary responsibility for developing and filing the state plan, but many state boards of education have statutory authority for carrying out elements of the plan, and most are likely take a formal vote on their plans before they are sent to the U.S. Department of Education (USED). The National Association of State Boards of Education (NASBE) created a policy update document for state board of education members to review prior to voting on any such state plan. The document is included as part of the board packet and can be accessed here.
Before the Board considers an official action, it is worthwhile to consider what will be on the agenda for this and the next SBE meetings.
• In May, the Board will hear about the work of the ESSA ASW on the topics of summative ratings, tier labels, and factoring participation rates into the statewide accountability system. The Board will also hear about the options put forth on the above-cited topics by the newly created Accountability Technical Assistance Committee (ASW TAC). This is an excellent time for the Board to provide guidance to staff and to make formal or informal recommendation on the topics to the ASW and the Superintendent.
• In July, the scheduled work of the ASW and the ASW TAC will be completed and the Board is expected to get an update on all of the other concerns specified by the Superintendent. At a minimum, these concerns include the new English Learner measure derived from the ELPA 21, and the weighting schemes for the next Index version that will utilize the English Learner and the School Quality and Student Success (SQSS) indicators. The Board is expected to provide guidance to staff and to make formal or informal recommendation on the topics to the ASW and the Superintendent.
• In September, the Board will seek clarity on elements of the ESSA State Plan the Superintendent is expected to present on in May and July.
Some of the key questions are as follows:
1. Does the Board support a change in practice (supported by the Accountability Systems Workgroup) to not publicly report a summative Index rating for schools?
2. Does the Board support a change in practice (supported by the ASW) to develop a four-tiered classification system for schools?
3. Does the Board support the manner in which schools are held accountable for low participation rates on the statewide assessments?
4. After hearing from the Superintendent and his staff in May, what will be the next steps for the Board in July and September regarding ESSA State Plan submission to the USED? When or will the Board take an action on the Plan and would that action occur at the July meeting?
Accountability and the ESSA
Soon after being elected to the position of Superintendent of Public Instruction, Superintendent Reykdal announced his intention to submit Washington’s ESSA Consolidated State Plan to the U.S. Department of Education on September 18th, 2017. While there are several good reasons for the selection of this submission date, high on the list was likely the desire to carefully consider public input on the plan and to provide the Governor, Legislature, and other stakeholders with an additional review of the plan after

Prepared for the May, 2017 Board Meeting
revisions. The Draft Consolidated State Plan is found here and a summary of public comments on the first public draft of the plan is found here.
Repeal of the ESSA Accountability Regulations
The ESSA Accountability Regulations were published May 2016 in draft form in the Federal Register and final regulations were published by the Department on November 29, 2016. On February 7, the U.S. House of Representatives voted to overturn the ESSA accountability regulations after considering a joint resolution of disapproval under the Congressional Review Act (CRA) and on March 9, 2017, the U.S. Senate voted to block the accountability regulations. The bill was sent to President Trump, who signed the bill on March 27. With repeal of the regulations and until new regulations are issued, states are only required to meet the ESSA as written and to provide the required information specified in the template. Find more information about the impact of the repeal of some of the ESSA Accountability rules in Appendix A.
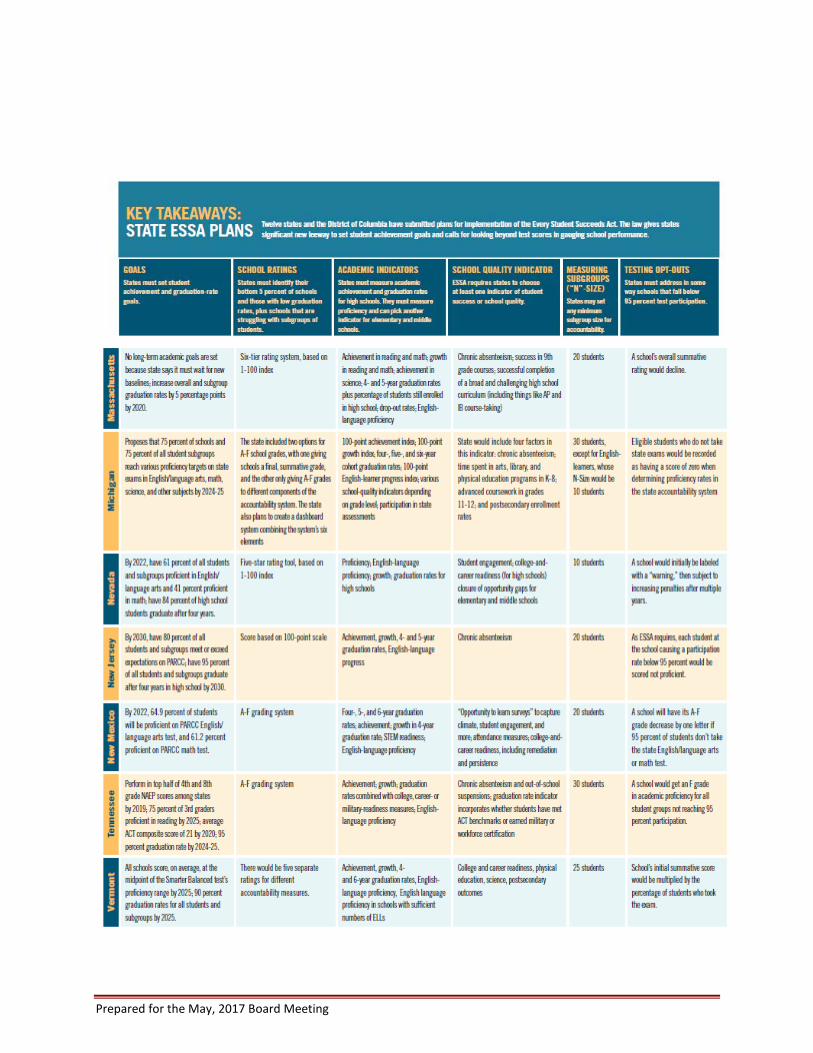
In anticipation of President Trump’s signature on the bill, the U.S. Department of Education (USED) created and distributed an updated consolidated state plan template for state officials to follow in writing their state plans. Per the OSPI, the updated template is shorter and asks for less information than the template developed under the Obama administration. Twelve states submitted ESSA state plans to the USED during the early-April submission window. A summary of and more information on the twelve state plans, created by Education Week, can be found here and in Appendix B.
Timeline of Activities
Superintendent Reykdal announced that he would submit the Washington ESSA Consolidated State Plan on September 18th. This later submission date afforded the OSPI additional time in which to address certain elements not fully defined in the draft plan. As part of a news release on April 12th, the Superintendent publicly announced the reconvening of certain ESSA workgroups (ESSA ASW and the formation of the ASW TAC) for the purpose of addressing the remaining issues regarding the ESSA Consolidated State Plan. The Superintendent’s timeline taken from the April 12th news release is shown on Figure 1 and a more detailed timeline in included in Appendix B.
Figure 1: Shows the Superintendent’s timeline for completing the ESSA Consolidated State Plan.
ESSA Accountability System Workgroup
In the fall 2016, the Consolidated State Plan Team put forth recommendations to the Superintendent that an accountability workgroup provide input to the OSPI on certain Consolidated State Plan components. To this end, Superintendent Reykdal tasked Deputy Superintendent, Dr. Michaela Miller,

Prepared for the May, 2017 Board Meeting
with reconvening ESSA Accountability Systems Workgroup to accomplish the unfinished ESSA accountability tasks specified below.
• Identify tier labels of school performance.
• Identify state-determined actions for schools that do not meet the 95 percent participation rate on assessments.
• Refine the metric for meaningfully differentiating schools - including the English Learner progress measure, weighting of indicators, and inclusion of targeted subgroups.
To accomplish these tasks, the ESSA ASW was scheduled to meet on three occasions between the March and May SBE meetings, but met only twice as the April 25th meeting was postponed and has been tentatively rescheduled for early June. The final ASW meeting is scheduled to be a full day event to he held on June 22nd.
Summative Rating
When the ASW met in the summer of 2016, the draft ESSA Accountability Regulations specified that the meaningful differentiation of schools must include a single summative determination for each school. In the spring and summer of 2016, the ASW discussed but did not reach consensus on the topic of creating and reporting a summative rating for schools as the outcome of the system of meaningful differentiation. Two recommendations and a minority opinion were put forth to the Consolidated State Plan Workgroup on October 20th:
• Recommendation 1: Assigning only a name (or label) to a school. The Consolidated Plan Team voting did not support this option.
• Recommendation 2: Assigning a 1 to 10 (summative) rating, a name (or label), and adding color codes. The Consolidated Plan Team narrowly supported this option.
• Minority Opinion: The state should not utilize a summative rating.
With repeal of the regulations, the state need only meet the requirement in the ESSA and provide the information required in the State Plan Template.
• Section 1111(c)(4)(C) of the ESSA states that the state must develop a system of meaningful differentiation of all schools based on all indicators and for all student groups.
• Section A(4)(v)(a) of the Template requires the state to describe the system of annual meaningful differentiation of all public schools in the State…that includes a description of how the system of differentiation is based on all indicators in the State’s accountability system for all students and for each subgroup of students.
At the March 29, 2017 meeting of the ASW and with the knowledge of the repeal of the regulations, a discussion was had on whether to compute and publicly report a summative rating for schools. The majority of the ASW voted in favor of computing but not publicly reporting or displaying a summative Index rating. Without a publicly displayed summative rating, a stakeholder cannot answer questions such as, “How good is the school doing? Is this school doing better than most? If so, how much better?” Such an identification is less transparent and less informative for the typical stakeholder parent than the current practice. The Board is expected to discuss the ASW recommendation to not publicly report a summative rating for schools.
The Board is expected to discuss whether to publicly report the summative Index
rating for schools.

Prepared for the May, 2017 Board Meeting
Tier Labels
In May 2013, the SBE discussed the tier rating scheme when the Index was in the midst of a major revision that would include new growth model data. At the time, the Index utilized and the Board mostly supported a five-tier system to rate schools as Exemplary, Very Good, Good, Fair, or Struggling. Also at the time, the Legislature was considering but did not pass bills requiring the OSPI and the SBE to use an A-F rating system in place of the descriptive tiers. Archived meeting materials indicate the Board historically opposed (and continue to oppose) the idea of the A-F rating system and directed staff to explore and present options for a six-tiered school rating system.
Then in July 2013, the SBE staff made a presentation to the Board addressing the Board’s concerns about the negativity of the term “Struggling” in characterizing schools. During discussion, a board member presented the option of adding a sixth tier to the revised Index which would place Focus Schools into a new Underperforming tier with other lower performing schools. The additional tier would recognize the important differences between Priority and Focus Schools. After discussing what to name the two lowest categories, the Board decided to modify the Index to include a sixth tier, label the lowest tier “Priority – Lowest 5%”, and label the second lowest tier “Underperforming”. This six-tiered system has been in use for the last four Index versions.
In the summer of 2016, the ASW put forth a recommendation to the Consolidated State Plan Team that the system of differentiation result in a color coded tier label for all schools. However, neither the ASW nor the Consolidated State Plan Team made a recommendation on the number of tiers, the color coding scheme, or the tier labels. The draft Consolidated State Plan delegated this work to an accountability workgroup to be completed prior to the Superintendent submitting the plan.
With repeal of the regulations, the state must meet only the requirement in the ESSA. Section 1111(c)(4)(D) of the ESSA specifies that a state must identify, based on the system of meaningful differentiation, schools for Comprehensive Support, Targeted Support, and additional statewide categories of schools at the discretion of the state. Section A(4)(vi) of the Updated Template requires the state to identify schools for Comprehensive Support, Targeted Support, and any other categories of schools the state may choose to identify.
At the March 29, 2017 ASW meeting, the workgroup heard a presentation from the OSPI that included tier label schemes adopted by other states in their ESSA plans. The presentation was meant to show that states have opted to include from three to six summative labels using a variety of generic to descriptive terms for the school classifications (Figure 2).
Figure 2: Examples of school labels adopted by states to meet ESSA requirements.
Example A Example B (ASW Favored) Example D Example E WA
Tier 1 Exemplary
Mastering Tier 2 Very Good
Exemplary Mentoring Tier 3 Good
Other Commendable Meeting Tier 4 Fair
Targeted Support Underperforming Leading Tier 5 Underperforming
Comprehensive Support
Lowest Performing Learning Tier 6 Lowest 5%
Prepared for the May, 2017 Board Meeting
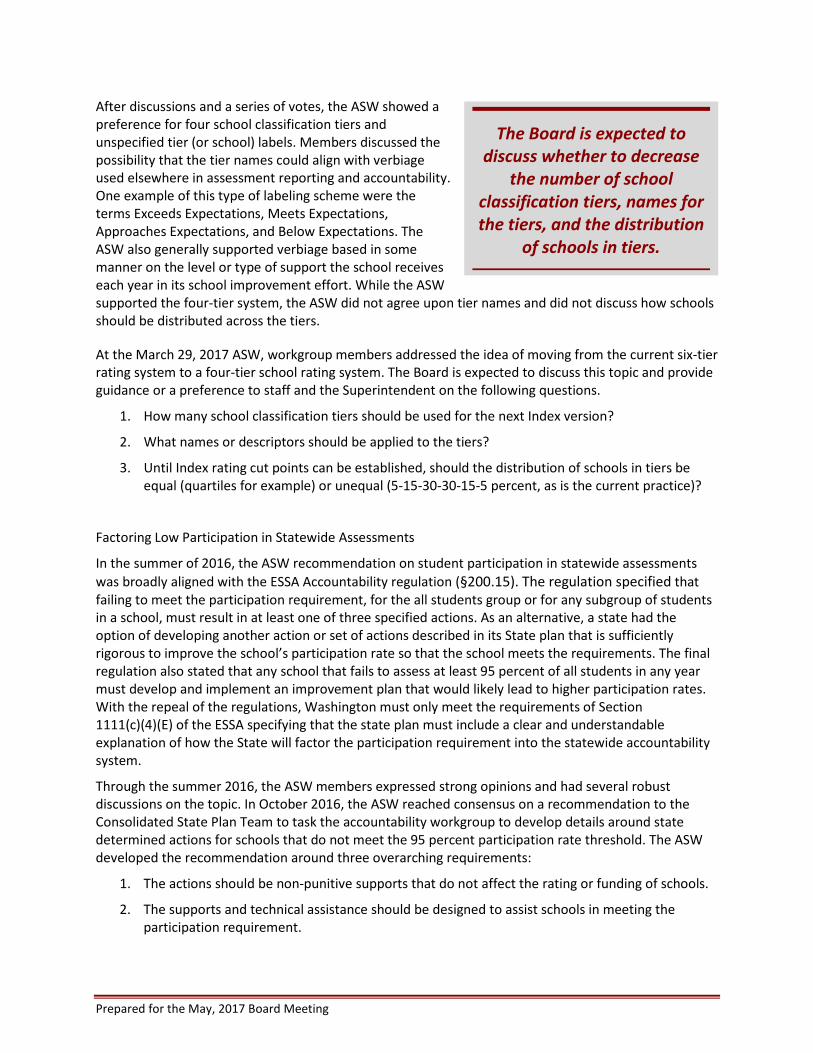
After discussions and a series of votes, the ASW showed a preference for four school classification tiers and unspecified tier (or school) labels. Members discussed the possibility that the tier names could align with verbiage used elsewhere in assessment reporting and accountability. One example of this type of labeling scheme were the terms Exceeds Expectations, Meets Expectations, Approaches Expectations, and Below Expectations. The ASW also generally supported verbiage based in some manner on the level or type of support the school receives each year in its school improvement effort. While the ASW supported the four-tier system, the ASW did not agree upon tier names and did not discuss how schools should be distributed across the tiers.
At the March 29, 2017 ASW, workgroup members addressed the idea of moving from the current six-tier rating system to a four-tier school rating system. The Board is expected to discuss this topic and provide guidance or a preference to staff and the Superintendent on the following questions.
1. How many school classification tiers should be used for the next Index version?
2. What names or descriptors should be applied to the tiers?
3. Until Index rating cut points can be established, should the distribution of schools in tiers be equal (quartiles for example) or unequal (5-15-30-30-15-5 percent, as is the current practice)?
Factoring Low Participation in Statewide Assessments
In the summer of 2016, the ASW recommendation on student participation in statewide assessments was broadly aligned with the ESSA Accountability regulation (§200.15). The regulation specified that failing to meet the participation requirement, for the all students group or for any subgroup of students in a school, must result in at least one of three specified actions. As an alternative, a state had the option of developing another action or set of actions described in its State plan that is sufficiently rigorous to improve the school’s participation rate so that the school meets the requirements. The final regulation also stated that any school that fails to assess at least 95 percent of all students in any year must develop and implement an improvement plan that would likely lead to higher participation rates. With the repeal of the regulations, Washington must only meet the requirements of Section 1111(c)(4)(E) of the ESSA specifying that the state plan must include a clear and understandable explanation of how the State will factor the participation requirement into the statewide accountability system.
Through the summer 2016, the ASW members expressed strong opinions and had several robust discussions on the topic. In October 2016, the ASW reached consensus on a recommendation to the Consolidated State Plan Team to task the accountability workgroup to develop details around state determined actions for schools that do not meet the 95 percent participation rate threshold. The ASW developed the recommendation around three overarching requirements:
1. The actions should be non-punitive supports that do not affect the rating or funding of schools.
2. The supports and technical assistance should be designed to assist schools in meeting the participation requirement.
The Board is expected to discuss whether to decrease
the number of school classification tiers, names for the tiers, and the distribution
of schools in tiers.

Prepared for the May, 2017 Board Meeting
3. Actions and supports should be tiered (which is taken to mean escalating or increasingly consequential) in the event improvement does not occur.
On the topic, the Draft Consolidated State Plan states that, the accountability workgroup shall develop details around state-determined actions for schools that do not meet 95 percent participation rate. Those actions should be non-punitive supports that do not affect the rating or funding of schools. The AAW would define and recommend these supports and the technical assistance that would be used to help schools meet 95 percent participation. The AAW would also recommend and define tiered accountability if improvement wasn’t made.
As presented to the ASW on March 29 and again on April 12, the current practices of the OSPI would likely meet the requirements of the ESSA and be approved by the USED. On the topic of factoring low participation rates into statewide accountability, Washington currently takes the following actions.
• Students who do not participate but should have participated are assigned a scaled score of zero and are counted as non-proficient. This action could result in a lower proficiency rate for the school and a lower school Index rating.
• Schools not meeting the participation requirement must address the issue in their annual School Improvement Plan (SIP) by designing and implementing actions for the purpose of increasing the participation in statewide assessments.
• Schools not meeting the participation rate threshold for the all students group are not eligible for recognition.
The ASW has yet to engage in the next round of discussions on the role of low participation in school accountability, but the topic was on the agenda for the April 25th ASW that was postponed. There is a strong likelihood that the topic will be on the agenda of the next ASW meeting. In the meantime, the Board is expected to have a discussion on the topic in order to provide guidance to the ASW in making a recommendation to the Superintendent. As part of the discussion, the Board may want to consider these questions.
1. The current practices listed above might be considered as punitive by some. Should some or all of the current practices be eliminated? If there are no consequences (non-punitive) for low participation, what will incentivize a change in behavior?
2. Should escalating actions include some type of warning for schools when participation rates are not adequate? How many warnings should a school receive before a support or intervention is implemented?
3. While requiring an annual participation threshold for all student groups, the ESSA does not prohibit the use of averaging for the statewide accountability system. Do you support the idea of exploring options for a two- or three-year uniform averaging for schools or student groups as a means to meet the 95 percent participation requirement?
ESSA Technical Advisory Committee
In a March 24 email to a select group of data savvy individuals, Superintendent Reykdal announced the creation of a new Accountability Technical Advisory Committee (TAC). The TAC’s mission is to provide
The Board will want to discuss how to factor low
participation rates into the school accountability
system. Are the current practices sufficient? Too rigorous? Too forgiving?
Prepared for the May, 2017 Board Meeting
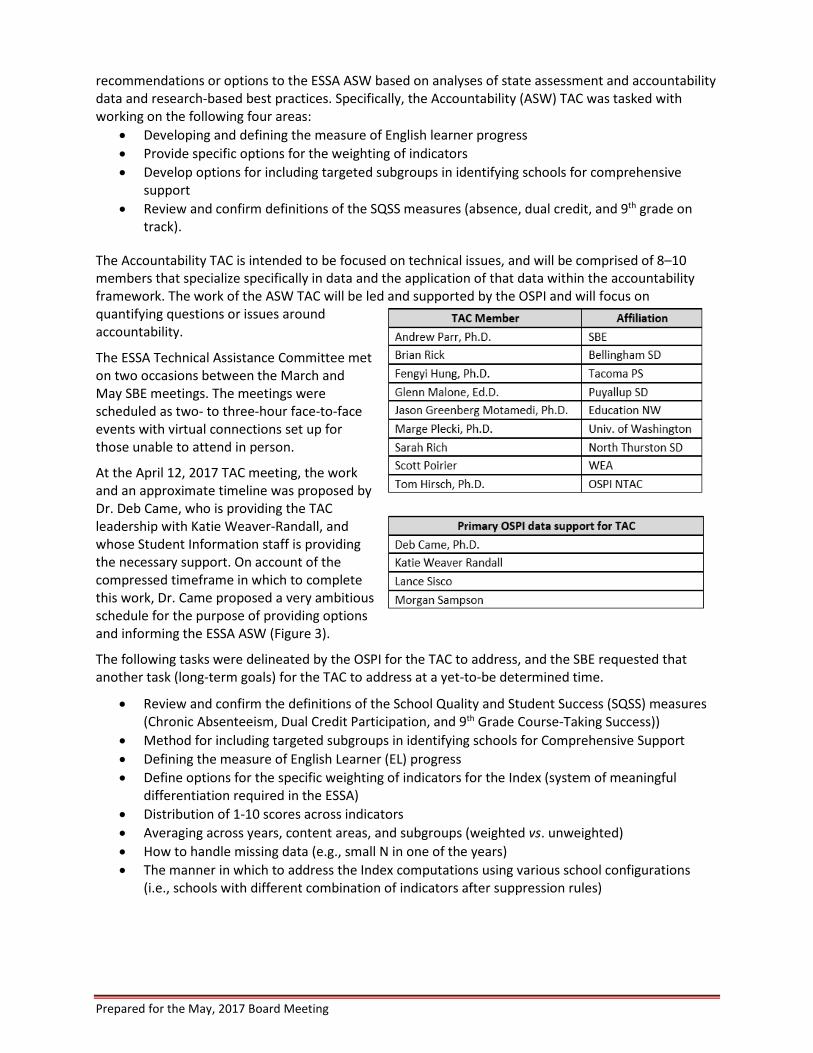
recommendations or options to the ESSA ASW based on analyses of state assessment and accountability data and research-based best practices. Specifically, the Accountability (ASW) TAC was tasked with working on the following four areas:
• Developing and defining the measure of English learner progress • Provide specific options for the weighting of indicators • Develop options for including targeted subgroups in identifying schools for comprehensive
support • Review and confirm definitions of the SQSS measures (absence, dual credit, and 9th grade on
track).
The Accountability TAC is intended to be focused on technical issues, and will be comprised of 8–10 members that specialize specifically in data and the application of that data within the accountability framework. The work of the ASW TAC will be led and supported by the OSPI and will focus on quantifying questions or issues around accountability.
The ESSA Technical Assistance Committee met on two occasions between the March and May SBE meetings. The meetings were scheduled as two- to three-hour face-to-face events with virtual connections set up for those unable to attend in person.
At the April 12, 2017 TAC meeting, the work and an approximate timeline was proposed by Dr. Deb Came, who is providing the TAC leadership with Katie Weaver-Randall, and whose Student Information staff is providing the necessary support. On account of the compressed timeframe in which to complete this work, Dr. Came proposed a very ambitious schedule for the purpose of providing options and informing the ESSA ASW (Figure 3).
The following tasks were delineated by the OSPI for the TAC to address, and the SBE requested that another task (long-term goals) for the TAC to address at a yet-to-be determined time.
• Review and confirm the definitions of the School Quality and Student Success (SQSS) measures (Chronic Absenteeism, Dual Credit Participation, and 9th Grade Course-Taking Success))
• Method for including targeted subgroups in identifying schools for Comprehensive Support • Defining the measure of English Learner (EL) progress • Define options for the specific weighting of indicators for the Index (system of meaningful
differentiation required in the ESSA) • Distribution of 1-10 scores across indicators • Averaging across years, content areas, and subgroups (weighted vs. unweighted) • How to handle missing data (e.g., small N in one of the years) • The manner in which to address the Index computations using various school configurations
(i.e., schools with different combination of indicators after suppression rules)

Prepared for the May, 2017 Board Meeting
On April 26, the ASW TAC discussed aspects of the SQSS measures for the purpose of creating precise definitions suitable for school accountability. The OSPI provided numerator and denominator options for each of the SQSS measures, and data from which to analyze and assess results. After a robust discussion, the TAC was in fairly good agreement as to the most suitable options for the Dual Credit Participation measures and the Chronic Absenteeism measure, while the discussion on the 9th Grade Course-Taking Success measure was cut short. The TAC is presently analyzing de-identified live data to support the recommendation-making process. Several themes to the discussions are noteworthy.
• The TAC is carefully considering how potential measures differentially impact various student groups. In other words, the measures are examined through an equity lens.
• The TAC is examining the results for bias based on various school factors and different school grade-level configurations.
• The TAC is assessing the definition options in a manner that increases the visibility of all student groups, especially the groups with small N-counts at schools whose results are more often than no suppressed.
• The TAC is taking care to ensure the definitions are fair to schools and do not require additional data collections or additional reporting burdens for schools or districts.
Figure 3: Approximate timeline and tasks for the ASW Technical Assistance Committee.
Date TAC Activity and Work Requirement
April 12 TAC Meeting: Orientation to work; identify TAC’s data needs, and agreement on approach to getting the tasks completed.
April 17-21 OSPI provide data to TAC on the three SQSS measures to support April 26th TAC meeting discussion.
April 26 TAC Meeting: Discuss the three SQSS measures and create measure definitions recommendations; introduce discussion on low N size for all measures.
May 1-5 OSPI provide data to TAC on all measures to support discussion of low N sizes for May 10th TAC meeting discussion
May 10 TAC Meeting: Discuss low N sizes and craft recommendation; introduce discussion of 1-10 rating for each subgroup.
May 15-19 OSPI provide data to TAC to support discussion on 1-10 rating for each subgroup and how to combine targeted and all students into one score for each measure.
May 24 TAC Meeting: Discuss 1-10 rating for each subgroup and approaches to combining targeted and all students into one score.
May 29-June 2 OSPI provide data to TAC that has all the measures, by school with all decisions
applied so TAC can work with different weighting to see how it impacts different size schools and schools with different proportions of targeted groups.
June 7 TAC Meeting: Finalize recommendations in briefing papers and measure documentation template for presentation to the ASW.
June 21 TAC Meeting: Finalize recommendations in briefing papers and measure documentation template for presentation to the ASW.

Prepared for the May, 2017 Board Meeting
On April 13, the SBE requested that the OSPI consider tasking the ASW TAC with reviewing the methodology and data for the long-term goal setting required in state law and the ESSA. The Draft Consolidated State Plan describes the long-term goals for the Achievement indicator as a combination of the students meeting standard on state assessments plus those who are not meeting standard but are making adequate growth toward proficiency, as indicated by the Washington Growth Model.
Action
The Board is expected to discuss all of these topics and provide guidance for staff for their work in the reconvened ESSA workgroups.
Hyperlinks to websites and documents referenced in the text of this memo:
NASBE Policy Update on the questions State Boards should be asking about their ESSA State Plans.
http://www.nasbe.org/wp-content/uploads/Amundson_State-Plans-Final.pdf
Washington ESSA Draft Plan http://www.k12.wa.us/ESEA/ESSA/pubdocs/WashingtonESSADraftConsolidatedPlan.pdf
Summary of public comments on the ESSA Draft Plan
http://www.k12.wa.us/ESEA/ESSA/pubdocs/WashingtonESSADraftConsolidatedPlan.pdf
Summary of ESSA State Plans submitted during the early-April submission window
http://www.edweek.org/ew/section/multimedia/key-takeaways-state-essa-plans.html
Additional information on the 2016 Washington Achievement Awards.
http://www.k12.wa.us/EducationAwards/WashingtonAchievement/

Prepared for the May, 2017 Board Meeting
Appendix A – What does the Repeal of the Accountability Regulations Mean?
Factoring Participation on Assessments in Statewide Accountability
WHAT THE ESSA SAYS: Section 1111(c)(4)(E) of the ESSA specifies that the state must annually measure the achievement of not less than 95 percent of all students, and 95 percent of all students in each subgroup of students, who are enrolled in public schools on the statewide assessments. The state plan must include a clear and understandable explanation of how the State will factor the participation requirement into the statewide accountability system.
WHAT THE REGULATIONS SAY: The final regulation (§200.15) specifies that falling short of the participation requirement, for the all students group or for any subgroup of students in a school, must result in at least one of the following actions:
1. A lower summative determination in the State’s system of annual meaningful differentiation.
2. The lowest performance level on the Academic Achievement indicator in the State’s system of annual meaningful differentiation.
3. Identification for, and implementation of, a targeted support and improvement plan.
4. Another State-determined action or set of actions described in its State plan that is sufficiently rigorous to improve the school’s participation rate so that the school meets the requirements.
The final regulation also states that any school that fails to assess at least 95 percent of all students or 95 percent of each subgroup of students in any year must develop and implement an improvement plan as described below.
1. Is developed in partnership with stakeholders (including principals and other school leaders; teachers; and parents and, as appropriate, students);
2. Includes one or more strategies to address the reason or reasons for low participation rates in the school and improve participation rates in subsequent years;
3. Is reviewed and approved by the LEA prior to implementation; and
4. Is monitored, upon submission and implementation, by the LEA; and
The regulation also specifies that an LEA with a significant number or percentage of schools that fail to assess at least 95 percent of all students or 95 percent of each subgroup of students in any year must develop and implement an improvement plan that includes additional actions to support effective implementation of the school-level plans described above and that is reviewed and approved by the State.
WHAT THE TEMPLATE ASKS FOR: Section A(4)(vii) of the Updated Template requires a description as to how the state factors the requirement for 95 percent student participation in statewide mathematics and reading/language arts assessments into the statewide accountability system. The language in the template is closely aligned with the language in the law Section 1111(c)(4)(E)(iii).
COMMENTS: With the repeal of §200.15 and unless new regulations are adopted by the USED, a state will only be required to provide a description as to the manner in which the requirement for 95 percent student participation in statewide mathematics and reading/language arts assessments will factor into the statewide accountability system. This is all that is currently required in Section A(4)(vii) of the Updated Template.
Prepared for the May, 2017 Board Meeting
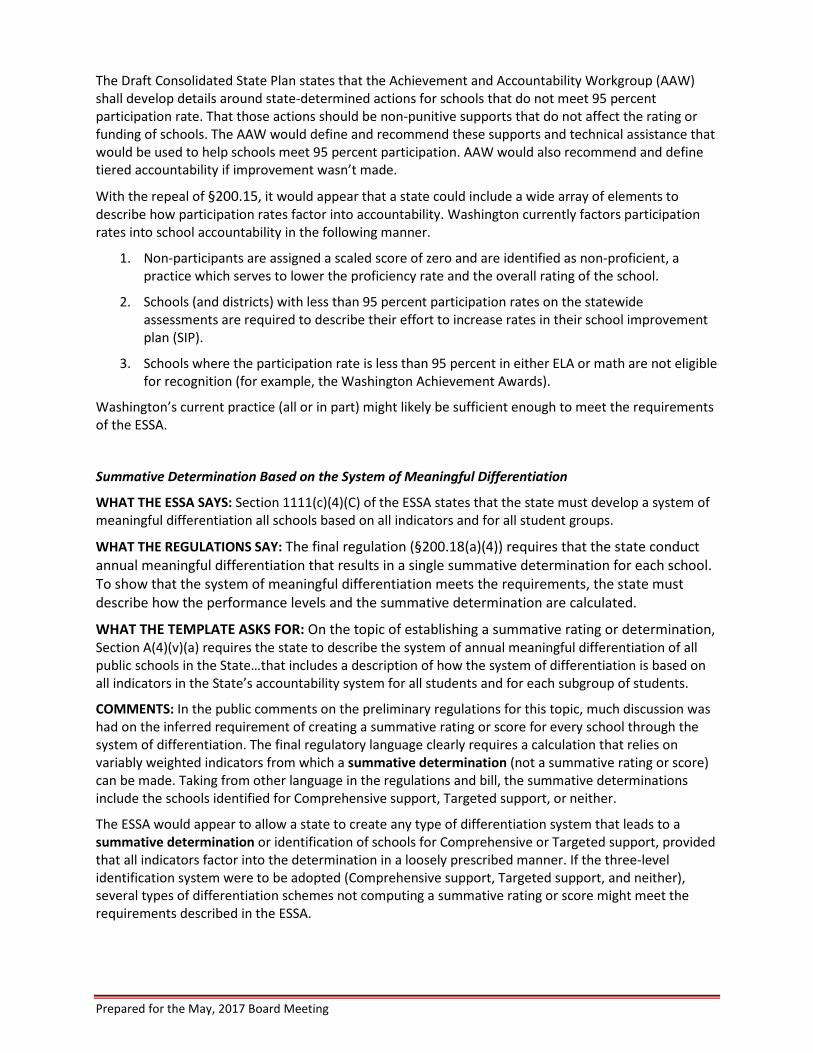
The Draft Consolidated State Plan states that the Achievement and Accountability Workgroup (AAW) shall develop details around state-determined actions for schools that do not meet 95 percent participation rate. That those actions should be non-punitive supports that do not affect the rating or funding of schools. The AAW would define and recommend these supports and technical assistance that would be used to help schools meet 95 percent participation. AAW would also recommend and define tiered accountability if improvement wasn’t made.
With the repeal of §200.15, it would appear that a state could include a wide array of elements to describe how participation rates factor into accountability. Washington currently factors participation rates into school accountability in the following manner.
1. Non-participants are assigned a scaled score of zero and are identified as non-proficient, a practice which serves to lower the proficiency rate and the overall rating of the school.
2. Schools (and districts) with less than 95 percent participation rates on the statewide assessments are required to describe their effort to increase rates in their school improvement plan (SIP).
3. Schools where the participation rate is less than 95 percent in either ELA or math are not eligible for recognition (for example, the Washington Achievement Awards).
Washington’s current practice (all or in part) might likely be sufficient enough to meet the requirements of the ESSA.
Summative Determination Based on the System of Meaningful Differentiation
WHAT THE ESSA SAYS: Section 1111(c)(4)(C) of the ESSA states that the state must develop a system of meaningful differentiation all schools based on all indicators and for all student groups.
WHAT THE REGULATIONS SAY: The final regulation (§200.18(a)(4)) requires that the state conduct annual meaningful differentiation that results in a single summative determination for each school. To show that the system of meaningful differentiation meets the requirements, the state must describe how the performance levels and the summative determination are calculated.
WHAT THE TEMPLATE ASKS FOR: On the topic of establishing a summative rating or determination, Section A(4)(v)(a) requires the state to describe the system of annual meaningful differentiation of all public schools in the State…that includes a description of how the system of differentiation is based on all indicators in the State’s accountability system for all students and for each subgroup of students.
COMMENTS: In the public comments on the preliminary regulations for this topic, much discussion was had on the inferred requirement of creating a summative rating or score for every school through the system of differentiation. The final regulatory language clearly requires a calculation that relies on variably weighted indicators from which a summative determination (not a summative rating or score) can be made. Taking from other language in the regulations and bill, the summative determinations include the schools identified for Comprehensive support, Targeted support, or neither.
The ESSA would appear to allow a state to create any type of differentiation system that leads to a summative determination or identification of schools for Comprehensive or Targeted support, provided that all indicators factor into the determination in a loosely prescribed manner. If the three-level identification system were to be adopted (Comprehensive support, Targeted support, and neither), several types of differentiation schemes not computing a summative rating or score might meet the requirements described in the ESSA.

Prepared for the May, 2017 Board Meeting
School Designations, Classifications and Labels
WHAT THE ESSA SAYS: Section 1111(c)(4)(D) of the ESSA specifies that a state must identify, based on the system of meaningful differentiation, schools for comprehensive, targeted support, and additional statewide categories of schools at the discretion of the state.
WHAT THE REGULATIONS SAY: The final regulation (§200.18) requires that each state’s accountability system meaningfully differentiates schools by providing them with at least three distinct, clear, and understandable categories. The state may either use:
1. Determinations that include the two categories of schools required to be identified for support a. schools identified for comprehensive support and improvement and b. targeted support and improvement) and c. a third category of unidentified schools, or
2. Determinations distinct from the categories of schools described in § 200.19.
WHAT THE TEMPLATE ASKS FOR: Section A(4)(vi) of the Updated Template requires the state to identify schools for Comprehensive Support, Targeted Support, and any other categories of schools the state may choose to identify. The language in the template is very closely aligned with the language in §200.18.
COMMENTS: At a minimum, states are required to identify, classify, and otherwise label only schools for support, as schools not identified for support could receive no label or be labeled as “other”. This would be similar to the three-label system developed for the No Child Left Behind Act (NCLB) that utilized an In Need of Improvement, Watch, and Made AYP labels. Under the ESEA Flexibility Waivers, many states migrated to school multi-tier school rating systems to provide the public and other stakeholders with a more transparent and broad overview of the performance of schools.
If a state were to meet the minimum requirements on this topic, the state would be de facto following the school classification model of NCLB. Providing no classification or label for schools not identified for support would broadly imply similarity when, in fact, the performance of the various schools would likely be very different. Meeting the minimum requirements might make it look as though the state is making an effort to conceal the performance of schools or be providing less transparency when the public generally seeks more transparency.
Establishment of Long-Term Goals (Achievement)
WHAT THE ESSA SAYS: Section 1111(c)(4)(A) of the ESSA specifies that the state must establish ambitious long-term achievement goals, which shall include measurements of interim progress toward meeting such goals for the all students group and for each subgroup of students as measured by proficiency on the annual assessments.
WHAT THE REGULATIONS SAY: The corresponding regulation (§200.13) states that the state plan must:
1. Identify the ambitious State-designed long-term goals and measurements of interim progress for improved academic achievement, as measured by the percentage of students attaining grade-level proficiency … for all students and separately for each subgroup of students …
2. Describe how the state established those goals and measurements of interim progress.
3. Apply the same academic achievement standards to all public school students in the State, except as provided for students with the most significant cognitive disabilities…
4. Measure achievement separately for reading/language arts and for mathematics.

Prepared for the May, 2017 Board Meeting
5. Take into account the improvement necessary for each subgroup of students to make significant progress in closing statewide proficiency gaps, such that the State’s measurements of interim progress require greater rates of improvement for subgroups of students that are lower-achieving.
WHAT THE TEMPLATE ASKS FOR: Section A(4)(iii)(a) of the Updated Template poses a three-part question on the topic of long-term goals for the achievement indicator as follows.
1. Describe the long-term goals for improved academic achievement, as measured by proficiency on the annual statewide reading/language arts and mathematics assessments, for all students and for each subgroup of students, including:
a. the timeline for meeting the long-term goals, for which the term must be the same multi-year length of time for all students and for each subgroup of students in the State, and
b. How the long-term goals are ambitious. 2. Provide the measurements of interim progress toward meeting the long-term goals for
academic achievement in Appendix A. 3. Describe how the long-term goals and measurements of interim progress toward the long-term
goals for academic achievement take into account the improvement necessary to make significant progress in closing statewide proficiency gaps.
COMMENTS: In this case the Updated Template requires the state to provide information in the State Plan that is very similar to the regulatory language. However, the law specifies that the goal be “measured by proficiency” instead of being “measured by the percentage of students attaining grade-level proficiency [on the statewide assessments].” The combination of repealing §200.13 and the reduced specificity in the law would appear to allow states more latitude in defining the criteria for setting long-term goals. For example, the combination of the following measures would appear to meet the requirements in law.
• Students meeting or exceeding standard on the statewide assessments plus
• Students not meeting or exceeding standard on the statewide assessments, but meeting their individual adequate growth percentile (AGP).
In this example, the two student groups described above would comprise the numerator and the total students tested would comprise the denominator. The resulting measure (percentage of students who are proficient or on-track to proficiency) is being “measured by proficiency.”

Prepared for the May, 2017 Board Meeting
Appendix B
Summary Table of the ESSA State Plans submitted to the U.S. Department of Education during the April submission window. Created by Education Week and can be retrieved from:
http://www.edweek.org/ew/section/multimedia/key-takeaways-state-essa-plans.html
Prepared for the May, 2017 Board Meeting
Prepared for the May, 2017 Board Meeting
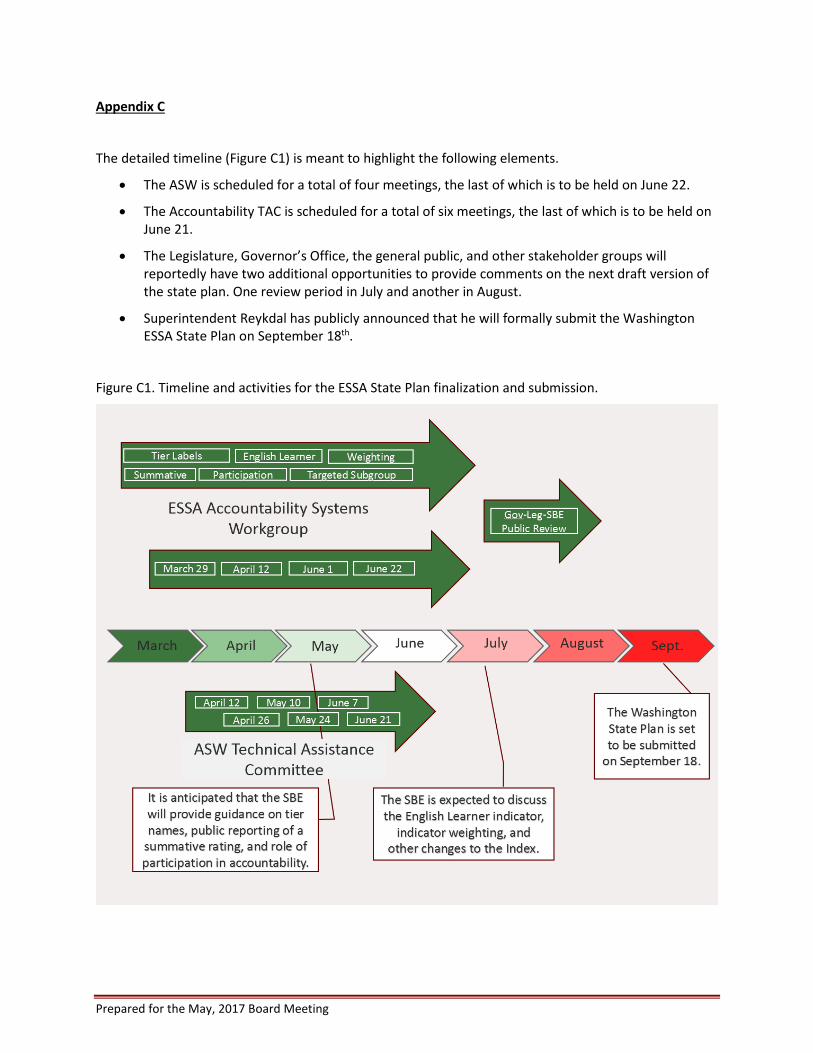
Appendix C
The detailed timeline (Figure C1) is meant to highlight the following elements.
• The ASW is scheduled for a total of four meetings, the last of which is to be held on June 22.
• The Accountability TAC is scheduled for a total of six meetings, the last of which is to be held on June 21.
• The Legislature, Governor’s Office, the general public, and other stakeholder groups will reportedly have two additional opportunities to provide comments on the next draft version of the state plan. One review period in July and another in August.
• Superintendent Reykdal has publicly announced that he will formally submit the Washington ESSA State Plan on September 18th.
Figure C1. Timeline and activities for the ESSA State Plan finalization and submission.
Prepared for the May, 2017 Board Meeting
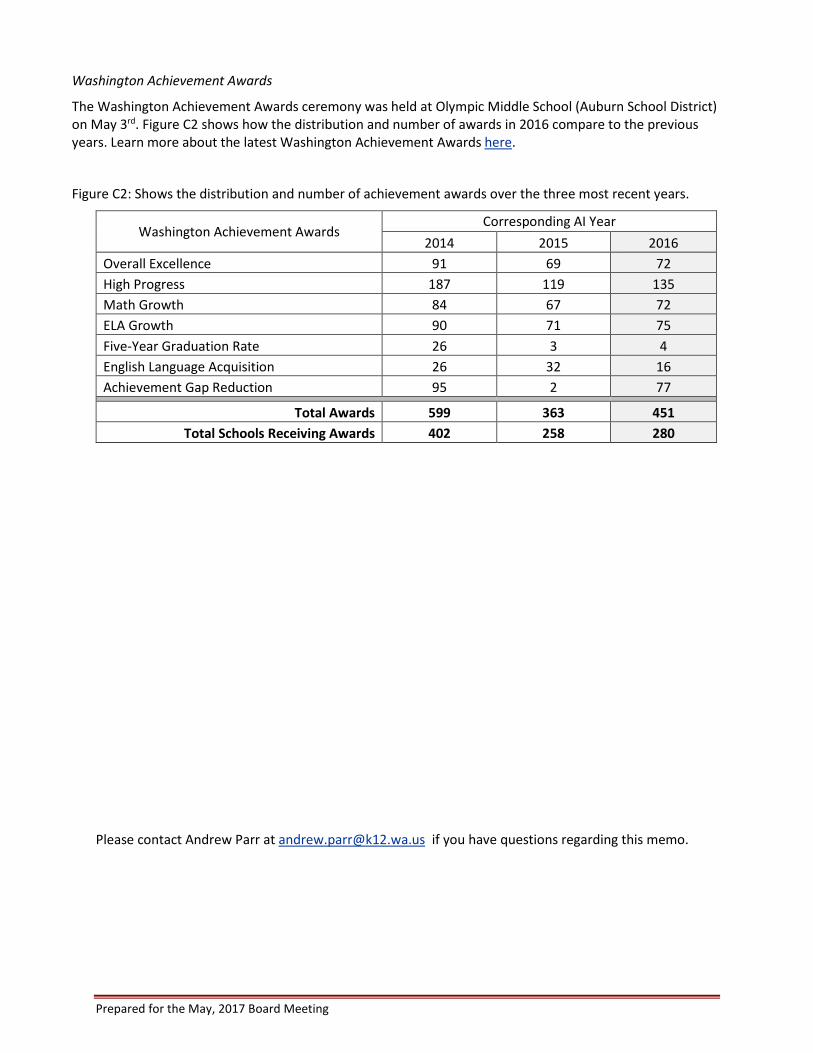
Washington Achievement Awards
The Washington Achievement Awards ceremony was held at Olympic Middle School (Auburn School District) on May 3rd. Figure C2 shows how the distribution and number of awards in 2016 compare to the previous years. Learn more about the latest Washington Achievement Awards here.
Figure C2: Shows the distribution and number of achievement awards over the three most recent years.
Washington Achievement Awards Corresponding AI Year
2014 2015 2016 Overall Excellence 91 69 72 High Progress 187 119 135 Math Growth 84 67 72 ELA Growth 90 71 75 Five-Year Graduation Rate 26 3 4 English Language Acquisition 26 32 16 Achievement Gap Reduction 95 2 77
Total Awards 599 363 451
Total Schools Receiving Awards 402 258 280
Please contact Andrew Parr at [email protected] if you have questions regarding this memo.

National Association of State Boards of Education
Vol. 21, No. 3November 2014
Seven Questions Boards Should Ask about Their ESSA State Plans
By Kris Amundson
Vol. 24, No. 2March 2017
Returning more responsibility to states for making education policy was the central premise (and promise) of the Every Student Succeeds Act (ESSA). In fact, the Wall Street Journal called ESSA “the biggest devolution of federal control to the states in a quarter century.”1 Shortly after the bill passed in December 2015, states set to work on plans for using ESSA to shape policy in their states. Their assumption was that the federal government would provide some regulatory “guardrails” to guide that work.
With the recent congressional decision to rescind the accountability regulations for ESSA by invoking the Congressional Review Act (CRA), states fi nd themselves with even more authority. How will they approach the challenges and opportunities ESSA provides? Will they ensure equity and excellence for all students?
We will fi nd out soon. In April or September, states will fi le comprehensive plans for how they plan to spend federal funding.2 Each state is different, and each state plan will be developed within the context of its own polit-ical and educational landscape. Since some state plans are already available online, it is possible to see how the early birds are approaching equity and excellence.
State education agencies (SEAs) have the primary responsibility for developing and fi ling the state plan. But state boards of education play a key role. In many states, the board has specifi c statutory responsibility for carrying out some elements of the plan. For example, a recent NASBE publication reported that in 31 states, state boards have
primary authority over the state summative assessment.3 In addition, 45 state boards adopt the learning standards on which the assessment should be aligned.
In addition, state boards are highlighted in ESSA as one of the groups that must be provided “meaningful” consultation. And because state boards serve as the citizen voice in education, they should also ensure that the state plan refl ects input gained from stakeholders during the planning process.
In most states, the board will take a formal vote to approve the plan before it is sent on to the U.S. Department of Education (ED). Here are seven big questions board mem-bers should have answered before they vote.
1. WHAT ARE OUR GOALSFOR IMPROVING K-12 STUDENT PERFORMANCE AND OUTCOMES? Under the accountability regulations that were invalidated by the CRA, the Education Department noted: “The fi nal regulations give states fl exibility to create their own educational visions and incorporate new measures of school quality or student suc-cess into their accountability systems while maintaining the core expectation that states, districts, and schools work to improve aca-demic outcomes for all students, including individual subgroups of students.”4 (emphasis added)
That emphasis on creating a unique state vision should still permeate the state plan—even without these regulations. And an effective state plan must begin with clear goals. As Lewis Carroll said, “If you don’t know where you’re going, any path will take you there.”
State boards should ensure that their state
plan is built around ambitious goals and also ask for information about how those goals (and the timeline for achieving them) were developed. For states without a strategic plan, stakeholder input can help identify these overarching goals.
A focus on the goals will help boards and SEAs make tough choices on where to prior-itize federal funding. For example, if the state wants to prioritize closing the achievement gap in third grade reading profi ciency, then helping teachers strengthen their ability to teach literacy skills should be a focus of the state’s professional learning.
The District of Columbia’s plan, for example, sets a long-term goal that 85 percent of students will be profi cient in reading. The plan further spells out that the goal applies to all students. Clearly, the need to close the achievement gap will need to drive many other decisions.
States that want to focus on providing all students with a well-rounded education could include inputs as part of their school accountability system. As part of its ESSA plan, Louisiana will begin the development of an “Interests and Opportunities” indicator, designed to promote a well-rounded educa-tion. The indicator will measure, for example, the extent to which elementary and middle schools are exposing students to high-quality arts and foreign language experiences. At the high school level, it will measure and evaluate schools’ efforts to expand access to advanced courses in both applied and academic fi elds. In all schools, the index aspires to measure not only the expansion of such experiences for students but also the extent to which students of all backgrounds experience the offerings fairly.
Here are some questions state boards should ask about the state plan’s goals:
• Has our state gone through a formalgoal-setting process?
• If not, how did the state develop the

goals on which the current state plan is based?
• Does our state ESSA plan support thosegoals? How/how not?
2. HOW WILL OUR PLANPROTECT EQUITY?Congress’s action under the CRA not only eliminates the key equity protections that were included in the ESSA accountabil-ity regulations, it prevents ED from ever creating regulations that are “substantially the same”—unless Congress subsequently gives it the power to do so.
So it is up to states. They must guarantee that their state plans continue to look at prom-ising practices such as a focus on growth rather than profi ciency or inclusion of metrics that incorporate civic or career readiness in addition to summative tests. Yet will SEAs, conditioned by years of the compliance-based accountability created under No Child Left Behind, be willing to innovate? Clearly, state boards need to keep asking questions that encourage innovative approaches.
States also need to call out their commit-ment to equity. In Ohio, which has adopted a “third grade reading guarantee,” the state plan notes: “Reading is the foundation for all learning. We must identify and address reading issues as early as possible.” The K-3 Literacy component looks at how successful a school is at getting struggling readers on track to proficiency in third grade and beyond.
Here are some questions state board mem-bers should ask to ensure that the state plan focuses on equity:
• How does this plan help us improve per-formance for students of color, students with disabilities, and students from low-income families?
• Does the state plan ensure both equityand excellence? Or does it achieve equity by defi ning profi ciency down?
• How does the state plan communicatethe importance of equity to all stakeholders?
3. HOW DOES OUR PLANPROMOTE FLEXIBILITY IN ALLOCATING FEDERAL FUNDING? State plans cover a wide range of federal programs. For years, states have asked for greater fl exibility to allocate federal funds to address their greatest needs. ESSA offers some opportunities to move away from rigid federal requirements, but there will need to be changes on the state level to make that possible.
The plans must spell out how the state expects to allocate resources from each of the federal programs for which it will receive funds, including the following:
• Title I, Part A (fi nancial assistance tolocal education agencies and schools with high numbers or high percentages of children from low-income families to help ensure that all children meet challenging state academic standards);
• Title I, Part C (high-quality and compre-hensive educational programs for migratory children);
• Title I, Part D (educational services forneglected or delinquent children and youth in local and state institutions);
• Title II, Part A (the Teacher and PrincipalTraining and Recruitment Fund);
• Title III, Part A (helps institutions of high-er education support low-income students);
• Title IV, Part A (supports Student Supportand Academic Enrichment Grants);
• Title IV, Part B (supports educationalactivities in community learning centers);
• Title V, Part B, Subpart 2 (supportscharter schools);
• The McKinney Vento Homeless Assis-tance Act (supports educational programs for homeless students).
The consolidated state plan is one way to coordinate and comprehensively plan for the use of federal funds that provide critical support to schools and districts. Board mem-bers should ask whether and how their state plans to take advantage of this fl exibility and what regulatory changes or internal SEA ad-justments will be necessary (for one example from Louisiana, see box).
There is another way to increase fl exibility of federal funding to focus on the needi-est children: schoolwide Title I programs, which allow Title I funds to support reforms that benefi t every student in a school that enrolls low-income students. Schoolwide programs also allow for Title I funds to be combined with other federal and state funding streams, which can focus a number of smaller funding streams into a larger and higher-impact investment opportuni-ty. Schoolwide programs can also reduce administrative overhead.
Here are some questions state board mem-bers should ask:
• Does our state have a vision for all stu-dents that drives state spending decisions?
• Does this plan set out a comprehensiveapproach to meeting student needs, or does it keep funding strictly segregated by category?
• How will the SEA help local districtsbuild their capacity for more fl exible uses of federal funding?
• Has our state considered moving toschoolwide Title I funding? What policy changes would the state need to make?
• Will any state policies need to bechanged to permit greater fl exibility?
• How will the SEA work with ED to imple-ment the desired fl exibility?
BOX 1: LOUISIANA PLANS TO TAKE ADVANTAGE OF FLEXIBILITY
In Louisiana, one goal of the state plan is to narrow achievement gaps between students with disabilities and their nondisabled peers. Accordingly, their plan specifi es that districts should use funding from a variety of federal sources. School systems in Louisiana will thus include Title I, Title II, and Title III investments such as the following in their annual plans to address the challenges of historically disadvantaged students:
• high-quality, early screening andcontinued monitoring until the student is exited effectively from additional support services such as academic interventions, special education, or English language services;
• interventions and instructional prac-tices that help students access grade-lev-el learning along with their peers rather than maintaining a below-level learning gap; and
• school structures for learning that arethe least disruptive and best integrated for a student’s needs.
4. HOW DOES OUR STATE PLANIMPROVE THE QUALITY OF TEACHERS AND EDUCATION LEADERS?Research has consistently shown that teachers are the single most important in-school factor affecting student achievement. More recently, researchers have established clear links between school leadership and student achievement.5 State boards that want to focus on equity must pay attention to the quality of teachers and leaders in their schools.
State boards have a signifi cant role to play. In 33 states, the board has full control over teacher licensure, and in two additional states, that responsibility is shared. In Massachusetts, the Board of Elementary and Secondary Education (BESE) included teach-er quality in its strategic plan. In 2012, BESE changed the program approval standards for teacher preparation programs across the state. These new standards ensure that teachers entering Massachusetts classrooms will be prepared to be effective on day one.
In addition, most boards control the licensure for principals and other administrators. In 36 states, boards have full or partial authority for principal/administrator licensure or the standards for their preparation and certifi ca-tion programs.
Boards also have responsibility for ensur-ing that students living in poverty, English learners, and minority students are not disproportionately served by teachers who are inexperienced, teaching out of their fi eld, or ineffective. The Elementary and Second-ary Education Act requires states to report out on the distribution of these teachers, and states should ensure that their plan makes some provision for keeping track of the quality of educators who teach the neediest students.6
NASBE’s State Board Insight database tracks the frequency with which state boards discuss issues of teacher supply and teacher quality. The subjects appear frequently on state board agendas. Most recently, for example, the New York Board of Regents ad-dressed licensure issues within the context of teacher shortages.
To focus on teacher and leader quality, here are questions boards should ask:
• How is our state plan designed to attract,
prepare, develop, and retain effective teach-ers and leaders? How do the proposed activ-ities help develop teachers and leaders who can support and strengthen the performance of all students in the state?
• How does the plan address the need torecruit and retain teachers and leaders in high-needs areas, including special educa-tion, STEM, and other shortage areas?
• How does the plan help principals devel-op the leadership skills they need to support the development of effective teachers?
5. DOES OUR ACCOUNTABILITYSYSTEM MEASURE WHAT WE WANT STUDENTS TO KNOW? One of the criticisms of NCLB-era account-ability was that too many state summative assessments focused on relatively low-level thinking tasks. Other critics pointed out that too often state assessments did not measure the things that state policymakers thought were most important.
ESSA gives states the opportunity to change that. By relying on multiple measures of achievement, states can focus on issues they care about, including social and emotional learning or career readiness.
For example, the Massachusetts state plan explicitly highlights the commitment to high-er order thinking: “The state will upgrade the MCAS to better measure the critical thinking skills students need for success in the 21st century.”
The state accountability system may include student growth or profi ciency/mastery. For states that want to highlight continuous improvement, a growth measure (measuring students across two or more points in time) would make sense. For those states that focus on ensuring all students meet at least a basic level of understanding, a profi ciency/mastery metric (measuring students at a single point in time) might be better aligned with that goal.
To ensure that the state accountability system measures the things the board wants students to know, here are some questions board members should ask:
• Please share the components of ourstate assessment. How much time do students spend writing versus answering multiple choice questions, for example?
• How does our state assessment measurestudent knowledge beyond memorization?
• How do the components of our account-ability system fi t together to measure the goals we have adopted?
6. HOW WILL OUR STATEEVALUATE AND SUPPORT LOCAL PLANS FOR LOW-PERFORMING SCHOOLS? Persistently underperforming schools have been a continuing challenge in education. Over the years, the federal government has tried many approaches to address this problem. Most recently, the Obama ad-ministration authorized $7 billion in School Improvement Grants (SIG) between 2010 and 2015.
Schools receiving SIG funds needed to adopt one of a limited number of turnaround models. Initially, there were four preferred approaches: replacing the principal and at least half the teachers, converting into a charter school, closing altogether, or under-going a “transformation,” including hiring a new principal and adopting new instructional strategies, new teacher evaluations, and a longer school day.
Eventually, the program allowed more fl exibility, but it remained prescriptive. The federal government’s own analysis of the SIG program revealed a major problem: None of the approaches worked very well.7 The report concluded: “We found that the implementation of SIG-funded models had no signifi cant impact on math or reading test scores, high school graduation, or college enrollment for schools near the SIG eligibility cutoff. In addition, there were no signifi cant impacts within student and school sub-groups. For elementary grades, we found no evidence suggesting that one model was more effective at improving student achieve-ment than another.”
With ESSA, the pendulum swung in the other direction. The law now gives primary responsibility to local districts for designing a plan to support low-performing schools. The state’s role is more supportive, ensuring that local districts adopt “evidence-based” interventions and checking in on progress.
ESSA authorizes two new programs that can be focused on lower-performing schools and districts: Direct Student Ser-vices and Student Support and Academic Enrichment grants. The two programs

POLICY UPDATES are developed and produced at the National Association of State Boards of Education, 333 John Carlyle Street, Suite 530, Alexandria, VA 22314 •703.684.4000 • www.nasbe.org. Kristen Amundson, President/CEO. Valerie Norville, Editorial Director. All rights reserved.
The National Association of State Boards of Education represents America’s state and territorial boards of education. Our principal objectives are to strengthen state leadership in education policymaking, advocate equality of access to educational opportunity, promote excellence in the education of all students, and ensure responsible lay governance of education. Learn more at www.nasbe.org.
NASBE
offer the fl exibility to tailor investments based on the needs of their unique student populations, particularly students attending schools where enriching experiences and challenging coursework are rare.
Here are some questions state board mem-bers should ask about local improvement programs:
• Has our state identifi ed a vision fora system to support school improvement statewide?
• What has our state done previously?What has worked? What has not?
• What lessons can we learn from oursuccesses and failures?
• Is our state’s turnaround vision a partof our strategy for developing teachers and school leaders? How can state policies develop and support educators working in schools with the highest need?
7. IS STAKEHOLDERENGAGEMENT EMBEDDED IN THE PLAN AND SEEN AS AN ONGOING ACTIVITY? ESSA calls for “meaningful consultation” with a wide variety of stakeholder groups. States have worked hard to engage with stake-holders. They have held meetings across the state, used online communications, and pulled together stakeholder work groups.8
A recent NASBE report found that in the summer of 2016 no state felt “confi dent they were doing everything right on stakeholder engagement.”9 Most states are recognizing that stakeholder engagement is not a one-time activity but rather a long-term initiative.
Stakeholders—especially parents—are force multipliers. They can provide criti-cal support for boards that want to make progress. But some policies may need to be changed. For example, boards may need to revisit how to manage public testimony at board meetings or how to use technology in ways that do not violate the state’s open meeting laws.
Some boards have already ensured that stakeholder engagement is part and parcel of their work. Engagement is baked into
the mission of the Illinois State Board of Education: “Provide leadership and resourc-es to achieve excellence across all Illinois districts through engaging legislators, school administrators, teachers, students, parents, and other stakeholders in formulating and advocating for policies that enhance educa-tion, empower districts, and ensure equitable outcomes for all students.”
Massachusetts is planning to sustain meaningful engagement even after their plan is fi led. The state plan particularly focuses on representing historically underserved students. As the plan notes, “[S]takeholder voice and analysis of the strong work under way in Massachusetts districts and schools will continue to play a prominent role. . . . We will . . . offer additional opportunities for stakeholders to provide input, particularly at key junctures when we are considering sig-nifi cant changes to an element of the plan.”
Here are questions that should be asked about the state plan to make stakeholder en-gagement a central part of the board’s work:
• What is the state’s vision for engagingstakeholders?
• What worked in the state’s outreach tostakeholders for development of the state plan? What did not? What lessons can be learned?
• What state policies need to be changedto promote greater citizen engagement?
The fi rst state plans submitted under ESSA will shape education policy in the state for many years. Boards can and should play a critical role in developing them. These ques-tions will ensure that state boards stay at the table throughout the process.
Kris Amundson is president/CEO of NASBE. Many education policy leaders suggested key questions boards should be asking about state plans: Special thanks to Chad Aldeman, Sandra Boyd, Michelle Exstrom, Carissa Moffat Miller, Chris Minnich, and Stephanie Wood-Garnett for their insights. Thanks to Abigail Potts and Sarah-Jane Lorenzo for research assistance in preparing this paper.
NOTES1. “No Child Left Behind’s Successor: Congress Rewrites
the Bush-Era Law by Giving More Power to States,” Review
& Outlook, Wall Street Journal (November 29, 2015).
2. A state may notify ED of its intent to submit its plan to
the governor by April 3, 2017, and subsequently submit
the plan to ED no later than the end of the 30-day review
period or May 3, 2017, whichever is earlier.
3. Kris Amundson and Gene Wilhoit, “Take It Off the
Consent Agenda: Nine Questions State Boards of Education
Should Ask about State Assessment Systems,” Policy
Update 23, no. 11 (Alexandria, VA: NASBE, April 2016).
4. U.S. Department of Education, “Accountability, State
Plans, and Data Reporting: Summary of Final Regulations,”
(Washington, DC: ED, November 28, 2016), https://www2.ed.gov/policy/elsec/leg/essa/essafactsheet1127.pdf.
5. Karen Seashore Louis et al., “Learning from Leadership:
Investigating the Links to Improved Student Learning,” Final
Report of Research to The Wallace Foundation (University
of Minnesota and University of Toronto, 2010).
6. Elementary and Secondary Education Act § 1111(h)(1)
(C)(ix).
7. Lisa Dragoset et al., “School Improvement Grants:
Implementation and Effectiveness (NCEE 2017- 4013),”
(Washington, DC: National Center for Education Evaluation
and Regional Assistance, Institute of Education Sciences,
U.S. Department of Education, 2017).
8. Kansas Department of Education, “Kansans Can,”
website, http://www.ksde.org/Agency/Fiscal-and-Administrative-Services/Communications-and-Recognition-Programs/Vision-Kansans-Can; State
of Washington Offi ce of the Superintendent of Public
Instruction, “Every Student Succeeds Act (ESSA),” website,
http://www.k12.wa.us/ESEA/ESSA/; Colorado Department
of Education, “ESSA in Colorado,” website, https://www.cde.state.co.us/fedprograms/essa.
9. Rachel Man and Chris Hofmann, “ESSA Stakeholder
Engagement: Early Challenges and Promising Practices,”
Policy Update 24, no. 1 (January 2017).

History of School Accountability in WARoles, Responsibilities, Next Steps
May 2017 State Board of Education Meeting
School Accountability in WashingtonA Timeline of Key Events
2
Wally Miller Report (1975)
Governors Commission
on Education Reform & Funding (1991)
Commission on Student Learning (1992)
HB 1209 ‐Standards, Assessment
(1993)
A+ Commission
(1993)
ESEA ‐ No Child Left Behind (2001)
State Board of Education Reauth. ‐
Assumes A+ Comm. Duties (2005)
SB 6696 Required Action (2010)
SB 5329 School
Intervention(2013)
NCLB Flexibility
(2013‐2015)
ESEA – ESSA (2015)

Wally Miller Report (1975)
3
Governors Commission on Education Reform & Funding (GCERF) (1993)
4Source: http://leg.wa.gov/JointCommittees/Archive/WASL/documents/Mtg07‐28‐08/OriginsofWASL2.pdf
From legislative summary:
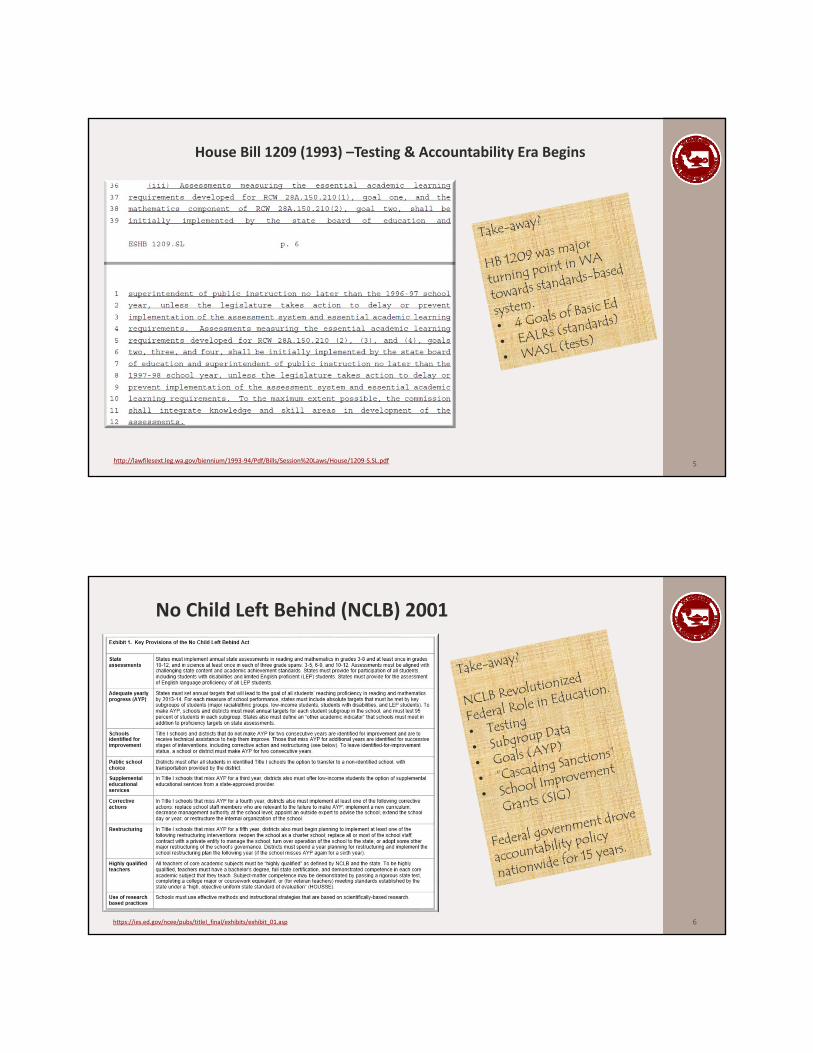
House Bill 1209 (1993) –Testing & Accountability Era Begins
5http://lawfilesext.leg.wa.gov/biennium/1993‐94/Pdf/Bills/Session%20Laws/House/1209‐S.SL.pdf
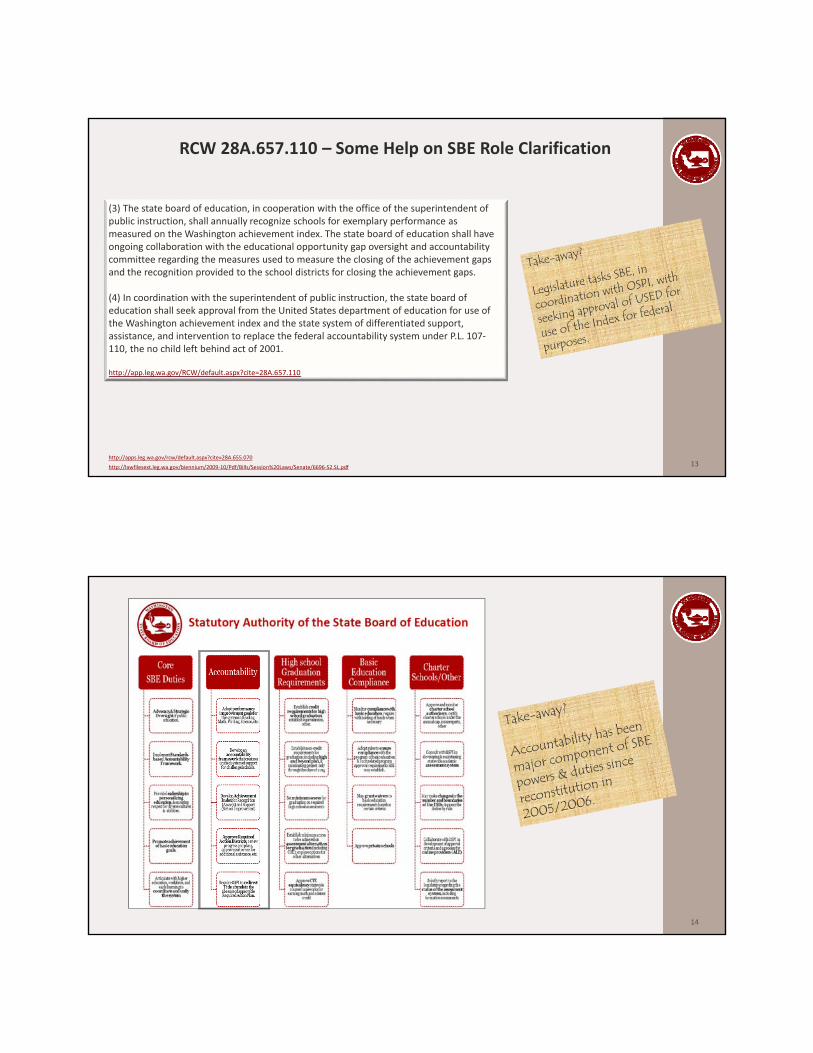
No Child Left Behind (NCLB) 2001
6https://ies.ed.gov/ncee/pubs/titleI_final/exhibits/exhibit_01.asp

House Bill 2261 (2009) – Develop ‘Accountability Index’
7http://lawfilesext.leg.wa.gov/biennium/2009‐10/Pdf/Bills/Session%20Laws/House/2261‐S.SL.pdf
House Bill 6696 (2010) – Establishes ‘Required Action’ Process based on Achievement Index, w/ Federal approval
8
http://lawfilesext.leg.wa.gov/biennium/2009‐10/Pdf/Bills/Session%20Laws/Senate/6696‐S2.SL.pdf

Senate Bill 5329 (2013) – Provides intervention authority to SPI via “Required Action II”
9http://lawfilesext.leg.wa.gov/biennium/2013‐14/Pdf/Bills/Session%20Laws/Senate/5329‐S2.SL.pdf
Every Student Succeeds Act, 2015 (ESEA Reauthorized)
10http://blogs.edweek.org/edweek/campaign‐k‐12/2015/11/accountability_and_the_esea_re.htmlhttps://www.youtube.com/watch?v=zWQGmU‐J80Q

11
Some slides on SBE Role Clarification
Some Help on SBE Role ClarificationRCW 28A.657.110 & RCW 28A.655.070
12http://lawfilesext.leg.wa.gov/biennium/2009‐10/Pdf/Bills/Session%20Laws/Senate/6696‐S2.SL.pdf
http://apps.leg.wa.gov/rcw/default.aspx?cite=28A.655.070
RCW 28A.657.110 – Some Help on SBE Role Clarification
13http://lawfilesext.leg.wa.gov/biennium/2009‐10/Pdf/Bills/Session%20Laws/Senate/6696‐S2.SL.pdf
http://apps.leg.wa.gov/rcw/default.aspx?cite=28A.655.070
(3) The state board of education, in cooperation with the office of the superintendent of public instruction, shall annually recognize schools for exemplary performance as measured on the Washington achievement index. The state board of education shall have ongoing collaboration with the educational opportunity gap oversight and accountability committee regarding the measures used to measure the closing of the achievement gapsand the recognition provided to the school districts for closing the achievement gaps.
(4) In coordination with the superintendent of public instruction, the state board of education shall seek approval from the United States department of education for use ofthe Washington achievement index and the state system of differentiated support,assistance, and intervention to replace the federal accountability system under P.L. 107‐110, the no child left behind act of 2001.
http://app.leg.wa.gov/RCW/default.aspx?cite=28A.657.110
14

15
Moving forward…
ESSA Passed… So What Now?Here is the staff perspective on how to proceed
16
SPI indicates intention to submit plan in September.
Board has to make decisions on issues within its jurisdiction of authority in state law. I think those are:1. Achievement Index (RCW 28A.657.110)2. Performance Improvement Goals (RCW 28A.305.130)3. Accountability framework (RCW 28A.657.110)
Most practical time to do that seems to be the July Board meeting.
In the mean time, the ASW and the Technical Advisory Committee will make a series of recommendations toSuperintendent Reykdal and, by extension, the Board. That is underway.
For July, Review draft ESSA Plan drafted by SPI (SBE staff would be involved in development of three components mentioned) Work with SPI to build a set of visuals that sufficiently represent the policies reflected in the 3 aforementioned areas of authority. Vote on those.
Members would be asked to provide comments and feedback to the plan
Operating assumption: Build from the draft plan the Board reviewed (and was comfortable with) in January, and concentrate on proposed changes to that plan by Supt Reykdal.
Staff is seeking feedback on this outline.
Goals: Unified accountability system, effective collaboration of SBE/SPI, improvement of Index usability andvisibility, opportunity to strengthen service to schools & kids.

SBE’s Accountability Framework
17
Take another look at SBE Accountability Framework (click on link for WAC180‐17‐100)
Does it need to change?
Accountability Index – Major Discussions
18
Adding 9th grade on‐track & chronic absenteeism
Add industry certification to dual credit – “advanced course‐taking”
Adding English Language Learners to Index framework
Graduation rate – incorporation of 5‐6‐7 year rates?
Index interface: how many tiers? What are they named?
More transparency! ‐‐ Adjustment for aggregating across years to achieve minimum ‘n’size of 20 (rather than needing 20 students in each year)
Measuring gaps! Targeted schools calculation based on index score for both race &program Instead of taking the bottom 5% from one large stack rank, take the bottom five percent of twostack ranks – one for race (USED categories), and one for program (poverty, language, specialneeds, etc).
Emphasizing gap analysis in “high performing” schools, too.
New weighting scheme (adding indicators necessarily dilutes/changes weight of others)
If I had to choose just four?
19
1. Tiers – making sense of the number tiers, the names, and levels of service.
2. Labels – getting the language right. Not punitive, but also transparent.
3. Service ‐ Once identified, how schools get served? What changes does SPIanticipate?
4. Participation rate requirements – how incorporated in the Plan?
What Are Your Questions?
20
A survey has been sent to SBE members seeking input on some key issues.We look forward to your input.
If you need to find it in your inbox, its here:

21
Website: www.SBE.wa.gov
Blog: washingtonSBE.wordpress.com
Facebook: www.facebook.com/washingtonSBE
YouTube: www.youtube.com/user/sbeweb
Twitter: @wa_SBE
Email: [email protected]
Phone: 360‐725‐6025
Web updates: bit.ly/SBEupdates
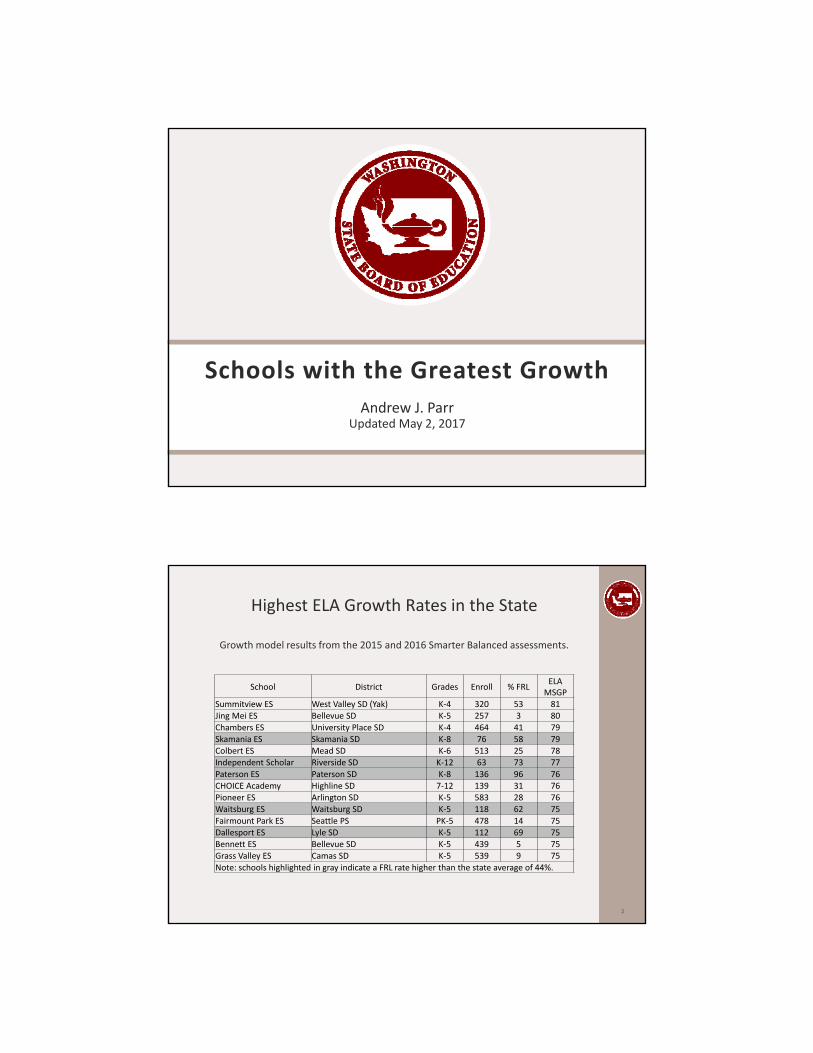
Andrew J. ParrUpdated May 2, 2017
Schools with the Greatest Growth
Highest ELA Growth Rates in the State
Growth model results from the 2015 and 2016 Smarter Balanced assessments.
2
School District Grades Enroll % FRLELA MSGP
Summitview ES West Valley SD (Yak) K‐4 320 53 81Jing Mei ES Bellevue SD K‐5 257 3 80
Chambers ES University Place SD K‐4 464 41 79Skamania ES Skamania SD K‐8 76 58 79Colbert ES Mead SD K‐6 513 25 78Independent Scholar Riverside SD K‐12 63 73 77
Paterson ES Paterson SD K‐8 136 96 76CHOICE Academy Highline SD 7‐12 139 31 76Pioneer ES Arlington SD K‐5 583 28 76Waitsburg ES Waitsburg SD K‐5 118 62 75
Fairmount Park ES Seattle PS PK‐5 478 14 75Dallesport ES Lyle SD K‐5 112 69 75Bennett ES Bellevue SD K‐5 439 5 75Grass Valley ES Camas SD K‐5 539 9 75
Note: schools highlighted in gray indicate a FRL rate higher than the state average of 44%.

Highest Math Growth Rates in the State
Growth model results from the 2015 and 2016 Smarter Balanced assessments.
3
School District Grades Enroll % FRLMath MSGP
Pioneer ES Auburn SD PK‐5 492 85 94Waitsburg ES Waitsburg SD K‐5 118 62 87
Summitview ES West Valley SD (Yak) K‐4 320 53 86Rainier Prep ALE Mary Walker SD 5‐8 80 86Clear Lake ES Sedro‐Woolley SD K‐6 264 48 84Excel ALE School Mary Walker SD 6‐7 18 84
Bickleton ES & HS Bickleton SD K‐12 86 15 84Almira ES Almira SD K‐8 109 36 84Graham Hill ES Seattle PS PK‐5 352 69 82Waterville ES Waterville SD K‐5 99 60 81
Cedarhome ES Stanwood‐Camano SD K‐5 503 17 80Paterson ES Paterson SD K‐8 136 96 79CHOICE Academy Highline SD 7‐12 139 31 79St John ES St. John SD K‐5 79 41 79
Olympic Hills ES Seattle PS PK‐5 290 75 79Note: schools highlighted in gray indicate a FRL rate higher than the state average of 44%.
Highest ELA and Math Growth Rates in the StateGrowth model results from the 2015 and 2016 Smarter Balanced assessments.
4
District School Grades Enroll % FRLELA MSGP
Math MSGP
AVG MSGP
West Valley SD (Yak) Summitview ES K‐4 320 53 81 86 83.5Waitsburg SD Waitsburg ES K‐5 118 62 75 87 81Auburn SD Pioneer ES PK‐5 492 85 66 94 80Sedro‐Woolley SD Clear Lake ES K‐6 264 48 74 84 79Mead SD Colbert ES K‐6 513 25 78 78 78Paterson SD Paterson ES K‐8 136 96 76 79 77.5Highline SD CHOICE Academy 7‐12 139 31 76 79 77.5University Place SD Chambers ES K‐4 464 41 79 74 76.5Bickleton SD Bickleton ES & HS K‐12 86 15 68 84 76Skamania SD Skamania ES K‐8 76 58 79 70 74.5Puyallup SD Sunrise ES PK‐6 517 47 72 77 74.5Cusick SD Cusick Jr Sr HS 6‐12 145 60 70 78 74Lake Stevens SD Glenwood ES K‐5 576 24 74 74 74Eatonville SD Weyerhaeuser ES K‐5 262 42 70 77 73.5Bellingham SD Alderwood ES PK‐5 241 86 70 76 73Sequim SD Greywolf ES K‐5 506 47 68 78 73St. John SD St John ES K‐5 79 41 67 79 73Note: schools highlighted in gray indicate a FRL rate higher than the state average of 44%.

Highest ELA and Math Growth Rates in the State High Poverty Schools
Growth model results from the 2015 and 2016 Smarter Balancedassessments.
Schools with a FRL rate ≥ 85% (nearly twice the sate average of 44%).
5
School District Grades Enroll % FRLELA MSGP
Math MSGP
AVGMSGP
Pioneer ES Auburn SD PK‐5 492 85 66 94 80Alderwood ES Bellingham SD PK‐5 241 86 70 76 73Barge‐Lincoln ES Yakima SD PK‐5 623 94 65 73 69
Soap Lake ES Soap Lake SD K‐5 211 90 56 75 65.5
Harrison MS Sunnyside SD 6‐8 814 89 59 69 64Wahluke JHS Wahluke SD 6‐8 483 86 61 62 61.5
Paterson ES Paterson SD K‐8 136 96 76 79 77.5Union Gap School Union Gap SD PK‐8 651 86 64 62 63
Highest Growth Rates in the Region (ESD 101)
Growth model results from the 2015 and 2016 Smarter Balanced assessments.
6
School District Grades Enroll % FRLELA MSGP
Math MSGP
AVG MSGP
Colbert ES Mead SD K‐6 513 25 78 78 78.0
St. John ES St. John SD K‐5 79 41 67 79 73.0
Wilson ES Spokane SD PK‐6 376 17 67 78 72.5
Almira ES Almira SD K‐8 109 36 60 84 72.0
Kettle Falls MS Kettle Falls SD 5‐8 213 60 65 72 68.5
Westview ES Spokane SD PK‐6 472 71 57 76 66.5
Farwell ES Mead SD K‐6 593 34 67 64 65.5
Hutton ES Spokane SD K‐6 565 22 66 65 65.5
Prairie View ES Mead SD K‐6 668 12 62 66 64.0
Meadow Ridge ES Mead SD K‐6 557 27 51 76 63.5
Reardan ES Reardan‐Edwall SD K‐5 253 47 55 72 63.5
Selkirk MS Selkirk SD 6‐8 47 35 56 70 63.0
Seth Woodard ES West Valley SD (Spok) K‐5 351 52 68 58 63.0
Davenport SHS Davenport SD 6‐12 327 52 60 66 63.0
Loon Lake ES Loon Lake SD PK‐6 113 86 58 67 62.5
Note: schools highlighted in gray indicate a FRL rate higher than the state average of 44%.

Highest Growth Rates in the Region (ESD 105)
Growth model results from the 2015 and 2016 Smarter Balanced assessments.
7
School District Grades Enroll % FRLELA MSGP
Math MSGP
AVG MSGP
Summitview ES West Valley SD (Yak) K‐4 320 53 81 86 83.5
Bickleton ES & HS Bickleton SD K‐12 86 16 68 84 76.0
Zillah MS Zillah SD 7‐8 221 56 69 71 70.0
Barge‐Lincoln ES Yakima SD PK‐5 623 93.6 65 73 69.0
Apple Valley ES West Valley SD (Yak) K‐4 323 34 56 77 66.5
Harrison MS Sunnyside SD 6‐8 814 89 59 69 64.0
Union Gap School Union Gap SD PK‐8 651 86 64 62 63.0
Cottonwood ES West Valley SD (Yak) K‐4 429 32 56 69 62.5
Mattawa ES Wahluke SD K‐5 441 82 72 52 62.0
Wahluke JHS Wahluke SD 6‐8 483 86 61 62 61.5
Ahtanum Valley ES West Valley SD (Yak) K‐4 253 58 65 56 60.5
Goldendale Primary Goldendale SD K‐4 342 68 68 53 60.5
Note: schools highlighted in gray indicate a FRL rate higher than the state average of 44%.
Highest Growth Rates in the Region (ESD 112)
Growth model results from the 2015 and 2016 Smarter Balanced assessments.
8
School District Grades Enroll % FRLELA MSGP
Math MSGP
AVG MSGP
Skamania ES Skamania SD K‐8 76 58 79 70 74.5
Dallesport ES Lyle SD K‐5 112 69 75 68 71.5
Burnt Bridge Creek ES Evergreen SD (Clark) K‐5 443 48 62 72 67.0
Dorothy Fox Camas SD K‐5 462 11 62 69 65.5
South Ridge ES Ridgefield SD K‐6 600 29 67 62 64.5
Harmony ES Evergreen SD (Clark) K‐5 671 25 65 62 63.5
Tukes Valley MS Battle Ground SD 5‐8 524 33 61 64 62.5
Carrolls ES Kelso SD K‐5 149 39 57 68 62.5
Image ES Evergreen SD (Clark) K‐5 690 61 57 67 62.0
Yacolt Primary Battle Ground SD K‐4 781 42 55 69 62.0
Mill Plain ES Evergreen SD (Clark) K‐5 497 63 64 59 61.5
Grass Valley ES Camas SD K‐5 539 9 75 48 61.5
Note: schools highlighted in gray indicate a FRL rate higher than the state average of 44%.
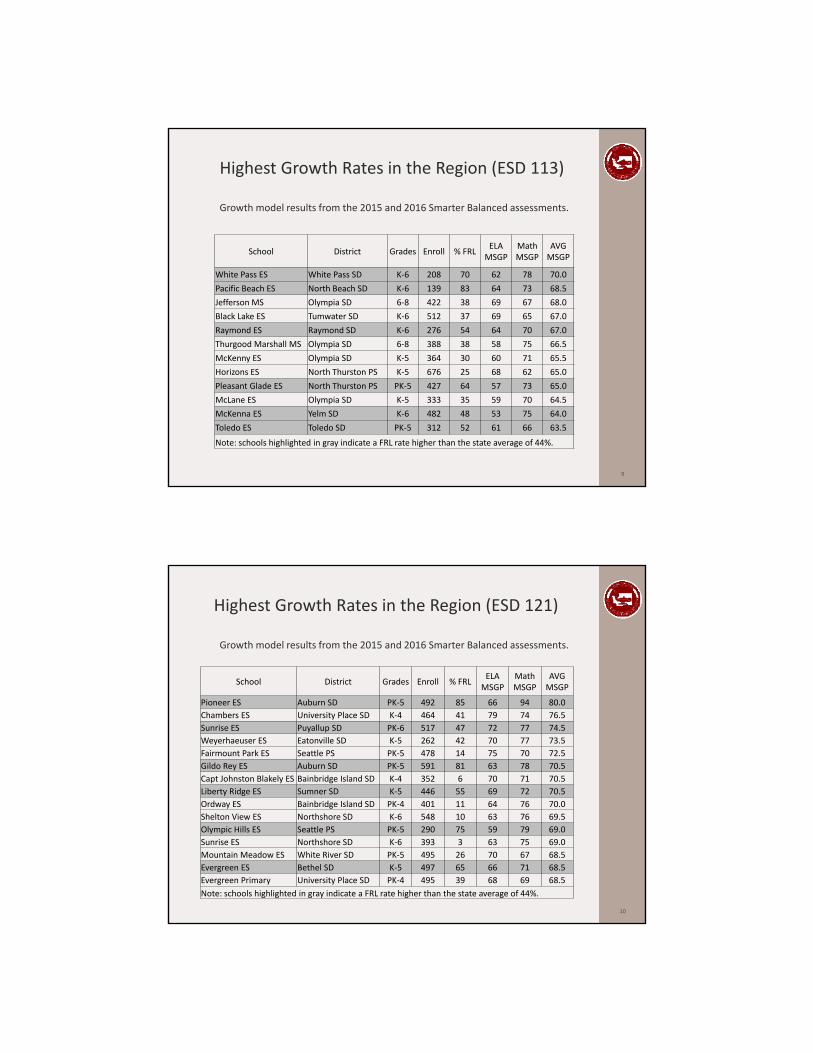
Highest Growth Rates in the Region (ESD 113)
Growth model results from the 2015 and 2016 Smarter Balanced assessments.
9
School District Grades Enroll % FRLELA MSGP
Math MSGP
AVG MSGP
White Pass ES White Pass SD K‐6 208 70 62 78 70.0
Pacific Beach ES North Beach SD K‐6 139 83 64 73 68.5
Jefferson MS Olympia SD 6‐8 422 38 69 67 68.0
Black Lake ES Tumwater SD K‐6 512 37 69 65 67.0
Raymond ES Raymond SD K‐6 276 54 64 70 67.0
Thurgood Marshall MS Olympia SD 6‐8 388 38 58 75 66.5
McKenny ES Olympia SD K‐5 364 30 60 71 65.5
Horizons ES North Thurston PS K‐5 676 25 68 62 65.0
Pleasant Glade ES North Thurston PS PK‐5 427 64 57 73 65.0
McLane ES Olympia SD K‐5 333 35 59 70 64.5
McKenna ES Yelm SD K‐6 482 48 53 75 64.0
Toledo ES Toledo SD PK‐5 312 52 61 66 63.5
Note: schools highlighted in gray indicate a FRL rate higher than the state average of 44%.
Highest Growth Rates in the Region (ESD 121)
Growth model results from the 2015 and 2016 Smarter Balanced assessments.
10
School District Grades Enroll % FRLELA MSGP
Math MSGP
AVG MSGP
Pioneer ES Auburn SD PK‐5 492 85 66 94 80.0
Chambers ES University Place SD K‐4 464 41 79 74 76.5
Sunrise ES Puyallup SD PK‐6 517 47 72 77 74.5
Weyerhaeuser ES Eatonville SD K‐5 262 42 70 77 73.5
Fairmount Park ES Seattle PS PK‐5 478 14 75 70 72.5
Gildo Rey ES Auburn SD PK‐5 591 81 63 78 70.5
Capt Johnston Blakely ES Bainbridge Island SD K‐4 352 6 70 71 70.5
Liberty Ridge ES Sumner SD K‐5 446 55 69 72 70.5
Ordway ES Bainbridge Island SD PK‐4 401 11 64 76 70.0
Shelton View ES Northshore SD K‐6 548 10 63 76 69.5
Olympic Hills ES Seattle PS PK‐5 290 75 59 79 69.0
Sunrise ES Northshore SD K‐6 393 3 63 75 69.0
Mountain Meadow ES White River SD PK‐5 495 26 70 67 68.5
Evergreen ES Bethel SD K‐5 497 65 66 71 68.5
Evergreen Primary University Place SD PK‐4 495 39 68 69 68.5
Note: schools highlighted in gray indicate a FRL rate higher than the state average of 44%.
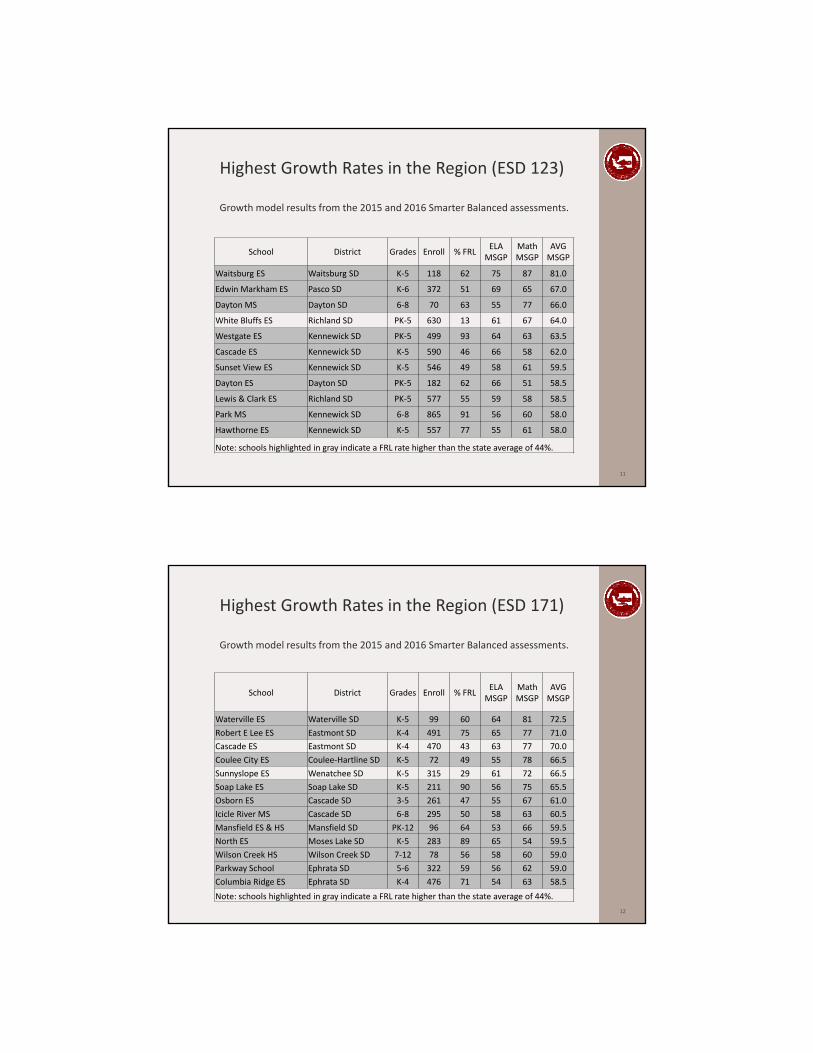
Highest Growth Rates in the Region (ESD 123)
Growth model results from the 2015 and 2016 Smarter Balanced assessments.
11
School District Grades Enroll % FRLELA MSGP
Math MSGP
AVG MSGP
Waitsburg ES Waitsburg SD K‐5 118 62 75 87 81.0
Edwin Markham ES Pasco SD K‐6 372 51 69 65 67.0
Dayton MS Dayton SD 6‐8 70 63 55 77 66.0
White Bluffs ES Richland SD PK‐5 630 13 61 67 64.0
Westgate ES Kennewick SD PK‐5 499 93 64 63 63.5
Cascade ES Kennewick SD K‐5 590 46 66 58 62.0
Sunset View ES Kennewick SD K‐5 546 49 58 61 59.5
Dayton ES Dayton SD PK‐5 182 62 66 51 58.5
Lewis & Clark ES Richland SD PK‐5 577 55 59 58 58.5
Park MS Kennewick SD 6‐8 865 91 56 60 58.0
Hawthorne ES Kennewick SD K‐5 557 77 55 61 58.0
Note: schools highlighted in gray indicate a FRL rate higher than the state average of 44%.
Highest Growth Rates in the Region (ESD 171)
Growth model results from the 2015 and 2016 Smarter Balanced assessments.
12
School District Grades Enroll % FRLELA MSGP
Math MSGP
AVG MSGP
Waterville ES Waterville SD K‐5 99 60 64 81 72.5
Robert E Lee ES Eastmont SD K‐4 491 75 65 77 71.0
Cascade ES Eastmont SD K‐4 470 43 63 77 70.0
Coulee City ES Coulee‐Hartline SD K‐5 72 49 55 78 66.5
Sunnyslope ES Wenatchee SD K‐5 315 29 61 72 66.5
Soap Lake ES Soap Lake SD K‐5 211 90 56 75 65.5
Osborn ES Cascade SD 3‐5 261 47 55 67 61.0
Icicle River MS Cascade SD 6‐8 295 50 58 63 60.5
Mansfield ES & HS Mansfield SD PK‐12 96 64 53 66 59.5
North ES Moses Lake SD K‐5 283 89 65 54 59.5
Wilson Creek HS Wilson Creek SD 7‐12 78 56 58 60 59.0
Parkway School Ephrata SD 5‐6 322 59 56 62 59.0
Columbia Ridge ES Ephrata SD K‐4 476 71 54 63 58.5
Note: schools highlighted in gray indicate a FRL rate higher than the state average of 44%.

Highest Growth Rates in the Region (ESD 189)
Growth model results from the 2015 and 2016 Smarter Balanced assessments.
13
School District Grades Enroll % FRLELA MSGP
Math MSGP
AVG MSGP
Clear Lake ES Sedro‐Woolley SD K‐6 264 48 74 84 79.0
Glenwood ES Lake Stevens SD K‐5 576 24 74 74 74.0
Alderwood ES Bellingham SD PK‐5 241 86 70 76 73.0
Endeavour ES Mukilteo SD K‐5 503 18 69 72 70.5
Pioneer ES Arlington SD K‐5 583 28 76 64 70.0
Cedarhome ES Stanwood‐Camano SD K‐5 503 17 57 80 68.5
Island View ES Anacortes SD K‐6 456 33 70 67 68.5
Garfield ES Everett SD PK‐5 391 73 67 69 68.0
Carl Cozier ES Bellingham SD PK‐5 261 58 66 70 68.0
Mill Creek ES Everett SD PK‐5 663 14 69 66 67.5
Seaview ES Edmonds SD K‐6 380 25 69 62 65.5
Elger Bay ES Stanwood‐Camano SD K‐5 291 35 69 62 65.5
Salem Woods ES Monroe SD PK‐5 478 25 64 67 65.5
Central ES Ferndale SD PK‐5 328 50 60 70 65.0
Note: schools highlighted in gray indicate a FRL rate higher than the state average of 44%.
Highest Growth Rates in the Region (Olympic ESD)
Growth model results from the 2015 and 2016 Smarter Balanced assessments.
14
School District Grades Enroll % FRLELA MSGP
Math MSGP
AVG MSGP
Greywolf ES Sequim SD K‐5 506 47 68 78 73.0
Helen Haller ES Sequim SD K‐5 611 57 62 73 67.5
Pinecrest ES Central Kitsap SD PK‐5 448 46 68 63 65.5
Chimacum ES Chimacum SD 3‐5 205 55 64 64 64.0
Belfair ES North Mason SD K‐5 499 47 62 63 62.5
Neah Bay ES Cape Flattery SD K‐5 166 76 63 61 62.0
Olalla ES South Kitsap SD K‐6 343 43 62 60 61.0
Stevens MS Port Angeles SD 6‐8 555 51 55 67 61.0
South Colby ES South Kitsap SD K‐6 392 24 65 56 60.5
Woodlands ES Central Kitsap SD K‐5 445 52 59 61 60.0
Emerald Heights ES Central Kitsap SD PK‐5 593 23 56 64 60.0
Manchester ES South Kitsap SD K‐6 377 46 56 62 59.0
Roosevelt ES Port Angeles SD K‐6 502 48 46 71 58.5
Note: schools highlighted in gray indicate a FRL rate higher than the state average of 44%.