The volatility of Bitcoin and its role as a medium of ...
21
Empirical Economics (2021) 61:2663–2683 https://doi.org/10.1007/s00181-020-01990-5 The volatility of Bitcoin and its role as a medium of exchange and a store of value Dirk G. Baur 1 · Thomas Dimpfl 2 Received: 30 March 2018 / Accepted: 12 November 2020 / Published online: 5 January 2021 © Springer-Verlag GmbH Germany, part of Springer Nature 2021 Abstract Bitcoin is designed as a peer-to-peer cash system. To work as a currency, it must be stable or be backed by a government. In this paper, we show that the volatility of Bitcoin prices is extreme and almost 10 times higher than the volatility of major exchange rates (US dollar against the euro and the yen). The excess volatility even adversely affects its potential role in portfolios. Our analysis implies that Bitcoin cannot function as a medium of exchange and has only limited use as a risk-diversifier. In contrast, we use the deflationary design of Bitcoin as a theoretical basis and demonstrate that Bitcoin displays store of value characteristics over long horizons. Keywords Bitcoin · Digital currency · Medium of exchange · Volatility JEL Classification C58 · E44 · F31 1 Introduction Cryptocurrencies are a new phenomenon compared to traditional fiat currencies and assets such as gold. The most prominent cryptocurrency, Bitcoin, is designed as a peer- to-peer cash system (see Nakamoto 2008) and thus has features of a currency. However, due to its high volatility, most empirical studies classify Bitcoin as an investment (Glaser et al. 2014; Baur et al. 2018; Bedi and Nashier 2020). In this article, we conduct a detailed analysis of the Bitcoin market with a particular focus on volatility. Both aspects—investment or currency—are heavily influenced by the level and nature of volatility, and our results suggest that Bitcoin does not work as a currency. B Thomas Dimpfl thomas.dimpfl@uni-tuebingen.de 1 University of Western Australia, Business School, 35 Stirling Highway, Perth 6009, Australia 2 University of Tübingen, School of Business and Economics, Geschwister-Scholl-Platz, 72074 Tübingen, Germany 123
Transcript of The volatility of Bitcoin and its role as a medium of ...

Empirical Economics (2021) 61:2663–2683https://doi.org/10.1007/s00181-020-01990-5
The volatility of Bitcoin and its role as a mediumof exchange and a store of value
Dirk G. Baur1 · Thomas Dimpfl2
Received: 30 March 2018 / Accepted: 12 November 2020 / Published online: 5 January 2021© Springer-Verlag GmbH Germany, part of Springer Nature 2021
AbstractBitcoin is designed as a peer-to-peer cash system. To work as a currency, it must bestable or be backed by a government. In this paper,we show that the volatility ofBitcoinprices is extreme and almost 10 times higher than the volatility ofmajor exchange rates(US dollar against the euro and the yen). The excess volatility even adversely affectsits potential role in portfolios. Our analysis implies that Bitcoin cannot function as amedium of exchange and has only limited use as a risk-diversifier. In contrast, we usethe deflationary design of Bitcoin as a theoretical basis and demonstrate that Bitcoindisplays store of value characteristics over long horizons.
Keywords Bitcoin · Digital currency ·Medium of exchange · Volatility
JEL Classification C58 · E44 · F31
1 Introduction
Cryptocurrencies are a new phenomenon compared to traditional fiat currencies andassets such as gold. Themost prominent cryptocurrency, Bitcoin, is designed as a peer-to-peer cash system (seeNakamoto 2008) and thus has features of a currency.However,due to its high volatility, most empirical studies classify Bitcoin as an investment(Glaser et al. 2014; Baur et al. 2018; Bedi and Nashier 2020). In this article, weconduct a detailed analysis of the Bitcoin market with a particular focus on volatility.Both aspects—investment or currency—are heavily influenced by the level and natureof volatility, and our results suggest that Bitcoin does not work as a currency.
B Thomas [email protected]
1 University of Western Australia, Business School, 35 Stirling Highway, Perth 6009, Australia
2 University of Tübingen, School of Business and Economics, Geschwister-Scholl-Platz, 72074Tübingen, Germany
123

2664 D. G. Baur, T. Dimpfl
The literature on Bitcoin is relatively new and has grown very fast in recent years.Trading aspects are considered by Cheah and Fry (2015) and Blau (2018) who inves-tigate speculative behavior in Bitcoin trading. Whether Bitcoin serves to diversifythe risk of an investment portfolio is analyzed by Brière et al. (2015), Guesmi et al.(2019), and Hussain Shahzad et al. (2020). There are numerous studies that look intothe volatility of Bitcoin. Dwyer (2015), for example, analyzes monthly standard devi-ations of Bitcoin prices from Mt. Gox, BTC, and Bitstamp and concludes that theseare 5–7 times higher than what is generally observed in stock markets. Bouoiyourand Selmi (2016), Bouri et al. (2017), Katsiampa (2017), and Ardia et al. (2019) relyon GARCH models to estimate daily volatility. All authors conclude that the volatil-ity level is comparatively high, offering different explanations such as cyber attacks,information asymmetry, decentralization, or the absence of regulation.
We contribute to the literature with an in-depth analysis of Bitcoin volatility and itsimplications on the usage of Bitcoin as a currency, a diversifier or hedge, and a storeof value. We use data from six different markets, covering Bitcoin exchange rates withthe US dollar, the euro, and the Japanese yen and compare them with USD/EUR andUSD/YEN exchange rates.We find that Bitcoin markets exhibit excess volatility in thesense that the volatility is up to 10 times higher than the volatility of the exchange rates.We understand such a high level of volatility as an obstacle for Bitcoin to perform allfunctions associated with a currency (means of exchange, unit of account, and storeof value) in a reliable and efficient manner. Also, we find that the dynamics of Bitcoinvolatility are different from and unrelated to FX volatility which suggests that Bitcoindoes not (yet) belong to the global market of currencies.
The article proceeds as follows. We first describe the Bitcoin market and relatedregulatory aspects in Sect. 2. In Sect. 3, we present the dataset and descriptive statistics.The empirical analysis follows in Sect. 4 where we look at Bitcoin during crisisperiods, consider Bitcoin’s use as a portfolio diversifier, analyze how it relates tomajor currencies, and finally consider money and store of value aspects of Bitcoin.Section 5 concludes.
2 The Bitcoinmarket
2.1 Market characteristics
The Bitcoin market is a fully electronic market which has been introduced on October31, 2008 by Satoshi Nakamoto (2008) as a peer-to-peer network without any centralauthority. Hence, there is no central bank (or any other single intermediary) involvedand transactions are verified by a network of nodes that check the accuracy of thelatest transaction against their register of total transactions, called the blockchain. Thetransaction is subsequently added to the ledger, and information is redistributed toother nodes.1
1 Brito and Castillo (2013) or Böhme et al. (2015) provide more details on the market design and thetechnological aspects of Bitcoin.
123

The volatility of Bitcoin and its role as a medium... 2665
050
000
1500
0025
0000
2009 2010 2011 2012 2013 2014 2015 2016 2017 2018 2019 2020
050
0010
000
1500
0
Fig. 1 Total Number of Bitcoins andMarket Capitalization. The figure presents the total number of Bitcoinsin circulation (dotted line, left axis) and the market capitalization in million USD (solid line, right axis)from March 1, 2009 to September 9, 2020
Unlike “classical” fiat currencieswhere central banks createmoney in, theoretically,unlimited amounts, the total number of Bitcoins is limited and capped at 21 million.This is one fundamental difference.2 Bitcoins aremined by providing network serviceslike verifying and collecting newly broadcast transactions which are added to a block.In order for a block to be accepted in the network, miners have to provide proofof authenticity by finding a specific number called a nonce. A hash function whichmaps the nonce back to an easily verifiable bit string ensures that the block is valid(cp. Antonopoulos 2014). As of August 31, 2020, there were 18.476 million Bitcoinsin circulation. They amounted to a total market value of 216 billion USD. Figure 1presents the development of the total number of Bitcoins tradeable and the marketcapitalization (MCAP, in USD). While the number of bitcoins has increased steadilysince its introduction, demand and, thus, market value, has also increased albeit lesssteadily. The plot of MCAP clearly shows that the Bitcoin price is very volatile. Forexample, during 2017 the price for one Bitcoin increased from less than 1,000 USdollars to more than 19,000 US dollars and fell back to 8,000 US dollars by mid of2018.
In light of this high volatility, many people have questioned whether Bitcoin canever fulfill the tasks of a currency. Aiming to avoid the excessive volatility of cryp-tocurrencies while preserving the benefits of the blockchain technology led to theconcept of low volatility stablecoins (Lyons and Viswanath-Natraj 2020; Eichengreen2019) like Tether (Tether Operations Ltd. 2016; Griffin and Shams 2020) or Libraproposed by Facebook (Libra Association 2020).
2.2 Trading and regulation
In our analysis, we consider five Bitcoin markets (Bitfinex, bitFlyer, BitStamp,BTCBOX, and Kraken), and it is worthwhile to note that the trading environment
2 The creation of new Bitcoin, called mining, resembles the mining of gold. Gold, similar to Bitcoin, is nota generally accepted unit of account and medium of exchange. An obvious and key difference of gold andBitcoin is that the former is a tangible, physically mined commodity, whereas the latter only exists digitally.
123

2666 D. G. Baur, T. Dimpfl
Table 1 Legal Status in Selected Jurisdictions . Sources: Wikipedia (https://en.wikipedia.org/wiki/Legality_of_bitcoin_by_country_or_territory), Global Legal Research Center (2018), cryptonews.com(https://cryptonews.com/guides/countries-in-which-bitcoin-is-banned-or-legal.htm)
Tax treatment
Country Definition Acquisition Gains Holding Mining
China Special virtualcommodity
Not taxed Profits tax Legal Prohibited
France Crypto-asset VAT exempt Flat-tax rate of 30% Legal Legal
Germany Financialinstrument
VAT exempt Income tax, cap-ital gains exemp-tion when held 1year or more
Legal Legal
Japan Property value Exempt fromconsumptionTax
Miscellaneous income Legal Legal
USA Convertible decentral-ized virtual currency(FinCEN 2013); com-modity (CFTC 2018)
Not taxed Capital gains tax legal legal
is not unified across these markets. Also, a consolidated tape is not available albeitall markets trade the same object. The minimum tick size during the sample period issubject to change as the exchanges adjust it in response to the Bitcoin price. Trans-action fees are charged by the different platforms as a percentage of total transactionvolume. For example, BitStamp charges between 0.1% and 0.25% based on the totaltransaction volume realized during a 30-day period. Kraken additionally distinguishesbetween order types and submitting a market order is slightly more costly than sub-mitting a limit order. There may be additional fixed costs for wire transfers or otherservices provided.
A critical issue in the Bitcoin framework is the regulation of cryptocurrencies whichis heterogeneous across countries. In some jurisdictions, Bitcoin is completely banned(e.g., Bolivia,Morocco, or Nepal); in others there is no limit to its use (European coun-tries, USA, and many others). In between these extremes are countries like Bahrain orQatar which tolerate that their citizens use Bitcoin abroad, but not within the country(Global Legal Research Center 2018). In addition to restrictions of use, treatment ofgains for tax purposes also varies greatly. In general, Bitcoin transactions are free fromVAT, but gains are subject to tax. Table 1 provides an overview of selected countrieswhich are related to the exchanges in our study. It is interesting to note that even thedefinitions vary across countries and have changed over the years, e.g., in the USA(see Mandjee 2015, for an overview of regulation and its implications in the USA).
Recently, regulation of cryptocurrencies has been again in the focus of law-makersand central banks following the proposal of Facebook, Inc. to establish its own virtualcurrency called Libra. Mersch (2019) and Adachi et al. (2020) point out that a stable-coin such as Libra could fall outside the European Central Bank’s existing regulationsas the nature of a currency-backed coin could be regarded as an investment fund, but it
123

The volatility of Bitcoin and its role as a medium... 2667
remains unclear whether Libra holders do have a 1:1 claim on the fiat currencies in itsbasket. They conclude that a stablecoin of global importance might endanger financialstability in case of malfunctions. Similar concerns are expressed by the US FederalReserve (Brainard 2019). In contrast, Baughman and Flemming (2020) conclude thatthe demand for a global stable coin would be so low that there is no risk for the globalfinancial system. However, it is not easy to predict the demand for such products.Consider again Fig. 1: Initially, Bitcoin was a negligible niche “product” which wasassociated with tech nerds. However, starting from 2013, and thus four years after theintroduction, the global demand started to rise and Bitcoin became recognized as thefirst and biggest global cryptocurrency.
While traditional security issues associated with money like bank robberies andcounterfeiting of physical currency notes are no concern for cryptocurrencies, theyface similar problems such as cyberattacks (Dion-Schwarz et al. 2019). For example,Kraken has been the target of multiple distributed denial of service (DDoS) attacks(e.g., from October 31, to November 4, 20153 or on November 9/10, 20194). In theabsence of binding regulation, it is unclear whether the exchange should be heldaccountable in such a situation when trading is made impossible. Following an attackon July 10, 2015, the China-based OKCoin platform compensated traders for lossesincurred due to the DDoS. As Vasek et al. (2014) show, the number of attacks hasincreased, and Böhme et al. (2015) argue that they are especially attractive as stolenBitcoins can easily be converted into cash. Exposure to this kind of risk is potentiallyreflected in the volatility of Bitcoin prices. We analyze this issue in more detail inSect. 4.1 below.
3 Data and descriptive analysis
In our analysis, we use historical price time series obtained from two different sources.The dataset ofBitcoin prices across differentmarkets is obtained from investing.com. Itcovers daily open, high, low, and close prices for Bitcoin traded against the U.S. dollaron Bitfinex and Kraken, for Bitcoin traded in Euro on Kraken and BitStamp, and forBitcoin traded against the Japanese Yen on BitFlyer and BTCBOX. The sample startsApril 1, 2014 for the Kraken and Bitfinex data, as well as the euro and yen exchangerates against the US dollar. The shortest time series is available for BTCBOX whichstarts January 16, 2018. Bitcoin data are available on a daily basis, FX data fromMonday to Friday. All time series are available until August 30, 2020.
As not all of these markets were operational during the entire period since theintroduction of Bitcoin, we also source a long time series of Bitcoin prices frombitinfocharts.com. The data cover the period July 17, 2010 until August 30, 2020 andare sampled on a daily frequency. Market information (Bitcoin market capitalizationand number of coins in circulation) is obtained from blockchain.com. These data startin March 2009 and also go till August 30, 2020.
3 Source: https://cointelegraph.com/news/kraken-ddos-attack-leaves-traders-unable-to-sell-at-500-peak[Accessed September 29, 2020].4 Source: https://status.kraken.io/history [Accessed September 29, 2020]
123

2668 D. G. Baur, T. Dimpfl
As a nonparametric measure of volatility, we rely on the estimator of Garman andKlass (1980) which reads as follows:
σ 2t = 0.5(ht − lt )
2 − (2 log(2) − 1)(ct − ot )2
where ht (lt ) denotes the log of the highest (lowest) price on day t , and ot and ct arethe first and the last recorded price on day t .5 For the subsequent analysis, we usevolatility σt obtained by taking the square root of σ 2
t . Figure 2 presents time seriesplots of the so obtained volatility estimate. It is immediately apparent that Bitcoinvolatility is much higher than the volatility of the FX rates. The plots also suggest thatthe volatility of volatility is higher in the Bitcoin case. This observation holds acrossall Bitcoin markets and all currencies against which Bitcoin is traded.
Table 2 presents descriptive statistics for returns and volatility. As can be seen, theaverage return of Bitcoin is similar across five out of the six markets. The slightlynegative return observed on BTCBOX is due to the fact that the time series for thismarket only starts in January 2018, amidst the downturn period after the all-time highin December 2017. The minimum values, however, are similar across all markets,reflecting the sharp downturn in March 2020. As regards volatility, it is similar acrossall markets and suggests a daily average volatility of 3%. However, there are extremelyvolatile days with the maximum ranging in general around 30% where BTCBOX isagain an extreme with more than 120% on a single day. In contrast, the FX rates arerather stable across the sample period with an average return close to zero and anaverage volatility estimate below 0.5%. Also, the volatility of volatility is much lowerin case of the FX rates as can be seen from the standard deviation of volatility whichis 10-20 times higher for Bitcoin than for the FX rates. High volatility in generalin connection with the high volatility of volatility fosters extreme price fluctuationswhich are frequently observed in the Bitcoin market.
We also test for the existence of structural breaks in the time series of volatilityusing the approach in Chan et al. (2014). As our time series of volatility is marked bylong memory6, we use the model of Corsi (2009) to account for this property whenimplementing the LASSO approach (using the package “glmnet” Friedman et al.(2010) in R). It turns out that none of the time series exhibits a structural break.
3.1 Trend in volatility
In order to assess the development of volatility over a long time period, we estimatean AR(1)-GARCH(1,1) model (Bollerslev 1986) with t-distributed innovations onour long daily price time series. The resulting time series of volatility is displayed inFigure 3. As can be seen, the volatility has been higher at the beginning of the sample
5 There are two instances where the estimator becomes negative, probably due to wrong recordings of thedata. In this instance, we only use half the square of the h and l range as a proxy for the daily variancefollowing Martens and van Dijk (2007).6 To check the persistence of the volatility time series, we estimate the fractional integration parameter dusing the methodologies proposed by Geweke and Porter-Hudak (1983) and Shimotsu and Phillips (2005).We find in all cases that d̂ is significantly different from zero and varies between 0.17 (BTCBOX) and 0.48(Bitfinex)
123

The volatility of Bitcoin and its role as a medium... 2669
Bitfinex (USD)0
510
2030
2014 2015 2016 2017 2018 2019 2020
Kraken (USD)
05
1020
30
2014 2015 2016 2017 2018 2019 2020
BitStamp (EUR)
05
1020
30
2016 2017 2018 2019 2020
Kraken (EUR)
05
1020
30
2014 2015 2016 2017 2018 2019 2020
bitFlyer (JPY)
05
1020
30
2015 2016 2017 2018 2019 2020
BTCBOX (JPY)
05
1020
30
2018 2019 2020
EUR/USD
01
23
4
2014 2015 2016 2017 2018 2019 2020
JPY/USD
01
23
4
2014 2015 2016 2017 2018 2019 2020
Fig. 2 Volatility Time Series. The figure presents time series of daily volatility (in percent) from January1, 2014 to January 25, 2017 for the six Bitcoin markets and the two foreign exchange markets
period than toward the end. Ultimately, this would be good news for the potential ofevolving as a stable currency. However, the initial downward trend does not persistacross the entire sample period. Considering the whole period from 2010 to 2020,we observe a slight downward trend which, in a regression of volatility on time, eventurns out statistically significant, albeit economically weak with 0.015 basis points permonth. This trend stopped after the first hype of Bitcoin at the end of 2013. Considering
123

2670 D. G. Baur, T. Dimpfl
Table 2 Descriptive Statistics
Returns Volatility
Mean S.D. Min Max Mean S.D. Min Max Start n.obs.
Bitfinex (USD) 0.14 4.02 − 48.09 23.72 3.07 2.69 0.00 26.80 Apr 1, 2014 2342
Kraken (USD) 0.14 4.13 − 49.59 23.59 3.23 2.89 0.00 34.03 Apr 1, 2014 2341
BitStamp (EUR) 0.19 4.21 − 48.18 21.82 3.45 2.95 0.04 30.74 Jun 5, 2016 1548
Kraken (EUR) 0.14 3.90 − 47.25 21.50 3.11 2.69 0.00 28.30 Apr 1, 2014 2343
bitFlyer (JPY) 0.19 4.18 − 47.32 34.64 3.06 3.05 0.01 32.01 Jun 25, 2015 1894
BTCBOX (JPY) − 0.01 4.14 − 47.56 18.67 3.54 5.17 0.01 121.13 Jan 16, 2018 958
EUR/USD − 0.01 0.51 − 2.42 3.02 0.47 0.25 0.07 2.94 Apr 1, 2014 1674
JPY/USD − 0.00 0.54 − 3.15 3.77 0.48 0.28 0.02 4.76 Apr 1, 2014 1674
The table presents descriptive statistics of returns and volatility (both in percent) for the Bitcoin and FXmarkets. Mean is the time series average across the available period, S.D. the sample standard deviation.Min (Max) are the minimum and maximum observation. Start indicates the first day in the sample andn.obs. gives the available number of observations
05
1015
2025
2010 2011 2012 2013 2014 2015 2016 2017 2018 2019 2020
Fig. 3 Trend in Volatility. The figure presents volatility of Bitcoin over time with two time trends: bluecovers the entire period from July 2010 to August 2020 and brown starts January 2014 and ends August2020
volatility between 2014 and 2020, a similar trend regression leads to the conclusionthat volatility is constant throughout these years, i.e., the trend is not significantlydifferent from zero.
3.2 Market correlations
Afinal aspectwhichwewant to highlight is the questionhow themarkets covary.This isimportant as the price difference between platforms trading Bitcoin can be substantial.If the information dissemination betweenmarkets works well, the pairwise correlationbetween daily transaction returns on those exchanges should be high as they all tradethe same good (Bitcoin). This is in general supported by our data. Figure 4 presents thedaily conditional correlation of returns based on a DCC-GARCH(1,1) model (Engle
123

The volatility of Bitcoin and its role as a medium... 2671
Bitfinex (USD) and Kraken (USD)0.
00.
20.
40.
60.
81.
0
2014 2015 2016 2017 2018 2019 2020
Bitfinex (USD) and Kraken (EUR)
0.3
0.4
0.5
0.6
0.7
0.8
0.9
1.0
2014 2015 2016 2017 2018 2019 2020
Bitfinex (USD) and Bitflyer (JPY)
0.3
0.4
0.5
0.6
0.7
0.8
0.9
1.0
2015 2016 2017 2018 2019
Kraken (EUR) and Bitflyer (JPY)
0.6
0.7
0.8
0.9
1.0
2015 2016 2017 2018 2019
Bitfinex (USD) and EUR/USD
0.02
5641
750.
0256
4185
2014 2015 2016 2017 2018 2019 2020
EUR/USD and JPY/USD
−0.6
−0.2
0.2
0.4
0.6
0.8
2014 2015 2016 2017 2018 2019 2020
Fig. 4 Return Correlations. The graph presents the dynamic conditional correlation of the daily return timeseries in the named markets
2002), using the pairs for which the longest time series are available. The correlationsof Bitcoin returns are high in general (0.95 on average) and also increased over time.In addition, they are higher than the correlation of the FX returns which is on average0.43. Still, the correlations only tend to converge to one at the end of the sampleperiod, irrespective of whether Bitcoin is traded in the same currency (e.g., the U.S.dollar, top left graph) or in different currencies (top right and middle graphs). Thisobservation also holds for the remaining (unreported) combinations. The bottom leftgraph in Fig. 4 presents the negligible correlation of Bitcoin returns and FX returns.On average, the correlation across time is 0.026.
The evolution of Bitcoin return correlations has important implications in termsof market efficiency. In an efficient market setup, one should be able to construct a
123

2672 D. G. Baur, T. Dimpfl
roundtrip. The cost to implement this trading strategy should be equal to the bid-askspread plus some cost that may be involved when changing the trading venue. Putdifferently, if there are arbitrage gains to be made by buying in one market and sellingin another market, prices should adjust to the fundamental value. In a fully electronicmarket, this should happen quickly and ultimately lead to high correlations of pricechanges. In the Bitcoin setup, there seem to be opportunities for arbitrage gains, inparticular at the beginning of the sample period, when the correlation was sometimesvery low. This finding is in line with Shynkevich (2020) who reports that arbitragegains are more difficult to realize since 2018. This is the period when the correlationtends toward one in Fig. 4, indicating that the markets are more synchronized whilethey were more fragmented before.
4 Empirical analysis
This section analyzes the volatility of Bitcoin in crises, its role as a risk-diversifier ina portfolio, its similarity with major currencies, and its role as a medium of exchangeand a store of value.
4.1 Bitcoin volatility during crisis periods
An important question concerning the volatility of Bitcoin is how it behaves duringcrises. There are two sorts of crises which we distinguish. First, we have crises relatedto the Bitcoin market itself. These are the named DDoS attacks or hacks of exchanges.On the other hand, Bitcoin could also be related to the real economy and volatilitymight therefore be linked to the stock market. Since the data covers the COVID-19pandemic and thus the first financial crisis since the inception of Bitcoin in late 2008,the analysis can provide some unique insights. This is also related to the questionwhether Bitcoin is a safe haven which is impossible to test if there is no crisis asexplained by Smales (2019).
To test whether the volatility behaves differently in any of the two circumstances,we implement a GARCH(1,1) model (Bollerslev 1986) using daily data from coin-marketcap.com and augment the variance equation with two dummy variables whichallow the variance to shift on the day of an attack7 or during the COVID-19 crisis. Forprecise crisis dates in the latter case, we use the end of February until the end of May2020, inspired by the time when the stock market plummeted and rebounded.
The estimation results are presented in Table 3. As can be seen, the Bitcoin-relatedevents (“attacks”) have aweak effect on the volatility. However, the order ofmagnitudeis non-negligible as the unconditional variance is more than 10 times higher underattacks than usual. In contrast, the COVID-19 pandemic does not have an impact onthe volatility. While the parameter estimate suggests an increase, it is not statisticallysignificant.
It appears that the high volatility period caused by the COVID-19 pandemic isnormal in a Bitcoin context as the volatility did not significantly increase in that
7 We use the events listed in Twomey and Mann (2020) where we were able to identify the exact dates.
123

The volatility of Bitcoin and its role as a medium... 2673
Table 3 Parameter estimates ofthe crisis GARCH(1,1)
Estimate Std. Error t-value Pr(> |t | )
μ 0.00119 0.00064 1.849 0.064
φ 0.01316 0.02290 0.575 0.565
ω 0.00008 0.00003 2.681 0.007
α 0.14447 0.03211 4.500 < 0.001
β 0.81655 0.03663 22.292 < 0.001
attacks 0.00101 0.00055 1.845 0.065
COVID-19 0.00041 0.00039 1.067 0.286
The table presents the parameter estimates of a GARCH(1,1) modelwith exogenous dummy variables accounting for days of Bitcoinmarket-related events (“attacks”) or theCOVID-19-induced stockmar-ket crash (February 21 toMay 31, 2020). Standard errors are calculatedaccounting for heteroscedasticity and autocorrelation
period despite the 50% drop in prices in March 2020 and the subsequent rise of morethan 100%. To check the robustness of this finding, we also useMarch 31, 2020, as theend of the COVID-19 crisis, and the results are qualitatively identical; the parameterfor the COVID-19 crisis never turns out statistically significant.
4.2 Bitcoin as a portfolio diversifier
It has often been reported that Bitcoin price changes are uncorrelated with other assets’price changesmakingBitcoin a good diversifier of risk in asset portfolios.We use daily,monthly and quarterly returns of the S&P500 and Bitcoin for the period August 2011to August 2020 to test this feature of Bitcoin.
We perform a portfolio analysis for all three return frequencies and find surprisingresults regarding Bitcoin’s role as a diversifier in an equity-Bitcoin portfolio. Thecorrelations are positive and thus different compared with previous findings. Thecorrelations increase from 0.09 for daily returns to 0.21 for monthly returns and to0.34 for quarterly returns.
We calculated optimal portfolio weights for the S&P500 and Bitcoin based on twocriteria: minimum variance and optimal Sharpe ratios. The optimal minimum varianceweights of Bitcoin are 2.5% for daily data and 0% for monthly and quarterly data. Thehigher correlation estimates for monthly and quarterly returns increase the variance bytoomuch forweights to be larger than zero. The optimal Sharpe ratioweights ofBitcoinare 55%, 50% and 100% for daily, monthly and quarterly returns, respectively. Thenon-monotonicity of the weights is due to a deteriorating risk-return ratio of Bitcoinfrom daily to monthly return frequencies.
The differences between the two optimization criteria are intuitive as the minimumvariance portfolio is exclusively based on variances and covariances and thus ignoresthe estimated expected returns, whereas the optimal Sharpe ratio portfolio includes thelatter and the high returns appear to dominate the variance resulting in much higherweights of Bitcoin compared with the minimum variance portfolios.
123

2674 D. G. Baur, T. Dimpfl
Given the evolution of Bitcoin and its youth, it is well possible that specific char-acteristics will change in the future. Hence, we briefly analyze the sensitivity of theestimates with regards to the portfolio weights. For example, if the volatility decreasedby 50%, it would increase the minimum variance weights from close to 0% to 13%and the Sharpe ratio weights from 55% to 65% for daily data. If the expected returnsdecreased, e.g., by 50%, the minimum variance weights would be unaffected (remainat 0%) and the optimal Sharpe ratio weights would decrease from 55% to 30%.
We conclude that Bitcoin’s excess expected returns and volatility (relative to theS&P500) do not unambiguously make it a good portfolio diversifier or hedge. Itsexcess volatility implies very low or zero weights in a minimum variance portfolio.In contrast, the weights are high, about 50% or higher, in portfolios based on optimalSharpe ratios due to the high excess returns despite the positive correlations.
4.3 Bitcoin versus major currencies
For Bitcoin to serve as a currency, it must resemble established, major currenciessuch as the US dollar. We operationalize resemblance with two key features, namelyintegration in the global currency system and stability. This leads to the followinghypotheses.
H1: Bitcoin volatility and FX volatility are highly correlated. Under H1, Bitcoin isintegrated into the global FX market. If the terms of trade deteriorate in a particularmarket, the country’s exchange rate with respect to all other currencies is affected.Hence, if Bitcoin is part of the global system of exchange rates, it would need to beaffected at the same time and of a similar order of magnitude, resulting in a strongcomovement of its volatility with the volatility of other FX rates.
H2: Bitcoin volatility and FX volatility are equal. Under H2, Bitcoin is relativelystable. If the volatility of Bitcoin is not different from the volatility of major exchangerates, Bitcoin is a reliable currency, i.e., the magnitude of fluctuations are comparablewith other major exchange rates.
To test H1, we compute a DCC model (Engle 2002) for all possible volatilitypairs and extract the time series of conditional correlations. In a second step, we testwhether the correlation of Bitcoin volatility and FX volatility is, on average, as highas the correlation of the two FX volatility time series. The latter serves as a benchmarkfor volatility correlation in the FX market and allows us to quantify the expected levelof the correlation.
Figure 5 depicts a selection of all correlations calculated in the first step. Thecorrelation between the two FX rates is on average 0.49, fluctuating between 0.29 and0.87. The fact that Bitcoin volatility is different is already illustrated by the correlationbetweenBitfinex andKraken volatilitywhich is on average higher (0.81) and fluctuatesmuch more (between 0.28 and 0.99). In order to test H1, we focus on the correlationbetween Bitfinex and the two FX rates. As can be seen from Fig. 5, the respectivecorrelation is very low on average (0.036 and 0.054). It therefore comes as no surprisethat a two-sample t test rejects H1 at any significance level for the pairs depicted inFig. 5. For the remaining Bitcoin/ FX volatility pairs in our sample, the test results
123

The volatility of Bitcoin and its role as a medium... 2675
Bitfinex (USD) and Kraken (USD)0.
30.
50.
70.
9
2014 2016 2018 2020
EUR/USD and JPY/USD
0.3
0.5
0.7
2014 2016 2018 2020
Bitfinex (USD) and EUR/USD
0.0
0.1
0.2
0.3
2014 2016 2018 2020
Bitfinex (USD) and JPY/USD
−0.2
0.0
0.2
0.4
2014 2016 2018 2020
Fig. 5 Volatility Correlations. The figure presents the dynamic conditional correlation of volatility in thenamed markets
consistently reject the equality hypothesis. Hence,we reject the hypothesis that Bitcoinis well-integrated in the global FX market.
H2 suggests that in order for Bitcoin to be a currency, its price fluctuations shouldnot be greater than the fluctuation of major exchange rates involving the US dollar,the euro and the yen. We implement the test as a two-sided two-sample Wilcoxon testto account for the fact that the volatilities are not normally distributed. In particular,we test whether the means of the FX rates’ volatilities (reported in Table 2) are equalto the means of the Bitcoin volatilities. The alternative hypothesis is that the meansare different. Table 4 presents the results and shows H2 is rejected for all pairs.
Hence, we conclude that Bitcoin volatility is different from the volatility of thethree major currencies. Considering the results presented in Table 2 further shows thatBitcoin volatility is higher than FX volatility.
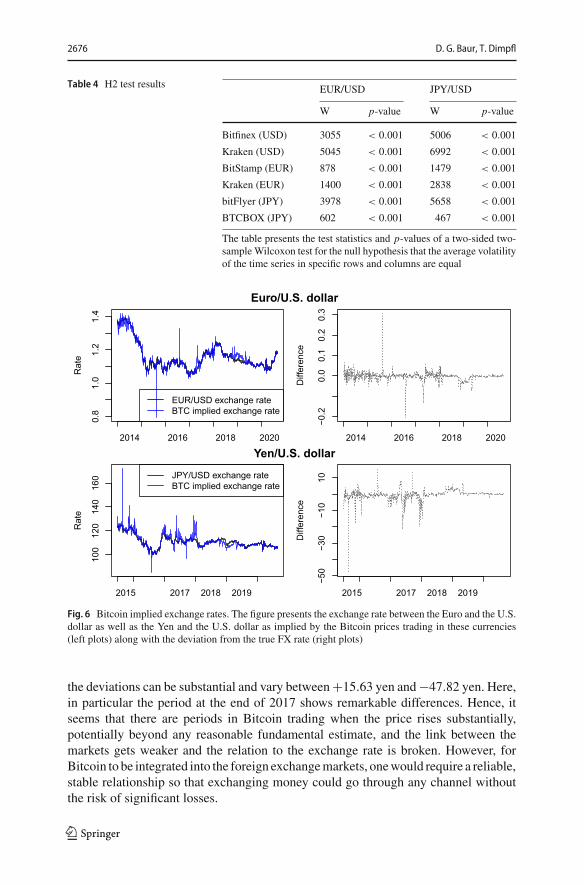
A further way to establish whether Bitcoin is integrated in the fiat currency systemis to calculate the Bitcoin implied exchange rate. It is obtained as the ratio of Bitcoinprices traded against the currencies of interest. Figure 6 presents the evolution of theimplied exchange rate along with the deviation from the official FX rate in our dataset.We find that the deviation from the EUR/USD exchange rate is on average −0.2 eurocent for one dollar. Seen as a cost, this might be better than the large spread offered bybanks. The problem, however, is that the deviations are not stable and vary between−20 and +30 cents. This is a particular problem during the early part of the sample.
Similar observations hold true for the JPY/USD exchange rate. The differencebetween the implied and the official FX rate is on average−0.44 yen per dollar. Again,
123
2676 D. G. Baur, T. Dimpfl
Table 4 H2 test results EUR/USD JPY/USD
W p-value W p-value
Bitfinex (USD) 3055 < 0.001 5006 < 0.001
Kraken (USD) 5045 < 0.001 6992 < 0.001
BitStamp (EUR) 878 < 0.001 1479 < 0.001
Kraken (EUR) 1400 < 0.001 2838 < 0.001
bitFlyer (JPY) 3978 < 0.001 5658 < 0.001
BTCBOX (JPY) 602 < 0.001 467 < 0.001
The table presents the test statistics and p-values of a two-sided two-sampleWilcoxon test for the null hypothesis that the average volatilityof the time series in specific rows and columns are equal
Rat
e
0.8
1.0
1.2
1.4
2014 2016 2018 2020
EUR/USD exchange rateBTC implied exchange rate
Diff
eren
ce
−0.2
0.0
0.1
0.2
0.3
2014 2016 2018 2020
Euro/U.S. dollar
Rat
e
100
120
140
160
2015 2017 2018 2019
JPY/USD exchange rateBTC implied exchange rate
Diff
eren
ce
−50
−30
−10
10
2015 2017 2018 2019
Yen/U.S. dollar
Fig. 6 Bitcoin implied exchange rates. The figure presents the exchange rate between the Euro and the U.S.dollar as well as the Yen and the U.S. dollar as implied by the Bitcoin prices trading in these currencies(left plots) along with the deviation from the true FX rate (right plots)
the deviations can be substantial and vary between+15.63 yen and−47.82 yen. Here,in particular the period at the end of 2017 shows remarkable differences. Hence, itseems that there are periods in Bitcoin trading when the price rises substantially,potentially beyond any reasonable fundamental estimate, and the link between themarkets gets weaker and the relation to the exchange rate is broken. However, forBitcoin to be integrated into the foreign exchangemarkets, onewould require a reliable,stable relationship so that exchanging money could go through any channel withoutthe risk of significant losses.
123

The volatility of Bitcoin and its role as a medium... 2677
March 2020
BTC
/US
D
4000
5000
6000
7000
8000
11 12 13 14 15 16 17 18 19 20
Fig. 7 A few days of Bitcoin prices. The figure presents the Bitcoin price (in USD) fromMarch 11 toMarch20, 2020 in transaction time (using every fourth observation in the plot to reduce size)
4.4 Bitcoin as money
This section analyzes whether the three key properties of a currency, namely mediumof exchange, unit of account, and store of value, also hold for the cryptocurrencyBitcoin.
4.4.1 Bitcoin as a medium of exchange
Currently, if a transaction is supposed to be carried out in Bitcoin, the buyer wouldhave to buy Bitcoin first before using it for payment. Subsequently, it is most likelythat the seller converts Bitcoin back to the local currency in order to pay his creditors.Such a transaction, however, bears exchange rate risk which increases with the levelof volatility in the Bitcoin exchange market. For example, Fig. 2 shows that the dailyvolatility is regularly about 10% and on some days even reaches values above 30%.This means that the purchase of a good that is valued at US$ 1,000 may cost 10%(or US$ 100) more or less depending on the time of the purchase abstracting fromtransaction costs.
To give a more precise example, consider the period 11 to March 13, 2020 which isdepicted in Fig. 7. The graph presents the time series of high frequency trading pricesof Bitcoin on Kraken for these days. Now imagine that a coffee shop sells a cup ofcoffee for 625,000 Satoshi8 which, on March 10 and 11, 2020 at 7.30 am, would havebeen roughly 5 USD. On the morning ofMarch 12, your daily morning coffee got a bitcheaper and is now 4.63 USD which is good for the customer but bad for the owner ofthe coffee shop (if both use US dollars as their benchmark). Even worse, at lunchtime,the same coffee sells for 3.75 USD and for 2.56 USD during the night of March 13.For the coffee shop owner, that is an unsustainable situation as she would have to incurhuge losses if prices stay that low. The only way out is to continuously updating theprice in Bitcoin/ Satoshi which makes a comparison of prices for the customer verycumbersome. To still earn 5 USD, the coffee shop owner would have had to increasethe price to 1,250,000 Satoshi on March 13, doubling the price.
8 1 Bitcoin equals 100,000,000 Satoshi.
123

2678 D. G. Baur, T. Dimpfl
This example also highlights the inconsistent news regarding the acceptance ofBitcoin by small and large corporations. Economic reasoning and intuition helps tounderstand that itwould bevery costly for any corporation, be itApple,Dell,Microsoft,or Paypal, to accept Bitcoin as a means of payment. What some firms may offer as apayment option is the conversion of Bitcoin through a linked Bitcoin exchange. This issimilar tomaking a payment in foreign currencywhich is converted into local currencyat the time of the transaction. Consequently, the conversion is generally costly and thusmuch more expensive than an actual and direct payment in Bitcoin would be.
The only way to entirely remove this risk would be for a country to adopt Bitcoin asa currency and restrict the exchange of Bitcoin into other currencies. But there are noreasons for a developed country to adopt Bitcoin as its currency since it would give upall control over its money supply. That is why the central banks of several countries,instead of adopting Bitcoin, consider creating their own digital currencies.9
4.4.2 Bitcoin as a unit of account
White (1984) argues that the unit of account and the medium of exchange featurecannot be separated. In the current statewhereBitcoin is not acceptedwidely by buyersor sellers as a means of payment, trading partners suffer additional costs (direct costsfrom exchanging currencies and indirect costs due to the high fluctuation of Bitcoin)when using Bitcoin as a unit of account. As Bitcoin is currently not accepted as amedium of exchange, it cannot have the unit of account feature.
Furthermore, due to its extreme volatility it is difficult or impossible to derive thetrue value of a specific good measured in Bitcoin. It is therefore not useful as a unit ofaccount. Yermack (2015) states that the only way to solve this issue is for a countryto adopt Bitcoin as principal currency. However, this is an unlikely scenario (at leastfor a large country) as discussed in Sect. 4.4.1.
4.5 Bitcoin as a store of value
Our analysis so far has identified excess volatility of Bitcoin which appears to reject itsuse as a store of value. However, since the long-term price trend is clearly positive asshown in Fig. 8 for different moving-average prices, it can be argued that the price didnot fall over sufficiently long periods and that Bitcoin shows store of value properties.This argument is supported by Bitcoin’s fixed supply and thus “deflationary design”compared with fiat currencies. In other words, since Bitcoin cannot be inflated beyonda fixed cap, unlike gold whose supply is not fixed, it is possible that demand growthwill persistently exceed supply growth in the future.
The following equation describes the relation of demand and supply of a currency(cp. Sachs and Larrain 1993, ch. 8) and explains the “deflationary design”:
M · V = P · Y9 Governments and central banks could create digital currency and then peg the digital currency to theexisting fiat currency (Eichengreen 2019; Mersch 2020). In this case, a regulated exchange would berequired to use the pegged exchange rate to convert fiat currency into digital currency or vice versa.
123

The volatility of Bitcoin and its role as a medium... 2679
1−year MA2−year MA3−year MA
050
0010
000
1500
0
31/12/2010 30/11/2012 31/10/2014 30/09/2016 31/08/2018 31/07/2020
Fig. 8 Long-term price trends. The figure presents the evolution of the price of Bitcoin (solid line) andlong-term trends based on 1-year, 2-year, and 3-year moving averages (MA)
whereM is money supply, V is the velocity of money, P the price level, and Y nationaloutput. If V is constant and M grows at a lower rate than Y , P must fall implyingdeflation. The value of one unit of currency M would be inversely related to the pricelevel P , i.e., a decreasing price level P implies an increasing price of M .10 In thisdeflationary scenario, currency holders have an incentive to hoard money and delayspending. This scenario is consistent with the long-run positive price trend of Bitcoinand with Bitcoin being a store of value.
Interestingly, major fiat currencies and gold are considered stores of values despitetheir price fluctuations and differing price trends. The price of gold appreciated relativeto major currencies over the last 40 years due to inflation of consumer prices in fiatcurrencies. Consequently, fiat currencies depreciated against gold and many other realassets over the last 40 years. These examples emphasize that the price of a store ofvalue in many cases is not and need not be stable.
The long-term store of value property can also be illustrated differently, based onthe holding period returns of Bitcoin. We calculate the log-returns of holding Bitcoinon a monthly basis for various buy and sell time periods between April 2013 and July2020. The result is presented in Fig. 9 and highlights that early investment (e.g., in2014) generally leads to significant returns over sufficiently long time spans. Indeed,only an investment during the high value period in December 2017 leads to a negativeholding period return over all horizons.
5 Conclusion
Bitcoin is a cryptocurrency but does not work as a currency due to its excess volatility.The high volatility makes it prohibitively costly to use as a medium of exchange anda unit of account. This conclusion holds for very short time horizons, e.g., minutesbut also over longer periods, e.g., days, weeks, or months. In contrast, over very long
10 An alternative, more general, formulation is S · p = D where S is the supply of Bitcoin, p is the priceof Bitcoin, and D is the demand for Bitcoin.
123

2680 D. G. Baur, T. Dimpfl
July 2020June 2020May 2020April 2020
March 2020February 2020January 2020
December 2019November 2019
October 2019September 2019
August 2019July 2019
June 2019May 2019April 2019
March 2019February 2019January 2019
December 2018November 2018
October 2018September 2018
August 2018July 2018
June 2018May 2018April 2018
March 2018February 2018January 2018
December 2017November 2017
October 2017September 2017
August 2017July 2017
June 2017May 2017April 2017
March 2017February 2017January 2017
December 2016November 2016
October 2016September 2016
August 2016July 2016
June 2016May 2016April 2016
March 2016February 2016January 2016
December 2015November 2015
October 2015September 2015
August 2015July 2015
June 2015May 2015April 2015
March 2015February 2015January 2015
December 2014November 2014
October 2014September 2014
August 2014July 2014
June 2014May 2014April 2014
March 2014February 2014January 2014
December 2013November 2013
October 2013September 2013
August 2013July 2013
June 2013May 2013
May
201
3Ju
ne 2
013
July
201
3Au
gust
201
3S
epte
mbe
r 201
3O
ctob
er 2
013
Nov
embe
r 201
3D
ecem
ber 2
013
Janu
ary
2014
Febr
uary
201
4M
arch
201
4A
pril
2014
May
201
4Ju
ne 2
014
July
201
4Au
gust
201
4S
epte
mbe
r 201
4O
ctob
er 2
014
Nov
embe
r 201
4D
ecem
ber 2
014
Janu
ary
2015
Febr
uary
201
5M
arch
201
5A
pril
2015
May
201
5Ju
ne 2
015
July
201
5Au
gust
201
5S
epte
mbe
r 201
5O
ctob
er 2
015
Nov
embe
r 201
5D
ecem
ber 2
015
Janu
ary
2016
Febr
uary
201
6M
arch
201
6A
pril
2016
May
201
6Ju
ne 2
016
July
201
6Au
gust
201
6S
epte
mbe
r 201
6O
ctob
er 2
016
Nov
embe
r 201
6D
ecem
ber 2
016
Janu
ary
2017
Febr
uary
201
7M
arch
201
7A
pril
2017
May
201
7Ju
ne 2
017
July
201
7Au
gust
201
7S
epte
mbe
r 201
7O
ctob
er 2
017
Nov
embe
r 201
7D
ecem
ber 2
017
Janu
ary
2018
Febr
uary
201
8M
arch
201
8A
pril
2018
May
201
8Ju
ne 2
018
July
201
8Au
gust
201
8S
epte
mbe
r 201
8O
ctob
er 2
018
Nov
embe
r 201
8D
ecem
ber 2
018
Janu
ary
2019
Febr
uary
201
9M
arch
201
9A
pril
2019
May
201
9Ju
ne 2
019
July
201
9Au
gust
201
9S
epte
mbe
r 201
9O
ctob
er 2
019
Nov
embe
r 201
9D
ecem
ber 2
019
Janu
ary
2020
Febr
uary
202
0M
arch
202
0A
pril
2020
May
202
0Ju
ne 2
020
July
202
0sell
buy
0 2 4Holding period return
Fig. 9 Investment triangle. The figure presents the holding returns of Bitcoin over time when investing onthe first of the month and selling at the end of the month named on the y-axis and x-axis, respectively
horizons, Bitcoin can be considered a store of value despite its excess volatility. Thisempirical finding is supported theoretically based on Bitcoin’s design, specifically its“deflationary” fixed supply. The high volatility does not only adversely affect Bitcoin’srole as a currency but also as an investment. We demonstrate that Bitcoin’s excessvolatility does not make it a good risk-diversifier in portfolios.
There are many historical examples of hyperinflation and currency crises withextreme changes in currencies similar to changes in the value of Bitcoin. In thesecases, the currencies were often replaced by barter or alternative (foreign) currency.While such fiat currencies often continued to serve as official money despite theextraordinary high volatility, there is a fundamental difference between traditional fiatcurrencies and Bitcoin. The former are backed by a state and require tax payments
123

The volatility of Bitcoin and its role as a medium... 2681
in the state-issued currency creating a direct demand for this currency (see Goodhart1998).Without this requirement, a highly volatile currency, such as Bitcoin, is unlikelyto be used as a means of payment. Since Bitcoin is independent of any governmentwhich may require payments in Bitcoin, people have a choice which translates intothe freedom to not use it as a medium of exchange.
Despite its high historical volatility compared to major currencies, Bitcoin mayevolve as a store of value and an alternative to other stores of value such as gold. Boththe deflationary design and the decentralized and global nature enhance the store ofvalue property and in turn make it unlikely that any country will adopt it as an officialcurrency and thus lose control over the money supply and its monetary policy. Excessvolatility appears to be inconsistent with a store of value but if the store of value isvolatile only in the short run but relatively stable (or rising) in the long run, volatilitymay not be the major issue for Bitcoin as a store of value. After all, safe assets are alsovolatile and risky until maturity. And fiat currencies are not safe or risk-free either.Due to inflation, most fiat currencies have depreciated against real assets such as goldor housing and thus did not work as a store of value in the long run but only in theshort run. This is in contrast to Bitcoin which does not work as a store of value in theshort run but potentially in the long run.
The evolution of digital currencies such as Bitcoin highlights the potential role ofdecentralized and denationalized private money (Hayek 1990) and “choice of cur-rency” (see Endres 2009). It remains to be seen if unregulated and internationally“distributed” digital currencies, including the more recent stablecoins, can competewith national fiat currencies and established stores of value such as gold.
Funding No funding has been received for this project.
Compliance with ethical standards
Conflict of interest Dirk Baur declares that he has no conflict of interest. Thomas Dimpfl declares that hehas no conflict of interest.
Human and animals rights This article does not contain any studies with human participants or animalsperformed by any of the authors.
References
Adachi M, Cominetta M, Kaufmann C, van der Kraaij A (2020) A regulatory and financial stability per-spective on global stablecoins. Macroprudential Bull 10:546
Antonopoulos AM (2014) Mastering Bitcoin. O’Reilly Media, Unlocking Digital Crypto-Currencies,Sebastopol, USA
Ardia D, Bluteau K, RüedeM (2019) Regime changes in Bitcoin GARCH volatility dynamics. Finance ResLett 29:266–271
Baughman G, Flemming J (2020) Global Demand for Basket-Backed Stablecoins. In: Finance and eco-nomics discussion series 2020–048. Board of Governorsof the Federal Reserve System, Washington.https://doi.org/10.17016/FEDS.2020.048
Baur DG, Lee AD, Hong K (2018) Bitcoin: medium of exchange or speculative assets? J Int Financial MarkInst Money 54:177–189
123

2682 D. G. Baur, T. Dimpfl
Bedi P, Nashier T (2020) On the investment credentials of Bitcoin: a cross-currency perspective. Res IntBus Finance 51:21
Blau BM (2018) Price dynamics and speculative trading in Bitcoin. Res Int Bus Finance 43:15–21Böhme R, Christin N, Edelman B,Moore T (2015) Bitcoin: economics, technology, and governance. J Econ
Perspect 29:213–238Bollerslev T (1986) Generalized autoregressive conditional heteroskedasticity. J Econ 31:307–327Bouoiyour J, Selmi R (2016) Bitcoin: a beginning of a new phase? Econ Bull 36:1–11Bouri E, Azzi G, Dyhrberg AH (2017) On the return-volatility relationship in the Bitcoin market around
the price crash of 2013. Open Access Open Assess E J Econ 3:11Brainard L (2019) Update on Digital Currencies, Stablecoins, and the Challenges Ahead. Technical Report,
Board of Governors of the Federal Reserve SystemBrière M, Oosterlinck K, Szafarz A (2015) Virtual currency, tangible return: Portfolio diversification with
bitcoin. J Asset Manag 16:365–373Brito J, Castillo A (2013) Bitcoin: a primer for policymakers. Mercatus Center George Mason University,
ArlingtonCFTC (2018) An Introduction to Virtual Currency. Technical report, Commodity futures and trade com-
mission. https://www.cftc.gov/Bitcoin/index.htm. Accessed Aug 19, 2020Chan NH, Yau CY, Zhang R-M (2014) Group LASSO for structural break time series. J Am Stat Assoc
109:590–599Cheah E-T, Fry J (2015) Speculative bubbles in Bitcoin markets? an empirical investigation into the funda-
mental value of Bitcoin. Econ Lett 130:32–36Corsi F (2009) A simple approximate long-memorymodel of realized volatility. J Financial Econ 7:174–196Dion-Schwarz C, Manheim D, Johnston PB (2019) Terrorist use of cryptocurrencies-technical and organi-
zational barriers and future threats. RAND Corporation, Research Reports, Santa Monica, CADwyer GP (2015) The economics of Bitcoin and similar private digital currencies. J Financ Stab 17:81–91Eichengreen B (2019) From Commodity to Fiat and Now to Crypto: What Does History Tell Us? In: NBER
Working Papers 25426, National Bureau of Economic Research, IncEndres AM (2009) Currency competition: a hayekian perspective on international monetary integration. J
Money Credit Bank 41:1251–1263Engle R (2002) Dynamic conditional correlation: a simple class of multivariate generalized autoregressive
conditional heteroskedasticity models. J Busin Econ Stat 20:339–350FinCEN (2013) Statement of Jennifer Shasky Calvery, Director, Financial Crimes Enforcement Network,
United States Department of the Treasury. Technical report, Financial Crimes Enforcement Net-work, United States Department of the Treasury. https://www.fincen.gov/news/testimony/statement-jennifer-shasky-calvery-director-financial-crimes-enforcement-network. Accessed Aug 19, 2020
Friedman J, Hastie T, Tibshirani R (2010) Regularization paths for generalized linear models via coordinatedescent. J Stat Softw 33:1–22
Garman MB, Klass MJ (1980) On the estimation of security price volatilities from historical data. J Bus53:67–78
Geweke J, Porter-Hudak S (1983) The estimation and application of long memory time series models. JTime Ser Anal 4:221–238
Glaser F, ZimmermannK, HaferkornM,WeberMC, SieringM (2014) Bitcoin-asset or currency? RevealingUsers’ Hidden Intentions. https://ssrn.com/abstract=2425247
Global Legal Research Center (2018) Regulation of Cryptocurrency Around the World, Technical report,The Law Library of Congress. https://www.loc.gov/law/help/cryptocurrency/world-survey. AccessedAug 19, 2020
Goodhart CA (1998) The two concepts of money: implications for the analysis of optimal currency areas.Eur J Polit Econ 14:407–432
Griffin JM, Shams A (2020) Is bitcoin really untethered? J Finance 75:1913–1964Guesmi K, Saadi S, Abid I, Ftiti Z (2019) Portfolio diversification with virtual currency: evidence from
bitcoin. Int Rev Financial Anal 63:431–437Hayek FA (1990) Denationalisation of money: the argument refined, vol 3. The Institute of Economic
Affairs, LondonHussain Shahzad SJ, Bouri E, Roubaud D, Kristoufek L (2020) Safe haven, hedge and diversification for
G7 stock markets: gold versus bitcoin. Econ Model 87:212–224Katsiampa P (2017) Volatility estimation for bitcoin: a comparison of GARCH models. Econ Lett 158:3–6Libra Association (2020) Libra White Paper. https://libra.org
123

The volatility of Bitcoin and its role as a medium... 2683
Lyons RK, Viswanath-Natraj G (2020) What keeps Stablecoins stable? NBER Working Paper No. 27136.https://www.nber.org/papers/w27136
Mandjee T (2015) Bitcoin, its legal classification and its regulatory framework. J Bus Secur Law15:157–218Martens M, van Dijk D (2007) Measuring volatility with the realized range. J Econ 138:181–207Mersch Y (2019) Money and private currencies: reflections on Libra. ECB Legal Conference speech.
https://www.ecb.europa.eu/press/key/date/2019/html/ecb.sp190902~aedded9219.en.html. AccessedAug 19, 2020
Mersch Y (2020) An ECB digital currency–a flight of fancy? Consensus 2020 virtual conference speech.https://www.ecb.europa.eu/press/key/date/2020/html/ecb.sp200511~01209cb324.en.html. AccessedAug 19, 2020
Nakamoto S (2008) Bitcoin: a peer-to-peer electronic cash system. https://bitcoin.org/bitcoin.pdfSachs JD, Larrain FB (1993) Macroeconomics in the global economy. Prentice-Hall, New YorkShimotsu K, Phillips PCB (2005) Exact local whittle estimation of fractional integration. Ann Stat 33:1890–
1933Shynkevich A (2020) Bitcoin arbitrage. Finance Res Lett 101698:6839Smales L (2019) Bitcoin as a safe haven: is it even worth considering? Finance Res Lett 2:59Tether Operations Ltd (2016) Tether: fiat currencies on the bitcoin blockchain. https://tether.to/Twomey D,Mann A (2020) Fraud and manipulation within cryptocurrency markets. In: Alexander C, Cum-
ming D (eds) Corruption and fraud in financial markets: malpractice, misconduct and manipulation.Wiley, New York, pp 205–250
Vasek M, Thornton M, Moore T (2014) Empirical analysis of denial-of-service attacks in the bitcoinecosystem. In: Böhme R, Brenner M, Moore T, Smith M (eds) Financial cryptography and datasecurity, vol 8438. Lecture Notes in Computer Science. Springer, Berlin, pp 57–71
White LH (1984) Competitive payments systems and the unit of account. Am Econ Rev 74:699–712Yermack D (2015) Is bitcoin a real currency? An economic appraisal. In: Chuen DLK, Diego S (eds)
Handbook of digital currency. Academic Press, New York, pp 31–43
Publisher’s Note Springer Nature remains neutral with regard to jurisdictional claims in published mapsand institutional affiliations.
123