The Visual Virtual Machine – a Study of Runtime Visualization - KTH
31
Johan Byttner TRITA-NA-E03149 The Visual Virtual Machine – a Study of Runtime Visualization of Java Programs
Transcript of The Visual Virtual Machine – a Study of Runtime Visualization - KTH
Johan Byttner
TRITA-NA-E03149
The Visual Virtual Machine– a Study of Runtime Visualization
of Java Programs
NADA
Numerisk analys och datalogi Department of Numerical AnalysisKTH and Computer Science100 44 Stockholm Royal Institute of Technology
SE-100 44 Stockholm, Sweden
Johan Byttner
TRITA-NA-E03149
Master’s Thesis in Computer Science (20 credits)at the School of Mechanical Engineering,Royal Institute of Technology year 2003
Supervisor at Nada was Kai-Mikael Jää-AroExaminer was Yngve Sundblad
The Visual Virtual Machine– a Study of Runtime Visualization
of Java Programs
1
The Visual Virtual Machine. A study of runtime visualization of Java programs.
Abstract In this project the possibility to provide a mental image of computation of a software system is investigated. Although the long-term goal is to provide this to end users, this paper mainly covers the short-term goal: giving software developers insight into their running Java program. This is done as a proof-of-concept for the long-term goal. An experimental platform was created, where a Java Virtual Machine was modified to extract information of its activity. This information was then visualized using a number of visualizing techniques. The evaluation of this system was over expectation; not only did it prove that useful information was available, but it also proved to be a useful tool for software developers trying to understand their program.
En Visuell Virtuell Maskin. En studie i realtidsvisualisering av Java-program.
Sammanfattning I det här projektet undersöks möjligheten att presentera en mental bild av beräkningar som sker i ett mjukvarusystem. Det långsiktiga målet är att presentera detta för slutanvändare. Det här dokumentet behandlar dock i första hand det kortsiktiga målet: Att ge programutvecklare insikt i sina exekverande Javaprogram. Detta görs för att visa att det långsiktiga målet är möjligt att nå. En experimentplatform har skapats genom en modifiering av en Java Virtual Machine så att intressant information om interna aktiviteter kan hämtas. Denna information presenteras sedan för användare med hjälp av olika visualiseringstekniker. Utvärderingen av detta system var över förväntan: det visade inte bara att användbar information finns tillgänglig, utan även att det är ett användbart system när programmerare vill förstå sina program.
2
Preface This is a master’s thesis at the Royal Institute of Technology in Stockholm, Sweden. The thesis covers a project executed at University of California, Irvine on behalf of Professor Paul Dourish. The project was conducted over a six month period and is a Computer Science project with focus on HCI, human computer interaction.
A shorter version of this thesis was presented at the Distributed Multimedia Systems – 2002 conference at San Francisco.
I would like to thank two persons that made it possible for me to conduct this work: Luis Miguel Campos for his help during my stay in California and Paul Dourish who was extremely inspiring to work with.
The chapters of this document can be divided into three parts. Chapters one, two and three describe the preparing work for the project. Chapters four and five explain the actual implementation of the program. The last four chapters describe the evaluation of the program.
Chapter one is an introduction to the project. It describes the short-term goal as well as the long-term goal of the project. In chapter two the background study is presented. It also describes the structure of the Java Virtual Machine. The next chapter is handling other projects which are related to VaVoom. Two projects are close to this: the Almost project from Brown University and JInsight from IBM.
Chapter four explains the methods chosen for the implementation, which is described in chapter five.
The sixth chapter shows the evaluation of the project which was carried out using two different user groups. This is followed by the results of this evaluation. The conclusions and recommendations from the user study are shown in chapter eight and nine.
Three appendixes are included in this document: the system description, the user’s guide and the details of the user study.
3
Table of Contents 1 Introduction ...................................................................................................... 5
1.1 Background ............................................................................................................. 5
1.2 Project goals ............................................................................................................ 5
1.3 Project description................................................................................................... 6
1.4 Limitations............................................................................................................... 7
1.5 Target group............................................................................................................ 7
2 Background study............................................................................................. 8
2.1 Structure of the Java Virtual Machine ................................................................... 8 2.1.1 Runtime Data Areas.................................................................................................................... 8 2.1.2 Frames ........................................................................................................................................ 9 2.1.3 Exceptions .................................................................................................................................. 9 2.1.4 Instruction Set............................................................................................................................. 9
3 Related work................................................................................................... 10
3.1 Almost .................................................................................................................... 11
3.2 JInsight .................................................................................................................. 12
4 Method description......................................................................................... 13
5 Implementing VaVoom.................................................................................. 13
5.1 TCL prototype....................................................................................................... 13
5.2 The Visual Virtual Machine.................................................................................. 14 5.2.1 The Visual Tools ...................................................................................................................... 14 5.2.2 The Control Interface................................................................................................................ 19
6 Evaluation ....................................................................................................... 19
7 Results.............................................................................................................. 20
8 Conclusions ..................................................................................................... 21
9 Recommendations .......................................................................................... 21
10 References ....................................................................................................... 22
4
11 Appendix I: System description .................................................................... 23
11.1 Kaffe ...................................................................................................................... 23
11.2 Visualizers.............................................................................................................. 23
11.3 Description of files ................................................................................................. 24 11.3.1 Files changed in Kaffe .............................................................................................................. 24 11.3.2 Visualizers ................................................................................................................................ 25
11.4 Communication protocol....................................................................................... 25
11.5 Todo list ................................................................................................................. 26
12 Appendix II: User’s Guide............................................................................. 27
12.1 Installing and running........................................................................................... 27
12.2 What works............................................................................................................ 27
13 Appendix III: User Study .............................................................................. 27
13.1 Test description ..................................................................................................... 27
5
1 Introduction
1.1 Background The computers of today are capable of calculating and displaying more complex visual interfaces than those 30 years ago. Despite this the interfaces we use today are based on a model of interaction that were developed this long ago[15]. The increasing computing power of everyday computers has also made the software more advanced. Still the interfaces we use to interact with these programs have not evolved at the same pace as the software they control. This raises an interesting question: are the interfaces we use today adequately advanced to control the software of today efficiently?
This project is intended to tackle these problems. One step towards better interfaces is to present information about what goes on inside the computer to the user. Similar to driving a car you get a lot of feedback from all your actions. You can for example hear how the engine sounds when you push the accelerator or the clicking noise from the turn signal telling you if they are working or not. This type of information is important when driving and we take it for granted. A mental image of what goes on inside a computer makes the interaction between humans and computers more natural.
Similarly, when two people interact they constantly monitor each others’ signs. These signs, visual or spoken, might tell more about what the other person means than the actual conversation. You are able to get a great deal of feedback about what the person is feeling and intending. This is an insight of what goes on in the head of the other person.
When communication between the user and the computer fails, you often hear the user asking questions out loud: “What is it doing now?” or “Why is nothing happening?”. In this project the possibility to enhance the “experience of computation” in everyday interaction is investigated. By doing this the computer user can get a mental image of events inside the computer. This is the long-term goal of the project.
1.2 Project goals Though the long-term goal is to provide the user with a mental image of computation, the intention is not to provide the user with a complete understanding of a software system. This would of course be impossible. Instead an insight of a specific detail of the system, normally hidden from the user, should be provided. This information might influence the user's decisions. For instance, the user can get information on the balance between network and disc activity, making it possible for the user to configure and optimize the balance between the two data sources. The long-term goal is aimed at end users.
The short-term goal is primarily a proof-of-concept. Similarly to the long-term goal the short-term goal will also provide a mental image of computation, but the focus will not be on end users. Instead this insight into a software system will be provided to its developer.
This master's thesis covers the short-term goal, presenting information about the events inside running programs to its developer.
6
1.3 Project description Most programs that run in a computer are either compiled into machine code, which the computer hardware can understand directly, or interpreted, which is the case for script based languages. In script based languages each line of code is read and executed by an interpreter. The advantage of script based languages is that they are generally independent of what platform they are running on. The disadvantage is that they are slow to execute, which is the reason why not many script based languages are used for application programming.
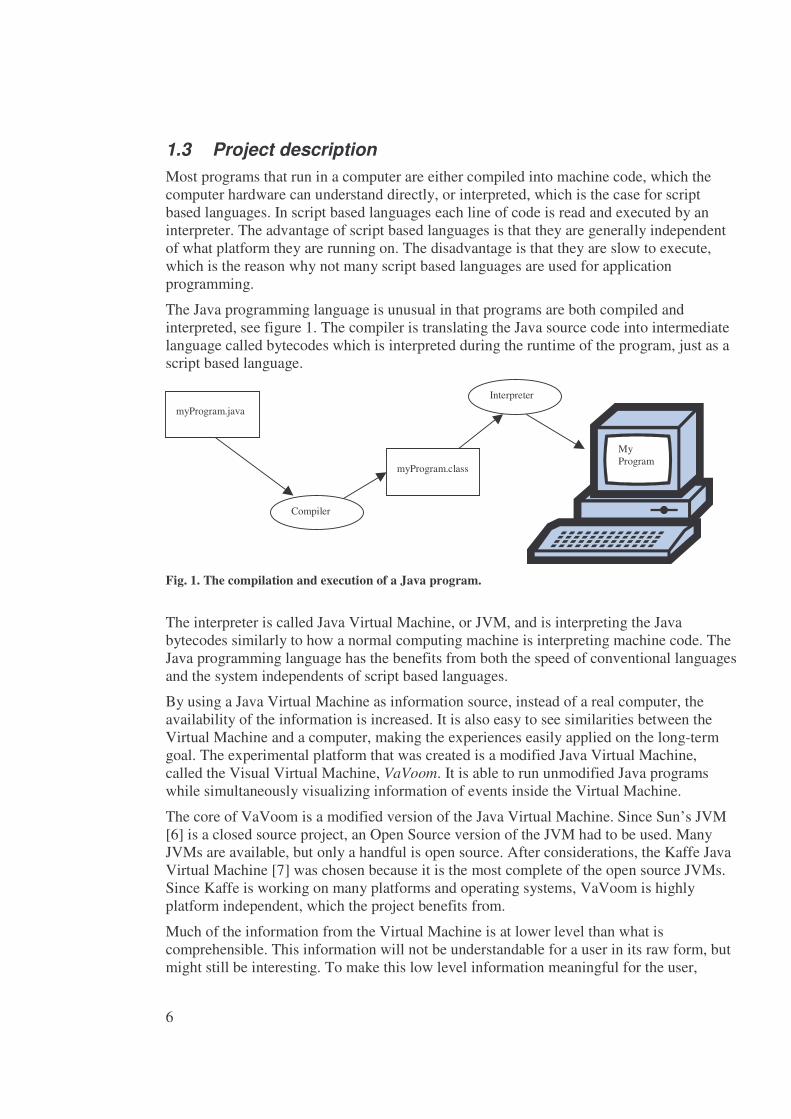
The Java programming language is unusual in that programs are both compiled and interpreted, see figure 1. The compiler is translating the Java source code into intermediate language called bytecodes which is interpreted during the runtime of the program, just as a script based language.
Fig. 1. The compilation and execution of a Java program.
The interpreter is called Java Virtual Machine, or JVM, and is interpreting the Java bytecodes similarly to how a normal computing machine is interpreting machine code. The Java programming language has the benefits from both the speed of conventional languages and the system independents of script based languages.
By using a Java Virtual Machine as information source, instead of a real computer, the availability of the information is increased. It is also easy to see similarities between the Virtual Machine and a computer, making the experiences easily applied on the long-term goal. The experimental platform that was created is a modified Java Virtual Machine, called the Visual Virtual Machine, VaVoom. It is able to run unmodified Java programs while simultaneously visualizing information of events inside the Virtual Machine.
The core of VaVoom is a modified version of the Java Virtual Machine. Since Sun’s JVM [6] is a closed source project, an Open Source version of the JVM had to be used. Many JVMs are available, but only a handful is open source. After considerations, the Kaffe Java Virtual Machine [7] was chosen because it is the most complete of the open source JVMs. Since Kaffe is working on many platforms and operating systems, VaVoom is highly platform independent, which the project benefits from.
Much of the information from the Virtual Machine is at lower level than what is comprehensible. This information will not be understandable for a user in its raw form, but might still be interesting. To make this low level information meaningful for the user,
Compiler
Interpreter
myProgram.java
myProgram.class
My Program
7
different visualization techniques was used. An important phase in the project was to examine what information from the JVM is interesting to visualize and at what resolution. To understand this, the data was visualized at a very low level and then gradually increased. The hypothesis is that it is possible to understand patterns in low level data if visualized in an effective way.
1.4 Limitations The development of VaVoom is a small part of a bigger project aiming for the long-term goal, providing a mental image of events in a computer. This puts a number of constraints on the short-term goal of developing VaVoom.
First, VaVoom has to visualize system behavior in real-time. The user should get feedback about what takes place inside the computer at a specific moment and directly see the consequences of a specific action. The analysis of the visualized program has to be done during the runtime of the program, in contrast to other visualization tools such as JInsight [1] (see chapter 3.2). This makes it possible for the developer to see how the visualization is affected by the interaction with the program.
Second, the visualized systems have to be already compiled programs. The user should only need to have access to the class files or the jar file, and not the source code. The source code should not need to be altered in any way. The visualizations should be able to be applied to any working program. This is in contrast with traditional approaches to algorithm animation [2].
Third, different information spaces need to be explored to get a wider idea of what information is possible to get from the system. Therefore multiple linked visualizations will be used, all focused on one particular aspect of the system behavior. It is important to be able to view these visualizations at the same time to understand correlations between different aspects of the system's behavior.
Fourth, the focus of the project is on visualizing the dynamic structure of a running program. Visualization of static structures in programs is an important part of Software Visualization and many tools, especially those aimed at novice programmers, provide this. Some tools aimed at large-scale software development, such as those of Eick et al. [3], are visualizing the static structure of programs. The dynamic visualizations developed in this project will serve as a complement to these static visualizations.
Fifth, VaVoom will not become a debugger, only a visualization tool. It will not be a tool for controlling or changing program flow or variable values. Although it will be possible to find errors in code using VaVoom, this is not the primary purpose. VaVoom will provide information from the Virtual Machine to the user. No information goes the other way, from the user to the running program.
1.5 Target group VaVoom is primarily intended for Java programmers who want to have insight into the JVM. This can be used for educational purposes, where students can see how their program is working inside the JVM or for advanced programmers trying to find bottlenecks and errors in their programs.
8
Secondarily, in the future, VaVoom is to be used by end users, for instance using network-based Java programs, where the users can see network congestions.
2 Background study The first phase of the project was to analyze the different techniques for implementing the Visual Virtual Machine. The structure of the Java Virtual Machine was studied to get knowledge of where to modify it and make it transmit event information. Related projects were also studied and different visualization techniques evaluated (see chapter 3).
2.1 Structure of the Java Virtual Machine The structure of the Java Virtual Machine is published by Sun Microsystems [8] and Kaffe follows Sun’s Specification.
The JVM executes instructions from a binary file called class file. The class file contains the instructions, or Opcodes, which are interpreted by the JVM and executed. This is analogous to a real computing machine, executing machine code instructions. Java source code has to be compiled into a class file to be able to run in the JVM.
2.1.1 Runtime Data Areas The Runtime Data Areas are used during the execution of the program. The data areas can be divided into two groups; the per-thread data areas, where the data are only available for one specific thread, and the global data areas containing data which are available for all threads.
2.1.1.1 Global runtime data areas
The Heap When a new instance of a class or a new array is created it is stored on the heap. In contrast to conventional programming languages, such as C++, objects and arrays cannot be deallocated. Instead an automatic storage management system, the Garbage Collector, handles all objects and arrays which are not used anymore.
Method Area The method area stores the code that is executed when a method is called. It also contains data about the specific class such as the constant pool, field and method data.
2.1.1.2 Per-thread runtime data areas
The pc Register The pc register holds the program counter which points at the instruction currently being executed in the Method Area. One pc Register is created for each thread since threads make it possible to do execution at different positions in a program at the same time.
9
Java Virtual Machine Stacks Each thread in the JVM has a JVM Stack containing frames (see below). Although the name implies that the frames are stored in a stack, the JVM specification does not say how they should be stored and the frames can just as well be stored as a heap.
Native Method Stacks The Java Virtual Machine may, but doesn’t have to, contain a Native Method Stack. This Stack makes it possible to execute methods written in other languages than Java. These methods are called Native Methods.
2.1.2 Frames Each time a method is invoked a new frame is created and pushed onto the JVM Stack. These frames contain data used in the execution of the method, such as local variables, and partial results. When the program returns from a method the frame is popped from the Stack. Only one frame per thread is active at one time as only one method can be active at one time. The active frame and method is called current frame and current method. The current method is a part of a class which is called the current class. The current class and current method are important information to be collected by VaVoom.
2.1.3 Exceptions There are two ways to exit a method or a constructor in Java. Apart from exiting a method normally, by running the method code to its end, it is also possible to throw exceptions. When an exception is thrown the current method will exit abruptly. Methods above will also exit until a method implementing a catch clause is encountered.
2.1.4 Instruction Set Like a real computing machine the JVM has an Instruction Set defining the operation that will be performed in the JVM. Every operation has a specific code called opcode. The opcodes can be grouped depending on what type of operation they represent.
• Load and store instructions – Put and pop local variables and the operand stack
• Arithmetic instructions – Perform an arithmetic operation on two values on the operand stack.
• Type conversion instructions – Convert the type of the topmost value on the operand stack.
• Object creation and manipulation – Create and manipulate objects and arrays
• Operand stack management instructions – Provide instructions for direct manipulation of the operand stack
• Control transfer instructions – Conditional and unconditional branching of the program flow.
• Method invocations and return instructions
10
• Throwing “exceptions” – Used as part of error handling in Java
• Implementing “finally” – Used as part of error handling in Java
• Synchronization of threads
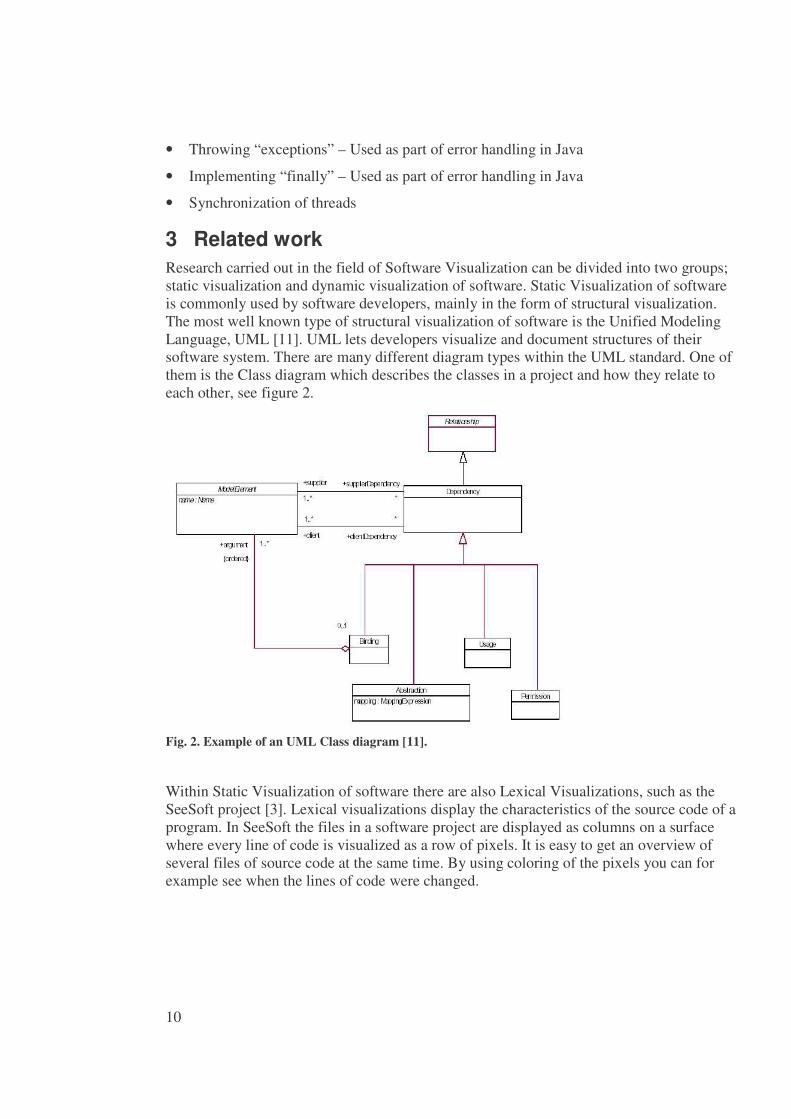
3 Related work Research carried out in the field of Software Visualization can be divided into two groups; static visualization and dynamic visualization of software. Static Visualization of software is commonly used by software developers, mainly in the form of structural visualization. The most well known type of structural visualization of software is the Unified Modeling Language, UML [11]. UML lets developers visualize and document structures of their software system. There are many different diagram types within the UML standard. One of them is the Class diagram which describes the classes in a project and how they relate to each other, see figure 2.
Fig. 2. Example of an UML Class diagram [11].
Within Static Visualization of software there are also Lexical Visualizations, such as the SeeSoft project [3]. Lexical visualizations display the characteristics of the source code of a program. In SeeSoft the files in a software project are displayed as columns on a surface where every line of code is visualized as a row of pixels. It is easy to get an overview of several files of source code at the same time. By using coloring of the pixels you can for example see when the lines of code were changed.
11
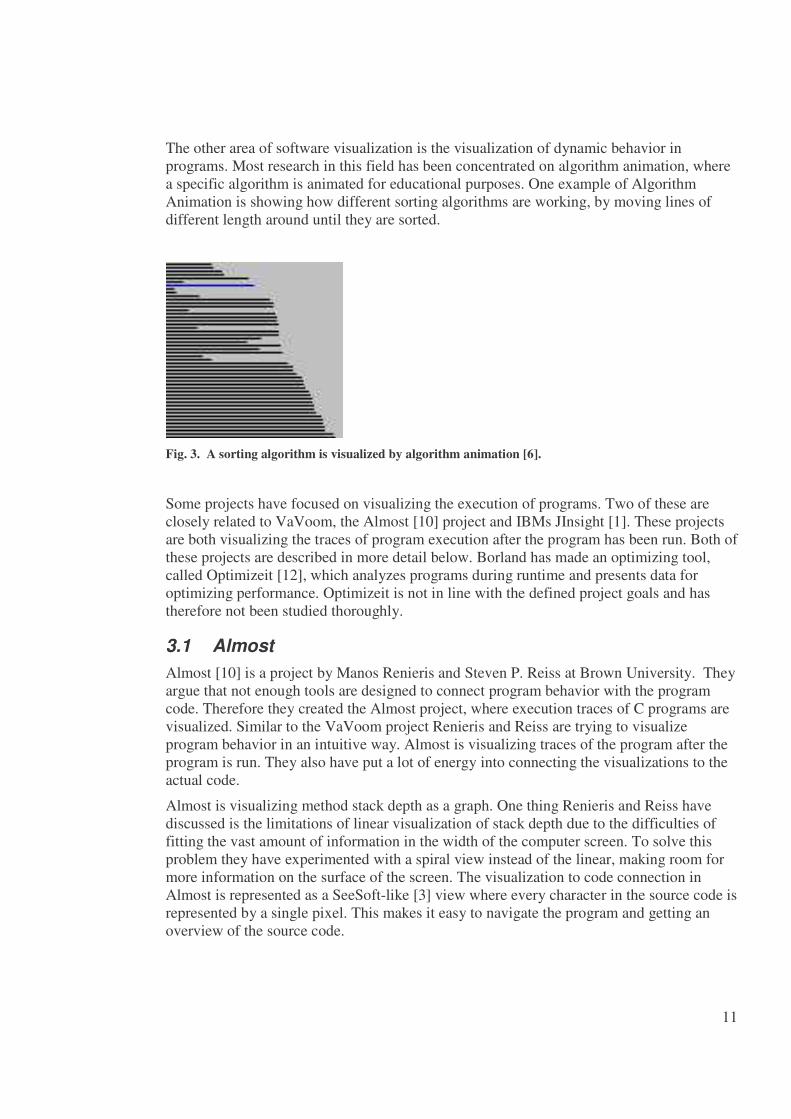
The other area of software visualization is the visualization of dynamic behavior in programs. Most research in this field has been concentrated on algorithm animation, where a specific algorithm is animated for educational purposes. One example of Algorithm Animation is showing how different sorting algorithms are working, by moving lines of different length around until they are sorted.
Fig. 3. A sorting algorithm is visualized by algorithm animation [6].
Some projects have focused on visualizing the execution of programs. Two of these are closely related to VaVoom, the Almost [10] project and IBMs JInsight [1]. These projects are both visualizing the traces of program execution after the program has been run. Both of these projects are described in more detail below. Borland has made an optimizing tool, called Optimizeit [12], which analyzes programs during runtime and presents data for optimizing performance. Optimizeit is not in line with the defined project goals and has therefore not been studied thoroughly.
3.1 Almost Almost [10] is a project by Manos Renieris and Steven P. Reiss at Brown University. They argue that not enough tools are designed to connect program behavior with the program code. Therefore they created the Almost project, where execution traces of C programs are visualized. Similar to the VaVoom project Renieris and Reiss are trying to visualize program behavior in an intuitive way. Almost is visualizing traces of the program after the program is run. They also have put a lot of energy into connecting the visualizations to the actual code.
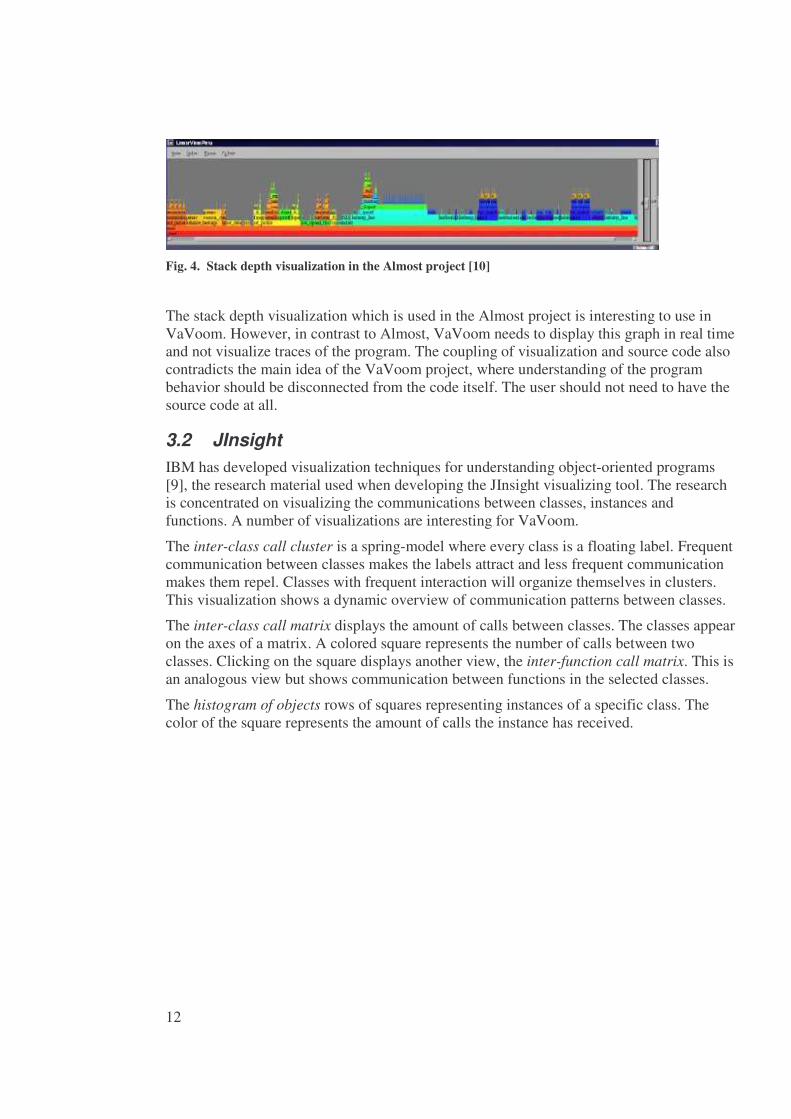
Almost is visualizing method stack depth as a graph. One thing Renieris and Reiss have discussed is the limitations of linear visualization of stack depth due to the difficulties of fitting the vast amount of information in the width of the computer screen. To solve this problem they have experimented with a spiral view instead of the linear, making room for more information on the surface of the screen. The visualization to code connection in Almost is represented as a SeeSoft-like [3] view where every character in the source code is represented by a single pixel. This makes it easy to navigate the program and getting an overview of the source code.
12
Fig. 4. Stack depth visualization in the Almost project [10]
The stack depth visualization which is used in the Almost project is interesting to use in VaVoom. However, in contrast to Almost, VaVoom needs to display this graph in real time and not visualize traces of the program. The coupling of visualization and source code also contradicts the main idea of the VaVoom project, where understanding of the program behavior should be disconnected from the code itself. The user should not need to have the source code at all.
3.2 JInsight IBM has developed visualization techniques for understanding object-oriented programs [9], the research material used when developing the JInsight visualizing tool. The research is concentrated on visualizing the communications between classes, instances and functions. A number of visualizations are interesting for VaVoom.
The inter-class call cluster is a spring-model where every class is a floating label. Frequent communication between classes makes the labels attract and less frequent communication makes them repel. Classes with frequent interaction will organize themselves in clusters. This visualization shows a dynamic overview of communication patterns between classes.
The inter-class call matrix displays the amount of calls between classes. The classes appear on the axes of a matrix. A colored square represents the number of calls between two classes. Clicking on the square displays another view, the inter-function call matrix. This is an analogous view but shows communication between functions in the selected classes.
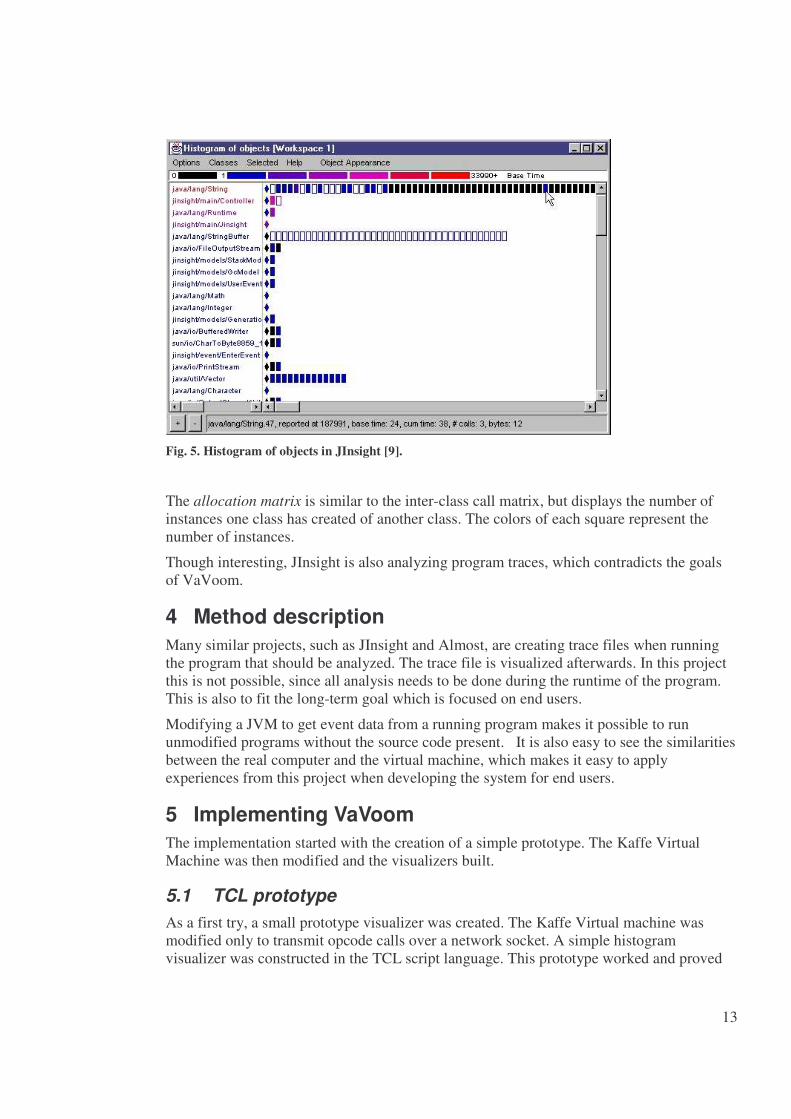
The histogram of objects rows of squares representing instances of a specific class. The color of the square represents the amount of calls the instance has received.
13
Fig. 5. Histogram of objects in JInsight [9].
The allocation matrix is similar to the inter-class call matrix, but displays the number of instances one class has created of another class. The colors of each square represent the number of instances.
Though interesting, JInsight is also analyzing program traces, which contradicts the goals of VaVoom.
4 Method description Many similar projects, such as JInsight and Almost, are creating trace files when running the program that should be analyzed. The trace file is visualized afterwards. In this project this is not possible, since all analysis needs to be done during the runtime of the program. This is also to fit the long-term goal which is focused on end users.
Modifying a JVM to get event data from a running program makes it possible to run unmodified programs without the source code present. It is also easy to see the similarities between the real computer and the virtual machine, which makes it easy to apply experiences from this project when developing the system for end users.
5 Implementing VaVoom The implementation started with the creation of a simple prototype. The Kaffe Virtual Machine was then modified and the visualizers built.
5.1 TCL prototype As a first try, a small prototype visualizer was created. The Kaffe Virtual machine was modified only to transmit opcode calls over a network socket. A simple histogram visualizer was constructed in the TCL script language. This prototype worked and proved
14
that the information was possible to visualize, but the TCL script language is far too slow to display any dynamic visualizations. Therefore the further development of the visualizers was be done in Java.
5.2 The Visual Virtual Machine
UnmodifiedJava program
InstrumentedJVM Multiplexor
Visual tools
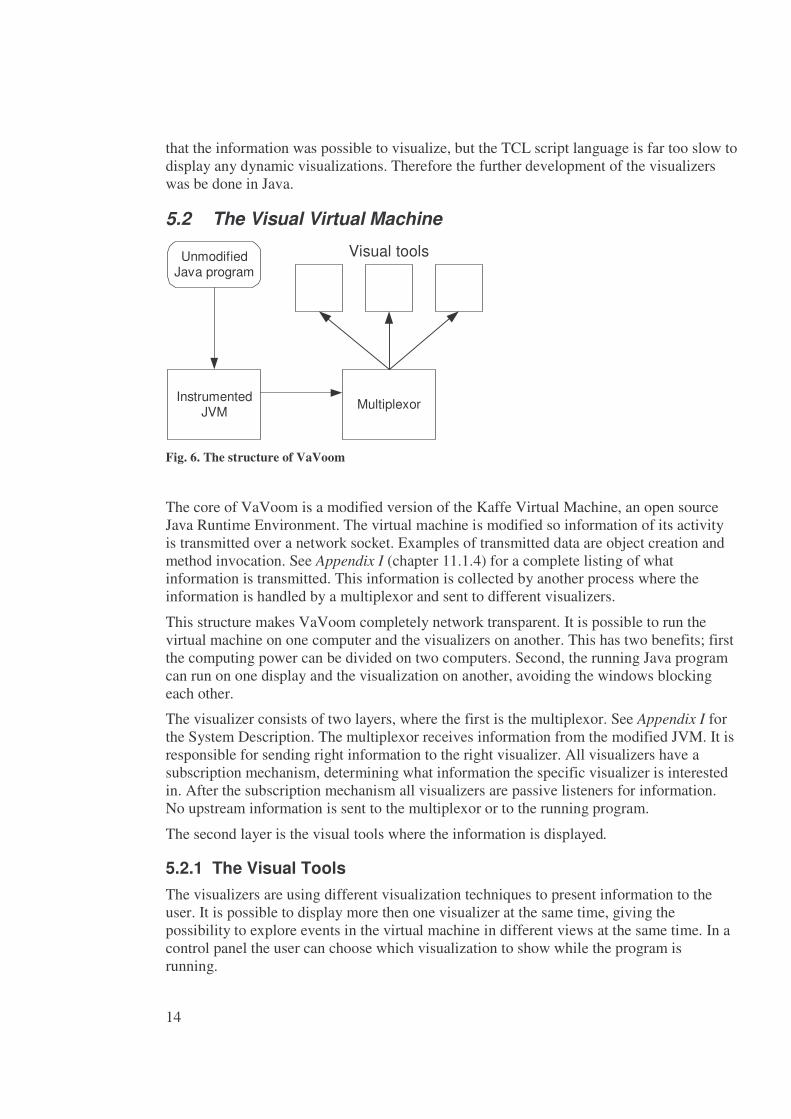
Fig. 6. The structure of VaVoom
The core of VaVoom is a modified version of the Kaffe Virtual Machine, an open source Java Runtime Environment. The virtual machine is modified so information of its activity is transmitted over a network socket. Examples of transmitted data are object creation and method invocation. See Appendix I (chapter 11.1.4) for a complete listing of what information is transmitted. This information is collected by another process where the information is handled by a multiplexor and sent to different visualizers.
This structure makes VaVoom completely network transparent. It is possible to run the virtual machine on one computer and the visualizers on another. This has two benefits; first the computing power can be divided on two computers. Second, the running Java program can run on one display and the visualization on another, avoiding the windows blocking each other.
The visualizer consists of two layers, where the first is the multiplexor. See Appendix I for the System Description. The multiplexor receives information from the modified JVM. It is responsible for sending right information to the right visualizer. All visualizers have a subscription mechanism, determining what information the specific visualizer is interested in. After the subscription mechanism all visualizers are passive listeners for information. No upstream information is sent to the multiplexor or to the running program.
The second layer is the visual tools where the information is displayed.
5.2.1 The Visual Tools The visualizers are using different visualization techniques to present information to the user. It is possible to display more then one visualizer at the same time, giving the possibility to explore events in the virtual machine in different views at the same time. In a control panel the user can choose which visualization to show while the program is running.
15
The visualizer is constructed to be a foundation for further experimentation. The program is very modular, making it easy to add new components.
For information on how to run the program see Appendix II
5.2.1.1 Instruction Histogram
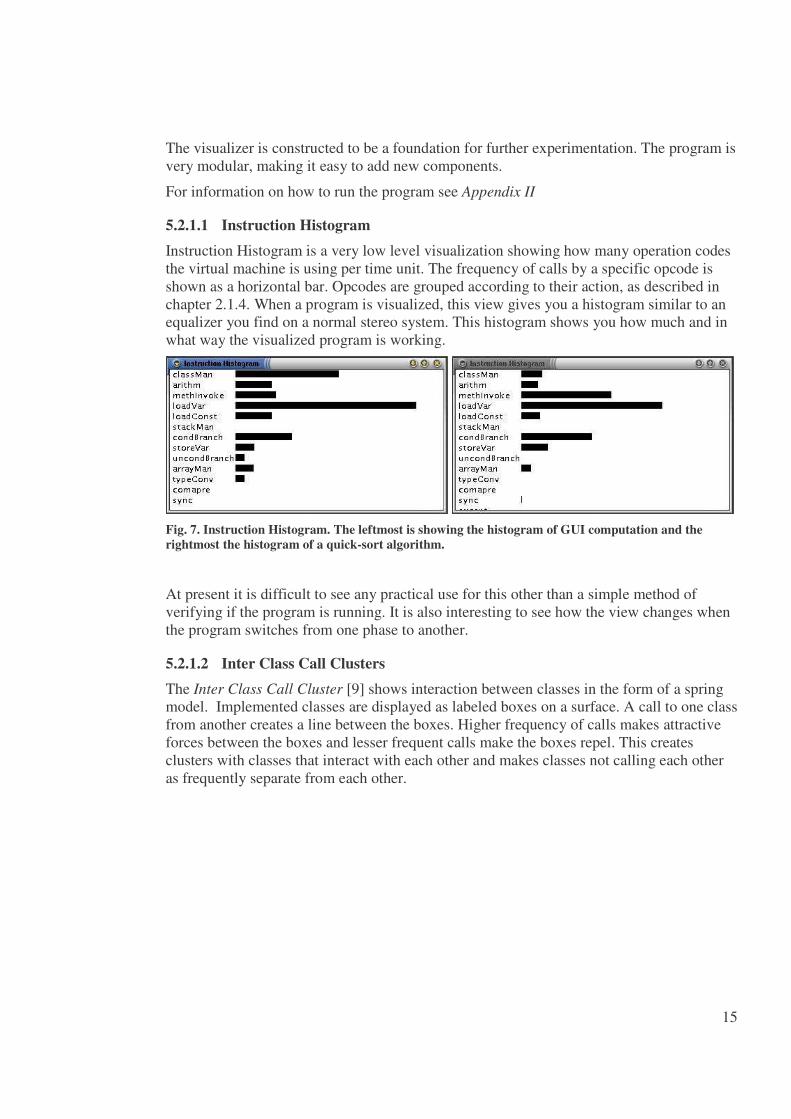
Instruction Histogram is a very low level visualization showing how many operation codes the virtual machine is using per time unit. The frequency of calls by a specific opcode is shown as a horizontal bar. Opcodes are grouped according to their action, as described in chapter 2.1.4. When a program is visualized, this view gives you a histogram similar to an equalizer you find on a normal stereo system. This histogram shows you how much and in what way the visualized program is working.
Fig. 7. Instruction Histogram. The leftmost is showing the histogram of GUI computation and the rightmost the histogram of a quick-sort algorithm.
At present it is difficult to see any practical use for this other than a simple method of verifying if the program is running. It is also interesting to see how the view changes when the program switches from one phase to another.
5.2.1.2 Inter Class Call Clusters
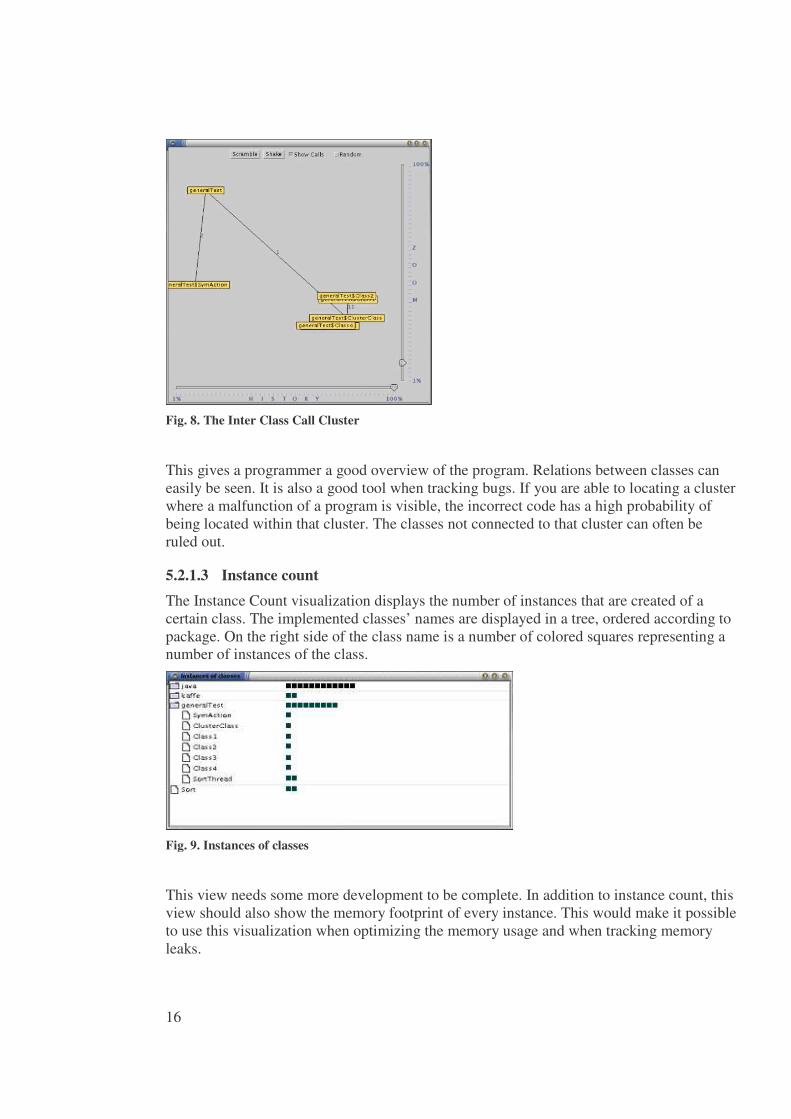
The Inter Class Call Cluster [9] shows interaction between classes in the form of a spring model. Implemented classes are displayed as labeled boxes on a surface. A call to one class from another creates a line between the boxes. Higher frequency of calls makes attractive forces between the boxes and lesser frequent calls make the boxes repel. This creates clusters with classes that interact with each other and makes classes not calling each other as frequently separate from each other.
16
Fig. 8. The Inter Class Call Cluster
This gives a programmer a good overview of the program. Relations between classes can easily be seen. It is also a good tool when tracking bugs. If you are able to locating a cluster where a malfunction of a program is visible, the incorrect code has a high probability of being located within that cluster. The classes not connected to that cluster can often be ruled out.
5.2.1.3 Instance count
The Instance Count visualization displays the number of instances that are created of a certain class. The implemented classes’ names are displayed in a tree, ordered according to package. On the right side of the class name is a number of colored squares representing a number of instances of the class.
Fig. 9. Instances of classes
This view needs some more development to be complete. In addition to instance count, this view should also show the memory footprint of every instance. This would make it possible to use this visualization when optimizing the memory usage and when tracking memory leaks.
17
5.2.1.4 Method Stack Depth
The Method Stack Depth [10] visualization lets you see the size of the method call stack at a specific moment. Every time a method is called in the visualized program, that method is pushed on a stack and every time a method is exited the method is popped from the stack.
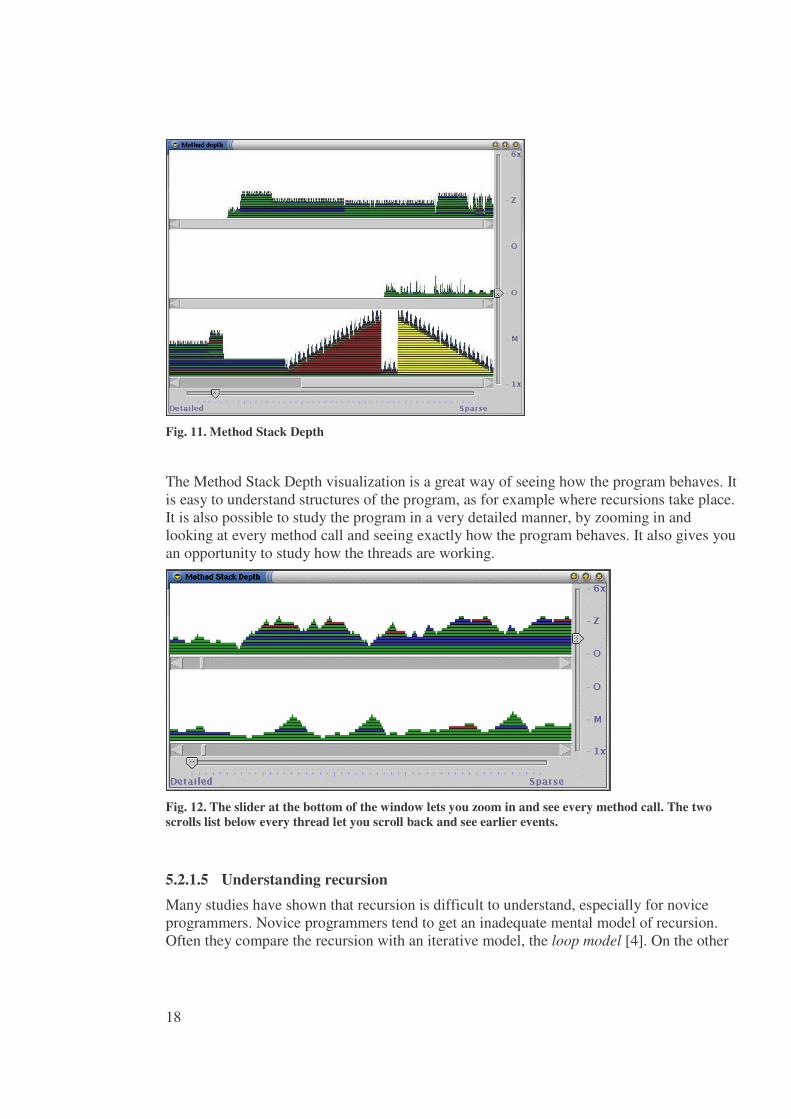
The size of the method call stack is visualized by a graph where the height of every column of pixels represents the size of the method call stack. Every method call in a column is separated by a black line. The horizontal axis represents time, where the latest event is to the right. Method calls are colored by one of three colors, representing how the method was called. If the method was called by another method in another class it is represented by a green color. If the method is called from another method in the same class it is colored blue. If the method is called by itself (pure recursion) it is colored red.
If a new thread is created the view is split horizontally and a new panel with a new graph is created. Every graph represents a different thread. This gives you an opportunity to study which thread is doing what and to compare the thread’s activity.
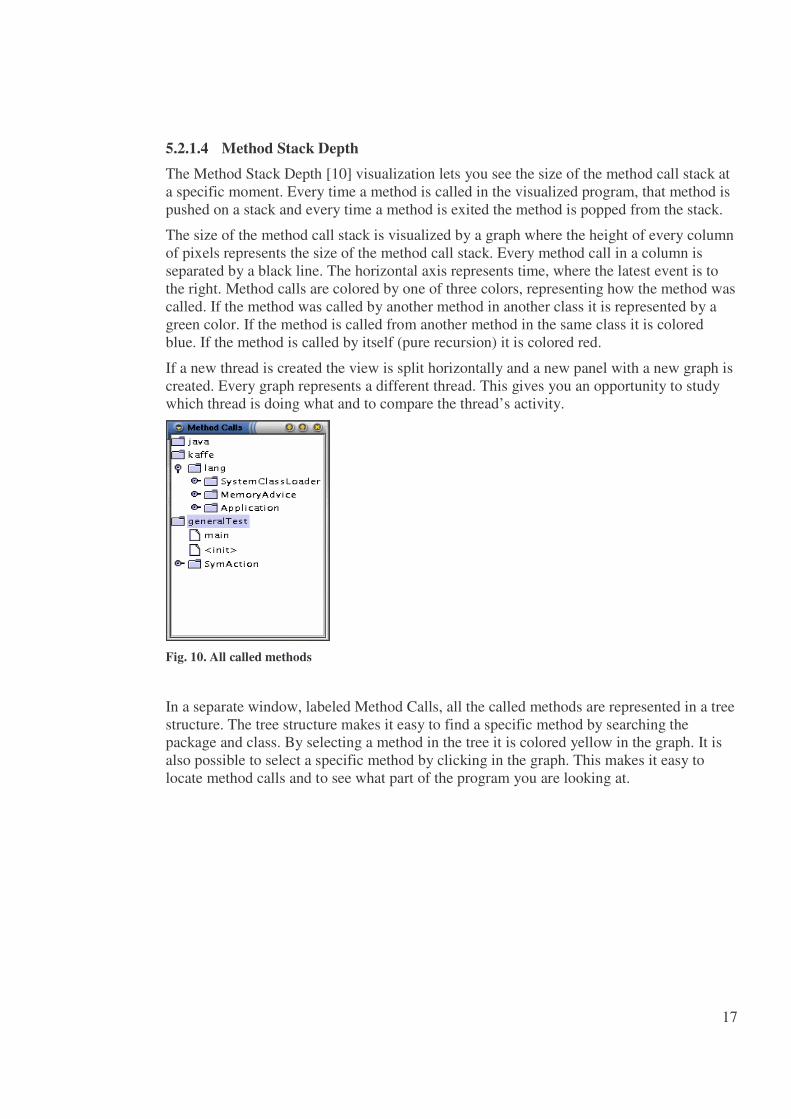
Fig. 10. All called methods
In a separate window, labeled Method Calls, all the called methods are represented in a tree structure. The tree structure makes it easy to find a specific method by searching the package and class. By selecting a method in the tree it is colored yellow in the graph. It is also possible to select a specific method by clicking in the graph. This makes it easy to locate method calls and to see what part of the program you are looking at.
18
Fig. 11. Method Stack Depth
The Method Stack Depth visualization is a great way of seeing how the program behaves. It is easy to understand structures of the program, as for example where recursions take place. It is also possible to study the program in a very detailed manner, by zooming in and looking at every method call and seeing exactly how the program behaves. It also gives you an opportunity to study how the threads are working.
Fig. 12. The slider at the bottom of the window lets you zoom in and see every method call. The two scrolls list below every thread let you scroll back and see earlier events.
5.2.1.5 Understanding recursion Many studies have shown that recursion is difficult to understand, especially for novice programmers. Novice programmers tend to get an inadequate mental model of recursion. Often they compare the recursion with an iterative model, the loop model [4]. On the other
19
hand, the more experienced programmers use the copies model, where they conceptualize unique invocations of subprograms.
The method stack depth visualization might make it easier for novice programmers to understand recursion. The visualization makes it easier for them to see the copies model. Similar to the Erosi tutor [5], the method call stack makes it easy to see how methods are called on top of each other. Studies on how the stack depth visualization might influence the ability to understand recursion have not been carried out in this thesis project. Further experimentation about this has to be done in the future to prove this.
5.2.2 The Control Interface The visualizers are controlled by a small interface. This provides the functionality to turn on or off the visualizers. Depending on how much computing power is available and the size of the screen, one or more visualizations can be displayed at a time. The control interface also has the functionality to pause the analyzed program, for study of the static status of the program at a specific moment, and to resume the execution. This function contradicts the long-term goal, where the analysis of the program should be done in real-time, but is a good function when analyzing Java programs.
6 Evaluation The evaluation of VaVoom consisted of a number of informal feedback sessions with programmers with different degrees of experience. A number of interesting issues arose in the course of these procedures, which will influence the future work.
The initial focus was on novice programmers, where the first group was students enrolled in introductory programming classes. The students ran assignment programs in VaVoom to analyze their programs. However, in general their programs were too small to effectively be analyzed by VaVoom. There are two reasons for this. The Virtual Machine creates noise, by unwanted information, as it runs and especially when it starts up. The algorithm created by the students often disappeared in the noise. Another problem is that VaVoom is created to visualize the dynamics of the analyzed program whereas novice programmers often struggle more with structural features than more complex dynamic behaviors. Although some positive result were received from these sessions (such as displaying recursion pattern with the method depth view), it seems that larger programs are more suitable for this system.
As a result, the second round of evaluation was performed using more advanced programs. These programs were analyzed by their developers:
20
• a chat client
• a mail server log file analyzer
• a interpreter for a Lisp-like language
• a parser for an XML-based Architectural Description Language [13]
• a client for managing web resources by using the WebDav protocol [14]
There are benefits and costs in using more complex programs. The benefits are that the more advanced programs have more complex behavior, making the dynamic visualizations more rewarding. On the other hand more complex programs need more computing power to be visualized. The modified JVM is also using much computing power to transmit the data to the visualizer and the visualizer uses much power to collect, store and modify the data. However, the program’s basic architecture provides a solution; the JVM is separable from the visualizers. This provides the possibility to run the JVM and the visualizers on two different machines. The benefit of this is not only the performance enhancements; it also simplifies the interaction with both the analyzed program and the visualizers. When using two computers, you also have access to two monitors and two sets of peripherals. You can control the visualizers independently from the analyzed program. When displaying the analyzed program and the visualizers on the same screen, the visualizers tend to cover the analyzed program. Not only is this a disadvantage to the interaction, the redrawing of the windows creates a lot of noise in the visualizers, making it harder to focus on the important information.
7 Results With the experimental set-up as above, performance was mostly not a problem and programmers could get significant insight into the behavior of their programs. For example dynamic behaviors (such as the recursive search through environments in the Lisp interpreter, or the switches between phases of XML schema parsing) become immediately visible, especially when they can be displayed as direct responses of interaction with the analyzed program.
The feedback from the evaluation was overall positive. All test subjects thought they would have use for a tool of this kind when developing Java programs, but some programs seem to be more suitable than others:
• Applications without a complex graphical user interface – produces less noise, e.g. uninteresting information.
• Programs with many classes or dynamic programs that create a lot of different instances – makes the Class Cluster view interesting.
• Programs with a lot of recursions – recursions can be shown clearly in the Method Depth view.
The visualizations that was most used by all test subjects was the Inter Class Call Cluster and the Method Stack Depth. The Method Stack Depth provided the best result for the
21
programs without a lot of GUI. The interesting information tended to disappear in the noise from the GUI calculations.
In the Inter Class Call Cluster the subjects could see relationships between classes and also how the clusters changed when the program switched phases.
The Instance Count did not give the subjects so much interesting feedback. Programs that are more memory intense might have more use for this view.
The Instruction Histogram view is not providing any concrete information other than showing the user if the program is running or not. However, it is still interesting to see how the view changes when the program switches from one phase to another.
The detailed results from this evaluation can be read about in Appendix III.
8 Conclusions The primary goal of this project was to offer a proof-of-concept for the long-term goal. The long-term focused on the use of dynamic visualization to let end users get an insight into system behavior. This project showed that meaningful information is possible extract from a running program and presented in an understandable way by using different visualization techniques. This concludes that further development toward end users is possible.
The short-term goal was to develop software for Java developers, showing the user information of what takes place inside their running program. The development of VaVoom was successful and the evolution provided meaningful feedback. Although the user study was too small to actually draw any scientific conclusions about VaVoom and the test group was too narrow to conclude anything for certain about how this program works for other groups of people, the initial exploration is regarded successful. VaVoom has a potential to be a great way for programmers to understand their code. There is design features that have emerged that is important to explore further.
One of these features is the multiple linked representations. The user can look at different views of an event from different directions at the same time and therefore “triangulate” the behavior. Another is the direct coupling of visualization and execution where every interaction with the analyzed program directly effects the visualization. This is especially important for the long-term goal, where users should get direct feedback of there actions.
The study also shows that some programs are more suitable for visualizing than others. Dynamic visualization is more suitable for visualizing big dynamic programs rather than small programs with only a couple of algorithms. The performance issue makes programs with a lot of GUI difficult to run.
9 Recommendations VaVoom is created to be an experimental platform where it is possible to test a range of visual tools. In the future the project is aiming more on the end users. One application where it is interesting to get insight into the computation is web search engines, where both performance, database coverage and query reformulation are largely hidden from the end user. Another field to study is network behavior. This is a domain where information is relevant to the end users.
22
The study has shown that the most important function to be added to the program is a filtering mechanism. A lot of the vital information is lost in noise. A lot of noise is created from Java classes such as Swing. A function to filter out whole packages in all the visualizers would solve a big part of this problem.
The performance of the program is also a big issue and needs to be enhanced. It is possible to increase the performance of the communication between the JVM and the Visualizer by refining the communication protocol. By doing this the amount of data transmitted is decreased.
For more short-term improvements to VaVoom look at the ToDo list in Appendix I.
10 References [1] W. De Pauw, D. Kimelman, J. Vlissides, “Visualizing Object-Oriented Software
Execution” in J. Stasko, J. Domingue, M.Brown, and B. Price (eds), Software Visualization, Cambridge, MA: MIT Press, 1997
[2] J. Stasko, “TANGO: A Framework and System for Algorithm Animation”, IEEE Computer, 29(9), 27-39, Sept. 1990.
[3] S. Eick, J Steffen, E. Summer Jr., “Seesoft: A Tool For Visualizing Line Oriented Software Statistics”, IEEE Trans. Software Engineering, pp. 957-68, 1992.
[4] H. Kahney, “What Do Novice Programmers Know About Recursion?”, Proceedings of the CHI '83 Conference on Human Factors in Computer Systems, 235-239. Boston, MA
[5] C. E. George, “Experiences with Novices: The Importance of Graphical Representations in Supporting Mental Models”, PPIG 2000, Cozenza Italy
[6] The Java Virtual Machine, http://java.sun.com (2003-03-27) [7] Kaffe Virtual Machine, http://www.kaffe.org (2003-03-27) [8] T. Lindholm, F. Yellin, The Java Virtual Machine Specification, ISBN:0-201-63452-
x, Addison-Wesley , 1996 [9] W. De Pauw, D. Kimelman, J. Vlissides, “Modeling Object-Oriented Program
Execution”, ECOOP 1994 [10] M. Rennieris, S. P. Reiss, “Almost: Exploring Program Traces”, NPIVM' 99
Workshop, Kansas City [11] Unified Modeling Language, http://www.uml.org (2003-03-27) [12] Borland Optimizeit Suite, http://www.borland.com/optimizeit/ (2003-03-27) [13] Eric M. Dashofy, André van der Hoek, Richard N. Taylor, A Highly-Extensible, XML-
Based Architecture Description Language, IEEE/IFIP Conference on Software Architecture, Amsterdam, The Netherlands, August 2001
[14] Web-based Distributed Authoring and Versioning, www.webdav.org (2003-03-27) [15] B. A. Myers. “A Brief History of Human Computer Interaction Technology.” ACM
interactions. Vol. 5, no. 2, March, 1998. pp. 44-54.
23
11 Appendix I: System description
11.1 Kaffe Only small adjustments have been made to the Kaffe source code. The main features added to fit VaVoom are in the main.c file and in the vvm.c file. In the main.c file the connection to the network socket is made, using the host name and port defined in the vvm.h file. In the vvm.c file there is a method called vvm_send. This is the method used to transmit information of activities in the virtual machine over the network socket. This method is called from different files in Kaffe where events take place. See the description of files below.
11.2 Visualizers All visualizers inherit the VisClass class, which defines how the visualizer is added and how information is collected. When the Visualizers program starts up, every visualizer is added to a list. The name, returned by the getName method, of every visualizer is then added to the menu in the control interface. The program then waits for a network connection to the Virtual Machine. When the connection is established, all visualizer's init method is called. Some visualizers need to start timers at this point. Soon the Virtual Machine starts sending data about events. In the communication protocol, the first string is a command, specifying what visualizers should listen to this particular information. This is so the multiplexor can send information to the right visualizer. Every visualizer needs to specify what information it wants to collect in the getSubs method. The multiplexor then sends the argument list of the commands by calling the putArgVector in the specific visualizers.
24
VisClass
Histogram Invoke Instances ClassCluster
OpCode
1
0..*
Calls
1
0..*
Visualisation
1
0..*
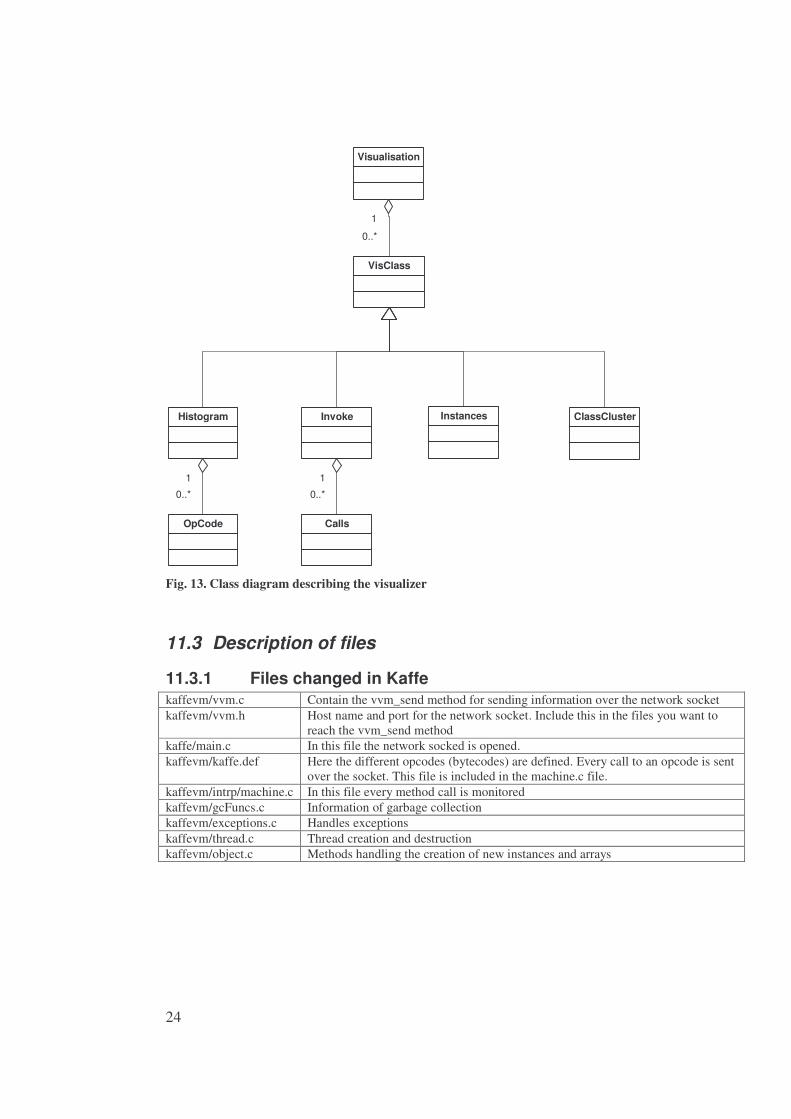
Fig. 13. Class diagram describing the visualizer
11.3 Description of files
11.3.1 Files changed in Kaffe kaffevm/vvm.c Contain the vvm_send method for sending information over the network socket kaffevm/vvm.h Host name and port for the network socket. Include this in the files you want to
reach the vvm_send method kaffe/main.c In this file the network socked is opened. kaffevm/kaffe.def Here the different opcodes (bytecodes) are defined. Every call to an opcode is sent
over the socket. This file is included in the machine.c file. kaffevm/intrp/machine.c In this file every method call is monitored kaffevm/gcFuncs.c Information of garbage collection kaffevm/exceptions.c Handles exceptions kaffevm/thread.c Thread creation and destruction kaffevm/object.c Methods handling the creation of new instances and arrays
25
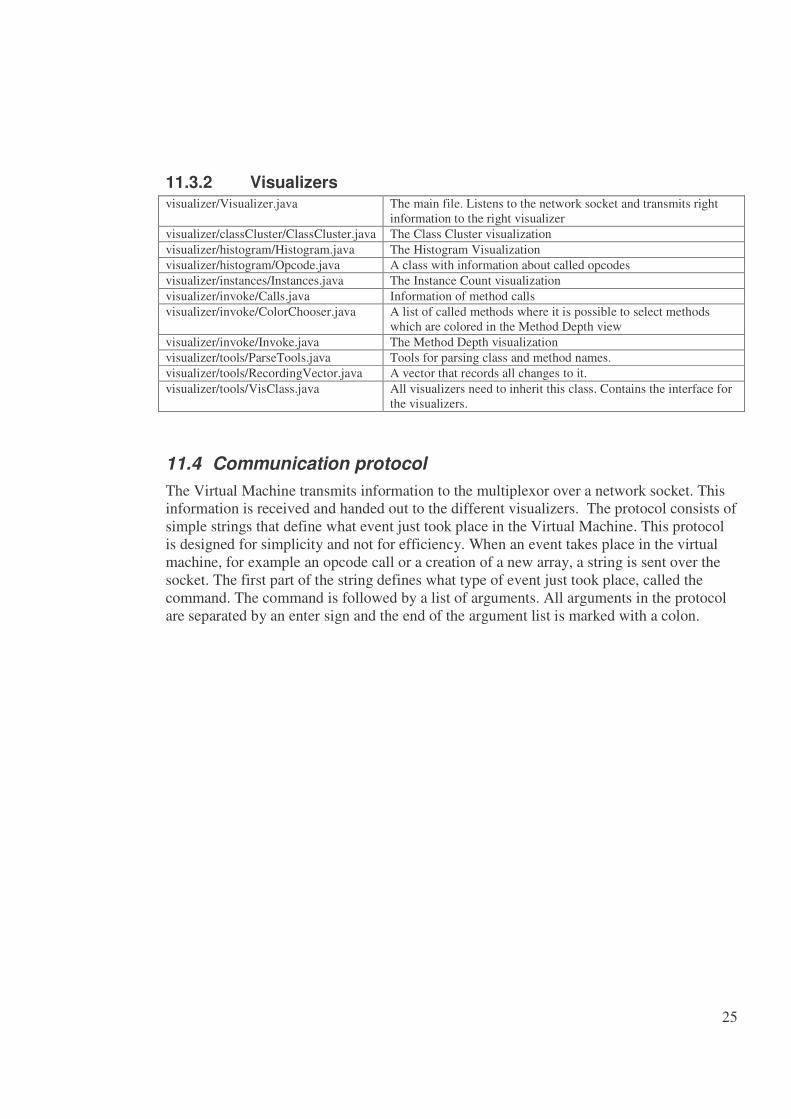
11.3.2 Visualizers visualizer/Visualizer.java The main file. Listens to the network socket and transmits right
information to the right visualizer visualizer/classCluster/ClassCluster.java The Class Cluster visualization visualizer/histogram/Histogram.java The Histogram Visualization visualizer/histogram/Opcode.java A class with information about called opcodes visualizer/instances/Instances.java The Instance Count visualization visualizer/invoke/Calls.java Information of method calls visualizer/invoke/ColorChooser.java A list of called methods where it is possible to select methods
which are colored in the Method Depth view visualizer/invoke/Invoke.java The Method Depth visualization visualizer/tools/ParseTools.java Tools for parsing class and method names. visualizer/tools/RecordingVector.java A vector that records all changes to it. visualizer/tools/VisClass.java All visualizers need to inherit this class. Contains the interface for
the visualizers.
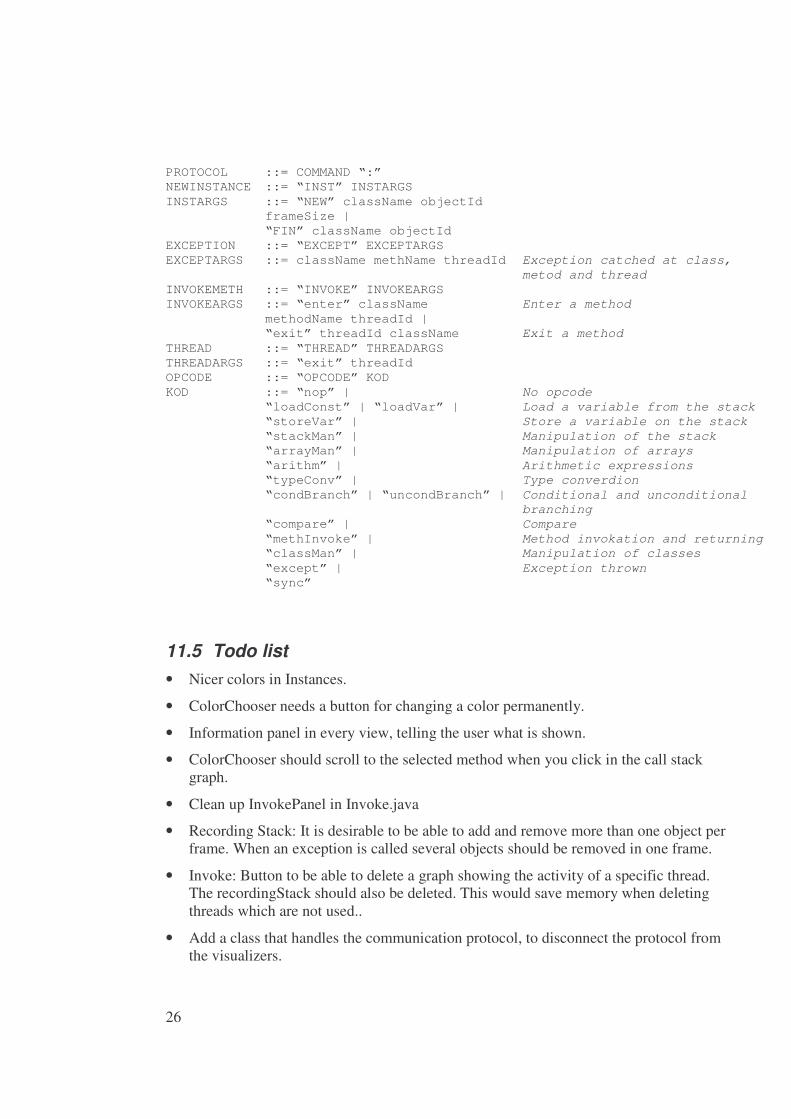
11.4 Communication protocol The Virtual Machine transmits information to the multiplexor over a network socket. This information is received and handed out to the different visualizers. The protocol consists of simple strings that define what event just took place in the Virtual Machine. This protocol is designed for simplicity and not for efficiency. When an event takes place in the virtual machine, for example an opcode call or a creation of a new array, a string is sent over the socket. The first part of the string defines what type of event just took place, called the command. The command is followed by a list of arguments. All arguments in the protocol are separated by an enter sign and the end of the argument list is marked with a colon.
26
PROTOCOL ::= COMMAND “:” NEWINSTANCE ::= “INST” INSTARGS INSTARGS ::= “NEW” className objectId
frameSize |
“FIN” className objectId EXCEPTION ::= “EXCEPT” EXCEPTARGS EXCEPTARGS ::= className methName threadId Exception catched at class,
metod and thread INVOKEMETH ::= “INVOKE” INVOKEARGS INVOKEARGS ::= “enter” className
methodName threadId | Enter a method
“exit” threadId className Exit a method THREAD ::= “THREAD” THREADARGS THREADARGS ::= “exit” threadId OPCODE ::= “OPCODE” KOD KOD ::= “nop” | No opcode “loadConst” | “loadVar” | Load a variable from the stack “storeVar” | Store a variable on the stack “stackMan” | Manipulation of the stack “arrayMan” | Manipulation of arrays “arithm” | Arithmetic expressions “typeConv” | Type converdion “condBranch” | “uncondBranch” | Conditional and unconditional
branching “compare” | Compare “methInvoke” | Method invokation and returning “classMan” | Manipulation of classes “except” | Exception thrown “sync”
11.5 Todo list • Nicer colors in Instances.
• ColorChooser needs a button for changing a color permanently.
• Information panel in every view, telling the user what is shown.
• ColorChooser should scroll to the selected method when you click in the call stack graph.
• Clean up InvokePanel in Invoke.java
• Recording Stack: It is desirable to be able to add and remove more than one object per frame. When an exception is called several objects should be removed in one frame.
• Invoke: Button to be able to delete a graph showing the activity of a specific thread. The recordingStack should also be deleted. This would save memory when deleting threads which are not used..
• Add a class that handles the communication protocol, to disconnect the protocol from the visualizers.
27
12 Appendix II: User’s Guide VaVoom works just like a Java Virtual Machine (JVM), but at the same time as it runs a Java program, it also visualizes what is happening inside the JVM. It visualizes data such as class and object creation, method calls and operation calls.
12.1 Installing and running
Linux (recommended) To install this program edit the VAVOOM PATH variable in the install file and the VaVoom file. Run the install script and keep your fingers crossed. To run VaVoom, just run the VaVoom script file from the directory of your Java files. Example:
If you want to visualize the generalTest program in the
$VAVOOM/javaExamples/generalTest/ directory:
cd javaExamples/generalTest
../../vavoom generalTest
If you want to run a JAR file, use the -jar option.
../../vavoom -jar IAmAJarFile.jar
Windows Install the Cygwin UNIX environment for Windows. www.cygwin.com Do as in the Linux installation, but use the installWin script instead of install. Under windows threads are not handled correctly. When a new thread is created, it doesn’t start until the first one ends.
12.2 What works All Java programs that run in the Kaffe Virtual Machine will also run in VaVoom. VaVoom is built on top of the KVM and has only made minor changes to it. Programs using AWT and Swing do work, but no fancy new stuff like drag and drop.
13 Appendix III: User Study
13.1 Test description
Personal data The test subjects were all computer scientists, three Graduate students, one undergraduate student and one professor. They were all experts in computer and Java programming.
28
The programs Three of the programs were described by their developers as small programs and two as medium size programs. Four of the programs were developed by a single person and one by a group of people. The tested programs were all without any particular bug.
Running the analyzer Four of the programs worked well in VaVoom. One of the programs had a lot of GUI making the performance loss from the visualizer too great to get any results. All subjects thought the Inter Class Call Cluster and the Method Stack Depth were the most usable visualizations. Some comments on the usability of the program were that the scrolling did not stop when clicking in a view in Method Depth and difficulties in finding the selected method in Color Chooser.
The Instruction Histogram This visualization did not lead to any concrete results, other than using the visualization to see if the analyzed program actually was running or not. Some test subjects saw differences in the behavior of the histogram when their program went from one phase to another.
Method depth The subject used this view to see every method call indetail. However, in most of the programs too much noise was created from the GUI to actually see anything useful. One of the programs did not have any GUI and for this program it was much easier to get good results. One thing all test subjects found useful was to look at the threads. They could see how many threads were running and how much they were working in relationship to each other.
Inter Class Call Cluster This visualization was one many subjects found interesting. They could see relations between classes and also how the clusters changed when the program switched phases.
Instance count In this view the subjects could se all of the instances their program created. However, the types of programs they created were not suitable for looking at instances. None of the subjects did get any interesting information from this view, since their programs did not create many instances. Memory intense program or memory sensitive programs might be programs that would benefit more from this visualization.
29
Suitable programs These program types were the best for analyzing according to the test subjects:
• Applications without a lot of GUI – produces less noise, e.g. uninteresting information.
• Programs with a lot of classes or dynamic programs that create a lot of different instances – makes the Class Cluster view interesting.
• Programs with a lot of recursions – recursions shows clearly in the Method Depth view.
Improvements to the GUI These are comments the test subjects made on the GUI of VaVoom:
• When clicking in the Method Depth view, the selected class should also highlight in the Inter Class Call Cluster.
• The color chooser tree should jump to the method you clicked on in method depth.
• Remove a certain thread to improve performance and get less noise.
• Tool tip in the Method Depth view would make it easier to see method names faster.
• Implement a filtering mechanism to lower the amount of noise.
• Method depth should scroll to the method you clicked on in Color Chooser.
• Implement a better scrolling and detail changing mechanism in the Method Depth graph.
• You should be able to walk around in the Method Depth graph with the arrow on the keyboard.
• The method coloring should have a function to coloring whole packages.
Some requested improvements contradict the long-term goal of the project:
• It should be possible to jump to the code from the visualizers.
• Implement a save and playback function to study events after they took place.
General opinion Four out of five test subjects thought they would have use for VaVoom while building their program. Everyone would like to use the program when developing new programs in the future.