THE VARIATION OF MARATHON PERFORMANCES WITH AGE AND SEX
59
THE VARIATION OF MARATHON PERFORMANCES WITH AGE AND SEX Richard L Smith University of North Carolina and SAMSI with input from: Scott Powers (Stanford) Jessi Cisewski (Carnegie Mellon) Jack Fleming and Michael Pieroni (BAA) 1
Transcript of THE VARIATION OF MARATHON PERFORMANCES WITH AGE AND SEX

THE VARIATION OF MARATHON PERFORMANCES WITH AGE AND SEX
Richard L Smith
University of North Carolina and SAMSI
with input from:
Scott Powers (Stanford)
Jessi Cisewski (Carnegie Mellon)
Jack Fleming and Michael Pieroni (BAA)
1
PART I: Our work on qualifying times for the Boston Marathon (Smith, Powers, Cisewski, Chance, to appear)
PART II: A new “longitudinal” approach to age-related performances (work in progress)
2
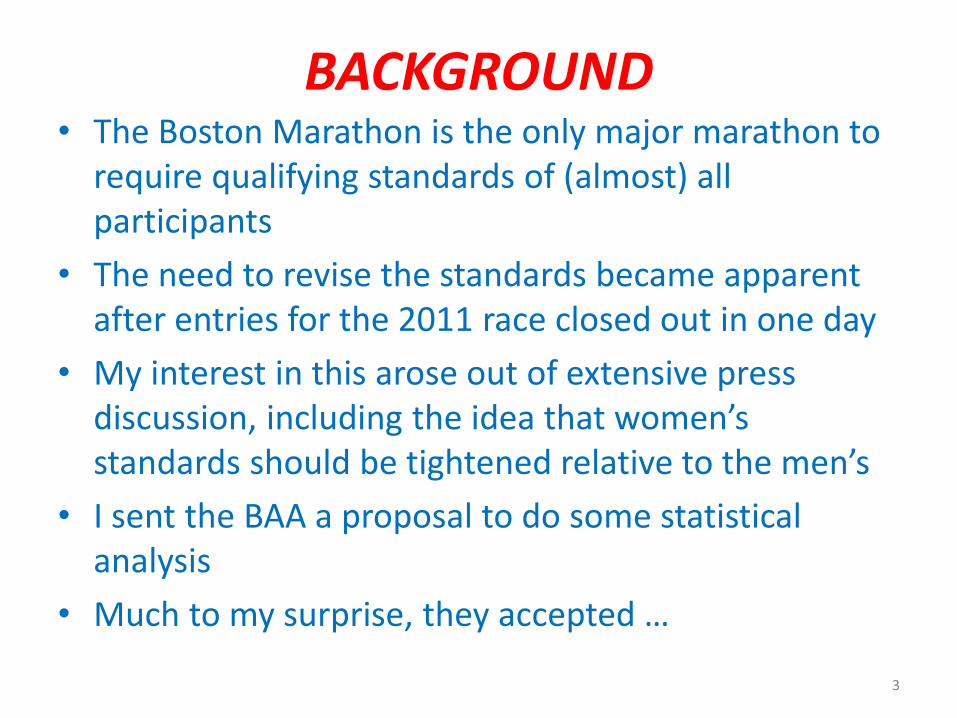
BACKGROUND • The Boston Marathon is the only major marathon to
require qualifying standards of (almost) all participants
• The need to revise the standards became apparent after entries for the 2011 race closed out in one day
• My interest in this arose out of extensive press discussion, including the idea that women’s standards should be tightened relative to the men’s
• I sent the BAA a proposal to do some statistical analysis
• Much to my surprise, they accepted …
3

4
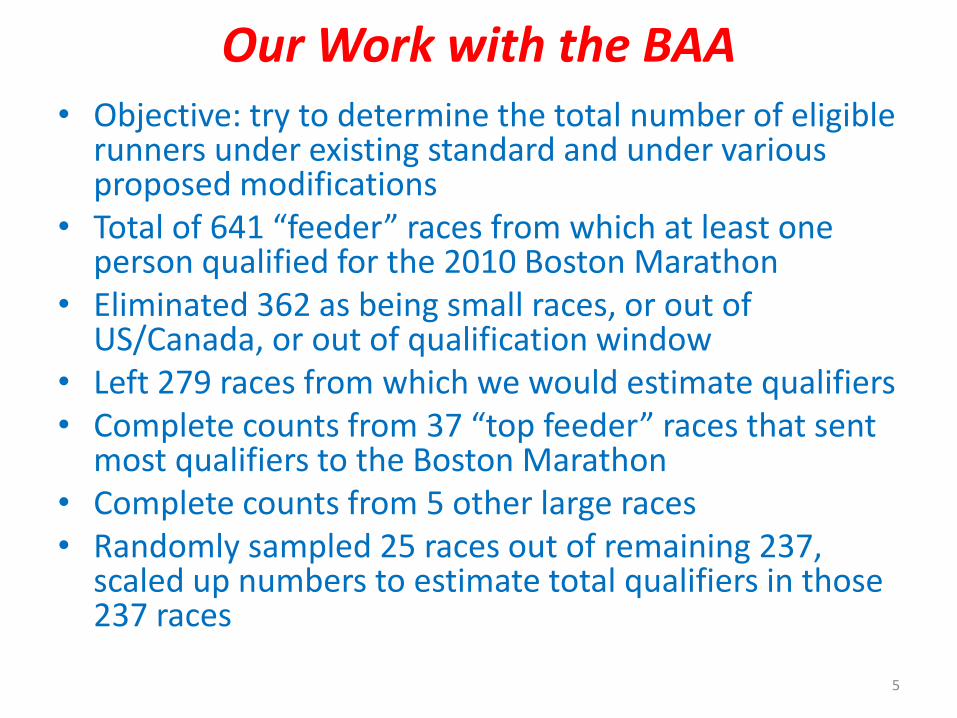
Our Work with the BAA • Objective: try to determine the total number of eligible
runners under existing standard and under various proposed modifications
• Total of 641 “feeder” races from which at least one person qualified for the 2010 Boston Marathon
• Eliminated 362 as being small races, or out of US/Canada, or out of qualification window
• Left 279 races from which we would estimate qualifiers • Complete counts from 37 “top feeder” races that sent
most qualifiers to the Boston Marathon • Complete counts from 5 other large races • Randomly sampled 25 races out of remaining 237,
scaled up numbers to estimate total qualifiers in those 237 races
5
6
7
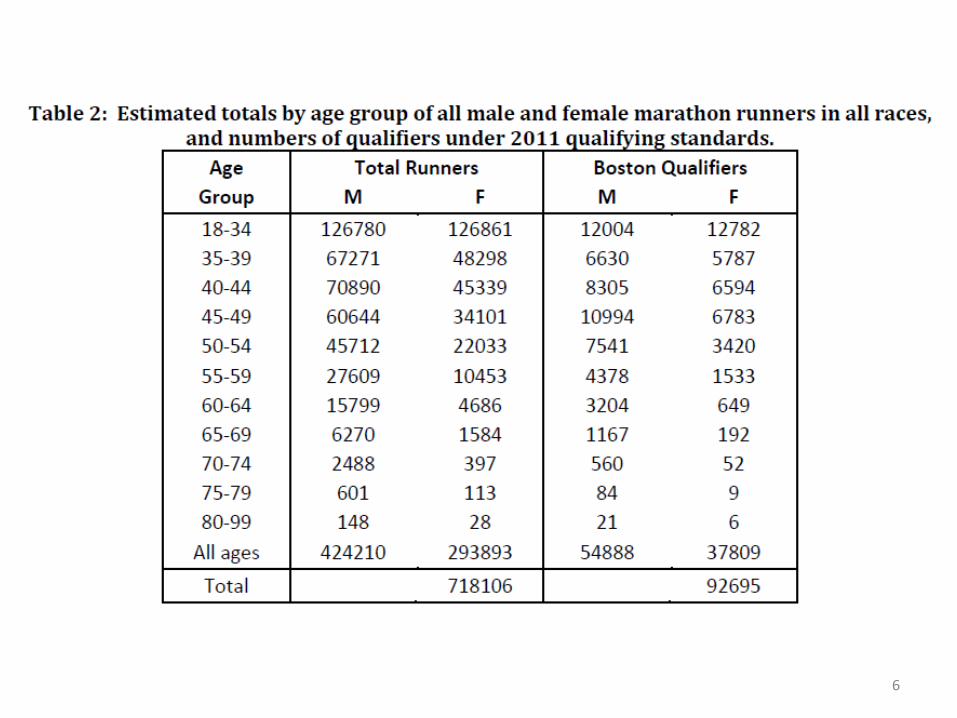
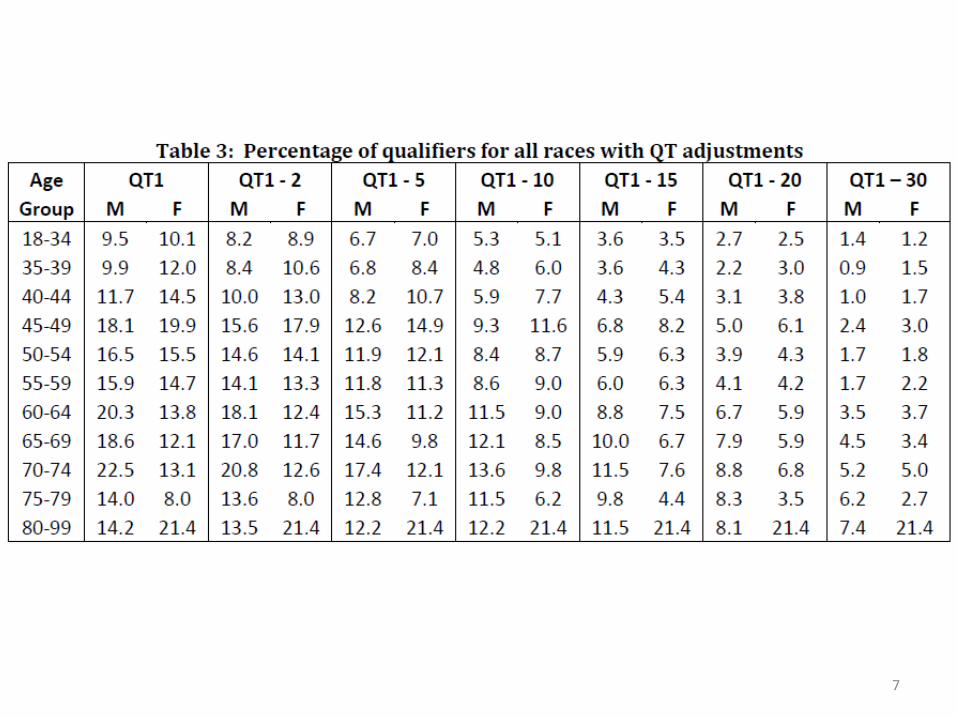
Conclusions from this exercise
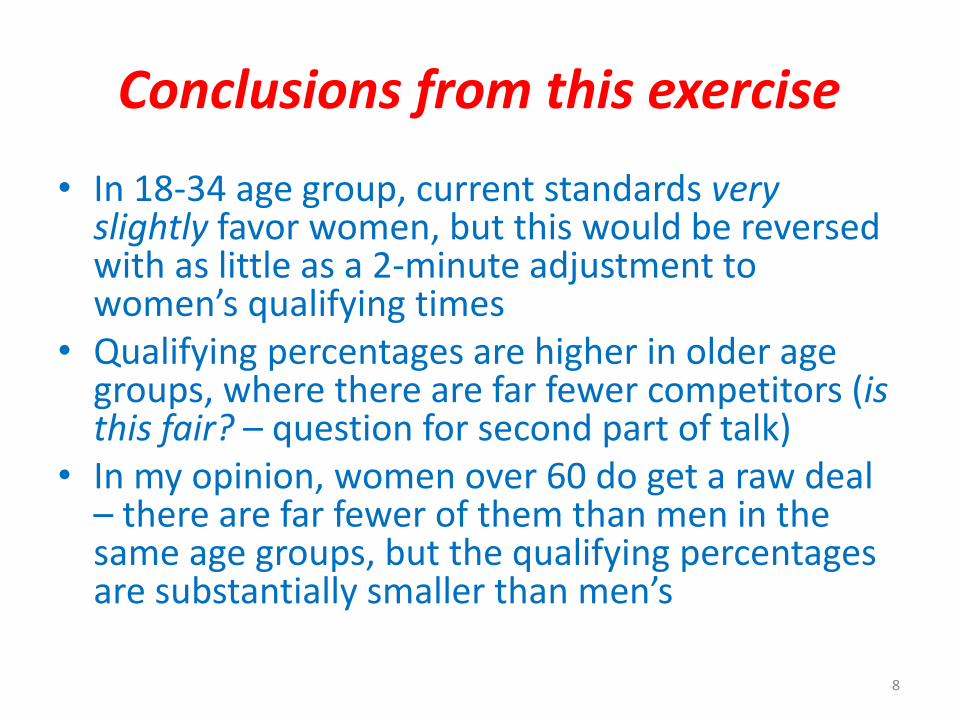
• In 18-34 age group, current standards very slightly favor women, but this would be reversed with as little as a 2-minute adjustment to women’s qualifying times
• Qualifying percentages are higher in older age groups, where there are far fewer competitors (is this fair? – question for second part of talk)
• In my opinion, women over 60 do get a raw deal – there are far fewer of them than men in the same age groups, but the qualifying percentages are substantially smaller than men’s 8
Decision by the BAA
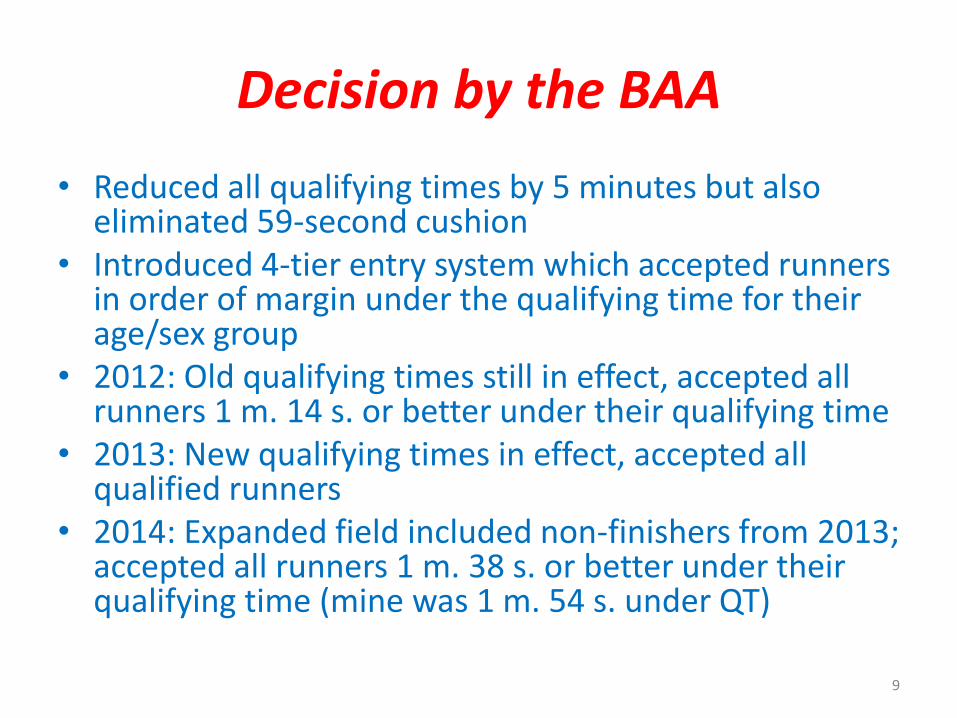
• Reduced all qualifying times by 5 minutes but also eliminated 59-second cushion
• Introduced 4-tier entry system which accepted runners in order of margin under the qualifying time for their age/sex group
• 2012: Old qualifying times still in effect, accepted all runners 1 m. 14 s. or better under their qualifying time
• 2013: New qualifying times in effect, accepted all qualified runners
• 2014: Expanded field included non-finishers from 2013; accepted all runners 1 m. 38 s. or better under their qualifying time (mine was 1 m. 54 s. under QT) 9

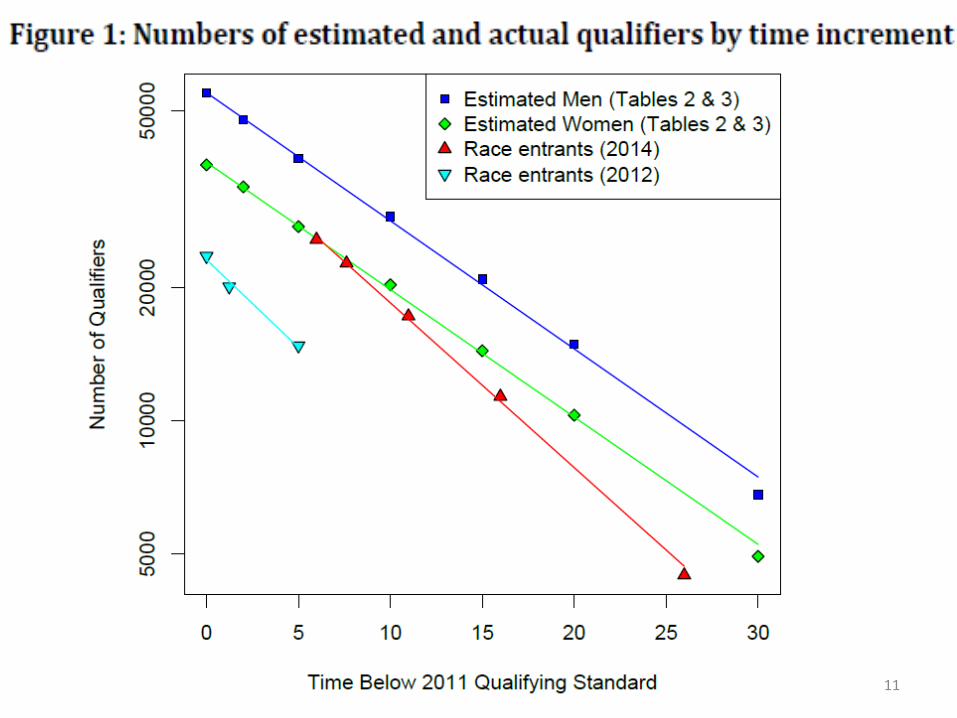
How well did our projections hold up?
10
11
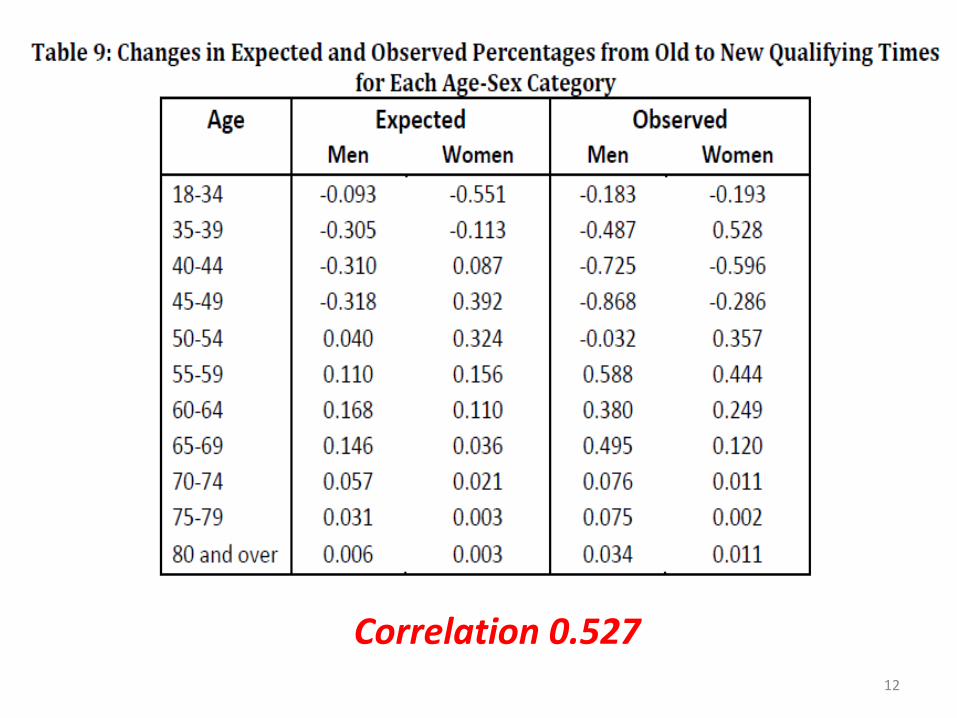
Correlation 0.527 12
Is This Correlation Statistically Significant?
13
Is This Correlation Statistically Significant? Run a bootstrap …
14
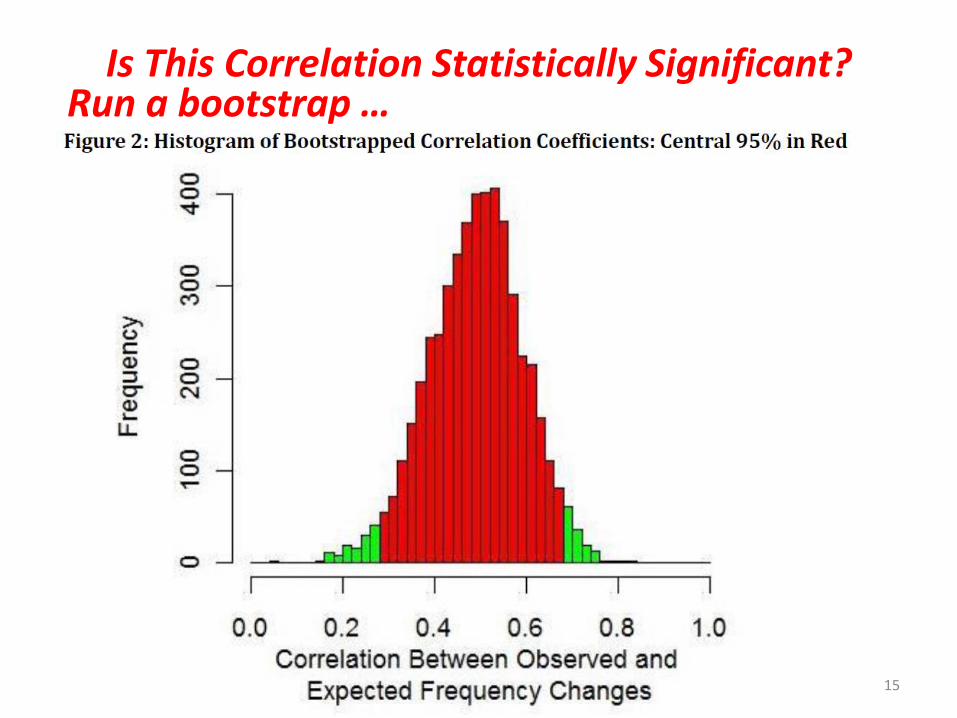
Is This Correlation Statistically Significant? Run a bootstrap …
15
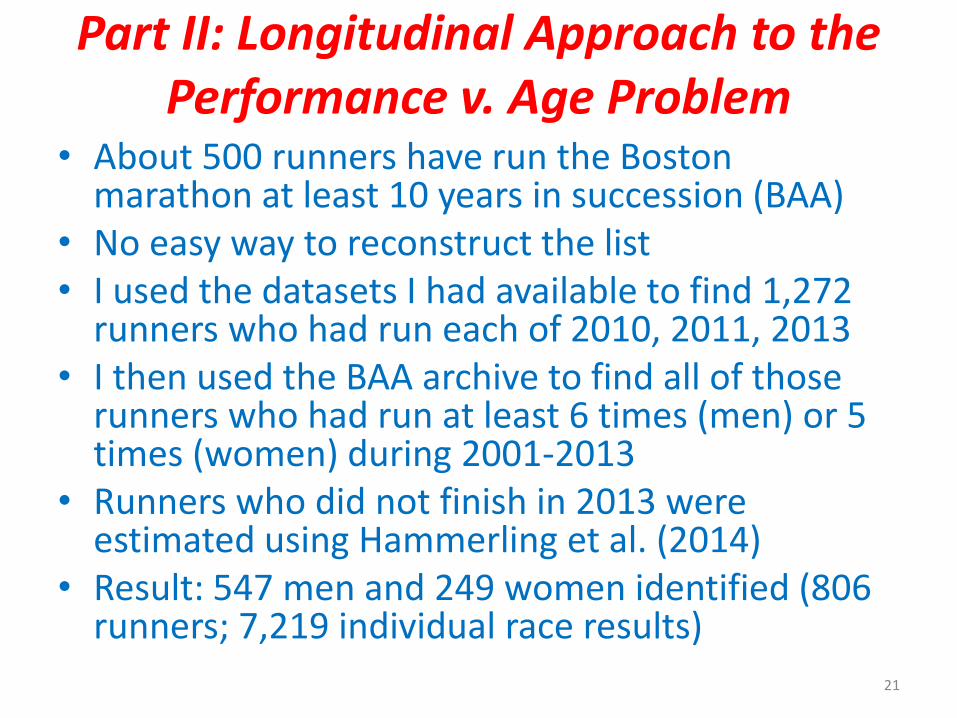
Part II: Longitudinal Approach to the Performance v. Age Problem
• About 500 runners have run the Boston marathon at least 10 years in succession (BAA)
• No easy way to reconstruct the list • I used the datasets I had available to find 1,272
runners who had run each of 2010, 2011, 2013 • I then used the BAA archive to find all of those
runners who had run at least 6 times (men) or 5 times (women) during 2001-2013
• Runners who did not finish in 2013 were estimated using Hammerling et al. (2014)
• Result: 547 men and 249 women identified (806 runners; 7,219 individual race results)
16
Part II: Longitudinal Approach to the Performance v. Age Problem
• About 500 runners have run the Boston marathon at least 10 years in succession (BAA)
• No easy way to reconstruct the list • I used the datasets I had available to find 1,272
runners who had run each of 2010, 2011, 2013 • I then used the BAA archive to find all of those
runners who had run at least 6 times (men) or 5 times (women) during 2001-2013
• Runners who did not finish in 2013 were estimated using Hammerling et al. (2014)
• Result: 547 men and 249 women identified (806 runners; 7,219 individual race results)
17
Part II: Longitudinal Approach to the Performance v. Age Problem
• About 500 runners have run the Boston marathon at least 10 years in succession (BAA)
• No easy way to reconstruct the list • I used the datasets I had available to find 1,272
runners who had run each of 2010, 2011, 2013 • I then used the BAA archive to find all of those
runners who had run at least 6 times (men) or 5 times (women) during 2001-2013
• Runners who did not finish in 2013 were estimated using Hammerling et al. (2014)
• Result: 547 men and 249 women identified (806 runners; 7,219 individual race results)
18
Part II: Longitudinal Approach to the Performance v. Age Problem
• About 500 runners have run the Boston marathon at least 10 years in succession (BAA)
• No easy way to reconstruct the list • I used the datasets I had available to find 1,272
runners who had run each of 2010, 2011, 2013 • I then used the BAA archive to find all of those
runners who had run at least 6 times (men) or 5 times (women) during 2001-2013
• Runners who did not finish in 2013 were estimated using Hammerling et al. (2014)
• Result: 547 men and 249 women identified (806 runners; 7,219 individual race results)
19
Part II: Longitudinal Approach to the Performance v. Age Problem
• About 500 runners have run the Boston marathon at least 10 years in succession (BAA)
• No easy way to reconstruct the list • I used the datasets I had available to find 1,272
runners who had run each of 2010, 2011, 2013 • I then used the BAA archive to find all of those
runners who had run at least 6 times (men) or 5 times (women) during 2001-2013
• Runners who did not finish in 2013 were estimated using Hammerling et al. (2014)
• Result: 547 men and 249 women identified (806 runners; 7,219 individual race results
20
Part II: Longitudinal Approach to the Performance v. Age Problem
• About 500 runners have run the Boston marathon at least 10 years in succession (BAA)
• No easy way to reconstruct the list • I used the datasets I had available to find 1,272
runners who had run each of 2010, 2011, 2013 • I then used the BAA archive to find all of those
runners who had run at least 6 times (men) or 5 times (women) during 2001-2013
• Runners who did not finish in 2013 were estimated using Hammerling et al. (2014)
• Result: 547 men and 249 women identified (806 runners; 7,219 individual race results)
21
22
23
24
25
26
27
28
29
30
31

32
33
34
35
36
37
38
39
40
41
42
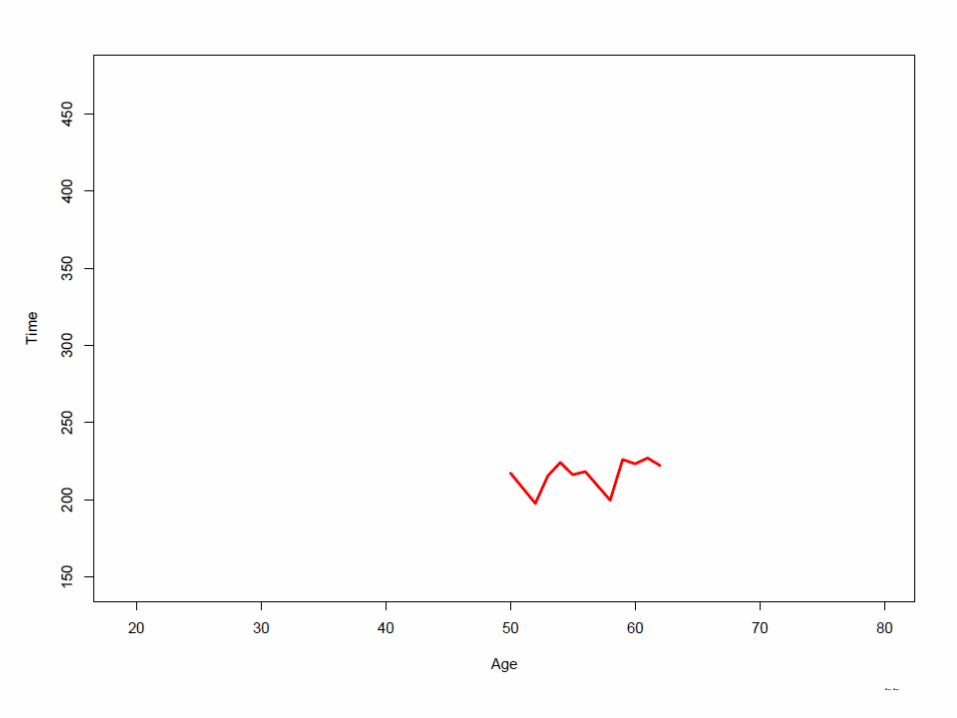
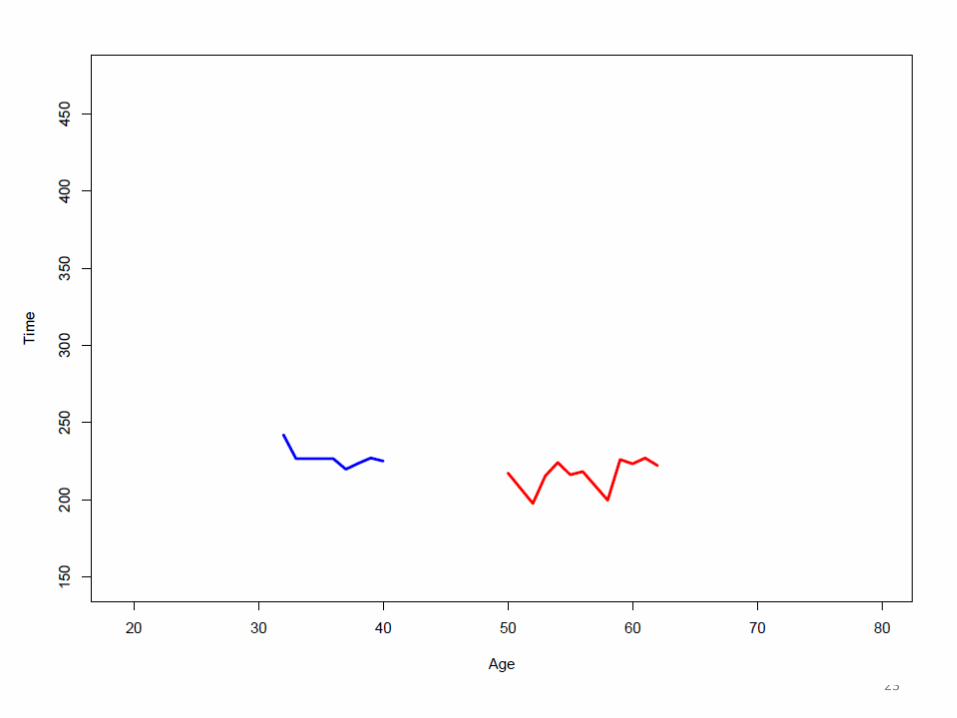
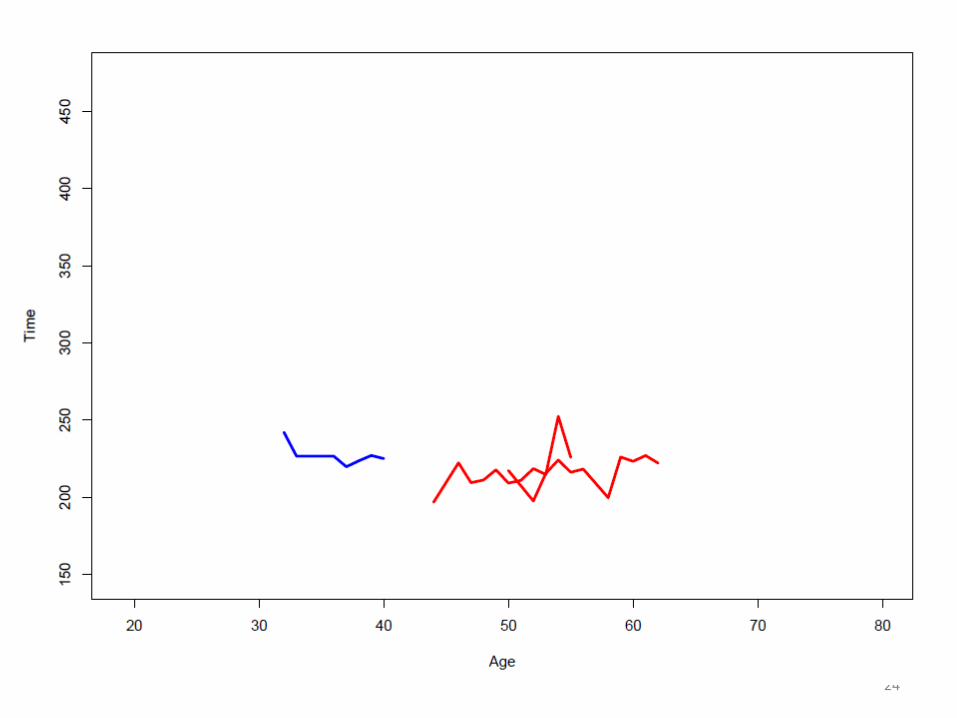
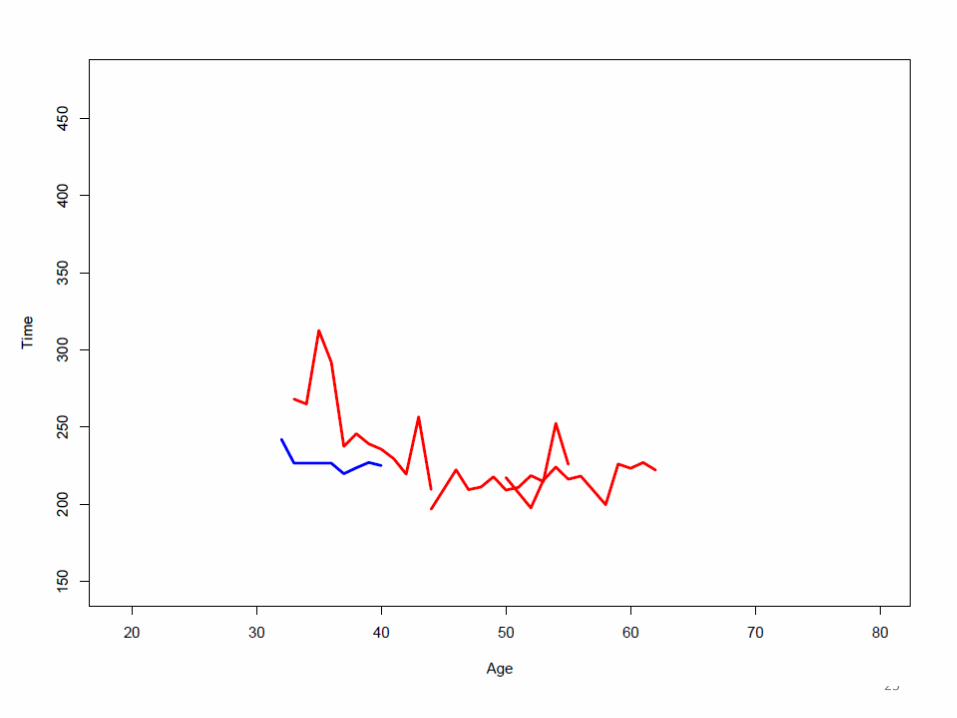
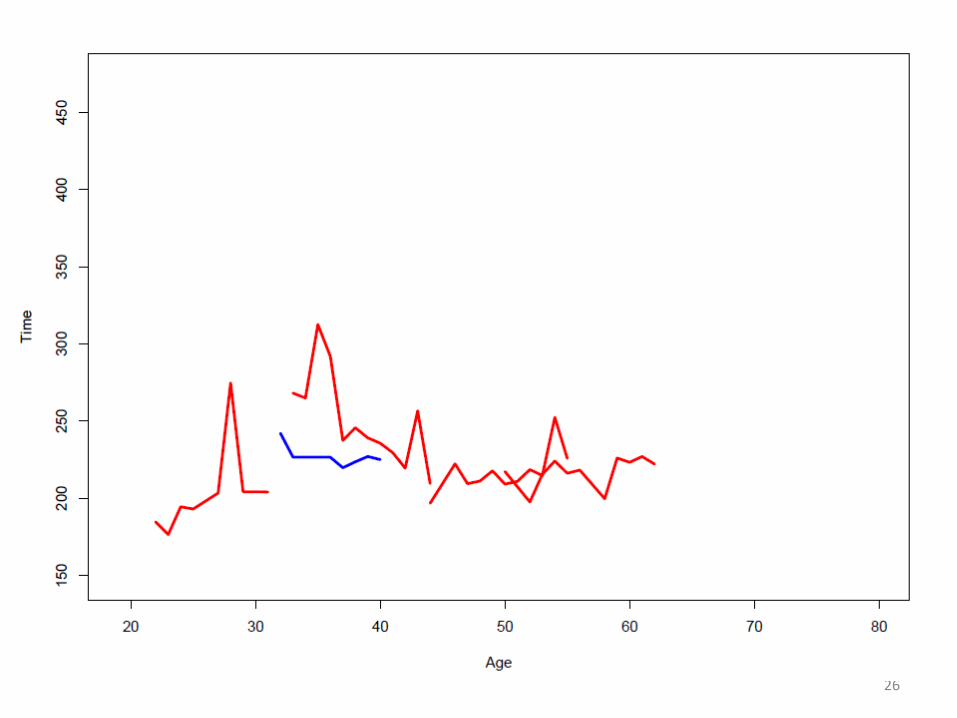
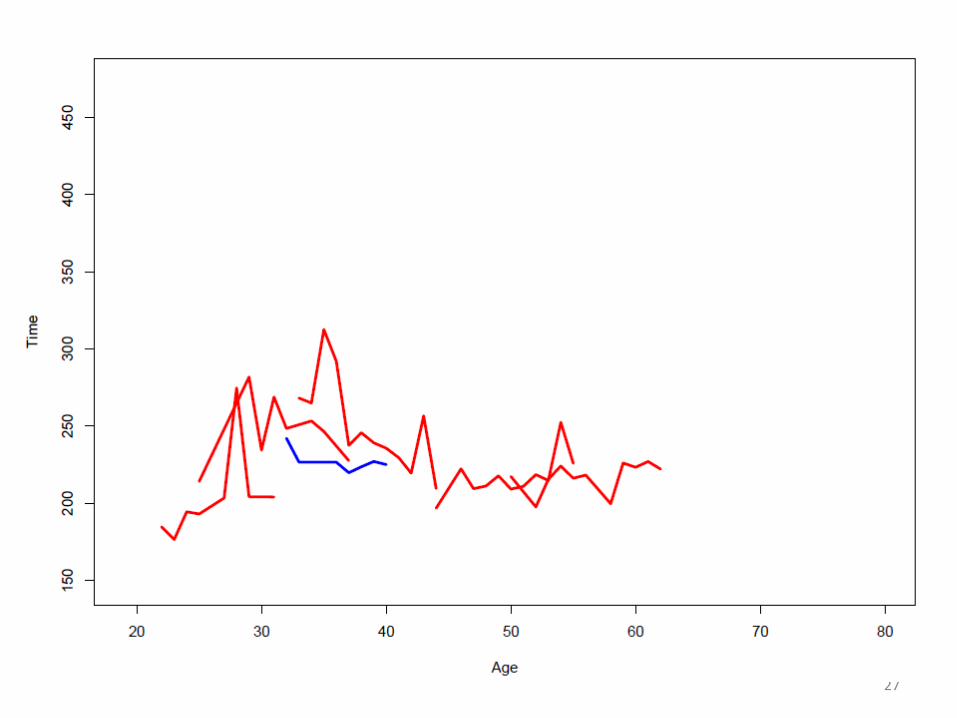
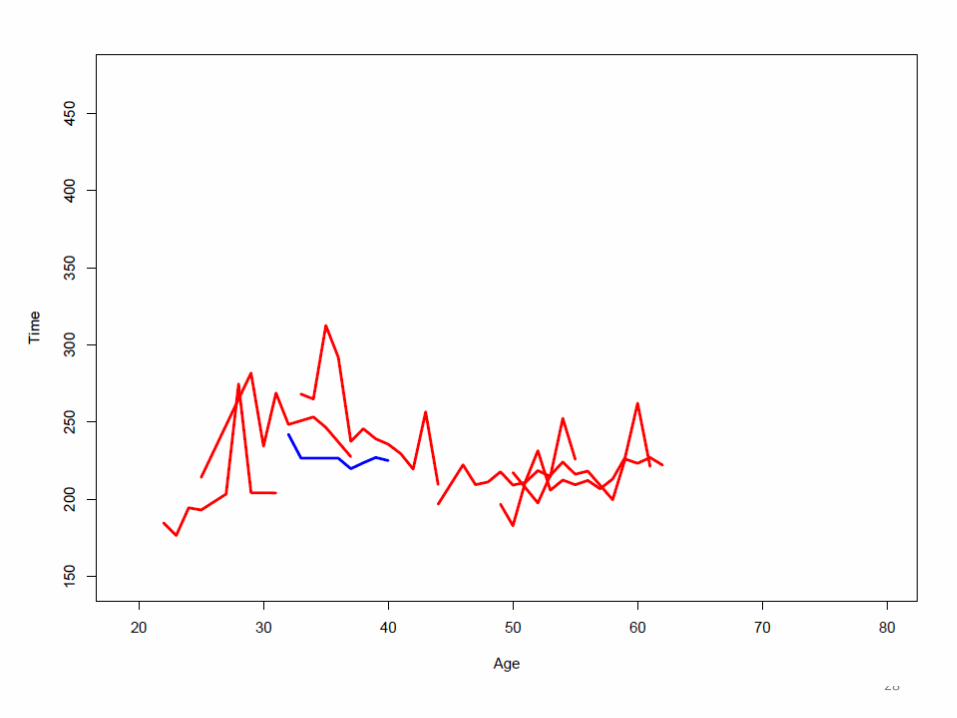
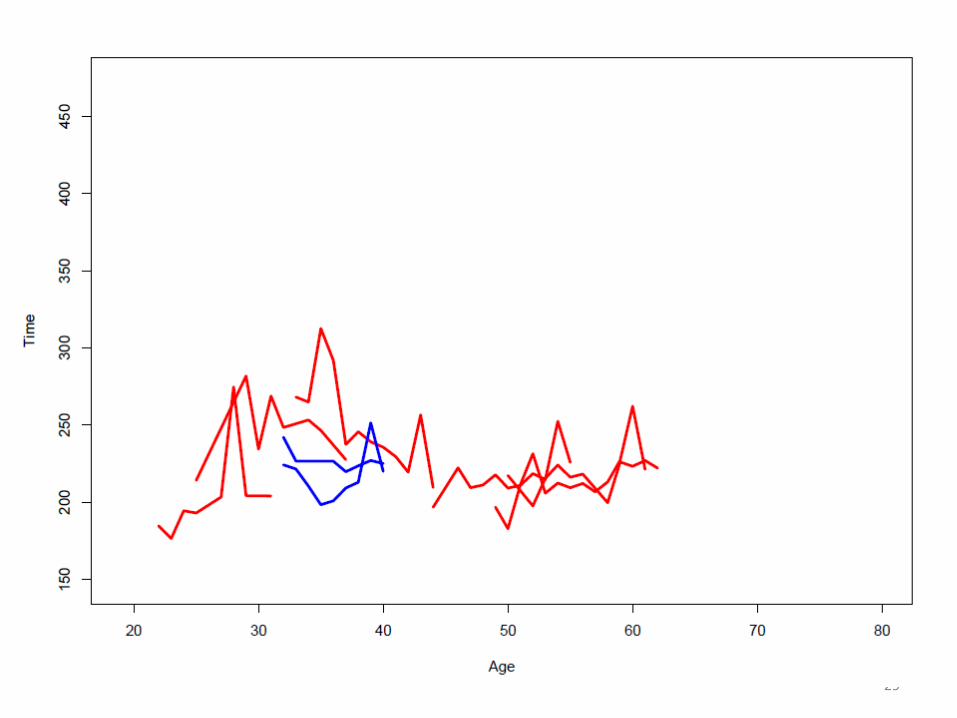
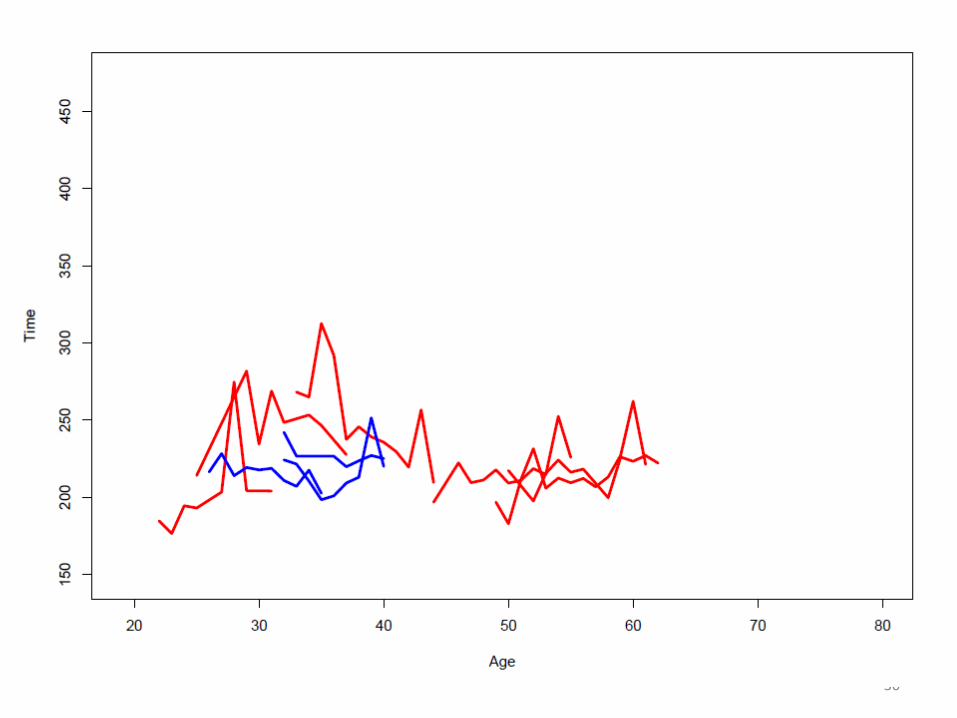
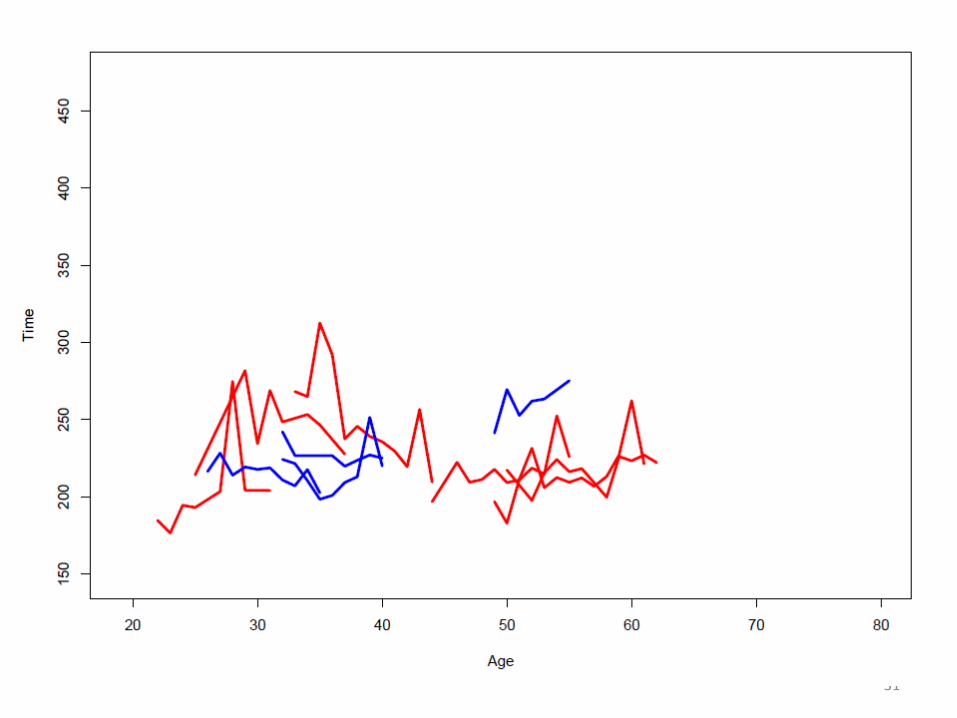
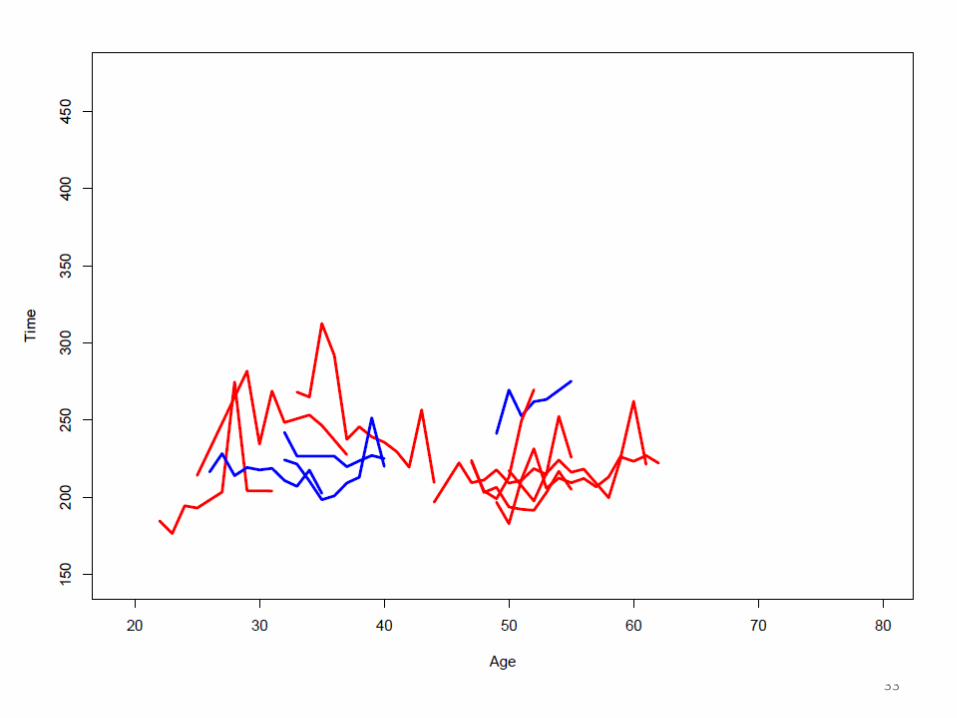
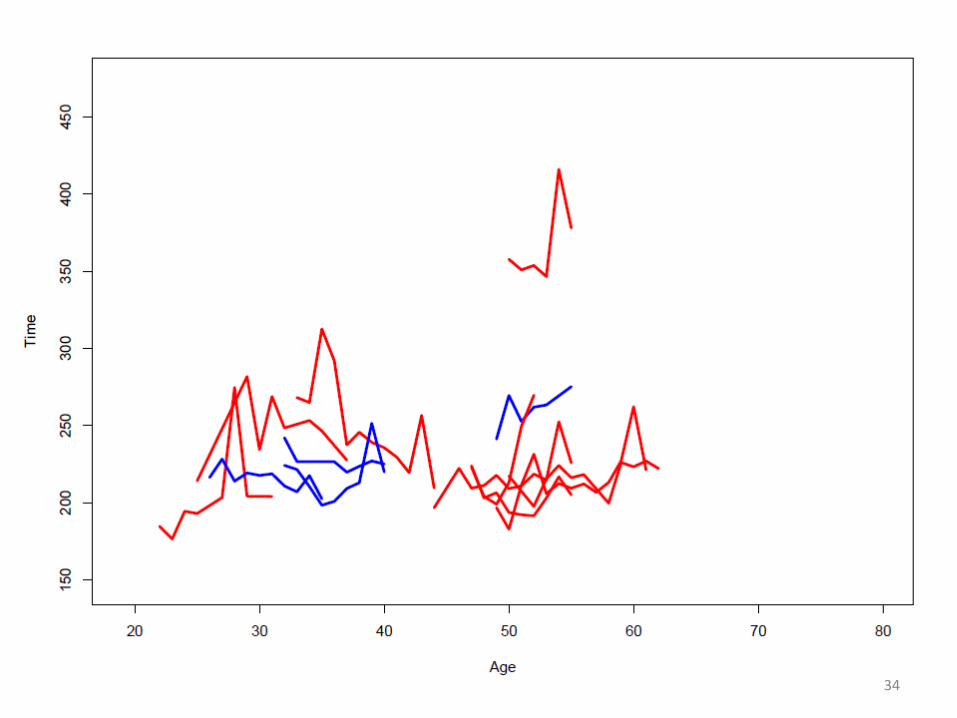
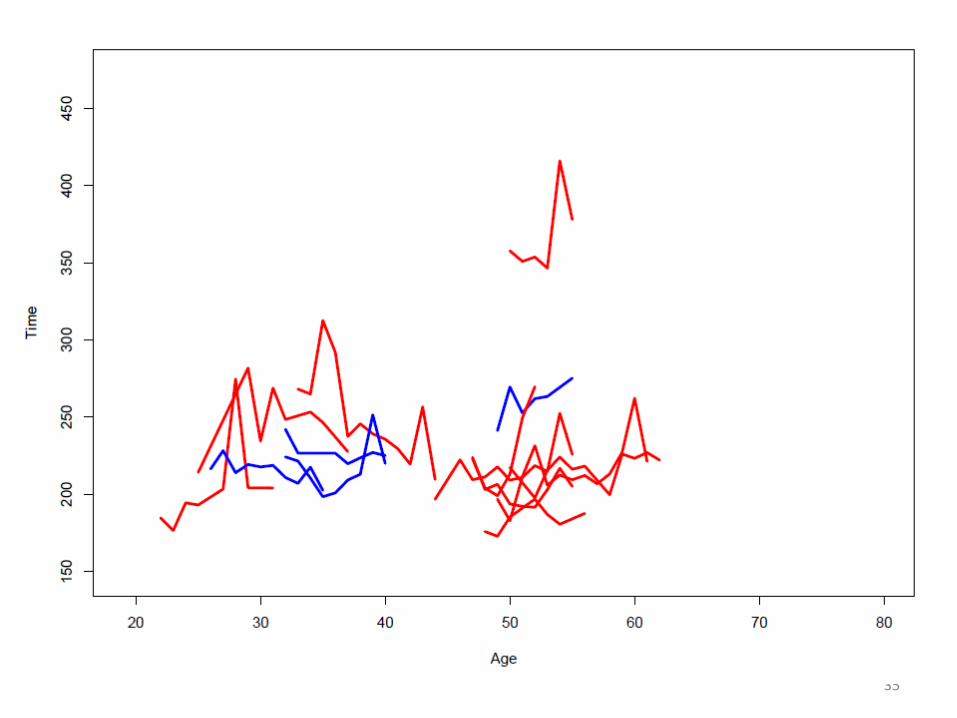
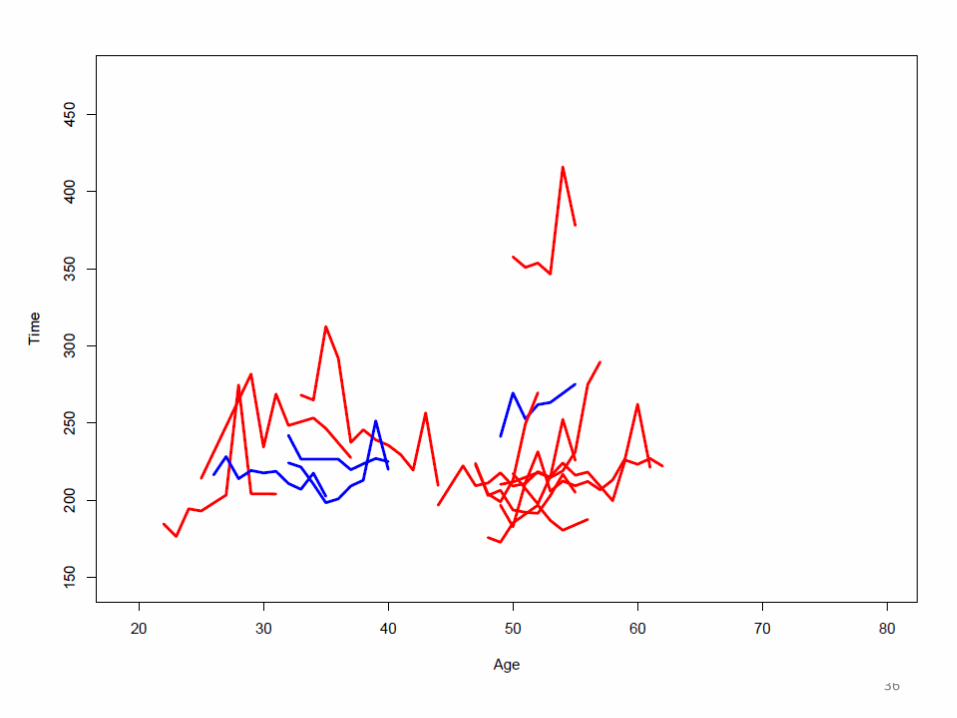
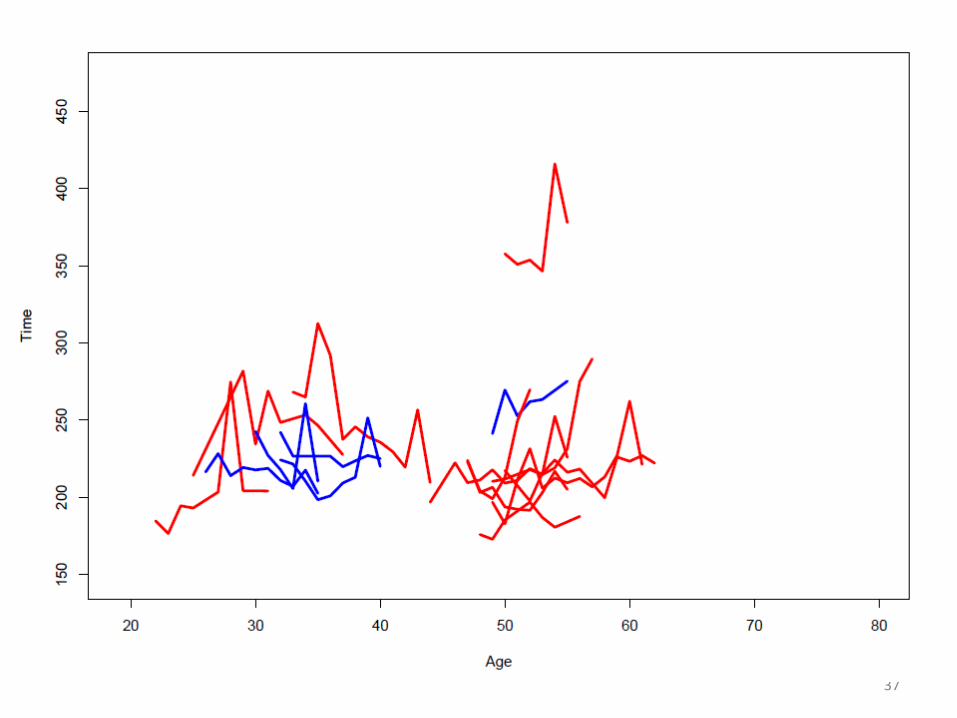
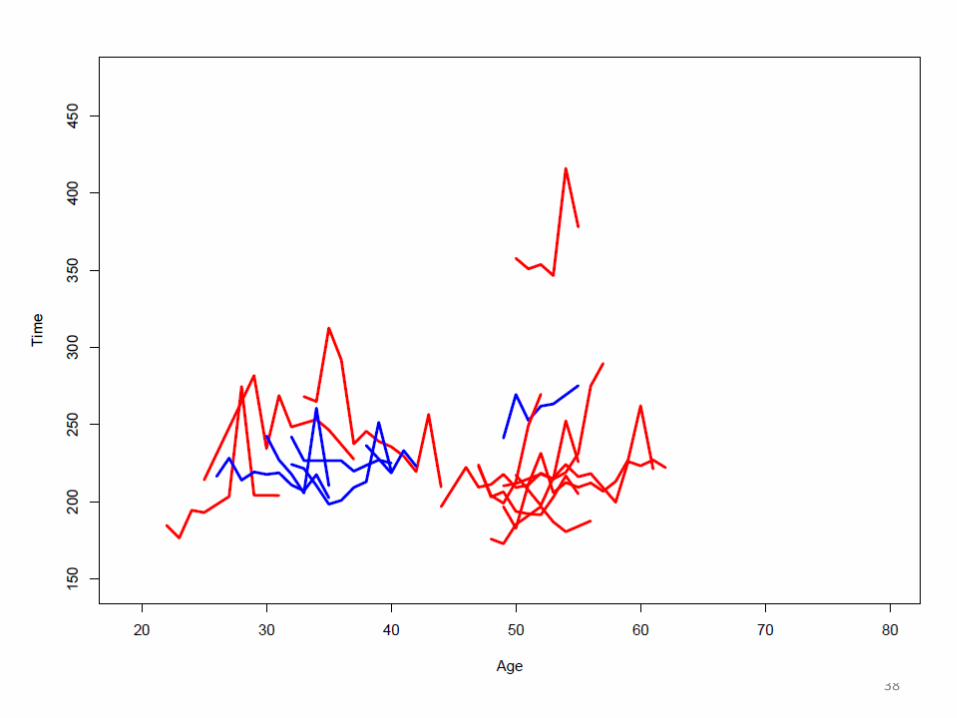
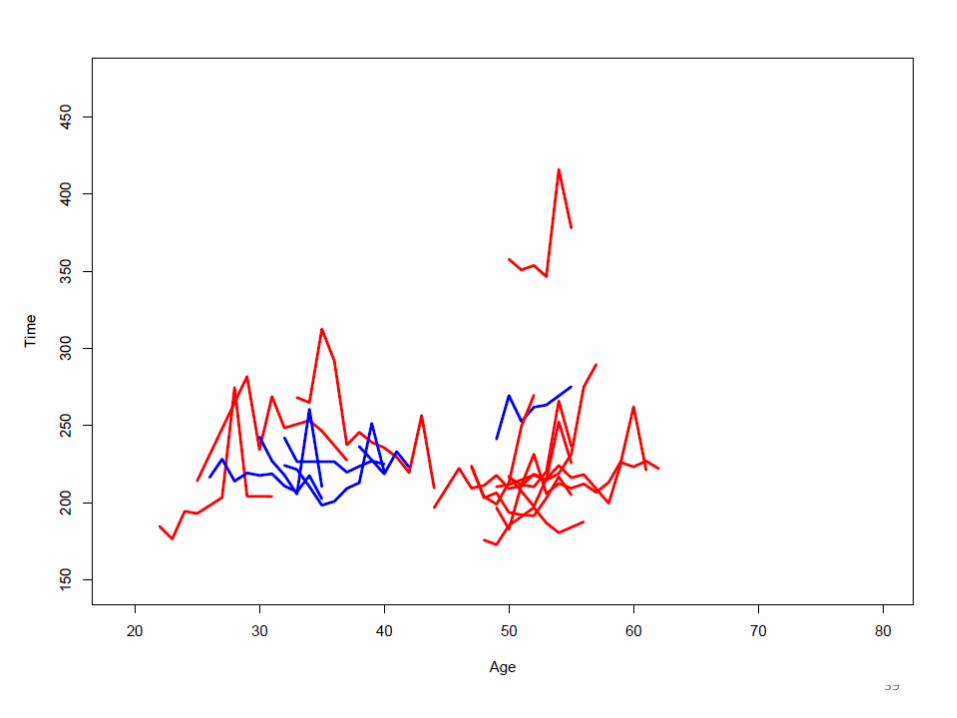
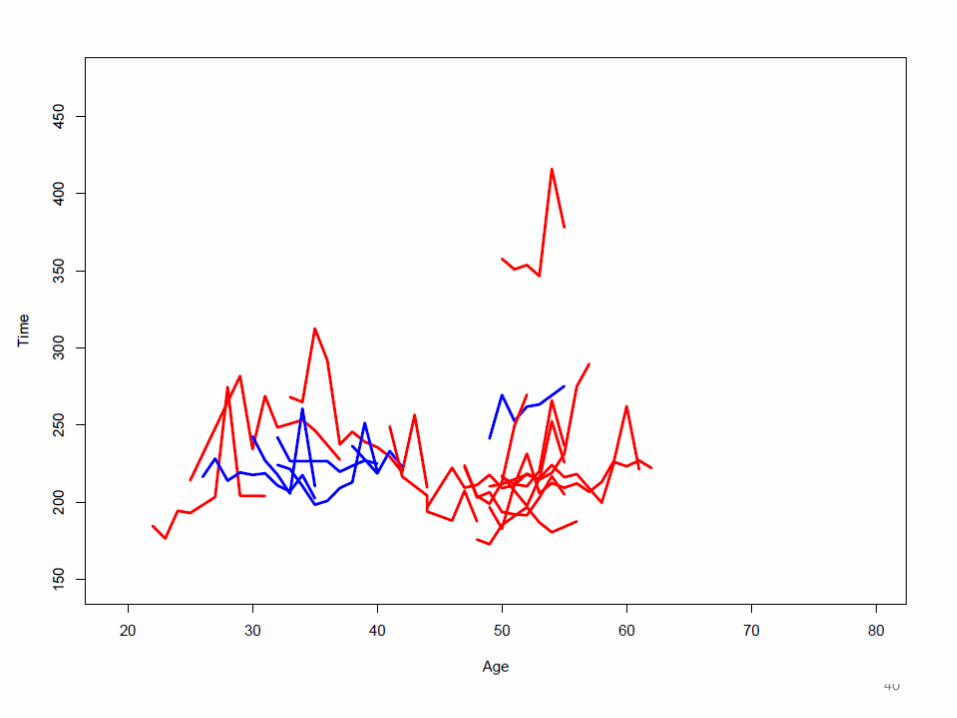
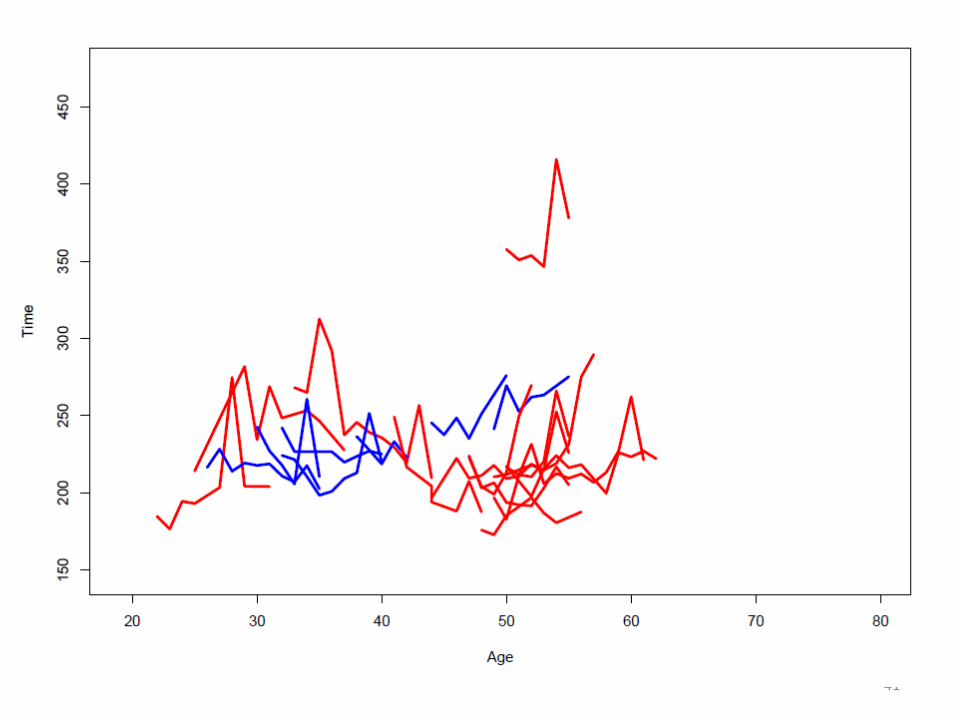
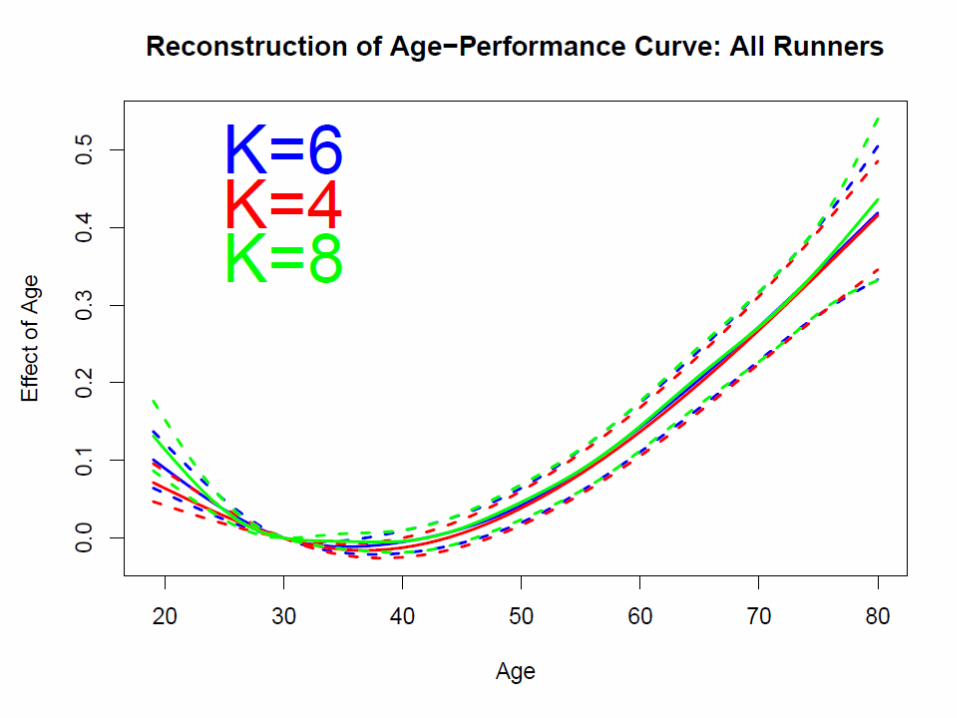
The Idea
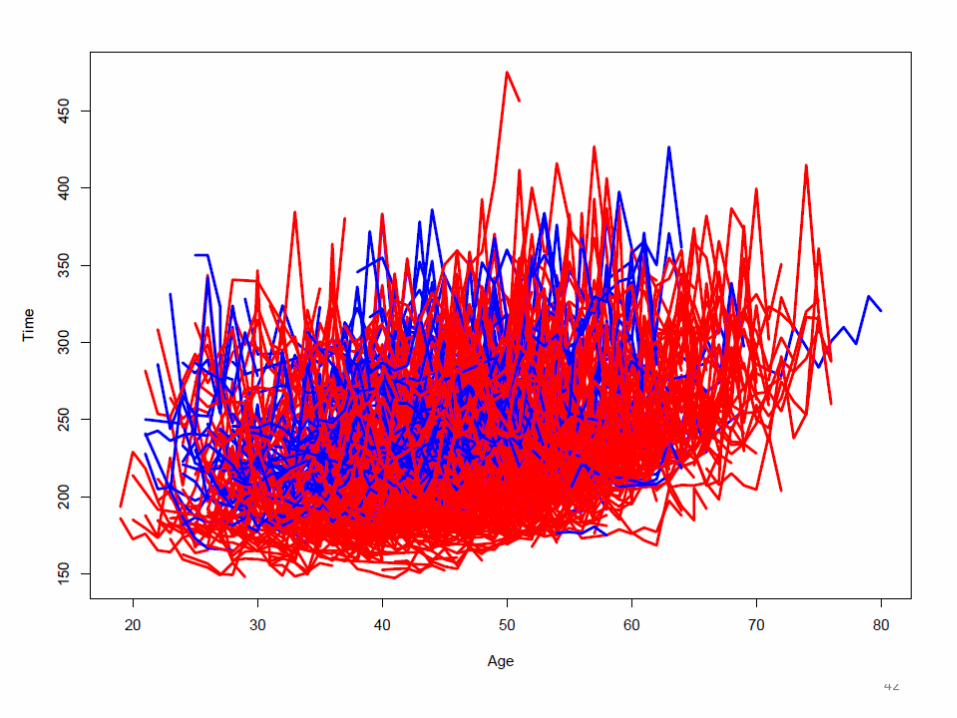
• Each individual runner record is a part-trace of the performance v. age curve for that runner
• Allow for a random “runner effect”
• Also allow for a random “calendar year” effect (2004 and 2012 were very hot)
• Separate men’s and women’s performance
• A refinement (later): also distinguish runners of different ability levels
43
44
45

46
47
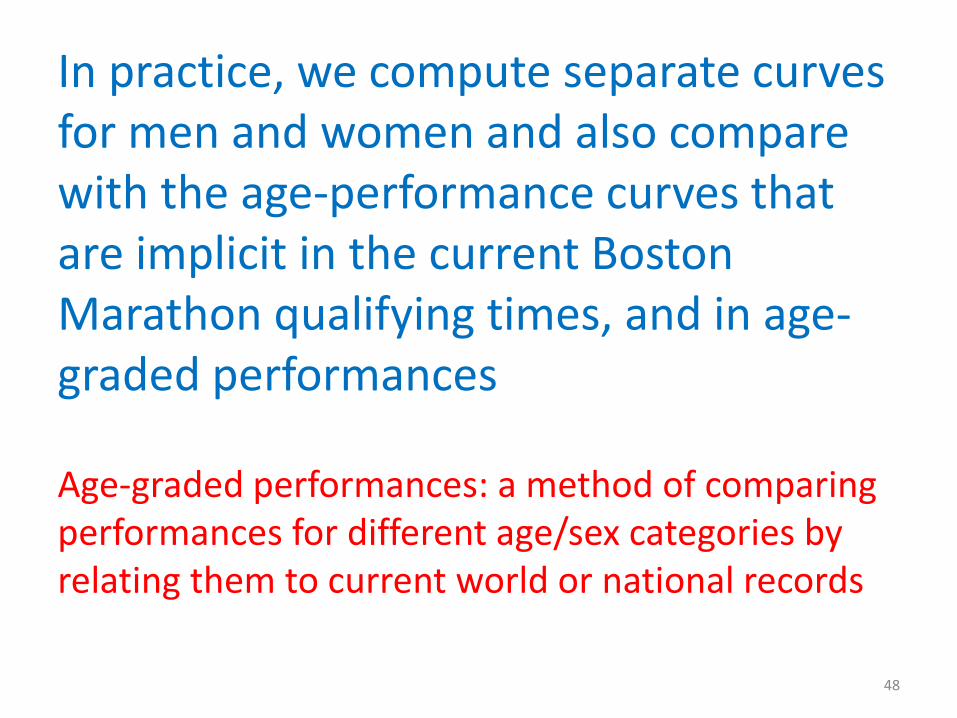
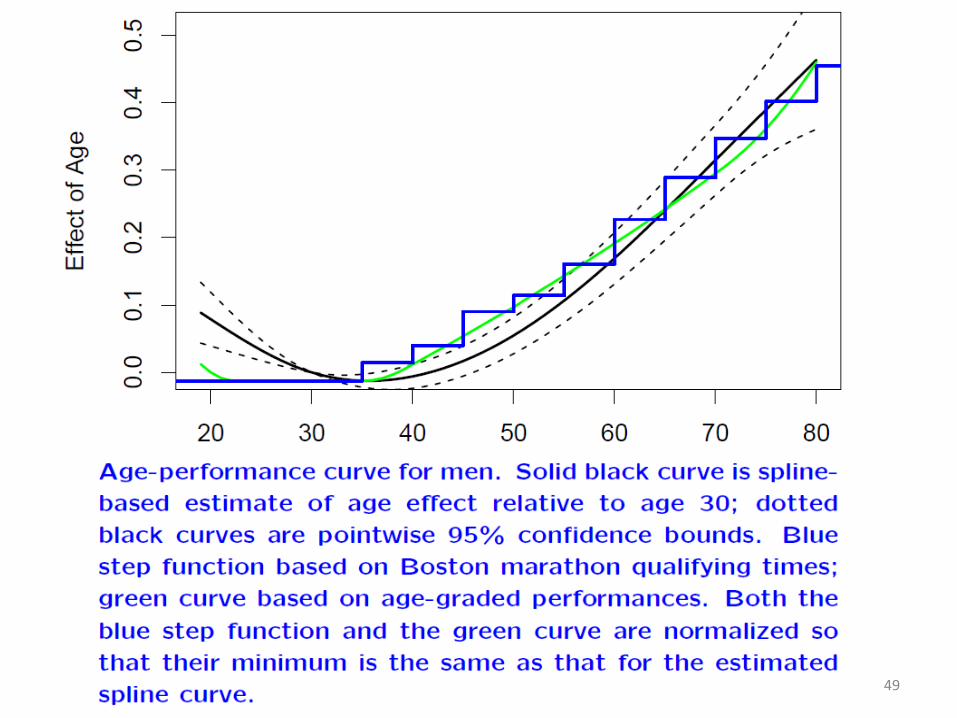
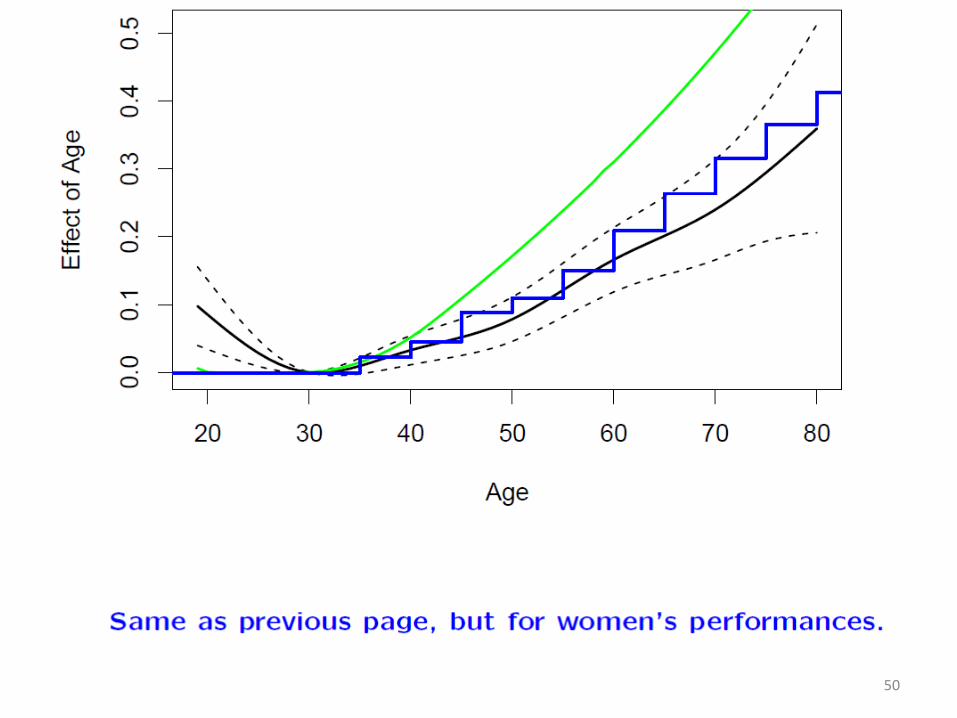
In practice, we compute separate curves for men and women and also compare with the age-performance curves that are implicit in the current Boston Marathon qualifying times, and in age-graded performances Age-graded performances: a method of comparing performances for different age/sex categories by relating them to current world or national records
48
49
50
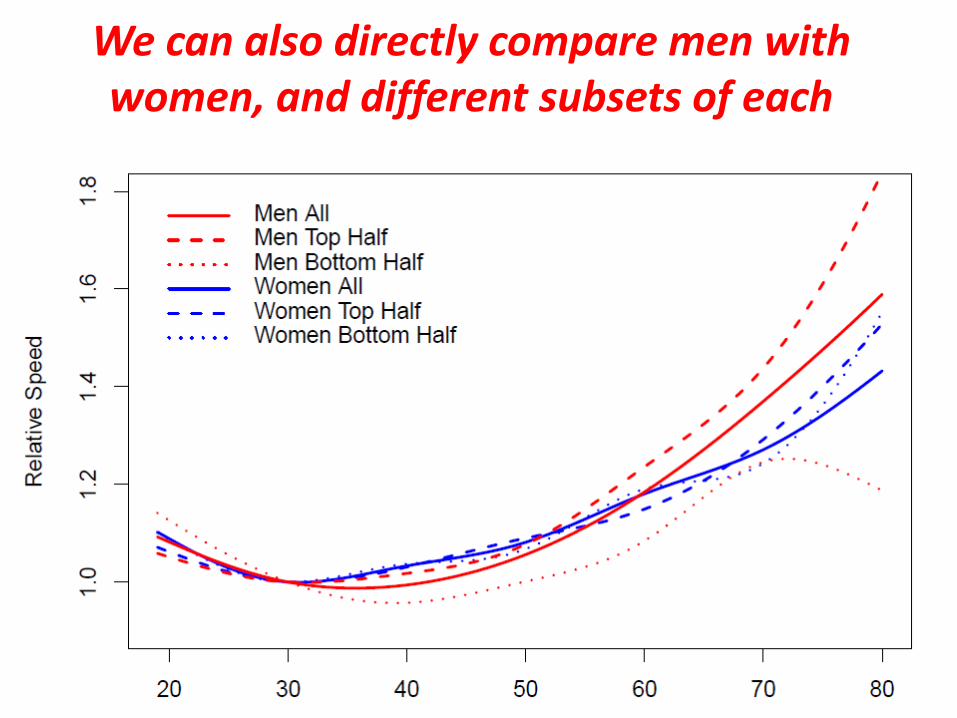
We can also directly compare men with women, and different subsets of each
51

Also look at the year effect
52
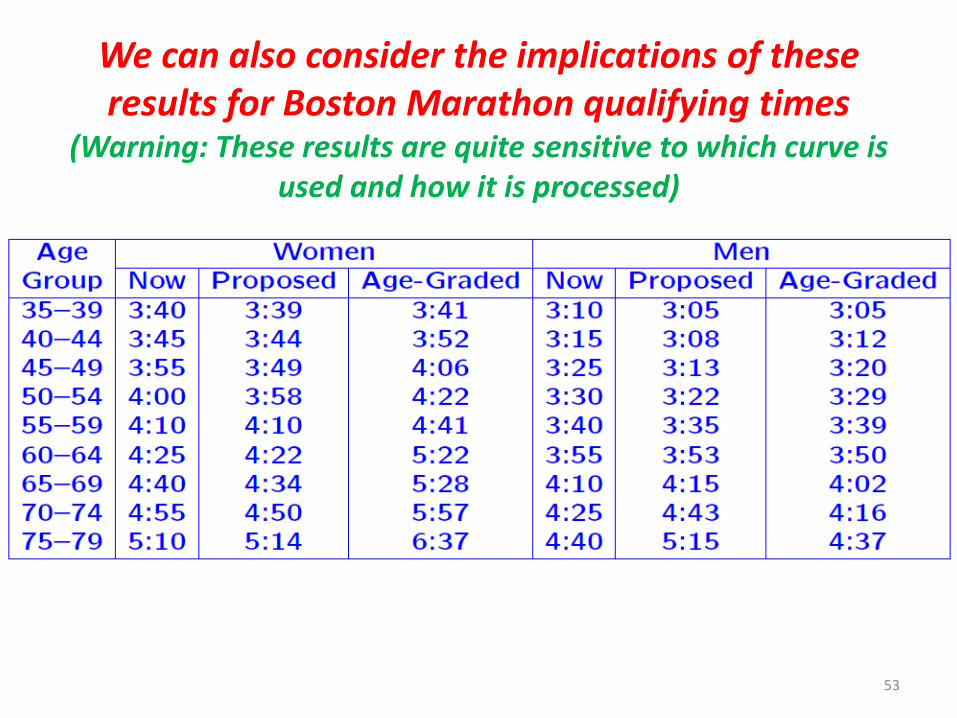
We can also consider the implications of these results for Boston Marathon qualifying times
(Warning: These results are quite sensitive to which curve is used and how it is processed)
53
Conclusions
• The problem is difficult • Current Boston Marathon standards have evolved over
the years, but no real “science” behind them • Age-graded standards are popular in the running
community, but they have problems • The longitudinal method proposed here is the only
method based on how individual runners’ performances change with age
• Still need larger datasets and more development of the method
• Thank you for your attention!
54

Conclusions
• The problem is difficult • Current Boston Marathon standards have evolved over
the years, but no real “science” behind them • Age-graded standards are popular in the running
community, but they have problems • The longitudinal method proposed here is the only
method based on how individual runners’ performances change with age
• Still need larger datasets and more development of the method
• Thank you for your attention!
55
Conclusions
• The problem is difficult • Current Boston Marathon standards have evolved over
the years, but no real “science” behind them • Age-graded standards are popular in the running
community, but they have problems • The longitudinal method proposed here is the only
method based on how individual runners’ performances change with age
• Still need larger datasets and more development of the method
• Thank you for your attention!
56
Conclusions
• The problem is difficult • Current Boston Marathon standards have evolved over
the years, but no real “science” behind them • Age-graded standards are popular in the running
community, but they have problems • The longitudinal method proposed here is the only
method based on how individual runners’ performances change with age
• Still need larger datasets and more development of the method
• Thank you for your attention!
57
Conclusions
• The problem is difficult • Current Boston Marathon standards have evolved over
the years, but no real “science” behind them • Age-graded standards are popular in the running
community, but they have problems • The longitudinal method proposed here is the only
method based on how individual runners’ performances change with age
• Still need larger datasets and more development of the method
• Thank you for your attention!
58
Conclusions
• The problem is difficult • Current Boston Marathon standards have evolved over
the years, but no real “science” behind them • Age-graded standards are popular in the running
community, but they have problems • The longitudinal method proposed here is the only
method based on how individual runners’ performances change with age
• Still need larger datasets and more development of the method
• Thank you for your attention!
59