The ValuEngine Forecasting Model Throws Me a Curve Ball.
5
Richard Suttmeier is the Chief Market Strategist at www.ValuEngine.com. ValuEngine is a fundamentally-based quant research firm in N ewtown, PA. V aluEngine covers over 7,000 stocks every day. A variety of newsletters and portfolios containing Suttmeier's detailed research, stock picks, and commentary can be found http://www.valuengine.com/nl/mainnl T o unsubscribe from this free email newsletter list, please click http://www.valuengine.com/pub/Unsubscribe? Februar y 9, 2012 – The ValuEngine Forec asti ng Model T hrow s Me a Cur ve Ball. Stocks are fundamentally overvalued ba sed upon the Val uEngine Valuation Model, and are technically overbought on both daily and weekly charts. Countering this concern is the ValuEngine Forecasting Model which significantly increased the number of BUY rated stocks. My conclusion is that stocks can become even more overvalued and more overbought. The S&P 500, Dow Transports and Russell 2000 can stretch their year to date gains to quarterly / annual risky levels at 1363.2 SPX, 5448 Dow Transports and 836.15 Russell 2000. Even with this strength these three indices can stay below their 2011 highs at 1370.58 SPX, 5627.85 Dow Transports and 868.57 Russell 2000. My quarterly pivots at 12,478 Dow Industrials, 1305.4 S&P 500 and 2777 NASDAQ have become the value areas. The yield on the 10-Year note remains cheaper than my semiannual pivot at 1.903. Gold came back down to between my quarterly pivots at $1725.5 and $1740.9. Crude oil moved back below its 50-day simple moving average at $99.23 with its quarterly pivot at $99.87 tested again on Wednesday. The euro vs the dollar remains above its 50-day simple moving average at 1.3047. 10-Year Note – (1.979) My annual value is 2.502 with my semiannual pivot at 1.903, and daily, weekly , quarterly and monthly risky levels are 1.894, 1.797, 1.687 and 1.347. Courtesy of Thomson / Reuters
-
Upload
valuenginecom -
Category
Documents
-
view
221 -
download
0
Transcript of The ValuEngine Forecasting Model Throws Me a Curve Ball.

8/3/2019 The ValuEngine Forecasting Model Throws Me a Curve Ball.
http://slidepdf.com/reader/full/the-valuengine-forecasting-model-throws-me-a-curve-ball 1/5
Richard Suttmeier is the Chief Market Strategist at www.ValuEngine.com. ValuEngine is a fundamentally-based quant research firm in Newtown, PA. ValuEnginecovers over 7,000 stocks every day.
A variety of newsletters and portfolios containing Suttmeier's detailed research, stock picks
and commentary can be found http://www.valuengine.com/nl/mainnl
To unsubscribe from this free email newsletter list, please click
http://www.valuengine.com/pub/Unsubscribe?
Februar y 9, 2012 – The ValuEngine Forec ast i ng Model T hrow s Me a Cur ve Bal l .
Stocks are fundamentally overvalued based upon the ValuEngine Valuation Model, and are
technically overbought on both daily and weekly charts. Countering this concern is theValuEngine Forecasting Model which significantly increased the number of BUY rated stocks.My conclusion is that stocks can become even more overvalued and more overbought. TheS&P 500, Dow Transports and Russell 2000 can stretch their year to date gains to quarterly /annual risky levels at 1363.2 SPX, 5448 Dow Transports and 836.15 Russell 2000. Even with thisstrength these three indices can stay below their 2011 highs at 1370.58 SPX, 5627.85 DowTransports and 868.57 Russell 2000. My quarterly pivots at 12,478 Dow Industrials, 1305.4 S&P500 and 2777 NASDAQ have become the value areas. The yield on the 10-Year note remainscheaper than my semiannual pivot at 1.903. Gold came back down to between my quarterlypivots at $1725.5 and $1740.9. Crude oil moved back below its 50-day simple moving average a$99.23 with its quarterly pivot at $99.87 tested again on Wednesday. The euro vs the dollar
remains above its 50-day simple moving average at 1.3047.10-Year Note – (1.979) My annual value is 2.502 with my semiannual pivot at 1.903, and daily, weeklyquarterly and monthly risky levels are 1.894, 1.797, 1.687 and 1.347.
Courtesy of Thomson / Reuters

8/3/2019 The ValuEngine Forecasting Model Throws Me a Curve Ball.
http://slidepdf.com/reader/full/the-valuengine-forecasting-model-throws-me-a-curve-ball 2/5
Comex Gold – ($1735.7) Semiannual, annual and weekly value levels are $1659.5, $1635.8,$1575.8, $1593.9 with quarterly and daily pivots at $1725.5, $1740.9 and $1739.3, and monthly risky
level at $1816.4.
Courtesy of Thomson / Reuters
Nymex Crude Oil – ($99.01) Monthly and semiannual value levels are $85.62 and $79.83 with
weekly, daily and quarterly pivots at $97.44, $96.65 and $99.87, and semiannual and annual riskylevels at $104.84, and $103.58 and $117.00.
Courtesy of Thomson / Reuters
8/3/2019 The ValuEngine Forecasting Model Throws Me a Curve Ball.
http://slidepdf.com/reader/full/the-valuengine-forecasting-model-throws-me-a-curve-ball 3/5
The Euro – (1.3258) Semiannual, monthly, weekly and quarterly value levels are 1.2980, 1.2945,1.2599 and 1.2499 with a daily pivot at 1.3118, and annual and semiannual risky levels at 1.4239 and
1.4405.
Courtesy of Thomson / Reuters
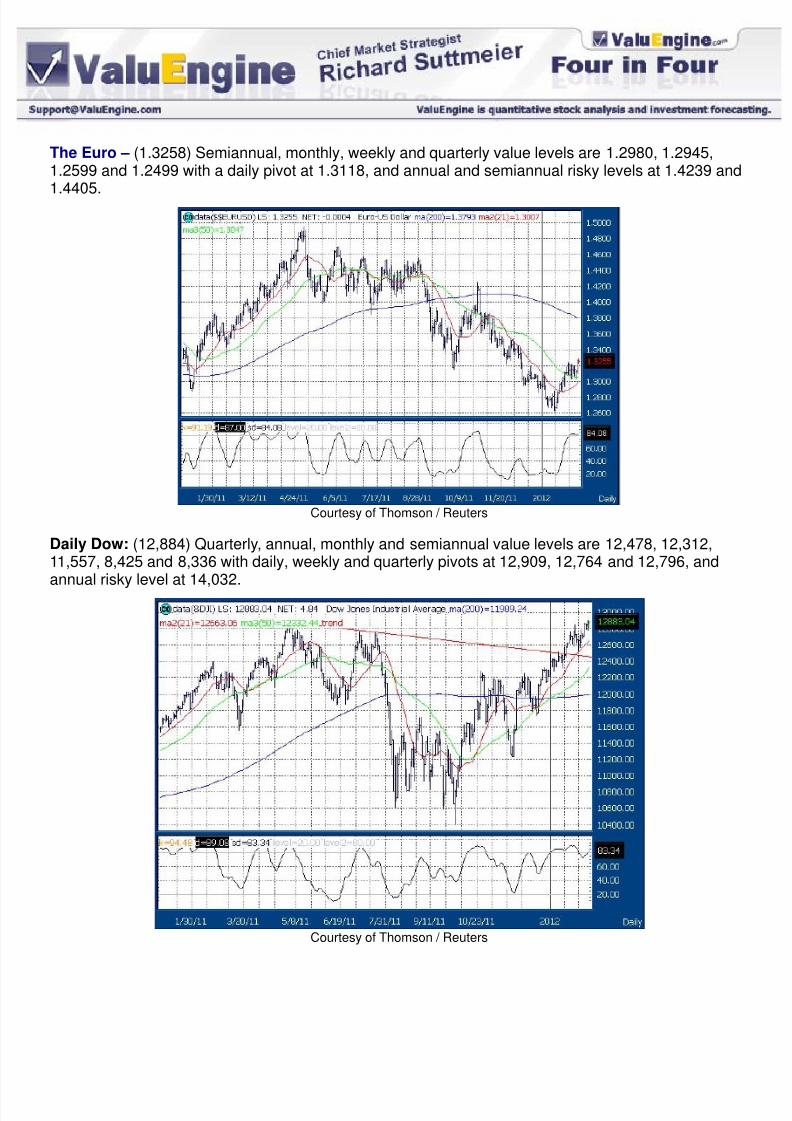
Daily Dow: (12,884) Quarterly, annual, monthly and semiannual value levels are 12,478, 12,312,11,557, 8,425 and 8,336 with daily, weekly and quarterly pivots at 12,909, 12,764 and 12,796, andannual risky level at 14,032.
Courtesy of Thomson / Reuters
8/3/2019 The ValuEngine Forecasting Model Throws Me a Curve Ball.
http://slidepdf.com/reader/full/the-valuengine-forecasting-model-throws-me-a-curve-ball 4/5
S&P 500 – (1350.0) Monthly and semiannual value levels are 1176.1, 841.7 and 829.9 with daily,quarterly and weekly pivots at 1352.8, 1305.4 and 1329.5, and annual risky levels at 1363.2 and
1562.9. The May 2, 2011 high is 1370.58.NASDAQ – (2916) Weekly, Quarterly, annual, monthly and semiannual value levels are 2815, 2777,2698, 2512, 2012 and 1952 with my quarterly pivot at 2849, and daily and annual risky level at 2934and 3232.
NASDAQ 100 (NDX) – (2546) Quarterly, weekly, annual, monthly and semiannual value levels are2422, 2412, 2300, 2280, 1851 and 1743 with my quarterly pivot at 2471, and daily and annual riskylevels at 2560 and 2603.
Dow Transports – (5299) Monthly and semiannual value levels are 4522, 4407 and 3778 with dailyand weekly pivots at 5303 and 5396, and quarterly, and annual risky levels at 5448, 5861 and 6111.The all time high was set at 5627.85 on July 11, 2011.
Russell 2000 – (828.39) Weekly, monthly and semiannual value levels are 803.62, 662.90, 572.90and 510.81 with quarterly pivots at 824.46 and 829.03, and daily and annual risky levels at 834.83,836.15 and 969.09. The all time high was set at 868.57 on May 2, 2011.
The SOX – (427.59) Weekly, quarterly, monthly, annual and semiannual value levels are 408.39,390.17, 323.52, 269.80, 277.90 and 194.47 with a daily and quarterly pivots at 427.61 and 423.32, andannual risky level at 520.61. The 2011 high is 474.33 set on February 18, 2011.
ValuEngine Valuation Model – Sectors have shifted to Overvalued from Undervalued.• 54.3% of all stocks are undervalued / 45.7% of all stocks are overvalued. On October 4 th -
93.5% of all stocks were undervalued.• Fifteen of sixteen sectors are overvalued; 10 are overvalued by double-digit percentages.
(11.0% OV to 19.6% OV) Back in March 2009 the sectors were undervalued by 33% to 45%. – Check out and subscribe to www.ValuEngine.com.
VE Morning Briefing – If you want expanded analysis of the US Capital Markets including a FearlessPrediction of the Week and a Stock of the Day go to this link and sign up:http://www.valuengine.com/nl/mainnl?nl=D
ValuTrader Model Portfolio – If you want to learn how to “Buy and Trade” use this link and sign up:http://www.valuengine.com/nl/mainnl?nl=V
ETF Weekly – If you want my Value Levels and Risky Levels for 30 Electronically Traded Funds usethis link and sign up: http://www.valuengine.com/nl/mainnl?nl=U
ValuEngine FDIC Evaluation Report – In this report I slice and dice the FDIC Quarterly BankingProfile. We publish a ValuEngine List of Problem Banks in this publication:http://www.valuengine.com/nl/mainnl?nl=C The December FDIC report with complete analysis ofthe Q3 Quarterly Banking Profile is now available. I track the continuing slow improvement to thehousing market and banking system, but recognize that we are not out of the war.
ValuEngine Capital Management - Over the years many of my readers have asked for investment

8/3/2019 The ValuEngine Forecasting Model Throws Me a Curve Ball.
http://slidepdf.com/reader/full/the-valuengine-forecasting-model-throws-me-a-curve-ball 5/5
help based upon ValuEngine and my technical analysis expertise. This is now possible through VECapital Management LLC. If you are a Registered Investment Advisor looking for new products to offeto your clients, let me know. If you have any questions, please respond to this email.
Definition of MOJO – This is my term for technical momentum. I use what’s called “12x3x3 slowstochastic readings” from daily, weekly and monthly charts. The scale is zero to 10.0 where above 8.0is overbought and below 2.0 is oversold.
Buy and Trade Strategies for Long Positions• Value Level – The price at which you establish an additional long position on share price
weakness. This is done on a GTC Limit Order to buy weakness to the Value Level. • Risky Level – The price at which you remove a single long position or reduce a multiple
long position on share price strength. This is done on a GTC Limit Order to sell strength tothe Risky Level.
Buy and Trade Strategies for Short Positions• Value Level – The price at which you remove a single short position or reduce a multiple
short position on share price weakness. This is done on a GTC Limit Order to buy weaknesto the Value Level.
• Risky Level – The price at which you establish an addition short position on share price strength. This is done on a GTC Limit Order to sell strength to the Risky Level.
Richard SuttmeierChief Market StrategistValuEngine.com(800) 381-5576
To unsubscribe from this free email newsletter list, please clickhttp://www.valuengine.com/pub/Unsubscribe?
Send your comments and questions to [email protected]. For more information on our productsand services visit www.ValuEngine.com
As Chief Market Strategist at ValuEngine Inc, my research is published regularly on the website www.ValuEngine.com. I have daily, weekly, monthly, andquarterly newsletters available that track a variety of equity and other data parameters as well as my most up-to-date analysis of world markets. Mynewest products include a weekly ETF newsletter as well as the ValuTrader Model Portfolio newsletter. You can go tohttp://www.valuengine.com/nl/mainnl to review sample issues and find out more about my research.
“I Hold No Positions in the Stocks I Cover.”