The Value Priority Hypotheses for Consumer Budget …ebusiness.mit.edu/urban/papers/the value...
21
The Value Priority Hypotheses for Consumer Budget Plans John R. Hauser; Glen L. Urban The Journal of Consumer Research, Vol. 12, No. 4. (Mar., 1986), pp. 446-462. Stable URL: http://links.jstor.org/sici?sici=0093-5301%28198603%2912%3A4%3C446%3ATVPHFC%3E2.0.CO%3B2-J The Journal of Consumer Research is currently published by The University of Chicago Press. Your use of the JSTOR archive indicates your acceptance of JSTOR's Terms and Conditions of Use, available at http://www.jstor.org/about/terms.html. JSTOR's Terms and Conditions of Use provides, in part, that unless you have obtained prior permission, you may not download an entire issue of a journal or multiple copies of articles, and you may use content in the JSTOR archive only for your personal, non-commercial use. Please contact the publisher regarding any further use of this work. Publisher contact information may be obtained at http://www.jstor.org/journals/ucpress.html. Each copy of any part of a JSTOR transmission must contain the same copyright notice that appears on the screen or printed page of such transmission. The JSTOR Archive is a trusted digital repository providing for long-term preservation and access to leading academic journals and scholarly literature from around the world. The Archive is supported by libraries, scholarly societies, publishers, and foundations. It is an initiative of JSTOR, a not-for-profit organization with a mission to help the scholarly community take advantage of advances in technology. For more information regarding JSTOR, please contact [email protected]. http://www.jstor.org Sun Oct 21 15:53:30 2007
Transcript of The Value Priority Hypotheses for Consumer Budget …ebusiness.mit.edu/urban/papers/the value...
The Value Priority Hypotheses for Consumer Budget Plans
John R Hauser Glen L Urban
The Journal of Consumer Research Vol 12 No 4 (Mar 1986) pp 446-462
Stable URL
httplinksjstororgsicisici=0093-53012819860329123A43C4463ATVPHFC3E20CO3B2-J
The Journal of Consumer Research is currently published by The University of Chicago Press
Your use of the JSTOR archive indicates your acceptance of JSTORs Terms and Conditions of Use available athttpwwwjstororgabouttermshtml JSTORs Terms and Conditions of Use provides in part that unless you have obtainedprior permission you may not download an entire issue of a journal or multiple copies of articles and you may use content inthe JSTOR archive only for your personal non-commercial use
Please contact the publisher regarding any further use of this work Publisher contact information may be obtained athttpwwwjstororgjournalsucpresshtml
Each copy of any part of a JSTOR transmission must contain the same copyright notice that appears on the screen or printedpage of such transmission
The JSTOR Archive is a trusted digital repository providing for long-term preservation and access to leading academicjournals and scholarly literature from around the world The Archive is supported by libraries scholarly societies publishersand foundations It is an initiative of JSTOR a not-for-profit organization with a mission to help the scholarly community takeadvantage of advances in technology For more information regarding JSTOR please contact supportjstororg
httpwwwjstororgSun Oct 21 155330 2007
The Value Priority Hypotheses for Consumer Budget Plans
JOHN R HAUSER GLEN L URBAN
Based on the behavioral sciences and mathematicalprogrammingwe hypothesize that consumers rank durables by a value (or net value) priority approximated by utility per dollar (or utility minus price) and plan to choose items in that order up to a budget cutoff This paper derives these hypotheses and develops a convergent linear programming procedure to estimate utility Using primary field data on res-ervation prices purchase probabilities lottery orders and combination prizes we estimate utilities and compare the hypothesesto 215 actual budget plans LISREL V analysis provides further support for the hypotheses
Purchases of major consumer goods such as auto- clude in their budget plans and we examine marketing mobiles home computers and video cassette re- science hypotheses of how goods are prioritized within
corders account for substantial budget outlays by con- a budget Our hypotheses are derived from mathemat-sumers Such purchases have a major impact on na- ical programming and economic reasoning as modified tional economic conditions and represent a challenging by behavioral science considerations The hypotheses research issue Scientific interest is strong because major represent what we believe are dominant effects and are consumer goods purchases depend upon inter-category proposed as a reasonable approximation to describe comparisons (eg auto versus home computers) and consumer planning behavior They also provide a basis upon the impact of limited consumer budgets Mana- for future research gerial interest is strong because understanding the effects In particular this paper reviews the value priority on families purchases of relative price and competitive hypothesis for consumer purchases introduces a rival entry along with recession inflation and tax policy is variation-the net value priority hypothesis and dis-critical for established products In developing new du- cusses their interrelationships based on economics rable goods managerial and research attention is high because new product development costs are large (eg in automobiles such costs can exceed one billion dol-lars) and because key strategic decisions must be made prior to new product launch
This article seeks to increase our understanding of consumer purchasing decisions We focus on those consumer goods usually durables that consumers in-
marketing and management science We describe data collected to test the hypotheses and linear programming procedures to estimate the underlying model from the data We then test the hypotheses by comparing their predictions to actual consumer budget plans and we provide convergent tests with an alternative estimation procedure LISREL V We close with a discussion of some managerial implications
John R Hauser and Glen L Urban are Professors of Manaeement VALUE PRIORITY HYPOTHESIS Science at the Sloan School of Management Massachusetts fistitute of Technology Cambridge MA 02 139 This research was sponsored
We begin with the single period consumer model by a grant from General Motors (Buick Motors Division) to MIT ppendix A discusses how the can be extended Special thanks go to John Dabels General Director of Marketing and to multiple periods that include borrowing savings de-Sales Planning for his support insights and guidance throughout preciation operating costs trade-ins and interproductthe project We are indebted to Paul G Schiodtz of MIT who complementarity In a single period the consumer facesdeveloped the convergent LP estimation software and who has been instrumental in the data analysis John Roberts Lisa Tenner Janny a fixed budget that she must allocate For some goods Leung Gayle Shea Young Sohn and Fareena Sultan (of MIT) she plans for she not For the Andy Cjazka Tom Rose Barbara Gaston and Lori Curtis (of Survey sake of simplicity we will call planned-for items durable Data Research Inc) Jan Woznik (of McCann-Erickson Inc) and goods although such items can include major expen-Paula Travinia (of Buick) provided valuable assistance creative in- ditures such as those for vacations or tuition L~~g besights and hard work throughout the project Finally we obtained guidance from John Roberts Gabriel Bitran and Paul Schiodtz the number of items of durable good j she purchases
g is usually 0 (no purchase) or 1 (eg purchase one 446
O JOURNAL OF CONSUMER RESEARCH Vol I2 March 1986
VALUE PRIORITY HYPOTHESES
automobile) but it can be any integer (eg purchase two color televisions) Following standard economic theory (eg Rosen 1974) let y be a summary of the consumers allocation to other goods (eg $5000 to household products) and let B be the consumers budget Let U ( ) be the consumers utility function and let pJ be the price she expects to pay for durable good j Then the consumers decision prob-lem is represented mathematically as
maximize U ( g l g2 g3 gnY ) (MPI)
subject to plgl + p g 2 + + pgn + y lt B
MPl is the standard microeconomic consumer be-havior model Depending upon the functional form of the utility function the solution to MPl can involve complex nonlinear searches of all possible combinations of goods purchases Exact solution of MP 1 may be dif-ficult for even the most advanced mathematical pro-gramming computer algorithms thus it is unlikely that consumers solve MPl in its full complexity for everyday purchase decisions
Various scientific disciplines including new economic theory (Heiner 1983) information processing theory (Sternthal and Craig 1982 Bettman 1979) social psy-chology (Johnson and Tversky 1983) mathematical psychology (Tversky and Kahneman 1974) and mar-keting science (Shugan 1980) suggest modifications to MP1 A variety of authors propose the simpler model that consumers establish and follow a buying order for durables See for example Brown Buck and Pyatt (1965) Clarke and Soutar (1982) Dickson Lusch and Wilkie (1983) Kasulis Lusch and Stafford (1979) and Paroush (1965)
Such a prioritized buying order is consistent with a modified MP 1 Suppose that the consumer can assign to each good a marginal utility u that represents the amount of utility she gets from possessing that durable good (We assume that 11 can be ratio scaled) If the consumer considers more than one unit of the durable good we assign values u u etc to the first second etc units of good j wlth the usual assumption that u gt uj2 etc However to simplify exposition we temporarily assume that g is at most one item This is not a restriction in the theory2MPl now becomes MP2
Technically this is an assumption of separability (Blackorby Pri-mont and Russell 1975) Separability is a common assumption in economic modeling because it makes the general process (MP1) fea-sible to model This becomes important when as in this paper we also seek an empirical realization of the model In theory one could include complementarity by making one utility u a function of which other goods are purchased eg u = u (gkfor all k f j) Of course for any practical problem the general function u()must be simplified to say painvise complementarity For example in Ap-pendix A Equation A 1 uj could be a function of previous purchases We leave such extensions for future research
If we allow gj to be any integer MP2 becomes max Z ~k ~ k 6 ~
+ u(y) st CJ ZkpJ6jk + y lt B where 6k = I iff g gt k Alternatively we can redefine goods such that the k + 1 item of good j has a different index than the kth item See also Appendix A
maximize ulgl + u g 2 + + urgn + uAy) (MP2) subject to pgl + p2g2 + + pngn+ y G B
where uy(y)is the marginal utility of allocating y dollars to nondurables
MP2 is now a mathematical programming problem called the knapsack problem If the g were not re-stricted to be discrete-that is if you could buy a frac-tional automobile-its solution (called the greedy al-gorithm) is well known (eg Gass 1969 p 204) allocate the budget to goods in order of uJpJas long as uJp is greater than the budget cutoff X = auy(y)ayevaluated at the budget ~ o n s t r a i n t ~Even when purchases are re-stricted to be discrete greedy algorithms are excellent heuristics (Cornuejols Fisher and Nemhauser 1977 Fisher 1980)
The greedy algorithm is simple yet it provides an excellent approximation to the optimization of MP2 across a variety of situations We posit that this heuristic provides a reasonable approximation to describe con-sumer purchasing behavior There is a simple behavioral interpretation of the mathematical result that the cri-terion uJpJof utility per dollar is a measure of value Thus we call our proposition the value priority hy-pothesis
Value Priority Hypothesis The consumer purchases du-rable goods in order of value as long as their value is above some cutoff A which represents the value of spending a n additional dollar on nondurable goods Furthermore value is measured by utility per dollar
For example suppose a consumer is considering a microwave oven a video cassette recorder an auto-mobile a personal computer a snow blower and home improvements She would consider the pleasure and usefulness-ie utility-obtained from owning the best choice from each category consider the price of the best choice and rank them according to value as shown below
Microwave oven Video cassette recorder Automobile
Budget constraint (A) Personal computer Snow blower Home improvements
The consumer would purchase first the microwave oven (and some nondurables up to ~microwavel~micr~w~ve)then the video cassette recorder then the automobile At this point she would find that the three durables (plus the
athematically X is a complex function of all the variables of the problem For our purposes we need not evaluate it we need only that it exists For a given set of utilities it is quite easy to construct an algorithm that finds X by iteratively allocating the budget between durables and nondurables according to maximum up or au(y)dy Alternatively we can scale all utilities relative to A
corresponding nondurables) exhaust hisher budget If she were to borrow or otherwise obtain additional funds the next durable she would purchase would be a personal computer
Of course actual purchasing behavior is more com- plex depending upon unexpected events as well as planning (eg Dickson and Wilkie 1978) but we feel that the value priority hypothesis is a good first order explanation It has roots in the econometric (Paroush 1965) and management science (Keon 1980) literatures and is consistent with small-sample exploratory focus- group semantics (Bertan and Hauser 1982) such as you get what you pay for I want my moneys worth good value for the money spent I want the most car for my money when you buy a car you shop value and so on
Appendix A shows that the value priority hypothesis extends beyond the simple single period model For ex- ample in a multiperiod problem with borrowing (sav- ing) and depreciation the value becomes the depre- ciated time stream of utility divided by the price in cur- rent dollars Operating costs become an addition to price discounted over time replacements (trade-ins) are incorporated by computing net utility gain and net price and complementarity is approximated by first or- der dependence The budget constraints for each period are related by interest rates
ANOTHER VIEWPOINT NET VALUE PRIORITY
There are two components to the value priority hy- pothesis the ordering by value and the means by which value is computed In the previous section we treated value as utility per dollar but in brand choice price is often treated as an attribute For example models using conjoint analysis (Green and Srinivasan 1978) percep- tual mapping (Hauser and Koppelman 1979) and logit analysis (McFadden 1974) have all included price as another (linear) explanatory variable Srinivasan ( 1982) argues that this is a good representation if we recognize that the criterion u - Xp is the Lagrangian solution to MP2 when the problem is one of brand choice where one and only one good is chosen He then argues that u - Xp may be a more robust representation than uJ p when price itself carries utility such as in conspicuous consumption or when perceptions of quality are based on price
Thus a variation of the value priority hypothesis is that consumers order durable goods by net value where net value is the surplus of utility over price that is 11
- Xp The net value priority hypothesis can be derived by examining the dual program to the mathematical program MP2 (For those readers unfamiliar with dual linear programs see Gass 1969 or Appendix B) Let X continue to be the dual variable of the budget constraint and let y be the dual variables associated with the im-
THE JOURNAL OF CONSUMER RESEARCH
plicit constraints of gj lt 104 Then the dual program is (Gass 1969 p 90)
minimize
Xp + y uj for all jsubject to
X = y)dy at optimum
By the duality theorem of linear programming (Gass 1969 p 90) the solution of MP3 equals the solution of MP2 when purchases of fractional goods are allowed Rearranging the constraints of MP3 we get y 3 u - Xpj If fractional goods are allowed the complemen- tary slackness theorem applies (Gass 1969 p 99) By this theorem y = u - Xp is greater than zero in the solution to MP3 if and only if g = 1 in the solution to MP2 Also y equals zero if and only if gj lt 1
We obtain a behavioral interpretation of MP3 by recognizing that the simplex multiplier y is the shadow price of the constraint g lt 1 That is y is the value at the margin to the consumer of buying more of durable j or the value of relaxing the constraint that durables are discrete Complementary slackness says that net value 11 - Xp is greater than zero if and only if a good is purchased Net value is less than (or equal to) zero if less than one unit of a good is purchased
Together MP2 and MP3 suggest the behavioral in- terpretation that net value is the appropriate criterion if the consumer focuses on the marginal benefit of pur- chasing more of a given durable value (utility per dollar) is the appropriate criterion if the consumer focuses on his or her overall budget allocation problem Both are reasonable theoretical descriptive hypotheses Empirical data will shed further light on both hypotheses
In summary value priority and net value priority are two reasonable hypotheses about consumer durable purchasing Both are derived by assuming that the con- sumer uses an heuristic decision rule to maximize utility subject to a budget constraint and implicit constraints that fractional items are not available Both imply that a consumer will order his or her durable purchasing (within budget) according to a simple criterion based on value The two hypotheses differ in how this criterion is computed Value priority focuses on the budget con- straint and postulates a criterion of utility per dollar Net value priority focuses on the marginal value of the next purchase and postulates a criterion of net value gained We now examine data on both hypotheses
DATA The value priority and net value priority hypotheses
are formulated for decision making units such as in- dividuals or families To test their implications one re- quires data on budget allocations of individual decision
4We can extend this to any integer value for g by the techniques of Footnote 2
VALUE PRIORITY HYPOTHESES
making units In March 1983 we were given the op- portunity to apply and test our hypotheses An Amer- ican automobile manufacturer planned to introduce a new automobile in the Spring of 1984 and among other things wanted to know with which durable products the automobile would compete The new automobile was a luxury model for upscale consumers hence competition from vacations second homes pools boats and college tuition was a management concern
The data collection was part of an ongoing project The questioning procedure about to be described is based on focus groups in Boston Massachusetts and Troy Michigan in June 1982 automobile-show inter- views in Boston Massachusetts in November 1981 1982 and 1983 a pretest (30 consumers) in Troy Michigan in June 1982 a mini-test (40 consumers) in Phoenix Arizona in January 1983 and a series of in- formal tests throughout the period Throughout these tests the questioning procedure evolved to represent reasonable tradeoffs among measurement of the hy- pothesized concepts and feasibility of measurement
The consumer tasks were administered with trained and experienced professional interviewers The con- sumer tasks took approximately 50 minutes and were the opening part of a larger two-hour interview in which respondents were paid $25 for their time (see Hauser Roberts and Urban 1983 for details on the full inter- blew) The 174 respondents were chosen at random from the Cincinnati Ohio area but in proportion to their previous purchases of automobiles similar to the automobile of interest For 12 percent of the interviews both husbands and wives participated in making joint budget allocations
Since our hypotheses and the data are at the level of the individual consumer this data should be sufficient for an initial test of the value priority hypotheses How- ever the specific durables and the magnitude of the budgets are not generalizable to the US population because our sample was weighted towards potential luxury car buyers Furthermore our analyses are limited to any extent that luxury car buyers are different in their budgeting processes
Budget Task To obtain budget information we gave consumers a
deck of cards in which each card represented a potential purchase For example these cards included college tuition vacations home improvements major clothing purchases landscaping cameras and accessories fur- niture home fuel savings devices dishwashers color televisions stereo systems jewelry and so on After an extensive pretest we were able to identify 52 items that accounted for most purchases (Consumers were given blank cards for additional purchases)
Consumers first sorted these cards according to whether they (a) now owned the durable (b) would consider purchasing it in the next three years or (c)
would not consider purchasing it in the next three years (Pretests indicated that three years was a reasonable budgeting period) Consumers next considered pile a- currently own-and removed those items they would either replace or supplement by buying an additional unit Finally they selected from pile b-would con-sider-and from the replacementadditional pile those items for which they would specifically budget and plan These items are now their budgetable goods
Consumers then allocated these items to the years 1983 1984 and 1985 and ordered the items according to priority within each year This rank order of items becomes our measure of their budget allocation We estimate utilities with other data described later and attempt to forecast the measured rank-order buying priorities
Explanatory Measures
Obtaining utility measures that can be used to infer value among product categories is a difficult task Al- most every utility measurement procedure of which we are familiar-including conjoint analysis preference regression logit analysis expectancy values and von Neumann-Morgenstern assessment-measures utility within a product category In a series of pre-test mea- surements in 198 1 1982 and 1983 we tried over a dozen different methods including directly scaled (0- 100 scale) points on utility and on value constant sum paired comparisons among items and constant sum allocations among all items We found four mea- sures that appeared to be feasible and that provided meaningful tasks to the consumer These four measures were included in our interviews
None of the four measures was an explicit measure of utility However for each consumer measure we use the value priority hypotheses to infer relationships among utilities Details as well as strengths and weak- nesses of the measures are given in the estimation sec- tion below The measures were
Reservation Pricc~ The consumer was asked to specify the minimum price at which he she o r they would no longer purchase the durable
Purchase Probabi1itv The consumer was asked to esti- mate the probability that he she or they would actually purchase the durable in the period of interest (0 to 10 Juster scale see Juster 1966)
Lottery Order The consumer was asked t o imagine that he she or they had won a lottery and would be allowed to select a prize They were then to rank the durable allocated to each year in the order corresponding to the order in which he she or they would choose a prize in the lottery Note that this ordering will usually be dif- ferent than the budget allocation ordering because price is not to be considered in this task
Combination Lottery Prizes The consumer was again told that he she or they had won a lottery but this time
the task was to choose among two pairs of prizes For example the consumer(s) might be asked to choose among receiving either (a) the first and fourth ranked prize or (b) the second and third ranked prize Consum- ers were asked up to eight such pairs or combinations for each budget year
Example Respondent Table 1 lists the actual data obtained from one re-
spondent This respondent a 30-year-old married woman with three children and a $35000 per year fam- ily income has six durable goods in her 1985 budget For example she expects to purchase a $5000 auto- mobile with a probability of 070 This durable good is ranked first in the lottery prize question and has a res- ervation price of $10000 If price were not an issue she would rather have the automobile plus a freezer than paid tuition plus a vacation There are three tables such as Table 1 for each respondent one for each year
ESTIMATION CONVERGENT LINEAR PROGRAMMING
Each of the measures in Table 1 provides information about utility values but none is a direct measure of utility For example the purchase probability might be a nonlinear function of utility and of A while the lottery order and combination lottery prizes provide only rank- order information about utility
Because two data types-lottery orders and combi- nation lottery prizes-are rank-order relationships and because the other data types are continuous and non- linear traditional methods based on continuous linear relationships may not be appropriate or at least must be modified We present in this section a modified linear programming (LP) procedure that can incorporate rank- order and continuous data types in a single convergent estimation procedure A later section will present an alternative estimation procedure that uses covariance analysis (LISREL V) In that section the relative pre- dictive capabilities of the two procedures are examined and the convergent indications about our hypotheses are discussed
The Basic Idea The idea behind convergent LP estimation is quite
simple Each datum implies a relationship either among various utility values or between a utility value and the datum The relationship varies by data type Our goal is to select utility values such that all relationships are satisfied However in the presence of measurement er- ror and approximation error it is unlikely that we will be able to satisfy all relationships simultaneously Thus for each datum-say a lottery prize answer-we may be able to satisfy the relationship only approximately The amount by which we cannot satisfy the relationship we call error Thus we choose utility values to min-
THE JOURNAL OF CONSUMER RESEARCH
TABLE 1
DATA FROM EXAMPLE RESPONDENT
Durable Price Reservation Purchase
($1 price ($) probability Lottery order
Automobile 5000 10000 70 1 Furniture 2000 4000 60 2 Tuition 2000 5000 99 3 Movie camera 500 1000 60 4 Vacation 1000 1500 70 5 Freezer 300 500 50 6
Combination lottery prizes
1 Automobile Freezer gt Tuition Vacation 2 Automobile Vacation gt Tuition Camera 3 Tuition Vacation gt Furniture Freezer 4Tuition Freezer gt Camera Vacation 5Freezer Vacation gt Camera 6Tuition gt Camera Freezer 7Tuition Freezer gt Furniture
NOTE gt symbolizes preferred to
imize a weighted sum of errors where the weights (cho- sen by the analyst) allow us to put a different emphasis on different data types This minimization of errors can be accomplished with a linear program The objective function is the weighted sum of errors and the con- straints are the relationships implied by each datum In general terms this is ( L P ~ ) ~
minimize WT (errors based on reservation price answers)
+W(errors based on purchase probability answers)
+WT (errors based on lottery order answers)
+U (errors based on combination lottery prize answers)
subject to relationships implied by the value priority (or net value priority) model We now illustrate the spe- cific mathematical relationships
Reservation Price Relationships The reservation price is the price at which the durable
good leaves the budget Thus if r and u are the res- ervation price and utility of the jthitem then the value priority hypothesis implies
uJrJ= h (1)
51t is useful to distinguish between the mathematical programs MPI MP2 and MP3 which are the consumers budget problems and the linear program LPI which is the analysts estimation prob- lem
VALUE PRIORITY HYPOTHESES
because at the reservation price the jthitem falls just below the budget cutoff A To include Equation 1 as a relationship in LP l we define errors based on reser- vation price answers as the absolute value of the dif- ference between ur and A that is lurj - XI In linear programming mathematics this becomes
errors based on reservation price answers = e + e (2)
To assure a consistent scale of errors across data types in LPI we multiply through by r The constraint re- lationships become
Equations 2 and 3 are the standard LP formulation for minimizing absolute error (see eg Gass 1969 p 320) If values for u and X are estimated and ur exceeds A only e$ will take on a positive value because minimi- zation of Equation 2 in LPI forces e to zero If X ex-ceeds ujrj only e will be positive
Since the LP seeks to minimize e + e and since it can simultaneously set uj and A one trivial solution is to set all variables equal to zero We avoid this problem by recognizing that utility and hence X are ratio scales and are thus unique to a positive constant Thus we can set one utility value or A arbitrarily In our for- mulations we set X = 1 thus scaling everything relative to X When X = 1 the net value priority hypothesis implies 14 - Xr = u - r = 0 which implies the same constraint as Equation 3 above This is consistent with the complementary slackness theorem and the inter- pretation of MP2 and MP3 The duality theorem im plies that at optimum for a given B the items in the budget as implied by the optimal solution are the same However the priority order predicted by value and net value may be quite different This will be discussed in a later section
Purchase Probability Relationships
The purchase probability is the consumers estimate of the probability that the durable good will actually be purchased in the budget period It is based on the utility and price of the durable good but also upon unobserved events that make the purchase more or less favorable If these unobserved events represent observation error then according to the value priority model the proba- bility of purchasing good j is given by
L = Prob upJ + error gt A) (4)
That is the likelihood of purchase (L)is the probability that the value (up) is greater than the budget constraint (A) after adjusting for error If we multiply through the p to assure consistent scaling in LP l and assume that the resulting observation error is distributed with a
double exponential probability distribution then Equation 4 becomes the logit model shown in Equation 5 where (3 is a parameter to be estimated
For the derivation see McFadden 1974 Equation 5 can be linearized by dividing through by (1 - Lj) and taking logarithms
Finally we again use the standard LP formulation for minimizing absolute error to obtain the objective function and constraint relationships for purchase probability For the criterion function in LPl
errors based on purchase probability answers = ec + e (6)
and the associated constraint is
u - (P-)log [Ll(l - L)]- e i + e = XP
In these equations L and p are observed and u (3 efi and e are variables As before we establish the scale by setting X = 1 and as before constraint 7 also esti- mates utilities for the net value priority hypothesis
Lottery Orders
The lottery order is a ranking of the durable goods according to their usefulness or desirability to the con- sumer As such the lottery order implies a rank order on the magnitude of the utilities For example if ul is the utility of the first ranked durable uZ is the utility of the second ranked durable and so on then the lottery orders imply
U I gt u2 (8)
uz gt u3 etc
The reader will notice that this data and the constraints implied by Equation 8 are similar to the LP conjoint analysis algorithm LINMAP as proposed by Srinivasan and Shocker (1973) The only difference is that we are interested in the utilities of alternative durable goods whereas Srinivasan and Shocker were interested in the utilities of factorial combinations of product charac-teristics
Following similar methods we count errors only when the inequality relationships are violated that is
lottery order error = ( 1 - 6k)ek + (6k)ek (9)
where if j is preferred to k
= 1 6k
0 if k is preferred to j
-- --
THE JOURNAL OF CONSUMER RESEARCH
In Equations 9 and 10 the (0 1) variable dJk is the answer to the lottery order question that tells us which product is preferred as a prize in the lottery Because the relationship is specified directly in terms of utility Equations 9 and 10 apply for both the value priority and net value priority hypotheses Unlike Srinivasan and Shocker (1973) we need not worry about the scaling of the utilities because the scaling is already established by the constraints associated with the reservation price andor purchase probability data6
Combination Lottery Prizes The combination lottery prize questions imply rank-
order relationships among pairs of utilities For ex-ample if the combination of goods 1 and 4 is preferred to the combination of goods 2 and 3 then
Objective functions for the paired comparison lottery error
(1 - d m k h + (arn)eFrn (12)
and formal constraints similar to 10 can be established for each combination lottery question m For ease of exposition we do not repeat them here
Summary The estimation LP is now to minimize the weighted
sum of errors given by Equations LPl 2 6 9 and 12 subject to the constraints of 3 7 10 and 11 For ex- ample for the six durable goods in Table 1 there are six reservation price relationships six probablity rela- tionships five lottery order relationships and seven combination lottery prize relationships totalling 24 constraints and 24 independent errors in the objective function Because of the complementary slackness and duality theorems LPl applies for both the value priority and the net value priority hypotheses
PREDICTING BUDGET PLANS The data on reservation prices purchase probabili-
ties lottery orders and combination lottery prizes give us the ability to estimate the utilities of the goods in an individuals or a familys budget If the value priority hypothesis andor the net value priority hypothesis is a reasonable descriptive representation of consumer purchasing behavior then the rank order of value (net value)-that is estimated utility divided by price (minus price)-should provide an estimate of the con- sumers rank-order buying priorities It will not be per- fect due to measurement and approximation errors We
6This implies that either the weight associated with reservation price ( W in LPI) andor with purchase probabilities (W in LPI) must be non-zero to establish scaling in terms of A
TABLE 2
EXAMPLE PREDICTIVE TEST
Actual Utility Value budget
Estimated Price + price priority priority Durable utility (000s) (000s) order order
Automobile 1000 50 20 3 4 Furniture 400 20 20 3 3 Tuition 1027 20 51 1 2 Movie
camera 122 05 25 2 1 Vacation 150 1O 15 5 6 Freezer 030 03 1O 6 5
NOTE Cwrelation of estimate with budget priority Spearman 0 = 087 Kendall i= 069
formulate a predictive test by comparing the estimated utilities (divided by or minus price) to the consumers budget priorities
Our predictive test is a comparison of budget plans as predicted by the value priority hypotheses to budget plans as stated directly by the consumers Because of uncertain and unexpected events such as change in the economy shortage or surplus of raw materials unex- pected raise or bonus loss of employment change of residence and so on actual purchases over the three years may differ from budget plans (Dickson and Wilkie 1978) By comparing predicted plans with actual plans we examine the value priority hypotheses as approxi- mate explanations of how consumers believe they will act We will illustrate our predictive tests in the next section
A different predictive test would compare predicted plans with actual purchases Such a test has the strength of external validity but the weakness of confounding the effect of plans and of unexpected events Since it was not feasible to observe three years of actual pur- chases (and unexpected events) within our research project we must leave such tests to future research
Example Predictive Test Consider the data in Table 1 and suppose we place
equal weight on each data type-that is W = W2= W3 = W4Applying convergent LP estimation provides the estimates of utility shown in the second column of Table 2 Dividing by price (third column) gives the estimates in the fourth column of Table 2 Notice that the esti- mated utilities would predict that this consumer would rank tuition as her first budget priority (value = 5 l) a movie camera as her second budget priority (value = 25) and a freezer as her last budget priority (value = 10)
In comparing the budget priority predicted by the estimated utilities to the budget priority actually ob- served it must be remembered that the observed budget priorities were not used in the estimation Thus the
VALUE PRIORITY HYPOTHESES
TABLE 3
VARYING WEIGHTS ON TYPES OF INPUT DATA FOR EXAMPLE RESPONDENT
Spearman Weighting scheme correlation
Equal weights to all four types 87 Resewation price weighted heavily 31 Purchase probability weighted heavily 82 Lottery order weighted heavily 82 Paired lottery prizes weighted heavily 87
NOTE Weightedheaq means the rebvant weight is 100 timesmore thanothers We~hts are not set equal to zero to maintain scaling as discussed in the text
comparison in Table 2 is a test of predictive ability not of data-fitting ability Comparing rank orders implied by the data in the fifth column to the sixth column of Table 2 we see that the predictions are reasonable but not perfect Tuition and the movie camera are predicted and observed to be the top two items but estimated value predicts tuition as the top priority while the con- sumer feels that the movie camera is her top priority Overall the Spearman rank-order correlation of the predicted rank from utility per dollar (column 5) and the actual rank (column 6) is 087 while the Kendall rank-order correlation is 069
However equal weighting of the data types is not the only choice For example Table 3 indicates the results we obtained by using each data source separately For this consumer it appears that the purchase probabilities lottery orders and paired lottery prizes each alone pro- vides reasonable estimates of budget priorities however in this case reservation price data do not appear to be as good as the other measures In fact if we drop res- ervation prices and use equal weights on the other three data sources we get a higher rank-order correlation- 093-than if we use all four data sources
Testing the net value priority hypothesis proceeds similarly The only difference is that we subtract price (in $000~) from the estimated utility rather than divide by price For example for the automobile the net value criterion is 1000 - 500 = 500 which turns out to be ranked second For equal Ws for this respondent the net value priority hypothesis produces a Spearman rank-order correlation of 054 Thus for this respondent (with equal Ws) the value priority hypothesis appears to predict better than the net value priority hypothesis Unfortunately because the tests are of different hy- potheses rather than of nested hypotheses we cannot be rigorous and state whether this difference is statis- tically significant
We report only the Spearman correlation for ease of exposition Results are similar to Kendalls T This applies for the remainder of the paper
FIGURE A
DISTRIBUTION OF SPEARMAN CORRELATION OF ACTUAL AND PREDICTED BUDGET PRIORITY ORDERS FOR VALUE
PRIORITY HYPOTHESIS
N U M B E R O F
BUDGETS
-100 - 75 -50 -25 OO 25 50 -75 t o to to to t o t o t o t 0
-75 -50 -25 -00 25 50 75 100
S P E A R M A N CORRELATION
Predictive Tests Across Individuals for the Value Priority Hypothesis
Our sample yields 522 potential budgets (1 74 families X 3 years) Sixty budgets ( I 15 percent) had one or more values missing for either an explanatory or a predictive measure These were spread across measures and de- mographics and did not appear to represent a systematic bias in measurement Of the remaining 462 budgets 247 had 0 1 or 2 durables planned Although the value priority (or net value priority) hypothesis applies to such small budgets predictions would be perfect by definition for 0 or 1 items and perfect by chance 50 percent of the time for 2 items in a budget We felt that this would bias our results upward artificially so we restricted our- selves to the more difficult task of predicting the 21 5 budgets which contained at least 3 durables
We applied the predictive tests as illustrated in Tables 1 2 and 3 to each individuals (or familys) budgets in the resulting sample To investigate the relative effec- tiveness of various measures we estimated utilities for each individual (or family) for equal weights ( W = W = W3 = W4) for weighting heavily each data source (as in Table 3) and for weighting heavily combinations of data sources (eg reservation prices and purchase probabilities) Even with todays mainframe computers and efficient LP software it was not feasible compu- tationally to search all possible combinations of Ws
We summarize the data in two ways To examine the value priority and net value priority hypotheses we re- port predictions based on the best set of Ws (from our
Of these annual budgets 84 had three items 54 had four items 35 had five items and 22 had six items The remainder had seven or more items up to a high of 12 items We detected no systematic bias based on the number of items in a budget
THE JOURNAL OF CONSUMER RESEARCH
FIGURE B
DISTRIBUTION OF SPEARMAN CORRELATION OF ACTUAL AND PREDICTED BUDGET PRIORITY ORDERS
FOR NET VALUE HYPOTHESIS N U M B E R
OF BUDGETS
t o t o t o t o t o t o t o t 0 - 75 - 5 0 - 2 5 -OO 25 5 0 75 100
S F E A R M A N C O R R E L A T I O N
limited search as described above) for each individual or family Then to examine the relative merits of each data source we keep the Ws the same for all individuals and families Other means of summarizing the data provide the same qualitative implications and are noted as appropriate
Figure A reports the Spearman correlations of the actual and predicted budget priorities for the value priority hypothesis It is based on the best Ws for each individual (or family) but we use the same weights for all his her or their budgets Overall the value priority hypothesis seems reasonable Despite potential mea- surement error and conservative reporting due to elim- inating the favorable budgets of 0 1 or 2 items roughly 83 percent of the budgets have positive correlations 60 percent have correlations of 050 or better the 35 per- cent have correlations of 075 or better Significance levels are complex (because many ties are possible) vary by budget (the number of items in each budget varies) and do not apply between hypotheses There is no single overall critical value that can be applied to Figure A
Comparison of the Value Priority and Net Value Priority Hypotheses
Figure B reports the Spearman correlations of actual and predicted budget priorities for the net value hy- pothesis The net value priority hypothesis also appears to be a reasonable description of consumer purchasing behavior Roughly 9 1 percent of the budgets have pos- itive correlations 84 percent have correlations of 050 or better and 5 1 percent have correlations of 075 or better The net value hypothesis appears to do somewhat better than the value hypothesis
TABLE 4
COMPARISON OF VALUE PRIORITY AND NET VALUE PRIORITY HYPOTHESES
Budgets
Value priority Net value priority Weighting scheme predicts best predicts best
Number of budgets 56 122 Average number of
productsbudget 457 461 Average number of
autoslbudget 048 036 Average price of
products in budget $3278 $3635
Average reservation price of product in budget $4232 $4349
Average age 437 441 Average income $36200 $36300
Examining consumer by consumer the Spearman correlations of actual and predicted budget plans 122 budgets (57 percent) were predicted better by net value priority 56 budgets (26 percent) were predicted better by value priority and 37 budgets (1 7 percent) were pre- dicted equally well by both As Table 4 suggests we found no significant demographic differences that sug- gest when one hypothesis predicts better than the other
In summary both hypotheses do well neither is re- jected and both are retained for future empirical testing Although net value priority does better in our tests the issue is very complex because of the theoretical inter- relationships among the hypotheses (through the duality theorem) We will interpret our results in light of these interrelationships in a later section
Variation Across Alternative Weightings of Data Types
Figure C reports distributions of Spearman correla- tion of actual and predicted budget priority orders for each of the data sources For example if we make W much larger than W2 W3 and W4 we emphasize res- ervation prices as the primary data source as in panel
The Figure C results are based on weights that do not vary across individual families Overall predictions based on reservation prices do better than random (67 percent are positive) but not nearly as well as they did in Figure B This is not surprising because reservation price is a complex concept for many consumers causing the quality of data to vary across consumers Our ex- ample respondent appears to have understood the con-
We report the results for net value priority here Results for value priority are qualitatively the same and in about the same relationship as summarized by Figures A and B
5 0
VALUE PRIORITY HYPOTHESES
FIGURE C
DISTRIBUTIONS OF SPEARMAN CORRELATION OF ACTUAL AND PREDICTED BUDGET PRIORITY ORDERS FOR FOUR DIFFERENT DATA SOURCES
N U M B E R N U M B E R 0 F OF
B U D G E T S BUDGETS
CORRELATION CORRE L A T I O N 1 2
Prediction based on reservation price Prediction based on purchase probabilities
N U M B E R NUMBER O F OF
BUDGETS BUDGETS
CORR E L A T l O N C O R R E L A T I O N 3 4
Prediction based on lottery order Prediction based on combination lottery prizes
THE JOURNAL OF CONSUMER RESEARCH
cept but other respondents clearly did not For ex- ample some consumers gave a reservation price of $2001 for an item with an expected price of $2000 Other consumers found it hard to imagine the item staying the same as the price rises
Figure C also reports the results for emphasizing data on purchase probabilities lottery orders and combi- nation lottery prize answers Of the data sources pur- chase probabilities are clearly the best indicators of budget priorities (81 percent positive and 60 percent with correlations of 050 or better) Lottery orders and combination lottery prizes (67 percent and 69 percent positive respectively) do about as well as reservation prices Results for combinations of two three and four data sources tend to be in the range of those in Figure C Those results also suggest that of the four data sources purchase probabilities tend to predict budget priorities best l o
Although purchase probability measures appear to be the best indicators of budget priorities Figure B sug- gests that consumers do vary in their abilities to answer any given question format We recommend a conver- gent estimation approach that utilizes all four data sources Convergent linear programming is one such approach we will illustrate another in a later section
Summary of Predictive Tests Based on convergent linear programming estimation
with all four data sources we are able to estimate utility values for durable products which with price forecast well consumers budget orders We feel that this is rea- sonable preliminary evidence that the hypotheses are good first order approximations to consumers pur-chasing ofdurable goods Elaborations of the hypotheses (Appendix A) may improve the approximation and predict better The comparison of value priority and net value priority shows that both criteria predict well consumers budget priorities Net value priority (fo- cusing on the marginal increase in net utility) does better than value priority (focusing on the budget constraint) but the results do vary by individuals andor families We found no systematic reason for the variations but further research may suggest some hypotheses Finally consumers do vary in their ability to respond to complex utility questions suggesting that utility is best measured with multiple questions and with at least one form of convergent estimation
ALTERNATIVE ESTIMATION PROCEDURE LISREL V
Convergent linear programming is one way to in- corporate multiple data sources Its strengths are that it can readily accommodate both ordinal and cardinal
Figure C gives one indication of how well purchase probabilities alone would predict budget plans
FIGURE D
MEASUREMENT MODEL FOR LISREL V ESTIMATION
I 1
ERROR ( S I l RESERVATION P R I C E
I TRANSFORMED 1 ERROR PURCHASE
U T I L I T Y
LOTTERY ERROR O R D E R S
ERROR (84) COMBINATION P R I Z E S
NOTE Data sources (boxes) are indicators of the unobservable utllity values (arcle)
measures and that the theoretical relationships sug- gested by the value priority hypotheses can be repre- sented exactlv within the structure Furthermore it is readily applied on a consumer-by-consumer basis to identify potential heterogeneities in response to ques- tion format andor planning Its disadvantages are that (1) the cost of searching all combinations of weights ( Wi W Z W3 and W4) to find a single best fit is pro- hibitive and (2) statistical properties of linear pro- gramming estimation are not well known
There are other estimation procedures that use mul- tiple data sources Each has its relative strengths and weaknesses We select one such estimation procedure to demonstrate that our basic result-the reasonable-ness of the value priority hypotheses-is robust with respect to the estimation procedure The procedure we choose is covariance analysis as implemented by Jo- reskog and Sorboms ( 198 1) LISREL V (see Heise 1975 Duncan 1975 and Bentler and Bonett 1980 for more details on covariance analysis) The advantages of LIS- REL V are that (1) a best set ofweights (in the maximum likelihood sense) can be found for the proper emphasis among data sources and (2) the statistical properties are well known when normality conditions hold The disadvantages are that (1) because LISREL is very sen- sitive to departures from normality (see Joreskog and Sorbom 1981 page I39) it may not do well with our ordinal data or with our transformed probabilities and (2) the estimation is infeasible for small sample sizes as would be the case with individual-by-individual analyses (see Bentler and Bonett 1980 p 591) Since the relative advantages and disadvantages of LISREL V compensate those of convergent linear programming estimation the resulting estimation provides valuable insight into the value priority hypotheses
Basic Estimation Model The LISREL V analysis corresponding to convergent
LP estimation is the measurement model shown in Fig- ure D The data sources (boxes) are indicators of the
- -
VALUE PRIORITY HYPOTHESES
unobservable utility values (circle) thus each measure- ment-say a reservation price-can be thought of as resulting from the unobserved utility value and a mea- surement error (6s in Figure D) The goal of LISREL V is to estimate the correlations (known as factor load- ings) relating the observables to the unobserved utility and then to use the structure to estimate a quantity (known as a factor score) for the unobserved utility We use the theoretical relationships as implied by the value priority hypotheses to specify the appropriate transfor- mations of the raw measurements
Measures Based on the value priority hypotheses the appro-
priate measures are
I Reservation prices as implied by Equation 3 with h = 1
2 Logit transformed probabilities as implied by Equa- tion 7 with h = l We allow the estimation to deter- mine the scaling constant -
3 Lottery orders These orderings are rank-order mea- sures and may violate strict normality assumptions but they are monotonic in utility
4 Combination lottery prizes The rank-order relation- ships implied by Equations 11 and 12 are complex dependent on each individual and interrelated with lottery orders They are not readily handled by the linear equations of LISREL V We use as a surrogate the number of times a durable is chosen from the set of combinations This measure is clearly monotonic in utility Again normality is a concern
Estimation Results The maximum likelihood estimation results are
shown in Table 5 The estimation is based on 932 ob- servations corresponding to the total number of budg- eted items in the 2 15 budgets Overall the measurement model does remarkably well The goodness of fit in- dex-which is independent of sample size and rela- tively robust against departures from normality (Jorgskog and Sorbom 198 1 page 14 1)-suggests that 999 percent of relative covariance is accounted for by the model Even adjusted for degrees of freedom this measure is 989 percent The coefficient of determina- tion for the overall model is 924 percent suggesting high overall reliability of the measurement model The chi-squared value is low-087 indicating that no ad- dition of free parameters would improve the model sig- nificantly
The model in Table 5 accounts for measurement correlation among the rank-order measures as suggested by the corresponding modification index (Joreskog and Sorbom 198 1 p 11119) Without the extra free parameter all coefficients and statistics except the chi- squared (401 with 2 df) are virtually identical to those in Table 5
TABLE 5
ESTIMATION RESULTS FOR LISREL V MEASUREMENT MODEL
Estimated Squared factor Asymptotic correlation
Variable loading t-statistic (reliability)
Reservation price 954 230 911 Transformed probabilities 812 207 660 Lottery orders 293 86 086 Combination prizes I66 49 027
Goodness-of-fit index Adjusted goodness-of-fit
index Coefficient of
determination Root mean square
residual Chi-squared (1degree of freedom)
For the specific measures reservation prices have the highest reliability followed by transformed probabilities Both have excellent asymptotic t-statistics The rank- order measures fare less well with low reliabilities but good t-statistics Normalized residuals (not shown) are reasonable for the cardinal measures but do depart somewhat for the rank-order measures Since the latter is to be expected the t-statistics are acceptable and we desire a comparison with the convergent LP estimation we retain all measures in the model
Predictive Tests Based on the measurement model in Table 5 we use
the LISREL V factor score regressions12 to estimate utility for each durable in each budget We then divide by price to forecast value priorities or subtract price to forecast net value priorities As we did with the linear programming forecasts we compare the LISREL V forecasts to actual consumer budget orders (see Fig- ure E)
The LISREL V predictive results appear comparable to the convergent LP estimates that do not vary by fam- ily 73 percent of the correlations are positive and 55 percent are 050 or better for the value priority hypoth- esis while 71 percent are positive and 54 percent are equal or above 050 for the net value priority hypoth- esis13 These correlations are better than those obtained in Figure C for reservation prices lottery orders or combination prizes as single measures and almost as good as those obtained for purchase probabilities Of course LISREL V does not do as well as the family-
The factor score coefficients are 0805 0180 0026 and 001 5 respectively for the four measures
13The value priority hypothesis does slightly better with LISREL V than does the net value priority hypothesis but this result is prob- ably not significant The best comparison between the hypotheses remains the family-by-family analysis (review Table 4)
THE JOURNAL OF CONSUMER RESEARCH
FIGURE E
DISTRIBUTION OF SPEARMAN CORRELATION OF ACTUAL AND PREDICTED BUDGET PRIORITY ORDERS FOR LISREL MODEL AND TWO DIFFERENT HYPOTHESES
U M B E R OF
UDGETS 7 0 -
--6 0
-50 -
-4 0
-30
720 -
10-
- 10 - 5 0 5 10
CORRELATION 1
Predictions based on value priority hypothesis
by-family estimates in Figures A and B Based on the similarity of the LISREL V predictive results to the convergent LP predictive results we have more confi- dence in our proposition that at least one of the value priority hypotheses is a reasonable first-order model of consumer budget planningI4
DISCUSSION The value priority hypothesis and the net value
priority hypothesis are models of how consumers al- locate their budgets to goods Both hypotheses are de- rived from the standard economic model of maximizing utility subject to a budget constraint However both
14CuriouslyLISREL V selects reservation price as the most reliable measure but the predictive tests in Figure D (a measure of validity) suggest that purchase probabilities may predict better Further re- search might estimate a more complex structural model including the dependent variable in the estimation We did not d o this because we felt it more appropriate to have an independent test of predictive ability that did not use the budget orders in the estimation and be- cause the dependent measure was at best an ordinal measure that clearly causes problems with LISREL V Furthermore our goal is to test the value priority hypotheses not to compare the relative merits of linear programming and LISREL V Finally a full comparison of technique would best be done with multiple measures of the dependent variable in a variety of contexts
NUMBER OF
BUDGETS-7 0
f6 0 -
50--4 0
-30
20 -
10-
-10 - 5 0 5 I o C O R R E L A T I O N
2
Predictions based on net value priority hypothesis
recognize the evidence from a variety of scientific dis- ciplines suggesting that behavior as observed may differ from behavior as prescribed Both hypotheses imply that the consumer (or family) uses a simple heuristic that leads to near-optimal behavior under a wide variety of conditions This heuristic is to rank order durables ac- cording to value (or net value) and purchase items in that order up to and including a budget cutoff The two hypotheses differ only in their derivation of the nu- meraire by which durables are ranked The empirical evidence for the hypotheses presented earlier suggests that both are reasonable we are comfortable with pro- posing both for further testing Figures A and B also suggest that the net value priority hypothesis may be the better predictor However before embracing the net value hypothesis there are a number of cautions worth considering These include the complex interrelation- ship between the two hypotheses the distinction be- tween descriptive and prescriptive theories and the empirical observation of high rank-order correlation between up and u - p all of which are discussed in the following sections
Interrelationships Between the Hypotheses If durables were not discrete then the duality and
complementary slackness theorems would imply that
459 VALUE PRIORITY HYPOTHESES
TABLE 6
AN EXAMPLE BUDGET WITH THREE ITEMS
Utility Price
($000~)
Home improvement Landscaping Food processor
994 657 328
060 030 008
NOTE ui Is the utlllty of Item1 and p 1s the prlce
the optimal solutions to MP2 (value priority) and MP3 (net value priority) are the same This means that for a given budget B and budget cutoff A the two cri- teria-~rp 3 A and zi - Ap gt 0-would yield the same overall budget (This can also be seen by dividing through by p in the net value criterion) This does not mean that the order of planned purchasing-the rank order of zip and 11 - Apl-will be the same
Consider three items-a home improvement land- scaping and a food processor-that are part of the budget of one of our respondents a married 37-year- old male with two children and a $65000 family in- come Follow~ng the convergent linear programming estimation procedure described earlier Table 6 displays the utilities scaled such that A = 1 Net value priority predicts the order as shown the home improvement the landscaping and then the food processor Value prior~ty predicts the reverse order For these three items the respondent actually planned the home improve- ment the landscaping and then the food processor For this consumer net value priority appears to be a better descriptive model (review Table 4 for more gen- eral results)
Assumption of Stable X
The example above does not indicate what would happen if the budget 3the utilities zi or the avail- ability of products changed The value priority criterion zip would not change On the other hand the net value criterion would remain unchanged only if A did not change However A-which equals dzi(y)djgt at the optimum solution to MP3-may change if B or the us change15 If the change were sufficiently dramatic the net value ordering could change Thus the net value priority hypothesis assumes that A or at least the con- sumers perceived A changes slowly This assumption is worth testing
A change in A would affect our scaling convention of X = 1 The utilities are a function of A and may themselves change if we change the budget problem yet restrict h to be 1 O For the comparative forecasts in this paper the budget problem does not change hence the restriction X = 1 is not critical for our predictive tests It could become critical in other situations
utPt Value priority ui - Pi
Net value priority
17 22 41
3 2 1
394 357 248
1 2 3
TABLE 7
REVISED BUDGETS
Budget items Utility Price
Value priority Food processor 328 $80 Convection oven 328 $80 Landscaping 657 $300
Total 1313 $460
Net value priority Home improvement 994 $600
Total 994 $600
Descriptive vs Prescriptive Hypotheses
We stated the value priority and the net value priority hypotheses as descriptive hypotheses They may or may not lead the consumer to the best decisions For ex- ample consider the consumer discussed above and suppose there were another durable-say a tabletop convection oven-with the same utility and price as the food processor Then for $600 of budget allocations the two hypotheses recommend the allocations indi- cated in Table 7 Prescriptively (if our utilities are ac- curate) the consumer would have been better off (more utility and less money) using the value priority than net value priority Such examples are easy to create Indeed if there were no integer constraints on durable pur- chases the value priority algorithm is prescriptively the best algorithm Even with integer constraints it does not do badly and has reasonable worst case propertiesI6 (Cornuejols et al 1977 Fisher 1980) However we can also create examples to favor net value priority over value priority so again we must interpret all prescrip- tive results with caution
I6The theoretical worst case is a factor of two For example with a budget of $1000 and two products of utility 502 and 500 that cost $501 and $500 respectively the optimum is two units of the second product rather than one unit of the first product But if the budget can be relaxed or nondurables purchased this worst case result is mitigated
Correlation The value priority and net value priority hypotheses
have quite different behavioral interpretations How- ever they may be difficult to distinguish from obser- vations of behavior because the two criteria rlJpJ and tiJ - pJ have high rank-order correlations To illustrate this we drew 10000random values of 11 and pJ from a uniform distribution each of five times The resulting linear correlation of log (uJpJ)-which is monotonic in r~p-and uJ - pJ was quite high 087 This suggests an even higher rank-order correlation Because of this correlation we must interpret with caution any empir- ical comparisons of observed budget plans This does not mean the hypotheses are indistinguishable for ex- ample verbal protocols or process-tracing technology may be able to distinguish between the hypotheses In summary the evidence favoring at least one of the hy- potheses as a description of durable purchasing is pos- itive However comparisons between the hlpotheses must be made with caution and subject to further testing
SUMMARY AND IMPLICATIONS Based on our data estimation and predictive tests
and subject to future research we posit that
1 The ranking of goods according to a budget priority appears to be a reasonable descriptorpredictor of consumer budget plans
2 Both value and net value provide reasonable approx- imations to the numeraire by which durables are ranked
3 It is feasible to measure utility across categories if multiple convergent measures are used
4 Convergent LP estimation is feasible provides rea- sonable estimates of utility and appears consistent in predictive ability with LiSREL V
5 Consumers vary in the heuristic numeraire-value or net value-they use for ranking
6 Consumers vary in their ability to answer specific question types
The last postulate is no surprise to the behavioral re- searcher who faces often the difficult task of estimating unobserved constructs It does provide a caution to the market researcher or management analyst faced with
We seek to demonstrate the rank-order correlation of upJ and uJ - p Thus we seek monotonic transformations of either or both variables such that the linear correlation is maximized The logarith- mic transformation is effective and provides a reasonable lower bound on the maximum rank correlation Technically some transformation is necessary because the mean and variance of (uJ pJ )are both infinite when uj and p are independent and identically distributed uniform random variables In addition the logarithmic transformation gives the intuitive interpretation that log (uJ p j )= log u - log p which we expect to be related to u - p
THE JOURNAL OF CONSUMER RESEARCH
limited measurement budgets who wants to forecast durable purchases Convergent measurement is prob- ably necessary
Our value priority hypotheses are a first step in un- derstanding consumer budget planning They are rea- sonable descriptorspredictors of actual budget plans but they do not model explicitly the mental processes leading to utility formation and information processing A useful direction for research would be the investi- gation of information processing theories to explain how consumers form utility judgments and whether value net value or another hypothesis is the best description of how they integrate utility and price to form budget plans Our postulates and analyses raise a number of other researchable issues as well Among these are
1 Two-stage predictive tests comparing predicted plans to actual plans and to actual purchase
2 Predictive tests collecting measures on all evoked goods and predicting which will be in the budget plans
3 Alternative methods such as verbal protocols and process tracing that can distinguish between the value and net value hypotheses without being subject to the bane of high rank-order correlation between hy-potheses
4 Collection of data such as perceived interest rates depreciation rates and operating and maintenance costs that could test a n elaborated model such as that in Appendix A
These are a few of the many unanswered questions that can be addressed in future research
Managerial Implications We close on a practical note The value priority hy-
potheses can be and are useful in forecasting sales in existing durable product classes Once utilities are es- timated for a sample of consumers we can forecast the implications of new products improved products or changes in prices or economic conditions New or im- proved products change utilities and economic con- ditions change the budgets For each consumer we compute the value criterion (or net value criterion if X does not change) and recompute the buying order For example a megabyte personal computer a digital stereoVCR or a mini-van may have high enough value (or net value) to enter the budget of some consumers The percent of consumers who now budget for the new product form is a forecast of its category sales
The measurement system described in this paper has been used at General Motors and has provided valuable managerial insight into which durable goods compete most with luxury automobiles For example Table 8 lists those goods that were ranked above automobiles
For example Lyons (1984) used our data internal intelligence on competitive models and a conjoint analysis to forecast changes in utility
VALUE PRIORITY HYPOTHESES
TABLE 8
DURABLE GOODS COMPETING WITH AUTOMOBILES
Durable Percent
1 School tuition 1983 2 Vacation 1983 3 Home improvement (minor) 4 Major clothing 5 Landscaping 6 School tuition 1984 7 GiftsDonations 8 Cameras and Accessories 9 Furniture
10 Home fuel savings device 11 Home improvement (major) 12 Vacation 1984 13 Dishwasher 14 Color television 15 Stereo system 16 Jewelry 17 House 18 Oven 19 MovieVideo camera 20 Video tape recorder 21 RefrigeratorFreezer 22 School tuition 1985 23 Home computer 24 Vacation 1985
NOTE The percents signify the percentage of budgets in which the indicated item was ranked above an automobile when both the item and an automobile were in the budget
when both were in the budget Recent automobile de- sign and marketing campaigns have been based on budget priority analyses that consider product im-provements or advertised image (less maintenance im- proved comfort and so on) Such changes are designed to increase the utility of an auto purchase and thereby move it up in the buying priority The value priority model is also used to determine if the introduction of a new automobile will improve the position of an au- tomobile purchase in the ordering After having con- sumers drive the new automobile in a clinic environ- ment the new automobiles utility is measured relative to the respondents current first choice automobile to determine if it is higher in the respondents priority or- dering than the previous automobile Application work is continuing to ascertain the managerial usefulness of the value priority hypotheses in managing new and es- tablished durable consumer goods
APPENDIX A Multiple Period Hypotheses
The value priority hypothesis and the net value priority hypothesis are readily extendable The equa- tions for the value priority hypothesis were derived in Hauser and Urban (1982) We restate them here in con- densed form and indicate how they apply to the net value priority hypothesis
Let ti be the utility of the r t h item of the jthgood p be the expected price of that good at time f cS be a
zero-one indicator of whether the ithitems of good J is purchased Note 6 gt 0 only if 6 1 - 1 = 1 Let u(y) be the utility of spending y on nondurables in time t Let B be the consumers budget constraint in time t Dbe hisher debt in time t and b be the amount borrowed (saved) in that period Let d be the depreciation rate for good J and r be the interest rate Let c be the op- erating and maintenance cost of durable j n periods after purchase The consumers problem (MP4) is as follows Maximize
T T-1 r C C C I C + C 14 ( ~ 1 )C f J 9 ~ ~ J l ~ J l I
r = l J r q=O I = 1
subject to T-1
pJt(C 61) + C cJJJtt+ )- h~ BI J n= l
Dl = Dl-(I + r ) + b DT=O forallt
6i = 0 1 6Ji = 1 iff 6 = 1 and s gt t
The value priority criterion for the LP relaxation of the integer constraints now becomes
T- I T- 1
Z ( J ~ [C(1 + riT-I[P~+ C ~ j n l - (Al ) q=O n= l
Finally trade-ins are handled by computing net depre- ciated utility gain divided by net price and pairwise complementarity is added with hierarchical dependence of u on another good k For the net value hypothesis the criterion is (numerator of A 1) - p (denominator of A l ) where p is the simplex multiplier of the debt con- straint D = 0
APPENDIX B Dual Linear Program Non-Technical
Summary 4n important concept in linear programming is that
for every linear program there is a related dual linear program The variables of the dual are known as simplex multipliers or shadow prices Each variable of the dual corresponds to a constraint in the original linear pro- gram and represents the sensitivity of relaxing the constraint-ie the amount by which the objective function would change if that constraint were relaxed If the original linear program is a maximization prob- lem then the dual program has as its objective the min- imization of a weighted sum of the dual variables The weights are the constants in the constraints of the orig- inal linear program The constraints of the dual are based on the constraints and objective function of the original linear program For example
Original Dual-max clxi + c2x2 min btul + b2u2 subject to al lxlt a12x2--i 61 st al lul+ a 2 1 ~ 22 cl
~ 2 ~ x 1+ ~ ~ 2 x 2--i b2 2 c2alzui+ a2~u2 X l X ~ 2 0 u u2gt0
Note tha t m corresponds to the first constraint in t he original program a n d represents t he value o f relaxing tha t constraint
T h e duality theorem states the amazing result tha t t h e optimal values of the object functions of t he two linear programs are identical Complementary slackness states tha t if a dua l variable has a non-zero value in the optimal solution t o t he dual t hen t h e corresponding constraint in t he original program must be binding and vice versa Fo r a more complete and technical exposi- t ion see Gass (1969) o r a n y l inear programming text Note tha t the dua l of t he dua l is t he original l inear pro- gram
[Received March 1985 Revised October 19851
REFERENCES
Bentler Peter M and Douglas G Bonett (1980) Significance Tests and Goodness of Fit in the Analysis of Covariance Structures Psychological Bulletin 88 (3) 588-606
Bertan Jenny and John R Hauser (1982) Auto Show Focus Groups Technical Report to General Motors MIT Cambridge MA January
Bettman James R (1979) An Information Processing Theory of Consumer Choice Reading MA Addison-Wesley
Blackorby Charles Daniel Primont and R Robert Russell (1 975) Budgeting Decentralization and Aggregation Annals ofEconomic Social Measurement 4 ( I ) 23-44
Brown DA SF Buck and FG Pyatt (1965) Improving the Sales Forecast for Consumer Durables Journal of Marketing Research 2 (August) 229-234
Clarke Yvonne and Geoffrey N Soutar (1982) Consumer Acquisition Patterns for Durable Goods Australian Ev- idence Journal of Consumer Research 8 (March) 456- 459
Cornuejols Gerald Marshall L Fisher and George L Nem- hauser (1977) Location of Bank Accounts to Optimize Float An Analytic Study of Exact and Approximate Al- gorithms hfanagement Science 23 (April) 789-8 10
Dickson Peter R Robert F Lusch and William L Wilkie (1 983) Consumer Acquisition Priorities for Home Ap- pliances A Reproduction and Re-evaluation Journal of Consumer Research 9 (March) 432-435
and William L Wilkie (1978) The Consumption of Household Durables A Behavioral Review Marketing Science Institute Working Paper Series Cambridge MA December
Duncan Otis D (1975) Introduction to Structural Equation Models New York Academic Press
Fisher Marshall (1980) Worst Case Analysis of Heuristic Algorithms Management Science 26 (January) 1 -17
Gass Saul 1 (1969) Linear Programming Methods and Ap- plications 3rd Edition New York McGraw-Hill
Green Paul E and V Srinivasan (1978) Conjoint Analysis in Consumer Research Issues and Outlook Journal of Consumer Research 5 (September) 103- 123
Hauser John R and Frank S Koppelman (l979) Alter- native Perceptual Mapping Techniques Relative Ac- curacy and Usefulness Journal ofltfarketing Research 16 (November) 495-506
John H Roberts and Glen L Urban (1983) Fore-
THE JOURNAL OF CONSUMER RESEARCH
casting Sales of a New Consumer Durable in Advances and Practices of Marketing Science ed F S Zufryden Providence RI The Institute of Management Sciences 115-128
and Glen L Urban (1982) Prelaunch Forecasting of New Consumer Durables Ideas on a Consumer Value- Priority Model in Analytic Approaches to Product and tfarketing Planning The Second Confirence ed Raj K Srivastava and Allan D Shocker Cambridge MA Mar- keting Science Institute 276-296
Heiner Ronald A (1983) The Origin of Predictable Be- havior American Economic Review 73 (September) 560-595
Heise David R (1975) Caltsal Analjsis New York John Wiley
Johnson Eric J and Amos Tversky (1983) Affect Gener- alization and the Perception of Risk Journal of Per- sonulily and Social Psychology 45 ( I) 20-3 1
Joreskog Karl G and Dag Sorbom (198 I) LISREL Anabois of Linear Structural Relationships by the Method of hfaximum Likelihood version V Chicago IL National Educational Resources
Juster F Thomas (1 966) Consumer Buying Intentions and Purchase Probability An Experiment in Survey Design Journal of the American Statistical Association 6 1 658- 696
Kasuiis Jack J Robert F Lusch and Edward F Stafford Jr (1979) Consumer Acquisition Patterns for Durable Goods Journal o f Consumer Research 6 (June) 47- 57
Keon John W (1980) The Bargain Value Model and a Comparison of Managerial Implications with the Linear Learning Model hlanagement Science 26 (November) 11 17-1 130
Lyons Larry (1 984) Forecasting the Impact of Competitive Entries on the Sales of a New Consumer Durable SM Thesis Sloan School of Management MIT Cam-bridge MA 02 139
McFadden David (1974) Conditional Logit Analysis of Qualitative Choice Behavior in Frontiers of Econo-metrics ed P Zarembka New York Academic Press
Paroush Jacob (1965) The Order of Acquisition of Con- sumer Durables Econometrica 33 (January) 225-235
Rosen Sherwin (1 974) Hedonic Prices and Implicit Mar- kets Product Differentiation in Pure Competition Journal qf Political Economy 82 ( ~ a n u a r ~ l ~ e b r u a r ~ ) 34-55
Shugan Steve M (1980) The Cost of Thinking Journal of Consumer Research 7 (September) 99- 1 1 1
Srinivasan V (1982) Comments on the Role of Price in Individual Utility Judgments in Choice Models for Buyer Behavior ed Leigh McAlister Greenwich CT JAI Press
and Allan D Shocker (1973) Linear Programming Techniques for Multi-Dimensional Analysis of Prefer- ence Psychometrika 38 (September) 337-370
Sternthal Brian and C Sam Craig (1 982) Consumer Behav- ior 4n Infornlation Processing Perspective Englewood Cliffs NJ Prentice-Hall
Tverskey Amos and Daniel Kahneman (1974) Judgment Under Uncertainty Heuristics and Biases Science 185 1124-1 131
Urban Glen L and John R Hauser (1980) Design and ampfar- keting o f~Yew Products Englewood Cliffs NJ Prentice- Hall
You have printed the following article
The Value Priority Hypotheses for Consumer Budget PlansJohn R Hauser Glen L UrbanThe Journal of Consumer Research Vol 12 No 4 (Mar 1986) pp 446-462Stable URL
httplinksjstororgsicisici=0093-53012819860329123A43C4463ATVPHFC3E20CO3B2-J
This article references the following linked citations If you are trying to access articles from anoff-campus location you may be required to first logon via your library web site to access JSTOR Pleasevisit your librarys website or contact a librarian to learn about options for remote access to JSTOR
References
Improving the Sales Forecast for Consumer DurablesD A Brown S F Buck F G PyattJournal of Marketing Research Vol 2 No 3 (Aug 1965) pp 229-234Stable URL
httplinksjstororgsicisici=0022-2437281965082923A33C2293AITSFFC3E20CO3B2-O
Consumer Acquisition Patterns for Durable Goods Australian EvidenceYvonne Clarke Geoffrey N SoutarThe Journal of Consumer Research Vol 8 No 4 (Mar 1982) pp 456-460Stable URL
httplinksjstororgsicisici=0093-5301281982032983A43C4563ACAPFDG3E20CO3B2-T
Location of Bank Accounts to Optimize Float An Analytic Study of Exact and ApproximateAlgorithmsGerard Cornuejols Marshall L Fisher George L NemhauserManagement Science Vol 23 No 8 (Apr 1977) pp 789-810Stable URL
httplinksjstororgsicisici=0025-19092819770429233A83C7893ALOBATO3E20CO3B2-1
Consumer Acquisition Priorities for Home Appliances A Replication and Re-evaluationPeter R Dickson Robert F Lusch William L WilkieThe Journal of Consumer Research Vol 9 No 4 (Mar 1983) pp 432-435Stable URL
httplinksjstororgsicisici=0093-5301281983032993A43C4323ACAPFHA3E20CO3B2-E
httpwwwjstororg
LINKED CITATIONS- Page 1 of 3 -
Worst-Case Analysis of Heuristic AlgorithmsMarshall L FisherManagement Science Vol 26 No 1 (Jan 1980) pp 1-17Stable URL
httplinksjstororgsicisici=0025-19092819800129263A13C13AWAOHA3E20CO3B2-4
Conjoint Analysis in Consumer Research Issues and OutlookPaul E Green V SrinivasanThe Journal of Consumer Research Vol 5 No 2 (Sep 1978) pp 103-123Stable URL
httplinksjstororgsicisici=0093-5301281978092953A23C1033ACAICRI3E20CO3B2-5
Alternative Perceptual Mapping Techniques Relative Accuracy and UsefulnessJohn R Hauser Frank S KoppelmanJournal of Marketing Research Vol 16 No 4 (Nov 1979) pp 495-506Stable URL
httplinksjstororgsicisici=0022-24372819791129163A43C4953AAPMTRA3E20CO3B2-23
The Origin of Predictable BehaviorRonald A HeinerThe American Economic Review Vol 73 No 4 (Sep 1983) pp 560-595Stable URL
httplinksjstororgsicisici=0002-82822819830929733A43C5603ATOOPB3E20CO3B2-R
Consumer Buying Intentions and Purchase Probability An Experiment in Survey DesignF Thomas JusterJournal of the American Statistical Association Vol 61 No 315 (Sep 1966) pp 658-696Stable URL
httplinksjstororgsicisici=0162-14592819660929613A3153C6583ACBIAPP3E20CO3B2-M
Consumer Acquistion Patterns for Durable GoodsJack J Kasulis Robert F Lusch Edward F Stafford JrThe Journal of Consumer Research Vol 6 No 1 (Jun 1979) pp 47-57Stable URL
httplinksjstororgsicisici=0093-5301281979062963A13C473ACAPFDG3E20CO3B2-S
httpwwwjstororg
LINKED CITATIONS- Page 2 of 3 -
The Bargain Value Model and a Comparison of Managerial Implications with the LinearLearning ModelJohn W KeonManagement Science Vol 26 No 11 (Nov 1980) pp 1117-1130Stable URL
httplinksjstororgsicisici=0025-19092819801129263A113C11173ATBVMAA3E20CO3B2-G
The Order of Acquisition of Consumer DurablesJacob ParoushEconometrica Vol 33 No 1 (Jan 1965) pp 225-235Stable URL
httplinksjstororgsicisici=0012-96822819650129333A13C2253ATOOAOC3E20CO3B2-3
Hedonic Prices and Implicit Markets Product Differentiation in Pure CompetitionSherwin RosenThe Journal of Political Economy Vol 82 No 1 (Jan - Feb 1974) pp 34-55Stable URL
httplinksjstororgsicisici=0022-3808281974012F0229823A13C343AHPAIMP3E20CO3B2-U
The Cost of ThinkingSteven M ShuganThe Journal of Consumer Research Vol 7 No 2 (Sep 1980) pp 99-111Stable URL
httplinksjstororgsicisici=0093-5301281980092973A23C993ATCOT3E20CO3B2-J
httpwwwjstororg
LINKED CITATIONS- Page 3 of 3 -
VALUE PRIORITY HYPOTHESES
automobile) but it can be any integer (eg purchase two color televisions) Following standard economic theory (eg Rosen 1974) let y be a summary of the consumers allocation to other goods (eg $5000 to household products) and let B be the consumers budget Let U ( ) be the consumers utility function and let pJ be the price she expects to pay for durable good j Then the consumers decision prob-lem is represented mathematically as
maximize U ( g l g2 g3 gnY ) (MPI)
subject to plgl + p g 2 + + pgn + y lt B
MPl is the standard microeconomic consumer be-havior model Depending upon the functional form of the utility function the solution to MPl can involve complex nonlinear searches of all possible combinations of goods purchases Exact solution of MP 1 may be dif-ficult for even the most advanced mathematical pro-gramming computer algorithms thus it is unlikely that consumers solve MPl in its full complexity for everyday purchase decisions
Various scientific disciplines including new economic theory (Heiner 1983) information processing theory (Sternthal and Craig 1982 Bettman 1979) social psy-chology (Johnson and Tversky 1983) mathematical psychology (Tversky and Kahneman 1974) and mar-keting science (Shugan 1980) suggest modifications to MP1 A variety of authors propose the simpler model that consumers establish and follow a buying order for durables See for example Brown Buck and Pyatt (1965) Clarke and Soutar (1982) Dickson Lusch and Wilkie (1983) Kasulis Lusch and Stafford (1979) and Paroush (1965)
Such a prioritized buying order is consistent with a modified MP 1 Suppose that the consumer can assign to each good a marginal utility u that represents the amount of utility she gets from possessing that durable good (We assume that 11 can be ratio scaled) If the consumer considers more than one unit of the durable good we assign values u u etc to the first second etc units of good j wlth the usual assumption that u gt uj2 etc However to simplify exposition we temporarily assume that g is at most one item This is not a restriction in the theory2MPl now becomes MP2
Technically this is an assumption of separability (Blackorby Pri-mont and Russell 1975) Separability is a common assumption in economic modeling because it makes the general process (MP1) fea-sible to model This becomes important when as in this paper we also seek an empirical realization of the model In theory one could include complementarity by making one utility u a function of which other goods are purchased eg u = u (gkfor all k f j) Of course for any practical problem the general function u()must be simplified to say painvise complementarity For example in Ap-pendix A Equation A 1 uj could be a function of previous purchases We leave such extensions for future research
If we allow gj to be any integer MP2 becomes max Z ~k ~ k 6 ~
+ u(y) st CJ ZkpJ6jk + y lt B where 6k = I iff g gt k Alternatively we can redefine goods such that the k + 1 item of good j has a different index than the kth item See also Appendix A
maximize ulgl + u g 2 + + urgn + uAy) (MP2) subject to pgl + p2g2 + + pngn+ y G B
where uy(y)is the marginal utility of allocating y dollars to nondurables
MP2 is now a mathematical programming problem called the knapsack problem If the g were not re-stricted to be discrete-that is if you could buy a frac-tional automobile-its solution (called the greedy al-gorithm) is well known (eg Gass 1969 p 204) allocate the budget to goods in order of uJpJas long as uJp is greater than the budget cutoff X = auy(y)ayevaluated at the budget ~ o n s t r a i n t ~Even when purchases are re-stricted to be discrete greedy algorithms are excellent heuristics (Cornuejols Fisher and Nemhauser 1977 Fisher 1980)
The greedy algorithm is simple yet it provides an excellent approximation to the optimization of MP2 across a variety of situations We posit that this heuristic provides a reasonable approximation to describe con-sumer purchasing behavior There is a simple behavioral interpretation of the mathematical result that the cri-terion uJpJof utility per dollar is a measure of value Thus we call our proposition the value priority hy-pothesis
Value Priority Hypothesis The consumer purchases du-rable goods in order of value as long as their value is above some cutoff A which represents the value of spending a n additional dollar on nondurable goods Furthermore value is measured by utility per dollar
For example suppose a consumer is considering a microwave oven a video cassette recorder an auto-mobile a personal computer a snow blower and home improvements She would consider the pleasure and usefulness-ie utility-obtained from owning the best choice from each category consider the price of the best choice and rank them according to value as shown below
Microwave oven Video cassette recorder Automobile
Budget constraint (A) Personal computer Snow blower Home improvements
The consumer would purchase first the microwave oven (and some nondurables up to ~microwavel~micr~w~ve)then the video cassette recorder then the automobile At this point she would find that the three durables (plus the
athematically X is a complex function of all the variables of the problem For our purposes we need not evaluate it we need only that it exists For a given set of utilities it is quite easy to construct an algorithm that finds X by iteratively allocating the budget between durables and nondurables according to maximum up or au(y)dy Alternatively we can scale all utilities relative to A
corresponding nondurables) exhaust hisher budget If she were to borrow or otherwise obtain additional funds the next durable she would purchase would be a personal computer
Of course actual purchasing behavior is more com- plex depending upon unexpected events as well as planning (eg Dickson and Wilkie 1978) but we feel that the value priority hypothesis is a good first order explanation It has roots in the econometric (Paroush 1965) and management science (Keon 1980) literatures and is consistent with small-sample exploratory focus- group semantics (Bertan and Hauser 1982) such as you get what you pay for I want my moneys worth good value for the money spent I want the most car for my money when you buy a car you shop value and so on
Appendix A shows that the value priority hypothesis extends beyond the simple single period model For ex- ample in a multiperiod problem with borrowing (sav- ing) and depreciation the value becomes the depre- ciated time stream of utility divided by the price in cur- rent dollars Operating costs become an addition to price discounted over time replacements (trade-ins) are incorporated by computing net utility gain and net price and complementarity is approximated by first or- der dependence The budget constraints for each period are related by interest rates
ANOTHER VIEWPOINT NET VALUE PRIORITY
There are two components to the value priority hy- pothesis the ordering by value and the means by which value is computed In the previous section we treated value as utility per dollar but in brand choice price is often treated as an attribute For example models using conjoint analysis (Green and Srinivasan 1978) percep- tual mapping (Hauser and Koppelman 1979) and logit analysis (McFadden 1974) have all included price as another (linear) explanatory variable Srinivasan ( 1982) argues that this is a good representation if we recognize that the criterion u - Xp is the Lagrangian solution to MP2 when the problem is one of brand choice where one and only one good is chosen He then argues that u - Xp may be a more robust representation than uJ p when price itself carries utility such as in conspicuous consumption or when perceptions of quality are based on price
Thus a variation of the value priority hypothesis is that consumers order durable goods by net value where net value is the surplus of utility over price that is 11
- Xp The net value priority hypothesis can be derived by examining the dual program to the mathematical program MP2 (For those readers unfamiliar with dual linear programs see Gass 1969 or Appendix B) Let X continue to be the dual variable of the budget constraint and let y be the dual variables associated with the im-
THE JOURNAL OF CONSUMER RESEARCH
plicit constraints of gj lt 104 Then the dual program is (Gass 1969 p 90)
minimize
Xp + y uj for all jsubject to
X = y)dy at optimum
By the duality theorem of linear programming (Gass 1969 p 90) the solution of MP3 equals the solution of MP2 when purchases of fractional goods are allowed Rearranging the constraints of MP3 we get y 3 u - Xpj If fractional goods are allowed the complemen- tary slackness theorem applies (Gass 1969 p 99) By this theorem y = u - Xp is greater than zero in the solution to MP3 if and only if g = 1 in the solution to MP2 Also y equals zero if and only if gj lt 1
We obtain a behavioral interpretation of MP3 by recognizing that the simplex multiplier y is the shadow price of the constraint g lt 1 That is y is the value at the margin to the consumer of buying more of durable j or the value of relaxing the constraint that durables are discrete Complementary slackness says that net value 11 - Xp is greater than zero if and only if a good is purchased Net value is less than (or equal to) zero if less than one unit of a good is purchased
Together MP2 and MP3 suggest the behavioral in- terpretation that net value is the appropriate criterion if the consumer focuses on the marginal benefit of pur- chasing more of a given durable value (utility per dollar) is the appropriate criterion if the consumer focuses on his or her overall budget allocation problem Both are reasonable theoretical descriptive hypotheses Empirical data will shed further light on both hypotheses
In summary value priority and net value priority are two reasonable hypotheses about consumer durable purchasing Both are derived by assuming that the con- sumer uses an heuristic decision rule to maximize utility subject to a budget constraint and implicit constraints that fractional items are not available Both imply that a consumer will order his or her durable purchasing (within budget) according to a simple criterion based on value The two hypotheses differ in how this criterion is computed Value priority focuses on the budget con- straint and postulates a criterion of utility per dollar Net value priority focuses on the marginal value of the next purchase and postulates a criterion of net value gained We now examine data on both hypotheses
DATA The value priority and net value priority hypotheses
are formulated for decision making units such as in- dividuals or families To test their implications one re- quires data on budget allocations of individual decision
4We can extend this to any integer value for g by the techniques of Footnote 2
VALUE PRIORITY HYPOTHESES
making units In March 1983 we were given the op- portunity to apply and test our hypotheses An Amer- ican automobile manufacturer planned to introduce a new automobile in the Spring of 1984 and among other things wanted to know with which durable products the automobile would compete The new automobile was a luxury model for upscale consumers hence competition from vacations second homes pools boats and college tuition was a management concern
The data collection was part of an ongoing project The questioning procedure about to be described is based on focus groups in Boston Massachusetts and Troy Michigan in June 1982 automobile-show inter- views in Boston Massachusetts in November 1981 1982 and 1983 a pretest (30 consumers) in Troy Michigan in June 1982 a mini-test (40 consumers) in Phoenix Arizona in January 1983 and a series of in- formal tests throughout the period Throughout these tests the questioning procedure evolved to represent reasonable tradeoffs among measurement of the hy- pothesized concepts and feasibility of measurement
The consumer tasks were administered with trained and experienced professional interviewers The con- sumer tasks took approximately 50 minutes and were the opening part of a larger two-hour interview in which respondents were paid $25 for their time (see Hauser Roberts and Urban 1983 for details on the full inter- blew) The 174 respondents were chosen at random from the Cincinnati Ohio area but in proportion to their previous purchases of automobiles similar to the automobile of interest For 12 percent of the interviews both husbands and wives participated in making joint budget allocations
Since our hypotheses and the data are at the level of the individual consumer this data should be sufficient for an initial test of the value priority hypotheses How- ever the specific durables and the magnitude of the budgets are not generalizable to the US population because our sample was weighted towards potential luxury car buyers Furthermore our analyses are limited to any extent that luxury car buyers are different in their budgeting processes
Budget Task To obtain budget information we gave consumers a
deck of cards in which each card represented a potential purchase For example these cards included college tuition vacations home improvements major clothing purchases landscaping cameras and accessories fur- niture home fuel savings devices dishwashers color televisions stereo systems jewelry and so on After an extensive pretest we were able to identify 52 items that accounted for most purchases (Consumers were given blank cards for additional purchases)
Consumers first sorted these cards according to whether they (a) now owned the durable (b) would consider purchasing it in the next three years or (c)
would not consider purchasing it in the next three years (Pretests indicated that three years was a reasonable budgeting period) Consumers next considered pile a- currently own-and removed those items they would either replace or supplement by buying an additional unit Finally they selected from pile b-would con-sider-and from the replacementadditional pile those items for which they would specifically budget and plan These items are now their budgetable goods
Consumers then allocated these items to the years 1983 1984 and 1985 and ordered the items according to priority within each year This rank order of items becomes our measure of their budget allocation We estimate utilities with other data described later and attempt to forecast the measured rank-order buying priorities
Explanatory Measures
Obtaining utility measures that can be used to infer value among product categories is a difficult task Al- most every utility measurement procedure of which we are familiar-including conjoint analysis preference regression logit analysis expectancy values and von Neumann-Morgenstern assessment-measures utility within a product category In a series of pre-test mea- surements in 198 1 1982 and 1983 we tried over a dozen different methods including directly scaled (0- 100 scale) points on utility and on value constant sum paired comparisons among items and constant sum allocations among all items We found four mea- sures that appeared to be feasible and that provided meaningful tasks to the consumer These four measures were included in our interviews
None of the four measures was an explicit measure of utility However for each consumer measure we use the value priority hypotheses to infer relationships among utilities Details as well as strengths and weak- nesses of the measures are given in the estimation sec- tion below The measures were
Reservation Pricc~ The consumer was asked to specify the minimum price at which he she o r they would no longer purchase the durable
Purchase Probabi1itv The consumer was asked to esti- mate the probability that he she or they would actually purchase the durable in the period of interest (0 to 10 Juster scale see Juster 1966)
Lottery Order The consumer was asked t o imagine that he she or they had won a lottery and would be allowed to select a prize They were then to rank the durable allocated to each year in the order corresponding to the order in which he she or they would choose a prize in the lottery Note that this ordering will usually be dif- ferent than the budget allocation ordering because price is not to be considered in this task
Combination Lottery Prizes The consumer was again told that he she or they had won a lottery but this time
the task was to choose among two pairs of prizes For example the consumer(s) might be asked to choose among receiving either (a) the first and fourth ranked prize or (b) the second and third ranked prize Consum- ers were asked up to eight such pairs or combinations for each budget year
Example Respondent Table 1 lists the actual data obtained from one re-
spondent This respondent a 30-year-old married woman with three children and a $35000 per year fam- ily income has six durable goods in her 1985 budget For example she expects to purchase a $5000 auto- mobile with a probability of 070 This durable good is ranked first in the lottery prize question and has a res- ervation price of $10000 If price were not an issue she would rather have the automobile plus a freezer than paid tuition plus a vacation There are three tables such as Table 1 for each respondent one for each year
ESTIMATION CONVERGENT LINEAR PROGRAMMING
Each of the measures in Table 1 provides information about utility values but none is a direct measure of utility For example the purchase probability might be a nonlinear function of utility and of A while the lottery order and combination lottery prizes provide only rank- order information about utility
Because two data types-lottery orders and combi- nation lottery prizes-are rank-order relationships and because the other data types are continuous and non- linear traditional methods based on continuous linear relationships may not be appropriate or at least must be modified We present in this section a modified linear programming (LP) procedure that can incorporate rank- order and continuous data types in a single convergent estimation procedure A later section will present an alternative estimation procedure that uses covariance analysis (LISREL V) In that section the relative pre- dictive capabilities of the two procedures are examined and the convergent indications about our hypotheses are discussed
The Basic Idea The idea behind convergent LP estimation is quite
simple Each datum implies a relationship either among various utility values or between a utility value and the datum The relationship varies by data type Our goal is to select utility values such that all relationships are satisfied However in the presence of measurement er- ror and approximation error it is unlikely that we will be able to satisfy all relationships simultaneously Thus for each datum-say a lottery prize answer-we may be able to satisfy the relationship only approximately The amount by which we cannot satisfy the relationship we call error Thus we choose utility values to min-
THE JOURNAL OF CONSUMER RESEARCH
TABLE 1
DATA FROM EXAMPLE RESPONDENT
Durable Price Reservation Purchase
($1 price ($) probability Lottery order
Automobile 5000 10000 70 1 Furniture 2000 4000 60 2 Tuition 2000 5000 99 3 Movie camera 500 1000 60 4 Vacation 1000 1500 70 5 Freezer 300 500 50 6
Combination lottery prizes
1 Automobile Freezer gt Tuition Vacation 2 Automobile Vacation gt Tuition Camera 3 Tuition Vacation gt Furniture Freezer 4Tuition Freezer gt Camera Vacation 5Freezer Vacation gt Camera 6Tuition gt Camera Freezer 7Tuition Freezer gt Furniture
NOTE gt symbolizes preferred to
imize a weighted sum of errors where the weights (cho- sen by the analyst) allow us to put a different emphasis on different data types This minimization of errors can be accomplished with a linear program The objective function is the weighted sum of errors and the con- straints are the relationships implied by each datum In general terms this is ( L P ~ ) ~
minimize WT (errors based on reservation price answers)
+W(errors based on purchase probability answers)
+WT (errors based on lottery order answers)
+U (errors based on combination lottery prize answers)
subject to relationships implied by the value priority (or net value priority) model We now illustrate the spe- cific mathematical relationships
Reservation Price Relationships The reservation price is the price at which the durable
good leaves the budget Thus if r and u are the res- ervation price and utility of the jthitem then the value priority hypothesis implies
uJrJ= h (1)
51t is useful to distinguish between the mathematical programs MPI MP2 and MP3 which are the consumers budget problems and the linear program LPI which is the analysts estimation prob- lem
VALUE PRIORITY HYPOTHESES
because at the reservation price the jthitem falls just below the budget cutoff A To include Equation 1 as a relationship in LP l we define errors based on reser- vation price answers as the absolute value of the dif- ference between ur and A that is lurj - XI In linear programming mathematics this becomes
errors based on reservation price answers = e + e (2)
To assure a consistent scale of errors across data types in LPI we multiply through by r The constraint re- lationships become
Equations 2 and 3 are the standard LP formulation for minimizing absolute error (see eg Gass 1969 p 320) If values for u and X are estimated and ur exceeds A only e$ will take on a positive value because minimi- zation of Equation 2 in LPI forces e to zero If X ex-ceeds ujrj only e will be positive
Since the LP seeks to minimize e + e and since it can simultaneously set uj and A one trivial solution is to set all variables equal to zero We avoid this problem by recognizing that utility and hence X are ratio scales and are thus unique to a positive constant Thus we can set one utility value or A arbitrarily In our for- mulations we set X = 1 thus scaling everything relative to X When X = 1 the net value priority hypothesis implies 14 - Xr = u - r = 0 which implies the same constraint as Equation 3 above This is consistent with the complementary slackness theorem and the inter- pretation of MP2 and MP3 The duality theorem im plies that at optimum for a given B the items in the budget as implied by the optimal solution are the same However the priority order predicted by value and net value may be quite different This will be discussed in a later section
Purchase Probability Relationships
The purchase probability is the consumers estimate of the probability that the durable good will actually be purchased in the budget period It is based on the utility and price of the durable good but also upon unobserved events that make the purchase more or less favorable If these unobserved events represent observation error then according to the value priority model the proba- bility of purchasing good j is given by
L = Prob upJ + error gt A) (4)
That is the likelihood of purchase (L)is the probability that the value (up) is greater than the budget constraint (A) after adjusting for error If we multiply through the p to assure consistent scaling in LP l and assume that the resulting observation error is distributed with a
double exponential probability distribution then Equation 4 becomes the logit model shown in Equation 5 where (3 is a parameter to be estimated
For the derivation see McFadden 1974 Equation 5 can be linearized by dividing through by (1 - Lj) and taking logarithms
Finally we again use the standard LP formulation for minimizing absolute error to obtain the objective function and constraint relationships for purchase probability For the criterion function in LPl
errors based on purchase probability answers = ec + e (6)
and the associated constraint is
u - (P-)log [Ll(l - L)]- e i + e = XP
In these equations L and p are observed and u (3 efi and e are variables As before we establish the scale by setting X = 1 and as before constraint 7 also esti- mates utilities for the net value priority hypothesis
Lottery Orders
The lottery order is a ranking of the durable goods according to their usefulness or desirability to the con- sumer As such the lottery order implies a rank order on the magnitude of the utilities For example if ul is the utility of the first ranked durable uZ is the utility of the second ranked durable and so on then the lottery orders imply
U I gt u2 (8)
uz gt u3 etc
The reader will notice that this data and the constraints implied by Equation 8 are similar to the LP conjoint analysis algorithm LINMAP as proposed by Srinivasan and Shocker (1973) The only difference is that we are interested in the utilities of alternative durable goods whereas Srinivasan and Shocker were interested in the utilities of factorial combinations of product charac-teristics
Following similar methods we count errors only when the inequality relationships are violated that is
lottery order error = ( 1 - 6k)ek + (6k)ek (9)
where if j is preferred to k
= 1 6k
0 if k is preferred to j
-- --
THE JOURNAL OF CONSUMER RESEARCH
In Equations 9 and 10 the (0 1) variable dJk is the answer to the lottery order question that tells us which product is preferred as a prize in the lottery Because the relationship is specified directly in terms of utility Equations 9 and 10 apply for both the value priority and net value priority hypotheses Unlike Srinivasan and Shocker (1973) we need not worry about the scaling of the utilities because the scaling is already established by the constraints associated with the reservation price andor purchase probability data6
Combination Lottery Prizes The combination lottery prize questions imply rank-
order relationships among pairs of utilities For ex-ample if the combination of goods 1 and 4 is preferred to the combination of goods 2 and 3 then
Objective functions for the paired comparison lottery error
(1 - d m k h + (arn)eFrn (12)
and formal constraints similar to 10 can be established for each combination lottery question m For ease of exposition we do not repeat them here
Summary The estimation LP is now to minimize the weighted
sum of errors given by Equations LPl 2 6 9 and 12 subject to the constraints of 3 7 10 and 11 For ex- ample for the six durable goods in Table 1 there are six reservation price relationships six probablity rela- tionships five lottery order relationships and seven combination lottery prize relationships totalling 24 constraints and 24 independent errors in the objective function Because of the complementary slackness and duality theorems LPl applies for both the value priority and the net value priority hypotheses
PREDICTING BUDGET PLANS The data on reservation prices purchase probabili-
ties lottery orders and combination lottery prizes give us the ability to estimate the utilities of the goods in an individuals or a familys budget If the value priority hypothesis andor the net value priority hypothesis is a reasonable descriptive representation of consumer purchasing behavior then the rank order of value (net value)-that is estimated utility divided by price (minus price)-should provide an estimate of the con- sumers rank-order buying priorities It will not be per- fect due to measurement and approximation errors We
6This implies that either the weight associated with reservation price ( W in LPI) andor with purchase probabilities (W in LPI) must be non-zero to establish scaling in terms of A
TABLE 2
EXAMPLE PREDICTIVE TEST
Actual Utility Value budget
Estimated Price + price priority priority Durable utility (000s) (000s) order order
Automobile 1000 50 20 3 4 Furniture 400 20 20 3 3 Tuition 1027 20 51 1 2 Movie
camera 122 05 25 2 1 Vacation 150 1O 15 5 6 Freezer 030 03 1O 6 5
NOTE Cwrelation of estimate with budget priority Spearman 0 = 087 Kendall i= 069
formulate a predictive test by comparing the estimated utilities (divided by or minus price) to the consumers budget priorities
Our predictive test is a comparison of budget plans as predicted by the value priority hypotheses to budget plans as stated directly by the consumers Because of uncertain and unexpected events such as change in the economy shortage or surplus of raw materials unex- pected raise or bonus loss of employment change of residence and so on actual purchases over the three years may differ from budget plans (Dickson and Wilkie 1978) By comparing predicted plans with actual plans we examine the value priority hypotheses as approxi- mate explanations of how consumers believe they will act We will illustrate our predictive tests in the next section
A different predictive test would compare predicted plans with actual purchases Such a test has the strength of external validity but the weakness of confounding the effect of plans and of unexpected events Since it was not feasible to observe three years of actual pur- chases (and unexpected events) within our research project we must leave such tests to future research
Example Predictive Test Consider the data in Table 1 and suppose we place
equal weight on each data type-that is W = W2= W3 = W4Applying convergent LP estimation provides the estimates of utility shown in the second column of Table 2 Dividing by price (third column) gives the estimates in the fourth column of Table 2 Notice that the esti- mated utilities would predict that this consumer would rank tuition as her first budget priority (value = 5 l) a movie camera as her second budget priority (value = 25) and a freezer as her last budget priority (value = 10)
In comparing the budget priority predicted by the estimated utilities to the budget priority actually ob- served it must be remembered that the observed budget priorities were not used in the estimation Thus the
VALUE PRIORITY HYPOTHESES
TABLE 3
VARYING WEIGHTS ON TYPES OF INPUT DATA FOR EXAMPLE RESPONDENT
Spearman Weighting scheme correlation
Equal weights to all four types 87 Resewation price weighted heavily 31 Purchase probability weighted heavily 82 Lottery order weighted heavily 82 Paired lottery prizes weighted heavily 87
NOTE Weightedheaq means the rebvant weight is 100 timesmore thanothers We~hts are not set equal to zero to maintain scaling as discussed in the text
comparison in Table 2 is a test of predictive ability not of data-fitting ability Comparing rank orders implied by the data in the fifth column to the sixth column of Table 2 we see that the predictions are reasonable but not perfect Tuition and the movie camera are predicted and observed to be the top two items but estimated value predicts tuition as the top priority while the con- sumer feels that the movie camera is her top priority Overall the Spearman rank-order correlation of the predicted rank from utility per dollar (column 5) and the actual rank (column 6) is 087 while the Kendall rank-order correlation is 069
However equal weighting of the data types is not the only choice For example Table 3 indicates the results we obtained by using each data source separately For this consumer it appears that the purchase probabilities lottery orders and paired lottery prizes each alone pro- vides reasonable estimates of budget priorities however in this case reservation price data do not appear to be as good as the other measures In fact if we drop res- ervation prices and use equal weights on the other three data sources we get a higher rank-order correlation- 093-than if we use all four data sources
Testing the net value priority hypothesis proceeds similarly The only difference is that we subtract price (in $000~) from the estimated utility rather than divide by price For example for the automobile the net value criterion is 1000 - 500 = 500 which turns out to be ranked second For equal Ws for this respondent the net value priority hypothesis produces a Spearman rank-order correlation of 054 Thus for this respondent (with equal Ws) the value priority hypothesis appears to predict better than the net value priority hypothesis Unfortunately because the tests are of different hy- potheses rather than of nested hypotheses we cannot be rigorous and state whether this difference is statis- tically significant
We report only the Spearman correlation for ease of exposition Results are similar to Kendalls T This applies for the remainder of the paper
FIGURE A
DISTRIBUTION OF SPEARMAN CORRELATION OF ACTUAL AND PREDICTED BUDGET PRIORITY ORDERS FOR VALUE
PRIORITY HYPOTHESIS
N U M B E R O F
BUDGETS
-100 - 75 -50 -25 OO 25 50 -75 t o to to to t o t o t o t 0
-75 -50 -25 -00 25 50 75 100
S P E A R M A N CORRELATION
Predictive Tests Across Individuals for the Value Priority Hypothesis
Our sample yields 522 potential budgets (1 74 families X 3 years) Sixty budgets ( I 15 percent) had one or more values missing for either an explanatory or a predictive measure These were spread across measures and de- mographics and did not appear to represent a systematic bias in measurement Of the remaining 462 budgets 247 had 0 1 or 2 durables planned Although the value priority (or net value priority) hypothesis applies to such small budgets predictions would be perfect by definition for 0 or 1 items and perfect by chance 50 percent of the time for 2 items in a budget We felt that this would bias our results upward artificially so we restricted our- selves to the more difficult task of predicting the 21 5 budgets which contained at least 3 durables
We applied the predictive tests as illustrated in Tables 1 2 and 3 to each individuals (or familys) budgets in the resulting sample To investigate the relative effec- tiveness of various measures we estimated utilities for each individual (or family) for equal weights ( W = W = W3 = W4) for weighting heavily each data source (as in Table 3) and for weighting heavily combinations of data sources (eg reservation prices and purchase probabilities) Even with todays mainframe computers and efficient LP software it was not feasible compu- tationally to search all possible combinations of Ws
We summarize the data in two ways To examine the value priority and net value priority hypotheses we re- port predictions based on the best set of Ws (from our
Of these annual budgets 84 had three items 54 had four items 35 had five items and 22 had six items The remainder had seven or more items up to a high of 12 items We detected no systematic bias based on the number of items in a budget
THE JOURNAL OF CONSUMER RESEARCH
FIGURE B
DISTRIBUTION OF SPEARMAN CORRELATION OF ACTUAL AND PREDICTED BUDGET PRIORITY ORDERS
FOR NET VALUE HYPOTHESIS N U M B E R
OF BUDGETS
t o t o t o t o t o t o t o t 0 - 75 - 5 0 - 2 5 -OO 25 5 0 75 100
S F E A R M A N C O R R E L A T I O N
limited search as described above) for each individual or family Then to examine the relative merits of each data source we keep the Ws the same for all individuals and families Other means of summarizing the data provide the same qualitative implications and are noted as appropriate
Figure A reports the Spearman correlations of the actual and predicted budget priorities for the value priority hypothesis It is based on the best Ws for each individual (or family) but we use the same weights for all his her or their budgets Overall the value priority hypothesis seems reasonable Despite potential mea- surement error and conservative reporting due to elim- inating the favorable budgets of 0 1 or 2 items roughly 83 percent of the budgets have positive correlations 60 percent have correlations of 050 or better the 35 per- cent have correlations of 075 or better Significance levels are complex (because many ties are possible) vary by budget (the number of items in each budget varies) and do not apply between hypotheses There is no single overall critical value that can be applied to Figure A
Comparison of the Value Priority and Net Value Priority Hypotheses
Figure B reports the Spearman correlations of actual and predicted budget priorities for the net value hy- pothesis The net value priority hypothesis also appears to be a reasonable description of consumer purchasing behavior Roughly 9 1 percent of the budgets have pos- itive correlations 84 percent have correlations of 050 or better and 5 1 percent have correlations of 075 or better The net value hypothesis appears to do somewhat better than the value hypothesis
TABLE 4
COMPARISON OF VALUE PRIORITY AND NET VALUE PRIORITY HYPOTHESES
Budgets
Value priority Net value priority Weighting scheme predicts best predicts best
Number of budgets 56 122 Average number of
productsbudget 457 461 Average number of
autoslbudget 048 036 Average price of
products in budget $3278 $3635
Average reservation price of product in budget $4232 $4349
Average age 437 441 Average income $36200 $36300
Examining consumer by consumer the Spearman correlations of actual and predicted budget plans 122 budgets (57 percent) were predicted better by net value priority 56 budgets (26 percent) were predicted better by value priority and 37 budgets (1 7 percent) were pre- dicted equally well by both As Table 4 suggests we found no significant demographic differences that sug- gest when one hypothesis predicts better than the other
In summary both hypotheses do well neither is re- jected and both are retained for future empirical testing Although net value priority does better in our tests the issue is very complex because of the theoretical inter- relationships among the hypotheses (through the duality theorem) We will interpret our results in light of these interrelationships in a later section
Variation Across Alternative Weightings of Data Types
Figure C reports distributions of Spearman correla- tion of actual and predicted budget priority orders for each of the data sources For example if we make W much larger than W2 W3 and W4 we emphasize res- ervation prices as the primary data source as in panel
The Figure C results are based on weights that do not vary across individual families Overall predictions based on reservation prices do better than random (67 percent are positive) but not nearly as well as they did in Figure B This is not surprising because reservation price is a complex concept for many consumers causing the quality of data to vary across consumers Our ex- ample respondent appears to have understood the con-
We report the results for net value priority here Results for value priority are qualitatively the same and in about the same relationship as summarized by Figures A and B
5 0
VALUE PRIORITY HYPOTHESES
FIGURE C
DISTRIBUTIONS OF SPEARMAN CORRELATION OF ACTUAL AND PREDICTED BUDGET PRIORITY ORDERS FOR FOUR DIFFERENT DATA SOURCES
N U M B E R N U M B E R 0 F OF
B U D G E T S BUDGETS
CORRELATION CORRE L A T I O N 1 2
Prediction based on reservation price Prediction based on purchase probabilities
N U M B E R NUMBER O F OF
BUDGETS BUDGETS
CORR E L A T l O N C O R R E L A T I O N 3 4
Prediction based on lottery order Prediction based on combination lottery prizes
THE JOURNAL OF CONSUMER RESEARCH
cept but other respondents clearly did not For ex- ample some consumers gave a reservation price of $2001 for an item with an expected price of $2000 Other consumers found it hard to imagine the item staying the same as the price rises
Figure C also reports the results for emphasizing data on purchase probabilities lottery orders and combi- nation lottery prize answers Of the data sources pur- chase probabilities are clearly the best indicators of budget priorities (81 percent positive and 60 percent with correlations of 050 or better) Lottery orders and combination lottery prizes (67 percent and 69 percent positive respectively) do about as well as reservation prices Results for combinations of two three and four data sources tend to be in the range of those in Figure C Those results also suggest that of the four data sources purchase probabilities tend to predict budget priorities best l o
Although purchase probability measures appear to be the best indicators of budget priorities Figure B sug- gests that consumers do vary in their abilities to answer any given question format We recommend a conver- gent estimation approach that utilizes all four data sources Convergent linear programming is one such approach we will illustrate another in a later section
Summary of Predictive Tests Based on convergent linear programming estimation
with all four data sources we are able to estimate utility values for durable products which with price forecast well consumers budget orders We feel that this is rea- sonable preliminary evidence that the hypotheses are good first order approximations to consumers pur-chasing ofdurable goods Elaborations of the hypotheses (Appendix A) may improve the approximation and predict better The comparison of value priority and net value priority shows that both criteria predict well consumers budget priorities Net value priority (fo- cusing on the marginal increase in net utility) does better than value priority (focusing on the budget constraint) but the results do vary by individuals andor families We found no systematic reason for the variations but further research may suggest some hypotheses Finally consumers do vary in their ability to respond to complex utility questions suggesting that utility is best measured with multiple questions and with at least one form of convergent estimation
ALTERNATIVE ESTIMATION PROCEDURE LISREL V
Convergent linear programming is one way to in- corporate multiple data sources Its strengths are that it can readily accommodate both ordinal and cardinal
Figure C gives one indication of how well purchase probabilities alone would predict budget plans
FIGURE D
MEASUREMENT MODEL FOR LISREL V ESTIMATION
I 1
ERROR ( S I l RESERVATION P R I C E
I TRANSFORMED 1 ERROR PURCHASE
U T I L I T Y
LOTTERY ERROR O R D E R S
ERROR (84) COMBINATION P R I Z E S
NOTE Data sources (boxes) are indicators of the unobservable utllity values (arcle)
measures and that the theoretical relationships sug- gested by the value priority hypotheses can be repre- sented exactlv within the structure Furthermore it is readily applied on a consumer-by-consumer basis to identify potential heterogeneities in response to ques- tion format andor planning Its disadvantages are that (1) the cost of searching all combinations of weights ( Wi W Z W3 and W4) to find a single best fit is pro- hibitive and (2) statistical properties of linear pro- gramming estimation are not well known
There are other estimation procedures that use mul- tiple data sources Each has its relative strengths and weaknesses We select one such estimation procedure to demonstrate that our basic result-the reasonable-ness of the value priority hypotheses-is robust with respect to the estimation procedure The procedure we choose is covariance analysis as implemented by Jo- reskog and Sorboms ( 198 1) LISREL V (see Heise 1975 Duncan 1975 and Bentler and Bonett 1980 for more details on covariance analysis) The advantages of LIS- REL V are that (1) a best set ofweights (in the maximum likelihood sense) can be found for the proper emphasis among data sources and (2) the statistical properties are well known when normality conditions hold The disadvantages are that (1) because LISREL is very sen- sitive to departures from normality (see Joreskog and Sorbom 1981 page I39) it may not do well with our ordinal data or with our transformed probabilities and (2) the estimation is infeasible for small sample sizes as would be the case with individual-by-individual analyses (see Bentler and Bonett 1980 p 591) Since the relative advantages and disadvantages of LISREL V compensate those of convergent linear programming estimation the resulting estimation provides valuable insight into the value priority hypotheses
Basic Estimation Model The LISREL V analysis corresponding to convergent
LP estimation is the measurement model shown in Fig- ure D The data sources (boxes) are indicators of the
- -
VALUE PRIORITY HYPOTHESES
unobservable utility values (circle) thus each measure- ment-say a reservation price-can be thought of as resulting from the unobserved utility value and a mea- surement error (6s in Figure D) The goal of LISREL V is to estimate the correlations (known as factor load- ings) relating the observables to the unobserved utility and then to use the structure to estimate a quantity (known as a factor score) for the unobserved utility We use the theoretical relationships as implied by the value priority hypotheses to specify the appropriate transfor- mations of the raw measurements
Measures Based on the value priority hypotheses the appro-
priate measures are
I Reservation prices as implied by Equation 3 with h = 1
2 Logit transformed probabilities as implied by Equa- tion 7 with h = l We allow the estimation to deter- mine the scaling constant -
3 Lottery orders These orderings are rank-order mea- sures and may violate strict normality assumptions but they are monotonic in utility
4 Combination lottery prizes The rank-order relation- ships implied by Equations 11 and 12 are complex dependent on each individual and interrelated with lottery orders They are not readily handled by the linear equations of LISREL V We use as a surrogate the number of times a durable is chosen from the set of combinations This measure is clearly monotonic in utility Again normality is a concern
Estimation Results The maximum likelihood estimation results are
shown in Table 5 The estimation is based on 932 ob- servations corresponding to the total number of budg- eted items in the 2 15 budgets Overall the measurement model does remarkably well The goodness of fit in- dex-which is independent of sample size and rela- tively robust against departures from normality (Jorgskog and Sorbom 198 1 page 14 1)-suggests that 999 percent of relative covariance is accounted for by the model Even adjusted for degrees of freedom this measure is 989 percent The coefficient of determina- tion for the overall model is 924 percent suggesting high overall reliability of the measurement model The chi-squared value is low-087 indicating that no ad- dition of free parameters would improve the model sig- nificantly
The model in Table 5 accounts for measurement correlation among the rank-order measures as suggested by the corresponding modification index (Joreskog and Sorbom 198 1 p 11119) Without the extra free parameter all coefficients and statistics except the chi- squared (401 with 2 df) are virtually identical to those in Table 5
TABLE 5
ESTIMATION RESULTS FOR LISREL V MEASUREMENT MODEL
Estimated Squared factor Asymptotic correlation
Variable loading t-statistic (reliability)
Reservation price 954 230 911 Transformed probabilities 812 207 660 Lottery orders 293 86 086 Combination prizes I66 49 027
Goodness-of-fit index Adjusted goodness-of-fit
index Coefficient of
determination Root mean square
residual Chi-squared (1degree of freedom)
For the specific measures reservation prices have the highest reliability followed by transformed probabilities Both have excellent asymptotic t-statistics The rank- order measures fare less well with low reliabilities but good t-statistics Normalized residuals (not shown) are reasonable for the cardinal measures but do depart somewhat for the rank-order measures Since the latter is to be expected the t-statistics are acceptable and we desire a comparison with the convergent LP estimation we retain all measures in the model
Predictive Tests Based on the measurement model in Table 5 we use
the LISREL V factor score regressions12 to estimate utility for each durable in each budget We then divide by price to forecast value priorities or subtract price to forecast net value priorities As we did with the linear programming forecasts we compare the LISREL V forecasts to actual consumer budget orders (see Fig- ure E)
The LISREL V predictive results appear comparable to the convergent LP estimates that do not vary by fam- ily 73 percent of the correlations are positive and 55 percent are 050 or better for the value priority hypoth- esis while 71 percent are positive and 54 percent are equal or above 050 for the net value priority hypoth- esis13 These correlations are better than those obtained in Figure C for reservation prices lottery orders or combination prizes as single measures and almost as good as those obtained for purchase probabilities Of course LISREL V does not do as well as the family-
The factor score coefficients are 0805 0180 0026 and 001 5 respectively for the four measures
13The value priority hypothesis does slightly better with LISREL V than does the net value priority hypothesis but this result is prob- ably not significant The best comparison between the hypotheses remains the family-by-family analysis (review Table 4)
THE JOURNAL OF CONSUMER RESEARCH
FIGURE E
DISTRIBUTION OF SPEARMAN CORRELATION OF ACTUAL AND PREDICTED BUDGET PRIORITY ORDERS FOR LISREL MODEL AND TWO DIFFERENT HYPOTHESES
U M B E R OF
UDGETS 7 0 -
--6 0
-50 -
-4 0
-30
720 -
10-
- 10 - 5 0 5 10
CORRELATION 1
Predictions based on value priority hypothesis
by-family estimates in Figures A and B Based on the similarity of the LISREL V predictive results to the convergent LP predictive results we have more confi- dence in our proposition that at least one of the value priority hypotheses is a reasonable first-order model of consumer budget planningI4
DISCUSSION The value priority hypothesis and the net value
priority hypothesis are models of how consumers al- locate their budgets to goods Both hypotheses are de- rived from the standard economic model of maximizing utility subject to a budget constraint However both
14CuriouslyLISREL V selects reservation price as the most reliable measure but the predictive tests in Figure D (a measure of validity) suggest that purchase probabilities may predict better Further re- search might estimate a more complex structural model including the dependent variable in the estimation We did not d o this because we felt it more appropriate to have an independent test of predictive ability that did not use the budget orders in the estimation and be- cause the dependent measure was at best an ordinal measure that clearly causes problems with LISREL V Furthermore our goal is to test the value priority hypotheses not to compare the relative merits of linear programming and LISREL V Finally a full comparison of technique would best be done with multiple measures of the dependent variable in a variety of contexts
NUMBER OF
BUDGETS-7 0
f6 0 -
50--4 0
-30
20 -
10-
-10 - 5 0 5 I o C O R R E L A T I O N
2
Predictions based on net value priority hypothesis
recognize the evidence from a variety of scientific dis- ciplines suggesting that behavior as observed may differ from behavior as prescribed Both hypotheses imply that the consumer (or family) uses a simple heuristic that leads to near-optimal behavior under a wide variety of conditions This heuristic is to rank order durables ac- cording to value (or net value) and purchase items in that order up to and including a budget cutoff The two hypotheses differ only in their derivation of the nu- meraire by which durables are ranked The empirical evidence for the hypotheses presented earlier suggests that both are reasonable we are comfortable with pro- posing both for further testing Figures A and B also suggest that the net value priority hypothesis may be the better predictor However before embracing the net value hypothesis there are a number of cautions worth considering These include the complex interrelation- ship between the two hypotheses the distinction be- tween descriptive and prescriptive theories and the empirical observation of high rank-order correlation between up and u - p all of which are discussed in the following sections
Interrelationships Between the Hypotheses If durables were not discrete then the duality and
complementary slackness theorems would imply that
459 VALUE PRIORITY HYPOTHESES
TABLE 6
AN EXAMPLE BUDGET WITH THREE ITEMS
Utility Price
($000~)
Home improvement Landscaping Food processor
994 657 328
060 030 008
NOTE ui Is the utlllty of Item1 and p 1s the prlce
the optimal solutions to MP2 (value priority) and MP3 (net value priority) are the same This means that for a given budget B and budget cutoff A the two cri- teria-~rp 3 A and zi - Ap gt 0-would yield the same overall budget (This can also be seen by dividing through by p in the net value criterion) This does not mean that the order of planned purchasing-the rank order of zip and 11 - Apl-will be the same
Consider three items-a home improvement land- scaping and a food processor-that are part of the budget of one of our respondents a married 37-year- old male with two children and a $65000 family in- come Follow~ng the convergent linear programming estimation procedure described earlier Table 6 displays the utilities scaled such that A = 1 Net value priority predicts the order as shown the home improvement the landscaping and then the food processor Value prior~ty predicts the reverse order For these three items the respondent actually planned the home improve- ment the landscaping and then the food processor For this consumer net value priority appears to be a better descriptive model (review Table 4 for more gen- eral results)
Assumption of Stable X
The example above does not indicate what would happen if the budget 3the utilities zi or the avail- ability of products changed The value priority criterion zip would not change On the other hand the net value criterion would remain unchanged only if A did not change However A-which equals dzi(y)djgt at the optimum solution to MP3-may change if B or the us change15 If the change were sufficiently dramatic the net value ordering could change Thus the net value priority hypothesis assumes that A or at least the con- sumers perceived A changes slowly This assumption is worth testing
A change in A would affect our scaling convention of X = 1 The utilities are a function of A and may themselves change if we change the budget problem yet restrict h to be 1 O For the comparative forecasts in this paper the budget problem does not change hence the restriction X = 1 is not critical for our predictive tests It could become critical in other situations
utPt Value priority ui - Pi
Net value priority
17 22 41
3 2 1
394 357 248
1 2 3
TABLE 7
REVISED BUDGETS
Budget items Utility Price
Value priority Food processor 328 $80 Convection oven 328 $80 Landscaping 657 $300
Total 1313 $460
Net value priority Home improvement 994 $600
Total 994 $600
Descriptive vs Prescriptive Hypotheses
We stated the value priority and the net value priority hypotheses as descriptive hypotheses They may or may not lead the consumer to the best decisions For ex- ample consider the consumer discussed above and suppose there were another durable-say a tabletop convection oven-with the same utility and price as the food processor Then for $600 of budget allocations the two hypotheses recommend the allocations indi- cated in Table 7 Prescriptively (if our utilities are ac- curate) the consumer would have been better off (more utility and less money) using the value priority than net value priority Such examples are easy to create Indeed if there were no integer constraints on durable pur- chases the value priority algorithm is prescriptively the best algorithm Even with integer constraints it does not do badly and has reasonable worst case propertiesI6 (Cornuejols et al 1977 Fisher 1980) However we can also create examples to favor net value priority over value priority so again we must interpret all prescrip- tive results with caution
I6The theoretical worst case is a factor of two For example with a budget of $1000 and two products of utility 502 and 500 that cost $501 and $500 respectively the optimum is two units of the second product rather than one unit of the first product But if the budget can be relaxed or nondurables purchased this worst case result is mitigated
Correlation The value priority and net value priority hypotheses
have quite different behavioral interpretations How- ever they may be difficult to distinguish from obser- vations of behavior because the two criteria rlJpJ and tiJ - pJ have high rank-order correlations To illustrate this we drew 10000random values of 11 and pJ from a uniform distribution each of five times The resulting linear correlation of log (uJpJ)-which is monotonic in r~p-and uJ - pJ was quite high 087 This suggests an even higher rank-order correlation Because of this correlation we must interpret with caution any empir- ical comparisons of observed budget plans This does not mean the hypotheses are indistinguishable for ex- ample verbal protocols or process-tracing technology may be able to distinguish between the hypotheses In summary the evidence favoring at least one of the hy- potheses as a description of durable purchasing is pos- itive However comparisons between the hlpotheses must be made with caution and subject to further testing
SUMMARY AND IMPLICATIONS Based on our data estimation and predictive tests
and subject to future research we posit that
1 The ranking of goods according to a budget priority appears to be a reasonable descriptorpredictor of consumer budget plans
2 Both value and net value provide reasonable approx- imations to the numeraire by which durables are ranked
3 It is feasible to measure utility across categories if multiple convergent measures are used
4 Convergent LP estimation is feasible provides rea- sonable estimates of utility and appears consistent in predictive ability with LiSREL V
5 Consumers vary in the heuristic numeraire-value or net value-they use for ranking
6 Consumers vary in their ability to answer specific question types
The last postulate is no surprise to the behavioral re- searcher who faces often the difficult task of estimating unobserved constructs It does provide a caution to the market researcher or management analyst faced with
We seek to demonstrate the rank-order correlation of upJ and uJ - p Thus we seek monotonic transformations of either or both variables such that the linear correlation is maximized The logarith- mic transformation is effective and provides a reasonable lower bound on the maximum rank correlation Technically some transformation is necessary because the mean and variance of (uJ pJ )are both infinite when uj and p are independent and identically distributed uniform random variables In addition the logarithmic transformation gives the intuitive interpretation that log (uJ p j )= log u - log p which we expect to be related to u - p
THE JOURNAL OF CONSUMER RESEARCH
limited measurement budgets who wants to forecast durable purchases Convergent measurement is prob- ably necessary
Our value priority hypotheses are a first step in un- derstanding consumer budget planning They are rea- sonable descriptorspredictors of actual budget plans but they do not model explicitly the mental processes leading to utility formation and information processing A useful direction for research would be the investi- gation of information processing theories to explain how consumers form utility judgments and whether value net value or another hypothesis is the best description of how they integrate utility and price to form budget plans Our postulates and analyses raise a number of other researchable issues as well Among these are
1 Two-stage predictive tests comparing predicted plans to actual plans and to actual purchase
2 Predictive tests collecting measures on all evoked goods and predicting which will be in the budget plans
3 Alternative methods such as verbal protocols and process tracing that can distinguish between the value and net value hypotheses without being subject to the bane of high rank-order correlation between hy-potheses
4 Collection of data such as perceived interest rates depreciation rates and operating and maintenance costs that could test a n elaborated model such as that in Appendix A
These are a few of the many unanswered questions that can be addressed in future research
Managerial Implications We close on a practical note The value priority hy-
potheses can be and are useful in forecasting sales in existing durable product classes Once utilities are es- timated for a sample of consumers we can forecast the implications of new products improved products or changes in prices or economic conditions New or im- proved products change utilities and economic con- ditions change the budgets For each consumer we compute the value criterion (or net value criterion if X does not change) and recompute the buying order For example a megabyte personal computer a digital stereoVCR or a mini-van may have high enough value (or net value) to enter the budget of some consumers The percent of consumers who now budget for the new product form is a forecast of its category sales
The measurement system described in this paper has been used at General Motors and has provided valuable managerial insight into which durable goods compete most with luxury automobiles For example Table 8 lists those goods that were ranked above automobiles
For example Lyons (1984) used our data internal intelligence on competitive models and a conjoint analysis to forecast changes in utility
VALUE PRIORITY HYPOTHESES
TABLE 8
DURABLE GOODS COMPETING WITH AUTOMOBILES
Durable Percent
1 School tuition 1983 2 Vacation 1983 3 Home improvement (minor) 4 Major clothing 5 Landscaping 6 School tuition 1984 7 GiftsDonations 8 Cameras and Accessories 9 Furniture
10 Home fuel savings device 11 Home improvement (major) 12 Vacation 1984 13 Dishwasher 14 Color television 15 Stereo system 16 Jewelry 17 House 18 Oven 19 MovieVideo camera 20 Video tape recorder 21 RefrigeratorFreezer 22 School tuition 1985 23 Home computer 24 Vacation 1985
NOTE The percents signify the percentage of budgets in which the indicated item was ranked above an automobile when both the item and an automobile were in the budget
when both were in the budget Recent automobile de- sign and marketing campaigns have been based on budget priority analyses that consider product im-provements or advertised image (less maintenance im- proved comfort and so on) Such changes are designed to increase the utility of an auto purchase and thereby move it up in the buying priority The value priority model is also used to determine if the introduction of a new automobile will improve the position of an au- tomobile purchase in the ordering After having con- sumers drive the new automobile in a clinic environ- ment the new automobiles utility is measured relative to the respondents current first choice automobile to determine if it is higher in the respondents priority or- dering than the previous automobile Application work is continuing to ascertain the managerial usefulness of the value priority hypotheses in managing new and es- tablished durable consumer goods
APPENDIX A Multiple Period Hypotheses
The value priority hypothesis and the net value priority hypothesis are readily extendable The equa- tions for the value priority hypothesis were derived in Hauser and Urban (1982) We restate them here in con- densed form and indicate how they apply to the net value priority hypothesis
Let ti be the utility of the r t h item of the jthgood p be the expected price of that good at time f cS be a
zero-one indicator of whether the ithitems of good J is purchased Note 6 gt 0 only if 6 1 - 1 = 1 Let u(y) be the utility of spending y on nondurables in time t Let B be the consumers budget constraint in time t Dbe hisher debt in time t and b be the amount borrowed (saved) in that period Let d be the depreciation rate for good J and r be the interest rate Let c be the op- erating and maintenance cost of durable j n periods after purchase The consumers problem (MP4) is as follows Maximize
T T-1 r C C C I C + C 14 ( ~ 1 )C f J 9 ~ ~ J l ~ J l I
r = l J r q=O I = 1
subject to T-1
pJt(C 61) + C cJJJtt+ )- h~ BI J n= l
Dl = Dl-(I + r ) + b DT=O forallt
6i = 0 1 6Ji = 1 iff 6 = 1 and s gt t
The value priority criterion for the LP relaxation of the integer constraints now becomes
T- I T- 1
Z ( J ~ [C(1 + riT-I[P~+ C ~ j n l - (Al ) q=O n= l
Finally trade-ins are handled by computing net depre- ciated utility gain divided by net price and pairwise complementarity is added with hierarchical dependence of u on another good k For the net value hypothesis the criterion is (numerator of A 1) - p (denominator of A l ) where p is the simplex multiplier of the debt con- straint D = 0
APPENDIX B Dual Linear Program Non-Technical
Summary 4n important concept in linear programming is that
for every linear program there is a related dual linear program The variables of the dual are known as simplex multipliers or shadow prices Each variable of the dual corresponds to a constraint in the original linear pro- gram and represents the sensitivity of relaxing the constraint-ie the amount by which the objective function would change if that constraint were relaxed If the original linear program is a maximization prob- lem then the dual program has as its objective the min- imization of a weighted sum of the dual variables The weights are the constants in the constraints of the orig- inal linear program The constraints of the dual are based on the constraints and objective function of the original linear program For example
Original Dual-max clxi + c2x2 min btul + b2u2 subject to al lxlt a12x2--i 61 st al lul+ a 2 1 ~ 22 cl
~ 2 ~ x 1+ ~ ~ 2 x 2--i b2 2 c2alzui+ a2~u2 X l X ~ 2 0 u u2gt0
Note tha t m corresponds to the first constraint in t he original program a n d represents t he value o f relaxing tha t constraint
T h e duality theorem states the amazing result tha t t h e optimal values of the object functions of t he two linear programs are identical Complementary slackness states tha t if a dua l variable has a non-zero value in the optimal solution t o t he dual t hen t h e corresponding constraint in t he original program must be binding and vice versa Fo r a more complete and technical exposi- t ion see Gass (1969) o r a n y l inear programming text Note tha t the dua l of t he dua l is t he original l inear pro- gram
[Received March 1985 Revised October 19851
REFERENCES
Bentler Peter M and Douglas G Bonett (1980) Significance Tests and Goodness of Fit in the Analysis of Covariance Structures Psychological Bulletin 88 (3) 588-606
Bertan Jenny and John R Hauser (1982) Auto Show Focus Groups Technical Report to General Motors MIT Cambridge MA January
Bettman James R (1979) An Information Processing Theory of Consumer Choice Reading MA Addison-Wesley
Blackorby Charles Daniel Primont and R Robert Russell (1 975) Budgeting Decentralization and Aggregation Annals ofEconomic Social Measurement 4 ( I ) 23-44
Brown DA SF Buck and FG Pyatt (1965) Improving the Sales Forecast for Consumer Durables Journal of Marketing Research 2 (August) 229-234
Clarke Yvonne and Geoffrey N Soutar (1982) Consumer Acquisition Patterns for Durable Goods Australian Ev- idence Journal of Consumer Research 8 (March) 456- 459
Cornuejols Gerald Marshall L Fisher and George L Nem- hauser (1977) Location of Bank Accounts to Optimize Float An Analytic Study of Exact and Approximate Al- gorithms hfanagement Science 23 (April) 789-8 10
Dickson Peter R Robert F Lusch and William L Wilkie (1 983) Consumer Acquisition Priorities for Home Ap- pliances A Reproduction and Re-evaluation Journal of Consumer Research 9 (March) 432-435
and William L Wilkie (1978) The Consumption of Household Durables A Behavioral Review Marketing Science Institute Working Paper Series Cambridge MA December
Duncan Otis D (1975) Introduction to Structural Equation Models New York Academic Press
Fisher Marshall (1980) Worst Case Analysis of Heuristic Algorithms Management Science 26 (January) 1 -17
Gass Saul 1 (1969) Linear Programming Methods and Ap- plications 3rd Edition New York McGraw-Hill
Green Paul E and V Srinivasan (1978) Conjoint Analysis in Consumer Research Issues and Outlook Journal of Consumer Research 5 (September) 103- 123
Hauser John R and Frank S Koppelman (l979) Alter- native Perceptual Mapping Techniques Relative Ac- curacy and Usefulness Journal ofltfarketing Research 16 (November) 495-506
John H Roberts and Glen L Urban (1983) Fore-
THE JOURNAL OF CONSUMER RESEARCH
casting Sales of a New Consumer Durable in Advances and Practices of Marketing Science ed F S Zufryden Providence RI The Institute of Management Sciences 115-128
and Glen L Urban (1982) Prelaunch Forecasting of New Consumer Durables Ideas on a Consumer Value- Priority Model in Analytic Approaches to Product and tfarketing Planning The Second Confirence ed Raj K Srivastava and Allan D Shocker Cambridge MA Mar- keting Science Institute 276-296
Heiner Ronald A (1983) The Origin of Predictable Be- havior American Economic Review 73 (September) 560-595
Heise David R (1975) Caltsal Analjsis New York John Wiley
Johnson Eric J and Amos Tversky (1983) Affect Gener- alization and the Perception of Risk Journal of Per- sonulily and Social Psychology 45 ( I) 20-3 1
Joreskog Karl G and Dag Sorbom (198 I) LISREL Anabois of Linear Structural Relationships by the Method of hfaximum Likelihood version V Chicago IL National Educational Resources
Juster F Thomas (1 966) Consumer Buying Intentions and Purchase Probability An Experiment in Survey Design Journal of the American Statistical Association 6 1 658- 696
Kasuiis Jack J Robert F Lusch and Edward F Stafford Jr (1979) Consumer Acquisition Patterns for Durable Goods Journal o f Consumer Research 6 (June) 47- 57
Keon John W (1980) The Bargain Value Model and a Comparison of Managerial Implications with the Linear Learning Model hlanagement Science 26 (November) 11 17-1 130
Lyons Larry (1 984) Forecasting the Impact of Competitive Entries on the Sales of a New Consumer Durable SM Thesis Sloan School of Management MIT Cam-bridge MA 02 139
McFadden David (1974) Conditional Logit Analysis of Qualitative Choice Behavior in Frontiers of Econo-metrics ed P Zarembka New York Academic Press
Paroush Jacob (1965) The Order of Acquisition of Con- sumer Durables Econometrica 33 (January) 225-235
Rosen Sherwin (1 974) Hedonic Prices and Implicit Mar- kets Product Differentiation in Pure Competition Journal qf Political Economy 82 ( ~ a n u a r ~ l ~ e b r u a r ~ ) 34-55
Shugan Steve M (1980) The Cost of Thinking Journal of Consumer Research 7 (September) 99- 1 1 1
Srinivasan V (1982) Comments on the Role of Price in Individual Utility Judgments in Choice Models for Buyer Behavior ed Leigh McAlister Greenwich CT JAI Press
and Allan D Shocker (1973) Linear Programming Techniques for Multi-Dimensional Analysis of Prefer- ence Psychometrika 38 (September) 337-370
Sternthal Brian and C Sam Craig (1 982) Consumer Behav- ior 4n Infornlation Processing Perspective Englewood Cliffs NJ Prentice-Hall
Tverskey Amos and Daniel Kahneman (1974) Judgment Under Uncertainty Heuristics and Biases Science 185 1124-1 131
Urban Glen L and John R Hauser (1980) Design and ampfar- keting o f~Yew Products Englewood Cliffs NJ Prentice- Hall
You have printed the following article
The Value Priority Hypotheses for Consumer Budget PlansJohn R Hauser Glen L UrbanThe Journal of Consumer Research Vol 12 No 4 (Mar 1986) pp 446-462Stable URL
httplinksjstororgsicisici=0093-53012819860329123A43C4463ATVPHFC3E20CO3B2-J
This article references the following linked citations If you are trying to access articles from anoff-campus location you may be required to first logon via your library web site to access JSTOR Pleasevisit your librarys website or contact a librarian to learn about options for remote access to JSTOR
References
Improving the Sales Forecast for Consumer DurablesD A Brown S F Buck F G PyattJournal of Marketing Research Vol 2 No 3 (Aug 1965) pp 229-234Stable URL
httplinksjstororgsicisici=0022-2437281965082923A33C2293AITSFFC3E20CO3B2-O
Consumer Acquisition Patterns for Durable Goods Australian EvidenceYvonne Clarke Geoffrey N SoutarThe Journal of Consumer Research Vol 8 No 4 (Mar 1982) pp 456-460Stable URL
httplinksjstororgsicisici=0093-5301281982032983A43C4563ACAPFDG3E20CO3B2-T
Location of Bank Accounts to Optimize Float An Analytic Study of Exact and ApproximateAlgorithmsGerard Cornuejols Marshall L Fisher George L NemhauserManagement Science Vol 23 No 8 (Apr 1977) pp 789-810Stable URL
httplinksjstororgsicisici=0025-19092819770429233A83C7893ALOBATO3E20CO3B2-1
Consumer Acquisition Priorities for Home Appliances A Replication and Re-evaluationPeter R Dickson Robert F Lusch William L WilkieThe Journal of Consumer Research Vol 9 No 4 (Mar 1983) pp 432-435Stable URL
httplinksjstororgsicisici=0093-5301281983032993A43C4323ACAPFHA3E20CO3B2-E
httpwwwjstororg
LINKED CITATIONS- Page 1 of 3 -
Worst-Case Analysis of Heuristic AlgorithmsMarshall L FisherManagement Science Vol 26 No 1 (Jan 1980) pp 1-17Stable URL
httplinksjstororgsicisici=0025-19092819800129263A13C13AWAOHA3E20CO3B2-4
Conjoint Analysis in Consumer Research Issues and OutlookPaul E Green V SrinivasanThe Journal of Consumer Research Vol 5 No 2 (Sep 1978) pp 103-123Stable URL
httplinksjstororgsicisici=0093-5301281978092953A23C1033ACAICRI3E20CO3B2-5
Alternative Perceptual Mapping Techniques Relative Accuracy and UsefulnessJohn R Hauser Frank S KoppelmanJournal of Marketing Research Vol 16 No 4 (Nov 1979) pp 495-506Stable URL
httplinksjstororgsicisici=0022-24372819791129163A43C4953AAPMTRA3E20CO3B2-23
The Origin of Predictable BehaviorRonald A HeinerThe American Economic Review Vol 73 No 4 (Sep 1983) pp 560-595Stable URL
httplinksjstororgsicisici=0002-82822819830929733A43C5603ATOOPB3E20CO3B2-R
Consumer Buying Intentions and Purchase Probability An Experiment in Survey DesignF Thomas JusterJournal of the American Statistical Association Vol 61 No 315 (Sep 1966) pp 658-696Stable URL
httplinksjstororgsicisici=0162-14592819660929613A3153C6583ACBIAPP3E20CO3B2-M
Consumer Acquistion Patterns for Durable GoodsJack J Kasulis Robert F Lusch Edward F Stafford JrThe Journal of Consumer Research Vol 6 No 1 (Jun 1979) pp 47-57Stable URL
httplinksjstororgsicisici=0093-5301281979062963A13C473ACAPFDG3E20CO3B2-S
httpwwwjstororg
LINKED CITATIONS- Page 2 of 3 -
The Bargain Value Model and a Comparison of Managerial Implications with the LinearLearning ModelJohn W KeonManagement Science Vol 26 No 11 (Nov 1980) pp 1117-1130Stable URL
httplinksjstororgsicisici=0025-19092819801129263A113C11173ATBVMAA3E20CO3B2-G
The Order of Acquisition of Consumer DurablesJacob ParoushEconometrica Vol 33 No 1 (Jan 1965) pp 225-235Stable URL
httplinksjstororgsicisici=0012-96822819650129333A13C2253ATOOAOC3E20CO3B2-3
Hedonic Prices and Implicit Markets Product Differentiation in Pure CompetitionSherwin RosenThe Journal of Political Economy Vol 82 No 1 (Jan - Feb 1974) pp 34-55Stable URL
httplinksjstororgsicisici=0022-3808281974012F0229823A13C343AHPAIMP3E20CO3B2-U
The Cost of ThinkingSteven M ShuganThe Journal of Consumer Research Vol 7 No 2 (Sep 1980) pp 99-111Stable URL
httplinksjstororgsicisici=0093-5301281980092973A23C993ATCOT3E20CO3B2-J
httpwwwjstororg
LINKED CITATIONS- Page 3 of 3 -
VALUE PRIORITY HYPOTHESES
making units In March 1983 we were given the op- portunity to apply and test our hypotheses An Amer- ican automobile manufacturer planned to introduce a new automobile in the Spring of 1984 and among other things wanted to know with which durable products the automobile would compete The new automobile was a luxury model for upscale consumers hence competition from vacations second homes pools boats and college tuition was a management concern
The data collection was part of an ongoing project The questioning procedure about to be described is based on focus groups in Boston Massachusetts and Troy Michigan in June 1982 automobile-show inter- views in Boston Massachusetts in November 1981 1982 and 1983 a pretest (30 consumers) in Troy Michigan in June 1982 a mini-test (40 consumers) in Phoenix Arizona in January 1983 and a series of in- formal tests throughout the period Throughout these tests the questioning procedure evolved to represent reasonable tradeoffs among measurement of the hy- pothesized concepts and feasibility of measurement
The consumer tasks were administered with trained and experienced professional interviewers The con- sumer tasks took approximately 50 minutes and were the opening part of a larger two-hour interview in which respondents were paid $25 for their time (see Hauser Roberts and Urban 1983 for details on the full inter- blew) The 174 respondents were chosen at random from the Cincinnati Ohio area but in proportion to their previous purchases of automobiles similar to the automobile of interest For 12 percent of the interviews both husbands and wives participated in making joint budget allocations
Since our hypotheses and the data are at the level of the individual consumer this data should be sufficient for an initial test of the value priority hypotheses How- ever the specific durables and the magnitude of the budgets are not generalizable to the US population because our sample was weighted towards potential luxury car buyers Furthermore our analyses are limited to any extent that luxury car buyers are different in their budgeting processes
Budget Task To obtain budget information we gave consumers a
deck of cards in which each card represented a potential purchase For example these cards included college tuition vacations home improvements major clothing purchases landscaping cameras and accessories fur- niture home fuel savings devices dishwashers color televisions stereo systems jewelry and so on After an extensive pretest we were able to identify 52 items that accounted for most purchases (Consumers were given blank cards for additional purchases)
Consumers first sorted these cards according to whether they (a) now owned the durable (b) would consider purchasing it in the next three years or (c)
would not consider purchasing it in the next three years (Pretests indicated that three years was a reasonable budgeting period) Consumers next considered pile a- currently own-and removed those items they would either replace or supplement by buying an additional unit Finally they selected from pile b-would con-sider-and from the replacementadditional pile those items for which they would specifically budget and plan These items are now their budgetable goods
Consumers then allocated these items to the years 1983 1984 and 1985 and ordered the items according to priority within each year This rank order of items becomes our measure of their budget allocation We estimate utilities with other data described later and attempt to forecast the measured rank-order buying priorities
Explanatory Measures
Obtaining utility measures that can be used to infer value among product categories is a difficult task Al- most every utility measurement procedure of which we are familiar-including conjoint analysis preference regression logit analysis expectancy values and von Neumann-Morgenstern assessment-measures utility within a product category In a series of pre-test mea- surements in 198 1 1982 and 1983 we tried over a dozen different methods including directly scaled (0- 100 scale) points on utility and on value constant sum paired comparisons among items and constant sum allocations among all items We found four mea- sures that appeared to be feasible and that provided meaningful tasks to the consumer These four measures were included in our interviews
None of the four measures was an explicit measure of utility However for each consumer measure we use the value priority hypotheses to infer relationships among utilities Details as well as strengths and weak- nesses of the measures are given in the estimation sec- tion below The measures were
Reservation Pricc~ The consumer was asked to specify the minimum price at which he she o r they would no longer purchase the durable
Purchase Probabi1itv The consumer was asked to esti- mate the probability that he she or they would actually purchase the durable in the period of interest (0 to 10 Juster scale see Juster 1966)
Lottery Order The consumer was asked t o imagine that he she or they had won a lottery and would be allowed to select a prize They were then to rank the durable allocated to each year in the order corresponding to the order in which he she or they would choose a prize in the lottery Note that this ordering will usually be dif- ferent than the budget allocation ordering because price is not to be considered in this task
Combination Lottery Prizes The consumer was again told that he she or they had won a lottery but this time
the task was to choose among two pairs of prizes For example the consumer(s) might be asked to choose among receiving either (a) the first and fourth ranked prize or (b) the second and third ranked prize Consum- ers were asked up to eight such pairs or combinations for each budget year
Example Respondent Table 1 lists the actual data obtained from one re-
spondent This respondent a 30-year-old married woman with three children and a $35000 per year fam- ily income has six durable goods in her 1985 budget For example she expects to purchase a $5000 auto- mobile with a probability of 070 This durable good is ranked first in the lottery prize question and has a res- ervation price of $10000 If price were not an issue she would rather have the automobile plus a freezer than paid tuition plus a vacation There are three tables such as Table 1 for each respondent one for each year
ESTIMATION CONVERGENT LINEAR PROGRAMMING
Each of the measures in Table 1 provides information about utility values but none is a direct measure of utility For example the purchase probability might be a nonlinear function of utility and of A while the lottery order and combination lottery prizes provide only rank- order information about utility
Because two data types-lottery orders and combi- nation lottery prizes-are rank-order relationships and because the other data types are continuous and non- linear traditional methods based on continuous linear relationships may not be appropriate or at least must be modified We present in this section a modified linear programming (LP) procedure that can incorporate rank- order and continuous data types in a single convergent estimation procedure A later section will present an alternative estimation procedure that uses covariance analysis (LISREL V) In that section the relative pre- dictive capabilities of the two procedures are examined and the convergent indications about our hypotheses are discussed
The Basic Idea The idea behind convergent LP estimation is quite
simple Each datum implies a relationship either among various utility values or between a utility value and the datum The relationship varies by data type Our goal is to select utility values such that all relationships are satisfied However in the presence of measurement er- ror and approximation error it is unlikely that we will be able to satisfy all relationships simultaneously Thus for each datum-say a lottery prize answer-we may be able to satisfy the relationship only approximately The amount by which we cannot satisfy the relationship we call error Thus we choose utility values to min-
THE JOURNAL OF CONSUMER RESEARCH
TABLE 1
DATA FROM EXAMPLE RESPONDENT
Durable Price Reservation Purchase
($1 price ($) probability Lottery order
Automobile 5000 10000 70 1 Furniture 2000 4000 60 2 Tuition 2000 5000 99 3 Movie camera 500 1000 60 4 Vacation 1000 1500 70 5 Freezer 300 500 50 6
Combination lottery prizes
1 Automobile Freezer gt Tuition Vacation 2 Automobile Vacation gt Tuition Camera 3 Tuition Vacation gt Furniture Freezer 4Tuition Freezer gt Camera Vacation 5Freezer Vacation gt Camera 6Tuition gt Camera Freezer 7Tuition Freezer gt Furniture
NOTE gt symbolizes preferred to
imize a weighted sum of errors where the weights (cho- sen by the analyst) allow us to put a different emphasis on different data types This minimization of errors can be accomplished with a linear program The objective function is the weighted sum of errors and the con- straints are the relationships implied by each datum In general terms this is ( L P ~ ) ~
minimize WT (errors based on reservation price answers)
+W(errors based on purchase probability answers)
+WT (errors based on lottery order answers)
+U (errors based on combination lottery prize answers)
subject to relationships implied by the value priority (or net value priority) model We now illustrate the spe- cific mathematical relationships
Reservation Price Relationships The reservation price is the price at which the durable
good leaves the budget Thus if r and u are the res- ervation price and utility of the jthitem then the value priority hypothesis implies
uJrJ= h (1)
51t is useful to distinguish between the mathematical programs MPI MP2 and MP3 which are the consumers budget problems and the linear program LPI which is the analysts estimation prob- lem
VALUE PRIORITY HYPOTHESES
because at the reservation price the jthitem falls just below the budget cutoff A To include Equation 1 as a relationship in LP l we define errors based on reser- vation price answers as the absolute value of the dif- ference between ur and A that is lurj - XI In linear programming mathematics this becomes
errors based on reservation price answers = e + e (2)
To assure a consistent scale of errors across data types in LPI we multiply through by r The constraint re- lationships become
Equations 2 and 3 are the standard LP formulation for minimizing absolute error (see eg Gass 1969 p 320) If values for u and X are estimated and ur exceeds A only e$ will take on a positive value because minimi- zation of Equation 2 in LPI forces e to zero If X ex-ceeds ujrj only e will be positive
Since the LP seeks to minimize e + e and since it can simultaneously set uj and A one trivial solution is to set all variables equal to zero We avoid this problem by recognizing that utility and hence X are ratio scales and are thus unique to a positive constant Thus we can set one utility value or A arbitrarily In our for- mulations we set X = 1 thus scaling everything relative to X When X = 1 the net value priority hypothesis implies 14 - Xr = u - r = 0 which implies the same constraint as Equation 3 above This is consistent with the complementary slackness theorem and the inter- pretation of MP2 and MP3 The duality theorem im plies that at optimum for a given B the items in the budget as implied by the optimal solution are the same However the priority order predicted by value and net value may be quite different This will be discussed in a later section
Purchase Probability Relationships
The purchase probability is the consumers estimate of the probability that the durable good will actually be purchased in the budget period It is based on the utility and price of the durable good but also upon unobserved events that make the purchase more or less favorable If these unobserved events represent observation error then according to the value priority model the proba- bility of purchasing good j is given by
L = Prob upJ + error gt A) (4)
That is the likelihood of purchase (L)is the probability that the value (up) is greater than the budget constraint (A) after adjusting for error If we multiply through the p to assure consistent scaling in LP l and assume that the resulting observation error is distributed with a
double exponential probability distribution then Equation 4 becomes the logit model shown in Equation 5 where (3 is a parameter to be estimated
For the derivation see McFadden 1974 Equation 5 can be linearized by dividing through by (1 - Lj) and taking logarithms
Finally we again use the standard LP formulation for minimizing absolute error to obtain the objective function and constraint relationships for purchase probability For the criterion function in LPl
errors based on purchase probability answers = ec + e (6)
and the associated constraint is
u - (P-)log [Ll(l - L)]- e i + e = XP
In these equations L and p are observed and u (3 efi and e are variables As before we establish the scale by setting X = 1 and as before constraint 7 also esti- mates utilities for the net value priority hypothesis
Lottery Orders
The lottery order is a ranking of the durable goods according to their usefulness or desirability to the con- sumer As such the lottery order implies a rank order on the magnitude of the utilities For example if ul is the utility of the first ranked durable uZ is the utility of the second ranked durable and so on then the lottery orders imply
U I gt u2 (8)
uz gt u3 etc
The reader will notice that this data and the constraints implied by Equation 8 are similar to the LP conjoint analysis algorithm LINMAP as proposed by Srinivasan and Shocker (1973) The only difference is that we are interested in the utilities of alternative durable goods whereas Srinivasan and Shocker were interested in the utilities of factorial combinations of product charac-teristics
Following similar methods we count errors only when the inequality relationships are violated that is
lottery order error = ( 1 - 6k)ek + (6k)ek (9)
where if j is preferred to k
= 1 6k
0 if k is preferred to j
-- --
THE JOURNAL OF CONSUMER RESEARCH
In Equations 9 and 10 the (0 1) variable dJk is the answer to the lottery order question that tells us which product is preferred as a prize in the lottery Because the relationship is specified directly in terms of utility Equations 9 and 10 apply for both the value priority and net value priority hypotheses Unlike Srinivasan and Shocker (1973) we need not worry about the scaling of the utilities because the scaling is already established by the constraints associated with the reservation price andor purchase probability data6
Combination Lottery Prizes The combination lottery prize questions imply rank-
order relationships among pairs of utilities For ex-ample if the combination of goods 1 and 4 is preferred to the combination of goods 2 and 3 then
Objective functions for the paired comparison lottery error
(1 - d m k h + (arn)eFrn (12)
and formal constraints similar to 10 can be established for each combination lottery question m For ease of exposition we do not repeat them here
Summary The estimation LP is now to minimize the weighted
sum of errors given by Equations LPl 2 6 9 and 12 subject to the constraints of 3 7 10 and 11 For ex- ample for the six durable goods in Table 1 there are six reservation price relationships six probablity rela- tionships five lottery order relationships and seven combination lottery prize relationships totalling 24 constraints and 24 independent errors in the objective function Because of the complementary slackness and duality theorems LPl applies for both the value priority and the net value priority hypotheses
PREDICTING BUDGET PLANS The data on reservation prices purchase probabili-
ties lottery orders and combination lottery prizes give us the ability to estimate the utilities of the goods in an individuals or a familys budget If the value priority hypothesis andor the net value priority hypothesis is a reasonable descriptive representation of consumer purchasing behavior then the rank order of value (net value)-that is estimated utility divided by price (minus price)-should provide an estimate of the con- sumers rank-order buying priorities It will not be per- fect due to measurement and approximation errors We
6This implies that either the weight associated with reservation price ( W in LPI) andor with purchase probabilities (W in LPI) must be non-zero to establish scaling in terms of A
TABLE 2
EXAMPLE PREDICTIVE TEST
Actual Utility Value budget
Estimated Price + price priority priority Durable utility (000s) (000s) order order
Automobile 1000 50 20 3 4 Furniture 400 20 20 3 3 Tuition 1027 20 51 1 2 Movie
camera 122 05 25 2 1 Vacation 150 1O 15 5 6 Freezer 030 03 1O 6 5
NOTE Cwrelation of estimate with budget priority Spearman 0 = 087 Kendall i= 069
formulate a predictive test by comparing the estimated utilities (divided by or minus price) to the consumers budget priorities
Our predictive test is a comparison of budget plans as predicted by the value priority hypotheses to budget plans as stated directly by the consumers Because of uncertain and unexpected events such as change in the economy shortage or surplus of raw materials unex- pected raise or bonus loss of employment change of residence and so on actual purchases over the three years may differ from budget plans (Dickson and Wilkie 1978) By comparing predicted plans with actual plans we examine the value priority hypotheses as approxi- mate explanations of how consumers believe they will act We will illustrate our predictive tests in the next section
A different predictive test would compare predicted plans with actual purchases Such a test has the strength of external validity but the weakness of confounding the effect of plans and of unexpected events Since it was not feasible to observe three years of actual pur- chases (and unexpected events) within our research project we must leave such tests to future research
Example Predictive Test Consider the data in Table 1 and suppose we place
equal weight on each data type-that is W = W2= W3 = W4Applying convergent LP estimation provides the estimates of utility shown in the second column of Table 2 Dividing by price (third column) gives the estimates in the fourth column of Table 2 Notice that the esti- mated utilities would predict that this consumer would rank tuition as her first budget priority (value = 5 l) a movie camera as her second budget priority (value = 25) and a freezer as her last budget priority (value = 10)
In comparing the budget priority predicted by the estimated utilities to the budget priority actually ob- served it must be remembered that the observed budget priorities were not used in the estimation Thus the
VALUE PRIORITY HYPOTHESES
TABLE 3
VARYING WEIGHTS ON TYPES OF INPUT DATA FOR EXAMPLE RESPONDENT
Spearman Weighting scheme correlation
Equal weights to all four types 87 Resewation price weighted heavily 31 Purchase probability weighted heavily 82 Lottery order weighted heavily 82 Paired lottery prizes weighted heavily 87
NOTE Weightedheaq means the rebvant weight is 100 timesmore thanothers We~hts are not set equal to zero to maintain scaling as discussed in the text
comparison in Table 2 is a test of predictive ability not of data-fitting ability Comparing rank orders implied by the data in the fifth column to the sixth column of Table 2 we see that the predictions are reasonable but not perfect Tuition and the movie camera are predicted and observed to be the top two items but estimated value predicts tuition as the top priority while the con- sumer feels that the movie camera is her top priority Overall the Spearman rank-order correlation of the predicted rank from utility per dollar (column 5) and the actual rank (column 6) is 087 while the Kendall rank-order correlation is 069
However equal weighting of the data types is not the only choice For example Table 3 indicates the results we obtained by using each data source separately For this consumer it appears that the purchase probabilities lottery orders and paired lottery prizes each alone pro- vides reasonable estimates of budget priorities however in this case reservation price data do not appear to be as good as the other measures In fact if we drop res- ervation prices and use equal weights on the other three data sources we get a higher rank-order correlation- 093-than if we use all four data sources
Testing the net value priority hypothesis proceeds similarly The only difference is that we subtract price (in $000~) from the estimated utility rather than divide by price For example for the automobile the net value criterion is 1000 - 500 = 500 which turns out to be ranked second For equal Ws for this respondent the net value priority hypothesis produces a Spearman rank-order correlation of 054 Thus for this respondent (with equal Ws) the value priority hypothesis appears to predict better than the net value priority hypothesis Unfortunately because the tests are of different hy- potheses rather than of nested hypotheses we cannot be rigorous and state whether this difference is statis- tically significant
We report only the Spearman correlation for ease of exposition Results are similar to Kendalls T This applies for the remainder of the paper
FIGURE A
DISTRIBUTION OF SPEARMAN CORRELATION OF ACTUAL AND PREDICTED BUDGET PRIORITY ORDERS FOR VALUE
PRIORITY HYPOTHESIS
N U M B E R O F
BUDGETS
-100 - 75 -50 -25 OO 25 50 -75 t o to to to t o t o t o t 0
-75 -50 -25 -00 25 50 75 100
S P E A R M A N CORRELATION
Predictive Tests Across Individuals for the Value Priority Hypothesis
Our sample yields 522 potential budgets (1 74 families X 3 years) Sixty budgets ( I 15 percent) had one or more values missing for either an explanatory or a predictive measure These were spread across measures and de- mographics and did not appear to represent a systematic bias in measurement Of the remaining 462 budgets 247 had 0 1 or 2 durables planned Although the value priority (or net value priority) hypothesis applies to such small budgets predictions would be perfect by definition for 0 or 1 items and perfect by chance 50 percent of the time for 2 items in a budget We felt that this would bias our results upward artificially so we restricted our- selves to the more difficult task of predicting the 21 5 budgets which contained at least 3 durables
We applied the predictive tests as illustrated in Tables 1 2 and 3 to each individuals (or familys) budgets in the resulting sample To investigate the relative effec- tiveness of various measures we estimated utilities for each individual (or family) for equal weights ( W = W = W3 = W4) for weighting heavily each data source (as in Table 3) and for weighting heavily combinations of data sources (eg reservation prices and purchase probabilities) Even with todays mainframe computers and efficient LP software it was not feasible compu- tationally to search all possible combinations of Ws
We summarize the data in two ways To examine the value priority and net value priority hypotheses we re- port predictions based on the best set of Ws (from our
Of these annual budgets 84 had three items 54 had four items 35 had five items and 22 had six items The remainder had seven or more items up to a high of 12 items We detected no systematic bias based on the number of items in a budget
THE JOURNAL OF CONSUMER RESEARCH
FIGURE B
DISTRIBUTION OF SPEARMAN CORRELATION OF ACTUAL AND PREDICTED BUDGET PRIORITY ORDERS
FOR NET VALUE HYPOTHESIS N U M B E R
OF BUDGETS
t o t o t o t o t o t o t o t 0 - 75 - 5 0 - 2 5 -OO 25 5 0 75 100
S F E A R M A N C O R R E L A T I O N
limited search as described above) for each individual or family Then to examine the relative merits of each data source we keep the Ws the same for all individuals and families Other means of summarizing the data provide the same qualitative implications and are noted as appropriate
Figure A reports the Spearman correlations of the actual and predicted budget priorities for the value priority hypothesis It is based on the best Ws for each individual (or family) but we use the same weights for all his her or their budgets Overall the value priority hypothesis seems reasonable Despite potential mea- surement error and conservative reporting due to elim- inating the favorable budgets of 0 1 or 2 items roughly 83 percent of the budgets have positive correlations 60 percent have correlations of 050 or better the 35 per- cent have correlations of 075 or better Significance levels are complex (because many ties are possible) vary by budget (the number of items in each budget varies) and do not apply between hypotheses There is no single overall critical value that can be applied to Figure A
Comparison of the Value Priority and Net Value Priority Hypotheses
Figure B reports the Spearman correlations of actual and predicted budget priorities for the net value hy- pothesis The net value priority hypothesis also appears to be a reasonable description of consumer purchasing behavior Roughly 9 1 percent of the budgets have pos- itive correlations 84 percent have correlations of 050 or better and 5 1 percent have correlations of 075 or better The net value hypothesis appears to do somewhat better than the value hypothesis
TABLE 4
COMPARISON OF VALUE PRIORITY AND NET VALUE PRIORITY HYPOTHESES
Budgets
Value priority Net value priority Weighting scheme predicts best predicts best
Number of budgets 56 122 Average number of
productsbudget 457 461 Average number of
autoslbudget 048 036 Average price of
products in budget $3278 $3635
Average reservation price of product in budget $4232 $4349
Average age 437 441 Average income $36200 $36300
Examining consumer by consumer the Spearman correlations of actual and predicted budget plans 122 budgets (57 percent) were predicted better by net value priority 56 budgets (26 percent) were predicted better by value priority and 37 budgets (1 7 percent) were pre- dicted equally well by both As Table 4 suggests we found no significant demographic differences that sug- gest when one hypothesis predicts better than the other
In summary both hypotheses do well neither is re- jected and both are retained for future empirical testing Although net value priority does better in our tests the issue is very complex because of the theoretical inter- relationships among the hypotheses (through the duality theorem) We will interpret our results in light of these interrelationships in a later section
Variation Across Alternative Weightings of Data Types
Figure C reports distributions of Spearman correla- tion of actual and predicted budget priority orders for each of the data sources For example if we make W much larger than W2 W3 and W4 we emphasize res- ervation prices as the primary data source as in panel
The Figure C results are based on weights that do not vary across individual families Overall predictions based on reservation prices do better than random (67 percent are positive) but not nearly as well as they did in Figure B This is not surprising because reservation price is a complex concept for many consumers causing the quality of data to vary across consumers Our ex- ample respondent appears to have understood the con-
We report the results for net value priority here Results for value priority are qualitatively the same and in about the same relationship as summarized by Figures A and B
5 0
VALUE PRIORITY HYPOTHESES
FIGURE C
DISTRIBUTIONS OF SPEARMAN CORRELATION OF ACTUAL AND PREDICTED BUDGET PRIORITY ORDERS FOR FOUR DIFFERENT DATA SOURCES
N U M B E R N U M B E R 0 F OF
B U D G E T S BUDGETS
CORRELATION CORRE L A T I O N 1 2
Prediction based on reservation price Prediction based on purchase probabilities
N U M B E R NUMBER O F OF
BUDGETS BUDGETS
CORR E L A T l O N C O R R E L A T I O N 3 4
Prediction based on lottery order Prediction based on combination lottery prizes
THE JOURNAL OF CONSUMER RESEARCH
cept but other respondents clearly did not For ex- ample some consumers gave a reservation price of $2001 for an item with an expected price of $2000 Other consumers found it hard to imagine the item staying the same as the price rises
Figure C also reports the results for emphasizing data on purchase probabilities lottery orders and combi- nation lottery prize answers Of the data sources pur- chase probabilities are clearly the best indicators of budget priorities (81 percent positive and 60 percent with correlations of 050 or better) Lottery orders and combination lottery prizes (67 percent and 69 percent positive respectively) do about as well as reservation prices Results for combinations of two three and four data sources tend to be in the range of those in Figure C Those results also suggest that of the four data sources purchase probabilities tend to predict budget priorities best l o
Although purchase probability measures appear to be the best indicators of budget priorities Figure B sug- gests that consumers do vary in their abilities to answer any given question format We recommend a conver- gent estimation approach that utilizes all four data sources Convergent linear programming is one such approach we will illustrate another in a later section
Summary of Predictive Tests Based on convergent linear programming estimation
with all four data sources we are able to estimate utility values for durable products which with price forecast well consumers budget orders We feel that this is rea- sonable preliminary evidence that the hypotheses are good first order approximations to consumers pur-chasing ofdurable goods Elaborations of the hypotheses (Appendix A) may improve the approximation and predict better The comparison of value priority and net value priority shows that both criteria predict well consumers budget priorities Net value priority (fo- cusing on the marginal increase in net utility) does better than value priority (focusing on the budget constraint) but the results do vary by individuals andor families We found no systematic reason for the variations but further research may suggest some hypotheses Finally consumers do vary in their ability to respond to complex utility questions suggesting that utility is best measured with multiple questions and with at least one form of convergent estimation
ALTERNATIVE ESTIMATION PROCEDURE LISREL V
Convergent linear programming is one way to in- corporate multiple data sources Its strengths are that it can readily accommodate both ordinal and cardinal
Figure C gives one indication of how well purchase probabilities alone would predict budget plans
FIGURE D
MEASUREMENT MODEL FOR LISREL V ESTIMATION
I 1
ERROR ( S I l RESERVATION P R I C E
I TRANSFORMED 1 ERROR PURCHASE
U T I L I T Y
LOTTERY ERROR O R D E R S
ERROR (84) COMBINATION P R I Z E S
NOTE Data sources (boxes) are indicators of the unobservable utllity values (arcle)
measures and that the theoretical relationships sug- gested by the value priority hypotheses can be repre- sented exactlv within the structure Furthermore it is readily applied on a consumer-by-consumer basis to identify potential heterogeneities in response to ques- tion format andor planning Its disadvantages are that (1) the cost of searching all combinations of weights ( Wi W Z W3 and W4) to find a single best fit is pro- hibitive and (2) statistical properties of linear pro- gramming estimation are not well known
There are other estimation procedures that use mul- tiple data sources Each has its relative strengths and weaknesses We select one such estimation procedure to demonstrate that our basic result-the reasonable-ness of the value priority hypotheses-is robust with respect to the estimation procedure The procedure we choose is covariance analysis as implemented by Jo- reskog and Sorboms ( 198 1) LISREL V (see Heise 1975 Duncan 1975 and Bentler and Bonett 1980 for more details on covariance analysis) The advantages of LIS- REL V are that (1) a best set ofweights (in the maximum likelihood sense) can be found for the proper emphasis among data sources and (2) the statistical properties are well known when normality conditions hold The disadvantages are that (1) because LISREL is very sen- sitive to departures from normality (see Joreskog and Sorbom 1981 page I39) it may not do well with our ordinal data or with our transformed probabilities and (2) the estimation is infeasible for small sample sizes as would be the case with individual-by-individual analyses (see Bentler and Bonett 1980 p 591) Since the relative advantages and disadvantages of LISREL V compensate those of convergent linear programming estimation the resulting estimation provides valuable insight into the value priority hypotheses
Basic Estimation Model The LISREL V analysis corresponding to convergent
LP estimation is the measurement model shown in Fig- ure D The data sources (boxes) are indicators of the
- -
VALUE PRIORITY HYPOTHESES
unobservable utility values (circle) thus each measure- ment-say a reservation price-can be thought of as resulting from the unobserved utility value and a mea- surement error (6s in Figure D) The goal of LISREL V is to estimate the correlations (known as factor load- ings) relating the observables to the unobserved utility and then to use the structure to estimate a quantity (known as a factor score) for the unobserved utility We use the theoretical relationships as implied by the value priority hypotheses to specify the appropriate transfor- mations of the raw measurements
Measures Based on the value priority hypotheses the appro-
priate measures are
I Reservation prices as implied by Equation 3 with h = 1
2 Logit transformed probabilities as implied by Equa- tion 7 with h = l We allow the estimation to deter- mine the scaling constant -
3 Lottery orders These orderings are rank-order mea- sures and may violate strict normality assumptions but they are monotonic in utility
4 Combination lottery prizes The rank-order relation- ships implied by Equations 11 and 12 are complex dependent on each individual and interrelated with lottery orders They are not readily handled by the linear equations of LISREL V We use as a surrogate the number of times a durable is chosen from the set of combinations This measure is clearly monotonic in utility Again normality is a concern
Estimation Results The maximum likelihood estimation results are
shown in Table 5 The estimation is based on 932 ob- servations corresponding to the total number of budg- eted items in the 2 15 budgets Overall the measurement model does remarkably well The goodness of fit in- dex-which is independent of sample size and rela- tively robust against departures from normality (Jorgskog and Sorbom 198 1 page 14 1)-suggests that 999 percent of relative covariance is accounted for by the model Even adjusted for degrees of freedom this measure is 989 percent The coefficient of determina- tion for the overall model is 924 percent suggesting high overall reliability of the measurement model The chi-squared value is low-087 indicating that no ad- dition of free parameters would improve the model sig- nificantly
The model in Table 5 accounts for measurement correlation among the rank-order measures as suggested by the corresponding modification index (Joreskog and Sorbom 198 1 p 11119) Without the extra free parameter all coefficients and statistics except the chi- squared (401 with 2 df) are virtually identical to those in Table 5
TABLE 5
ESTIMATION RESULTS FOR LISREL V MEASUREMENT MODEL
Estimated Squared factor Asymptotic correlation
Variable loading t-statistic (reliability)
Reservation price 954 230 911 Transformed probabilities 812 207 660 Lottery orders 293 86 086 Combination prizes I66 49 027
Goodness-of-fit index Adjusted goodness-of-fit
index Coefficient of
determination Root mean square
residual Chi-squared (1degree of freedom)
For the specific measures reservation prices have the highest reliability followed by transformed probabilities Both have excellent asymptotic t-statistics The rank- order measures fare less well with low reliabilities but good t-statistics Normalized residuals (not shown) are reasonable for the cardinal measures but do depart somewhat for the rank-order measures Since the latter is to be expected the t-statistics are acceptable and we desire a comparison with the convergent LP estimation we retain all measures in the model
Predictive Tests Based on the measurement model in Table 5 we use
the LISREL V factor score regressions12 to estimate utility for each durable in each budget We then divide by price to forecast value priorities or subtract price to forecast net value priorities As we did with the linear programming forecasts we compare the LISREL V forecasts to actual consumer budget orders (see Fig- ure E)
The LISREL V predictive results appear comparable to the convergent LP estimates that do not vary by fam- ily 73 percent of the correlations are positive and 55 percent are 050 or better for the value priority hypoth- esis while 71 percent are positive and 54 percent are equal or above 050 for the net value priority hypoth- esis13 These correlations are better than those obtained in Figure C for reservation prices lottery orders or combination prizes as single measures and almost as good as those obtained for purchase probabilities Of course LISREL V does not do as well as the family-
The factor score coefficients are 0805 0180 0026 and 001 5 respectively for the four measures
13The value priority hypothesis does slightly better with LISREL V than does the net value priority hypothesis but this result is prob- ably not significant The best comparison between the hypotheses remains the family-by-family analysis (review Table 4)
THE JOURNAL OF CONSUMER RESEARCH
FIGURE E
DISTRIBUTION OF SPEARMAN CORRELATION OF ACTUAL AND PREDICTED BUDGET PRIORITY ORDERS FOR LISREL MODEL AND TWO DIFFERENT HYPOTHESES
U M B E R OF
UDGETS 7 0 -
--6 0
-50 -
-4 0
-30
720 -
10-
- 10 - 5 0 5 10
CORRELATION 1
Predictions based on value priority hypothesis
by-family estimates in Figures A and B Based on the similarity of the LISREL V predictive results to the convergent LP predictive results we have more confi- dence in our proposition that at least one of the value priority hypotheses is a reasonable first-order model of consumer budget planningI4
DISCUSSION The value priority hypothesis and the net value
priority hypothesis are models of how consumers al- locate their budgets to goods Both hypotheses are de- rived from the standard economic model of maximizing utility subject to a budget constraint However both
14CuriouslyLISREL V selects reservation price as the most reliable measure but the predictive tests in Figure D (a measure of validity) suggest that purchase probabilities may predict better Further re- search might estimate a more complex structural model including the dependent variable in the estimation We did not d o this because we felt it more appropriate to have an independent test of predictive ability that did not use the budget orders in the estimation and be- cause the dependent measure was at best an ordinal measure that clearly causes problems with LISREL V Furthermore our goal is to test the value priority hypotheses not to compare the relative merits of linear programming and LISREL V Finally a full comparison of technique would best be done with multiple measures of the dependent variable in a variety of contexts
NUMBER OF
BUDGETS-7 0
f6 0 -
50--4 0
-30
20 -
10-
-10 - 5 0 5 I o C O R R E L A T I O N
2
Predictions based on net value priority hypothesis
recognize the evidence from a variety of scientific dis- ciplines suggesting that behavior as observed may differ from behavior as prescribed Both hypotheses imply that the consumer (or family) uses a simple heuristic that leads to near-optimal behavior under a wide variety of conditions This heuristic is to rank order durables ac- cording to value (or net value) and purchase items in that order up to and including a budget cutoff The two hypotheses differ only in their derivation of the nu- meraire by which durables are ranked The empirical evidence for the hypotheses presented earlier suggests that both are reasonable we are comfortable with pro- posing both for further testing Figures A and B also suggest that the net value priority hypothesis may be the better predictor However before embracing the net value hypothesis there are a number of cautions worth considering These include the complex interrelation- ship between the two hypotheses the distinction be- tween descriptive and prescriptive theories and the empirical observation of high rank-order correlation between up and u - p all of which are discussed in the following sections
Interrelationships Between the Hypotheses If durables were not discrete then the duality and
complementary slackness theorems would imply that
459 VALUE PRIORITY HYPOTHESES
TABLE 6
AN EXAMPLE BUDGET WITH THREE ITEMS
Utility Price
($000~)
Home improvement Landscaping Food processor
994 657 328
060 030 008
NOTE ui Is the utlllty of Item1 and p 1s the prlce
the optimal solutions to MP2 (value priority) and MP3 (net value priority) are the same This means that for a given budget B and budget cutoff A the two cri- teria-~rp 3 A and zi - Ap gt 0-would yield the same overall budget (This can also be seen by dividing through by p in the net value criterion) This does not mean that the order of planned purchasing-the rank order of zip and 11 - Apl-will be the same
Consider three items-a home improvement land- scaping and a food processor-that are part of the budget of one of our respondents a married 37-year- old male with two children and a $65000 family in- come Follow~ng the convergent linear programming estimation procedure described earlier Table 6 displays the utilities scaled such that A = 1 Net value priority predicts the order as shown the home improvement the landscaping and then the food processor Value prior~ty predicts the reverse order For these three items the respondent actually planned the home improve- ment the landscaping and then the food processor For this consumer net value priority appears to be a better descriptive model (review Table 4 for more gen- eral results)
Assumption of Stable X
The example above does not indicate what would happen if the budget 3the utilities zi or the avail- ability of products changed The value priority criterion zip would not change On the other hand the net value criterion would remain unchanged only if A did not change However A-which equals dzi(y)djgt at the optimum solution to MP3-may change if B or the us change15 If the change were sufficiently dramatic the net value ordering could change Thus the net value priority hypothesis assumes that A or at least the con- sumers perceived A changes slowly This assumption is worth testing
A change in A would affect our scaling convention of X = 1 The utilities are a function of A and may themselves change if we change the budget problem yet restrict h to be 1 O For the comparative forecasts in this paper the budget problem does not change hence the restriction X = 1 is not critical for our predictive tests It could become critical in other situations
utPt Value priority ui - Pi
Net value priority
17 22 41
3 2 1
394 357 248
1 2 3
TABLE 7
REVISED BUDGETS
Budget items Utility Price
Value priority Food processor 328 $80 Convection oven 328 $80 Landscaping 657 $300
Total 1313 $460
Net value priority Home improvement 994 $600
Total 994 $600
Descriptive vs Prescriptive Hypotheses
We stated the value priority and the net value priority hypotheses as descriptive hypotheses They may or may not lead the consumer to the best decisions For ex- ample consider the consumer discussed above and suppose there were another durable-say a tabletop convection oven-with the same utility and price as the food processor Then for $600 of budget allocations the two hypotheses recommend the allocations indi- cated in Table 7 Prescriptively (if our utilities are ac- curate) the consumer would have been better off (more utility and less money) using the value priority than net value priority Such examples are easy to create Indeed if there were no integer constraints on durable pur- chases the value priority algorithm is prescriptively the best algorithm Even with integer constraints it does not do badly and has reasonable worst case propertiesI6 (Cornuejols et al 1977 Fisher 1980) However we can also create examples to favor net value priority over value priority so again we must interpret all prescrip- tive results with caution
I6The theoretical worst case is a factor of two For example with a budget of $1000 and two products of utility 502 and 500 that cost $501 and $500 respectively the optimum is two units of the second product rather than one unit of the first product But if the budget can be relaxed or nondurables purchased this worst case result is mitigated
Correlation The value priority and net value priority hypotheses
have quite different behavioral interpretations How- ever they may be difficult to distinguish from obser- vations of behavior because the two criteria rlJpJ and tiJ - pJ have high rank-order correlations To illustrate this we drew 10000random values of 11 and pJ from a uniform distribution each of five times The resulting linear correlation of log (uJpJ)-which is monotonic in r~p-and uJ - pJ was quite high 087 This suggests an even higher rank-order correlation Because of this correlation we must interpret with caution any empir- ical comparisons of observed budget plans This does not mean the hypotheses are indistinguishable for ex- ample verbal protocols or process-tracing technology may be able to distinguish between the hypotheses In summary the evidence favoring at least one of the hy- potheses as a description of durable purchasing is pos- itive However comparisons between the hlpotheses must be made with caution and subject to further testing
SUMMARY AND IMPLICATIONS Based on our data estimation and predictive tests
and subject to future research we posit that
1 The ranking of goods according to a budget priority appears to be a reasonable descriptorpredictor of consumer budget plans
2 Both value and net value provide reasonable approx- imations to the numeraire by which durables are ranked
3 It is feasible to measure utility across categories if multiple convergent measures are used
4 Convergent LP estimation is feasible provides rea- sonable estimates of utility and appears consistent in predictive ability with LiSREL V
5 Consumers vary in the heuristic numeraire-value or net value-they use for ranking
6 Consumers vary in their ability to answer specific question types
The last postulate is no surprise to the behavioral re- searcher who faces often the difficult task of estimating unobserved constructs It does provide a caution to the market researcher or management analyst faced with
We seek to demonstrate the rank-order correlation of upJ and uJ - p Thus we seek monotonic transformations of either or both variables such that the linear correlation is maximized The logarith- mic transformation is effective and provides a reasonable lower bound on the maximum rank correlation Technically some transformation is necessary because the mean and variance of (uJ pJ )are both infinite when uj and p are independent and identically distributed uniform random variables In addition the logarithmic transformation gives the intuitive interpretation that log (uJ p j )= log u - log p which we expect to be related to u - p
THE JOURNAL OF CONSUMER RESEARCH
limited measurement budgets who wants to forecast durable purchases Convergent measurement is prob- ably necessary
Our value priority hypotheses are a first step in un- derstanding consumer budget planning They are rea- sonable descriptorspredictors of actual budget plans but they do not model explicitly the mental processes leading to utility formation and information processing A useful direction for research would be the investi- gation of information processing theories to explain how consumers form utility judgments and whether value net value or another hypothesis is the best description of how they integrate utility and price to form budget plans Our postulates and analyses raise a number of other researchable issues as well Among these are
1 Two-stage predictive tests comparing predicted plans to actual plans and to actual purchase
2 Predictive tests collecting measures on all evoked goods and predicting which will be in the budget plans
3 Alternative methods such as verbal protocols and process tracing that can distinguish between the value and net value hypotheses without being subject to the bane of high rank-order correlation between hy-potheses
4 Collection of data such as perceived interest rates depreciation rates and operating and maintenance costs that could test a n elaborated model such as that in Appendix A
These are a few of the many unanswered questions that can be addressed in future research
Managerial Implications We close on a practical note The value priority hy-
potheses can be and are useful in forecasting sales in existing durable product classes Once utilities are es- timated for a sample of consumers we can forecast the implications of new products improved products or changes in prices or economic conditions New or im- proved products change utilities and economic con- ditions change the budgets For each consumer we compute the value criterion (or net value criterion if X does not change) and recompute the buying order For example a megabyte personal computer a digital stereoVCR or a mini-van may have high enough value (or net value) to enter the budget of some consumers The percent of consumers who now budget for the new product form is a forecast of its category sales
The measurement system described in this paper has been used at General Motors and has provided valuable managerial insight into which durable goods compete most with luxury automobiles For example Table 8 lists those goods that were ranked above automobiles
For example Lyons (1984) used our data internal intelligence on competitive models and a conjoint analysis to forecast changes in utility
VALUE PRIORITY HYPOTHESES
TABLE 8
DURABLE GOODS COMPETING WITH AUTOMOBILES
Durable Percent
1 School tuition 1983 2 Vacation 1983 3 Home improvement (minor) 4 Major clothing 5 Landscaping 6 School tuition 1984 7 GiftsDonations 8 Cameras and Accessories 9 Furniture
10 Home fuel savings device 11 Home improvement (major) 12 Vacation 1984 13 Dishwasher 14 Color television 15 Stereo system 16 Jewelry 17 House 18 Oven 19 MovieVideo camera 20 Video tape recorder 21 RefrigeratorFreezer 22 School tuition 1985 23 Home computer 24 Vacation 1985
NOTE The percents signify the percentage of budgets in which the indicated item was ranked above an automobile when both the item and an automobile were in the budget
when both were in the budget Recent automobile de- sign and marketing campaigns have been based on budget priority analyses that consider product im-provements or advertised image (less maintenance im- proved comfort and so on) Such changes are designed to increase the utility of an auto purchase and thereby move it up in the buying priority The value priority model is also used to determine if the introduction of a new automobile will improve the position of an au- tomobile purchase in the ordering After having con- sumers drive the new automobile in a clinic environ- ment the new automobiles utility is measured relative to the respondents current first choice automobile to determine if it is higher in the respondents priority or- dering than the previous automobile Application work is continuing to ascertain the managerial usefulness of the value priority hypotheses in managing new and es- tablished durable consumer goods
APPENDIX A Multiple Period Hypotheses
The value priority hypothesis and the net value priority hypothesis are readily extendable The equa- tions for the value priority hypothesis were derived in Hauser and Urban (1982) We restate them here in con- densed form and indicate how they apply to the net value priority hypothesis
Let ti be the utility of the r t h item of the jthgood p be the expected price of that good at time f cS be a
zero-one indicator of whether the ithitems of good J is purchased Note 6 gt 0 only if 6 1 - 1 = 1 Let u(y) be the utility of spending y on nondurables in time t Let B be the consumers budget constraint in time t Dbe hisher debt in time t and b be the amount borrowed (saved) in that period Let d be the depreciation rate for good J and r be the interest rate Let c be the op- erating and maintenance cost of durable j n periods after purchase The consumers problem (MP4) is as follows Maximize
T T-1 r C C C I C + C 14 ( ~ 1 )C f J 9 ~ ~ J l ~ J l I
r = l J r q=O I = 1
subject to T-1
pJt(C 61) + C cJJJtt+ )- h~ BI J n= l
Dl = Dl-(I + r ) + b DT=O forallt
6i = 0 1 6Ji = 1 iff 6 = 1 and s gt t
The value priority criterion for the LP relaxation of the integer constraints now becomes
T- I T- 1
Z ( J ~ [C(1 + riT-I[P~+ C ~ j n l - (Al ) q=O n= l
Finally trade-ins are handled by computing net depre- ciated utility gain divided by net price and pairwise complementarity is added with hierarchical dependence of u on another good k For the net value hypothesis the criterion is (numerator of A 1) - p (denominator of A l ) where p is the simplex multiplier of the debt con- straint D = 0
APPENDIX B Dual Linear Program Non-Technical
Summary 4n important concept in linear programming is that
for every linear program there is a related dual linear program The variables of the dual are known as simplex multipliers or shadow prices Each variable of the dual corresponds to a constraint in the original linear pro- gram and represents the sensitivity of relaxing the constraint-ie the amount by which the objective function would change if that constraint were relaxed If the original linear program is a maximization prob- lem then the dual program has as its objective the min- imization of a weighted sum of the dual variables The weights are the constants in the constraints of the orig- inal linear program The constraints of the dual are based on the constraints and objective function of the original linear program For example
Original Dual-max clxi + c2x2 min btul + b2u2 subject to al lxlt a12x2--i 61 st al lul+ a 2 1 ~ 22 cl
~ 2 ~ x 1+ ~ ~ 2 x 2--i b2 2 c2alzui+ a2~u2 X l X ~ 2 0 u u2gt0
Note tha t m corresponds to the first constraint in t he original program a n d represents t he value o f relaxing tha t constraint
T h e duality theorem states the amazing result tha t t h e optimal values of the object functions of t he two linear programs are identical Complementary slackness states tha t if a dua l variable has a non-zero value in the optimal solution t o t he dual t hen t h e corresponding constraint in t he original program must be binding and vice versa Fo r a more complete and technical exposi- t ion see Gass (1969) o r a n y l inear programming text Note tha t the dua l of t he dua l is t he original l inear pro- gram
[Received March 1985 Revised October 19851
REFERENCES
Bentler Peter M and Douglas G Bonett (1980) Significance Tests and Goodness of Fit in the Analysis of Covariance Structures Psychological Bulletin 88 (3) 588-606
Bertan Jenny and John R Hauser (1982) Auto Show Focus Groups Technical Report to General Motors MIT Cambridge MA January
Bettman James R (1979) An Information Processing Theory of Consumer Choice Reading MA Addison-Wesley
Blackorby Charles Daniel Primont and R Robert Russell (1 975) Budgeting Decentralization and Aggregation Annals ofEconomic Social Measurement 4 ( I ) 23-44
Brown DA SF Buck and FG Pyatt (1965) Improving the Sales Forecast for Consumer Durables Journal of Marketing Research 2 (August) 229-234
Clarke Yvonne and Geoffrey N Soutar (1982) Consumer Acquisition Patterns for Durable Goods Australian Ev- idence Journal of Consumer Research 8 (March) 456- 459
Cornuejols Gerald Marshall L Fisher and George L Nem- hauser (1977) Location of Bank Accounts to Optimize Float An Analytic Study of Exact and Approximate Al- gorithms hfanagement Science 23 (April) 789-8 10
Dickson Peter R Robert F Lusch and William L Wilkie (1 983) Consumer Acquisition Priorities for Home Ap- pliances A Reproduction and Re-evaluation Journal of Consumer Research 9 (March) 432-435
and William L Wilkie (1978) The Consumption of Household Durables A Behavioral Review Marketing Science Institute Working Paper Series Cambridge MA December
Duncan Otis D (1975) Introduction to Structural Equation Models New York Academic Press
Fisher Marshall (1980) Worst Case Analysis of Heuristic Algorithms Management Science 26 (January) 1 -17
Gass Saul 1 (1969) Linear Programming Methods and Ap- plications 3rd Edition New York McGraw-Hill
Green Paul E and V Srinivasan (1978) Conjoint Analysis in Consumer Research Issues and Outlook Journal of Consumer Research 5 (September) 103- 123
Hauser John R and Frank S Koppelman (l979) Alter- native Perceptual Mapping Techniques Relative Ac- curacy and Usefulness Journal ofltfarketing Research 16 (November) 495-506
John H Roberts and Glen L Urban (1983) Fore-
THE JOURNAL OF CONSUMER RESEARCH
casting Sales of a New Consumer Durable in Advances and Practices of Marketing Science ed F S Zufryden Providence RI The Institute of Management Sciences 115-128
and Glen L Urban (1982) Prelaunch Forecasting of New Consumer Durables Ideas on a Consumer Value- Priority Model in Analytic Approaches to Product and tfarketing Planning The Second Confirence ed Raj K Srivastava and Allan D Shocker Cambridge MA Mar- keting Science Institute 276-296
Heiner Ronald A (1983) The Origin of Predictable Be- havior American Economic Review 73 (September) 560-595
Heise David R (1975) Caltsal Analjsis New York John Wiley
Johnson Eric J and Amos Tversky (1983) Affect Gener- alization and the Perception of Risk Journal of Per- sonulily and Social Psychology 45 ( I) 20-3 1
Joreskog Karl G and Dag Sorbom (198 I) LISREL Anabois of Linear Structural Relationships by the Method of hfaximum Likelihood version V Chicago IL National Educational Resources
Juster F Thomas (1 966) Consumer Buying Intentions and Purchase Probability An Experiment in Survey Design Journal of the American Statistical Association 6 1 658- 696
Kasuiis Jack J Robert F Lusch and Edward F Stafford Jr (1979) Consumer Acquisition Patterns for Durable Goods Journal o f Consumer Research 6 (June) 47- 57
Keon John W (1980) The Bargain Value Model and a Comparison of Managerial Implications with the Linear Learning Model hlanagement Science 26 (November) 11 17-1 130
Lyons Larry (1 984) Forecasting the Impact of Competitive Entries on the Sales of a New Consumer Durable SM Thesis Sloan School of Management MIT Cam-bridge MA 02 139
McFadden David (1974) Conditional Logit Analysis of Qualitative Choice Behavior in Frontiers of Econo-metrics ed P Zarembka New York Academic Press
Paroush Jacob (1965) The Order of Acquisition of Con- sumer Durables Econometrica 33 (January) 225-235
Rosen Sherwin (1 974) Hedonic Prices and Implicit Mar- kets Product Differentiation in Pure Competition Journal qf Political Economy 82 ( ~ a n u a r ~ l ~ e b r u a r ~ ) 34-55
Shugan Steve M (1980) The Cost of Thinking Journal of Consumer Research 7 (September) 99- 1 1 1
Srinivasan V (1982) Comments on the Role of Price in Individual Utility Judgments in Choice Models for Buyer Behavior ed Leigh McAlister Greenwich CT JAI Press
and Allan D Shocker (1973) Linear Programming Techniques for Multi-Dimensional Analysis of Prefer- ence Psychometrika 38 (September) 337-370
Sternthal Brian and C Sam Craig (1 982) Consumer Behav- ior 4n Infornlation Processing Perspective Englewood Cliffs NJ Prentice-Hall
Tverskey Amos and Daniel Kahneman (1974) Judgment Under Uncertainty Heuristics and Biases Science 185 1124-1 131
Urban Glen L and John R Hauser (1980) Design and ampfar- keting o f~Yew Products Englewood Cliffs NJ Prentice- Hall
You have printed the following article
The Value Priority Hypotheses for Consumer Budget PlansJohn R Hauser Glen L UrbanThe Journal of Consumer Research Vol 12 No 4 (Mar 1986) pp 446-462Stable URL
httplinksjstororgsicisici=0093-53012819860329123A43C4463ATVPHFC3E20CO3B2-J
This article references the following linked citations If you are trying to access articles from anoff-campus location you may be required to first logon via your library web site to access JSTOR Pleasevisit your librarys website or contact a librarian to learn about options for remote access to JSTOR
References
Improving the Sales Forecast for Consumer DurablesD A Brown S F Buck F G PyattJournal of Marketing Research Vol 2 No 3 (Aug 1965) pp 229-234Stable URL
httplinksjstororgsicisici=0022-2437281965082923A33C2293AITSFFC3E20CO3B2-O
Consumer Acquisition Patterns for Durable Goods Australian EvidenceYvonne Clarke Geoffrey N SoutarThe Journal of Consumer Research Vol 8 No 4 (Mar 1982) pp 456-460Stable URL
httplinksjstororgsicisici=0093-5301281982032983A43C4563ACAPFDG3E20CO3B2-T
Location of Bank Accounts to Optimize Float An Analytic Study of Exact and ApproximateAlgorithmsGerard Cornuejols Marshall L Fisher George L NemhauserManagement Science Vol 23 No 8 (Apr 1977) pp 789-810Stable URL
httplinksjstororgsicisici=0025-19092819770429233A83C7893ALOBATO3E20CO3B2-1
Consumer Acquisition Priorities for Home Appliances A Replication and Re-evaluationPeter R Dickson Robert F Lusch William L WilkieThe Journal of Consumer Research Vol 9 No 4 (Mar 1983) pp 432-435Stable URL
httplinksjstororgsicisici=0093-5301281983032993A43C4323ACAPFHA3E20CO3B2-E
httpwwwjstororg
LINKED CITATIONS- Page 1 of 3 -
Worst-Case Analysis of Heuristic AlgorithmsMarshall L FisherManagement Science Vol 26 No 1 (Jan 1980) pp 1-17Stable URL
httplinksjstororgsicisici=0025-19092819800129263A13C13AWAOHA3E20CO3B2-4
Conjoint Analysis in Consumer Research Issues and OutlookPaul E Green V SrinivasanThe Journal of Consumer Research Vol 5 No 2 (Sep 1978) pp 103-123Stable URL
httplinksjstororgsicisici=0093-5301281978092953A23C1033ACAICRI3E20CO3B2-5
Alternative Perceptual Mapping Techniques Relative Accuracy and UsefulnessJohn R Hauser Frank S KoppelmanJournal of Marketing Research Vol 16 No 4 (Nov 1979) pp 495-506Stable URL
httplinksjstororgsicisici=0022-24372819791129163A43C4953AAPMTRA3E20CO3B2-23
The Origin of Predictable BehaviorRonald A HeinerThe American Economic Review Vol 73 No 4 (Sep 1983) pp 560-595Stable URL
httplinksjstororgsicisici=0002-82822819830929733A43C5603ATOOPB3E20CO3B2-R
Consumer Buying Intentions and Purchase Probability An Experiment in Survey DesignF Thomas JusterJournal of the American Statistical Association Vol 61 No 315 (Sep 1966) pp 658-696Stable URL
httplinksjstororgsicisici=0162-14592819660929613A3153C6583ACBIAPP3E20CO3B2-M
Consumer Acquistion Patterns for Durable GoodsJack J Kasulis Robert F Lusch Edward F Stafford JrThe Journal of Consumer Research Vol 6 No 1 (Jun 1979) pp 47-57Stable URL
httplinksjstororgsicisici=0093-5301281979062963A13C473ACAPFDG3E20CO3B2-S
httpwwwjstororg
LINKED CITATIONS- Page 2 of 3 -
The Bargain Value Model and a Comparison of Managerial Implications with the LinearLearning ModelJohn W KeonManagement Science Vol 26 No 11 (Nov 1980) pp 1117-1130Stable URL
httplinksjstororgsicisici=0025-19092819801129263A113C11173ATBVMAA3E20CO3B2-G
The Order of Acquisition of Consumer DurablesJacob ParoushEconometrica Vol 33 No 1 (Jan 1965) pp 225-235Stable URL
httplinksjstororgsicisici=0012-96822819650129333A13C2253ATOOAOC3E20CO3B2-3
Hedonic Prices and Implicit Markets Product Differentiation in Pure CompetitionSherwin RosenThe Journal of Political Economy Vol 82 No 1 (Jan - Feb 1974) pp 34-55Stable URL
httplinksjstororgsicisici=0022-3808281974012F0229823A13C343AHPAIMP3E20CO3B2-U
The Cost of ThinkingSteven M ShuganThe Journal of Consumer Research Vol 7 No 2 (Sep 1980) pp 99-111Stable URL
httplinksjstororgsicisici=0093-5301281980092973A23C993ATCOT3E20CO3B2-J
httpwwwjstororg
LINKED CITATIONS- Page 3 of 3 -
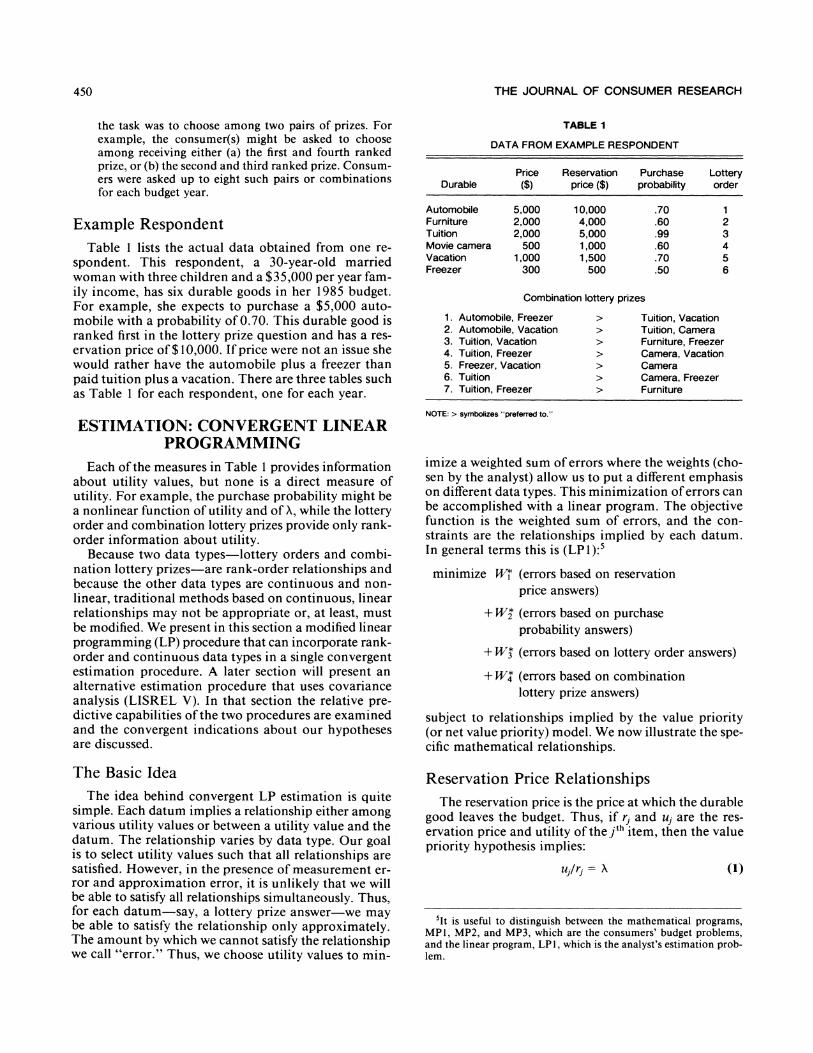
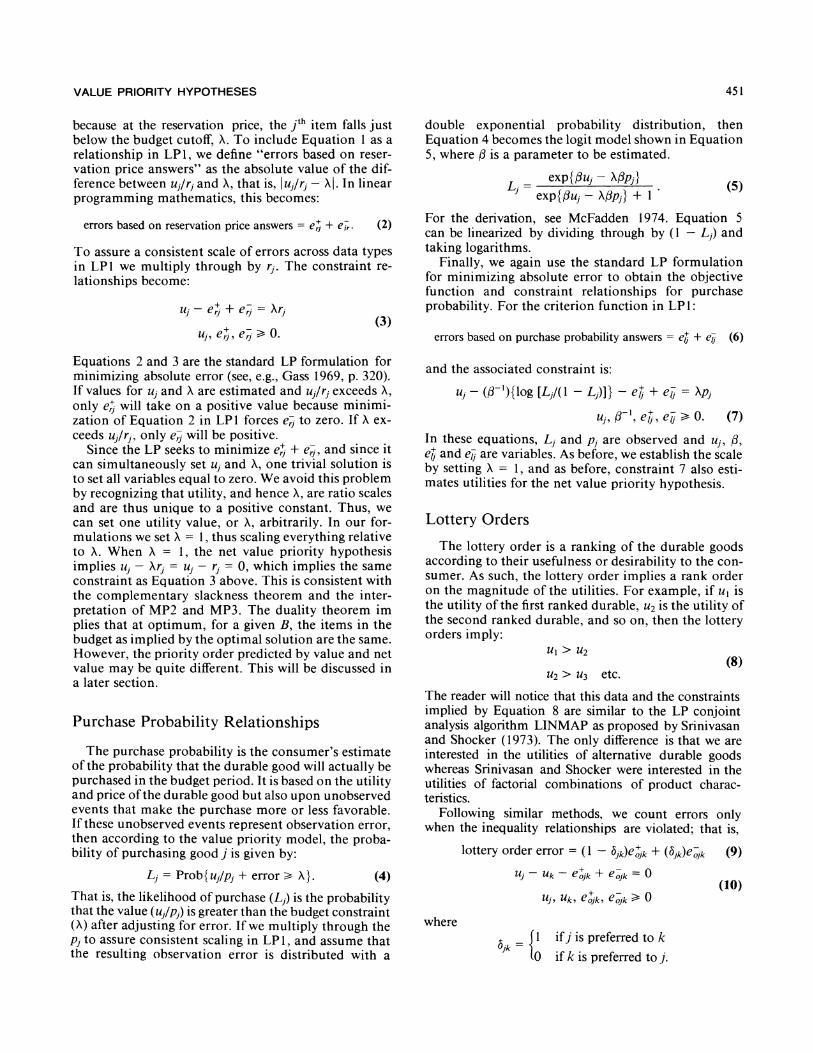
VALUE PRIORITY HYPOTHESES
because at the reservation price the jthitem falls just below the budget cutoff A To include Equation 1 as a relationship in LP l we define errors based on reser- vation price answers as the absolute value of the dif- ference between ur and A that is lurj - XI In linear programming mathematics this becomes
errors based on reservation price answers = e + e (2)
To assure a consistent scale of errors across data types in LPI we multiply through by r The constraint re- lationships become
Equations 2 and 3 are the standard LP formulation for minimizing absolute error (see eg Gass 1969 p 320) If values for u and X are estimated and ur exceeds A only e$ will take on a positive value because minimi- zation of Equation 2 in LPI forces e to zero If X ex-ceeds ujrj only e will be positive
Since the LP seeks to minimize e + e and since it can simultaneously set uj and A one trivial solution is to set all variables equal to zero We avoid this problem by recognizing that utility and hence X are ratio scales and are thus unique to a positive constant Thus we can set one utility value or A arbitrarily In our for- mulations we set X = 1 thus scaling everything relative to X When X = 1 the net value priority hypothesis implies 14 - Xr = u - r = 0 which implies the same constraint as Equation 3 above This is consistent with the complementary slackness theorem and the inter- pretation of MP2 and MP3 The duality theorem im plies that at optimum for a given B the items in the budget as implied by the optimal solution are the same However the priority order predicted by value and net value may be quite different This will be discussed in a later section
Purchase Probability Relationships
The purchase probability is the consumers estimate of the probability that the durable good will actually be purchased in the budget period It is based on the utility and price of the durable good but also upon unobserved events that make the purchase more or less favorable If these unobserved events represent observation error then according to the value priority model the proba- bility of purchasing good j is given by
L = Prob upJ + error gt A) (4)
That is the likelihood of purchase (L)is the probability that the value (up) is greater than the budget constraint (A) after adjusting for error If we multiply through the p to assure consistent scaling in LP l and assume that the resulting observation error is distributed with a
double exponential probability distribution then Equation 4 becomes the logit model shown in Equation 5 where (3 is a parameter to be estimated
For the derivation see McFadden 1974 Equation 5 can be linearized by dividing through by (1 - Lj) and taking logarithms
Finally we again use the standard LP formulation for minimizing absolute error to obtain the objective function and constraint relationships for purchase probability For the criterion function in LPl
errors based on purchase probability answers = ec + e (6)
and the associated constraint is
u - (P-)log [Ll(l - L)]- e i + e = XP
In these equations L and p are observed and u (3 efi and e are variables As before we establish the scale by setting X = 1 and as before constraint 7 also esti- mates utilities for the net value priority hypothesis
Lottery Orders
The lottery order is a ranking of the durable goods according to their usefulness or desirability to the con- sumer As such the lottery order implies a rank order on the magnitude of the utilities For example if ul is the utility of the first ranked durable uZ is the utility of the second ranked durable and so on then the lottery orders imply
U I gt u2 (8)
uz gt u3 etc
The reader will notice that this data and the constraints implied by Equation 8 are similar to the LP conjoint analysis algorithm LINMAP as proposed by Srinivasan and Shocker (1973) The only difference is that we are interested in the utilities of alternative durable goods whereas Srinivasan and Shocker were interested in the utilities of factorial combinations of product charac-teristics
Following similar methods we count errors only when the inequality relationships are violated that is
lottery order error = ( 1 - 6k)ek + (6k)ek (9)
where if j is preferred to k
= 1 6k
0 if k is preferred to j
-- --
THE JOURNAL OF CONSUMER RESEARCH
In Equations 9 and 10 the (0 1) variable dJk is the answer to the lottery order question that tells us which product is preferred as a prize in the lottery Because the relationship is specified directly in terms of utility Equations 9 and 10 apply for both the value priority and net value priority hypotheses Unlike Srinivasan and Shocker (1973) we need not worry about the scaling of the utilities because the scaling is already established by the constraints associated with the reservation price andor purchase probability data6
Combination Lottery Prizes The combination lottery prize questions imply rank-
order relationships among pairs of utilities For ex-ample if the combination of goods 1 and 4 is preferred to the combination of goods 2 and 3 then
Objective functions for the paired comparison lottery error
(1 - d m k h + (arn)eFrn (12)
and formal constraints similar to 10 can be established for each combination lottery question m For ease of exposition we do not repeat them here
Summary The estimation LP is now to minimize the weighted
sum of errors given by Equations LPl 2 6 9 and 12 subject to the constraints of 3 7 10 and 11 For ex- ample for the six durable goods in Table 1 there are six reservation price relationships six probablity rela- tionships five lottery order relationships and seven combination lottery prize relationships totalling 24 constraints and 24 independent errors in the objective function Because of the complementary slackness and duality theorems LPl applies for both the value priority and the net value priority hypotheses
PREDICTING BUDGET PLANS The data on reservation prices purchase probabili-
ties lottery orders and combination lottery prizes give us the ability to estimate the utilities of the goods in an individuals or a familys budget If the value priority hypothesis andor the net value priority hypothesis is a reasonable descriptive representation of consumer purchasing behavior then the rank order of value (net value)-that is estimated utility divided by price (minus price)-should provide an estimate of the con- sumers rank-order buying priorities It will not be per- fect due to measurement and approximation errors We
6This implies that either the weight associated with reservation price ( W in LPI) andor with purchase probabilities (W in LPI) must be non-zero to establish scaling in terms of A
TABLE 2
EXAMPLE PREDICTIVE TEST
Actual Utility Value budget
Estimated Price + price priority priority Durable utility (000s) (000s) order order
Automobile 1000 50 20 3 4 Furniture 400 20 20 3 3 Tuition 1027 20 51 1 2 Movie
camera 122 05 25 2 1 Vacation 150 1O 15 5 6 Freezer 030 03 1O 6 5
NOTE Cwrelation of estimate with budget priority Spearman 0 = 087 Kendall i= 069
formulate a predictive test by comparing the estimated utilities (divided by or minus price) to the consumers budget priorities
Our predictive test is a comparison of budget plans as predicted by the value priority hypotheses to budget plans as stated directly by the consumers Because of uncertain and unexpected events such as change in the economy shortage or surplus of raw materials unex- pected raise or bonus loss of employment change of residence and so on actual purchases over the three years may differ from budget plans (Dickson and Wilkie 1978) By comparing predicted plans with actual plans we examine the value priority hypotheses as approxi- mate explanations of how consumers believe they will act We will illustrate our predictive tests in the next section
A different predictive test would compare predicted plans with actual purchases Such a test has the strength of external validity but the weakness of confounding the effect of plans and of unexpected events Since it was not feasible to observe three years of actual pur- chases (and unexpected events) within our research project we must leave such tests to future research
Example Predictive Test Consider the data in Table 1 and suppose we place
equal weight on each data type-that is W = W2= W3 = W4Applying convergent LP estimation provides the estimates of utility shown in the second column of Table 2 Dividing by price (third column) gives the estimates in the fourth column of Table 2 Notice that the esti- mated utilities would predict that this consumer would rank tuition as her first budget priority (value = 5 l) a movie camera as her second budget priority (value = 25) and a freezer as her last budget priority (value = 10)
In comparing the budget priority predicted by the estimated utilities to the budget priority actually ob- served it must be remembered that the observed budget priorities were not used in the estimation Thus the
VALUE PRIORITY HYPOTHESES
TABLE 3
VARYING WEIGHTS ON TYPES OF INPUT DATA FOR EXAMPLE RESPONDENT
Spearman Weighting scheme correlation
Equal weights to all four types 87 Resewation price weighted heavily 31 Purchase probability weighted heavily 82 Lottery order weighted heavily 82 Paired lottery prizes weighted heavily 87
NOTE Weightedheaq means the rebvant weight is 100 timesmore thanothers We~hts are not set equal to zero to maintain scaling as discussed in the text
comparison in Table 2 is a test of predictive ability not of data-fitting ability Comparing rank orders implied by the data in the fifth column to the sixth column of Table 2 we see that the predictions are reasonable but not perfect Tuition and the movie camera are predicted and observed to be the top two items but estimated value predicts tuition as the top priority while the con- sumer feels that the movie camera is her top priority Overall the Spearman rank-order correlation of the predicted rank from utility per dollar (column 5) and the actual rank (column 6) is 087 while the Kendall rank-order correlation is 069
However equal weighting of the data types is not the only choice For example Table 3 indicates the results we obtained by using each data source separately For this consumer it appears that the purchase probabilities lottery orders and paired lottery prizes each alone pro- vides reasonable estimates of budget priorities however in this case reservation price data do not appear to be as good as the other measures In fact if we drop res- ervation prices and use equal weights on the other three data sources we get a higher rank-order correlation- 093-than if we use all four data sources
Testing the net value priority hypothesis proceeds similarly The only difference is that we subtract price (in $000~) from the estimated utility rather than divide by price For example for the automobile the net value criterion is 1000 - 500 = 500 which turns out to be ranked second For equal Ws for this respondent the net value priority hypothesis produces a Spearman rank-order correlation of 054 Thus for this respondent (with equal Ws) the value priority hypothesis appears to predict better than the net value priority hypothesis Unfortunately because the tests are of different hy- potheses rather than of nested hypotheses we cannot be rigorous and state whether this difference is statis- tically significant
We report only the Spearman correlation for ease of exposition Results are similar to Kendalls T This applies for the remainder of the paper
FIGURE A
DISTRIBUTION OF SPEARMAN CORRELATION OF ACTUAL AND PREDICTED BUDGET PRIORITY ORDERS FOR VALUE
PRIORITY HYPOTHESIS
N U M B E R O F
BUDGETS
-100 - 75 -50 -25 OO 25 50 -75 t o to to to t o t o t o t 0
-75 -50 -25 -00 25 50 75 100
S P E A R M A N CORRELATION
Predictive Tests Across Individuals for the Value Priority Hypothesis
Our sample yields 522 potential budgets (1 74 families X 3 years) Sixty budgets ( I 15 percent) had one or more values missing for either an explanatory or a predictive measure These were spread across measures and de- mographics and did not appear to represent a systematic bias in measurement Of the remaining 462 budgets 247 had 0 1 or 2 durables planned Although the value priority (or net value priority) hypothesis applies to such small budgets predictions would be perfect by definition for 0 or 1 items and perfect by chance 50 percent of the time for 2 items in a budget We felt that this would bias our results upward artificially so we restricted our- selves to the more difficult task of predicting the 21 5 budgets which contained at least 3 durables
We applied the predictive tests as illustrated in Tables 1 2 and 3 to each individuals (or familys) budgets in the resulting sample To investigate the relative effec- tiveness of various measures we estimated utilities for each individual (or family) for equal weights ( W = W = W3 = W4) for weighting heavily each data source (as in Table 3) and for weighting heavily combinations of data sources (eg reservation prices and purchase probabilities) Even with todays mainframe computers and efficient LP software it was not feasible compu- tationally to search all possible combinations of Ws
We summarize the data in two ways To examine the value priority and net value priority hypotheses we re- port predictions based on the best set of Ws (from our
Of these annual budgets 84 had three items 54 had four items 35 had five items and 22 had six items The remainder had seven or more items up to a high of 12 items We detected no systematic bias based on the number of items in a budget
THE JOURNAL OF CONSUMER RESEARCH
FIGURE B
DISTRIBUTION OF SPEARMAN CORRELATION OF ACTUAL AND PREDICTED BUDGET PRIORITY ORDERS
FOR NET VALUE HYPOTHESIS N U M B E R
OF BUDGETS
t o t o t o t o t o t o t o t 0 - 75 - 5 0 - 2 5 -OO 25 5 0 75 100
S F E A R M A N C O R R E L A T I O N
limited search as described above) for each individual or family Then to examine the relative merits of each data source we keep the Ws the same for all individuals and families Other means of summarizing the data provide the same qualitative implications and are noted as appropriate
Figure A reports the Spearman correlations of the actual and predicted budget priorities for the value priority hypothesis It is based on the best Ws for each individual (or family) but we use the same weights for all his her or their budgets Overall the value priority hypothesis seems reasonable Despite potential mea- surement error and conservative reporting due to elim- inating the favorable budgets of 0 1 or 2 items roughly 83 percent of the budgets have positive correlations 60 percent have correlations of 050 or better the 35 per- cent have correlations of 075 or better Significance levels are complex (because many ties are possible) vary by budget (the number of items in each budget varies) and do not apply between hypotheses There is no single overall critical value that can be applied to Figure A
Comparison of the Value Priority and Net Value Priority Hypotheses
Figure B reports the Spearman correlations of actual and predicted budget priorities for the net value hy- pothesis The net value priority hypothesis also appears to be a reasonable description of consumer purchasing behavior Roughly 9 1 percent of the budgets have pos- itive correlations 84 percent have correlations of 050 or better and 5 1 percent have correlations of 075 or better The net value hypothesis appears to do somewhat better than the value hypothesis
TABLE 4
COMPARISON OF VALUE PRIORITY AND NET VALUE PRIORITY HYPOTHESES
Budgets
Value priority Net value priority Weighting scheme predicts best predicts best
Number of budgets 56 122 Average number of
productsbudget 457 461 Average number of
autoslbudget 048 036 Average price of
products in budget $3278 $3635
Average reservation price of product in budget $4232 $4349
Average age 437 441 Average income $36200 $36300
Examining consumer by consumer the Spearman correlations of actual and predicted budget plans 122 budgets (57 percent) were predicted better by net value priority 56 budgets (26 percent) were predicted better by value priority and 37 budgets (1 7 percent) were pre- dicted equally well by both As Table 4 suggests we found no significant demographic differences that sug- gest when one hypothesis predicts better than the other
In summary both hypotheses do well neither is re- jected and both are retained for future empirical testing Although net value priority does better in our tests the issue is very complex because of the theoretical inter- relationships among the hypotheses (through the duality theorem) We will interpret our results in light of these interrelationships in a later section
Variation Across Alternative Weightings of Data Types
Figure C reports distributions of Spearman correla- tion of actual and predicted budget priority orders for each of the data sources For example if we make W much larger than W2 W3 and W4 we emphasize res- ervation prices as the primary data source as in panel
The Figure C results are based on weights that do not vary across individual families Overall predictions based on reservation prices do better than random (67 percent are positive) but not nearly as well as they did in Figure B This is not surprising because reservation price is a complex concept for many consumers causing the quality of data to vary across consumers Our ex- ample respondent appears to have understood the con-
We report the results for net value priority here Results for value priority are qualitatively the same and in about the same relationship as summarized by Figures A and B
5 0
VALUE PRIORITY HYPOTHESES
FIGURE C
DISTRIBUTIONS OF SPEARMAN CORRELATION OF ACTUAL AND PREDICTED BUDGET PRIORITY ORDERS FOR FOUR DIFFERENT DATA SOURCES
N U M B E R N U M B E R 0 F OF
B U D G E T S BUDGETS
CORRELATION CORRE L A T I O N 1 2
Prediction based on reservation price Prediction based on purchase probabilities
N U M B E R NUMBER O F OF
BUDGETS BUDGETS
CORR E L A T l O N C O R R E L A T I O N 3 4
Prediction based on lottery order Prediction based on combination lottery prizes
THE JOURNAL OF CONSUMER RESEARCH
cept but other respondents clearly did not For ex- ample some consumers gave a reservation price of $2001 for an item with an expected price of $2000 Other consumers found it hard to imagine the item staying the same as the price rises
Figure C also reports the results for emphasizing data on purchase probabilities lottery orders and combi- nation lottery prize answers Of the data sources pur- chase probabilities are clearly the best indicators of budget priorities (81 percent positive and 60 percent with correlations of 050 or better) Lottery orders and combination lottery prizes (67 percent and 69 percent positive respectively) do about as well as reservation prices Results for combinations of two three and four data sources tend to be in the range of those in Figure C Those results also suggest that of the four data sources purchase probabilities tend to predict budget priorities best l o
Although purchase probability measures appear to be the best indicators of budget priorities Figure B sug- gests that consumers do vary in their abilities to answer any given question format We recommend a conver- gent estimation approach that utilizes all four data sources Convergent linear programming is one such approach we will illustrate another in a later section
Summary of Predictive Tests Based on convergent linear programming estimation
with all four data sources we are able to estimate utility values for durable products which with price forecast well consumers budget orders We feel that this is rea- sonable preliminary evidence that the hypotheses are good first order approximations to consumers pur-chasing ofdurable goods Elaborations of the hypotheses (Appendix A) may improve the approximation and predict better The comparison of value priority and net value priority shows that both criteria predict well consumers budget priorities Net value priority (fo- cusing on the marginal increase in net utility) does better than value priority (focusing on the budget constraint) but the results do vary by individuals andor families We found no systematic reason for the variations but further research may suggest some hypotheses Finally consumers do vary in their ability to respond to complex utility questions suggesting that utility is best measured with multiple questions and with at least one form of convergent estimation
ALTERNATIVE ESTIMATION PROCEDURE LISREL V
Convergent linear programming is one way to in- corporate multiple data sources Its strengths are that it can readily accommodate both ordinal and cardinal
Figure C gives one indication of how well purchase probabilities alone would predict budget plans
FIGURE D
MEASUREMENT MODEL FOR LISREL V ESTIMATION
I 1
ERROR ( S I l RESERVATION P R I C E
I TRANSFORMED 1 ERROR PURCHASE
U T I L I T Y
LOTTERY ERROR O R D E R S
ERROR (84) COMBINATION P R I Z E S
NOTE Data sources (boxes) are indicators of the unobservable utllity values (arcle)
measures and that the theoretical relationships sug- gested by the value priority hypotheses can be repre- sented exactlv within the structure Furthermore it is readily applied on a consumer-by-consumer basis to identify potential heterogeneities in response to ques- tion format andor planning Its disadvantages are that (1) the cost of searching all combinations of weights ( Wi W Z W3 and W4) to find a single best fit is pro- hibitive and (2) statistical properties of linear pro- gramming estimation are not well known
There are other estimation procedures that use mul- tiple data sources Each has its relative strengths and weaknesses We select one such estimation procedure to demonstrate that our basic result-the reasonable-ness of the value priority hypotheses-is robust with respect to the estimation procedure The procedure we choose is covariance analysis as implemented by Jo- reskog and Sorboms ( 198 1) LISREL V (see Heise 1975 Duncan 1975 and Bentler and Bonett 1980 for more details on covariance analysis) The advantages of LIS- REL V are that (1) a best set ofweights (in the maximum likelihood sense) can be found for the proper emphasis among data sources and (2) the statistical properties are well known when normality conditions hold The disadvantages are that (1) because LISREL is very sen- sitive to departures from normality (see Joreskog and Sorbom 1981 page I39) it may not do well with our ordinal data or with our transformed probabilities and (2) the estimation is infeasible for small sample sizes as would be the case with individual-by-individual analyses (see Bentler and Bonett 1980 p 591) Since the relative advantages and disadvantages of LISREL V compensate those of convergent linear programming estimation the resulting estimation provides valuable insight into the value priority hypotheses
Basic Estimation Model The LISREL V analysis corresponding to convergent
LP estimation is the measurement model shown in Fig- ure D The data sources (boxes) are indicators of the
- -
VALUE PRIORITY HYPOTHESES
unobservable utility values (circle) thus each measure- ment-say a reservation price-can be thought of as resulting from the unobserved utility value and a mea- surement error (6s in Figure D) The goal of LISREL V is to estimate the correlations (known as factor load- ings) relating the observables to the unobserved utility and then to use the structure to estimate a quantity (known as a factor score) for the unobserved utility We use the theoretical relationships as implied by the value priority hypotheses to specify the appropriate transfor- mations of the raw measurements
Measures Based on the value priority hypotheses the appro-
priate measures are
I Reservation prices as implied by Equation 3 with h = 1
2 Logit transformed probabilities as implied by Equa- tion 7 with h = l We allow the estimation to deter- mine the scaling constant -
3 Lottery orders These orderings are rank-order mea- sures and may violate strict normality assumptions but they are monotonic in utility
4 Combination lottery prizes The rank-order relation- ships implied by Equations 11 and 12 are complex dependent on each individual and interrelated with lottery orders They are not readily handled by the linear equations of LISREL V We use as a surrogate the number of times a durable is chosen from the set of combinations This measure is clearly monotonic in utility Again normality is a concern
Estimation Results The maximum likelihood estimation results are
shown in Table 5 The estimation is based on 932 ob- servations corresponding to the total number of budg- eted items in the 2 15 budgets Overall the measurement model does remarkably well The goodness of fit in- dex-which is independent of sample size and rela- tively robust against departures from normality (Jorgskog and Sorbom 198 1 page 14 1)-suggests that 999 percent of relative covariance is accounted for by the model Even adjusted for degrees of freedom this measure is 989 percent The coefficient of determina- tion for the overall model is 924 percent suggesting high overall reliability of the measurement model The chi-squared value is low-087 indicating that no ad- dition of free parameters would improve the model sig- nificantly
The model in Table 5 accounts for measurement correlation among the rank-order measures as suggested by the corresponding modification index (Joreskog and Sorbom 198 1 p 11119) Without the extra free parameter all coefficients and statistics except the chi- squared (401 with 2 df) are virtually identical to those in Table 5
TABLE 5
ESTIMATION RESULTS FOR LISREL V MEASUREMENT MODEL
Estimated Squared factor Asymptotic correlation
Variable loading t-statistic (reliability)
Reservation price 954 230 911 Transformed probabilities 812 207 660 Lottery orders 293 86 086 Combination prizes I66 49 027
Goodness-of-fit index Adjusted goodness-of-fit
index Coefficient of
determination Root mean square
residual Chi-squared (1degree of freedom)
For the specific measures reservation prices have the highest reliability followed by transformed probabilities Both have excellent asymptotic t-statistics The rank- order measures fare less well with low reliabilities but good t-statistics Normalized residuals (not shown) are reasonable for the cardinal measures but do depart somewhat for the rank-order measures Since the latter is to be expected the t-statistics are acceptable and we desire a comparison with the convergent LP estimation we retain all measures in the model
Predictive Tests Based on the measurement model in Table 5 we use
the LISREL V factor score regressions12 to estimate utility for each durable in each budget We then divide by price to forecast value priorities or subtract price to forecast net value priorities As we did with the linear programming forecasts we compare the LISREL V forecasts to actual consumer budget orders (see Fig- ure E)
The LISREL V predictive results appear comparable to the convergent LP estimates that do not vary by fam- ily 73 percent of the correlations are positive and 55 percent are 050 or better for the value priority hypoth- esis while 71 percent are positive and 54 percent are equal or above 050 for the net value priority hypoth- esis13 These correlations are better than those obtained in Figure C for reservation prices lottery orders or combination prizes as single measures and almost as good as those obtained for purchase probabilities Of course LISREL V does not do as well as the family-
The factor score coefficients are 0805 0180 0026 and 001 5 respectively for the four measures
13The value priority hypothesis does slightly better with LISREL V than does the net value priority hypothesis but this result is prob- ably not significant The best comparison between the hypotheses remains the family-by-family analysis (review Table 4)
THE JOURNAL OF CONSUMER RESEARCH
FIGURE E
DISTRIBUTION OF SPEARMAN CORRELATION OF ACTUAL AND PREDICTED BUDGET PRIORITY ORDERS FOR LISREL MODEL AND TWO DIFFERENT HYPOTHESES
U M B E R OF
UDGETS 7 0 -
--6 0
-50 -
-4 0
-30
720 -
10-
- 10 - 5 0 5 10
CORRELATION 1
Predictions based on value priority hypothesis
by-family estimates in Figures A and B Based on the similarity of the LISREL V predictive results to the convergent LP predictive results we have more confi- dence in our proposition that at least one of the value priority hypotheses is a reasonable first-order model of consumer budget planningI4
DISCUSSION The value priority hypothesis and the net value
priority hypothesis are models of how consumers al- locate their budgets to goods Both hypotheses are de- rived from the standard economic model of maximizing utility subject to a budget constraint However both
14CuriouslyLISREL V selects reservation price as the most reliable measure but the predictive tests in Figure D (a measure of validity) suggest that purchase probabilities may predict better Further re- search might estimate a more complex structural model including the dependent variable in the estimation We did not d o this because we felt it more appropriate to have an independent test of predictive ability that did not use the budget orders in the estimation and be- cause the dependent measure was at best an ordinal measure that clearly causes problems with LISREL V Furthermore our goal is to test the value priority hypotheses not to compare the relative merits of linear programming and LISREL V Finally a full comparison of technique would best be done with multiple measures of the dependent variable in a variety of contexts
NUMBER OF
BUDGETS-7 0
f6 0 -
50--4 0
-30
20 -
10-
-10 - 5 0 5 I o C O R R E L A T I O N
2
Predictions based on net value priority hypothesis
recognize the evidence from a variety of scientific dis- ciplines suggesting that behavior as observed may differ from behavior as prescribed Both hypotheses imply that the consumer (or family) uses a simple heuristic that leads to near-optimal behavior under a wide variety of conditions This heuristic is to rank order durables ac- cording to value (or net value) and purchase items in that order up to and including a budget cutoff The two hypotheses differ only in their derivation of the nu- meraire by which durables are ranked The empirical evidence for the hypotheses presented earlier suggests that both are reasonable we are comfortable with pro- posing both for further testing Figures A and B also suggest that the net value priority hypothesis may be the better predictor However before embracing the net value hypothesis there are a number of cautions worth considering These include the complex interrelation- ship between the two hypotheses the distinction be- tween descriptive and prescriptive theories and the empirical observation of high rank-order correlation between up and u - p all of which are discussed in the following sections
Interrelationships Between the Hypotheses If durables were not discrete then the duality and
complementary slackness theorems would imply that
459 VALUE PRIORITY HYPOTHESES
TABLE 6
AN EXAMPLE BUDGET WITH THREE ITEMS
Utility Price
($000~)
Home improvement Landscaping Food processor
994 657 328
060 030 008
NOTE ui Is the utlllty of Item1 and p 1s the prlce
the optimal solutions to MP2 (value priority) and MP3 (net value priority) are the same This means that for a given budget B and budget cutoff A the two cri- teria-~rp 3 A and zi - Ap gt 0-would yield the same overall budget (This can also be seen by dividing through by p in the net value criterion) This does not mean that the order of planned purchasing-the rank order of zip and 11 - Apl-will be the same
Consider three items-a home improvement land- scaping and a food processor-that are part of the budget of one of our respondents a married 37-year- old male with two children and a $65000 family in- come Follow~ng the convergent linear programming estimation procedure described earlier Table 6 displays the utilities scaled such that A = 1 Net value priority predicts the order as shown the home improvement the landscaping and then the food processor Value prior~ty predicts the reverse order For these three items the respondent actually planned the home improve- ment the landscaping and then the food processor For this consumer net value priority appears to be a better descriptive model (review Table 4 for more gen- eral results)
Assumption of Stable X
The example above does not indicate what would happen if the budget 3the utilities zi or the avail- ability of products changed The value priority criterion zip would not change On the other hand the net value criterion would remain unchanged only if A did not change However A-which equals dzi(y)djgt at the optimum solution to MP3-may change if B or the us change15 If the change were sufficiently dramatic the net value ordering could change Thus the net value priority hypothesis assumes that A or at least the con- sumers perceived A changes slowly This assumption is worth testing
A change in A would affect our scaling convention of X = 1 The utilities are a function of A and may themselves change if we change the budget problem yet restrict h to be 1 O For the comparative forecasts in this paper the budget problem does not change hence the restriction X = 1 is not critical for our predictive tests It could become critical in other situations
utPt Value priority ui - Pi
Net value priority
17 22 41
3 2 1
394 357 248
1 2 3
TABLE 7
REVISED BUDGETS
Budget items Utility Price
Value priority Food processor 328 $80 Convection oven 328 $80 Landscaping 657 $300
Total 1313 $460
Net value priority Home improvement 994 $600
Total 994 $600
Descriptive vs Prescriptive Hypotheses
We stated the value priority and the net value priority hypotheses as descriptive hypotheses They may or may not lead the consumer to the best decisions For ex- ample consider the consumer discussed above and suppose there were another durable-say a tabletop convection oven-with the same utility and price as the food processor Then for $600 of budget allocations the two hypotheses recommend the allocations indi- cated in Table 7 Prescriptively (if our utilities are ac- curate) the consumer would have been better off (more utility and less money) using the value priority than net value priority Such examples are easy to create Indeed if there were no integer constraints on durable pur- chases the value priority algorithm is prescriptively the best algorithm Even with integer constraints it does not do badly and has reasonable worst case propertiesI6 (Cornuejols et al 1977 Fisher 1980) However we can also create examples to favor net value priority over value priority so again we must interpret all prescrip- tive results with caution
I6The theoretical worst case is a factor of two For example with a budget of $1000 and two products of utility 502 and 500 that cost $501 and $500 respectively the optimum is two units of the second product rather than one unit of the first product But if the budget can be relaxed or nondurables purchased this worst case result is mitigated
Correlation The value priority and net value priority hypotheses
have quite different behavioral interpretations How- ever they may be difficult to distinguish from obser- vations of behavior because the two criteria rlJpJ and tiJ - pJ have high rank-order correlations To illustrate this we drew 10000random values of 11 and pJ from a uniform distribution each of five times The resulting linear correlation of log (uJpJ)-which is monotonic in r~p-and uJ - pJ was quite high 087 This suggests an even higher rank-order correlation Because of this correlation we must interpret with caution any empir- ical comparisons of observed budget plans This does not mean the hypotheses are indistinguishable for ex- ample verbal protocols or process-tracing technology may be able to distinguish between the hypotheses In summary the evidence favoring at least one of the hy- potheses as a description of durable purchasing is pos- itive However comparisons between the hlpotheses must be made with caution and subject to further testing
SUMMARY AND IMPLICATIONS Based on our data estimation and predictive tests
and subject to future research we posit that
1 The ranking of goods according to a budget priority appears to be a reasonable descriptorpredictor of consumer budget plans
2 Both value and net value provide reasonable approx- imations to the numeraire by which durables are ranked
3 It is feasible to measure utility across categories if multiple convergent measures are used
4 Convergent LP estimation is feasible provides rea- sonable estimates of utility and appears consistent in predictive ability with LiSREL V
5 Consumers vary in the heuristic numeraire-value or net value-they use for ranking
6 Consumers vary in their ability to answer specific question types
The last postulate is no surprise to the behavioral re- searcher who faces often the difficult task of estimating unobserved constructs It does provide a caution to the market researcher or management analyst faced with
We seek to demonstrate the rank-order correlation of upJ and uJ - p Thus we seek monotonic transformations of either or both variables such that the linear correlation is maximized The logarith- mic transformation is effective and provides a reasonable lower bound on the maximum rank correlation Technically some transformation is necessary because the mean and variance of (uJ pJ )are both infinite when uj and p are independent and identically distributed uniform random variables In addition the logarithmic transformation gives the intuitive interpretation that log (uJ p j )= log u - log p which we expect to be related to u - p
THE JOURNAL OF CONSUMER RESEARCH
limited measurement budgets who wants to forecast durable purchases Convergent measurement is prob- ably necessary
Our value priority hypotheses are a first step in un- derstanding consumer budget planning They are rea- sonable descriptorspredictors of actual budget plans but they do not model explicitly the mental processes leading to utility formation and information processing A useful direction for research would be the investi- gation of information processing theories to explain how consumers form utility judgments and whether value net value or another hypothesis is the best description of how they integrate utility and price to form budget plans Our postulates and analyses raise a number of other researchable issues as well Among these are
1 Two-stage predictive tests comparing predicted plans to actual plans and to actual purchase
2 Predictive tests collecting measures on all evoked goods and predicting which will be in the budget plans
3 Alternative methods such as verbal protocols and process tracing that can distinguish between the value and net value hypotheses without being subject to the bane of high rank-order correlation between hy-potheses
4 Collection of data such as perceived interest rates depreciation rates and operating and maintenance costs that could test a n elaborated model such as that in Appendix A
These are a few of the many unanswered questions that can be addressed in future research
Managerial Implications We close on a practical note The value priority hy-
potheses can be and are useful in forecasting sales in existing durable product classes Once utilities are es- timated for a sample of consumers we can forecast the implications of new products improved products or changes in prices or economic conditions New or im- proved products change utilities and economic con- ditions change the budgets For each consumer we compute the value criterion (or net value criterion if X does not change) and recompute the buying order For example a megabyte personal computer a digital stereoVCR or a mini-van may have high enough value (or net value) to enter the budget of some consumers The percent of consumers who now budget for the new product form is a forecast of its category sales
The measurement system described in this paper has been used at General Motors and has provided valuable managerial insight into which durable goods compete most with luxury automobiles For example Table 8 lists those goods that were ranked above automobiles
For example Lyons (1984) used our data internal intelligence on competitive models and a conjoint analysis to forecast changes in utility
VALUE PRIORITY HYPOTHESES
TABLE 8
DURABLE GOODS COMPETING WITH AUTOMOBILES
Durable Percent
1 School tuition 1983 2 Vacation 1983 3 Home improvement (minor) 4 Major clothing 5 Landscaping 6 School tuition 1984 7 GiftsDonations 8 Cameras and Accessories 9 Furniture
10 Home fuel savings device 11 Home improvement (major) 12 Vacation 1984 13 Dishwasher 14 Color television 15 Stereo system 16 Jewelry 17 House 18 Oven 19 MovieVideo camera 20 Video tape recorder 21 RefrigeratorFreezer 22 School tuition 1985 23 Home computer 24 Vacation 1985
NOTE The percents signify the percentage of budgets in which the indicated item was ranked above an automobile when both the item and an automobile were in the budget
when both were in the budget Recent automobile de- sign and marketing campaigns have been based on budget priority analyses that consider product im-provements or advertised image (less maintenance im- proved comfort and so on) Such changes are designed to increase the utility of an auto purchase and thereby move it up in the buying priority The value priority model is also used to determine if the introduction of a new automobile will improve the position of an au- tomobile purchase in the ordering After having con- sumers drive the new automobile in a clinic environ- ment the new automobiles utility is measured relative to the respondents current first choice automobile to determine if it is higher in the respondents priority or- dering than the previous automobile Application work is continuing to ascertain the managerial usefulness of the value priority hypotheses in managing new and es- tablished durable consumer goods
APPENDIX A Multiple Period Hypotheses
The value priority hypothesis and the net value priority hypothesis are readily extendable The equa- tions for the value priority hypothesis were derived in Hauser and Urban (1982) We restate them here in con- densed form and indicate how they apply to the net value priority hypothesis
Let ti be the utility of the r t h item of the jthgood p be the expected price of that good at time f cS be a
zero-one indicator of whether the ithitems of good J is purchased Note 6 gt 0 only if 6 1 - 1 = 1 Let u(y) be the utility of spending y on nondurables in time t Let B be the consumers budget constraint in time t Dbe hisher debt in time t and b be the amount borrowed (saved) in that period Let d be the depreciation rate for good J and r be the interest rate Let c be the op- erating and maintenance cost of durable j n periods after purchase The consumers problem (MP4) is as follows Maximize
T T-1 r C C C I C + C 14 ( ~ 1 )C f J 9 ~ ~ J l ~ J l I
r = l J r q=O I = 1
subject to T-1
pJt(C 61) + C cJJJtt+ )- h~ BI J n= l
Dl = Dl-(I + r ) + b DT=O forallt
6i = 0 1 6Ji = 1 iff 6 = 1 and s gt t
The value priority criterion for the LP relaxation of the integer constraints now becomes
T- I T- 1
Z ( J ~ [C(1 + riT-I[P~+ C ~ j n l - (Al ) q=O n= l
Finally trade-ins are handled by computing net depre- ciated utility gain divided by net price and pairwise complementarity is added with hierarchical dependence of u on another good k For the net value hypothesis the criterion is (numerator of A 1) - p (denominator of A l ) where p is the simplex multiplier of the debt con- straint D = 0
APPENDIX B Dual Linear Program Non-Technical
Summary 4n important concept in linear programming is that
for every linear program there is a related dual linear program The variables of the dual are known as simplex multipliers or shadow prices Each variable of the dual corresponds to a constraint in the original linear pro- gram and represents the sensitivity of relaxing the constraint-ie the amount by which the objective function would change if that constraint were relaxed If the original linear program is a maximization prob- lem then the dual program has as its objective the min- imization of a weighted sum of the dual variables The weights are the constants in the constraints of the orig- inal linear program The constraints of the dual are based on the constraints and objective function of the original linear program For example
Original Dual-max clxi + c2x2 min btul + b2u2 subject to al lxlt a12x2--i 61 st al lul+ a 2 1 ~ 22 cl
~ 2 ~ x 1+ ~ ~ 2 x 2--i b2 2 c2alzui+ a2~u2 X l X ~ 2 0 u u2gt0
Note tha t m corresponds to the first constraint in t he original program a n d represents t he value o f relaxing tha t constraint
T h e duality theorem states the amazing result tha t t h e optimal values of the object functions of t he two linear programs are identical Complementary slackness states tha t if a dua l variable has a non-zero value in the optimal solution t o t he dual t hen t h e corresponding constraint in t he original program must be binding and vice versa Fo r a more complete and technical exposi- t ion see Gass (1969) o r a n y l inear programming text Note tha t the dua l of t he dua l is t he original l inear pro- gram
[Received March 1985 Revised October 19851
REFERENCES
Bentler Peter M and Douglas G Bonett (1980) Significance Tests and Goodness of Fit in the Analysis of Covariance Structures Psychological Bulletin 88 (3) 588-606
Bertan Jenny and John R Hauser (1982) Auto Show Focus Groups Technical Report to General Motors MIT Cambridge MA January
Bettman James R (1979) An Information Processing Theory of Consumer Choice Reading MA Addison-Wesley
Blackorby Charles Daniel Primont and R Robert Russell (1 975) Budgeting Decentralization and Aggregation Annals ofEconomic Social Measurement 4 ( I ) 23-44
Brown DA SF Buck and FG Pyatt (1965) Improving the Sales Forecast for Consumer Durables Journal of Marketing Research 2 (August) 229-234
Clarke Yvonne and Geoffrey N Soutar (1982) Consumer Acquisition Patterns for Durable Goods Australian Ev- idence Journal of Consumer Research 8 (March) 456- 459
Cornuejols Gerald Marshall L Fisher and George L Nem- hauser (1977) Location of Bank Accounts to Optimize Float An Analytic Study of Exact and Approximate Al- gorithms hfanagement Science 23 (April) 789-8 10
Dickson Peter R Robert F Lusch and William L Wilkie (1 983) Consumer Acquisition Priorities for Home Ap- pliances A Reproduction and Re-evaluation Journal of Consumer Research 9 (March) 432-435
and William L Wilkie (1978) The Consumption of Household Durables A Behavioral Review Marketing Science Institute Working Paper Series Cambridge MA December
Duncan Otis D (1975) Introduction to Structural Equation Models New York Academic Press
Fisher Marshall (1980) Worst Case Analysis of Heuristic Algorithms Management Science 26 (January) 1 -17
Gass Saul 1 (1969) Linear Programming Methods and Ap- plications 3rd Edition New York McGraw-Hill
Green Paul E and V Srinivasan (1978) Conjoint Analysis in Consumer Research Issues and Outlook Journal of Consumer Research 5 (September) 103- 123
Hauser John R and Frank S Koppelman (l979) Alter- native Perceptual Mapping Techniques Relative Ac- curacy and Usefulness Journal ofltfarketing Research 16 (November) 495-506
John H Roberts and Glen L Urban (1983) Fore-
THE JOURNAL OF CONSUMER RESEARCH
casting Sales of a New Consumer Durable in Advances and Practices of Marketing Science ed F S Zufryden Providence RI The Institute of Management Sciences 115-128
and Glen L Urban (1982) Prelaunch Forecasting of New Consumer Durables Ideas on a Consumer Value- Priority Model in Analytic Approaches to Product and tfarketing Planning The Second Confirence ed Raj K Srivastava and Allan D Shocker Cambridge MA Mar- keting Science Institute 276-296
Heiner Ronald A (1983) The Origin of Predictable Be- havior American Economic Review 73 (September) 560-595
Heise David R (1975) Caltsal Analjsis New York John Wiley
Johnson Eric J and Amos Tversky (1983) Affect Gener- alization and the Perception of Risk Journal of Per- sonulily and Social Psychology 45 ( I) 20-3 1
Joreskog Karl G and Dag Sorbom (198 I) LISREL Anabois of Linear Structural Relationships by the Method of hfaximum Likelihood version V Chicago IL National Educational Resources
Juster F Thomas (1 966) Consumer Buying Intentions and Purchase Probability An Experiment in Survey Design Journal of the American Statistical Association 6 1 658- 696
Kasuiis Jack J Robert F Lusch and Edward F Stafford Jr (1979) Consumer Acquisition Patterns for Durable Goods Journal o f Consumer Research 6 (June) 47- 57
Keon John W (1980) The Bargain Value Model and a Comparison of Managerial Implications with the Linear Learning Model hlanagement Science 26 (November) 11 17-1 130
Lyons Larry (1 984) Forecasting the Impact of Competitive Entries on the Sales of a New Consumer Durable SM Thesis Sloan School of Management MIT Cam-bridge MA 02 139
McFadden David (1974) Conditional Logit Analysis of Qualitative Choice Behavior in Frontiers of Econo-metrics ed P Zarembka New York Academic Press
Paroush Jacob (1965) The Order of Acquisition of Con- sumer Durables Econometrica 33 (January) 225-235
Rosen Sherwin (1 974) Hedonic Prices and Implicit Mar- kets Product Differentiation in Pure Competition Journal qf Political Economy 82 ( ~ a n u a r ~ l ~ e b r u a r ~ ) 34-55
Shugan Steve M (1980) The Cost of Thinking Journal of Consumer Research 7 (September) 99- 1 1 1
Srinivasan V (1982) Comments on the Role of Price in Individual Utility Judgments in Choice Models for Buyer Behavior ed Leigh McAlister Greenwich CT JAI Press
and Allan D Shocker (1973) Linear Programming Techniques for Multi-Dimensional Analysis of Prefer- ence Psychometrika 38 (September) 337-370
Sternthal Brian and C Sam Craig (1 982) Consumer Behav- ior 4n Infornlation Processing Perspective Englewood Cliffs NJ Prentice-Hall
Tverskey Amos and Daniel Kahneman (1974) Judgment Under Uncertainty Heuristics and Biases Science 185 1124-1 131
Urban Glen L and John R Hauser (1980) Design and ampfar- keting o f~Yew Products Englewood Cliffs NJ Prentice- Hall
You have printed the following article
The Value Priority Hypotheses for Consumer Budget PlansJohn R Hauser Glen L UrbanThe Journal of Consumer Research Vol 12 No 4 (Mar 1986) pp 446-462Stable URL
httplinksjstororgsicisici=0093-53012819860329123A43C4463ATVPHFC3E20CO3B2-J
This article references the following linked citations If you are trying to access articles from anoff-campus location you may be required to first logon via your library web site to access JSTOR Pleasevisit your librarys website or contact a librarian to learn about options for remote access to JSTOR
References
Improving the Sales Forecast for Consumer DurablesD A Brown S F Buck F G PyattJournal of Marketing Research Vol 2 No 3 (Aug 1965) pp 229-234Stable URL
httplinksjstororgsicisici=0022-2437281965082923A33C2293AITSFFC3E20CO3B2-O
Consumer Acquisition Patterns for Durable Goods Australian EvidenceYvonne Clarke Geoffrey N SoutarThe Journal of Consumer Research Vol 8 No 4 (Mar 1982) pp 456-460Stable URL
httplinksjstororgsicisici=0093-5301281982032983A43C4563ACAPFDG3E20CO3B2-T
Location of Bank Accounts to Optimize Float An Analytic Study of Exact and ApproximateAlgorithmsGerard Cornuejols Marshall L Fisher George L NemhauserManagement Science Vol 23 No 8 (Apr 1977) pp 789-810Stable URL
httplinksjstororgsicisici=0025-19092819770429233A83C7893ALOBATO3E20CO3B2-1
Consumer Acquisition Priorities for Home Appliances A Replication and Re-evaluationPeter R Dickson Robert F Lusch William L WilkieThe Journal of Consumer Research Vol 9 No 4 (Mar 1983) pp 432-435Stable URL
httplinksjstororgsicisici=0093-5301281983032993A43C4323ACAPFHA3E20CO3B2-E
httpwwwjstororg
LINKED CITATIONS- Page 1 of 3 -
Worst-Case Analysis of Heuristic AlgorithmsMarshall L FisherManagement Science Vol 26 No 1 (Jan 1980) pp 1-17Stable URL
httplinksjstororgsicisici=0025-19092819800129263A13C13AWAOHA3E20CO3B2-4
Conjoint Analysis in Consumer Research Issues and OutlookPaul E Green V SrinivasanThe Journal of Consumer Research Vol 5 No 2 (Sep 1978) pp 103-123Stable URL
httplinksjstororgsicisici=0093-5301281978092953A23C1033ACAICRI3E20CO3B2-5
Alternative Perceptual Mapping Techniques Relative Accuracy and UsefulnessJohn R Hauser Frank S KoppelmanJournal of Marketing Research Vol 16 No 4 (Nov 1979) pp 495-506Stable URL
httplinksjstororgsicisici=0022-24372819791129163A43C4953AAPMTRA3E20CO3B2-23
The Origin of Predictable BehaviorRonald A HeinerThe American Economic Review Vol 73 No 4 (Sep 1983) pp 560-595Stable URL
httplinksjstororgsicisici=0002-82822819830929733A43C5603ATOOPB3E20CO3B2-R
Consumer Buying Intentions and Purchase Probability An Experiment in Survey DesignF Thomas JusterJournal of the American Statistical Association Vol 61 No 315 (Sep 1966) pp 658-696Stable URL
httplinksjstororgsicisici=0162-14592819660929613A3153C6583ACBIAPP3E20CO3B2-M
Consumer Acquistion Patterns for Durable GoodsJack J Kasulis Robert F Lusch Edward F Stafford JrThe Journal of Consumer Research Vol 6 No 1 (Jun 1979) pp 47-57Stable URL
httplinksjstororgsicisici=0093-5301281979062963A13C473ACAPFDG3E20CO3B2-S
httpwwwjstororg
LINKED CITATIONS- Page 2 of 3 -
The Bargain Value Model and a Comparison of Managerial Implications with the LinearLearning ModelJohn W KeonManagement Science Vol 26 No 11 (Nov 1980) pp 1117-1130Stable URL
httplinksjstororgsicisici=0025-19092819801129263A113C11173ATBVMAA3E20CO3B2-G
The Order of Acquisition of Consumer DurablesJacob ParoushEconometrica Vol 33 No 1 (Jan 1965) pp 225-235Stable URL
httplinksjstororgsicisici=0012-96822819650129333A13C2253ATOOAOC3E20CO3B2-3
Hedonic Prices and Implicit Markets Product Differentiation in Pure CompetitionSherwin RosenThe Journal of Political Economy Vol 82 No 1 (Jan - Feb 1974) pp 34-55Stable URL
httplinksjstororgsicisici=0022-3808281974012F0229823A13C343AHPAIMP3E20CO3B2-U
The Cost of ThinkingSteven M ShuganThe Journal of Consumer Research Vol 7 No 2 (Sep 1980) pp 99-111Stable URL
httplinksjstororgsicisici=0093-5301281980092973A23C993ATCOT3E20CO3B2-J
httpwwwjstororg
LINKED CITATIONS- Page 3 of 3 -
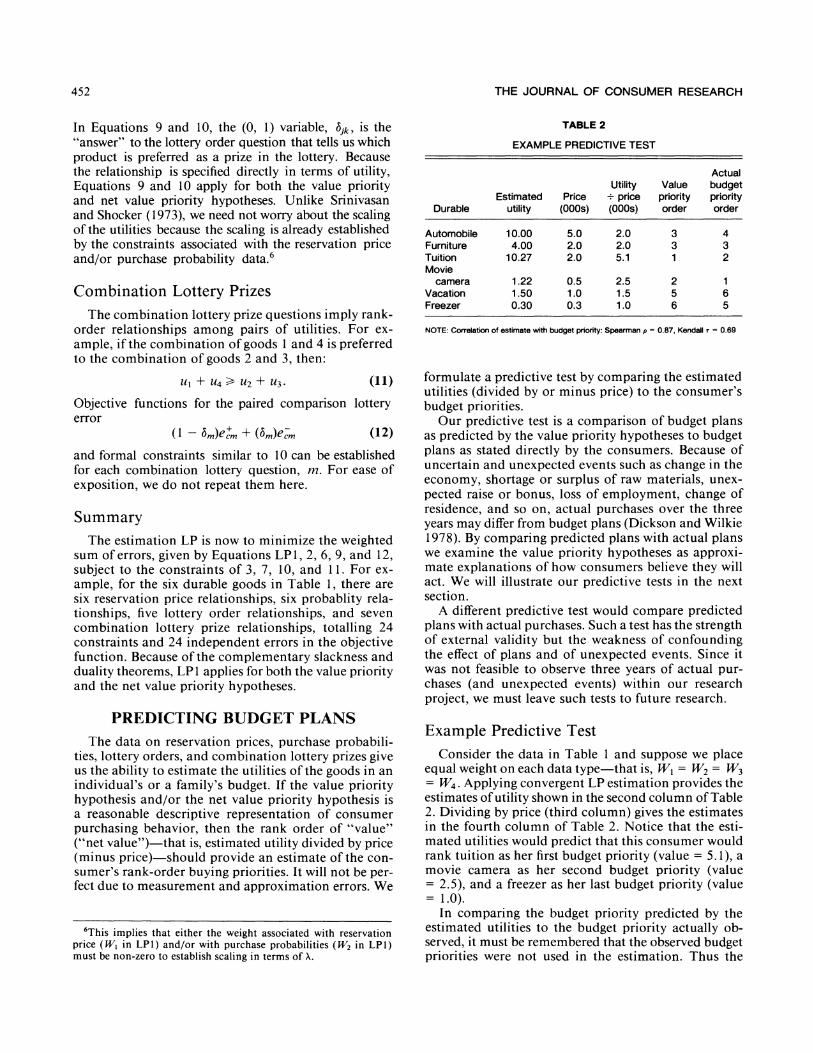
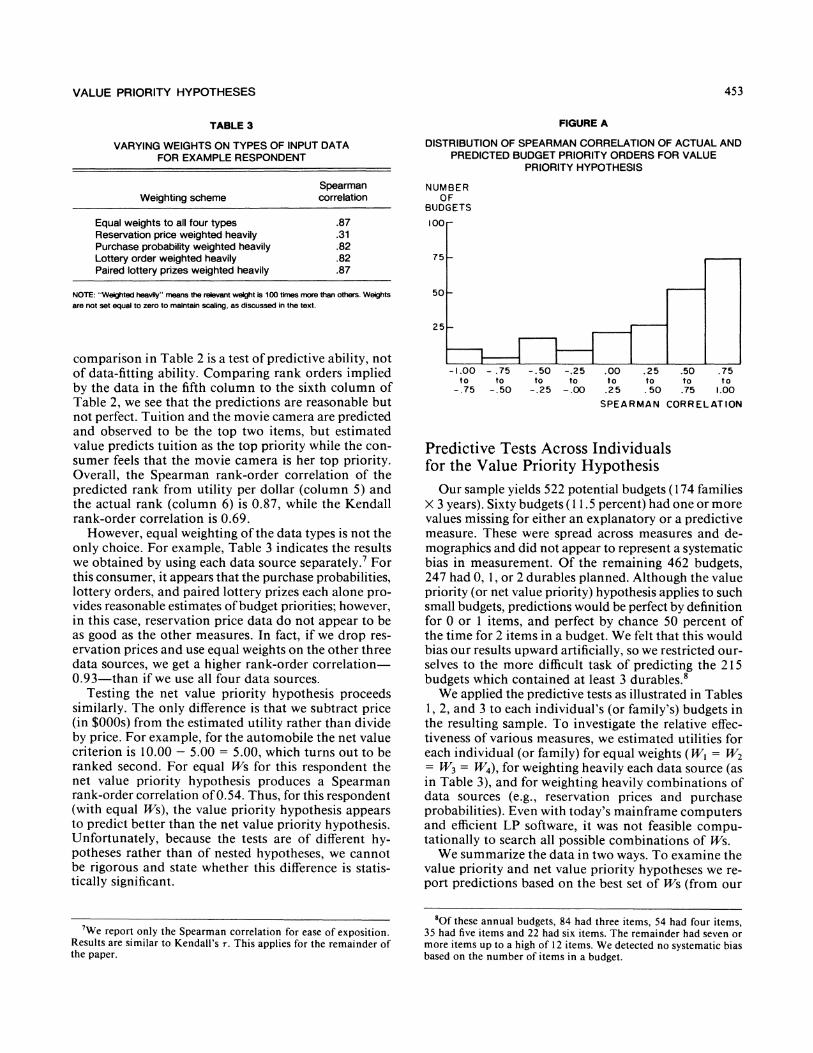
VALUE PRIORITY HYPOTHESES
TABLE 3
VARYING WEIGHTS ON TYPES OF INPUT DATA FOR EXAMPLE RESPONDENT
Spearman Weighting scheme correlation
Equal weights to all four types 87 Resewation price weighted heavily 31 Purchase probability weighted heavily 82 Lottery order weighted heavily 82 Paired lottery prizes weighted heavily 87
NOTE Weightedheaq means the rebvant weight is 100 timesmore thanothers We~hts are not set equal to zero to maintain scaling as discussed in the text
comparison in Table 2 is a test of predictive ability not of data-fitting ability Comparing rank orders implied by the data in the fifth column to the sixth column of Table 2 we see that the predictions are reasonable but not perfect Tuition and the movie camera are predicted and observed to be the top two items but estimated value predicts tuition as the top priority while the con- sumer feels that the movie camera is her top priority Overall the Spearman rank-order correlation of the predicted rank from utility per dollar (column 5) and the actual rank (column 6) is 087 while the Kendall rank-order correlation is 069
However equal weighting of the data types is not the only choice For example Table 3 indicates the results we obtained by using each data source separately For this consumer it appears that the purchase probabilities lottery orders and paired lottery prizes each alone pro- vides reasonable estimates of budget priorities however in this case reservation price data do not appear to be as good as the other measures In fact if we drop res- ervation prices and use equal weights on the other three data sources we get a higher rank-order correlation- 093-than if we use all four data sources
Testing the net value priority hypothesis proceeds similarly The only difference is that we subtract price (in $000~) from the estimated utility rather than divide by price For example for the automobile the net value criterion is 1000 - 500 = 500 which turns out to be ranked second For equal Ws for this respondent the net value priority hypothesis produces a Spearman rank-order correlation of 054 Thus for this respondent (with equal Ws) the value priority hypothesis appears to predict better than the net value priority hypothesis Unfortunately because the tests are of different hy- potheses rather than of nested hypotheses we cannot be rigorous and state whether this difference is statis- tically significant
We report only the Spearman correlation for ease of exposition Results are similar to Kendalls T This applies for the remainder of the paper
FIGURE A
DISTRIBUTION OF SPEARMAN CORRELATION OF ACTUAL AND PREDICTED BUDGET PRIORITY ORDERS FOR VALUE
PRIORITY HYPOTHESIS
N U M B E R O F
BUDGETS
-100 - 75 -50 -25 OO 25 50 -75 t o to to to t o t o t o t 0
-75 -50 -25 -00 25 50 75 100
S P E A R M A N CORRELATION
Predictive Tests Across Individuals for the Value Priority Hypothesis
Our sample yields 522 potential budgets (1 74 families X 3 years) Sixty budgets ( I 15 percent) had one or more values missing for either an explanatory or a predictive measure These were spread across measures and de- mographics and did not appear to represent a systematic bias in measurement Of the remaining 462 budgets 247 had 0 1 or 2 durables planned Although the value priority (or net value priority) hypothesis applies to such small budgets predictions would be perfect by definition for 0 or 1 items and perfect by chance 50 percent of the time for 2 items in a budget We felt that this would bias our results upward artificially so we restricted our- selves to the more difficult task of predicting the 21 5 budgets which contained at least 3 durables
We applied the predictive tests as illustrated in Tables 1 2 and 3 to each individuals (or familys) budgets in the resulting sample To investigate the relative effec- tiveness of various measures we estimated utilities for each individual (or family) for equal weights ( W = W = W3 = W4) for weighting heavily each data source (as in Table 3) and for weighting heavily combinations of data sources (eg reservation prices and purchase probabilities) Even with todays mainframe computers and efficient LP software it was not feasible compu- tationally to search all possible combinations of Ws
We summarize the data in two ways To examine the value priority and net value priority hypotheses we re- port predictions based on the best set of Ws (from our
Of these annual budgets 84 had three items 54 had four items 35 had five items and 22 had six items The remainder had seven or more items up to a high of 12 items We detected no systematic bias based on the number of items in a budget
THE JOURNAL OF CONSUMER RESEARCH
FIGURE B
DISTRIBUTION OF SPEARMAN CORRELATION OF ACTUAL AND PREDICTED BUDGET PRIORITY ORDERS
FOR NET VALUE HYPOTHESIS N U M B E R
OF BUDGETS
t o t o t o t o t o t o t o t 0 - 75 - 5 0 - 2 5 -OO 25 5 0 75 100
S F E A R M A N C O R R E L A T I O N
limited search as described above) for each individual or family Then to examine the relative merits of each data source we keep the Ws the same for all individuals and families Other means of summarizing the data provide the same qualitative implications and are noted as appropriate
Figure A reports the Spearman correlations of the actual and predicted budget priorities for the value priority hypothesis It is based on the best Ws for each individual (or family) but we use the same weights for all his her or their budgets Overall the value priority hypothesis seems reasonable Despite potential mea- surement error and conservative reporting due to elim- inating the favorable budgets of 0 1 or 2 items roughly 83 percent of the budgets have positive correlations 60 percent have correlations of 050 or better the 35 per- cent have correlations of 075 or better Significance levels are complex (because many ties are possible) vary by budget (the number of items in each budget varies) and do not apply between hypotheses There is no single overall critical value that can be applied to Figure A
Comparison of the Value Priority and Net Value Priority Hypotheses
Figure B reports the Spearman correlations of actual and predicted budget priorities for the net value hy- pothesis The net value priority hypothesis also appears to be a reasonable description of consumer purchasing behavior Roughly 9 1 percent of the budgets have pos- itive correlations 84 percent have correlations of 050 or better and 5 1 percent have correlations of 075 or better The net value hypothesis appears to do somewhat better than the value hypothesis
TABLE 4
COMPARISON OF VALUE PRIORITY AND NET VALUE PRIORITY HYPOTHESES
Budgets
Value priority Net value priority Weighting scheme predicts best predicts best
Number of budgets 56 122 Average number of
productsbudget 457 461 Average number of
autoslbudget 048 036 Average price of
products in budget $3278 $3635
Average reservation price of product in budget $4232 $4349
Average age 437 441 Average income $36200 $36300
Examining consumer by consumer the Spearman correlations of actual and predicted budget plans 122 budgets (57 percent) were predicted better by net value priority 56 budgets (26 percent) were predicted better by value priority and 37 budgets (1 7 percent) were pre- dicted equally well by both As Table 4 suggests we found no significant demographic differences that sug- gest when one hypothesis predicts better than the other
In summary both hypotheses do well neither is re- jected and both are retained for future empirical testing Although net value priority does better in our tests the issue is very complex because of the theoretical inter- relationships among the hypotheses (through the duality theorem) We will interpret our results in light of these interrelationships in a later section
Variation Across Alternative Weightings of Data Types
Figure C reports distributions of Spearman correla- tion of actual and predicted budget priority orders for each of the data sources For example if we make W much larger than W2 W3 and W4 we emphasize res- ervation prices as the primary data source as in panel
The Figure C results are based on weights that do not vary across individual families Overall predictions based on reservation prices do better than random (67 percent are positive) but not nearly as well as they did in Figure B This is not surprising because reservation price is a complex concept for many consumers causing the quality of data to vary across consumers Our ex- ample respondent appears to have understood the con-
We report the results for net value priority here Results for value priority are qualitatively the same and in about the same relationship as summarized by Figures A and B
5 0
VALUE PRIORITY HYPOTHESES
FIGURE C
DISTRIBUTIONS OF SPEARMAN CORRELATION OF ACTUAL AND PREDICTED BUDGET PRIORITY ORDERS FOR FOUR DIFFERENT DATA SOURCES
N U M B E R N U M B E R 0 F OF
B U D G E T S BUDGETS
CORRELATION CORRE L A T I O N 1 2
Prediction based on reservation price Prediction based on purchase probabilities
N U M B E R NUMBER O F OF
BUDGETS BUDGETS
CORR E L A T l O N C O R R E L A T I O N 3 4
Prediction based on lottery order Prediction based on combination lottery prizes
THE JOURNAL OF CONSUMER RESEARCH
cept but other respondents clearly did not For ex- ample some consumers gave a reservation price of $2001 for an item with an expected price of $2000 Other consumers found it hard to imagine the item staying the same as the price rises
Figure C also reports the results for emphasizing data on purchase probabilities lottery orders and combi- nation lottery prize answers Of the data sources pur- chase probabilities are clearly the best indicators of budget priorities (81 percent positive and 60 percent with correlations of 050 or better) Lottery orders and combination lottery prizes (67 percent and 69 percent positive respectively) do about as well as reservation prices Results for combinations of two three and four data sources tend to be in the range of those in Figure C Those results also suggest that of the four data sources purchase probabilities tend to predict budget priorities best l o
Although purchase probability measures appear to be the best indicators of budget priorities Figure B sug- gests that consumers do vary in their abilities to answer any given question format We recommend a conver- gent estimation approach that utilizes all four data sources Convergent linear programming is one such approach we will illustrate another in a later section
Summary of Predictive Tests Based on convergent linear programming estimation
with all four data sources we are able to estimate utility values for durable products which with price forecast well consumers budget orders We feel that this is rea- sonable preliminary evidence that the hypotheses are good first order approximations to consumers pur-chasing ofdurable goods Elaborations of the hypotheses (Appendix A) may improve the approximation and predict better The comparison of value priority and net value priority shows that both criteria predict well consumers budget priorities Net value priority (fo- cusing on the marginal increase in net utility) does better than value priority (focusing on the budget constraint) but the results do vary by individuals andor families We found no systematic reason for the variations but further research may suggest some hypotheses Finally consumers do vary in their ability to respond to complex utility questions suggesting that utility is best measured with multiple questions and with at least one form of convergent estimation
ALTERNATIVE ESTIMATION PROCEDURE LISREL V
Convergent linear programming is one way to in- corporate multiple data sources Its strengths are that it can readily accommodate both ordinal and cardinal
Figure C gives one indication of how well purchase probabilities alone would predict budget plans
FIGURE D
MEASUREMENT MODEL FOR LISREL V ESTIMATION
I 1
ERROR ( S I l RESERVATION P R I C E
I TRANSFORMED 1 ERROR PURCHASE
U T I L I T Y
LOTTERY ERROR O R D E R S
ERROR (84) COMBINATION P R I Z E S
NOTE Data sources (boxes) are indicators of the unobservable utllity values (arcle)
measures and that the theoretical relationships sug- gested by the value priority hypotheses can be repre- sented exactlv within the structure Furthermore it is readily applied on a consumer-by-consumer basis to identify potential heterogeneities in response to ques- tion format andor planning Its disadvantages are that (1) the cost of searching all combinations of weights ( Wi W Z W3 and W4) to find a single best fit is pro- hibitive and (2) statistical properties of linear pro- gramming estimation are not well known
There are other estimation procedures that use mul- tiple data sources Each has its relative strengths and weaknesses We select one such estimation procedure to demonstrate that our basic result-the reasonable-ness of the value priority hypotheses-is robust with respect to the estimation procedure The procedure we choose is covariance analysis as implemented by Jo- reskog and Sorboms ( 198 1) LISREL V (see Heise 1975 Duncan 1975 and Bentler and Bonett 1980 for more details on covariance analysis) The advantages of LIS- REL V are that (1) a best set ofweights (in the maximum likelihood sense) can be found for the proper emphasis among data sources and (2) the statistical properties are well known when normality conditions hold The disadvantages are that (1) because LISREL is very sen- sitive to departures from normality (see Joreskog and Sorbom 1981 page I39) it may not do well with our ordinal data or with our transformed probabilities and (2) the estimation is infeasible for small sample sizes as would be the case with individual-by-individual analyses (see Bentler and Bonett 1980 p 591) Since the relative advantages and disadvantages of LISREL V compensate those of convergent linear programming estimation the resulting estimation provides valuable insight into the value priority hypotheses
Basic Estimation Model The LISREL V analysis corresponding to convergent
LP estimation is the measurement model shown in Fig- ure D The data sources (boxes) are indicators of the
- -
VALUE PRIORITY HYPOTHESES
unobservable utility values (circle) thus each measure- ment-say a reservation price-can be thought of as resulting from the unobserved utility value and a mea- surement error (6s in Figure D) The goal of LISREL V is to estimate the correlations (known as factor load- ings) relating the observables to the unobserved utility and then to use the structure to estimate a quantity (known as a factor score) for the unobserved utility We use the theoretical relationships as implied by the value priority hypotheses to specify the appropriate transfor- mations of the raw measurements
Measures Based on the value priority hypotheses the appro-
priate measures are
I Reservation prices as implied by Equation 3 with h = 1
2 Logit transformed probabilities as implied by Equa- tion 7 with h = l We allow the estimation to deter- mine the scaling constant -
3 Lottery orders These orderings are rank-order mea- sures and may violate strict normality assumptions but they are monotonic in utility
4 Combination lottery prizes The rank-order relation- ships implied by Equations 11 and 12 are complex dependent on each individual and interrelated with lottery orders They are not readily handled by the linear equations of LISREL V We use as a surrogate the number of times a durable is chosen from the set of combinations This measure is clearly monotonic in utility Again normality is a concern
Estimation Results The maximum likelihood estimation results are
shown in Table 5 The estimation is based on 932 ob- servations corresponding to the total number of budg- eted items in the 2 15 budgets Overall the measurement model does remarkably well The goodness of fit in- dex-which is independent of sample size and rela- tively robust against departures from normality (Jorgskog and Sorbom 198 1 page 14 1)-suggests that 999 percent of relative covariance is accounted for by the model Even adjusted for degrees of freedom this measure is 989 percent The coefficient of determina- tion for the overall model is 924 percent suggesting high overall reliability of the measurement model The chi-squared value is low-087 indicating that no ad- dition of free parameters would improve the model sig- nificantly
The model in Table 5 accounts for measurement correlation among the rank-order measures as suggested by the corresponding modification index (Joreskog and Sorbom 198 1 p 11119) Without the extra free parameter all coefficients and statistics except the chi- squared (401 with 2 df) are virtually identical to those in Table 5
TABLE 5
ESTIMATION RESULTS FOR LISREL V MEASUREMENT MODEL
Estimated Squared factor Asymptotic correlation
Variable loading t-statistic (reliability)
Reservation price 954 230 911 Transformed probabilities 812 207 660 Lottery orders 293 86 086 Combination prizes I66 49 027
Goodness-of-fit index Adjusted goodness-of-fit
index Coefficient of
determination Root mean square
residual Chi-squared (1degree of freedom)
For the specific measures reservation prices have the highest reliability followed by transformed probabilities Both have excellent asymptotic t-statistics The rank- order measures fare less well with low reliabilities but good t-statistics Normalized residuals (not shown) are reasonable for the cardinal measures but do depart somewhat for the rank-order measures Since the latter is to be expected the t-statistics are acceptable and we desire a comparison with the convergent LP estimation we retain all measures in the model
Predictive Tests Based on the measurement model in Table 5 we use
the LISREL V factor score regressions12 to estimate utility for each durable in each budget We then divide by price to forecast value priorities or subtract price to forecast net value priorities As we did with the linear programming forecasts we compare the LISREL V forecasts to actual consumer budget orders (see Fig- ure E)
The LISREL V predictive results appear comparable to the convergent LP estimates that do not vary by fam- ily 73 percent of the correlations are positive and 55 percent are 050 or better for the value priority hypoth- esis while 71 percent are positive and 54 percent are equal or above 050 for the net value priority hypoth- esis13 These correlations are better than those obtained in Figure C for reservation prices lottery orders or combination prizes as single measures and almost as good as those obtained for purchase probabilities Of course LISREL V does not do as well as the family-
The factor score coefficients are 0805 0180 0026 and 001 5 respectively for the four measures
13The value priority hypothesis does slightly better with LISREL V than does the net value priority hypothesis but this result is prob- ably not significant The best comparison between the hypotheses remains the family-by-family analysis (review Table 4)
THE JOURNAL OF CONSUMER RESEARCH
FIGURE E
DISTRIBUTION OF SPEARMAN CORRELATION OF ACTUAL AND PREDICTED BUDGET PRIORITY ORDERS FOR LISREL MODEL AND TWO DIFFERENT HYPOTHESES
U M B E R OF
UDGETS 7 0 -
--6 0
-50 -
-4 0
-30
720 -
10-
- 10 - 5 0 5 10
CORRELATION 1
Predictions based on value priority hypothesis
by-family estimates in Figures A and B Based on the similarity of the LISREL V predictive results to the convergent LP predictive results we have more confi- dence in our proposition that at least one of the value priority hypotheses is a reasonable first-order model of consumer budget planningI4
DISCUSSION The value priority hypothesis and the net value
priority hypothesis are models of how consumers al- locate their budgets to goods Both hypotheses are de- rived from the standard economic model of maximizing utility subject to a budget constraint However both
14CuriouslyLISREL V selects reservation price as the most reliable measure but the predictive tests in Figure D (a measure of validity) suggest that purchase probabilities may predict better Further re- search might estimate a more complex structural model including the dependent variable in the estimation We did not d o this because we felt it more appropriate to have an independent test of predictive ability that did not use the budget orders in the estimation and be- cause the dependent measure was at best an ordinal measure that clearly causes problems with LISREL V Furthermore our goal is to test the value priority hypotheses not to compare the relative merits of linear programming and LISREL V Finally a full comparison of technique would best be done with multiple measures of the dependent variable in a variety of contexts
NUMBER OF
BUDGETS-7 0
f6 0 -
50--4 0
-30
20 -
10-
-10 - 5 0 5 I o C O R R E L A T I O N
2
Predictions based on net value priority hypothesis
recognize the evidence from a variety of scientific dis- ciplines suggesting that behavior as observed may differ from behavior as prescribed Both hypotheses imply that the consumer (or family) uses a simple heuristic that leads to near-optimal behavior under a wide variety of conditions This heuristic is to rank order durables ac- cording to value (or net value) and purchase items in that order up to and including a budget cutoff The two hypotheses differ only in their derivation of the nu- meraire by which durables are ranked The empirical evidence for the hypotheses presented earlier suggests that both are reasonable we are comfortable with pro- posing both for further testing Figures A and B also suggest that the net value priority hypothesis may be the better predictor However before embracing the net value hypothesis there are a number of cautions worth considering These include the complex interrelation- ship between the two hypotheses the distinction be- tween descriptive and prescriptive theories and the empirical observation of high rank-order correlation between up and u - p all of which are discussed in the following sections
Interrelationships Between the Hypotheses If durables were not discrete then the duality and
complementary slackness theorems would imply that
459 VALUE PRIORITY HYPOTHESES
TABLE 6
AN EXAMPLE BUDGET WITH THREE ITEMS
Utility Price
($000~)
Home improvement Landscaping Food processor
994 657 328
060 030 008
NOTE ui Is the utlllty of Item1 and p 1s the prlce
the optimal solutions to MP2 (value priority) and MP3 (net value priority) are the same This means that for a given budget B and budget cutoff A the two cri- teria-~rp 3 A and zi - Ap gt 0-would yield the same overall budget (This can also be seen by dividing through by p in the net value criterion) This does not mean that the order of planned purchasing-the rank order of zip and 11 - Apl-will be the same
Consider three items-a home improvement land- scaping and a food processor-that are part of the budget of one of our respondents a married 37-year- old male with two children and a $65000 family in- come Follow~ng the convergent linear programming estimation procedure described earlier Table 6 displays the utilities scaled such that A = 1 Net value priority predicts the order as shown the home improvement the landscaping and then the food processor Value prior~ty predicts the reverse order For these three items the respondent actually planned the home improve- ment the landscaping and then the food processor For this consumer net value priority appears to be a better descriptive model (review Table 4 for more gen- eral results)
Assumption of Stable X
The example above does not indicate what would happen if the budget 3the utilities zi or the avail- ability of products changed The value priority criterion zip would not change On the other hand the net value criterion would remain unchanged only if A did not change However A-which equals dzi(y)djgt at the optimum solution to MP3-may change if B or the us change15 If the change were sufficiently dramatic the net value ordering could change Thus the net value priority hypothesis assumes that A or at least the con- sumers perceived A changes slowly This assumption is worth testing
A change in A would affect our scaling convention of X = 1 The utilities are a function of A and may themselves change if we change the budget problem yet restrict h to be 1 O For the comparative forecasts in this paper the budget problem does not change hence the restriction X = 1 is not critical for our predictive tests It could become critical in other situations
utPt Value priority ui - Pi
Net value priority
17 22 41
3 2 1
394 357 248
1 2 3
TABLE 7
REVISED BUDGETS
Budget items Utility Price
Value priority Food processor 328 $80 Convection oven 328 $80 Landscaping 657 $300
Total 1313 $460
Net value priority Home improvement 994 $600
Total 994 $600
Descriptive vs Prescriptive Hypotheses
We stated the value priority and the net value priority hypotheses as descriptive hypotheses They may or may not lead the consumer to the best decisions For ex- ample consider the consumer discussed above and suppose there were another durable-say a tabletop convection oven-with the same utility and price as the food processor Then for $600 of budget allocations the two hypotheses recommend the allocations indi- cated in Table 7 Prescriptively (if our utilities are ac- curate) the consumer would have been better off (more utility and less money) using the value priority than net value priority Such examples are easy to create Indeed if there were no integer constraints on durable pur- chases the value priority algorithm is prescriptively the best algorithm Even with integer constraints it does not do badly and has reasonable worst case propertiesI6 (Cornuejols et al 1977 Fisher 1980) However we can also create examples to favor net value priority over value priority so again we must interpret all prescrip- tive results with caution
I6The theoretical worst case is a factor of two For example with a budget of $1000 and two products of utility 502 and 500 that cost $501 and $500 respectively the optimum is two units of the second product rather than one unit of the first product But if the budget can be relaxed or nondurables purchased this worst case result is mitigated
Correlation The value priority and net value priority hypotheses
have quite different behavioral interpretations How- ever they may be difficult to distinguish from obser- vations of behavior because the two criteria rlJpJ and tiJ - pJ have high rank-order correlations To illustrate this we drew 10000random values of 11 and pJ from a uniform distribution each of five times The resulting linear correlation of log (uJpJ)-which is monotonic in r~p-and uJ - pJ was quite high 087 This suggests an even higher rank-order correlation Because of this correlation we must interpret with caution any empir- ical comparisons of observed budget plans This does not mean the hypotheses are indistinguishable for ex- ample verbal protocols or process-tracing technology may be able to distinguish between the hypotheses In summary the evidence favoring at least one of the hy- potheses as a description of durable purchasing is pos- itive However comparisons between the hlpotheses must be made with caution and subject to further testing
SUMMARY AND IMPLICATIONS Based on our data estimation and predictive tests
and subject to future research we posit that
1 The ranking of goods according to a budget priority appears to be a reasonable descriptorpredictor of consumer budget plans
2 Both value and net value provide reasonable approx- imations to the numeraire by which durables are ranked
3 It is feasible to measure utility across categories if multiple convergent measures are used
4 Convergent LP estimation is feasible provides rea- sonable estimates of utility and appears consistent in predictive ability with LiSREL V
5 Consumers vary in the heuristic numeraire-value or net value-they use for ranking
6 Consumers vary in their ability to answer specific question types
The last postulate is no surprise to the behavioral re- searcher who faces often the difficult task of estimating unobserved constructs It does provide a caution to the market researcher or management analyst faced with
We seek to demonstrate the rank-order correlation of upJ and uJ - p Thus we seek monotonic transformations of either or both variables such that the linear correlation is maximized The logarith- mic transformation is effective and provides a reasonable lower bound on the maximum rank correlation Technically some transformation is necessary because the mean and variance of (uJ pJ )are both infinite when uj and p are independent and identically distributed uniform random variables In addition the logarithmic transformation gives the intuitive interpretation that log (uJ p j )= log u - log p which we expect to be related to u - p
THE JOURNAL OF CONSUMER RESEARCH
limited measurement budgets who wants to forecast durable purchases Convergent measurement is prob- ably necessary
Our value priority hypotheses are a first step in un- derstanding consumer budget planning They are rea- sonable descriptorspredictors of actual budget plans but they do not model explicitly the mental processes leading to utility formation and information processing A useful direction for research would be the investi- gation of information processing theories to explain how consumers form utility judgments and whether value net value or another hypothesis is the best description of how they integrate utility and price to form budget plans Our postulates and analyses raise a number of other researchable issues as well Among these are
1 Two-stage predictive tests comparing predicted plans to actual plans and to actual purchase
2 Predictive tests collecting measures on all evoked goods and predicting which will be in the budget plans
3 Alternative methods such as verbal protocols and process tracing that can distinguish between the value and net value hypotheses without being subject to the bane of high rank-order correlation between hy-potheses
4 Collection of data such as perceived interest rates depreciation rates and operating and maintenance costs that could test a n elaborated model such as that in Appendix A
These are a few of the many unanswered questions that can be addressed in future research
Managerial Implications We close on a practical note The value priority hy-
potheses can be and are useful in forecasting sales in existing durable product classes Once utilities are es- timated for a sample of consumers we can forecast the implications of new products improved products or changes in prices or economic conditions New or im- proved products change utilities and economic con- ditions change the budgets For each consumer we compute the value criterion (or net value criterion if X does not change) and recompute the buying order For example a megabyte personal computer a digital stereoVCR or a mini-van may have high enough value (or net value) to enter the budget of some consumers The percent of consumers who now budget for the new product form is a forecast of its category sales
The measurement system described in this paper has been used at General Motors and has provided valuable managerial insight into which durable goods compete most with luxury automobiles For example Table 8 lists those goods that were ranked above automobiles
For example Lyons (1984) used our data internal intelligence on competitive models and a conjoint analysis to forecast changes in utility
VALUE PRIORITY HYPOTHESES
TABLE 8
DURABLE GOODS COMPETING WITH AUTOMOBILES
Durable Percent
1 School tuition 1983 2 Vacation 1983 3 Home improvement (minor) 4 Major clothing 5 Landscaping 6 School tuition 1984 7 GiftsDonations 8 Cameras and Accessories 9 Furniture
10 Home fuel savings device 11 Home improvement (major) 12 Vacation 1984 13 Dishwasher 14 Color television 15 Stereo system 16 Jewelry 17 House 18 Oven 19 MovieVideo camera 20 Video tape recorder 21 RefrigeratorFreezer 22 School tuition 1985 23 Home computer 24 Vacation 1985
NOTE The percents signify the percentage of budgets in which the indicated item was ranked above an automobile when both the item and an automobile were in the budget
when both were in the budget Recent automobile de- sign and marketing campaigns have been based on budget priority analyses that consider product im-provements or advertised image (less maintenance im- proved comfort and so on) Such changes are designed to increase the utility of an auto purchase and thereby move it up in the buying priority The value priority model is also used to determine if the introduction of a new automobile will improve the position of an au- tomobile purchase in the ordering After having con- sumers drive the new automobile in a clinic environ- ment the new automobiles utility is measured relative to the respondents current first choice automobile to determine if it is higher in the respondents priority or- dering than the previous automobile Application work is continuing to ascertain the managerial usefulness of the value priority hypotheses in managing new and es- tablished durable consumer goods
APPENDIX A Multiple Period Hypotheses
The value priority hypothesis and the net value priority hypothesis are readily extendable The equa- tions for the value priority hypothesis were derived in Hauser and Urban (1982) We restate them here in con- densed form and indicate how they apply to the net value priority hypothesis
Let ti be the utility of the r t h item of the jthgood p be the expected price of that good at time f cS be a
zero-one indicator of whether the ithitems of good J is purchased Note 6 gt 0 only if 6 1 - 1 = 1 Let u(y) be the utility of spending y on nondurables in time t Let B be the consumers budget constraint in time t Dbe hisher debt in time t and b be the amount borrowed (saved) in that period Let d be the depreciation rate for good J and r be the interest rate Let c be the op- erating and maintenance cost of durable j n periods after purchase The consumers problem (MP4) is as follows Maximize
T T-1 r C C C I C + C 14 ( ~ 1 )C f J 9 ~ ~ J l ~ J l I
r = l J r q=O I = 1
subject to T-1
pJt(C 61) + C cJJJtt+ )- h~ BI J n= l
Dl = Dl-(I + r ) + b DT=O forallt
6i = 0 1 6Ji = 1 iff 6 = 1 and s gt t
The value priority criterion for the LP relaxation of the integer constraints now becomes
T- I T- 1
Z ( J ~ [C(1 + riT-I[P~+ C ~ j n l - (Al ) q=O n= l
Finally trade-ins are handled by computing net depre- ciated utility gain divided by net price and pairwise complementarity is added with hierarchical dependence of u on another good k For the net value hypothesis the criterion is (numerator of A 1) - p (denominator of A l ) where p is the simplex multiplier of the debt con- straint D = 0
APPENDIX B Dual Linear Program Non-Technical
Summary 4n important concept in linear programming is that
for every linear program there is a related dual linear program The variables of the dual are known as simplex multipliers or shadow prices Each variable of the dual corresponds to a constraint in the original linear pro- gram and represents the sensitivity of relaxing the constraint-ie the amount by which the objective function would change if that constraint were relaxed If the original linear program is a maximization prob- lem then the dual program has as its objective the min- imization of a weighted sum of the dual variables The weights are the constants in the constraints of the orig- inal linear program The constraints of the dual are based on the constraints and objective function of the original linear program For example
Original Dual-max clxi + c2x2 min btul + b2u2 subject to al lxlt a12x2--i 61 st al lul+ a 2 1 ~ 22 cl
~ 2 ~ x 1+ ~ ~ 2 x 2--i b2 2 c2alzui+ a2~u2 X l X ~ 2 0 u u2gt0
Note tha t m corresponds to the first constraint in t he original program a n d represents t he value o f relaxing tha t constraint
T h e duality theorem states the amazing result tha t t h e optimal values of the object functions of t he two linear programs are identical Complementary slackness states tha t if a dua l variable has a non-zero value in the optimal solution t o t he dual t hen t h e corresponding constraint in t he original program must be binding and vice versa Fo r a more complete and technical exposi- t ion see Gass (1969) o r a n y l inear programming text Note tha t the dua l of t he dua l is t he original l inear pro- gram
[Received March 1985 Revised October 19851
REFERENCES
Bentler Peter M and Douglas G Bonett (1980) Significance Tests and Goodness of Fit in the Analysis of Covariance Structures Psychological Bulletin 88 (3) 588-606
Bertan Jenny and John R Hauser (1982) Auto Show Focus Groups Technical Report to General Motors MIT Cambridge MA January
Bettman James R (1979) An Information Processing Theory of Consumer Choice Reading MA Addison-Wesley
Blackorby Charles Daniel Primont and R Robert Russell (1 975) Budgeting Decentralization and Aggregation Annals ofEconomic Social Measurement 4 ( I ) 23-44
Brown DA SF Buck and FG Pyatt (1965) Improving the Sales Forecast for Consumer Durables Journal of Marketing Research 2 (August) 229-234
Clarke Yvonne and Geoffrey N Soutar (1982) Consumer Acquisition Patterns for Durable Goods Australian Ev- idence Journal of Consumer Research 8 (March) 456- 459
Cornuejols Gerald Marshall L Fisher and George L Nem- hauser (1977) Location of Bank Accounts to Optimize Float An Analytic Study of Exact and Approximate Al- gorithms hfanagement Science 23 (April) 789-8 10
Dickson Peter R Robert F Lusch and William L Wilkie (1 983) Consumer Acquisition Priorities for Home Ap- pliances A Reproduction and Re-evaluation Journal of Consumer Research 9 (March) 432-435
and William L Wilkie (1978) The Consumption of Household Durables A Behavioral Review Marketing Science Institute Working Paper Series Cambridge MA December
Duncan Otis D (1975) Introduction to Structural Equation Models New York Academic Press
Fisher Marshall (1980) Worst Case Analysis of Heuristic Algorithms Management Science 26 (January) 1 -17
Gass Saul 1 (1969) Linear Programming Methods and Ap- plications 3rd Edition New York McGraw-Hill
Green Paul E and V Srinivasan (1978) Conjoint Analysis in Consumer Research Issues and Outlook Journal of Consumer Research 5 (September) 103- 123
Hauser John R and Frank S Koppelman (l979) Alter- native Perceptual Mapping Techniques Relative Ac- curacy and Usefulness Journal ofltfarketing Research 16 (November) 495-506
John H Roberts and Glen L Urban (1983) Fore-
THE JOURNAL OF CONSUMER RESEARCH
casting Sales of a New Consumer Durable in Advances and Practices of Marketing Science ed F S Zufryden Providence RI The Institute of Management Sciences 115-128
and Glen L Urban (1982) Prelaunch Forecasting of New Consumer Durables Ideas on a Consumer Value- Priority Model in Analytic Approaches to Product and tfarketing Planning The Second Confirence ed Raj K Srivastava and Allan D Shocker Cambridge MA Mar- keting Science Institute 276-296
Heiner Ronald A (1983) The Origin of Predictable Be- havior American Economic Review 73 (September) 560-595
Heise David R (1975) Caltsal Analjsis New York John Wiley
Johnson Eric J and Amos Tversky (1983) Affect Gener- alization and the Perception of Risk Journal of Per- sonulily and Social Psychology 45 ( I) 20-3 1
Joreskog Karl G and Dag Sorbom (198 I) LISREL Anabois of Linear Structural Relationships by the Method of hfaximum Likelihood version V Chicago IL National Educational Resources
Juster F Thomas (1 966) Consumer Buying Intentions and Purchase Probability An Experiment in Survey Design Journal of the American Statistical Association 6 1 658- 696
Kasuiis Jack J Robert F Lusch and Edward F Stafford Jr (1979) Consumer Acquisition Patterns for Durable Goods Journal o f Consumer Research 6 (June) 47- 57
Keon John W (1980) The Bargain Value Model and a Comparison of Managerial Implications with the Linear Learning Model hlanagement Science 26 (November) 11 17-1 130
Lyons Larry (1 984) Forecasting the Impact of Competitive Entries on the Sales of a New Consumer Durable SM Thesis Sloan School of Management MIT Cam-bridge MA 02 139
McFadden David (1974) Conditional Logit Analysis of Qualitative Choice Behavior in Frontiers of Econo-metrics ed P Zarembka New York Academic Press
Paroush Jacob (1965) The Order of Acquisition of Con- sumer Durables Econometrica 33 (January) 225-235
Rosen Sherwin (1 974) Hedonic Prices and Implicit Mar- kets Product Differentiation in Pure Competition Journal qf Political Economy 82 ( ~ a n u a r ~ l ~ e b r u a r ~ ) 34-55
Shugan Steve M (1980) The Cost of Thinking Journal of Consumer Research 7 (September) 99- 1 1 1
Srinivasan V (1982) Comments on the Role of Price in Individual Utility Judgments in Choice Models for Buyer Behavior ed Leigh McAlister Greenwich CT JAI Press
and Allan D Shocker (1973) Linear Programming Techniques for Multi-Dimensional Analysis of Prefer- ence Psychometrika 38 (September) 337-370
Sternthal Brian and C Sam Craig (1 982) Consumer Behav- ior 4n Infornlation Processing Perspective Englewood Cliffs NJ Prentice-Hall
Tverskey Amos and Daniel Kahneman (1974) Judgment Under Uncertainty Heuristics and Biases Science 185 1124-1 131
Urban Glen L and John R Hauser (1980) Design and ampfar- keting o f~Yew Products Englewood Cliffs NJ Prentice- Hall
You have printed the following article
The Value Priority Hypotheses for Consumer Budget PlansJohn R Hauser Glen L UrbanThe Journal of Consumer Research Vol 12 No 4 (Mar 1986) pp 446-462Stable URL
httplinksjstororgsicisici=0093-53012819860329123A43C4463ATVPHFC3E20CO3B2-J
This article references the following linked citations If you are trying to access articles from anoff-campus location you may be required to first logon via your library web site to access JSTOR Pleasevisit your librarys website or contact a librarian to learn about options for remote access to JSTOR
References
Improving the Sales Forecast for Consumer DurablesD A Brown S F Buck F G PyattJournal of Marketing Research Vol 2 No 3 (Aug 1965) pp 229-234Stable URL
httplinksjstororgsicisici=0022-2437281965082923A33C2293AITSFFC3E20CO3B2-O
Consumer Acquisition Patterns for Durable Goods Australian EvidenceYvonne Clarke Geoffrey N SoutarThe Journal of Consumer Research Vol 8 No 4 (Mar 1982) pp 456-460Stable URL
httplinksjstororgsicisici=0093-5301281982032983A43C4563ACAPFDG3E20CO3B2-T
Location of Bank Accounts to Optimize Float An Analytic Study of Exact and ApproximateAlgorithmsGerard Cornuejols Marshall L Fisher George L NemhauserManagement Science Vol 23 No 8 (Apr 1977) pp 789-810Stable URL
httplinksjstororgsicisici=0025-19092819770429233A83C7893ALOBATO3E20CO3B2-1
Consumer Acquisition Priorities for Home Appliances A Replication and Re-evaluationPeter R Dickson Robert F Lusch William L WilkieThe Journal of Consumer Research Vol 9 No 4 (Mar 1983) pp 432-435Stable URL
httplinksjstororgsicisici=0093-5301281983032993A43C4323ACAPFHA3E20CO3B2-E
httpwwwjstororg
LINKED CITATIONS- Page 1 of 3 -
Worst-Case Analysis of Heuristic AlgorithmsMarshall L FisherManagement Science Vol 26 No 1 (Jan 1980) pp 1-17Stable URL
httplinksjstororgsicisici=0025-19092819800129263A13C13AWAOHA3E20CO3B2-4
Conjoint Analysis in Consumer Research Issues and OutlookPaul E Green V SrinivasanThe Journal of Consumer Research Vol 5 No 2 (Sep 1978) pp 103-123Stable URL
httplinksjstororgsicisici=0093-5301281978092953A23C1033ACAICRI3E20CO3B2-5
Alternative Perceptual Mapping Techniques Relative Accuracy and UsefulnessJohn R Hauser Frank S KoppelmanJournal of Marketing Research Vol 16 No 4 (Nov 1979) pp 495-506Stable URL
httplinksjstororgsicisici=0022-24372819791129163A43C4953AAPMTRA3E20CO3B2-23
The Origin of Predictable BehaviorRonald A HeinerThe American Economic Review Vol 73 No 4 (Sep 1983) pp 560-595Stable URL
httplinksjstororgsicisici=0002-82822819830929733A43C5603ATOOPB3E20CO3B2-R
Consumer Buying Intentions and Purchase Probability An Experiment in Survey DesignF Thomas JusterJournal of the American Statistical Association Vol 61 No 315 (Sep 1966) pp 658-696Stable URL
httplinksjstororgsicisici=0162-14592819660929613A3153C6583ACBIAPP3E20CO3B2-M
Consumer Acquistion Patterns for Durable GoodsJack J Kasulis Robert F Lusch Edward F Stafford JrThe Journal of Consumer Research Vol 6 No 1 (Jun 1979) pp 47-57Stable URL
httplinksjstororgsicisici=0093-5301281979062963A13C473ACAPFDG3E20CO3B2-S
httpwwwjstororg
LINKED CITATIONS- Page 2 of 3 -
The Bargain Value Model and a Comparison of Managerial Implications with the LinearLearning ModelJohn W KeonManagement Science Vol 26 No 11 (Nov 1980) pp 1117-1130Stable URL
httplinksjstororgsicisici=0025-19092819801129263A113C11173ATBVMAA3E20CO3B2-G
The Order of Acquisition of Consumer DurablesJacob ParoushEconometrica Vol 33 No 1 (Jan 1965) pp 225-235Stable URL
httplinksjstororgsicisici=0012-96822819650129333A13C2253ATOOAOC3E20CO3B2-3
Hedonic Prices and Implicit Markets Product Differentiation in Pure CompetitionSherwin RosenThe Journal of Political Economy Vol 82 No 1 (Jan - Feb 1974) pp 34-55Stable URL
httplinksjstororgsicisici=0022-3808281974012F0229823A13C343AHPAIMP3E20CO3B2-U
The Cost of ThinkingSteven M ShuganThe Journal of Consumer Research Vol 7 No 2 (Sep 1980) pp 99-111Stable URL
httplinksjstororgsicisici=0093-5301281980092973A23C993ATCOT3E20CO3B2-J
httpwwwjstororg
LINKED CITATIONS- Page 3 of 3 -
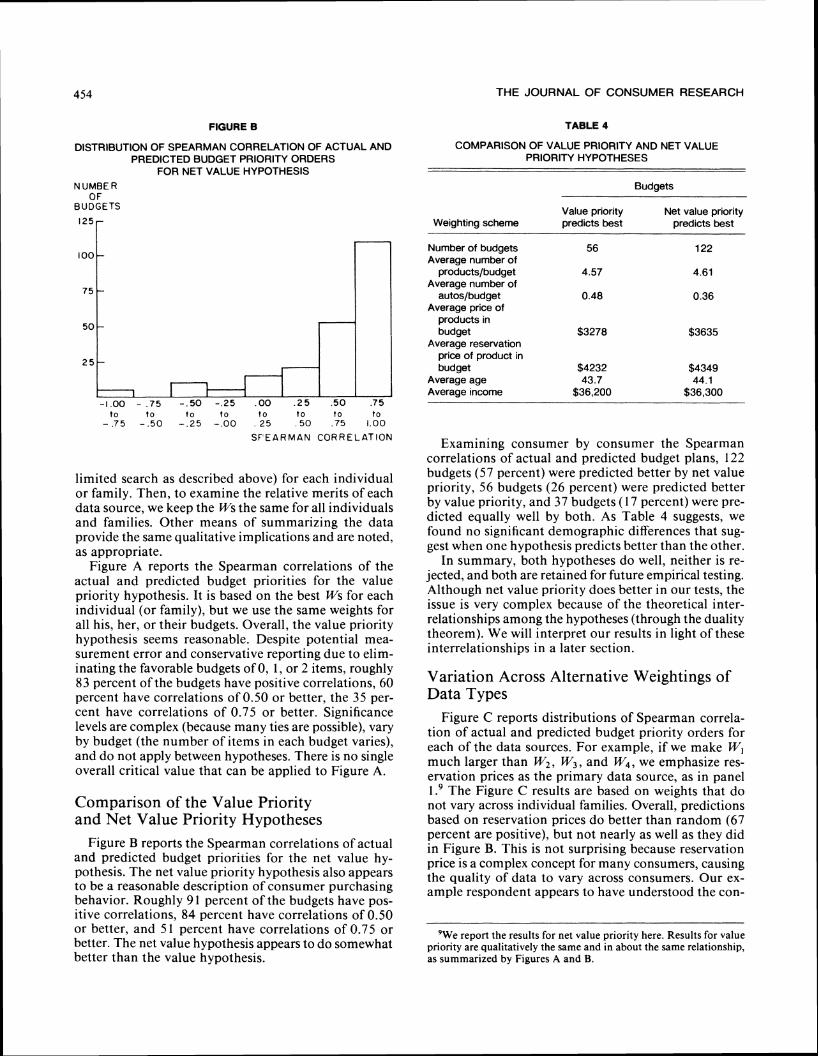
THE JOURNAL OF CONSUMER RESEARCH
FIGURE B
DISTRIBUTION OF SPEARMAN CORRELATION OF ACTUAL AND PREDICTED BUDGET PRIORITY ORDERS
FOR NET VALUE HYPOTHESIS N U M B E R
OF BUDGETS
t o t o t o t o t o t o t o t 0 - 75 - 5 0 - 2 5 -OO 25 5 0 75 100
S F E A R M A N C O R R E L A T I O N
limited search as described above) for each individual or family Then to examine the relative merits of each data source we keep the Ws the same for all individuals and families Other means of summarizing the data provide the same qualitative implications and are noted as appropriate
Figure A reports the Spearman correlations of the actual and predicted budget priorities for the value priority hypothesis It is based on the best Ws for each individual (or family) but we use the same weights for all his her or their budgets Overall the value priority hypothesis seems reasonable Despite potential mea- surement error and conservative reporting due to elim- inating the favorable budgets of 0 1 or 2 items roughly 83 percent of the budgets have positive correlations 60 percent have correlations of 050 or better the 35 per- cent have correlations of 075 or better Significance levels are complex (because many ties are possible) vary by budget (the number of items in each budget varies) and do not apply between hypotheses There is no single overall critical value that can be applied to Figure A
Comparison of the Value Priority and Net Value Priority Hypotheses
Figure B reports the Spearman correlations of actual and predicted budget priorities for the net value hy- pothesis The net value priority hypothesis also appears to be a reasonable description of consumer purchasing behavior Roughly 9 1 percent of the budgets have pos- itive correlations 84 percent have correlations of 050 or better and 5 1 percent have correlations of 075 or better The net value hypothesis appears to do somewhat better than the value hypothesis
TABLE 4
COMPARISON OF VALUE PRIORITY AND NET VALUE PRIORITY HYPOTHESES
Budgets
Value priority Net value priority Weighting scheme predicts best predicts best
Number of budgets 56 122 Average number of
productsbudget 457 461 Average number of
autoslbudget 048 036 Average price of
products in budget $3278 $3635
Average reservation price of product in budget $4232 $4349
Average age 437 441 Average income $36200 $36300
Examining consumer by consumer the Spearman correlations of actual and predicted budget plans 122 budgets (57 percent) were predicted better by net value priority 56 budgets (26 percent) were predicted better by value priority and 37 budgets (1 7 percent) were pre- dicted equally well by both As Table 4 suggests we found no significant demographic differences that sug- gest when one hypothesis predicts better than the other
In summary both hypotheses do well neither is re- jected and both are retained for future empirical testing Although net value priority does better in our tests the issue is very complex because of the theoretical inter- relationships among the hypotheses (through the duality theorem) We will interpret our results in light of these interrelationships in a later section
Variation Across Alternative Weightings of Data Types
Figure C reports distributions of Spearman correla- tion of actual and predicted budget priority orders for each of the data sources For example if we make W much larger than W2 W3 and W4 we emphasize res- ervation prices as the primary data source as in panel
The Figure C results are based on weights that do not vary across individual families Overall predictions based on reservation prices do better than random (67 percent are positive) but not nearly as well as they did in Figure B This is not surprising because reservation price is a complex concept for many consumers causing the quality of data to vary across consumers Our ex- ample respondent appears to have understood the con-
We report the results for net value priority here Results for value priority are qualitatively the same and in about the same relationship as summarized by Figures A and B
5 0
VALUE PRIORITY HYPOTHESES
FIGURE C
DISTRIBUTIONS OF SPEARMAN CORRELATION OF ACTUAL AND PREDICTED BUDGET PRIORITY ORDERS FOR FOUR DIFFERENT DATA SOURCES
N U M B E R N U M B E R 0 F OF
B U D G E T S BUDGETS
CORRELATION CORRE L A T I O N 1 2
Prediction based on reservation price Prediction based on purchase probabilities
N U M B E R NUMBER O F OF
BUDGETS BUDGETS
CORR E L A T l O N C O R R E L A T I O N 3 4
Prediction based on lottery order Prediction based on combination lottery prizes
THE JOURNAL OF CONSUMER RESEARCH
cept but other respondents clearly did not For ex- ample some consumers gave a reservation price of $2001 for an item with an expected price of $2000 Other consumers found it hard to imagine the item staying the same as the price rises
Figure C also reports the results for emphasizing data on purchase probabilities lottery orders and combi- nation lottery prize answers Of the data sources pur- chase probabilities are clearly the best indicators of budget priorities (81 percent positive and 60 percent with correlations of 050 or better) Lottery orders and combination lottery prizes (67 percent and 69 percent positive respectively) do about as well as reservation prices Results for combinations of two three and four data sources tend to be in the range of those in Figure C Those results also suggest that of the four data sources purchase probabilities tend to predict budget priorities best l o
Although purchase probability measures appear to be the best indicators of budget priorities Figure B sug- gests that consumers do vary in their abilities to answer any given question format We recommend a conver- gent estimation approach that utilizes all four data sources Convergent linear programming is one such approach we will illustrate another in a later section
Summary of Predictive Tests Based on convergent linear programming estimation
with all four data sources we are able to estimate utility values for durable products which with price forecast well consumers budget orders We feel that this is rea- sonable preliminary evidence that the hypotheses are good first order approximations to consumers pur-chasing ofdurable goods Elaborations of the hypotheses (Appendix A) may improve the approximation and predict better The comparison of value priority and net value priority shows that both criteria predict well consumers budget priorities Net value priority (fo- cusing on the marginal increase in net utility) does better than value priority (focusing on the budget constraint) but the results do vary by individuals andor families We found no systematic reason for the variations but further research may suggest some hypotheses Finally consumers do vary in their ability to respond to complex utility questions suggesting that utility is best measured with multiple questions and with at least one form of convergent estimation
ALTERNATIVE ESTIMATION PROCEDURE LISREL V
Convergent linear programming is one way to in- corporate multiple data sources Its strengths are that it can readily accommodate both ordinal and cardinal
Figure C gives one indication of how well purchase probabilities alone would predict budget plans
FIGURE D
MEASUREMENT MODEL FOR LISREL V ESTIMATION
I 1
ERROR ( S I l RESERVATION P R I C E
I TRANSFORMED 1 ERROR PURCHASE
U T I L I T Y
LOTTERY ERROR O R D E R S
ERROR (84) COMBINATION P R I Z E S
NOTE Data sources (boxes) are indicators of the unobservable utllity values (arcle)
measures and that the theoretical relationships sug- gested by the value priority hypotheses can be repre- sented exactlv within the structure Furthermore it is readily applied on a consumer-by-consumer basis to identify potential heterogeneities in response to ques- tion format andor planning Its disadvantages are that (1) the cost of searching all combinations of weights ( Wi W Z W3 and W4) to find a single best fit is pro- hibitive and (2) statistical properties of linear pro- gramming estimation are not well known
There are other estimation procedures that use mul- tiple data sources Each has its relative strengths and weaknesses We select one such estimation procedure to demonstrate that our basic result-the reasonable-ness of the value priority hypotheses-is robust with respect to the estimation procedure The procedure we choose is covariance analysis as implemented by Jo- reskog and Sorboms ( 198 1) LISREL V (see Heise 1975 Duncan 1975 and Bentler and Bonett 1980 for more details on covariance analysis) The advantages of LIS- REL V are that (1) a best set ofweights (in the maximum likelihood sense) can be found for the proper emphasis among data sources and (2) the statistical properties are well known when normality conditions hold The disadvantages are that (1) because LISREL is very sen- sitive to departures from normality (see Joreskog and Sorbom 1981 page I39) it may not do well with our ordinal data or with our transformed probabilities and (2) the estimation is infeasible for small sample sizes as would be the case with individual-by-individual analyses (see Bentler and Bonett 1980 p 591) Since the relative advantages and disadvantages of LISREL V compensate those of convergent linear programming estimation the resulting estimation provides valuable insight into the value priority hypotheses
Basic Estimation Model The LISREL V analysis corresponding to convergent
LP estimation is the measurement model shown in Fig- ure D The data sources (boxes) are indicators of the
- -
VALUE PRIORITY HYPOTHESES
unobservable utility values (circle) thus each measure- ment-say a reservation price-can be thought of as resulting from the unobserved utility value and a mea- surement error (6s in Figure D) The goal of LISREL V is to estimate the correlations (known as factor load- ings) relating the observables to the unobserved utility and then to use the structure to estimate a quantity (known as a factor score) for the unobserved utility We use the theoretical relationships as implied by the value priority hypotheses to specify the appropriate transfor- mations of the raw measurements
Measures Based on the value priority hypotheses the appro-
priate measures are
I Reservation prices as implied by Equation 3 with h = 1
2 Logit transformed probabilities as implied by Equa- tion 7 with h = l We allow the estimation to deter- mine the scaling constant -
3 Lottery orders These orderings are rank-order mea- sures and may violate strict normality assumptions but they are monotonic in utility
4 Combination lottery prizes The rank-order relation- ships implied by Equations 11 and 12 are complex dependent on each individual and interrelated with lottery orders They are not readily handled by the linear equations of LISREL V We use as a surrogate the number of times a durable is chosen from the set of combinations This measure is clearly monotonic in utility Again normality is a concern
Estimation Results The maximum likelihood estimation results are
shown in Table 5 The estimation is based on 932 ob- servations corresponding to the total number of budg- eted items in the 2 15 budgets Overall the measurement model does remarkably well The goodness of fit in- dex-which is independent of sample size and rela- tively robust against departures from normality (Jorgskog and Sorbom 198 1 page 14 1)-suggests that 999 percent of relative covariance is accounted for by the model Even adjusted for degrees of freedom this measure is 989 percent The coefficient of determina- tion for the overall model is 924 percent suggesting high overall reliability of the measurement model The chi-squared value is low-087 indicating that no ad- dition of free parameters would improve the model sig- nificantly
The model in Table 5 accounts for measurement correlation among the rank-order measures as suggested by the corresponding modification index (Joreskog and Sorbom 198 1 p 11119) Without the extra free parameter all coefficients and statistics except the chi- squared (401 with 2 df) are virtually identical to those in Table 5
TABLE 5
ESTIMATION RESULTS FOR LISREL V MEASUREMENT MODEL
Estimated Squared factor Asymptotic correlation
Variable loading t-statistic (reliability)
Reservation price 954 230 911 Transformed probabilities 812 207 660 Lottery orders 293 86 086 Combination prizes I66 49 027
Goodness-of-fit index Adjusted goodness-of-fit
index Coefficient of
determination Root mean square
residual Chi-squared (1degree of freedom)
For the specific measures reservation prices have the highest reliability followed by transformed probabilities Both have excellent asymptotic t-statistics The rank- order measures fare less well with low reliabilities but good t-statistics Normalized residuals (not shown) are reasonable for the cardinal measures but do depart somewhat for the rank-order measures Since the latter is to be expected the t-statistics are acceptable and we desire a comparison with the convergent LP estimation we retain all measures in the model
Predictive Tests Based on the measurement model in Table 5 we use
the LISREL V factor score regressions12 to estimate utility for each durable in each budget We then divide by price to forecast value priorities or subtract price to forecast net value priorities As we did with the linear programming forecasts we compare the LISREL V forecasts to actual consumer budget orders (see Fig- ure E)
The LISREL V predictive results appear comparable to the convergent LP estimates that do not vary by fam- ily 73 percent of the correlations are positive and 55 percent are 050 or better for the value priority hypoth- esis while 71 percent are positive and 54 percent are equal or above 050 for the net value priority hypoth- esis13 These correlations are better than those obtained in Figure C for reservation prices lottery orders or combination prizes as single measures and almost as good as those obtained for purchase probabilities Of course LISREL V does not do as well as the family-
The factor score coefficients are 0805 0180 0026 and 001 5 respectively for the four measures
13The value priority hypothesis does slightly better with LISREL V than does the net value priority hypothesis but this result is prob- ably not significant The best comparison between the hypotheses remains the family-by-family analysis (review Table 4)
THE JOURNAL OF CONSUMER RESEARCH
FIGURE E
DISTRIBUTION OF SPEARMAN CORRELATION OF ACTUAL AND PREDICTED BUDGET PRIORITY ORDERS FOR LISREL MODEL AND TWO DIFFERENT HYPOTHESES
U M B E R OF
UDGETS 7 0 -
--6 0
-50 -
-4 0
-30
720 -
10-
- 10 - 5 0 5 10
CORRELATION 1
Predictions based on value priority hypothesis
by-family estimates in Figures A and B Based on the similarity of the LISREL V predictive results to the convergent LP predictive results we have more confi- dence in our proposition that at least one of the value priority hypotheses is a reasonable first-order model of consumer budget planningI4
DISCUSSION The value priority hypothesis and the net value
priority hypothesis are models of how consumers al- locate their budgets to goods Both hypotheses are de- rived from the standard economic model of maximizing utility subject to a budget constraint However both
14CuriouslyLISREL V selects reservation price as the most reliable measure but the predictive tests in Figure D (a measure of validity) suggest that purchase probabilities may predict better Further re- search might estimate a more complex structural model including the dependent variable in the estimation We did not d o this because we felt it more appropriate to have an independent test of predictive ability that did not use the budget orders in the estimation and be- cause the dependent measure was at best an ordinal measure that clearly causes problems with LISREL V Furthermore our goal is to test the value priority hypotheses not to compare the relative merits of linear programming and LISREL V Finally a full comparison of technique would best be done with multiple measures of the dependent variable in a variety of contexts
NUMBER OF
BUDGETS-7 0
f6 0 -
50--4 0
-30
20 -
10-
-10 - 5 0 5 I o C O R R E L A T I O N
2
Predictions based on net value priority hypothesis
recognize the evidence from a variety of scientific dis- ciplines suggesting that behavior as observed may differ from behavior as prescribed Both hypotheses imply that the consumer (or family) uses a simple heuristic that leads to near-optimal behavior under a wide variety of conditions This heuristic is to rank order durables ac- cording to value (or net value) and purchase items in that order up to and including a budget cutoff The two hypotheses differ only in their derivation of the nu- meraire by which durables are ranked The empirical evidence for the hypotheses presented earlier suggests that both are reasonable we are comfortable with pro- posing both for further testing Figures A and B also suggest that the net value priority hypothesis may be the better predictor However before embracing the net value hypothesis there are a number of cautions worth considering These include the complex interrelation- ship between the two hypotheses the distinction be- tween descriptive and prescriptive theories and the empirical observation of high rank-order correlation between up and u - p all of which are discussed in the following sections
Interrelationships Between the Hypotheses If durables were not discrete then the duality and
complementary slackness theorems would imply that
459 VALUE PRIORITY HYPOTHESES
TABLE 6
AN EXAMPLE BUDGET WITH THREE ITEMS
Utility Price
($000~)
Home improvement Landscaping Food processor
994 657 328
060 030 008
NOTE ui Is the utlllty of Item1 and p 1s the prlce
the optimal solutions to MP2 (value priority) and MP3 (net value priority) are the same This means that for a given budget B and budget cutoff A the two cri- teria-~rp 3 A and zi - Ap gt 0-would yield the same overall budget (This can also be seen by dividing through by p in the net value criterion) This does not mean that the order of planned purchasing-the rank order of zip and 11 - Apl-will be the same
Consider three items-a home improvement land- scaping and a food processor-that are part of the budget of one of our respondents a married 37-year- old male with two children and a $65000 family in- come Follow~ng the convergent linear programming estimation procedure described earlier Table 6 displays the utilities scaled such that A = 1 Net value priority predicts the order as shown the home improvement the landscaping and then the food processor Value prior~ty predicts the reverse order For these three items the respondent actually planned the home improve- ment the landscaping and then the food processor For this consumer net value priority appears to be a better descriptive model (review Table 4 for more gen- eral results)
Assumption of Stable X
The example above does not indicate what would happen if the budget 3the utilities zi or the avail- ability of products changed The value priority criterion zip would not change On the other hand the net value criterion would remain unchanged only if A did not change However A-which equals dzi(y)djgt at the optimum solution to MP3-may change if B or the us change15 If the change were sufficiently dramatic the net value ordering could change Thus the net value priority hypothesis assumes that A or at least the con- sumers perceived A changes slowly This assumption is worth testing
A change in A would affect our scaling convention of X = 1 The utilities are a function of A and may themselves change if we change the budget problem yet restrict h to be 1 O For the comparative forecasts in this paper the budget problem does not change hence the restriction X = 1 is not critical for our predictive tests It could become critical in other situations
utPt Value priority ui - Pi
Net value priority
17 22 41
3 2 1
394 357 248
1 2 3
TABLE 7
REVISED BUDGETS
Budget items Utility Price
Value priority Food processor 328 $80 Convection oven 328 $80 Landscaping 657 $300
Total 1313 $460
Net value priority Home improvement 994 $600
Total 994 $600
Descriptive vs Prescriptive Hypotheses
We stated the value priority and the net value priority hypotheses as descriptive hypotheses They may or may not lead the consumer to the best decisions For ex- ample consider the consumer discussed above and suppose there were another durable-say a tabletop convection oven-with the same utility and price as the food processor Then for $600 of budget allocations the two hypotheses recommend the allocations indi- cated in Table 7 Prescriptively (if our utilities are ac- curate) the consumer would have been better off (more utility and less money) using the value priority than net value priority Such examples are easy to create Indeed if there were no integer constraints on durable pur- chases the value priority algorithm is prescriptively the best algorithm Even with integer constraints it does not do badly and has reasonable worst case propertiesI6 (Cornuejols et al 1977 Fisher 1980) However we can also create examples to favor net value priority over value priority so again we must interpret all prescrip- tive results with caution
I6The theoretical worst case is a factor of two For example with a budget of $1000 and two products of utility 502 and 500 that cost $501 and $500 respectively the optimum is two units of the second product rather than one unit of the first product But if the budget can be relaxed or nondurables purchased this worst case result is mitigated
Correlation The value priority and net value priority hypotheses
have quite different behavioral interpretations How- ever they may be difficult to distinguish from obser- vations of behavior because the two criteria rlJpJ and tiJ - pJ have high rank-order correlations To illustrate this we drew 10000random values of 11 and pJ from a uniform distribution each of five times The resulting linear correlation of log (uJpJ)-which is monotonic in r~p-and uJ - pJ was quite high 087 This suggests an even higher rank-order correlation Because of this correlation we must interpret with caution any empir- ical comparisons of observed budget plans This does not mean the hypotheses are indistinguishable for ex- ample verbal protocols or process-tracing technology may be able to distinguish between the hypotheses In summary the evidence favoring at least one of the hy- potheses as a description of durable purchasing is pos- itive However comparisons between the hlpotheses must be made with caution and subject to further testing
SUMMARY AND IMPLICATIONS Based on our data estimation and predictive tests
and subject to future research we posit that
1 The ranking of goods according to a budget priority appears to be a reasonable descriptorpredictor of consumer budget plans
2 Both value and net value provide reasonable approx- imations to the numeraire by which durables are ranked
3 It is feasible to measure utility across categories if multiple convergent measures are used
4 Convergent LP estimation is feasible provides rea- sonable estimates of utility and appears consistent in predictive ability with LiSREL V
5 Consumers vary in the heuristic numeraire-value or net value-they use for ranking
6 Consumers vary in their ability to answer specific question types
The last postulate is no surprise to the behavioral re- searcher who faces often the difficult task of estimating unobserved constructs It does provide a caution to the market researcher or management analyst faced with
We seek to demonstrate the rank-order correlation of upJ and uJ - p Thus we seek monotonic transformations of either or both variables such that the linear correlation is maximized The logarith- mic transformation is effective and provides a reasonable lower bound on the maximum rank correlation Technically some transformation is necessary because the mean and variance of (uJ pJ )are both infinite when uj and p are independent and identically distributed uniform random variables In addition the logarithmic transformation gives the intuitive interpretation that log (uJ p j )= log u - log p which we expect to be related to u - p
THE JOURNAL OF CONSUMER RESEARCH
limited measurement budgets who wants to forecast durable purchases Convergent measurement is prob- ably necessary
Our value priority hypotheses are a first step in un- derstanding consumer budget planning They are rea- sonable descriptorspredictors of actual budget plans but they do not model explicitly the mental processes leading to utility formation and information processing A useful direction for research would be the investi- gation of information processing theories to explain how consumers form utility judgments and whether value net value or another hypothesis is the best description of how they integrate utility and price to form budget plans Our postulates and analyses raise a number of other researchable issues as well Among these are
1 Two-stage predictive tests comparing predicted plans to actual plans and to actual purchase
2 Predictive tests collecting measures on all evoked goods and predicting which will be in the budget plans
3 Alternative methods such as verbal protocols and process tracing that can distinguish between the value and net value hypotheses without being subject to the bane of high rank-order correlation between hy-potheses
4 Collection of data such as perceived interest rates depreciation rates and operating and maintenance costs that could test a n elaborated model such as that in Appendix A
These are a few of the many unanswered questions that can be addressed in future research
Managerial Implications We close on a practical note The value priority hy-
potheses can be and are useful in forecasting sales in existing durable product classes Once utilities are es- timated for a sample of consumers we can forecast the implications of new products improved products or changes in prices or economic conditions New or im- proved products change utilities and economic con- ditions change the budgets For each consumer we compute the value criterion (or net value criterion if X does not change) and recompute the buying order For example a megabyte personal computer a digital stereoVCR or a mini-van may have high enough value (or net value) to enter the budget of some consumers The percent of consumers who now budget for the new product form is a forecast of its category sales
The measurement system described in this paper has been used at General Motors and has provided valuable managerial insight into which durable goods compete most with luxury automobiles For example Table 8 lists those goods that were ranked above automobiles
For example Lyons (1984) used our data internal intelligence on competitive models and a conjoint analysis to forecast changes in utility
VALUE PRIORITY HYPOTHESES
TABLE 8
DURABLE GOODS COMPETING WITH AUTOMOBILES
Durable Percent
1 School tuition 1983 2 Vacation 1983 3 Home improvement (minor) 4 Major clothing 5 Landscaping 6 School tuition 1984 7 GiftsDonations 8 Cameras and Accessories 9 Furniture
10 Home fuel savings device 11 Home improvement (major) 12 Vacation 1984 13 Dishwasher 14 Color television 15 Stereo system 16 Jewelry 17 House 18 Oven 19 MovieVideo camera 20 Video tape recorder 21 RefrigeratorFreezer 22 School tuition 1985 23 Home computer 24 Vacation 1985
NOTE The percents signify the percentage of budgets in which the indicated item was ranked above an automobile when both the item and an automobile were in the budget
when both were in the budget Recent automobile de- sign and marketing campaigns have been based on budget priority analyses that consider product im-provements or advertised image (less maintenance im- proved comfort and so on) Such changes are designed to increase the utility of an auto purchase and thereby move it up in the buying priority The value priority model is also used to determine if the introduction of a new automobile will improve the position of an au- tomobile purchase in the ordering After having con- sumers drive the new automobile in a clinic environ- ment the new automobiles utility is measured relative to the respondents current first choice automobile to determine if it is higher in the respondents priority or- dering than the previous automobile Application work is continuing to ascertain the managerial usefulness of the value priority hypotheses in managing new and es- tablished durable consumer goods
APPENDIX A Multiple Period Hypotheses
The value priority hypothesis and the net value priority hypothesis are readily extendable The equa- tions for the value priority hypothesis were derived in Hauser and Urban (1982) We restate them here in con- densed form and indicate how they apply to the net value priority hypothesis
Let ti be the utility of the r t h item of the jthgood p be the expected price of that good at time f cS be a
zero-one indicator of whether the ithitems of good J is purchased Note 6 gt 0 only if 6 1 - 1 = 1 Let u(y) be the utility of spending y on nondurables in time t Let B be the consumers budget constraint in time t Dbe hisher debt in time t and b be the amount borrowed (saved) in that period Let d be the depreciation rate for good J and r be the interest rate Let c be the op- erating and maintenance cost of durable j n periods after purchase The consumers problem (MP4) is as follows Maximize
T T-1 r C C C I C + C 14 ( ~ 1 )C f J 9 ~ ~ J l ~ J l I
r = l J r q=O I = 1
subject to T-1
pJt(C 61) + C cJJJtt+ )- h~ BI J n= l
Dl = Dl-(I + r ) + b DT=O forallt
6i = 0 1 6Ji = 1 iff 6 = 1 and s gt t
The value priority criterion for the LP relaxation of the integer constraints now becomes
T- I T- 1
Z ( J ~ [C(1 + riT-I[P~+ C ~ j n l - (Al ) q=O n= l
Finally trade-ins are handled by computing net depre- ciated utility gain divided by net price and pairwise complementarity is added with hierarchical dependence of u on another good k For the net value hypothesis the criterion is (numerator of A 1) - p (denominator of A l ) where p is the simplex multiplier of the debt con- straint D = 0
APPENDIX B Dual Linear Program Non-Technical
Summary 4n important concept in linear programming is that
for every linear program there is a related dual linear program The variables of the dual are known as simplex multipliers or shadow prices Each variable of the dual corresponds to a constraint in the original linear pro- gram and represents the sensitivity of relaxing the constraint-ie the amount by which the objective function would change if that constraint were relaxed If the original linear program is a maximization prob- lem then the dual program has as its objective the min- imization of a weighted sum of the dual variables The weights are the constants in the constraints of the orig- inal linear program The constraints of the dual are based on the constraints and objective function of the original linear program For example
Original Dual-max clxi + c2x2 min btul + b2u2 subject to al lxlt a12x2--i 61 st al lul+ a 2 1 ~ 22 cl
~ 2 ~ x 1+ ~ ~ 2 x 2--i b2 2 c2alzui+ a2~u2 X l X ~ 2 0 u u2gt0
Note tha t m corresponds to the first constraint in t he original program a n d represents t he value o f relaxing tha t constraint
T h e duality theorem states the amazing result tha t t h e optimal values of the object functions of t he two linear programs are identical Complementary slackness states tha t if a dua l variable has a non-zero value in the optimal solution t o t he dual t hen t h e corresponding constraint in t he original program must be binding and vice versa Fo r a more complete and technical exposi- t ion see Gass (1969) o r a n y l inear programming text Note tha t the dua l of t he dua l is t he original l inear pro- gram
[Received March 1985 Revised October 19851
REFERENCES
Bentler Peter M and Douglas G Bonett (1980) Significance Tests and Goodness of Fit in the Analysis of Covariance Structures Psychological Bulletin 88 (3) 588-606
Bertan Jenny and John R Hauser (1982) Auto Show Focus Groups Technical Report to General Motors MIT Cambridge MA January
Bettman James R (1979) An Information Processing Theory of Consumer Choice Reading MA Addison-Wesley
Blackorby Charles Daniel Primont and R Robert Russell (1 975) Budgeting Decentralization and Aggregation Annals ofEconomic Social Measurement 4 ( I ) 23-44
Brown DA SF Buck and FG Pyatt (1965) Improving the Sales Forecast for Consumer Durables Journal of Marketing Research 2 (August) 229-234
Clarke Yvonne and Geoffrey N Soutar (1982) Consumer Acquisition Patterns for Durable Goods Australian Ev- idence Journal of Consumer Research 8 (March) 456- 459
Cornuejols Gerald Marshall L Fisher and George L Nem- hauser (1977) Location of Bank Accounts to Optimize Float An Analytic Study of Exact and Approximate Al- gorithms hfanagement Science 23 (April) 789-8 10
Dickson Peter R Robert F Lusch and William L Wilkie (1 983) Consumer Acquisition Priorities for Home Ap- pliances A Reproduction and Re-evaluation Journal of Consumer Research 9 (March) 432-435
and William L Wilkie (1978) The Consumption of Household Durables A Behavioral Review Marketing Science Institute Working Paper Series Cambridge MA December
Duncan Otis D (1975) Introduction to Structural Equation Models New York Academic Press
Fisher Marshall (1980) Worst Case Analysis of Heuristic Algorithms Management Science 26 (January) 1 -17
Gass Saul 1 (1969) Linear Programming Methods and Ap- plications 3rd Edition New York McGraw-Hill
Green Paul E and V Srinivasan (1978) Conjoint Analysis in Consumer Research Issues and Outlook Journal of Consumer Research 5 (September) 103- 123
Hauser John R and Frank S Koppelman (l979) Alter- native Perceptual Mapping Techniques Relative Ac- curacy and Usefulness Journal ofltfarketing Research 16 (November) 495-506
John H Roberts and Glen L Urban (1983) Fore-
THE JOURNAL OF CONSUMER RESEARCH
casting Sales of a New Consumer Durable in Advances and Practices of Marketing Science ed F S Zufryden Providence RI The Institute of Management Sciences 115-128
and Glen L Urban (1982) Prelaunch Forecasting of New Consumer Durables Ideas on a Consumer Value- Priority Model in Analytic Approaches to Product and tfarketing Planning The Second Confirence ed Raj K Srivastava and Allan D Shocker Cambridge MA Mar- keting Science Institute 276-296
Heiner Ronald A (1983) The Origin of Predictable Be- havior American Economic Review 73 (September) 560-595
Heise David R (1975) Caltsal Analjsis New York John Wiley
Johnson Eric J and Amos Tversky (1983) Affect Gener- alization and the Perception of Risk Journal of Per- sonulily and Social Psychology 45 ( I) 20-3 1
Joreskog Karl G and Dag Sorbom (198 I) LISREL Anabois of Linear Structural Relationships by the Method of hfaximum Likelihood version V Chicago IL National Educational Resources
Juster F Thomas (1 966) Consumer Buying Intentions and Purchase Probability An Experiment in Survey Design Journal of the American Statistical Association 6 1 658- 696
Kasuiis Jack J Robert F Lusch and Edward F Stafford Jr (1979) Consumer Acquisition Patterns for Durable Goods Journal o f Consumer Research 6 (June) 47- 57
Keon John W (1980) The Bargain Value Model and a Comparison of Managerial Implications with the Linear Learning Model hlanagement Science 26 (November) 11 17-1 130
Lyons Larry (1 984) Forecasting the Impact of Competitive Entries on the Sales of a New Consumer Durable SM Thesis Sloan School of Management MIT Cam-bridge MA 02 139
McFadden David (1974) Conditional Logit Analysis of Qualitative Choice Behavior in Frontiers of Econo-metrics ed P Zarembka New York Academic Press
Paroush Jacob (1965) The Order of Acquisition of Con- sumer Durables Econometrica 33 (January) 225-235
Rosen Sherwin (1 974) Hedonic Prices and Implicit Mar- kets Product Differentiation in Pure Competition Journal qf Political Economy 82 ( ~ a n u a r ~ l ~ e b r u a r ~ ) 34-55
Shugan Steve M (1980) The Cost of Thinking Journal of Consumer Research 7 (September) 99- 1 1 1
Srinivasan V (1982) Comments on the Role of Price in Individual Utility Judgments in Choice Models for Buyer Behavior ed Leigh McAlister Greenwich CT JAI Press
and Allan D Shocker (1973) Linear Programming Techniques for Multi-Dimensional Analysis of Prefer- ence Psychometrika 38 (September) 337-370
Sternthal Brian and C Sam Craig (1 982) Consumer Behav- ior 4n Infornlation Processing Perspective Englewood Cliffs NJ Prentice-Hall
Tverskey Amos and Daniel Kahneman (1974) Judgment Under Uncertainty Heuristics and Biases Science 185 1124-1 131
Urban Glen L and John R Hauser (1980) Design and ampfar- keting o f~Yew Products Englewood Cliffs NJ Prentice- Hall
You have printed the following article
The Value Priority Hypotheses for Consumer Budget PlansJohn R Hauser Glen L UrbanThe Journal of Consumer Research Vol 12 No 4 (Mar 1986) pp 446-462Stable URL
httplinksjstororgsicisici=0093-53012819860329123A43C4463ATVPHFC3E20CO3B2-J
This article references the following linked citations If you are trying to access articles from anoff-campus location you may be required to first logon via your library web site to access JSTOR Pleasevisit your librarys website or contact a librarian to learn about options for remote access to JSTOR
References
Improving the Sales Forecast for Consumer DurablesD A Brown S F Buck F G PyattJournal of Marketing Research Vol 2 No 3 (Aug 1965) pp 229-234Stable URL
httplinksjstororgsicisici=0022-2437281965082923A33C2293AITSFFC3E20CO3B2-O
Consumer Acquisition Patterns for Durable Goods Australian EvidenceYvonne Clarke Geoffrey N SoutarThe Journal of Consumer Research Vol 8 No 4 (Mar 1982) pp 456-460Stable URL
httplinksjstororgsicisici=0093-5301281982032983A43C4563ACAPFDG3E20CO3B2-T
Location of Bank Accounts to Optimize Float An Analytic Study of Exact and ApproximateAlgorithmsGerard Cornuejols Marshall L Fisher George L NemhauserManagement Science Vol 23 No 8 (Apr 1977) pp 789-810Stable URL
httplinksjstororgsicisici=0025-19092819770429233A83C7893ALOBATO3E20CO3B2-1
Consumer Acquisition Priorities for Home Appliances A Replication and Re-evaluationPeter R Dickson Robert F Lusch William L WilkieThe Journal of Consumer Research Vol 9 No 4 (Mar 1983) pp 432-435Stable URL
httplinksjstororgsicisici=0093-5301281983032993A43C4323ACAPFHA3E20CO3B2-E
httpwwwjstororg
LINKED CITATIONS- Page 1 of 3 -
Worst-Case Analysis of Heuristic AlgorithmsMarshall L FisherManagement Science Vol 26 No 1 (Jan 1980) pp 1-17Stable URL
httplinksjstororgsicisici=0025-19092819800129263A13C13AWAOHA3E20CO3B2-4
Conjoint Analysis in Consumer Research Issues and OutlookPaul E Green V SrinivasanThe Journal of Consumer Research Vol 5 No 2 (Sep 1978) pp 103-123Stable URL
httplinksjstororgsicisici=0093-5301281978092953A23C1033ACAICRI3E20CO3B2-5
Alternative Perceptual Mapping Techniques Relative Accuracy and UsefulnessJohn R Hauser Frank S KoppelmanJournal of Marketing Research Vol 16 No 4 (Nov 1979) pp 495-506Stable URL
httplinksjstororgsicisici=0022-24372819791129163A43C4953AAPMTRA3E20CO3B2-23
The Origin of Predictable BehaviorRonald A HeinerThe American Economic Review Vol 73 No 4 (Sep 1983) pp 560-595Stable URL
httplinksjstororgsicisici=0002-82822819830929733A43C5603ATOOPB3E20CO3B2-R
Consumer Buying Intentions and Purchase Probability An Experiment in Survey DesignF Thomas JusterJournal of the American Statistical Association Vol 61 No 315 (Sep 1966) pp 658-696Stable URL
httplinksjstororgsicisici=0162-14592819660929613A3153C6583ACBIAPP3E20CO3B2-M
Consumer Acquistion Patterns for Durable GoodsJack J Kasulis Robert F Lusch Edward F Stafford JrThe Journal of Consumer Research Vol 6 No 1 (Jun 1979) pp 47-57Stable URL
httplinksjstororgsicisici=0093-5301281979062963A13C473ACAPFDG3E20CO3B2-S
httpwwwjstororg
LINKED CITATIONS- Page 2 of 3 -
The Bargain Value Model and a Comparison of Managerial Implications with the LinearLearning ModelJohn W KeonManagement Science Vol 26 No 11 (Nov 1980) pp 1117-1130Stable URL
httplinksjstororgsicisici=0025-19092819801129263A113C11173ATBVMAA3E20CO3B2-G
The Order of Acquisition of Consumer DurablesJacob ParoushEconometrica Vol 33 No 1 (Jan 1965) pp 225-235Stable URL
httplinksjstororgsicisici=0012-96822819650129333A13C2253ATOOAOC3E20CO3B2-3
Hedonic Prices and Implicit Markets Product Differentiation in Pure CompetitionSherwin RosenThe Journal of Political Economy Vol 82 No 1 (Jan - Feb 1974) pp 34-55Stable URL
httplinksjstororgsicisici=0022-3808281974012F0229823A13C343AHPAIMP3E20CO3B2-U
The Cost of ThinkingSteven M ShuganThe Journal of Consumer Research Vol 7 No 2 (Sep 1980) pp 99-111Stable URL
httplinksjstororgsicisici=0093-5301281980092973A23C993ATCOT3E20CO3B2-J
httpwwwjstororg
LINKED CITATIONS- Page 3 of 3 -
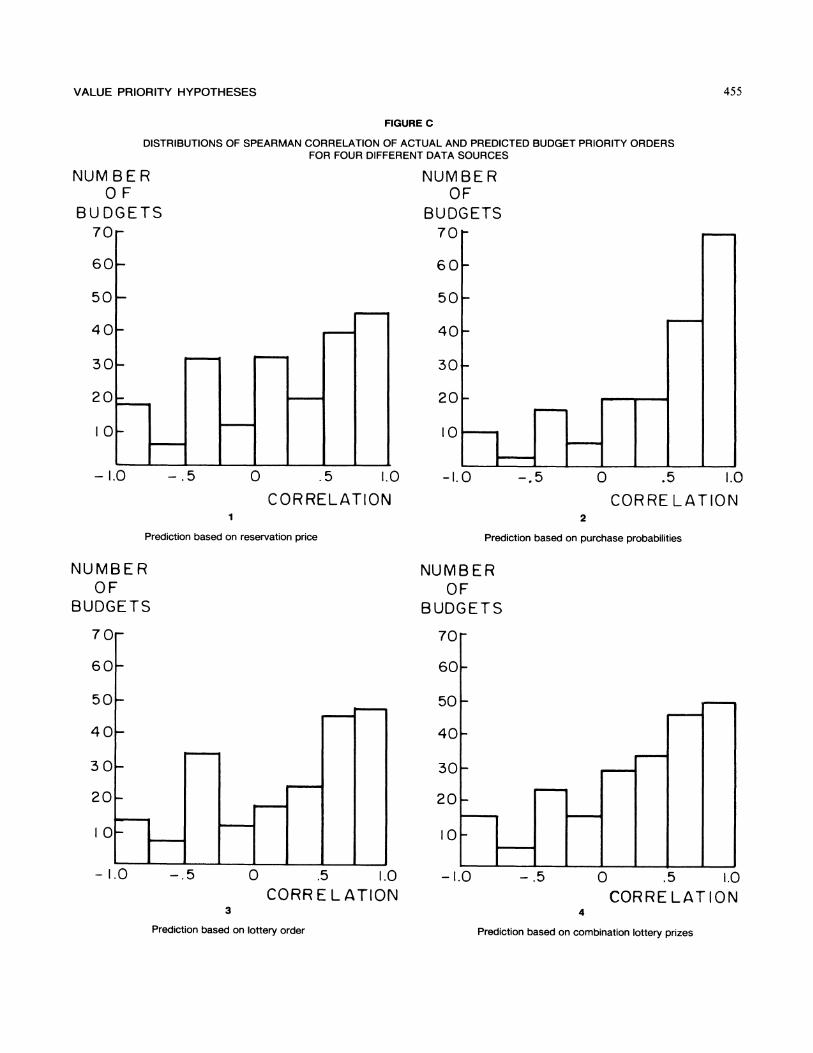
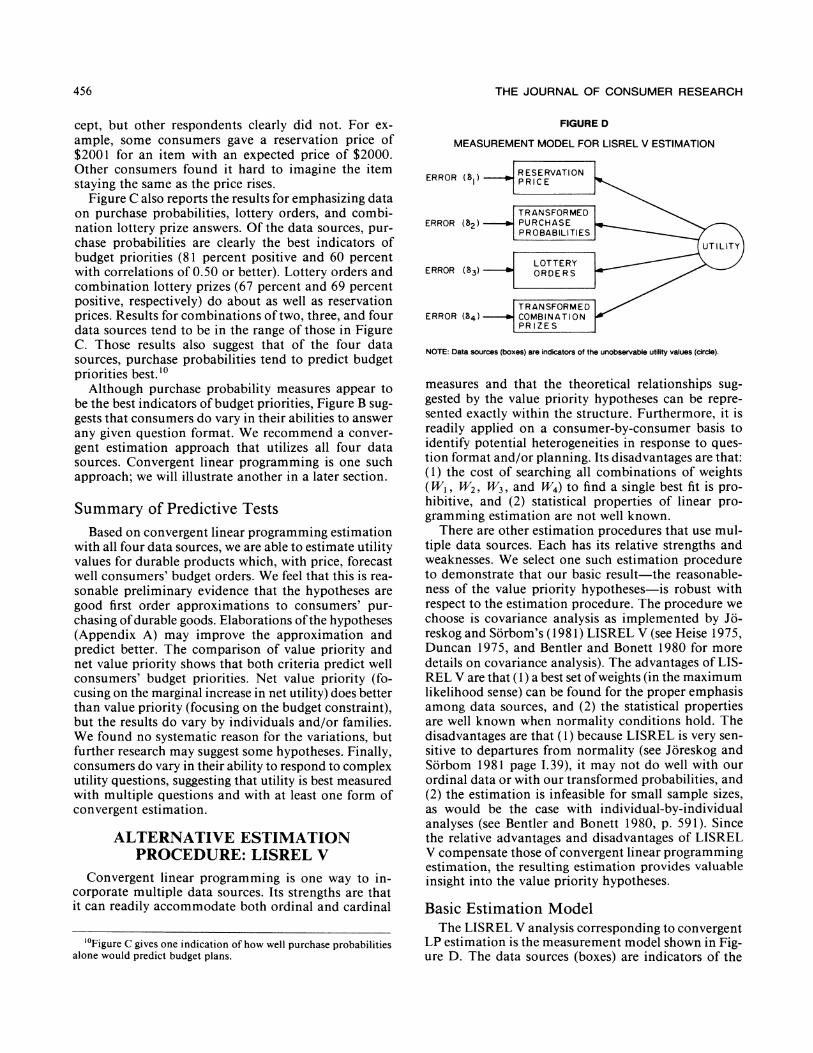
THE JOURNAL OF CONSUMER RESEARCH
cept but other respondents clearly did not For ex- ample some consumers gave a reservation price of $2001 for an item with an expected price of $2000 Other consumers found it hard to imagine the item staying the same as the price rises
Figure C also reports the results for emphasizing data on purchase probabilities lottery orders and combi- nation lottery prize answers Of the data sources pur- chase probabilities are clearly the best indicators of budget priorities (81 percent positive and 60 percent with correlations of 050 or better) Lottery orders and combination lottery prizes (67 percent and 69 percent positive respectively) do about as well as reservation prices Results for combinations of two three and four data sources tend to be in the range of those in Figure C Those results also suggest that of the four data sources purchase probabilities tend to predict budget priorities best l o
Although purchase probability measures appear to be the best indicators of budget priorities Figure B sug- gests that consumers do vary in their abilities to answer any given question format We recommend a conver- gent estimation approach that utilizes all four data sources Convergent linear programming is one such approach we will illustrate another in a later section
Summary of Predictive Tests Based on convergent linear programming estimation
with all four data sources we are able to estimate utility values for durable products which with price forecast well consumers budget orders We feel that this is rea- sonable preliminary evidence that the hypotheses are good first order approximations to consumers pur-chasing ofdurable goods Elaborations of the hypotheses (Appendix A) may improve the approximation and predict better The comparison of value priority and net value priority shows that both criteria predict well consumers budget priorities Net value priority (fo- cusing on the marginal increase in net utility) does better than value priority (focusing on the budget constraint) but the results do vary by individuals andor families We found no systematic reason for the variations but further research may suggest some hypotheses Finally consumers do vary in their ability to respond to complex utility questions suggesting that utility is best measured with multiple questions and with at least one form of convergent estimation
ALTERNATIVE ESTIMATION PROCEDURE LISREL V
Convergent linear programming is one way to in- corporate multiple data sources Its strengths are that it can readily accommodate both ordinal and cardinal
Figure C gives one indication of how well purchase probabilities alone would predict budget plans
FIGURE D
MEASUREMENT MODEL FOR LISREL V ESTIMATION
I 1
ERROR ( S I l RESERVATION P R I C E
I TRANSFORMED 1 ERROR PURCHASE
U T I L I T Y
LOTTERY ERROR O R D E R S
ERROR (84) COMBINATION P R I Z E S
NOTE Data sources (boxes) are indicators of the unobservable utllity values (arcle)
measures and that the theoretical relationships sug- gested by the value priority hypotheses can be repre- sented exactlv within the structure Furthermore it is readily applied on a consumer-by-consumer basis to identify potential heterogeneities in response to ques- tion format andor planning Its disadvantages are that (1) the cost of searching all combinations of weights ( Wi W Z W3 and W4) to find a single best fit is pro- hibitive and (2) statistical properties of linear pro- gramming estimation are not well known
There are other estimation procedures that use mul- tiple data sources Each has its relative strengths and weaknesses We select one such estimation procedure to demonstrate that our basic result-the reasonable-ness of the value priority hypotheses-is robust with respect to the estimation procedure The procedure we choose is covariance analysis as implemented by Jo- reskog and Sorboms ( 198 1) LISREL V (see Heise 1975 Duncan 1975 and Bentler and Bonett 1980 for more details on covariance analysis) The advantages of LIS- REL V are that (1) a best set ofweights (in the maximum likelihood sense) can be found for the proper emphasis among data sources and (2) the statistical properties are well known when normality conditions hold The disadvantages are that (1) because LISREL is very sen- sitive to departures from normality (see Joreskog and Sorbom 1981 page I39) it may not do well with our ordinal data or with our transformed probabilities and (2) the estimation is infeasible for small sample sizes as would be the case with individual-by-individual analyses (see Bentler and Bonett 1980 p 591) Since the relative advantages and disadvantages of LISREL V compensate those of convergent linear programming estimation the resulting estimation provides valuable insight into the value priority hypotheses
Basic Estimation Model The LISREL V analysis corresponding to convergent
LP estimation is the measurement model shown in Fig- ure D The data sources (boxes) are indicators of the
- -
VALUE PRIORITY HYPOTHESES
unobservable utility values (circle) thus each measure- ment-say a reservation price-can be thought of as resulting from the unobserved utility value and a mea- surement error (6s in Figure D) The goal of LISREL V is to estimate the correlations (known as factor load- ings) relating the observables to the unobserved utility and then to use the structure to estimate a quantity (known as a factor score) for the unobserved utility We use the theoretical relationships as implied by the value priority hypotheses to specify the appropriate transfor- mations of the raw measurements
Measures Based on the value priority hypotheses the appro-
priate measures are
I Reservation prices as implied by Equation 3 with h = 1
2 Logit transformed probabilities as implied by Equa- tion 7 with h = l We allow the estimation to deter- mine the scaling constant -
3 Lottery orders These orderings are rank-order mea- sures and may violate strict normality assumptions but they are monotonic in utility
4 Combination lottery prizes The rank-order relation- ships implied by Equations 11 and 12 are complex dependent on each individual and interrelated with lottery orders They are not readily handled by the linear equations of LISREL V We use as a surrogate the number of times a durable is chosen from the set of combinations This measure is clearly monotonic in utility Again normality is a concern
Estimation Results The maximum likelihood estimation results are
shown in Table 5 The estimation is based on 932 ob- servations corresponding to the total number of budg- eted items in the 2 15 budgets Overall the measurement model does remarkably well The goodness of fit in- dex-which is independent of sample size and rela- tively robust against departures from normality (Jorgskog and Sorbom 198 1 page 14 1)-suggests that 999 percent of relative covariance is accounted for by the model Even adjusted for degrees of freedom this measure is 989 percent The coefficient of determina- tion for the overall model is 924 percent suggesting high overall reliability of the measurement model The chi-squared value is low-087 indicating that no ad- dition of free parameters would improve the model sig- nificantly
The model in Table 5 accounts for measurement correlation among the rank-order measures as suggested by the corresponding modification index (Joreskog and Sorbom 198 1 p 11119) Without the extra free parameter all coefficients and statistics except the chi- squared (401 with 2 df) are virtually identical to those in Table 5
TABLE 5
ESTIMATION RESULTS FOR LISREL V MEASUREMENT MODEL
Estimated Squared factor Asymptotic correlation
Variable loading t-statistic (reliability)
Reservation price 954 230 911 Transformed probabilities 812 207 660 Lottery orders 293 86 086 Combination prizes I66 49 027
Goodness-of-fit index Adjusted goodness-of-fit
index Coefficient of
determination Root mean square
residual Chi-squared (1degree of freedom)
For the specific measures reservation prices have the highest reliability followed by transformed probabilities Both have excellent asymptotic t-statistics The rank- order measures fare less well with low reliabilities but good t-statistics Normalized residuals (not shown) are reasonable for the cardinal measures but do depart somewhat for the rank-order measures Since the latter is to be expected the t-statistics are acceptable and we desire a comparison with the convergent LP estimation we retain all measures in the model
Predictive Tests Based on the measurement model in Table 5 we use
the LISREL V factor score regressions12 to estimate utility for each durable in each budget We then divide by price to forecast value priorities or subtract price to forecast net value priorities As we did with the linear programming forecasts we compare the LISREL V forecasts to actual consumer budget orders (see Fig- ure E)
The LISREL V predictive results appear comparable to the convergent LP estimates that do not vary by fam- ily 73 percent of the correlations are positive and 55 percent are 050 or better for the value priority hypoth- esis while 71 percent are positive and 54 percent are equal or above 050 for the net value priority hypoth- esis13 These correlations are better than those obtained in Figure C for reservation prices lottery orders or combination prizes as single measures and almost as good as those obtained for purchase probabilities Of course LISREL V does not do as well as the family-
The factor score coefficients are 0805 0180 0026 and 001 5 respectively for the four measures
13The value priority hypothesis does slightly better with LISREL V than does the net value priority hypothesis but this result is prob- ably not significant The best comparison between the hypotheses remains the family-by-family analysis (review Table 4)
THE JOURNAL OF CONSUMER RESEARCH
FIGURE E
DISTRIBUTION OF SPEARMAN CORRELATION OF ACTUAL AND PREDICTED BUDGET PRIORITY ORDERS FOR LISREL MODEL AND TWO DIFFERENT HYPOTHESES
U M B E R OF
UDGETS 7 0 -
--6 0
-50 -
-4 0
-30
720 -
10-
- 10 - 5 0 5 10
CORRELATION 1
Predictions based on value priority hypothesis
by-family estimates in Figures A and B Based on the similarity of the LISREL V predictive results to the convergent LP predictive results we have more confi- dence in our proposition that at least one of the value priority hypotheses is a reasonable first-order model of consumer budget planningI4
DISCUSSION The value priority hypothesis and the net value
priority hypothesis are models of how consumers al- locate their budgets to goods Both hypotheses are de- rived from the standard economic model of maximizing utility subject to a budget constraint However both
14CuriouslyLISREL V selects reservation price as the most reliable measure but the predictive tests in Figure D (a measure of validity) suggest that purchase probabilities may predict better Further re- search might estimate a more complex structural model including the dependent variable in the estimation We did not d o this because we felt it more appropriate to have an independent test of predictive ability that did not use the budget orders in the estimation and be- cause the dependent measure was at best an ordinal measure that clearly causes problems with LISREL V Furthermore our goal is to test the value priority hypotheses not to compare the relative merits of linear programming and LISREL V Finally a full comparison of technique would best be done with multiple measures of the dependent variable in a variety of contexts
NUMBER OF
BUDGETS-7 0
f6 0 -
50--4 0
-30
20 -
10-
-10 - 5 0 5 I o C O R R E L A T I O N
2
Predictions based on net value priority hypothesis
recognize the evidence from a variety of scientific dis- ciplines suggesting that behavior as observed may differ from behavior as prescribed Both hypotheses imply that the consumer (or family) uses a simple heuristic that leads to near-optimal behavior under a wide variety of conditions This heuristic is to rank order durables ac- cording to value (or net value) and purchase items in that order up to and including a budget cutoff The two hypotheses differ only in their derivation of the nu- meraire by which durables are ranked The empirical evidence for the hypotheses presented earlier suggests that both are reasonable we are comfortable with pro- posing both for further testing Figures A and B also suggest that the net value priority hypothesis may be the better predictor However before embracing the net value hypothesis there are a number of cautions worth considering These include the complex interrelation- ship between the two hypotheses the distinction be- tween descriptive and prescriptive theories and the empirical observation of high rank-order correlation between up and u - p all of which are discussed in the following sections
Interrelationships Between the Hypotheses If durables were not discrete then the duality and
complementary slackness theorems would imply that
459 VALUE PRIORITY HYPOTHESES
TABLE 6
AN EXAMPLE BUDGET WITH THREE ITEMS
Utility Price
($000~)
Home improvement Landscaping Food processor
994 657 328
060 030 008
NOTE ui Is the utlllty of Item1 and p 1s the prlce
the optimal solutions to MP2 (value priority) and MP3 (net value priority) are the same This means that for a given budget B and budget cutoff A the two cri- teria-~rp 3 A and zi - Ap gt 0-would yield the same overall budget (This can also be seen by dividing through by p in the net value criterion) This does not mean that the order of planned purchasing-the rank order of zip and 11 - Apl-will be the same
Consider three items-a home improvement land- scaping and a food processor-that are part of the budget of one of our respondents a married 37-year- old male with two children and a $65000 family in- come Follow~ng the convergent linear programming estimation procedure described earlier Table 6 displays the utilities scaled such that A = 1 Net value priority predicts the order as shown the home improvement the landscaping and then the food processor Value prior~ty predicts the reverse order For these three items the respondent actually planned the home improve- ment the landscaping and then the food processor For this consumer net value priority appears to be a better descriptive model (review Table 4 for more gen- eral results)
Assumption of Stable X
The example above does not indicate what would happen if the budget 3the utilities zi or the avail- ability of products changed The value priority criterion zip would not change On the other hand the net value criterion would remain unchanged only if A did not change However A-which equals dzi(y)djgt at the optimum solution to MP3-may change if B or the us change15 If the change were sufficiently dramatic the net value ordering could change Thus the net value priority hypothesis assumes that A or at least the con- sumers perceived A changes slowly This assumption is worth testing
A change in A would affect our scaling convention of X = 1 The utilities are a function of A and may themselves change if we change the budget problem yet restrict h to be 1 O For the comparative forecasts in this paper the budget problem does not change hence the restriction X = 1 is not critical for our predictive tests It could become critical in other situations
utPt Value priority ui - Pi
Net value priority
17 22 41
3 2 1
394 357 248
1 2 3
TABLE 7
REVISED BUDGETS
Budget items Utility Price
Value priority Food processor 328 $80 Convection oven 328 $80 Landscaping 657 $300
Total 1313 $460
Net value priority Home improvement 994 $600
Total 994 $600
Descriptive vs Prescriptive Hypotheses
We stated the value priority and the net value priority hypotheses as descriptive hypotheses They may or may not lead the consumer to the best decisions For ex- ample consider the consumer discussed above and suppose there were another durable-say a tabletop convection oven-with the same utility and price as the food processor Then for $600 of budget allocations the two hypotheses recommend the allocations indi- cated in Table 7 Prescriptively (if our utilities are ac- curate) the consumer would have been better off (more utility and less money) using the value priority than net value priority Such examples are easy to create Indeed if there were no integer constraints on durable pur- chases the value priority algorithm is prescriptively the best algorithm Even with integer constraints it does not do badly and has reasonable worst case propertiesI6 (Cornuejols et al 1977 Fisher 1980) However we can also create examples to favor net value priority over value priority so again we must interpret all prescrip- tive results with caution
I6The theoretical worst case is a factor of two For example with a budget of $1000 and two products of utility 502 and 500 that cost $501 and $500 respectively the optimum is two units of the second product rather than one unit of the first product But if the budget can be relaxed or nondurables purchased this worst case result is mitigated
Correlation The value priority and net value priority hypotheses
have quite different behavioral interpretations How- ever they may be difficult to distinguish from obser- vations of behavior because the two criteria rlJpJ and tiJ - pJ have high rank-order correlations To illustrate this we drew 10000random values of 11 and pJ from a uniform distribution each of five times The resulting linear correlation of log (uJpJ)-which is monotonic in r~p-and uJ - pJ was quite high 087 This suggests an even higher rank-order correlation Because of this correlation we must interpret with caution any empir- ical comparisons of observed budget plans This does not mean the hypotheses are indistinguishable for ex- ample verbal protocols or process-tracing technology may be able to distinguish between the hypotheses In summary the evidence favoring at least one of the hy- potheses as a description of durable purchasing is pos- itive However comparisons between the hlpotheses must be made with caution and subject to further testing
SUMMARY AND IMPLICATIONS Based on our data estimation and predictive tests
and subject to future research we posit that
1 The ranking of goods according to a budget priority appears to be a reasonable descriptorpredictor of consumer budget plans
2 Both value and net value provide reasonable approx- imations to the numeraire by which durables are ranked
3 It is feasible to measure utility across categories if multiple convergent measures are used
4 Convergent LP estimation is feasible provides rea- sonable estimates of utility and appears consistent in predictive ability with LiSREL V
5 Consumers vary in the heuristic numeraire-value or net value-they use for ranking
6 Consumers vary in their ability to answer specific question types
The last postulate is no surprise to the behavioral re- searcher who faces often the difficult task of estimating unobserved constructs It does provide a caution to the market researcher or management analyst faced with
We seek to demonstrate the rank-order correlation of upJ and uJ - p Thus we seek monotonic transformations of either or both variables such that the linear correlation is maximized The logarith- mic transformation is effective and provides a reasonable lower bound on the maximum rank correlation Technically some transformation is necessary because the mean and variance of (uJ pJ )are both infinite when uj and p are independent and identically distributed uniform random variables In addition the logarithmic transformation gives the intuitive interpretation that log (uJ p j )= log u - log p which we expect to be related to u - p
THE JOURNAL OF CONSUMER RESEARCH
limited measurement budgets who wants to forecast durable purchases Convergent measurement is prob- ably necessary
Our value priority hypotheses are a first step in un- derstanding consumer budget planning They are rea- sonable descriptorspredictors of actual budget plans but they do not model explicitly the mental processes leading to utility formation and information processing A useful direction for research would be the investi- gation of information processing theories to explain how consumers form utility judgments and whether value net value or another hypothesis is the best description of how they integrate utility and price to form budget plans Our postulates and analyses raise a number of other researchable issues as well Among these are
1 Two-stage predictive tests comparing predicted plans to actual plans and to actual purchase
2 Predictive tests collecting measures on all evoked goods and predicting which will be in the budget plans
3 Alternative methods such as verbal protocols and process tracing that can distinguish between the value and net value hypotheses without being subject to the bane of high rank-order correlation between hy-potheses
4 Collection of data such as perceived interest rates depreciation rates and operating and maintenance costs that could test a n elaborated model such as that in Appendix A
These are a few of the many unanswered questions that can be addressed in future research
Managerial Implications We close on a practical note The value priority hy-
potheses can be and are useful in forecasting sales in existing durable product classes Once utilities are es- timated for a sample of consumers we can forecast the implications of new products improved products or changes in prices or economic conditions New or im- proved products change utilities and economic con- ditions change the budgets For each consumer we compute the value criterion (or net value criterion if X does not change) and recompute the buying order For example a megabyte personal computer a digital stereoVCR or a mini-van may have high enough value (or net value) to enter the budget of some consumers The percent of consumers who now budget for the new product form is a forecast of its category sales
The measurement system described in this paper has been used at General Motors and has provided valuable managerial insight into which durable goods compete most with luxury automobiles For example Table 8 lists those goods that were ranked above automobiles
For example Lyons (1984) used our data internal intelligence on competitive models and a conjoint analysis to forecast changes in utility
VALUE PRIORITY HYPOTHESES
TABLE 8
DURABLE GOODS COMPETING WITH AUTOMOBILES
Durable Percent
1 School tuition 1983 2 Vacation 1983 3 Home improvement (minor) 4 Major clothing 5 Landscaping 6 School tuition 1984 7 GiftsDonations 8 Cameras and Accessories 9 Furniture
10 Home fuel savings device 11 Home improvement (major) 12 Vacation 1984 13 Dishwasher 14 Color television 15 Stereo system 16 Jewelry 17 House 18 Oven 19 MovieVideo camera 20 Video tape recorder 21 RefrigeratorFreezer 22 School tuition 1985 23 Home computer 24 Vacation 1985
NOTE The percents signify the percentage of budgets in which the indicated item was ranked above an automobile when both the item and an automobile were in the budget
when both were in the budget Recent automobile de- sign and marketing campaigns have been based on budget priority analyses that consider product im-provements or advertised image (less maintenance im- proved comfort and so on) Such changes are designed to increase the utility of an auto purchase and thereby move it up in the buying priority The value priority model is also used to determine if the introduction of a new automobile will improve the position of an au- tomobile purchase in the ordering After having con- sumers drive the new automobile in a clinic environ- ment the new automobiles utility is measured relative to the respondents current first choice automobile to determine if it is higher in the respondents priority or- dering than the previous automobile Application work is continuing to ascertain the managerial usefulness of the value priority hypotheses in managing new and es- tablished durable consumer goods
APPENDIX A Multiple Period Hypotheses
The value priority hypothesis and the net value priority hypothesis are readily extendable The equa- tions for the value priority hypothesis were derived in Hauser and Urban (1982) We restate them here in con- densed form and indicate how they apply to the net value priority hypothesis
Let ti be the utility of the r t h item of the jthgood p be the expected price of that good at time f cS be a
zero-one indicator of whether the ithitems of good J is purchased Note 6 gt 0 only if 6 1 - 1 = 1 Let u(y) be the utility of spending y on nondurables in time t Let B be the consumers budget constraint in time t Dbe hisher debt in time t and b be the amount borrowed (saved) in that period Let d be the depreciation rate for good J and r be the interest rate Let c be the op- erating and maintenance cost of durable j n periods after purchase The consumers problem (MP4) is as follows Maximize
T T-1 r C C C I C + C 14 ( ~ 1 )C f J 9 ~ ~ J l ~ J l I
r = l J r q=O I = 1
subject to T-1
pJt(C 61) + C cJJJtt+ )- h~ BI J n= l
Dl = Dl-(I + r ) + b DT=O forallt
6i = 0 1 6Ji = 1 iff 6 = 1 and s gt t
The value priority criterion for the LP relaxation of the integer constraints now becomes
T- I T- 1
Z ( J ~ [C(1 + riT-I[P~+ C ~ j n l - (Al ) q=O n= l
Finally trade-ins are handled by computing net depre- ciated utility gain divided by net price and pairwise complementarity is added with hierarchical dependence of u on another good k For the net value hypothesis the criterion is (numerator of A 1) - p (denominator of A l ) where p is the simplex multiplier of the debt con- straint D = 0
APPENDIX B Dual Linear Program Non-Technical
Summary 4n important concept in linear programming is that
for every linear program there is a related dual linear program The variables of the dual are known as simplex multipliers or shadow prices Each variable of the dual corresponds to a constraint in the original linear pro- gram and represents the sensitivity of relaxing the constraint-ie the amount by which the objective function would change if that constraint were relaxed If the original linear program is a maximization prob- lem then the dual program has as its objective the min- imization of a weighted sum of the dual variables The weights are the constants in the constraints of the orig- inal linear program The constraints of the dual are based on the constraints and objective function of the original linear program For example
Original Dual-max clxi + c2x2 min btul + b2u2 subject to al lxlt a12x2--i 61 st al lul+ a 2 1 ~ 22 cl
~ 2 ~ x 1+ ~ ~ 2 x 2--i b2 2 c2alzui+ a2~u2 X l X ~ 2 0 u u2gt0
Note tha t m corresponds to the first constraint in t he original program a n d represents t he value o f relaxing tha t constraint
T h e duality theorem states the amazing result tha t t h e optimal values of the object functions of t he two linear programs are identical Complementary slackness states tha t if a dua l variable has a non-zero value in the optimal solution t o t he dual t hen t h e corresponding constraint in t he original program must be binding and vice versa Fo r a more complete and technical exposi- t ion see Gass (1969) o r a n y l inear programming text Note tha t the dua l of t he dua l is t he original l inear pro- gram
[Received March 1985 Revised October 19851
REFERENCES
Bentler Peter M and Douglas G Bonett (1980) Significance Tests and Goodness of Fit in the Analysis of Covariance Structures Psychological Bulletin 88 (3) 588-606
Bertan Jenny and John R Hauser (1982) Auto Show Focus Groups Technical Report to General Motors MIT Cambridge MA January
Bettman James R (1979) An Information Processing Theory of Consumer Choice Reading MA Addison-Wesley
Blackorby Charles Daniel Primont and R Robert Russell (1 975) Budgeting Decentralization and Aggregation Annals ofEconomic Social Measurement 4 ( I ) 23-44
Brown DA SF Buck and FG Pyatt (1965) Improving the Sales Forecast for Consumer Durables Journal of Marketing Research 2 (August) 229-234
Clarke Yvonne and Geoffrey N Soutar (1982) Consumer Acquisition Patterns for Durable Goods Australian Ev- idence Journal of Consumer Research 8 (March) 456- 459
Cornuejols Gerald Marshall L Fisher and George L Nem- hauser (1977) Location of Bank Accounts to Optimize Float An Analytic Study of Exact and Approximate Al- gorithms hfanagement Science 23 (April) 789-8 10
Dickson Peter R Robert F Lusch and William L Wilkie (1 983) Consumer Acquisition Priorities for Home Ap- pliances A Reproduction and Re-evaluation Journal of Consumer Research 9 (March) 432-435
and William L Wilkie (1978) The Consumption of Household Durables A Behavioral Review Marketing Science Institute Working Paper Series Cambridge MA December
Duncan Otis D (1975) Introduction to Structural Equation Models New York Academic Press
Fisher Marshall (1980) Worst Case Analysis of Heuristic Algorithms Management Science 26 (January) 1 -17
Gass Saul 1 (1969) Linear Programming Methods and Ap- plications 3rd Edition New York McGraw-Hill
Green Paul E and V Srinivasan (1978) Conjoint Analysis in Consumer Research Issues and Outlook Journal of Consumer Research 5 (September) 103- 123
Hauser John R and Frank S Koppelman (l979) Alter- native Perceptual Mapping Techniques Relative Ac- curacy and Usefulness Journal ofltfarketing Research 16 (November) 495-506
John H Roberts and Glen L Urban (1983) Fore-
THE JOURNAL OF CONSUMER RESEARCH
casting Sales of a New Consumer Durable in Advances and Practices of Marketing Science ed F S Zufryden Providence RI The Institute of Management Sciences 115-128
and Glen L Urban (1982) Prelaunch Forecasting of New Consumer Durables Ideas on a Consumer Value- Priority Model in Analytic Approaches to Product and tfarketing Planning The Second Confirence ed Raj K Srivastava and Allan D Shocker Cambridge MA Mar- keting Science Institute 276-296
Heiner Ronald A (1983) The Origin of Predictable Be- havior American Economic Review 73 (September) 560-595
Heise David R (1975) Caltsal Analjsis New York John Wiley
Johnson Eric J and Amos Tversky (1983) Affect Gener- alization and the Perception of Risk Journal of Per- sonulily and Social Psychology 45 ( I) 20-3 1
Joreskog Karl G and Dag Sorbom (198 I) LISREL Anabois of Linear Structural Relationships by the Method of hfaximum Likelihood version V Chicago IL National Educational Resources
Juster F Thomas (1 966) Consumer Buying Intentions and Purchase Probability An Experiment in Survey Design Journal of the American Statistical Association 6 1 658- 696
Kasuiis Jack J Robert F Lusch and Edward F Stafford Jr (1979) Consumer Acquisition Patterns for Durable Goods Journal o f Consumer Research 6 (June) 47- 57
Keon John W (1980) The Bargain Value Model and a Comparison of Managerial Implications with the Linear Learning Model hlanagement Science 26 (November) 11 17-1 130
Lyons Larry (1 984) Forecasting the Impact of Competitive Entries on the Sales of a New Consumer Durable SM Thesis Sloan School of Management MIT Cam-bridge MA 02 139
McFadden David (1974) Conditional Logit Analysis of Qualitative Choice Behavior in Frontiers of Econo-metrics ed P Zarembka New York Academic Press
Paroush Jacob (1965) The Order of Acquisition of Con- sumer Durables Econometrica 33 (January) 225-235
Rosen Sherwin (1 974) Hedonic Prices and Implicit Mar- kets Product Differentiation in Pure Competition Journal qf Political Economy 82 ( ~ a n u a r ~ l ~ e b r u a r ~ ) 34-55
Shugan Steve M (1980) The Cost of Thinking Journal of Consumer Research 7 (September) 99- 1 1 1
Srinivasan V (1982) Comments on the Role of Price in Individual Utility Judgments in Choice Models for Buyer Behavior ed Leigh McAlister Greenwich CT JAI Press
and Allan D Shocker (1973) Linear Programming Techniques for Multi-Dimensional Analysis of Prefer- ence Psychometrika 38 (September) 337-370
Sternthal Brian and C Sam Craig (1 982) Consumer Behav- ior 4n Infornlation Processing Perspective Englewood Cliffs NJ Prentice-Hall
Tverskey Amos and Daniel Kahneman (1974) Judgment Under Uncertainty Heuristics and Biases Science 185 1124-1 131
Urban Glen L and John R Hauser (1980) Design and ampfar- keting o f~Yew Products Englewood Cliffs NJ Prentice- Hall
You have printed the following article
The Value Priority Hypotheses for Consumer Budget PlansJohn R Hauser Glen L UrbanThe Journal of Consumer Research Vol 12 No 4 (Mar 1986) pp 446-462Stable URL
httplinksjstororgsicisici=0093-53012819860329123A43C4463ATVPHFC3E20CO3B2-J
This article references the following linked citations If you are trying to access articles from anoff-campus location you may be required to first logon via your library web site to access JSTOR Pleasevisit your librarys website or contact a librarian to learn about options for remote access to JSTOR
References
Improving the Sales Forecast for Consumer DurablesD A Brown S F Buck F G PyattJournal of Marketing Research Vol 2 No 3 (Aug 1965) pp 229-234Stable URL
httplinksjstororgsicisici=0022-2437281965082923A33C2293AITSFFC3E20CO3B2-O
Consumer Acquisition Patterns for Durable Goods Australian EvidenceYvonne Clarke Geoffrey N SoutarThe Journal of Consumer Research Vol 8 No 4 (Mar 1982) pp 456-460Stable URL
httplinksjstororgsicisici=0093-5301281982032983A43C4563ACAPFDG3E20CO3B2-T
Location of Bank Accounts to Optimize Float An Analytic Study of Exact and ApproximateAlgorithmsGerard Cornuejols Marshall L Fisher George L NemhauserManagement Science Vol 23 No 8 (Apr 1977) pp 789-810Stable URL
httplinksjstororgsicisici=0025-19092819770429233A83C7893ALOBATO3E20CO3B2-1
Consumer Acquisition Priorities for Home Appliances A Replication and Re-evaluationPeter R Dickson Robert F Lusch William L WilkieThe Journal of Consumer Research Vol 9 No 4 (Mar 1983) pp 432-435Stable URL
httplinksjstororgsicisici=0093-5301281983032993A43C4323ACAPFHA3E20CO3B2-E
httpwwwjstororg
LINKED CITATIONS- Page 1 of 3 -
Worst-Case Analysis of Heuristic AlgorithmsMarshall L FisherManagement Science Vol 26 No 1 (Jan 1980) pp 1-17Stable URL
httplinksjstororgsicisici=0025-19092819800129263A13C13AWAOHA3E20CO3B2-4
Conjoint Analysis in Consumer Research Issues and OutlookPaul E Green V SrinivasanThe Journal of Consumer Research Vol 5 No 2 (Sep 1978) pp 103-123Stable URL
httplinksjstororgsicisici=0093-5301281978092953A23C1033ACAICRI3E20CO3B2-5
Alternative Perceptual Mapping Techniques Relative Accuracy and UsefulnessJohn R Hauser Frank S KoppelmanJournal of Marketing Research Vol 16 No 4 (Nov 1979) pp 495-506Stable URL
httplinksjstororgsicisici=0022-24372819791129163A43C4953AAPMTRA3E20CO3B2-23
The Origin of Predictable BehaviorRonald A HeinerThe American Economic Review Vol 73 No 4 (Sep 1983) pp 560-595Stable URL
httplinksjstororgsicisici=0002-82822819830929733A43C5603ATOOPB3E20CO3B2-R
Consumer Buying Intentions and Purchase Probability An Experiment in Survey DesignF Thomas JusterJournal of the American Statistical Association Vol 61 No 315 (Sep 1966) pp 658-696Stable URL
httplinksjstororgsicisici=0162-14592819660929613A3153C6583ACBIAPP3E20CO3B2-M
Consumer Acquistion Patterns for Durable GoodsJack J Kasulis Robert F Lusch Edward F Stafford JrThe Journal of Consumer Research Vol 6 No 1 (Jun 1979) pp 47-57Stable URL
httplinksjstororgsicisici=0093-5301281979062963A13C473ACAPFDG3E20CO3B2-S
httpwwwjstororg
LINKED CITATIONS- Page 2 of 3 -
The Bargain Value Model and a Comparison of Managerial Implications with the LinearLearning ModelJohn W KeonManagement Science Vol 26 No 11 (Nov 1980) pp 1117-1130Stable URL
httplinksjstororgsicisici=0025-19092819801129263A113C11173ATBVMAA3E20CO3B2-G
The Order of Acquisition of Consumer DurablesJacob ParoushEconometrica Vol 33 No 1 (Jan 1965) pp 225-235Stable URL
httplinksjstororgsicisici=0012-96822819650129333A13C2253ATOOAOC3E20CO3B2-3
Hedonic Prices and Implicit Markets Product Differentiation in Pure CompetitionSherwin RosenThe Journal of Political Economy Vol 82 No 1 (Jan - Feb 1974) pp 34-55Stable URL
httplinksjstororgsicisici=0022-3808281974012F0229823A13C343AHPAIMP3E20CO3B2-U
The Cost of ThinkingSteven M ShuganThe Journal of Consumer Research Vol 7 No 2 (Sep 1980) pp 99-111Stable URL
httplinksjstororgsicisici=0093-5301281980092973A23C993ATCOT3E20CO3B2-J
httpwwwjstororg
LINKED CITATIONS- Page 3 of 3 -
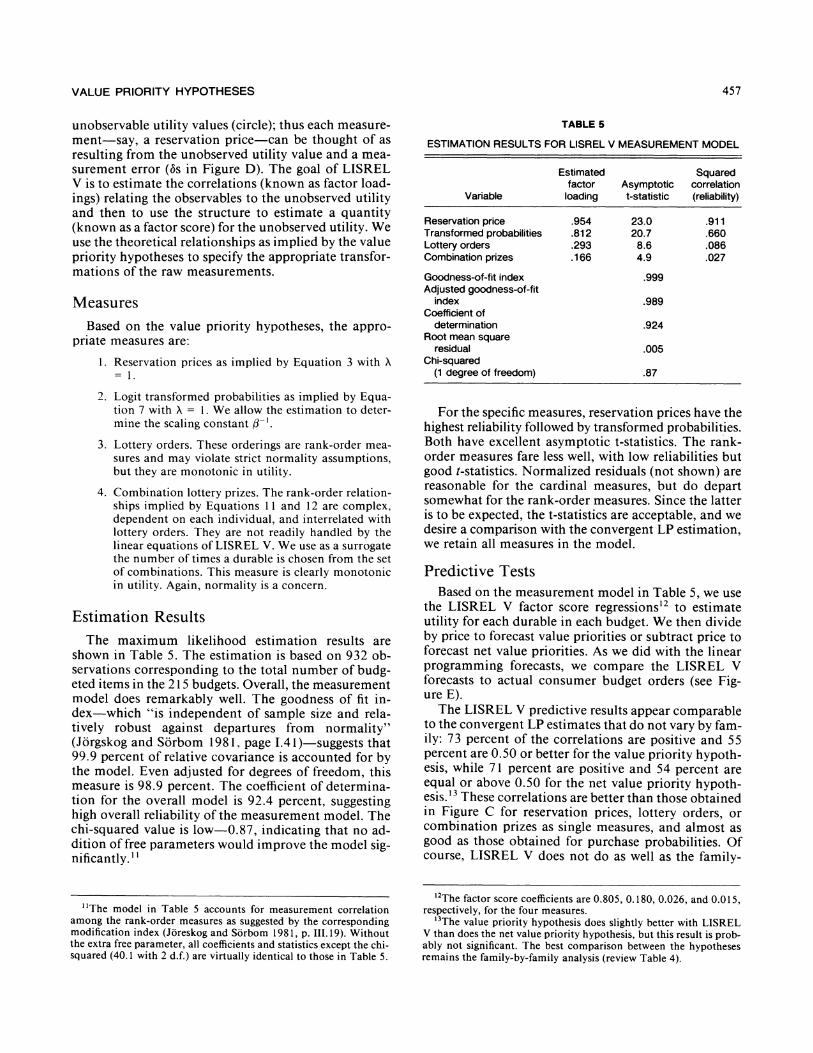
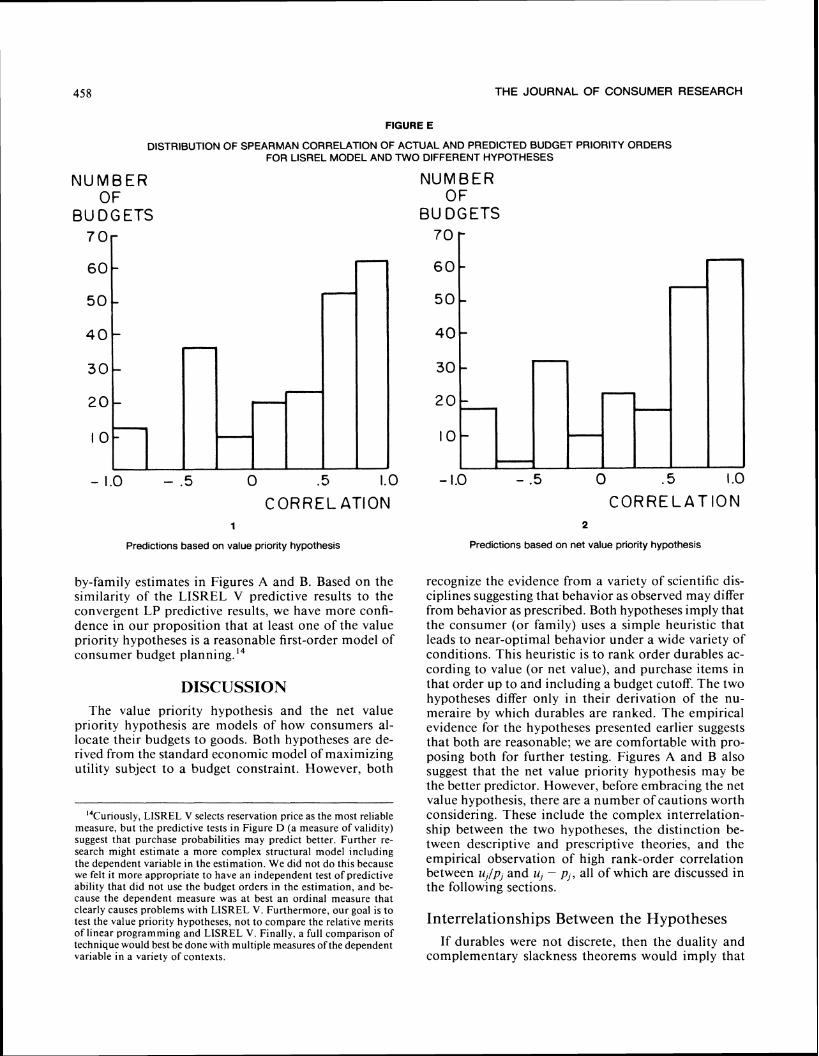
THE JOURNAL OF CONSUMER RESEARCH
FIGURE E
DISTRIBUTION OF SPEARMAN CORRELATION OF ACTUAL AND PREDICTED BUDGET PRIORITY ORDERS FOR LISREL MODEL AND TWO DIFFERENT HYPOTHESES
U M B E R OF
UDGETS 7 0 -
--6 0
-50 -
-4 0
-30
720 -
10-
- 10 - 5 0 5 10
CORRELATION 1
Predictions based on value priority hypothesis
by-family estimates in Figures A and B Based on the similarity of the LISREL V predictive results to the convergent LP predictive results we have more confi- dence in our proposition that at least one of the value priority hypotheses is a reasonable first-order model of consumer budget planningI4
DISCUSSION The value priority hypothesis and the net value
priority hypothesis are models of how consumers al- locate their budgets to goods Both hypotheses are de- rived from the standard economic model of maximizing utility subject to a budget constraint However both
14CuriouslyLISREL V selects reservation price as the most reliable measure but the predictive tests in Figure D (a measure of validity) suggest that purchase probabilities may predict better Further re- search might estimate a more complex structural model including the dependent variable in the estimation We did not d o this because we felt it more appropriate to have an independent test of predictive ability that did not use the budget orders in the estimation and be- cause the dependent measure was at best an ordinal measure that clearly causes problems with LISREL V Furthermore our goal is to test the value priority hypotheses not to compare the relative merits of linear programming and LISREL V Finally a full comparison of technique would best be done with multiple measures of the dependent variable in a variety of contexts
NUMBER OF
BUDGETS-7 0
f6 0 -
50--4 0
-30
20 -
10-
-10 - 5 0 5 I o C O R R E L A T I O N
2
Predictions based on net value priority hypothesis
recognize the evidence from a variety of scientific dis- ciplines suggesting that behavior as observed may differ from behavior as prescribed Both hypotheses imply that the consumer (or family) uses a simple heuristic that leads to near-optimal behavior under a wide variety of conditions This heuristic is to rank order durables ac- cording to value (or net value) and purchase items in that order up to and including a budget cutoff The two hypotheses differ only in their derivation of the nu- meraire by which durables are ranked The empirical evidence for the hypotheses presented earlier suggests that both are reasonable we are comfortable with pro- posing both for further testing Figures A and B also suggest that the net value priority hypothesis may be the better predictor However before embracing the net value hypothesis there are a number of cautions worth considering These include the complex interrelation- ship between the two hypotheses the distinction be- tween descriptive and prescriptive theories and the empirical observation of high rank-order correlation between up and u - p all of which are discussed in the following sections
Interrelationships Between the Hypotheses If durables were not discrete then the duality and
complementary slackness theorems would imply that
459 VALUE PRIORITY HYPOTHESES
TABLE 6
AN EXAMPLE BUDGET WITH THREE ITEMS
Utility Price
($000~)
Home improvement Landscaping Food processor
994 657 328
060 030 008
NOTE ui Is the utlllty of Item1 and p 1s the prlce
the optimal solutions to MP2 (value priority) and MP3 (net value priority) are the same This means that for a given budget B and budget cutoff A the two cri- teria-~rp 3 A and zi - Ap gt 0-would yield the same overall budget (This can also be seen by dividing through by p in the net value criterion) This does not mean that the order of planned purchasing-the rank order of zip and 11 - Apl-will be the same
Consider three items-a home improvement land- scaping and a food processor-that are part of the budget of one of our respondents a married 37-year- old male with two children and a $65000 family in- come Follow~ng the convergent linear programming estimation procedure described earlier Table 6 displays the utilities scaled such that A = 1 Net value priority predicts the order as shown the home improvement the landscaping and then the food processor Value prior~ty predicts the reverse order For these three items the respondent actually planned the home improve- ment the landscaping and then the food processor For this consumer net value priority appears to be a better descriptive model (review Table 4 for more gen- eral results)
Assumption of Stable X
The example above does not indicate what would happen if the budget 3the utilities zi or the avail- ability of products changed The value priority criterion zip would not change On the other hand the net value criterion would remain unchanged only if A did not change However A-which equals dzi(y)djgt at the optimum solution to MP3-may change if B or the us change15 If the change were sufficiently dramatic the net value ordering could change Thus the net value priority hypothesis assumes that A or at least the con- sumers perceived A changes slowly This assumption is worth testing
A change in A would affect our scaling convention of X = 1 The utilities are a function of A and may themselves change if we change the budget problem yet restrict h to be 1 O For the comparative forecasts in this paper the budget problem does not change hence the restriction X = 1 is not critical for our predictive tests It could become critical in other situations
utPt Value priority ui - Pi
Net value priority
17 22 41
3 2 1
394 357 248
1 2 3
TABLE 7
REVISED BUDGETS
Budget items Utility Price
Value priority Food processor 328 $80 Convection oven 328 $80 Landscaping 657 $300
Total 1313 $460
Net value priority Home improvement 994 $600
Total 994 $600
Descriptive vs Prescriptive Hypotheses
We stated the value priority and the net value priority hypotheses as descriptive hypotheses They may or may not lead the consumer to the best decisions For ex- ample consider the consumer discussed above and suppose there were another durable-say a tabletop convection oven-with the same utility and price as the food processor Then for $600 of budget allocations the two hypotheses recommend the allocations indi- cated in Table 7 Prescriptively (if our utilities are ac- curate) the consumer would have been better off (more utility and less money) using the value priority than net value priority Such examples are easy to create Indeed if there were no integer constraints on durable pur- chases the value priority algorithm is prescriptively the best algorithm Even with integer constraints it does not do badly and has reasonable worst case propertiesI6 (Cornuejols et al 1977 Fisher 1980) However we can also create examples to favor net value priority over value priority so again we must interpret all prescrip- tive results with caution
I6The theoretical worst case is a factor of two For example with a budget of $1000 and two products of utility 502 and 500 that cost $501 and $500 respectively the optimum is two units of the second product rather than one unit of the first product But if the budget can be relaxed or nondurables purchased this worst case result is mitigated
Correlation The value priority and net value priority hypotheses
have quite different behavioral interpretations How- ever they may be difficult to distinguish from obser- vations of behavior because the two criteria rlJpJ and tiJ - pJ have high rank-order correlations To illustrate this we drew 10000random values of 11 and pJ from a uniform distribution each of five times The resulting linear correlation of log (uJpJ)-which is monotonic in r~p-and uJ - pJ was quite high 087 This suggests an even higher rank-order correlation Because of this correlation we must interpret with caution any empir- ical comparisons of observed budget plans This does not mean the hypotheses are indistinguishable for ex- ample verbal protocols or process-tracing technology may be able to distinguish between the hypotheses In summary the evidence favoring at least one of the hy- potheses as a description of durable purchasing is pos- itive However comparisons between the hlpotheses must be made with caution and subject to further testing
SUMMARY AND IMPLICATIONS Based on our data estimation and predictive tests
and subject to future research we posit that
1 The ranking of goods according to a budget priority appears to be a reasonable descriptorpredictor of consumer budget plans
2 Both value and net value provide reasonable approx- imations to the numeraire by which durables are ranked
3 It is feasible to measure utility across categories if multiple convergent measures are used
4 Convergent LP estimation is feasible provides rea- sonable estimates of utility and appears consistent in predictive ability with LiSREL V
5 Consumers vary in the heuristic numeraire-value or net value-they use for ranking
6 Consumers vary in their ability to answer specific question types
The last postulate is no surprise to the behavioral re- searcher who faces often the difficult task of estimating unobserved constructs It does provide a caution to the market researcher or management analyst faced with
We seek to demonstrate the rank-order correlation of upJ and uJ - p Thus we seek monotonic transformations of either or both variables such that the linear correlation is maximized The logarith- mic transformation is effective and provides a reasonable lower bound on the maximum rank correlation Technically some transformation is necessary because the mean and variance of (uJ pJ )are both infinite when uj and p are independent and identically distributed uniform random variables In addition the logarithmic transformation gives the intuitive interpretation that log (uJ p j )= log u - log p which we expect to be related to u - p
THE JOURNAL OF CONSUMER RESEARCH
limited measurement budgets who wants to forecast durable purchases Convergent measurement is prob- ably necessary
Our value priority hypotheses are a first step in un- derstanding consumer budget planning They are rea- sonable descriptorspredictors of actual budget plans but they do not model explicitly the mental processes leading to utility formation and information processing A useful direction for research would be the investi- gation of information processing theories to explain how consumers form utility judgments and whether value net value or another hypothesis is the best description of how they integrate utility and price to form budget plans Our postulates and analyses raise a number of other researchable issues as well Among these are
1 Two-stage predictive tests comparing predicted plans to actual plans and to actual purchase
2 Predictive tests collecting measures on all evoked goods and predicting which will be in the budget plans
3 Alternative methods such as verbal protocols and process tracing that can distinguish between the value and net value hypotheses without being subject to the bane of high rank-order correlation between hy-potheses
4 Collection of data such as perceived interest rates depreciation rates and operating and maintenance costs that could test a n elaborated model such as that in Appendix A
These are a few of the many unanswered questions that can be addressed in future research
Managerial Implications We close on a practical note The value priority hy-
potheses can be and are useful in forecasting sales in existing durable product classes Once utilities are es- timated for a sample of consumers we can forecast the implications of new products improved products or changes in prices or economic conditions New or im- proved products change utilities and economic con- ditions change the budgets For each consumer we compute the value criterion (or net value criterion if X does not change) and recompute the buying order For example a megabyte personal computer a digital stereoVCR or a mini-van may have high enough value (or net value) to enter the budget of some consumers The percent of consumers who now budget for the new product form is a forecast of its category sales
The measurement system described in this paper has been used at General Motors and has provided valuable managerial insight into which durable goods compete most with luxury automobiles For example Table 8 lists those goods that were ranked above automobiles
For example Lyons (1984) used our data internal intelligence on competitive models and a conjoint analysis to forecast changes in utility
VALUE PRIORITY HYPOTHESES
TABLE 8
DURABLE GOODS COMPETING WITH AUTOMOBILES
Durable Percent
1 School tuition 1983 2 Vacation 1983 3 Home improvement (minor) 4 Major clothing 5 Landscaping 6 School tuition 1984 7 GiftsDonations 8 Cameras and Accessories 9 Furniture
10 Home fuel savings device 11 Home improvement (major) 12 Vacation 1984 13 Dishwasher 14 Color television 15 Stereo system 16 Jewelry 17 House 18 Oven 19 MovieVideo camera 20 Video tape recorder 21 RefrigeratorFreezer 22 School tuition 1985 23 Home computer 24 Vacation 1985
NOTE The percents signify the percentage of budgets in which the indicated item was ranked above an automobile when both the item and an automobile were in the budget
when both were in the budget Recent automobile de- sign and marketing campaigns have been based on budget priority analyses that consider product im-provements or advertised image (less maintenance im- proved comfort and so on) Such changes are designed to increase the utility of an auto purchase and thereby move it up in the buying priority The value priority model is also used to determine if the introduction of a new automobile will improve the position of an au- tomobile purchase in the ordering After having con- sumers drive the new automobile in a clinic environ- ment the new automobiles utility is measured relative to the respondents current first choice automobile to determine if it is higher in the respondents priority or- dering than the previous automobile Application work is continuing to ascertain the managerial usefulness of the value priority hypotheses in managing new and es- tablished durable consumer goods
APPENDIX A Multiple Period Hypotheses
The value priority hypothesis and the net value priority hypothesis are readily extendable The equa- tions for the value priority hypothesis were derived in Hauser and Urban (1982) We restate them here in con- densed form and indicate how they apply to the net value priority hypothesis
Let ti be the utility of the r t h item of the jthgood p be the expected price of that good at time f cS be a
zero-one indicator of whether the ithitems of good J is purchased Note 6 gt 0 only if 6 1 - 1 = 1 Let u(y) be the utility of spending y on nondurables in time t Let B be the consumers budget constraint in time t Dbe hisher debt in time t and b be the amount borrowed (saved) in that period Let d be the depreciation rate for good J and r be the interest rate Let c be the op- erating and maintenance cost of durable j n periods after purchase The consumers problem (MP4) is as follows Maximize
T T-1 r C C C I C + C 14 ( ~ 1 )C f J 9 ~ ~ J l ~ J l I
r = l J r q=O I = 1
subject to T-1
pJt(C 61) + C cJJJtt+ )- h~ BI J n= l
Dl = Dl-(I + r ) + b DT=O forallt
6i = 0 1 6Ji = 1 iff 6 = 1 and s gt t
The value priority criterion for the LP relaxation of the integer constraints now becomes
T- I T- 1
Z ( J ~ [C(1 + riT-I[P~+ C ~ j n l - (Al ) q=O n= l
Finally trade-ins are handled by computing net depre- ciated utility gain divided by net price and pairwise complementarity is added with hierarchical dependence of u on another good k For the net value hypothesis the criterion is (numerator of A 1) - p (denominator of A l ) where p is the simplex multiplier of the debt con- straint D = 0
APPENDIX B Dual Linear Program Non-Technical
Summary 4n important concept in linear programming is that
for every linear program there is a related dual linear program The variables of the dual are known as simplex multipliers or shadow prices Each variable of the dual corresponds to a constraint in the original linear pro- gram and represents the sensitivity of relaxing the constraint-ie the amount by which the objective function would change if that constraint were relaxed If the original linear program is a maximization prob- lem then the dual program has as its objective the min- imization of a weighted sum of the dual variables The weights are the constants in the constraints of the orig- inal linear program The constraints of the dual are based on the constraints and objective function of the original linear program For example
Original Dual-max clxi + c2x2 min btul + b2u2 subject to al lxlt a12x2--i 61 st al lul+ a 2 1 ~ 22 cl
~ 2 ~ x 1+ ~ ~ 2 x 2--i b2 2 c2alzui+ a2~u2 X l X ~ 2 0 u u2gt0
Note tha t m corresponds to the first constraint in t he original program a n d represents t he value o f relaxing tha t constraint
T h e duality theorem states the amazing result tha t t h e optimal values of the object functions of t he two linear programs are identical Complementary slackness states tha t if a dua l variable has a non-zero value in the optimal solution t o t he dual t hen t h e corresponding constraint in t he original program must be binding and vice versa Fo r a more complete and technical exposi- t ion see Gass (1969) o r a n y l inear programming text Note tha t the dua l of t he dua l is t he original l inear pro- gram
[Received March 1985 Revised October 19851
REFERENCES
Bentler Peter M and Douglas G Bonett (1980) Significance Tests and Goodness of Fit in the Analysis of Covariance Structures Psychological Bulletin 88 (3) 588-606
Bertan Jenny and John R Hauser (1982) Auto Show Focus Groups Technical Report to General Motors MIT Cambridge MA January
Bettman James R (1979) An Information Processing Theory of Consumer Choice Reading MA Addison-Wesley
Blackorby Charles Daniel Primont and R Robert Russell (1 975) Budgeting Decentralization and Aggregation Annals ofEconomic Social Measurement 4 ( I ) 23-44
Brown DA SF Buck and FG Pyatt (1965) Improving the Sales Forecast for Consumer Durables Journal of Marketing Research 2 (August) 229-234
Clarke Yvonne and Geoffrey N Soutar (1982) Consumer Acquisition Patterns for Durable Goods Australian Ev- idence Journal of Consumer Research 8 (March) 456- 459
Cornuejols Gerald Marshall L Fisher and George L Nem- hauser (1977) Location of Bank Accounts to Optimize Float An Analytic Study of Exact and Approximate Al- gorithms hfanagement Science 23 (April) 789-8 10
Dickson Peter R Robert F Lusch and William L Wilkie (1 983) Consumer Acquisition Priorities for Home Ap- pliances A Reproduction and Re-evaluation Journal of Consumer Research 9 (March) 432-435
and William L Wilkie (1978) The Consumption of Household Durables A Behavioral Review Marketing Science Institute Working Paper Series Cambridge MA December
Duncan Otis D (1975) Introduction to Structural Equation Models New York Academic Press
Fisher Marshall (1980) Worst Case Analysis of Heuristic Algorithms Management Science 26 (January) 1 -17
Gass Saul 1 (1969) Linear Programming Methods and Ap- plications 3rd Edition New York McGraw-Hill
Green Paul E and V Srinivasan (1978) Conjoint Analysis in Consumer Research Issues and Outlook Journal of Consumer Research 5 (September) 103- 123
Hauser John R and Frank S Koppelman (l979) Alter- native Perceptual Mapping Techniques Relative Ac- curacy and Usefulness Journal ofltfarketing Research 16 (November) 495-506
John H Roberts and Glen L Urban (1983) Fore-
THE JOURNAL OF CONSUMER RESEARCH
casting Sales of a New Consumer Durable in Advances and Practices of Marketing Science ed F S Zufryden Providence RI The Institute of Management Sciences 115-128
and Glen L Urban (1982) Prelaunch Forecasting of New Consumer Durables Ideas on a Consumer Value- Priority Model in Analytic Approaches to Product and tfarketing Planning The Second Confirence ed Raj K Srivastava and Allan D Shocker Cambridge MA Mar- keting Science Institute 276-296
Heiner Ronald A (1983) The Origin of Predictable Be- havior American Economic Review 73 (September) 560-595
Heise David R (1975) Caltsal Analjsis New York John Wiley
Johnson Eric J and Amos Tversky (1983) Affect Gener- alization and the Perception of Risk Journal of Per- sonulily and Social Psychology 45 ( I) 20-3 1
Joreskog Karl G and Dag Sorbom (198 I) LISREL Anabois of Linear Structural Relationships by the Method of hfaximum Likelihood version V Chicago IL National Educational Resources
Juster F Thomas (1 966) Consumer Buying Intentions and Purchase Probability An Experiment in Survey Design Journal of the American Statistical Association 6 1 658- 696
Kasuiis Jack J Robert F Lusch and Edward F Stafford Jr (1979) Consumer Acquisition Patterns for Durable Goods Journal o f Consumer Research 6 (June) 47- 57
Keon John W (1980) The Bargain Value Model and a Comparison of Managerial Implications with the Linear Learning Model hlanagement Science 26 (November) 11 17-1 130
Lyons Larry (1 984) Forecasting the Impact of Competitive Entries on the Sales of a New Consumer Durable SM Thesis Sloan School of Management MIT Cam-bridge MA 02 139
McFadden David (1974) Conditional Logit Analysis of Qualitative Choice Behavior in Frontiers of Econo-metrics ed P Zarembka New York Academic Press
Paroush Jacob (1965) The Order of Acquisition of Con- sumer Durables Econometrica 33 (January) 225-235
Rosen Sherwin (1 974) Hedonic Prices and Implicit Mar- kets Product Differentiation in Pure Competition Journal qf Political Economy 82 ( ~ a n u a r ~ l ~ e b r u a r ~ ) 34-55
Shugan Steve M (1980) The Cost of Thinking Journal of Consumer Research 7 (September) 99- 1 1 1
Srinivasan V (1982) Comments on the Role of Price in Individual Utility Judgments in Choice Models for Buyer Behavior ed Leigh McAlister Greenwich CT JAI Press
and Allan D Shocker (1973) Linear Programming Techniques for Multi-Dimensional Analysis of Prefer- ence Psychometrika 38 (September) 337-370
Sternthal Brian and C Sam Craig (1 982) Consumer Behav- ior 4n Infornlation Processing Perspective Englewood Cliffs NJ Prentice-Hall
Tverskey Amos and Daniel Kahneman (1974) Judgment Under Uncertainty Heuristics and Biases Science 185 1124-1 131
Urban Glen L and John R Hauser (1980) Design and ampfar- keting o f~Yew Products Englewood Cliffs NJ Prentice- Hall
You have printed the following article
The Value Priority Hypotheses for Consumer Budget PlansJohn R Hauser Glen L UrbanThe Journal of Consumer Research Vol 12 No 4 (Mar 1986) pp 446-462Stable URL
httplinksjstororgsicisici=0093-53012819860329123A43C4463ATVPHFC3E20CO3B2-J
This article references the following linked citations If you are trying to access articles from anoff-campus location you may be required to first logon via your library web site to access JSTOR Pleasevisit your librarys website or contact a librarian to learn about options for remote access to JSTOR
References
Improving the Sales Forecast for Consumer DurablesD A Brown S F Buck F G PyattJournal of Marketing Research Vol 2 No 3 (Aug 1965) pp 229-234Stable URL
httplinksjstororgsicisici=0022-2437281965082923A33C2293AITSFFC3E20CO3B2-O
Consumer Acquisition Patterns for Durable Goods Australian EvidenceYvonne Clarke Geoffrey N SoutarThe Journal of Consumer Research Vol 8 No 4 (Mar 1982) pp 456-460Stable URL
httplinksjstororgsicisici=0093-5301281982032983A43C4563ACAPFDG3E20CO3B2-T
Location of Bank Accounts to Optimize Float An Analytic Study of Exact and ApproximateAlgorithmsGerard Cornuejols Marshall L Fisher George L NemhauserManagement Science Vol 23 No 8 (Apr 1977) pp 789-810Stable URL
httplinksjstororgsicisici=0025-19092819770429233A83C7893ALOBATO3E20CO3B2-1
Consumer Acquisition Priorities for Home Appliances A Replication and Re-evaluationPeter R Dickson Robert F Lusch William L WilkieThe Journal of Consumer Research Vol 9 No 4 (Mar 1983) pp 432-435Stable URL
httplinksjstororgsicisici=0093-5301281983032993A43C4323ACAPFHA3E20CO3B2-E
httpwwwjstororg
LINKED CITATIONS- Page 1 of 3 -
Worst-Case Analysis of Heuristic AlgorithmsMarshall L FisherManagement Science Vol 26 No 1 (Jan 1980) pp 1-17Stable URL
httplinksjstororgsicisici=0025-19092819800129263A13C13AWAOHA3E20CO3B2-4
Conjoint Analysis in Consumer Research Issues and OutlookPaul E Green V SrinivasanThe Journal of Consumer Research Vol 5 No 2 (Sep 1978) pp 103-123Stable URL
httplinksjstororgsicisici=0093-5301281978092953A23C1033ACAICRI3E20CO3B2-5
Alternative Perceptual Mapping Techniques Relative Accuracy and UsefulnessJohn R Hauser Frank S KoppelmanJournal of Marketing Research Vol 16 No 4 (Nov 1979) pp 495-506Stable URL
httplinksjstororgsicisici=0022-24372819791129163A43C4953AAPMTRA3E20CO3B2-23
The Origin of Predictable BehaviorRonald A HeinerThe American Economic Review Vol 73 No 4 (Sep 1983) pp 560-595Stable URL
httplinksjstororgsicisici=0002-82822819830929733A43C5603ATOOPB3E20CO3B2-R
Consumer Buying Intentions and Purchase Probability An Experiment in Survey DesignF Thomas JusterJournal of the American Statistical Association Vol 61 No 315 (Sep 1966) pp 658-696Stable URL
httplinksjstororgsicisici=0162-14592819660929613A3153C6583ACBIAPP3E20CO3B2-M
Consumer Acquistion Patterns for Durable GoodsJack J Kasulis Robert F Lusch Edward F Stafford JrThe Journal of Consumer Research Vol 6 No 1 (Jun 1979) pp 47-57Stable URL
httplinksjstororgsicisici=0093-5301281979062963A13C473ACAPFDG3E20CO3B2-S
httpwwwjstororg
LINKED CITATIONS- Page 2 of 3 -
The Bargain Value Model and a Comparison of Managerial Implications with the LinearLearning ModelJohn W KeonManagement Science Vol 26 No 11 (Nov 1980) pp 1117-1130Stable URL
httplinksjstororgsicisici=0025-19092819801129263A113C11173ATBVMAA3E20CO3B2-G
The Order of Acquisition of Consumer DurablesJacob ParoushEconometrica Vol 33 No 1 (Jan 1965) pp 225-235Stable URL
httplinksjstororgsicisici=0012-96822819650129333A13C2253ATOOAOC3E20CO3B2-3
Hedonic Prices and Implicit Markets Product Differentiation in Pure CompetitionSherwin RosenThe Journal of Political Economy Vol 82 No 1 (Jan - Feb 1974) pp 34-55Stable URL
httplinksjstororgsicisici=0022-3808281974012F0229823A13C343AHPAIMP3E20CO3B2-U
The Cost of ThinkingSteven M ShuganThe Journal of Consumer Research Vol 7 No 2 (Sep 1980) pp 99-111Stable URL
httplinksjstororgsicisici=0093-5301281980092973A23C993ATCOT3E20CO3B2-J
httpwwwjstororg
LINKED CITATIONS- Page 3 of 3 -
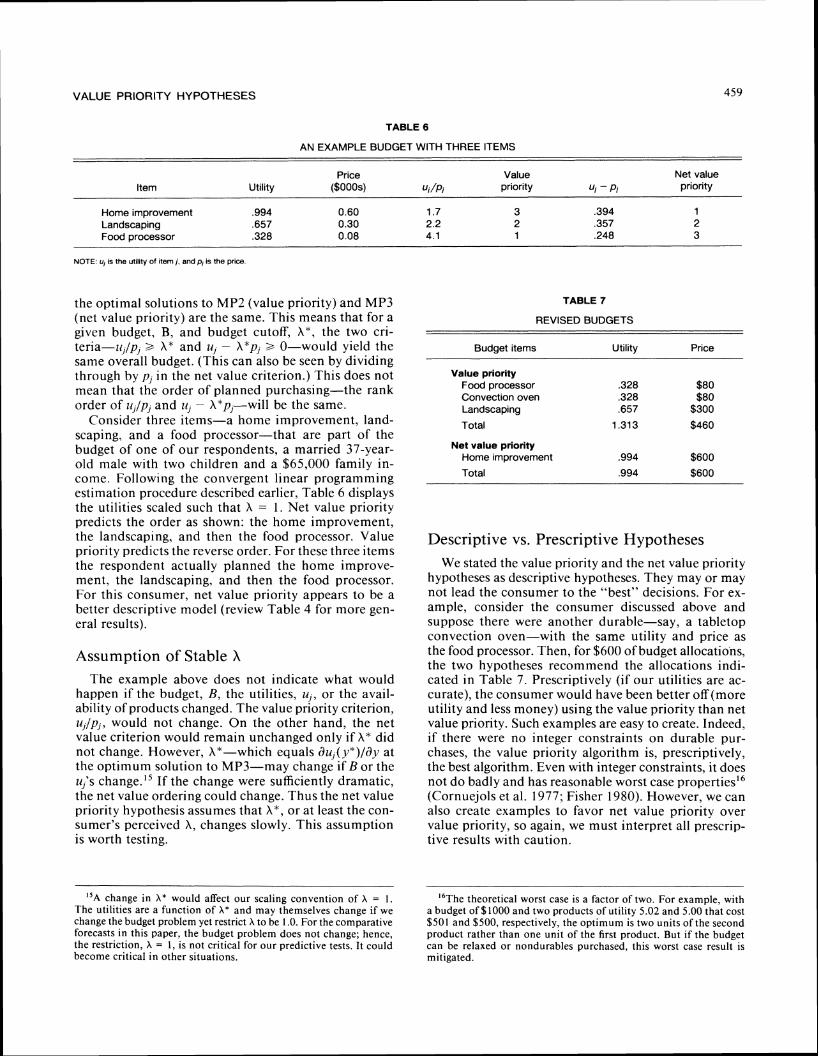
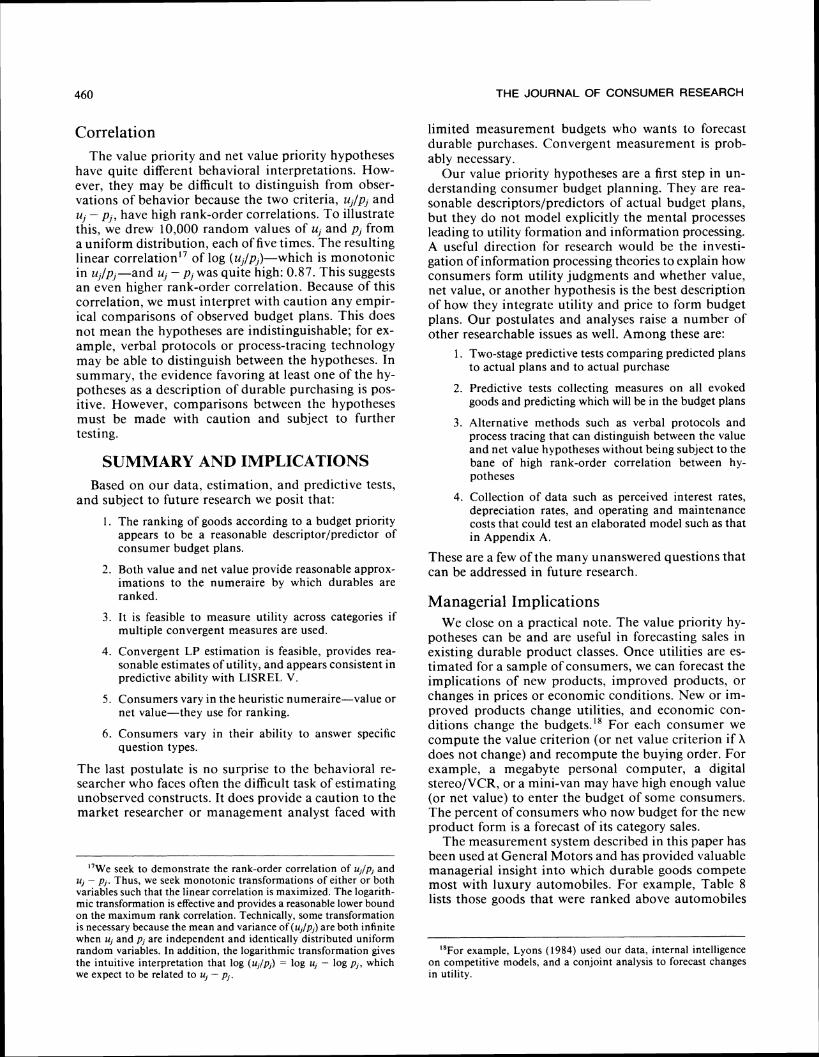
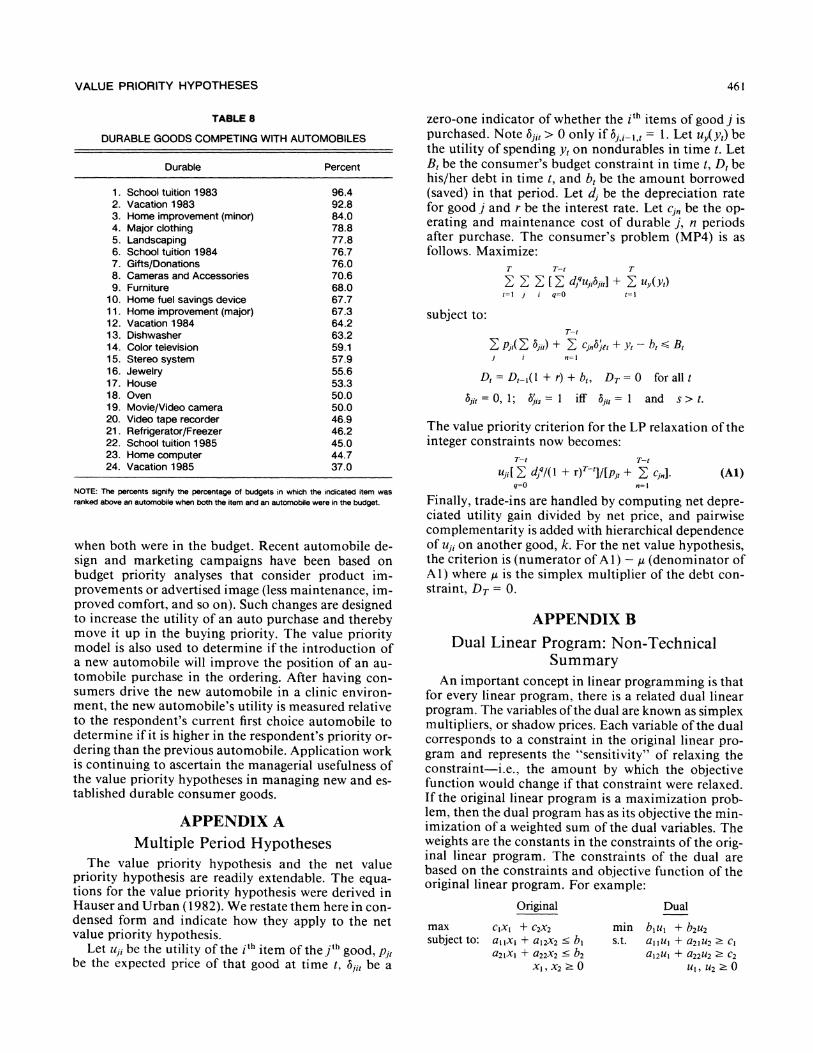