The value of energy storage in decarbonizing the...
40
The value of energy storage in decarbonizing the electricity sector Fernando J. de Sisternes 1,2* , Jesse D. Jenkins 1,2* , Audun Botterud 1,2 This is a pre-publication version of this paper. Please cite as: de Sisternes, Fernando J., Jesse D. Jenkins, and Audun Botterud, “The value of energy storage in decarbonizing the electricity sector,” Applied Energy (in press, 2016). 1 Energy Systems Division, Argonne National Laboratory, 9700 S. Cass Avenue, Building 362, Argonne, IL 60439-4844 USA. 2 MIT Energy Initiative, Massachusetts Institute of Technology, 77 Massachusetts Avenue, E19-307, Cambridge, MA 02139-4307 USA. * Corresponding authors. Email: [email protected]; [email protected]
Transcript of The value of energy storage in decarbonizing the...
The value of energy storage in decarbonizing the
electricity sector
Fernando J. de Sisternes1,2*, Jesse D. Jenkins1,2*, Audun Botterud1,2
This is a pre-publication version of this paper. Please cite as:
de Sisternes, Fernando J., Jesse D. Jenkins, and Audun Botterud, “The value of energy storage in decarbonizing the electricity sector,” Applied Energy (in press, 2016).
1 Energy Systems Division, Argonne National Laboratory, 9700 S. Cass Avenue, Building 362, Argonne,
IL 60439-4844 USA.
2 MIT Energy Initiative, Massachusetts Institute of Technology, 77 Massachusetts Avenue, E19-307,
Cambridge, MA 02139-4307 USA.
* Corresponding authors. Email: [email protected]; [email protected]

2 PRE-PUBLICATION VERSION | APRIL 20, 2016
Abstract
Electrical energy storage could play an important role in decarbonizing the electricity sector by
offering a new, carbon-free source of operational flexibility, improving the utilization of
generation assets, and facilitating the integration of variable renewable energy sources. Yet, the
future cost of energy storage technologies is uncertain, and the value that they can bring to the
system depends on multiple factors. Moreover, the marginal value of storage diminishes as more
energy storage capacity is deployed. To explore the potential value of energy storage in deep
decarbonization of the electricity sector, we assess the impact of increasing levels of energy
storage capacity on both power system operations and investments in generation capacity using a
generation capacity expansion model with detailed unit commitment constraints. In a case study
of a system with load and renewable resource characteristics from the U.S. state of Texas, we find
that energy storage delivers value by increasing the cost-effective penetration of renewable
energy, reducing total investments in nuclear power and gas-fired peaking units, and improving
the utilization of all installed capacity. However, we find that the value delivered by energy
storage with a 2-hour storage capacity only exceeds current technology costs under strict
emissions limits, implying that substantial cost reductions in battery storage are needed to justify
large-scale deployment. In contrast, storage resources with a 10-hour storage capacity deliver
value consistent with the current cost of pumped hydroelectric storage. In general, while energy
storage appears essential to enable decarbonization strategies dependent on very high shares of
wind and solar energy, storage is not a requisite if a diverse mix of flexible, low-carbon power
sources is employed, including flexible nuclear power.
Keywords: energy storage, climate change, decarbonization, renewable energy integration,
capacity planning

PRE-PUBLICATION VERSION | MAY 1, 2016 3
1. Introduction
The electric power sector must play a central role in any effort to mitigate the worst impacts
of climate change. Most climate stabilization scenarios envision the global power sector emitting
very low or zero carbon dioxide (CO2) by 2050 while also expanding to electrify and decarbonize
portions of the industry and transportation sectors [1] [2]. Electrical energy storage could play an
important role in the deep decarbonization of the power sector by offering a new, carbon-free
source of operational flexibility in the power system, improving the utilization of generation
assets, and facilitating the integration of variable renewable energy sources (i.e., wind and solar
power) [3] [4]. Most of the value of energy storage is accrued from its ability to arbitrage
wholesale prices during peak and non-peak hours, thereby leveling out the system load [5] [6] [7]
[8], but also from providing a carbon-free source of operating reserves and flexibility [9] [10]
[11] [12] that might potentially defer investments in other more expensive generation assets [13]
[14].
To date, many studies have examined the short-run impact of energy storage on electric
power system operations and economics [5] [6] [7] [8] [9] [14] [15] [16] [17] [18]. Some of these
studies have focused on the role of energy storage for integrating large amounts of variable
renewable energy generation in power system operations [9] [15] [16], and others have assessed
the impact of storage operation on carbon emissions in conventional power systems [17] [18].
Studies assessing the short-run value of energy storage in different electricity markets typically
employ price-taker arbitrage models (i.e., models that maximize the profits of the storage unit
assuming that storage does not impact electricity prices) [5] [6] [7] [8] [14], while others calculate
the short-run price equilibrium minimizing the system operating costs but ignoring long-run
capacity expansion decisions [11] [12].
The long-run impact of energy storage on renewable energy utilization is explored in [19].
However, this study does not account for economic considerations and maximizes a multi-
objective function composed of renewable penetration minus storage and backup requirements,

4 ACCEPTED BY APPLIED ENERGY | MAY 1, 2016
instead of using the standard criterion of maximizing social welfare—or, equivalently,
minimizing total generation costs. Conversely, the long-run economic impact of storage is
analyzed in [13] and [20] based on cost minimization, but these studies do not include binding
CO2 emissions limits for the electricity sector. Other studies that consider the long-run market
dynamics under stringent CO2 emissions limits [21] [22] do not consider detailed unit-
commitment constraints in the operation of the plants, underestimating the flexibility value
energy storage technologies bring to power systems.
In contrast to the existing literature discussed above, this paper focuses explicitly on the total
generation-system value of energy storage.1 We explore in detail the impact of energy storage on
short-run power systems operations—accounting for detailed unit-commitment decisions, the
contribution of storage to system flexibility and operating reserves, and the resulting influence on
wholesale electricity prices—as well as the impact of energy storage on long-run power plant
investment decisions, all in the context of stringent CO2 emissions reduction goals. This work
therefore adds to the existing literature by providing a more complete assessment of the full
economic value of energy storage through jointly capturing both the short- and long-run
interaction between storage, renewable energy, and other zero-carbon electricity sources and their
relative contributions to meet demands for energy and operating reserves along with emissions
reduction objectives. The novel analytical framework used in this work can be applied to more
accurately value energy storage in indicative planning [23] for future low-carbon power systems,
where the CO2 emissions and flexibility attributes of the different generation technologies play a
critical role in determining the minimum cost generation fleet that is operationally feasible and
complies with a given carbon emissions limit.
1 By generation-system value we refer to the full value of generation, including capital and operating costs
for meeting energy and ancillary services needs, but without accounting for transmission or distribution
costs, which are very much contingent on the particular power system analyzed.
PRE-PUBLICATION VERSION | MAY 1, 2016 5
In our analysis we made extensions to the Investment Model for Renewable Electricity
Systems (IMRES) [24], an advanced generation capacity expansion model that considers unit
commitment constraints for individual power plants, system-wide reliability requirements, and
individual power plant investment decisions. The model selects the cost-minimizing set of
investments in electricity generation capacity to reliably meet the electricity demand in a future
year, subject to a CO2 emissions limit.2 We model a power system with electricity demand and
wind and solar resource data from the Electricity Reliability Corporation of Texas (ERCOT) grid.
To explore the impacts of storage on the long-run portfolio of power generation capacity, we
increase demand consistent with 2035 projections in Texas and employ the model in a
“greenfield” configuration—i.e., selecting the entire generation mix from scratch. Eligible
technologies include pulverized coal, combined cycle gas turbines (CCGTs), open cycle gas
turbines (OCGTs), wind turbines, solar photovoltaics, and nuclear power. The nuclear power
plants are modeled as capable of flexible operation consistent with reactors in France, Germany
and other locations [25] [26] [27] as well as modern reactor capabilities [28] [29]. We model this
experimental power system assuming no transmission network constraints and imposing both
increasing levels of energy storage capacity and increasingly stringent limits on the average CO2
emissions rate of the electricity system. Specifically, we model 0-30 gigawatts (GW) of energy
storage, representing approximately 0-30% of the system’s peak demand, and emissions limits of
200-50 metric tons of CO2 per gigawatt-hour (tCO2/GWh), approximately 60-90% below
prevailing 2013 emissions rates in the United States (514 tCO2/GWh) [30] or the European Union
(567 tCO2/GWh) [31].
The contributions of this paper can be summarized as follows: 1) We present a
comprehensive analytical framework for assessment of the full generation-system value of energy
storage technologies in long-run economic equilibrium, accounting for detailed, short-term 2 The CO2 emissions limit applies only to emissions from power plants during operations and does not
include emissions associated with construction, decommissioning or other lifecycle related emissions.
fernando
Cross-Out
fernando
Cross-Out
fernando
Sticky Note
489
fernando
Sticky Note
337
6 ACCEPTED BY APPLIED ENERGY | MAY 1, 2016
operational constraints as well as CO2 emissions goals. The novel analytical framework allows
for a more accurate assessment of energy storage benefits compared to what is found in the
existing literature. 2) We conduct a detailed case study of the role of energy storage in a future
power system based on ERCOT data and with increasingly stringent CO2 emissions targets. We
find that the value of energy storage increases with tighter emissions targets. At the same time,
the marginal value of storage declines significantly as storage capacity increases and substantial
cost reductions are likely needed to economically justify large-scale deployment of most storage
technologies.
The paper is organized as follows: Section 2 introduces the methodological approach and the
experimental design used in the analysis. Section 3 presents the economic and technical results
under three different hypothetical conditions, each of which is exposed to increasingly stringent
emissions limits: a power system without energy storage and a diverse range of generation
resources, a power system with energy storage and the same generation resources, and a power
system with storage that relies exclusively on renewable energy technologies to reduce carbon
emissions. Section 4 and Section 5 present respectively the discussion and the conclusions
derived from the analysis.
2. Methods
2.1. Demand, renewables and generation technology cost data sets
This study models an experimental electricity system with electricity demand and wind and
solar resource data from the Electricity Reliability Corporation of Texas (ERCOT) grid. The
selection of a ‘Texas-like’ test system was motivated by the relative lack of hydroelectric
resources in Texas and weak interconnection with other neighboring power systems of the
ERCOT interconnection, which allows a clear interpretation of the results. To project electricity
demand in ERCOT in 2035, we increased historical 2014 hourly electricity demand for the
PRE-PUBLICATION VERSION | MAY 1, 2016 7
ERCOT grid at an annual growth rate of 1.86% [32], resulting in a system peak load of 97.1 GW.
Hourly wind resource availability was also obtained from 2014 ERCOT historical data, with an
average wind availability of 35.7%. Hourly solar photovoltaic availability was estimated by
aggregating data from NREL’s PV Watts Model [33] for seven geographically diversified
locations in Texas, assuming single-axis tracking systems located in Mineral Wells, Lubbock,
Midland, and Marfa and rooftop panels in San Antonio, Austin, and Houston. The resulting
average availability of solar photovoltaic was found to be 19.9%.
Other generation technologies considered in the study are dual-unit nuclear pressurized
water reactors, dual-unit advanced pulverized coal steam generators, combined-cycle gas turbines
(CCGTs), and advanced open-cycle gas turbines (OCGTs). The capital cost of each generation
technology was collected from the U.S. Energy Information Administration’s Annual Energy
Outlook 2014 [32] and the U.S. Department of Energy “Wind Vision” [34] and “SunShot Vision”
Reports [35]. Overnight capital costs were annualized using a 10% discount rate and 30 and 40
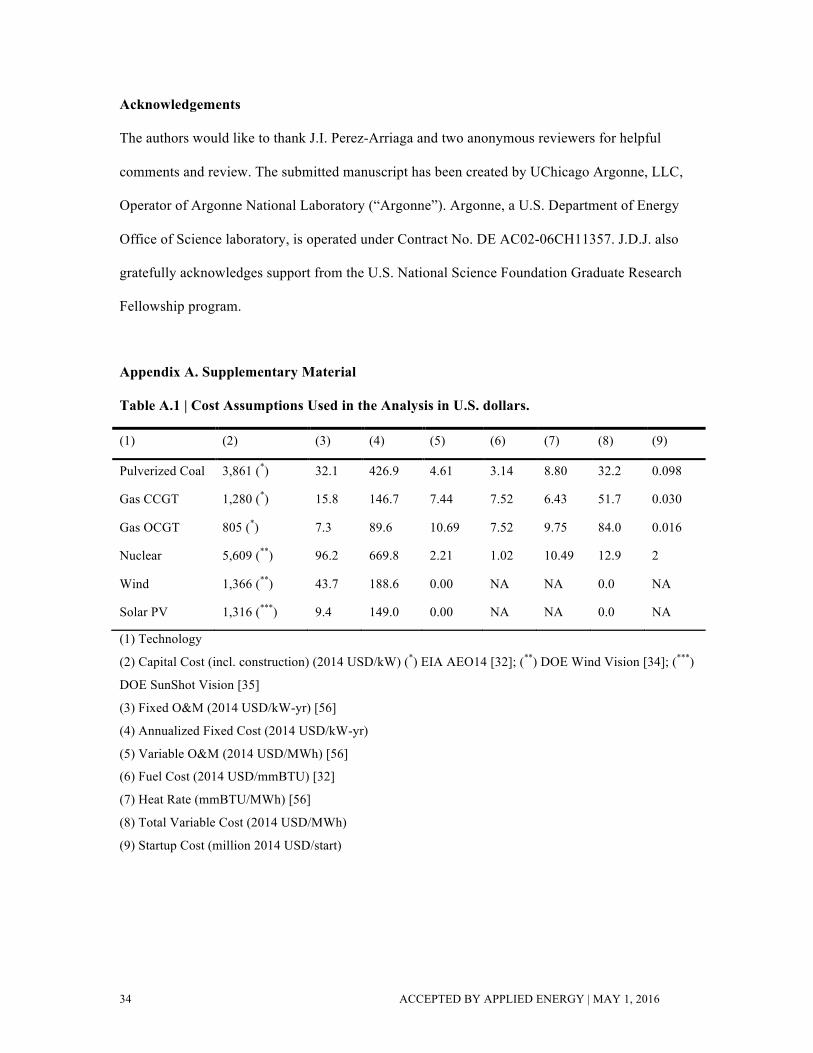
years of expected life for renewable and thermal technologies respectively. A summary of the
cost parameters for all generating technologies in the study is provided in Table A.1.
2.2. Experimental design
The experiments conducted in this study determine the optimal portfolio of thermal and
renewable generation capacity necessary to supply the expected hourly electricity demand in
2035 at minimum cost for different exogenously-specified levels of installed energy storage
capacity, while accounting for the chronological variability of demand and renewable resources,
the system requirements for operating reserves, as well as the operational limits of the installed
generating units. With the exception of a reference baseline scenario, each of the analyzed
scenarios is subject to a mass-based CO2 limit, representing future possible decarbonization
targets. This CO2 limit is implemented as a cap on the total amount of CO2 emissions produced
by electricity generation on a yearly basis. For easier comparison with the emissions produced in
8 ACCEPTED BY APPLIED ENERGY | MAY 1, 2016
other power systems, we normalize the mass-based limit by the total energy generated and
present the emissions limit in the plots as an emissions rate expressed as tons of CO2 emissions
per GWh generated.
The experimental setting consists of 35 cases resulting from the possible combinations of
seven scenarios of installed energy storage capacity and five scenarios of CO2 emissions limits.
Energy storage scenarios range from 0-30 GW of installed capacity (in 10 GW increments) and
include two generic energy storage technologies, each of which is represented by a different
energy to power ratio: 10:1 (or 10 hours of energy storage at maximum hourly discharge) and 2:1
(or 2 hours of storage). There is a wide range of energy storage technologies commercially
available and in development, each with different configurations of power and energy capacities,
round-trip efficiencies, cycle life, and other operating parameters [36] [37] [38]. We selected
these two generic storage technologies to enable evaluation of the value of different durations of
storage capacity. The 2-hour generic storage technology can be considered broadly consistent
with commercially available Lithium-ion (Li-ion) battery systems, which are typically installed
with energy to power ratios between 0.25:1 to 5:1 [36]. The 10-hour storage technology is
broadly consistent with pumped hydroelectric storage systems, which typically were designed for
a daily operating cycle with power ratios ranging from 8:1 to 16:1 [36], although there are
examples of pumped storage hydro facilities with more than 20 hours of operating storage as well
as storage duration of as little as four hours [38]. To facilitate comparison and evaluation of the
value of shorter or longer-duration storage capabilities, both generic technologies are assumed to
have a round-trip efficiency of 80%. This is a mid-range value for both pumped-hydro electric
storage systems, which have round-trip efficiencies ranging from 70-85% efficiency [36] [38] and
Li-ion systems, which typically range from 73-90% (including AC/DC and DC/AC power
conversion losses) [36]. While these two generic technologies allow for broad comparison of
relatively short and long-duration storage resources, care should be taken in using the results
PRE-PUBLICATION VERSION | MAY 1, 2016 9
herein to derive the value of specific storage technologies or installations which may have
different characteristics, such as different round-trip efficiency or storage duration.
CO2 emissions limits span a range between 200 t/GWh and 50t/GWh in 50 ton increments,
as well as a baseline reference scenario with unconstrained emissions. Note that these limits
represent substantial reductions in CO2 emissions relative to current emissions rates in Texas,
which stand at approximately 550 t/GWh. Emissions limit scenarios thus correspond to roughly
63-91 percent declines relative to current emissions rates.
In addition to these core scenarios, we also re-analyzed the 100 t/GWh emissions limit under
each of the seven storage scenarios after excluding nuclear power as an eligible generation
technology. These scenarios explore the ability of variable renewable energy resources (wind and
solar) to meet stringent emissions limits without additional zero-carbon generation resources and
the value of storage in such cases.
2.3. Generation Capacity Expansion Model
This study employs the generation capacity expansion model IMRES [39] to determine
simultaneously the optimal greenfield level of investment in generation capacity—i.e., assuming
that there is no existing generating capacity—in each of the cases studied and the optimal
operation of these generation investments. IMRES is implemented as a mixed-integer linear
programming model using the commercial optimization solver CPLEX. The model selects the
combination of available thermal power plants and renewable generation that can supply
electricity demand at minimum cost, while complying with operational reliability constraints and
the CO2 emission limit imposed on the system. The optimization is done over four representative
weeks and the operational results and associated costs are scaled up to approximate annual
values.
Analogously to classic static generation capacity expansion models [40], the goal of IMRES
is to minimize the total generation cost in the system over one year. These costs can be divided

10 ACCEPTED BY APPLIED ENERGY | MAY 1, 2016
into fixed costs (which include the annuity corresponding to the amortization of the capital cost at
a 10% weighted average cost of capital and fixed operation and maintenance cost), variable costs
(which include fuel consumption and variable operation and maintenance costs), startup costs for
thermal generators (which include the fuel cost of starting up the turbine and the degradation of
the turbine from starting up and shutting down), and the cost of non-served energy. The objective
function in IMRES is subject to a set of constraints that reflect the operational limits of the
different generators in the system (i.e., minimum up and down time, ramping limits, and
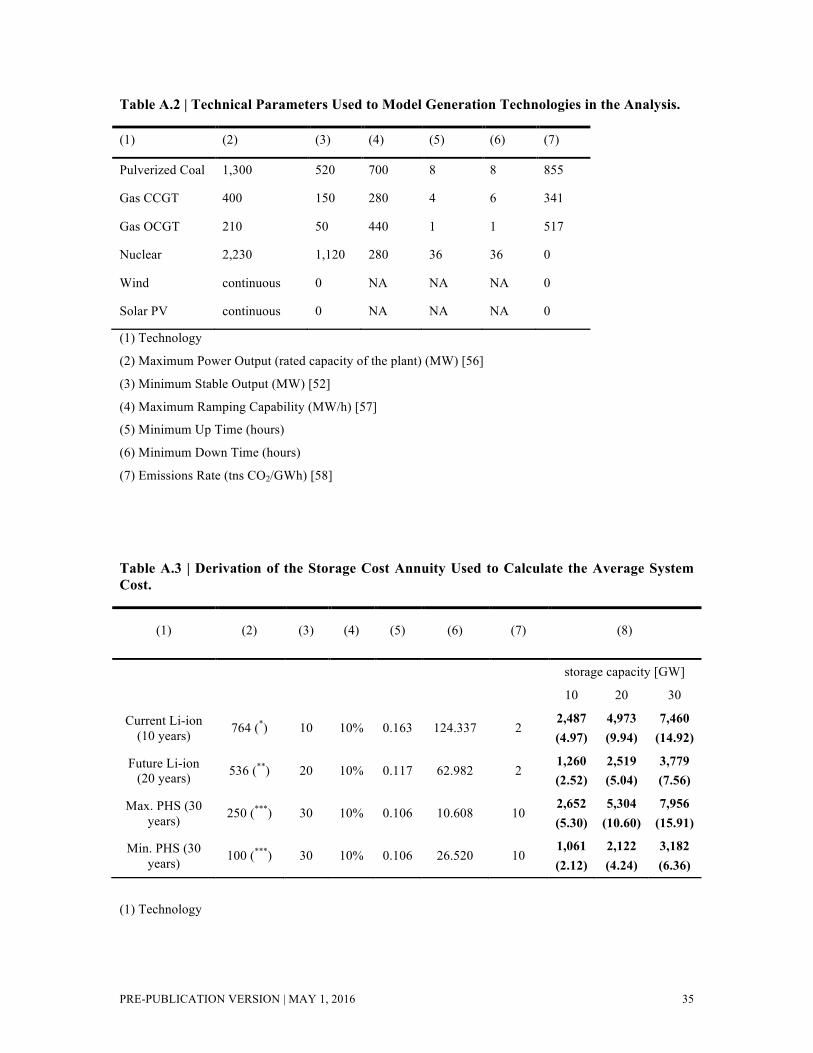
minimum stable output of the generators). The values of the technical parameters used are
included in Table A.2.
Moreover, IMRES requires the resulting generation mix to provide an amount of operating
reserves for the system, i.e., available capacity that can be used at any time to balance the system
under uncertain events such as the loss of a generator, or forecasting errors in demand, wind or
solar generation. The operating reserve requirements for the system are based on the largest
single generator in the system, the electricity demand in each hour, and the wind and solar energy
generation in each hour. Note that the reserve requirements are determined endogenously in the
model and increase with the level of installed wind and solar capacity. Details for the formulation
of these constraints can be found in [39]. Combining a capacity expansion formulation with
detailed operational constraints and operating reserve requirements enables our study to reflect
the impact of the variability and uncertainty of renewable resources on the operation of thermal
units, operating reserve requirements, and on capacity expansion decisions, and ultimately the
value of energy storage in decarbonizing the electricity sector. These aspects are critical in the
analysis of low carbon emissions power systems [13] [24].
In these experiments, we exogenously specify the capacity of energy storage, and then
IMRES optimally determines the operation of storage capacity and accounts for the interaction
between storage and other operating and capacity expansion decisions. IMRES treats this storage
capacity as a single energy reservoir that can store energy within the power and energy limits

PRE-PUBLICATION VERSION | MAY 1, 2016 11
specified for each of the analyzed scenarios. Energy storage is also exposed to a round-trip
efficiency factor (80%) that reflects the energy losses in the process. Note that since the energy
storage capacity in each experiment is an exogenous input, the investment cost of energy storage
is not reflected in the objective function of IMRES, which only reflects total generation costs. We
however add the cost of storage to the cost of generation in an additional metric representing the
total ‘system cost’ of supplying electricity. Later in the paper (in section 3.5) we take a different
perspective and present cost-benefit results of deploying increasing levels of energy storage.
These results focus on the value provided by energy storage to the generation system—measured
as reduction in generation costs—and compare this to current and future predicted costs for Li-ion
and pumped-storage hydro technologies.
2.4. Time-domain representation
The variability and uncertainty of renewable resources require generation expansion models
that use as input demand and renewable resource data with at least hourly time resolution in order
to guarantee the technical feasibility of the solution. However, accounting for the hourly
resolution of demand and renewable resources over a time span of one year increases
dramatically the dimensionality of the capacity expansion problem. Employing a mixed-integer
model to capture detailed investment, unit commitment, and operational constraints further
renders the problem computationally intractable for realistic size power systems when using state-
of-the-art commercial solvers like CPLEX.
This analysis therefore applies a dimensionality reduction technique based on selecting a set
of representative weeks that simultaneously reflect the annual variability of demand, the wind
resource, the solar resource and the correlation between them. Choosing contiguous weeks
instead of days, load blocks, or other time intervals ensures that the intra-week variability of wind
and solar resources, potentially including multiple consecutive days with low or high resource
availability, is reflected in the data used by the model. Using selected weeks to represent a full
12 ACCEPTED BY APPLIED ENERGY | MAY 1, 2016
year is a common approach in generation expansion planning with renewable resources—e.g.,
[41] and [42]. The robust week selection process used in this analysis extends the method
described in [43], selecting the weeks that most closely represent the full annual net load duration
curve (NLDC) as well as the inter-temporal variability of the net load. The error of approximating
the NLDC is captured by an ‘energy’ metric that reflects the root-mean-square error of the
difference between the real NLDC and the approximation. The inter-temporal variability of the
net load is captured through a ‘cycled power’ metric that quantifies the height of all the peaks in
the net load time series, which is taken as a proxy to the power that must be ramped-up or down
throughout the year. Such ramping events are the key driver of generator startup decisions and
system flexibility requirements—e.g., ramp rates of committed units. To allow for endogenous
determination of renewable energy capacity decisions, we applied a robust selection technique in
this study, such that the weeks selected are the ones that minimize the maximum error across the
‘energy error’ and ‘cycled power error’ metrics and across a range of potential renewable
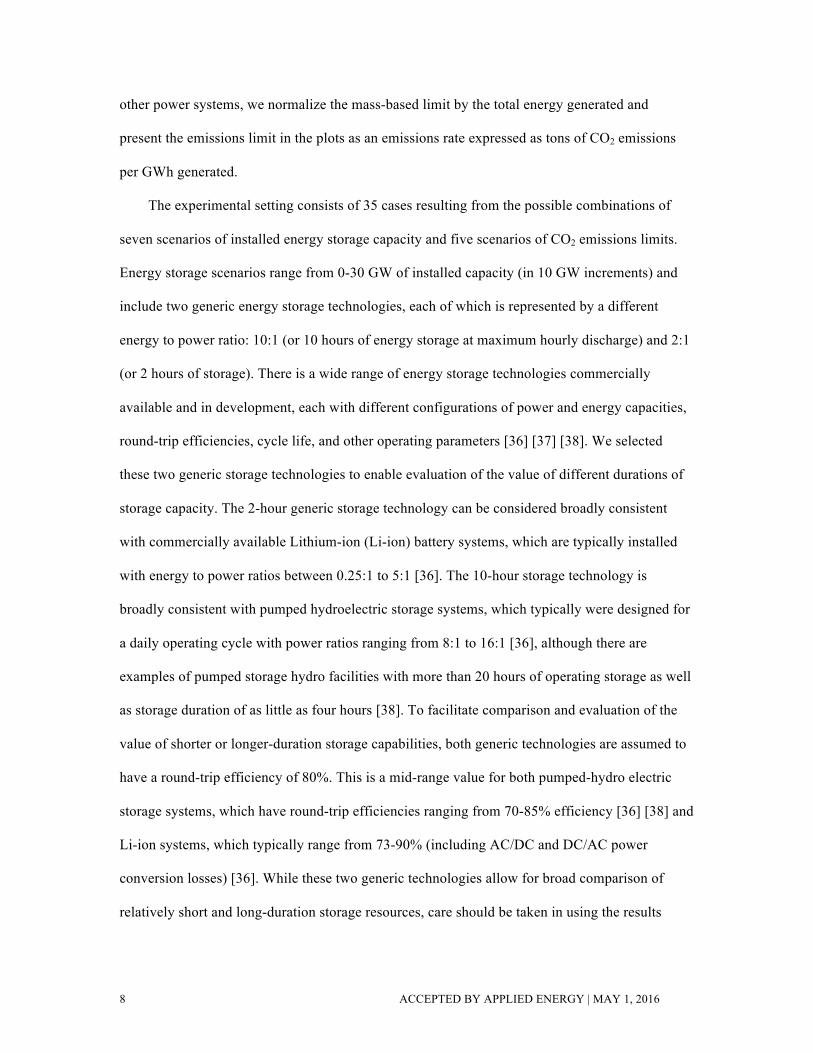
expansion levels. As Fig. 1 illustrates with the two most extreme examples in terms of renewable
capacity deployed, this feature ensures the approximate NLDC closely matches the full annual net
load duration curve under any resulting renewable energy capacity ultimately selected by the
model. In Fig. 1, the NLDC is determined by the original time series for load and the amount of
renewable generation capacity, which in turn is a function of the carbon constraint. The four-
week approximation is determined by the same renewable capacity as the original NLDC, but
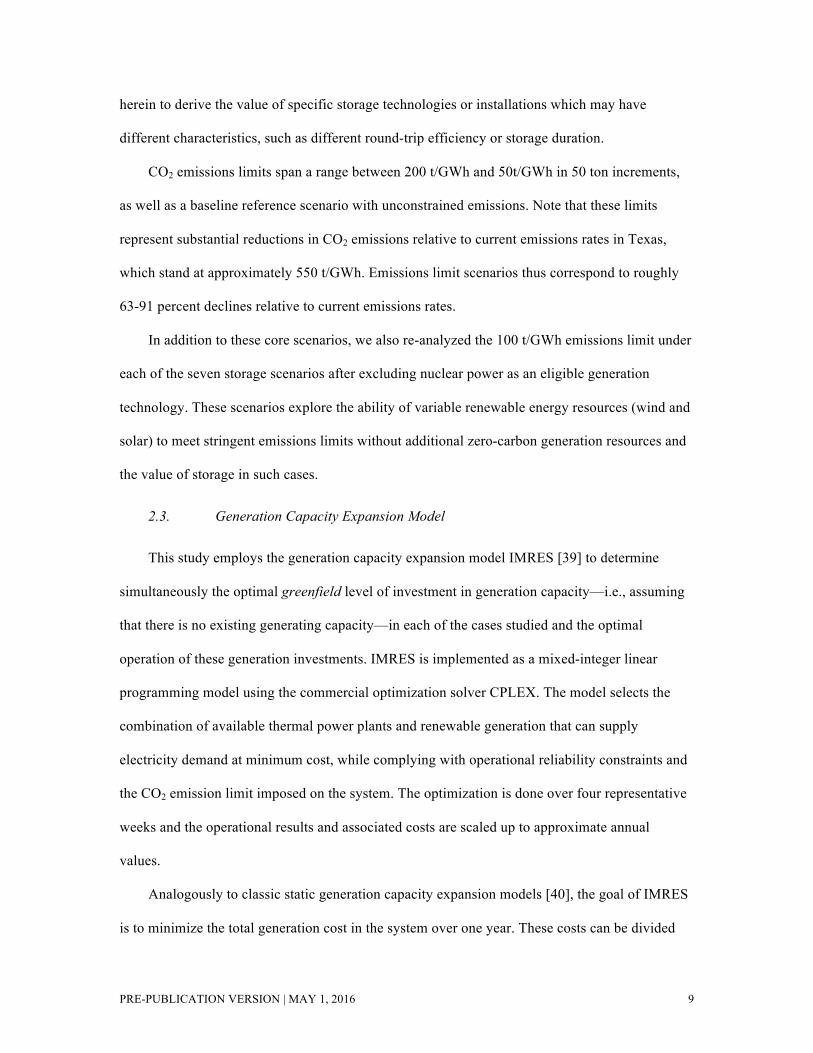
using only the set of four representative weeks selected. Fig. 2 presents the variability of load and
wind and solar resources for the four weeks selected by this algorithm. Load and solar generation
both have a distinct daily cycle, whereas the wind generation follows a more random pattern.

PRE-PUBLICATION VERSION | MAY 1, 2016 13
Figure 1 | Four-week approximation and full annual net load duration curve under renewable capacity levels corresponding to lowest and highest renewable investment levels across all “no storage” cases. The two four-week approximations represented are built using the same representative weeks (weeks #12, #19, #27 and #37). 1-COLUMN FITTING IMAGE
Figure 2 | Hourly time series of electricity demand and wind and solar resource quality for the four weeks selected by the week selection algorithm and modeled in this study (weeks #12, #19, #27 and #37). 1 or 2-COLUMN FITTING IMAGE AS NEEDED
-25
-5
15
35
55
75
95
0 1000 2000 3000 4000 5000 6000 7000 8000
Net
Loa
d in
GW
hours in one year
NLDC, unconstrained emissions (6.74 GW solar; 22.81 GW wind)
NLDC, 150 tons/GWh (22.50 GW solar; 50.68 GW wind)
Four-week approximation, unconstrained emissions
Four-week approximation, 150 tons/GWh
0%
10%
20%
30%
40%
50%
60%
70%
80%
90%
100%
1st week (#12) 2nd week (#19) 3rd week (#27) 4th week (#37)
per u
nit
672 hours in the 4 weeks modeled
Demand in per unit of peak demand Wind capacity factor Solar capacity factor

14 ACCEPTED BY APPLIED ENERGY | MAY 1, 2016
3. Results
3.1. Reducing the carbon footprint of electricity without energy storage
Fig. 3 reports the optimal portfolio of electricity generation under the increasingly stringent
emissions limits as well as the average generation costs in the absence of energy storage. Average
generation cost (AGC) is defined as the quotient between the total annual generation costs (TGC)
and the total annual load:
𝐴𝐺𝐶 = !"#!∙ !!!
!!!, [USD/MWh] (1)
where h is the index for the hours in the four weeks selected; H is the total number of hours
considered in the simulation (H = 672 with a four-week approximation); Θ = 8,760/𝐻 is the
weighing factor used to scale up the operating cost of the four-weeks modeled and make it
equivalent to full-year operating cost; and Dh is the total electricity demand during hour h in
MWh.
TGC is defined as the sum of generation investment annual costs, fixed and variable O&M,
fuel costs, start-up costs and the cost of non-served energy divided by the total annual load:
𝑇𝐺𝐶 = 1,000 ∙ 𝐶!!"# ∙ 𝑃!!"# + Θ ∙ 𝐶!!"# ∙ 𝑥!!!!!! + Θ ∙ 𝑉𝑂𝐿𝐿 ∙ 𝑛!!
!!!!!!! [USD], (2)
where i is the index for the plants installed in the system; N is the total number of plants installed
in the system; 𝐶!!"# is the annualized fixed cost of plant i in USD/kW-yr; 𝑃!!"# is the maximum
power output of plant i in MW; 𝐶!!"# is the variable cost of plant i in USD/MWh; xih is the
energy output of plant i during hour h in MWh; VOLL is the value of lost load in USD/MWh; and
nh is the amount of non-served energy during hour h in MWh.
Energy contribution of an individual technology 𝑡 ∈ 𝑇 (ECt) is defined as the average
contribution of generating units of technology t to supplying the total electricity demand over the
total number of hours considered in the simulation:
𝐸𝐶! = 100 ∙ !!!!∈!!!!!
!!!!!!
∀𝑡 ∈ 𝑇 [%], (3)
PRE-PUBLICATION VERSION | MAY 1, 2016 15
where T is the set of all available technologies in the system: T = {nuclear, coal, CCGT, OCGT,
wind, solar}.
Total generation costs rise 9% under a 100 tCO2/GWh emissions rate limit and 15% under a
50 tCO2/GWh limit, compared to the reference scenario with no emissions limit. These results are
context-specific, and several factors contribute to this relatively modest increase. First, we
assume solar, wind, and nuclear each achieve cost reduction targets outlined by industry and the
U.S. Department of Energy [34] [35], as summarized in Table A1. Assumed capital costs
correspond to a roughly 36% decline in cost per kilowatt installed for solar and a 25% decline for
wind relative to costs prevailing in the U.S. in 2014 [44] [45] and an 8% decline in overnight
capital costs for nuclear relative to the estimated cost of Vogtle Units 3 and 4 currently under
construction in Georgia [46]. Second, Texas possesses relatively abundant renewable energy
resources (i.e., historical average availability for wind and solar in 2014 is 35.7% and 19.9%
respectively) [47]. The total generation costs would increase with higher technology costs and in
locations with poorer renewable resources (and vice versa). At the same time, we assume
relatively modest natural gas prices consistent with current North American market forecasts
[32]. If higher gas prices prevail, the incremental cost of complying with emissions limits would
be smaller because the fuel savings generated when low-carbon resources displace gas-fueled
plants would be more valuable. Finally, by employing a greenfield capacity mix, we assume that
all generation assets must be built from scratch, regardless of the emissions constraint level.
Actual costs of compliance with emissions reduction limits could be more costly if existing
generation assets must be retired before the end of their useful life, while costs could be lower if
existing low-carbon assets can be utilized to meet emissions limits.
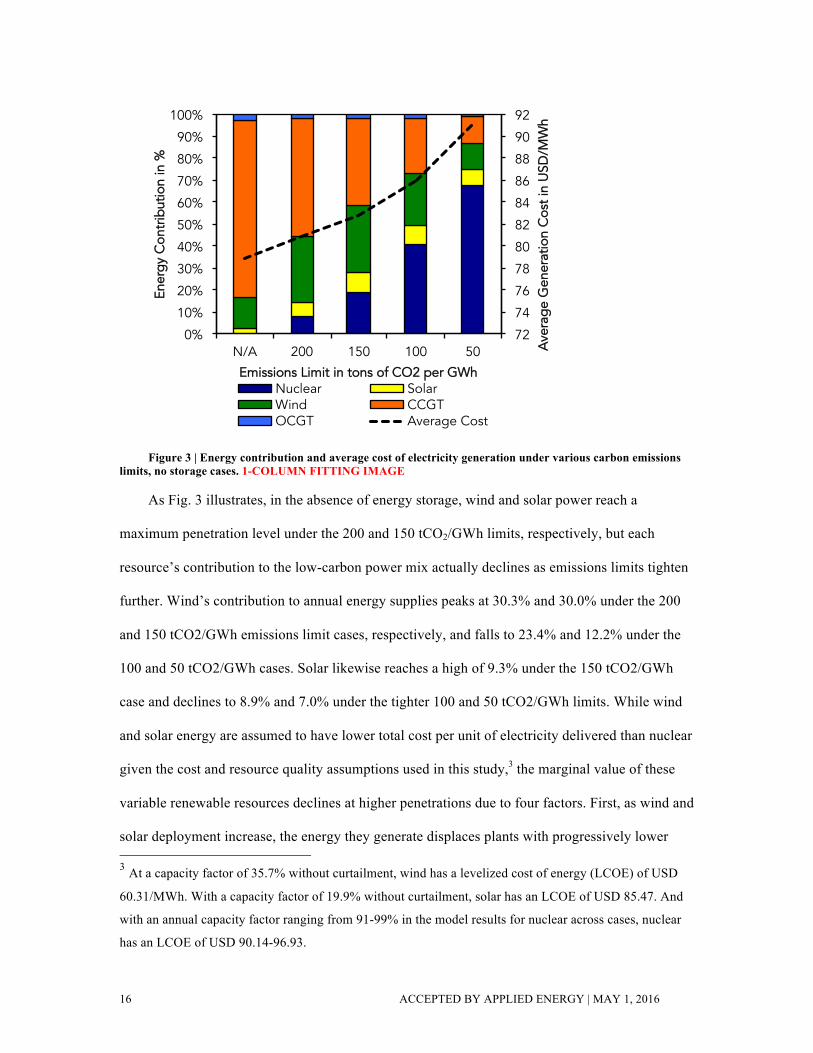
16 ACCEPTED BY APPLIED ENERGY | MAY 1, 2016
Figure 3 | Energy contribution and average cost of electricity generation under various carbon emissions limits, no storage cases. 1-COLUMN FITTING IMAGE
As Fig. 3 illustrates, in the absence of energy storage, wind and solar power reach a
maximum penetration level under the 200 and 150 tCO2/GWh limits, respectively, but each
resource’s contribution to the low-carbon power mix actually declines as emissions limits tighten
further. Wind’s contribution to annual energy supplies peaks at 30.3% and 30.0% under the 200
and 150 tCO2/GWh emissions limit cases, respectively, and falls to 23.4% and 12.2% under the
100 and 50 tCO2/GWh cases. Solar likewise reaches a high of 9.3% under the 150 tCO2/GWh
case and declines to 8.9% and 7.0% under the tighter 100 and 50 tCO2/GWh limits. While wind
and solar energy are assumed to have lower total cost per unit of electricity delivered than nuclear
given the cost and resource quality assumptions used in this study,3 the marginal value of these
variable renewable resources declines at higher penetrations due to four factors. First, as wind and
solar deployment increase, the energy they generate displaces plants with progressively lower 3 At a capacity factor of 35.7% without curtailment, wind has a levelized cost of energy (LCOE) of USD
60.31/MWh. With a capacity factor of 19.9% without curtailment, solar has an LCOE of USD 85.47. And
with an annual capacity factor ranging from 91-99% in the model results for nuclear across cases, nuclear
has an LCOE of USD 90.14-96.93.
72
74
76
78
80
82
84
86
88
90
92
0%
10%
20%
30%
40%
50%
60%
70%
80%
90%
100%
N/A 200 150 100 50 Ave
rage
Gen
erat
ion
Cos
t in
USD
/MW
h
Ener
gy C
ontr
ibut
ion
in %
Emissions Limit in tons of CO2 per GWh Nuclear Solar Wind CCGT OCGT Average Cost

PRE-PUBLICATION VERSION | MAY 1, 2016 17
variable costs, delivering less value to the system [48]. Second, due to their resource variability,
wind and solar contribute only modestly to meeting the peak electricity demand, and their
marginal contribution declines as they increase market share [49] [50] [51]. Third, wind and solar
curtailment rises at higher penetration levels, reducing the effective capacity factor of these
resources [52]. Finally, more wind and solar increases demand for operating reserves, i.e. flexible
standby capacity needed to respond to variability and uncertainty in the system [53]. As a result,
nuclear energy plays an increasingly important role as emissions limits tighten. Nuclear’s share of
annual energy generation rises from 7.8% and 18.9% under the 200 and 150 tCO2/GWh
emissions limits, respectively, to 40.5% under 100 tCO2/GWh and 67.6% under the 50
tCO2/GWh limit. By operating in a flexible manner [25] [26] [27] [28] [29], nuclear units provide
a flexible base of zero-carbon energy supplies, providing operating reserves and helping
minimize curtailment of wind and solar resources.
3.2. The impact of energy storage on electricity mix and cost
The addition of energy storage to the system substantially changes the economically optimal
low-carbon portfolio of generating resources and the cost of supplying electricity, as illustrated in
Fig. 4 and 5 below. We model two different energy storage capacities: a 2-hour storage capacity,
broadly consistent with Li-ion battery systems (left panel), and a 10-hour storage capacity (right
panel), consistent with pumped hydroelectric storage [36] [37], as discussed in Section 2.2.
It is important to note that the cost of storage itself is not included in the average generation
cost of electricity metric presented thus far. We therefore introduce a new metric accounting for
the total system cost (TSC) of supplying electricity for the year—including the cost of storage—,
defined as the sum of the TGC and the annuity corresponding to the cost of the storage capacity
exogenously added to the system:
𝑇𝑆𝐶 = 𝑇𝐺𝐶 + 𝑐𝑜𝑠𝑡 𝑜𝑓 𝑠𝑡𝑜𝑟𝑎𝑔𝑒 (𝑎𝑛𝑛𝑢𝑖𝑡𝑦), [USD] (4)
18 ACCEPTED BY APPLIED ENERGY | MAY 1, 2016
Analogously to the AGC, we define the average system cost (ASC) as the quotient between
the total system costs (TSC) and the total annual load:
𝐴𝑆𝐶 = !"#!∙ !!!
!!!, [USD/MWh] (5)
Under perfect competition, the ASC would be equivalent to the average price of electricity
that consumers would ultimately have to pay—excluding the cost of transmission and
distribution.
The future costs of energy storage systems are uncertain, particularly for emerging
technologies like batteries. To facilitate comparison with current and future forecasted capital
costs of Li-ion storage (764 and 536 USD/kWh respectively4) and maximum and minimum
capital cost estimates of pumped-hydroelectric storage (250 and 100 USD/kWh respectively5), we
report for each storage duration two average system cost estimates (Fig. 4 and 5). Table A.3 in
Appendix A presents a detailed calculation of the storage cost annuity used to derive the average
system cost (ASC).
4 These values are consistent with the cost assumptions presented in the cost-benefit results in Section 3.5
and the cost annuity calculation in Table A.3.
5 These values are consistent with the cost assumptions presented in the cost-benefit results in Section 3.5
and the cost annuity calculation in Table A.3.
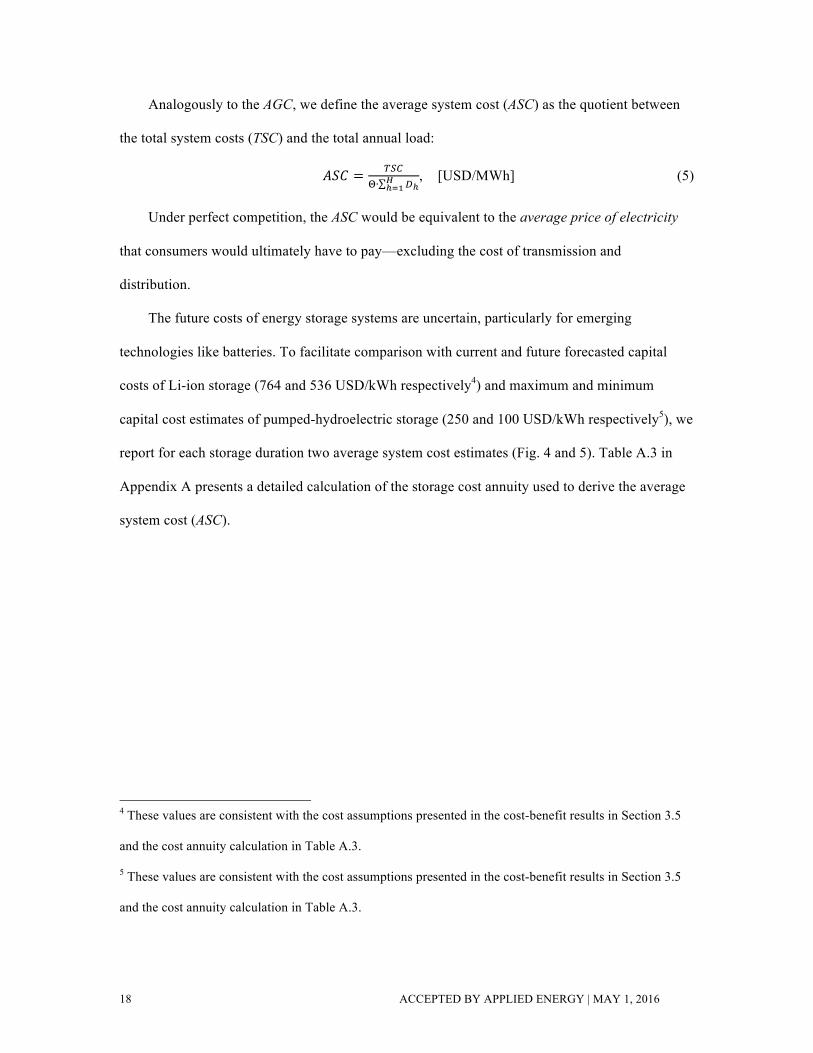
PRE-PUBLICATION VERSION | MAY 1, 2016 19
Figure 4 | Impact of energy storage on energy contribution, average generation cost (excluding the cost of energy storage, in black) and average system cost (including the cost of 2-hour and 10-hour storage, in red and blue respectively) under emissions limit of 100 tCO2/GWh. 2-COLUMN FITTING IMAGE
Energy storage helps reduce average electricity generation costs primarily by increasing the
utilization of the least-expensive low-carbon resource, which in our analysis are wind and solar.
However, under a carbon emissions limit of 100 tCO2/GWh, average system costs inclusive of
energy storage costs (Fig. 4 and 5) actually increase, not decrease, in most cases. To reduce total
system costs, 2-hour storage costs must improve relative to today’s Li-ion costs, and 10-hour
storage system costs must fall along the low end of current pumped storage hydro costs. We
discuss the economic value of storage in more detail for all other carbon emissions limits studied
and present implications for storage technology development cost targets in section 3.5.
70
75
80
85
90
95
100
0%
20%
40%
60%
80%
100%
0 GW 10 GW 20 GW 30 GW 0 GW 10 GW 20 GW 30 GW
2 hours 10 hours
Ave
rage
Cos
t in
USD
/MW
h
Ener
gy C
ontr
ibut
ion
in %
Storage Capacity Installed in GW, per type
OCGT CCGT Wind Solar Nuclear Average Generation Cost (excluding storage cost) Average System Cost (including current cost Li-ion, 10 year life) Average System Cost (including future cost Li-ion, 20 year life) Average System Cost (including min. estimated cost of PHS) Average System Cost (including max. estimated cost of PHS)

20 ACCEPTED BY APPLIED ENERGY | MAY 1, 2016
Figure 5 | Impact of energy storage on average system cost under emissions limit of 100 tCO2/GWh. With perfect competition the average system cost could be interpreted as the average electricity price. 1-COLUMN FITTING IMAGE
Given this study’s cost assumptions (see Section 3.1), storage reduces curtailment of wind
and solar increasing their utilization and attractiveness at higher penetration levels. Increasing
storage capacity thus increases the share of variable renewable resources for a given emissions
limit and correspondingly reduces the contribution from nuclear. Nuclear’s share under the 100
tCO2/GWh limit is approximately halved, for example, from 40.5% without storage to a low of
21.6% with 30 GW of 2-hour duration storage and 17.9% with 30 GW of 10-hour duration
storage, respectively (Fig. 4). Under the same emissions limit, wind and solar’s combined
contribution rises, meanwhile, from 32.3% without storage to a high of 50.7% and 54.7% with 30
GW of 2-hour and 10-hour storage, respectively.
In addition, Fig. 4 shows that the duration of energy storage capacity has a very different
impact on the optimal share of wind and solar. For an equal storage power capacity, a longer-
duration energy reservoir increases the share of wind power relative to the shorter-duration
70
75
80
85
90
95
100
10 GW 20 GW 30 GW 10 GW 20 GW 30 GW
2 hours 10 hours
Ave
rage
Sys
tem
Cos
t in
USD
/MW
h
Storage Capacity Installed in GW, per type
Average System Cost (including future cost Li-ion, 20 year life) Average System Cost (including current cost Li-ion, 10 year life) Average System Cost (including min. estimated cost of PHS) Average System Cost (including max. estimated cost of PHS) Average System cost baseline (no storage)

PRE-PUBLICATION VERSION | MAY 1, 2016 21
storage scenarios, and vice versa. Under the 100 tCO2/GWh and 30 GW storage case, for
example, wind and solar make up 42.5% and 12.2% of total energy generation, respectively, with
10-hour storage and 35.5% and 15.2% respectively with the shorter-duration 2-hour storage. This
difference is driven by the different patterns of wind and solar variability and their correlation
with electricity demand, as illustrated in Fig. 6-7. While a 2-hour battery is sufficient to store
renewable energy production to meet the afternoon peak in load as solar production falls off (Fig.
6), a longer-duration storage option is better suited to shift wind energy production overnight to
supply daytime demand (Fig. 7).
Figure 6 | Example of dispatch in week #27 under 100tCO2/GWh emissions limit and with 30 GW of storage with two-hour storage capacity. 1 or 2-COLUMN FITTING IMAGE
0
10
20
30
40
50
60
70
80
90
100
1 21 41 61 81 101 121 141 161
Elec
tric
ity d
eman
d an
d po
wer
out
put i
n G
W
hours of the week
Nuclear Solar Wind CCGT OCGT
Storage discharge Storage charge NSE Demand
22 ACCEPTED BY APPLIED ENERGY | MAY 1, 2016
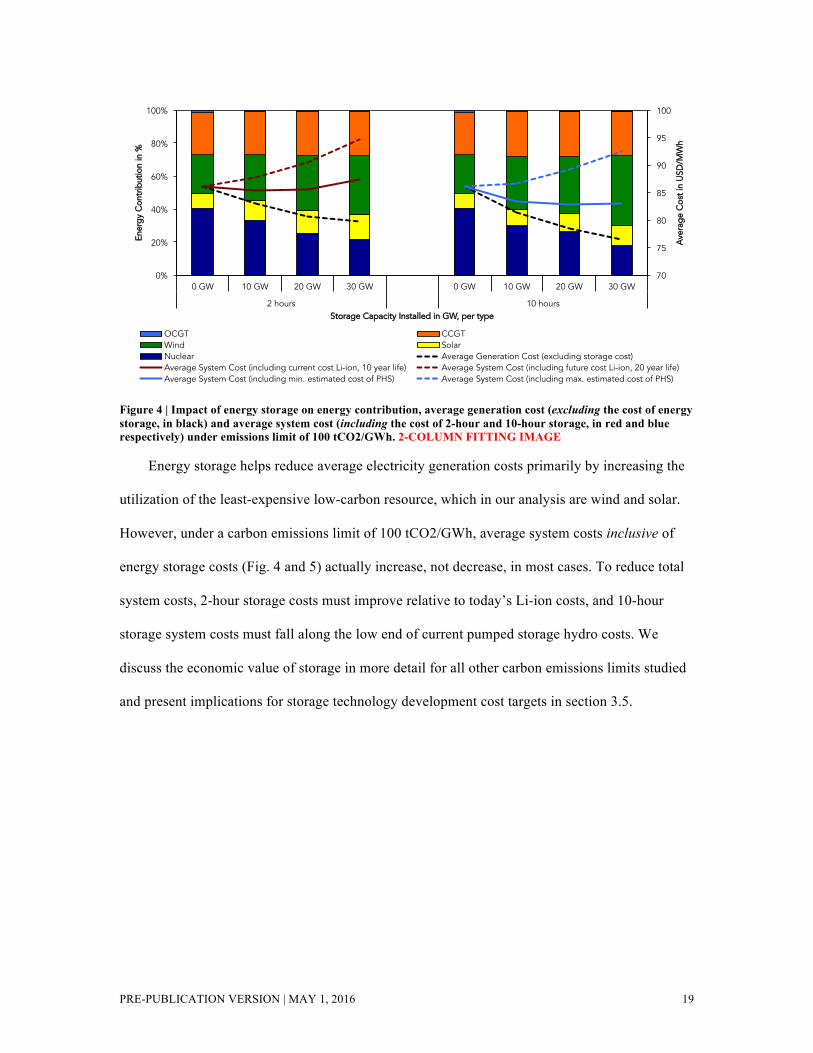
Figure 7 | Example of dispatch in week #27 under 100tCO2/GWh emissions limit and with 30 GW of storage with ten-hour storage capacity. 1 or 2-COLUMN FITTING IMAGE
Energy storage also competes directly with OCGTs to provide operating reserves and meet
peak power demands. As a result, combustion turbine capacity declines steadily as energy storage
capacity increases. Under the 100 tCO2/GWh emissions limit, for example, storage displaces
OCGT capacity nearly one-for-one, with OCGT capacity falling from 27.5 GW to 4.6 GW or 7.8
GW as storage capacity increases from 0-30 GW with a 10-hour or 2-hour storage duration,
respectively. In contrast, installed capacity and utilization of CCGTs are largely unaffected by the
addition of energy storage. While wind energy has a lower levelized cost of delivered electricity
than CCGTs in this study6, once the marginal value of wind falls sufficiently, the model
essentially deploys and utilizes CCGTs until the emissions limit is reached, before then turning to
more expensive zero carbon resources.
6 At an average capacity factor of 73.5% in the unconstrained emissions case, CCGTs have a levelized cost
of USD 74.51/MWh, as compared to 60.31/MWh for wind.
0
10
20
30
40
50
60
70
80
90
100
1 21 41 61 81 101 121 141 161
Elec
tric
ity d
eman
d an
d po
wer
out
put i
n G
W
hours of the week
Nuclear Solar Wind CCGT OCGT
Storage discharge Storage charge NSE Demand

PRE-PUBLICATION VERSION | MAY 1, 2016 23
3.3. The impact of relying exclusively on renewables
Since some countries do not consider nuclear power as an option for their future electricity
mix, we performed an additional analysis of the seven storage scenarios with the 100 t/GWh
emissions limit after excluding nuclear power as an eligible generation technology. First, we note
that in the no storage case, our model was unable to produce a feasible electricity portfolio to
comply with the 100 tCO2/GWh emissions limit. Without a zero-carbon source of system
flexibility, natural gas-fired units are necessary to meet the operating reserve requirements
commensurate with high penetrations of wind and solar energy, and these gas-fired units emit too
much CO2 to meet the relatively strict emissions limit. In effect, a sufficient level of low-carbon
system flexibility (be it storage, demand response, hydropower, or some other resource) is
necessary to meet technical power system operational requirements under strict emissions limits
if variable renewable resources are the chief means of achieving decarbonization.
The model produced feasible results for each of the cases including energy storage. Fig. 8
shows the economically optimal low-carbon portfolio of generating resources for these cases, as
well as the average generation and system costs achieved in the different storage capacity
scenarios (see also Fig. 9 for a more detailed comparison of average system costs). As above, the
energy contribution from CCGTs remains almost constant as its contribution is effectively limited
by the carbon emissions constraint imposed on the system. The optimal share of wind and solar
power for each of the two energy storage technology cases studied—2-hour and 10-hour
storage—is also approximately unchanged, with wind supplying roughly 50% and solar 20% of
annual electricity in each case. While the total amount of energy storage capacity improves
renewable utilization rates, it barely changes their relative importance in the energy generation
mix. However, by reducing curtailment (see Fig. 10) and improving the utilization of wind and
solar resources, increasing levels of energy storage reduce the total installed capacity of wind and
solar required, driving down overall generation costs. As Fig. 8 and 9 illustrate, cost reductions
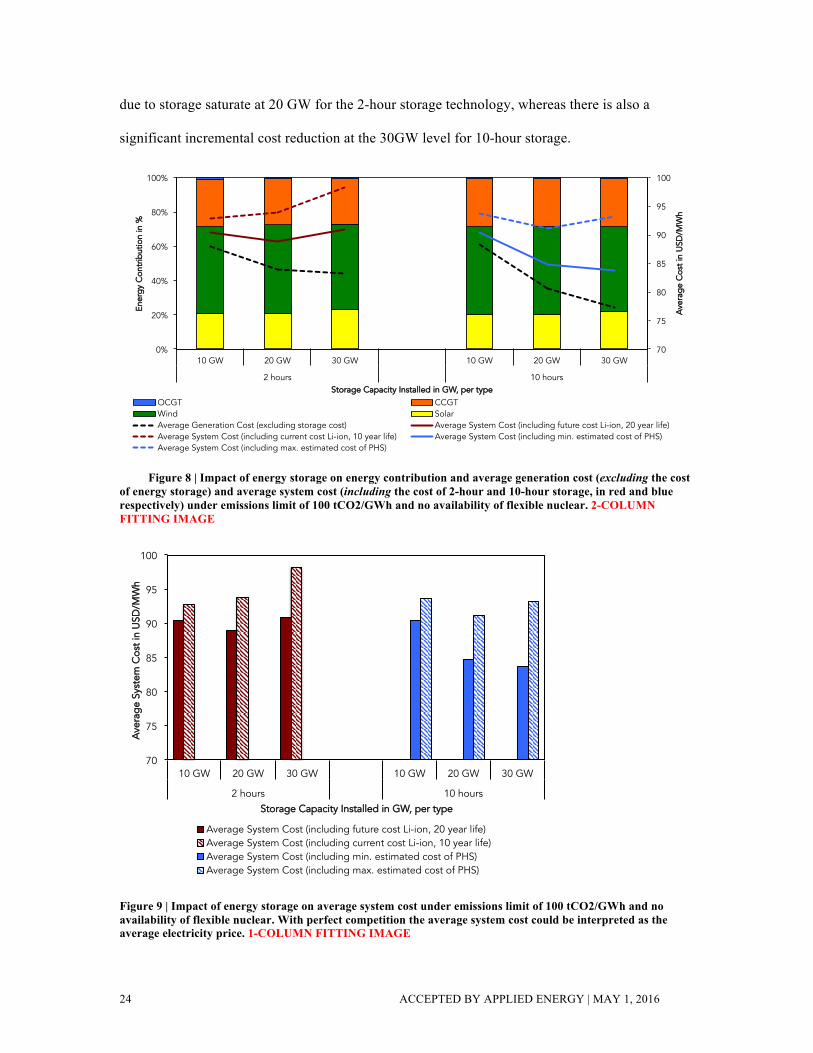
24 ACCEPTED BY APPLIED ENERGY | MAY 1, 2016
due to storage saturate at 20 GW for the 2-hour storage technology, whereas there is also a
significant incremental cost reduction at the 30GW level for 10-hour storage.
Figure 8 | Impact of energy storage on energy contribution and average generation cost (excluding the cost of energy storage) and average system cost (including the cost of 2-hour and 10-hour storage, in red and blue respectively) under emissions limit of 100 tCO2/GWh and no availability of flexible nuclear. 2-COLUMN FITTING IMAGE
Figure 9 | Impact of energy storage on average system cost under emissions limit of 100 tCO2/GWh and no availability of flexible nuclear. With perfect competition the average system cost could be interpreted as the average electricity price. 1-COLUMN FITTING IMAGE
70
75
80
85
90
95
100
0%
20%
40%
60%
80%
100%
10 GW 20 GW 30 GW 10 GW 20 GW 30 GW
2 hours 10 hours
Ave
rage
Cos
t in
USD
/MW
h
Ener
gy C
ontr
ibut
ion
in %
Storage Capacity Installed in GW, per type OCGT CCGT Wind Solar Average Generation Cost (excluding storage cost) Average System Cost (including future cost Li-ion, 20 year life) Average System Cost (including current cost Li-ion, 10 year life) Average System Cost (including min. estimated cost of PHS) Average System Cost (including max. estimated cost of PHS)
70
75
80
85
90
95
100
10 GW 20 GW 30 GW 10 GW 20 GW 30 GW
2 hours 10 hours
Ave
rage
Sys
tem
Cos
t in
USD
/MW
h
Storage Capacity Installed in GW, per type
Average System Cost (including future cost Li-ion, 20 year life) Average System Cost (including current cost Li-ion, 10 year life) Average System Cost (including min. estimated cost of PHS) Average System Cost (including max. estimated cost of PHS)

PRE-PUBLICATION VERSION | MAY 1, 2016 25
Comparing the two cases with and without nuclear (Fig. 4 and Fig. 8, respectively)
demonstrates that excluding nuclear power from the low-carbon power mix increases overall
system costs (given the costs assumptions employed herein). With 10 GW of energy storage
installed, including nuclear reduces total generation costs by 8.6% under the 10-hour storage
technology case and 6.0% under the 2-hour technology case. This finding indicates that
renewable energy and flexible nuclear power are likely to coexist in an economically optimal
low-carbon electricity system, even with large amounts of energy storage. Nevertheless, if storage
becomes sufficiently affordable, the role of wind and solar expands and the relative importance of
nuclear power declines.
3.4. The impact of energy storage on renewable curtailment
Oftentimes it is not technically feasible or economically efficient to utilize all renewable
energy available in power systems with a large share of renewable generation, and a fraction of
this renewable energy available needs to be curtailed. Hourly curtailment decisions are
endogenously determined by the model consistent with its objective function and technical
constraints. The total renewable energy curtailed over the course of one year can be expressed in
terms of the total renewable energy available with the rate of curtailment, which is given by the
following expression:
𝑅𝐶 = 100 ∙ !!"#$∙!"!!"#$!!!"#$%∙!"!
!"#$%!!!!"#$!!!
!"#$%!!!!
!!"#$∙!"!!"#$!!!"#$%∙!"!
!"#$%!!!!
[%] (6)
where 𝑝!"#$ is the wind power capacity installed in MWs; 𝑝!"#$% is the solar capacity installed
in MWs; 𝐶𝐹!!"#$ is the capacity factor of wind—or wind availability—during hour h in per unit;
𝐶𝐹!!"#$% is the capacity factor of solar—or solar availability—during hour h in per unit; 𝑥!!"#$ is
the wind generation during hour h in MWs; and 𝑥!!"#$% is the solar generation during hour h in
MWs.
26 ACCEPTED BY APPLIED ENERGY | MAY 1, 2016
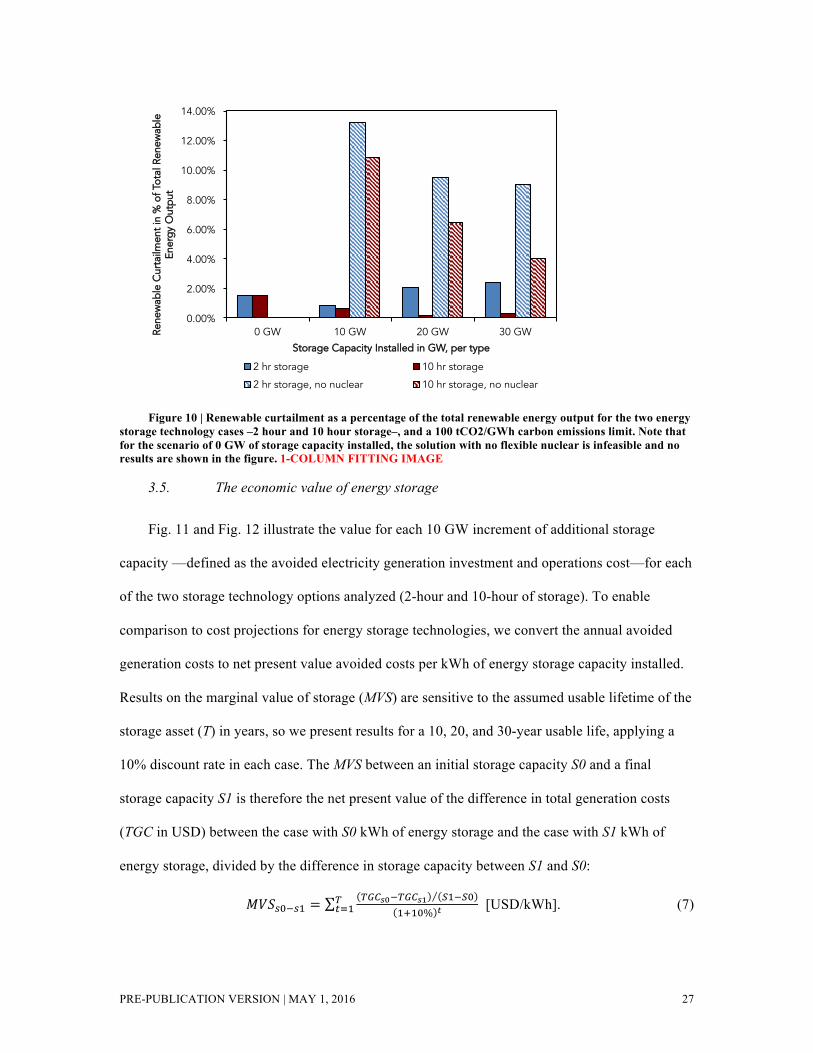
The importance of energy storage is magnified in a scenario predominately reliant on
variable renewables to decarbonize the power system. With the addition of sufficient energy
storage, it becomes technically feasible to meet a 100 tCO2/GWh limit with only wind, solar, and
gas-fired plants, as discussed above. However, up to 13.2% of wind and solar generation is
wasted due to curtailment if only 10 GW of energy storage is installed (Fig. 10). Renewable
curtailment declines as storage capacity increases, but it is still a substantial 4-8% at 30 GW of
storage, depending on the storage duration. Fig. 10 also shows that a diversified portfolio that
includes flexible nuclear energy would reduce renewable curtailment to levels below 2.4% under
a 100 tCO2/GWh emissions limit. The reductions in renewable curtailments lower the costs of
meeting this emissions limit. Note also that the evolution of renewable curtailment with the
amount of energy storage capacity deployed does not fall monotonically in the case that includes
flexible nuclear power in the mix. This non-monotonicity is due to the fact that thermal power
investments in general and nuclear power units in particular are discrete and ‘lumpy’ (e.g.,
investments in new dual-reactor nuclear plants are made in 2,230 megawatt increments), which
might create curtailment ‘jumps’ whenever nuclear capacity is substituted by renewables in the
solution.
PRE-PUBLICATION VERSION | MAY 1, 2016 27
Figure 10 | Renewable curtailment as a percentage of the total renewable energy output for the two energy storage technology cases –2 hour and 10 hour storage–, and a 100 tCO2/GWh carbon emissions limit. Note that for the scenario of 0 GW of storage capacity installed, the solution with no flexible nuclear is infeasible and no results are shown in the figure. 1-COLUMN FITTING IMAGE
3.5. The economic value of energy storage
Fig. 11 and Fig. 12 illustrate the value for each 10 GW increment of additional storage
capacity —defined as the avoided electricity generation investment and operations cost—for each
of the two storage technology options analyzed (2-hour and 10-hour of storage). To enable
comparison to cost projections for energy storage technologies, we convert the annual avoided
generation costs to net present value avoided costs per kWh of energy storage capacity installed.
Results on the marginal value of storage (MVS) are sensitive to the assumed usable lifetime of the
storage asset (T) in years, so we present results for a 10, 20, and 30-year usable life, applying a
10% discount rate in each case. The MVS between an initial storage capacity S0 and a final
storage capacity S1 is therefore the net present value of the difference in total generation costs
(TGC in USD) between the case with S0 kWh of energy storage and the case with S1 kWh of
energy storage, divided by the difference in storage capacity between S1 and S0:
𝑀𝑉𝑆!!!!! =!"#!!!!"#!! !!!!!
!!!"% !!!!! [USD/kWh]. (7)
0.00%
2.00%
4.00%
6.00%
8.00%
10.00%
12.00%
14.00%
0 GW 10 GW 20 GW 30 GW Rene
wab
le C
urta
ilmen
t in
% o
f Tot
al R
enew
able
En
ergy
Out
put
Storage Capacity Installed in GW, per type
2 hr storage 10 hr storage
2 hr storage, no nuclear 10 hr storage, no nuclear
fernando
Cross-Out
fernando
Cross-Out
fernando
Cross-Out

28 ACCEPTED BY APPLIED ENERGY | MAY 1, 2016
Fig. 11 presents results for the 2-hour storage technology cases, representative for many
electrochemical battery storage technologies. Assuming a 10-year asset life, the first 10 GW of 2-
hour duration storage avoids USD 286-572 in generation costs per installed kWh of storage
capacity (depending on emissions limit). The marginal value of storage declines rapidly,
however, falling to USD 193-367 per kWh at 20 GW installed capacity and USD 40-208 per kWh
at 30 GW. If the storage asset lasts for 20 or 30 years, the marginal value increases 39% and 53%
respectively.
For comparison, current best-in-class utility-scale Li-ion storage systems cost approximately
USD 764/kWh installed, including approximately USD 250/kWh for the battery pack and USD
514/kWh for balance of system (power electronics, racking, connection to the grid, etc.) [36]
[54]. Expected to last for only 10 years (3-4,000 cycles with an average cycling pattern of one
full cycle per day), these systems remain too costly in comparison to estimated avoided
generation costs (Fig. 11) regardless of the stringency of emissions limits.
Figure 11 | Cost-benefit of energy storage: system value of 2-hour energy storage capacity for different carbon emissions goals and current and potential future cost for Li-ion battery systems for comparison. Different markers reflect different storage penetration levels, and different colors reflect different expected asset lifespan. 2-COLUMN FITTING IMAGE
0
100
200
300
400
500
600
700
800
900
1000
10 yr 20 yr 30 yr 10 yr 20 yr 30 yr 10 yr 20 yr 30 yr 10 yr 20 yr 30 yr 10 yr 20 yr 30 yr
no limit 200 t/GWh 150 t/GWh 100 t/GWh 50 t/GWh
Bat
tery
Sys
tem
Cos
t and
Val
ue in
US
D p
er k
Wh
Inst
alle
d
Emissions Limit in tons of CO2 per GWh and Expected Life in years
Current estimated cost of Li-ionbattery systems (~10 yr life)
Future potential costs of Li-ionbattery systems (~20 yr life)
0 - 10 GW, 10 yr life
10 - 20 GW, 10 yr life
20 - 30 GW, 10 yr life
0 - 10 GW, 20 yr life
10 - 20 GW, 20 yr life
20 - 30 GW, 20 yr life
0 - 10 GW, 30 yr life
10 - 20 GW, 30 yr life
20 - 30 GW, 30 yr life
PRE-PUBLICATION VERSION | MAY 1, 2016 29
Looking ahead, the U.S. Department of Energy targets a capital cost of USD 125/kWh for
Li-ion battery packs by 2022 [55]. If a 20% reduction in balance of system costs can also be
achieved, that would bring total installed system costs to roughly USD 536/kWh. Combined with
a usable life of 20 years (e.g. >7,000 cycles), Fig. 11 indicates that such systems would deliver
sufficient value under emissions limits to justify deployment at up to 10-20 GW scale, depending
on the emissions limit. Assuming a 20-year storage asset life, the net present value of generation
costs avoided by the first 10 GW of two-hour storage technology installed ranges from USD
642/kWh of installed storage capacity under the 200 tCO2/GWh emissions limit to USD
793/kWh installed under the 50 tCO2/GWh limit, exceeding the estimated cost of this improved
battery system by roughly 20-48%. Much more dramatic cost reductions (i.e., an 80-85%
reduction from current system costs) would be necessary to justify storage deployment at 30 GW
or greater scale based on avoided generation costs.
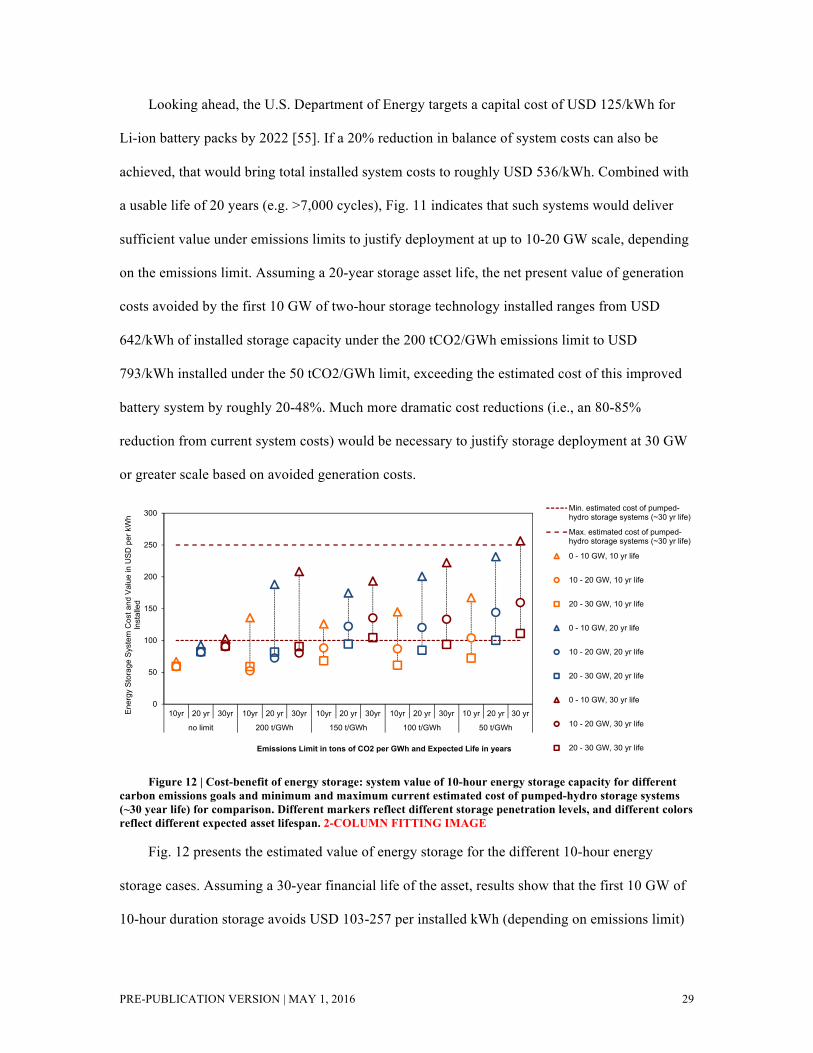
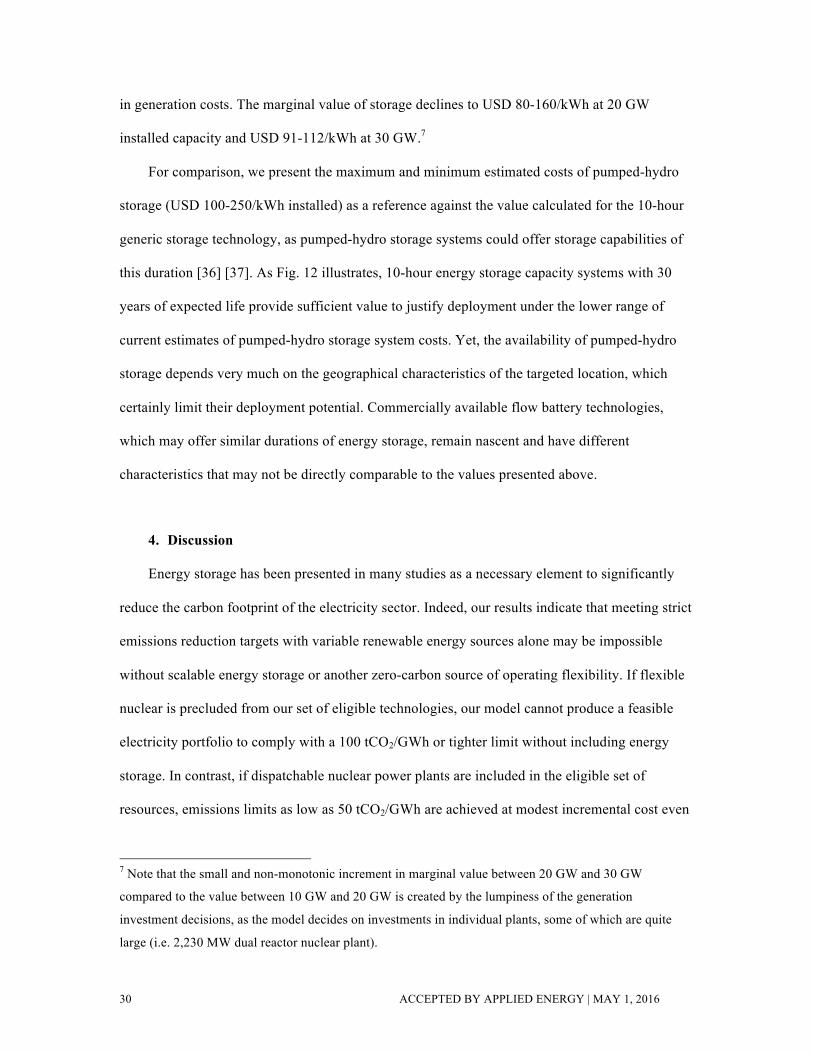
Figure 12 | Cost-benefit of energy storage: system value of 10-hour energy storage capacity for different carbon emissions goals and minimum and maximum current estimated cost of pumped-hydro storage systems (~30 year life) for comparison. Different markers reflect different storage penetration levels, and different colors reflect different expected asset lifespan. 2-COLUMN FITTING IMAGE
Fig. 12 presents the estimated value of energy storage for the different 10-hour energy
storage cases. Assuming a 30-year financial life of the asset, results show that the first 10 GW of
10-hour duration storage avoids USD 103-257 per installed kWh (depending on emissions limit)
0
50
100
150
200
250
300
10yr 20 yr 30yr 10yr 20 yr 30yr 10yr 20 yr 30yr 10yr 20 yr 30yr 10 yr 20 yr 30 yr
no limit 200 t/GWh 150 t/GWh 100 t/GWh 50 t/GWh
Ene
rgy
Sto
rage
Sys
tem
Cos
t and
Val
ue in
US
D p
er k
Wh
Inst
alle
d
Emissions Limit in tons of CO2 per GWh and Expected Life in years
Min. estimated cost of pumped-hydro storage systems (~30 yr life)
Max. estimated cost of pumped-hydro storage systems (~30 yr life)
0 - 10 GW, 10 yr life
10 - 20 GW, 10 yr life
20 - 30 GW, 10 yr life
0 - 10 GW, 20 yr life
10 - 20 GW, 20 yr life
20 - 30 GW, 20 yr life
0 - 10 GW, 30 yr life
10 - 20 GW, 30 yr life
20 - 30 GW, 30 yr life
30 ACCEPTED BY APPLIED ENERGY | MAY 1, 2016
in generation costs. The marginal value of storage declines to USD 80-160/kWh at 20 GW
installed capacity and USD 91-112/kWh at 30 GW.7
For comparison, we present the maximum and minimum estimated costs of pumped-hydro
storage (USD 100-250/kWh installed) as a reference against the value calculated for the 10-hour
generic storage technology, as pumped-hydro storage systems could offer storage capabilities of
this duration [36] [37]. As Fig. 12 illustrates, 10-hour energy storage capacity systems with 30
years of expected life provide sufficient value to justify deployment under the lower range of
current estimates of pumped-hydro storage system costs. Yet, the availability of pumped-hydro
storage depends very much on the geographical characteristics of the targeted location, which
certainly limit their deployment potential. Commercially available flow battery technologies,
which may offer similar durations of energy storage, remain nascent and have different
characteristics that may not be directly comparable to the values presented above.
4. Discussion
Energy storage has been presented in many studies as a necessary element to significantly
reduce the carbon footprint of the electricity sector. Indeed, our results indicate that meeting strict
emissions reduction targets with variable renewable energy sources alone may be impossible
without scalable energy storage or another zero-carbon source of operating flexibility. If flexible
nuclear is precluded from our set of eligible technologies, our model cannot produce a feasible
electricity portfolio to comply with a 100 tCO2/GWh or tighter limit without including energy
storage. In contrast, if dispatchable nuclear power plants are included in the eligible set of
resources, emissions limits as low as 50 tCO2/GWh are achieved at modest incremental cost even
7 Note that the small and non-monotonic increment in marginal value between 20 GW and 30 GW
compared to the value between 10 GW and 20 GW is created by the lumpiness of the generation
investment decisions, as the model decides on investments in individual plants, some of which are quite
large (i.e. 2,230 MW dual reactor nuclear plant).
PRE-PUBLICATION VERSION | MAY 1, 2016 31
without storage. In short, our results indicate that energy storage may be essential to enable
climate mitigation strategies dependent exclusively on very high shares of wind or solar energy,
but storage is not a requisite if a more diverse mix of flexible, low-carbon power sources is
considered.
Our results also show that if storage technologies meet future technology performance and
cost goals (i.e. extended cycle life and cost reductions), electrochemical energy storage could
become a cost-effective contributor to very low-carbon power systems (Fig. 6). At the same time,
the diminishing marginal value of energy storage means that the economically optimal
penetration level of storage will be limited unless costs continue to decline well beyond current
targets or in specific locations where storage systems deliver significant additional value to
electricity systems not considered in this paper, such as avoidance of transmission or distribution
costs.
5. Conclusion
The results presented in this work help inform the current debate about the value and role of
energy storage in decarbonizing electricity systems. Using a capacity expansion model with
detailed unit commitment constraints we quantify the value of different capacity levels of 2-hour
and 10-hour energy storage under stringent carbon emissions limits.
We first show that there is no silver bullet to decarbonize the electricity sector: the least-cost
generation mix includes a diverse mix of resources and wind, solar and flexible nuclear
technologies co-exist in the optimal low-carbon generation portfolio, regardless of the level of
energy storage. Under an emissions limit of 100 tCO2/GWh, nuclear’s contribution to total energy
supply ranges from 18-40%, depending on the amount of energy storage installed, while solar and
wind shares are in the 9-15% and 23-43% ranges, respectively. Likewise, flexible nuclear
contributes 52-68% under a tighter 50 tCO2/GWh limit while solar contributes 7-14% and wind
12-19%, depending on the storage capacity. Excluding dispatchable low-carbon resources—i.e.
32 ACCEPTED BY APPLIED ENERGY | MAY 1, 2016
flexible nuclear power in this analysis—from the portfolio raises costs by up to 8.6% and
increases the relative importance of energy storage, or other sources of emissions-free flexibility,
to integrate variable renewable energy sources and meet the need for operating reserves.
We find that under strict emissions limits, corresponding to a roughly 63-91% reduction
from today’s prevailing emissions rates, energy storage can reduce generation costs by increasing
the utilization of installed resources and enabling greater penetration of the lowest cost carbon-
free resources. Total generation costs—excluding the cost of energy storage—fall by 7-11% as up
to 30 GW of energy storage is installed under a 100 tCO2/GWh emissions limit and up to 12%
under a 50 tCO2/GWh limit. However, energy storage is only strictly necessary to meet tight
emissions limits in the absence of flexible dispatchable zero-carbon generation technologies.
The value of longer duration (i.e., 10-hour) energy storage resources appears high enough to
justify the deployment of pumped-hydro resources at current costs, but opportunities to deploy
pumped-hydro storage is geographically limited. Conversely, the value of shorter-duration (i.e. 2-
hour) storage technologies, such as Li-ion batteries, is only justified by generation cost savings
under the most stringent carbon emissions limits, and even then, only at low storage penetration
levels. Hence, continued innovation and cost declines for Li-ion batteries and other
electrochemical energy storage technologies will be necessary to economically justify large-scale
deployment in future low-carbon power systems.
Abbreviations and nomenclature
AGC average generation costs in USD/MWh
ASC average system costs in USD/MWh
𝐶!!"# annualized fixed cost of plant i in USD/kW-yr
𝐶!!"# variable cost of plant i in USD/MWh
𝐶𝐹!!"#$% solar power capacity factor during hour h in per unit
𝐶𝐹!!"#$ wind power capacity factor during hour h in per unit
CCGT combined cycle gas turbine
PRE-PUBLICATION VERSION | MAY 1, 2016 33
Dh total electricity demand during hour h in MWh
EC energy contribution of a generation technology in %
ERCOT Electricity Reliability Corporation of Texas
GW gigawatts
GWh gigawatt-hours
h index for the hours simulated
H total number of hours simulated
IMRES Investment Model for Renewable Electricity Systems
kWh kilowatt-hours
LCOE levelized cost of energy in USD/MWh
Li-ion lithium ion
MVS marginal value of storage in USD/kWh
N number of generation units installed
nh amount of non-served energy in the system during hour h in MWh
NLDC net load duration curve
OCGT open cycle gas turbine
𝑝!"#$% solar power capacity installed in MWs
𝑝!"#$ wind power capacity installed in MWs
PV photovoltaics
RC rate of renewable curtailment in %
S0 initial storage capacity in kWh
S1 final storage capacity in kWh
t index for generation technologies
T set of available generation technologies
TGC total generation cost in million of USD
TSC total system cost in million of USD
VOLL value of lost load in USD/MWh
𝑥!! output of unit i during hour h in MW
𝑥!!"#$% solar generation during hour h in MWs
𝑥!!"#$ wind generation during hour h in MWs
USD United States Dollars
Θ weighing factor to scale up operating costs modeled to one full year
34 ACCEPTED BY APPLIED ENERGY | MAY 1, 2016
Acknowledgements
The authors would like to thank J.I. Perez-Arriaga and two anonymous reviewers for helpful
comments and review. The submitted manuscript has been created by UChicago Argonne, LLC,
Operator of Argonne National Laboratory (“Argonne”). Argonne, a U.S. Department of Energy
Office of Science laboratory, is operated under Contract No. DE AC02-06CH11357. J.D.J. also
gratefully acknowledges support from the U.S. National Science Foundation Graduate Research
Fellowship program.
Appendix A. Supplementary Material
Table A.1 | Cost Assumptions Used in the Analysis in U.S. dollars.
(1) (2) (3) (4) (5) (6) (7) (8) (9)
Pulverized Coal 3,861 (*) 32.1 426.9 4.61 3.14 8.80 32.2 0.098
Gas CCGT 1,280 (*) 15.8 146.7 7.44 7.52 6.43 51.7 0.030
Gas OCGT 805 (*) 7.3 89.6 10.69 7.52 9.75 84.0 0.016
Nuclear 5,609 (**) 96.2 669.8 2.21 1.02 10.49 12.9 2
Wind 1,366 (**) 43.7 188.6 0.00 NA NA 0.0 NA
Solar PV 1,316 (***) 9.4 149.0 0.00 NA NA 0.0 NA
(1) Technology
(2) Capital Cost (incl. construction) (2014 USD/kW) (*) EIA AEO14 [32]; (**) DOE Wind Vision [34]; (***)
DOE SunShot Vision [35]
(3) Fixed O&M (2014 USD/kW-yr) [56]
(4) Annualized Fixed Cost (2014 USD/kW-yr)
(5) Variable O&M (2014 USD/MWh) [56]
(6) Fuel Cost (2014 USD/mmBTU) [32]
(7) Heat Rate (mmBTU/MWh) [56]
(8) Total Variable Cost (2014 USD/MWh)
(9) Startup Cost (million 2014 USD/start)
PRE-PUBLICATION VERSION | MAY 1, 2016 35
Table A.2 | Technical Parameters Used to Model Generation Technologies in the Analysis.
(1) (2) (3) (4) (5) (6) (7)
Pulverized Coal 1,300 520 700 8 8 855
Gas CCGT 400 150 280 4 6 341
Gas OCGT 210 50 440 1 1 517
Nuclear 2,230 1,120 280 36 36 0
Wind continuous 0 NA NA NA 0
Solar PV continuous 0 NA NA NA 0
(1) Technology
(2) Maximum Power Output (rated capacity of the plant) (MW) [56]
(3) Minimum Stable Output (MW) [52]
(4) Maximum Ramping Capability (MW/h) [57]
(5) Minimum Up Time (hours)
(6) Minimum Down Time (hours)
(7) Emissions Rate (tns CO2/GWh) [58]
Table A.3 | Derivation of the Storage Cost Annuity Used to Calculate the Average System Cost.
(1) (2) (3) (4) (5) (6) (7) (8)
storage capacity [GW]
10 20 30
Current Li-ion (10 years) 764 (*) 10 10% 0.163 124.337 2
2,487 (4.97)
4,973 (9.94)
7,460 (14.92)
Future Li-ion (20 years) 536 (**) 20 10% 0.117 62.982 2
1,260 (2.52)
2,519 (5.04)
3,779 (7.56)
Max. PHS (30 years) 250 (***) 30 10% 0.106 10.608 10
2,652 (5.30)
5,304 (10.60)
7,956 (15.91)
Min. PHS (30 years) 100 (***) 30 10% 0.106 26.520 10
1,061 (2.12)
2,122 (4.24)
3,182 (6.36)
(1) Technology
36 ACCEPTED BY APPLIED ENERGY | MAY 1, 2016
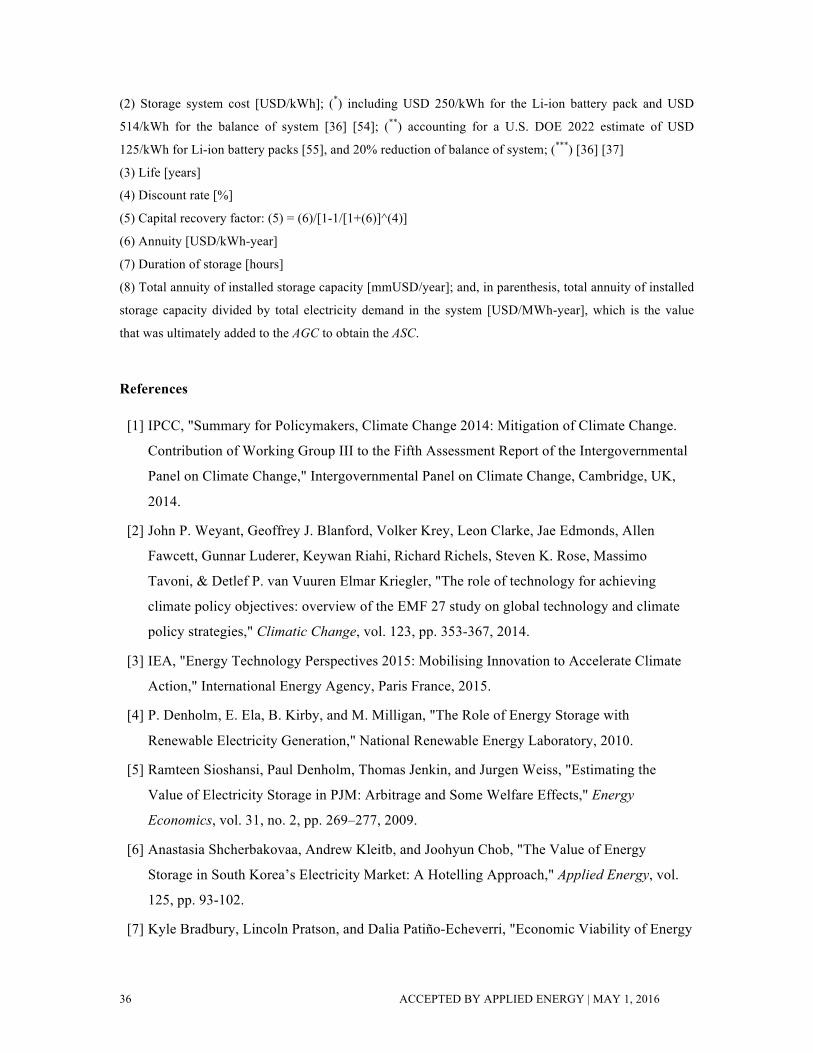
(2) Storage system cost [USD/kWh]; (*) including USD 250/kWh for the Li-ion battery pack and USD
514/kWh for the balance of system [36] [54]; (**) accounting for a U.S. DOE 2022 estimate of USD
125/kWh for Li-ion battery packs [55], and 20% reduction of balance of system; (***) [36] [37]
(3) Life [years]
(4) Discount rate [%]
(5) Capital recovery factor: (5) = (6)/[1-1/[1+(6)]^(4)]
(6) Annuity [USD/kWh-year]
(7) Duration of storage [hours]
(8) Total annuity of installed storage capacity [mmUSD/year]; and, in parenthesis, total annuity of installed
storage capacity divided by total electricity demand in the system [USD/MWh-year], which is the value
that was ultimately added to the AGC to obtain the ASC.
References
[1] IPCC, "Summary for Policymakers, Climate Change 2014: Mitigation of Climate Change.
Contribution of Working Group III to the Fifth Assessment Report of the Intergovernmental
Panel on Climate Change," Intergovernmental Panel on Climate Change, Cambridge, UK,
2014.
[2] John P. Weyant, Geoffrey J. Blanford, Volker Krey, Leon Clarke, Jae Edmonds, Allen
Fawcett, Gunnar Luderer, Keywan Riahi, Richard Richels, Steven K. Rose, Massimo
Tavoni, & Detlef P. van Vuuren Elmar Kriegler, "The role of technology for achieving
climate policy objectives: overview of the EMF 27 study on global technology and climate
policy strategies," Climatic Change, vol. 123, pp. 353-367, 2014.
[3] IEA, "Energy Technology Perspectives 2015: Mobilising Innovation to Accelerate Climate
Action," International Energy Agency, Paris France, 2015.
[4] P. Denholm, E. Ela, B. Kirby, and M. Milligan, "The Role of Energy Storage with
Renewable Electricity Generation," National Renewable Energy Laboratory, 2010.
[5] Ramteen Sioshansi, Paul Denholm, Thomas Jenkin, and Jurgen Weiss, "Estimating the
Value of Electricity Storage in PJM: Arbitrage and Some Welfare Effects," Energy
Economics, vol. 31, no. 2, pp. 269–277, 2009.
[6] Anastasia Shcherbakovaa, Andrew Kleitb, and Joohyun Chob, "The Value of Energy
Storage in South Korea’s Electricity Market: A Hotelling Approach," Applied Energy, vol.
125, pp. 93-102.
[7] Kyle Bradbury, Lincoln Pratson, and Dalia Patiño-Echeverri, "Economic Viability of Energy
PRE-PUBLICATION VERSION | MAY 1, 2016 37
Storage Systems Based on Price Arbitrage Potential in Real-Time U.S. Electricity Markets,"
Applied Energy, vol. 114, pp. 512-519, 2014.
[8] Dylan McConnell, Tim Forcey, and Mike Sandiford, "Estimating the Value of Electricity
Storage in an Energy-Only Wholesale Market," Applied Energy, vol. 159, pp. 422-432,
2015.
[9] P. Denholm and M. Hand, "Grid flexibility and storage required to achieve very high
penetration of variable renewable electricity," Energy Policy, vol. 39, no. 3, pp. 1817-1830,
2011.
[10] Joohyun Cho and Andrew N. Kleit, "Energy Storage Systems in Energy and Ancillary
Markets: A Backwards Induction Approach," Applied Energy, vol. 147, pp. 176-183, 2014.
[11] Trishna Das, Venkat Krishnan, and James D. McCalley, "Assessing the Benefits and
Economics of Bulk Energy Storage Technologies in the Power Grid," Applied Energy, vol.
139, pp. 104-118, 2015.
[12] Mary Black and Goran Strbac, "Value of Bulk Energy Storage for Managing Wind Power
Fluctuations," IEEE Transactions on Energy Conversion, vol. 22, no. 1, pp. 197-205, March
2007.
[13] IEA, "The Power of Transformation Wind, Sun and the Economics of Flexible Power
Systems," International Energy Agency, Paris, 2014.
[14] Eric Cutter, Ben Haley, Jeremy Hargreaves, and Jim Williams, "Utility Scale Energy Storage
and the Need for Flexible Capacity Metrics," Applied Energy, vol. 124, pp. 274-282, 2014.
[15] GE Energy, "Western Wind and Solar Integration Study," Golden, CO, SR-550-47434,
2010.
[16] A. Tuohy and M. O’Malley, "Pumped storage in systems with very high wind penetration,"
Energy Policy, vol. 39, no. 4, pp. 1965-1974, 2011.
[17] E. S. Hittinger and I. M. L. Azevedo, "Bulk Energy Storage Increases United States
Electricity System Emissions," Environmental Science and Technology, vol. 49 , no. 5, pp.
3203–3210, 2015.
[18] R. Lueken and J. Apt, "The effects of bulk electricity storage on the PJM market," Energy
Systems, no. 5, p. 1−14, 2014.
[19] A.A. Solomon, Daniel M. Kammen, and D. Callaway, "The Role of Large-Scale Energy
Storage Design and Dispatch in the Power Grid: A Study of Very High Grid Penetration of
Variable Renewable Resources," Applied Energy, vol. 134, pp. 75-89, 2014.
38 ACCEPTED BY APPLIED ENERGY | MAY 1, 2016
[20] D. Pudjianto and et al., "Whole-Systems Assessment of the Value of Energy Storage in Low-
Carbon Electricity Systems," IEEE Transactions on Smart Grid, vol. 5, no. 2, 2014.
[21] A. Mileva, J. Johnston, J. H. Nelson, and D. M. Kammen, "Power system balancing for deep
decarbonization of the electricity sector," Applied Energy, vol. 162, pp. 1001-1009, 2016.
[22] H. Safaei and D. Keith, "How much bulk energy storage is needed to decarbonize
electricity?," Energy and Environmental Science, 2015.
[23] I. J. Pérez-Arriaga and P. Linares, "Markets vs. Regulation: A Role for Indicative Energy
Planning," Energy Journal, p. 13, March 2008.
[24] F. J. de Sisternes, M. D. Webster, and J. I Perez-Arriaga, "The Impact of Bidding Rules on
Electricity Markets with Intermittent Renewables," IEEE Transactions on Power Systems,
vol. 30, no. 3, pp. 1603-1613, May 2015.
[25] OECD-NEA, "Nuclear Energy and Renewables System Effects in Low-carbon Electricity
Systems," OECD Nuclear Energy Agency, Paris, France, 2012.
[26] OECD-NEA, "Technical and Economic Aspects of Load Following with Nuclear Power
Plants," OECD Nuclear Energy Agency, Paris, France, 2011.
[27] EPRI, "Program on Technology Innovation: Approach to Transition Nuclear Power Plants to
Flexible Operations," Electric Power Research Institute, Palo Alto, CA, 2014.
[28] EUR, "The European Utility Requirement (EUR) document, Revision D," European Utilities
Requirements for LWR Nuclear Power Plants, 2012.
[29] Westinghouse, "AP1000 Design Control Document. Chapter 7: Instrumentation and
Controls," 2009.
[30] IEA, "CO2 Emissions from Fuel Combustion: Highlights. 2014 Edition," International
Energy Agency, Paris, France, 2014.
[31] European Environment Agency. (2014) Overview of the electricity production and use in
Europe (ENER 038). [Online]. http://www.eea.europa.eu/data-and-
maps/indicators/overview-of-the-electricity-production/assessment-2
[32] EIA, "Annual Energy Outlook 2014," U.S. Energy Information Administration, 2014.
[33] NREL. PV Watts Calculator. [Online]. http://pvwatts.nrel.gov/
[34] DOE, "Wind Vision Report," U.S. Department of Energy, 2015.
[35] DOE, "SunShot Vision Study ," U.S. Department of Energy, 2012.
[36] EPRI & DOE, "DOE/EPRI Electricity Storage Handbook in Collaboration with NRECA,"

PRE-PUBLICATION VERSION | MAY 1, 2016 39
U.S. Department of Energy, 2013.
[37] Xing Luo, Jihong Wang, Mark Dooner, and Jonathan Clarke, "Overview of Current
Development in Electrical Energy Storage Technologies and the Application Potential in
Power System Operation," Applied Energy, vol. 137, pp. 511-536, 2015.
[38] Botterud A., Levin T., and Koritarov V., "Pumped Storage Hydropower: Benefits for Grid
Reliability and Integration of Variable Renewable Energy," Argonne National Laboratory,
Report ANL/DIS-14/10 2014.
[39] F. J. de Sisternes, "Investment Model for Renewable Electricity Systems (IMRES): an
Electricity Generation Capacity Expansion Formulation with Unit Commitment
Constraints," CEEPR Working Paper Series, no. 016, November 2013.
[40] R. Turvey and D. Anderson, Electricity Economics. Essays and Case Studies. Baltimore and
London: The World Bank, The Johns Hopkins University Press, 1977.
[41] J. Ma, V. Silva, R. Belhomme, D.S. Kirschen, and L. F. Ochoa, "Evaluating and Planning
Flexibility in Sustainable Power Systems," IEEE Transactions on Sustainable Energy, vol. 4,
no. 1, pp. 200–209, 2013.
[42] S. Jin, A. Botterud, and S.M. Ryan, "Temporal vs. Stochastic Granularity in Thermal
Generation Capacity Planning with Wind Power," IEEE Transactions on Power Systems,
vol. 29, no. 5, pp. 2033-2041, 2014.
[43] F. J. de Sisternes and M. D. Webster, "Optimal Selection of Sample Weeks for
Approximating the Net Load in Generation Planning Problems," ESD Working Paper Series,
2013. [Online]. http://esd.mit.edu/wps/2013/esd-wp-2013-03.pdf
[44] Ryan Wiser and Mark Bolinger, "2013 Wind Technologies Market Report," Lawrence
Berkeley National Laboratory, 2014.
[45] GTM Research, "Solar Market Insight, 2014," 2014.
[46] Matthew Bandyk, "Georgia Power Reveals $1B Increase in Vogtle Nuclear Project Costs,"
Transmission and Distribution World, March 2015.
[47] ERCOT, "Hourly Load Data Archives," The Electric Reliability Council of Texas , 2015.
[48] L. Hirth, "The market value of variable renewables: The effect of solar wind power
variability on their relative price," Energy Economics, vol. 38, pp. 218-236, 2013.
[49] A. Mills and R. Wiser, "Changes in the Economic Value of Variable Generation at High
Penetration Levels: A Pilot Case Study of California," Lawrence Berkeley National

40 ACCEPTED BY APPLIED ENERGY | MAY 1, 2016
Laboratory, 2012.
[50] A. Keane and et al., "Capacity Value of Wind Power," IEEE Transactions on Power
Systems, vol. 26, no. 2, 2011.
[51] F. D. Munoz and A. D. Mills, "Endogenous Assessment of the Capacity Value of Solar PV
in Generation Investment Planning Studies," IEEE Transactions on Sustainable Energy,
2015.
[52] MIT, "The Future of Solar Energy," Massachusetts Institute of Technology, 2015.
[53] H. Holttinen and et al., "Methodologies to Determine Operating Reserves Due to Increased
Wind Power ," IEEE Transactions on Sustainable Energy, vol. 3, no. 4, 2012.
[54] GTM Research , "U.S. Energy Storage Monitor," 2015.
[55] B. Nykvist and M. Nilsson, "Rapidly falling costs of battery packs for electric vehicles,"
Nature Climate Change, vol. 5, pp. 329–332, 2015.
[56] EIA. (2013) Updated Capital Cost Estimates for Utility Scale Electricity Generating Plants.
[Online]. http://www.eia.gov/forecasts/capitalcost/pdf/updated_capcost.pdf
[57] MIT, "Managing Large-Scale Penetration of Intermittent Renewables. An MIT Energy
Initiative Symposium ," Massachusetts Institute of Technology, 2011.
[58] EIA, "How much carbon dioxide is produced when different fuels are burned? ," U.S.
Energy Information Administration, 2015.
[59] N. Stern, "Stern Review on The Economics of Climate Change," HM Treasury, London,
2010.