The Value of Distributed Electricity Storage in...
77
The Value of Distributed Electricity Storage in Texas Proposed Policy for Enabling Grid-Integrated Storage Investments PREPARED FOR PREPARED BY Judy Chang Ioanna Karkatsouli Johannes Pfeifenberger Lauren Regan Kathleen Spees James Mashal Matthew Davis March 2015
Transcript of The Value of Distributed Electricity Storage in...
The Value of Distributed Electricity Storage in Texas Proposed Policy for Enabling Grid-Integrated Storage Investments
PREPARED FOR
PREPARED BY
Judy Chang Ioanna Karkatsouli
Johannes Pfeifenberger Lauren Regan
Kathleen Spees James Mashal
Matthew Davis
March 2015

This report was prepared for Oncor Electric Delivery Company. All results and any errors are
the responsibility of the authors and do not represent the opinion of The Brattle Group, Inc. or
its clients. As a Transmission and Distribution Service Provider in Texas, Oncor has an interest
in the state’s regulatory policy regarding whether and how storage assets may be regulated.
While Oncor has commissioned this whitepaper, its contents represent the authors’ independent
view and assessment of the economics of storage in Texas.
We acknowledge the valuable contributions of Jürgen Weiss for peer review and conceptual
contributions, and of Oncor staff for providing the underlying data and conceptual support that
we used to understand and analyze the benefits of integrating storage into their distribution
system. We would like to thank the many ERCOT market participants and policy makers who
provided thoughtful comments since we released the November 2014 summary of our study.
Finally, we appreciate the thoughtful insights and feedback provided by a panel of academic and
industry peer reviewers retained by Oncor.
Copyright © 2015 The Brattle Group, Inc.
i| brattle.com
Table of Contents
Executive Summary ........................................................................................................................... ii
I. Introduction and Background .................................................................................................... 1
A. Perspectives for Measuring the Value of Electricity Storage ........................................... 1
B. Types of Value that Electricity Storage Can Provide ....................................................... 5
II. Prior Analyses Estimating the Value of Electricity Storage ...................................................... 6
A. Summary of Valuation Approaches .................................................................................. 6
B. Estimated Value of Electricity Storage in Prior Studies ................................................. 11
III. Analytical Approach to Estimating Storage Costs and Benefits .............................................. 13
A. Storage Costs ..................................................................................................................... 13
B. Wholesale Power Market Values of Storage .................................................................. 16
1. Overview of ERCOT Energy-Only Market Modeling Approach ........................ 16
2. Storage Dispatch into Energy and Ancillary Markets .......................................... 19
3. Market Price and Production Cost Impacts .......................................................... 23
4. Impacts on Other Generation Suppliers ................................................................ 25
C. Transmission and Distribution System Benefits ............................................................. 28
1. Deferred Transmission and Distribution Investments ......................................... 29
2. Reliability Improvements on the Distribution System ......................................... 36
D. Other Potential Storage Values Not Quantified ............................................................. 40
IV. Aggregate Value of Electrical Energy Storage ......................................................................... 43
A. The Merchant Value of Storage ....................................................................................... 44
B. System-Wide Societal Benefits ........................................................................................ 45
C. Customer Benefits ............................................................................................................ 47
V. Findings and Implications ........................................................................................................ 50
VI. Policies for Enabling Economic Storage Investments ............................................................. 52
List of Acronyms .............................................................................................................................. 59
Bibliography ..................................................................................................................................... 61
ii | brattle.com
Executive Summary
Electricity storage is attracting much attention as storage manufacturers begin to announce rapid
reductions in the technology’s costs, utilities publicize upcoming deployments, and states
evaluate new policy initiatives.1 Interest in electricity storage is driven by a range of potential
applications that include avoiding power outages for customers, reinforcing the grid, reducing
other transmission and distribution (T&D) costs, shifting power consumption away from costly
peak-load periods, balancing intermittent renewable energy resources, and providing ancillary
services and emergency response services in the wholesale power markets. While the potential
value of these and other storage applications have long been recognized, electricity storage costs
have not been competitive with alternative technologies and resources that can provide
comparable services. Therefore, electricity storage investments to date have been deployed
primarily as demonstration projects.
Now, it appears that electricity storage is on the verge of becoming economically attractive.
Battery storage manufacturers and industry reports indicate that costs will decrease substantially
over the next few years. Current forecasts estimate cost declines from the current $700–$3,000
per kWh of installed electricity storage in 2014 to less than half of that over the next three
years.2 Some analyst projections and vendor quotes indicate that the installed costs of battery
systems will drop to approximately $350/kWh by 2020.3 At these much lower costs, many
innovative applications of electricity storage could become cost effective.
In this context of declining battery costs, Oncor Electric Delivery Company (Oncor), a
Transmission and Distribution Service Provider (TDSP) in Texas, has engaged us to explore the
economics of grid-integrated storage deployment in Texas. We evaluate this question first by
examining the many potential value streams of storage, including those achieved in the T&D
systems and those achieved through participation in wholesale energy and ancillary services
markets. We then evaluate whether and at what deployment levels storage can be cost-effective
from the perspectives of wholesale electricity market participants, retail customers, and the
combined system or society as a whole.
1 For example, see Public Utility Commission of the State of California (2013), p. 2.
2 Navigant notes that current storage costs for a four-hour battery are $720–$2,800/kWh depending on
the scale of the battery. According to Sam Jaffe of Navigant Research, battery-only costs are currently
around $500–700/kWh with the remaining installation costs due to system costs. Also see Dumoulin-
Smith, et al. (2014), p. 1.
3 The $350/kWh installed cost projection is based on Oncor’s discussions with vendors, consistent with
industry sources. For example, Morgan Stanley predicts that battery-only costs may reach $125–
$150/kWh in the near future, down from the $500/kWh currently. See Byrd, et al. (2014), p. 40. If
battery costs are capable of reaching the low costs projected by Tesla Motors Inc., this would imply a
battery-only cost of $110/kWh. See Jaffe (2014), p. 30.

iii | brattle.com
We then evaluate whether new business models and public policies supporting those electricity
storage business models in Texas would be needed and appropriate, given the Electric Reliability
Council of Texas’s (ERCOT’s) deregulated market structure, and if so, what policies might be
necessary for Texas to realize the full economic and reliability benefits of grid-integrated,
distributed electrical energy storage.
Overall, our analysis shows that deploying electricity storage on distribution systems across
Texas could provide substantial net benefits to the state. We estimate that up to 5,000 MW
(15,000 MWh, assuming a three-to-one ratio of storage to discharge capability) of grid-
integrated, distributed electricity storage would be cost effective from an ERCOT system-wide
societal perspective, based on a forecast of installed cost of storage of approximately $350/kWh.
Our analysis assumes that the storage deployment plan and the business model enabled by public
policy will be developed to capture as many benefits as possible by integrating value from
increasing customer reliability, improving the T&D systems, and transacting in the wholesale
power markets.
Our analysis accounts for the net impact that deploying storage would have on generation
investments in ERCOT’s “energy-only” wholesale electricity market. We show that adding
5,000 MW (or 15,000 MWh) of storage would reduce the need for new generation by
approximately 3,100 MW. This generation investment response sustains market prices high
enough to fully support the development of the additional new generating capacity necessary to
maintain resource adequacy in ERCOT. Our market simulations also show that integrating
storage into the ERCOT market reduces price spikes during the most severe scarcity events,
resulting in fewer high-priced scarcity hours, but increases prices during non-scarcity peak hours
and during the lowest-priced off-peak hours. As a result, conventional generation plants recover
their fixed costs during more hours of the year and in somewhat more predictable fashion than
on the system without storage.
We also evaluate the benefits of grid-integrated storage deployed by TDSPs from an average
electricity customer’s perspective. Our analysis shows that deploying 3,000 MW (9,000 MWh) of
storage across ERCOT (with 1,000 MW on Oncor’s system) would reduce residential customer
bills slightly and provide additional reliability benefits in the form of reduced power outages for
customers located in areas where storage is installed. Considering both the impact on electricity
bills and improved reliability from grid-integrated storage, total customer benefits would
significantly exceed costs. However, while beneficial from an integrated, system-wide
perspective, an efficient scale of storage deployment would not be reached if deployed solely by
merchant wholesale market participants, by retail customers, or only for capturing T&D benefits.
Storage investments could not be undertaken at an efficient scale solely by merchant developers
in the Texas restructured electricity market because the value that a merchant storage developer
can monetize through transacting in the wholesale power market alone is too low compared to
costs. For instance, we find that approximately 30–40% of the total system-wide benefits of
storage investments are associated with reliability, transmission, and distribution functions that
are not reflected in wholesale market prices and, therefore, cannot be captured by merchant
storage investors. Even at the low projected storage costs, the opportunity to arbitrage wholesale
iv | brattle.com
power market prices and sell ancillary services would not likely attract merchant storage
investments at the efficient scale. This means that relying only on merchant investors to develop
storage in ERCOT would result in under-investment in storage from a state-wide perspective.
Moreover, without being integrated in T&D planning and operations, merchant electricity
storage would be under-utilized and unable to capture the high additional value offered by
targeted deployment within the transmission and distribution systems.
Similarly, while individual customers would be able to capture the backup-power benefits of
storage, they are not likely to directly monetize the larger grid-wide and wholesale power
market benefits. Finally, developing storage to capture only the T&D system benefits would
likely result in under-investment and under-utilization of electricity storage for wholesale power
applications.
In contrast, deploying storage in a manner that can be integrated into the distribution system and
also capture wholesale market benefits would allow TDSPs to capture high-value applications
such as providing backup power and voltage support on distribution feeders with below-average
reliability or high-value end uses; reducing wear on critical distribution assets; and deferring
T&D investments. Given that deploying storage on specific locations on the distribution system
is important for capturing the full value of benefits that storage can provide, a grid-based
deployment strategy will be most effective if it is integrated with: (1) planning transmission and
distribution system investments; and (2) targeted efforts to use electricity storage backup to
reduce customers’ distribution-system-related power outages. In addition, to capture the full
value of distributed storage assets would require that they be dispatched into the wholesale
power markets.
Given the significant benefits that storage can bring to the system as a whole, enabling cost-
effective investments in electricity storage will require a regulatory framework that helps
investors capture both the wholesale market and the T&D system values associated with the
storage devices. We identify a range of policy options and business models for enabling cost-
effective storage without relying on subsidies that would create a net cost for ratepayers or
taxpayers.
Because allowing TDSPs to integrate storage with its transmission and distribution planning will
help capture storage’s benefits and concerns related to this approach can be mitigated, we focus
on the policy framework that would involve: (1) enabling electricity storage investments to be
deployed by TDSPs on their systems as part of T&D planning that seeks to capture T&D and
reliability-related values; and (2) allowing independent wholesale market participants to offer
the storage devices into the wholesale power market. This regulatory framework would involve
allowing the transmission and distribution companies to “auction off” to independent third
parties the wholesale market dispatch of the electricity storage deployed on the T&D system.
This approach would maintain the clear delineation between the TDSP’s role as a T&D service
provider and wholesale market participants who transact in the market. The auction proceeds
would be used as an offset to retail customers’ T&D costs, which include paying for the storage
facilities. Such a regulatory framework would facilitate an economically-efficient level of storage
investments in Texas, and reduce investment barriers by allowing the storage technology to be

v | brattle.com
deployed when the combined benefits from the wholesale market, transmission, and distribution
systems exceed the expected costs by a sufficient margin.
The focus of this study is limited to: (a) analyzing the potential economic benefits of electricity
storage; (b) assessing the likely market size for cost-effective storage in ERCOT; and (c)
recommending a high-level regulatory framework to support such a cost-effective deployment.
We have not yet analyzed which of the different electricity storage technologies might be
suitable to capture most of the identified value, nor have we evaluated how different usages of
the storage devices might affect the costs. Additional work will be needed to develop a phased-
in deployment plan and demonstrate the cost effectiveness of any proposed plans. The details of
a regulatory structure and a roadmap of various approval processes and safeguards to support a
successful deployment of storage assets will also need to be developed.
1 | brattle.com
I. Introduction and Background
Oncor Electric Delivery Company (Oncor), a Transmission and Distribution Service Provider
(TDSP) in Texas, engaged us to explore the economics of grid-integrated, distributed storage in
Texas. We evaluate this first by estimating whether and to what extent storage could be cost-
effectively deployed on distribution systems in the state from the perspectives of retail
customers, wholesale electricity market participants, and the combined system or “society as a
whole.” We then evaluate the merits of different business models and whether new public
policies would be needed to support electricity storage in Texas, given the Electric Reliability
Council of Texas’s (ERCOT’s) deregulated market structure, and if so, what policies might be
necessary to realize the full economic and reliability benefits of grid-integrated, distributed
electrical energy storage.
This report is organized as follows. Section I discusses the different perspectives that can be
applied to measure the value of electricity storage and provide a summary of the types of
individual benefits that can contribute to the overall value of adding storage to the electricity
system. Section II reviews and summarizes recent industry studies on this subject area.
Section III presents the analytical approaches used to estimate the values that deploying grid-
integrated storage in ERCOT can provide on a system-wide basis. Section IV presents the
estimated merchant value of storage in ERCOT as well as the aggregate value grid-integrated
storage (including transmission, distribution, and reliability benefits) from both system-wide
societal and retail customer perspectives. Section V summarizes our overall findings and
discusses their implications. And finally, Section VI explores possible business models and
regulatory policies that could be implemented to enable economic storage investment in ERCOT
and operationally and financially unbundle the regulated and competitive uses of the storage
devices.
A. PERSPECTIVES FOR MEASURING THE VALUE OF ELECTRICITY STORAGE
One of the major differences between electricity and other energy sources such as oil and gas is
that electricity supplies must be balanced with consumption at all times. Aside from parts of the
country (and world) where pumped hydro storage is abundant, there has been very little ability
to economically store excess electricity supplies and discharge the power back into the grid when
needed.4 Depending on the technology, electricity storage can provide a number of services to
4 The grid-level storage of electricity is not a new concept. However, as of today, pumped hydro is the
only form of storage that has seen widespread deployment in electricity markets throughout the U.S.
Although it is severely restricted by geography, there are currently 36 pumped hydro facilities in the
U.S. with a combined capacity of approximately 20,000 MW, see DOE Global Energy Storage Database
(2014). Other forms of storage, such as batteries, have two major advantages over pumped hydro:
(1) they are not restricted by geography, and (2) they can be deployed at a smaller scale. If costs can
Continued on next page
2 | brattle.com
the grid beyond what is known as “energy arbitrage” or charging when demand is low and
discharging when demand is high. Some of these other applications include providing ancillary
services as storage can be fast-acting in response to a grid emergency; deferring the need for
transmission and distribution (T&D) investments; and, improving reliability by providing
discharging power during an outage.
Due to recent technological developments, it appears that electricity storage is becoming
economically attractive. In fact, industry projections indicate that battery costs may fall to half
of their current levels by 2020. Large storage additions have the potential to greatly change the
dynamics of the grid and the roles of generators, T&D utilities, and grid operators. As costs of
grid-level electricity storage decline, many innovative applications could become cost effective.
In this report we quantify a selection (but not all) of these potential benefits, and compare them
to the costs of deploying storage.
When evaluating the benefits of electricity storage, it is important to establish from whose
perspective the benefits are measured. From the perspective of a wholesale market participant,
the primary question is whether the benefits of merchant participation in the ERCOT electricity
markets exceed investment costs. From the perspective of T&D providers and their ratepayers, it
is important to evaluate the benefits that T&D customers would receive in comparison to the
costs they would incur. Finally, from the perspective of policy makers, it is most relevant to
compare the system-wide benefits with system-wide costs as the primary metric, although the
impacts on and the value implications for electricity customers, generators, regulated T&D
companies, and other market participants must all be considered.
The definition and significance of these three distinct perspectives are described below and
summarized in Figure 1:
Merchant Benefits are the net profits that a private investor could monetize by
participating in the wholesale markets for electric energy and ancillary services.
The net merchant value is the most relevant metric from a wholesale market
participant’s perspective because one would make the storage investment only if
one can obtain adequate profit from it. As we will discuss in more detail later, if
the capital expenditure of the storage were paid for by electricity customers
through regulated cost recovery, the merchant value could be captured and shared
with customers to reduce their electricity bills.
“System-Wide” or “Societal” Benefits are the overall benefits of storage to the
electricity system as a whole, regardless of whether those benefits and costs
accrue to the asset owner, retail customers, market participants, or other entities.
After subtracting the costs of electricity storage, the net societal benefits indicate
whether the investment in storage would be in the overall public interest. This
Continued from previous page
be reduced, electricity storage can dramatically change how energy storage is viewed for grid
deployments.

3 | brattle.com
system-wide benefits perspective is the most common metric on which policy-
makers and regulators rely in making policy choices. It is also the metric used in
Texas for evaluating the economics of transmission investment decisions, as
codified in the Public Utility Commission of Texas’s (PUCT’s) decisions.5
Customer Benefits are the benefits that accrue directly to electricity users. In the
context of electricity storage deployment, these benefits may include lower
electricity bills, improvements in reliability for customers that can take advantage
of storage as a backup power source, and improved power quality due to storage’s
ability to control voltage. Net customer benefits (after accounting for the costs
incurred) are likely to be the most important metric for ERCOT TDSPs and their
customers when determining whether a capital expenditure should be made and
added to a TDSP’s rate base.
We evaluate the magnitude of potential benefits from each of these three perspectives compared
to anticipated costs, when determining whether and how Texas can benefit from electricity
storage investments.
Figure 1 Three Perspectives on Measuring the Value of Electricity Storage
5 See PUCT (2012).
• Profits that a private investor could capture from the wholesale market• Driven by energy arbitrage value and ancillary service prices• Importance: Determines: (a) whether wholesale market incentives by themselves are sufficient to attract investment; and (b) the offset to storage costs if deployed by TDSPs for T&D/reliability benefits
Merchant Value
• System‐wide benefits, including reduction in production, investment, and outage costs (regardless of whether suppliers or customers benefit)
• Also known as “total resource cost” benefits
• Importance: PUCT transmission policy for "economic" projects requires analysis of net “societal” or “system‐wide” benefits
"Societal" or "System‐Wide" Benefits
• Customer bill savings from reduced wholesale prices, deferred transmission and distribution costs, and rebated merchant value
• Increase in realized distribution system reliability (reduced outages)
• Importance: Customers' and TDSP's primary interest, also a key metric from a public policy perspective
Customer Benefits
4 | brattle.com
The potential value of storage from each perspective and in aggregate depends greatly on how
that asset is deployed and operated. Because storage can provide value in both the regulated and
competitive segments of the electricity market, in a fully deregulated market like ERCOT, a
number of regulatory challenges present themselves. Conversely, without a proper regulatory
framework, storage values may not be captured in a deregulated and therefore, segmented
market place.
Acknowledging these challenges, the regulatory framework under which energy storage operates
at both the federal and state level has been evolving in recent years. At the Federal Energy
Regulatory Commission (FERC), regulatory changes have included setting new rules on how
ancillary services are priced that account for the capabilities of energy storage to provide this
service, and including energy storage devices in pro forma Small Generator Interconnection
Procedures, which will help ensure the cost and time associated with interconnecting them to
the grid are just and reasonable.6 FERC has also addressed the question of whether and when
electricity storage assets can be treated for regulatory purposes as a component of the regulated
transmission system (rather than part of the deregulated wholesale market).7 These changes are
in part intended to support the development of storage technologies and recognize the uniquely
valuable storage capabilities compared to conventional generation technologies.
Under Texas’s current regulatory framework, if an electricity storage asset intends “to be used to
sell energy or ancillary services at wholesale” it is considered to be a generation asset. Therefore,
it cannot currently be owned by a TDSP if any of the value in the energy and ancillary services
market should be captured.8 This PUCT rule is a barrier to storage deployment in ERCOT
because it limits the amount of value that can be derived from storage to being either just a
generation asset or just a T&D asset, but not both.9 In this report, we evaluate the impact that
this functional separation has on the value for storage deployed on Texas’s grid and compare it to
a case where the full value of storage can be realized by combining the wholesale market value
and the transmission, distribution, and customer reliability values.
6 See FERC Orders 755 and 784.
7 For example, in 2011 FERC encouraged system operators to modify their ancillary services markets to
allow for participation of fast-responding storage devices (FERC Order 755). The Commission also
approved the inclusion of storage devices into the transmission ratebase if the primary purpose of the
devices was to support the transmission system, and the market revenues associated with the devices
dispatch were credited back to transmission customers (130 FERC ¶ 61,056). In a separate ruling,
FERC ordered that a large new pumped-hydro plant could not be treated as a transmission asset (122
FERC ¶ 61,272).
8 See Texas Utilities Code (1999).
9 See Bhatnager, et al. (2013), p. 9.
5 | brattle.com
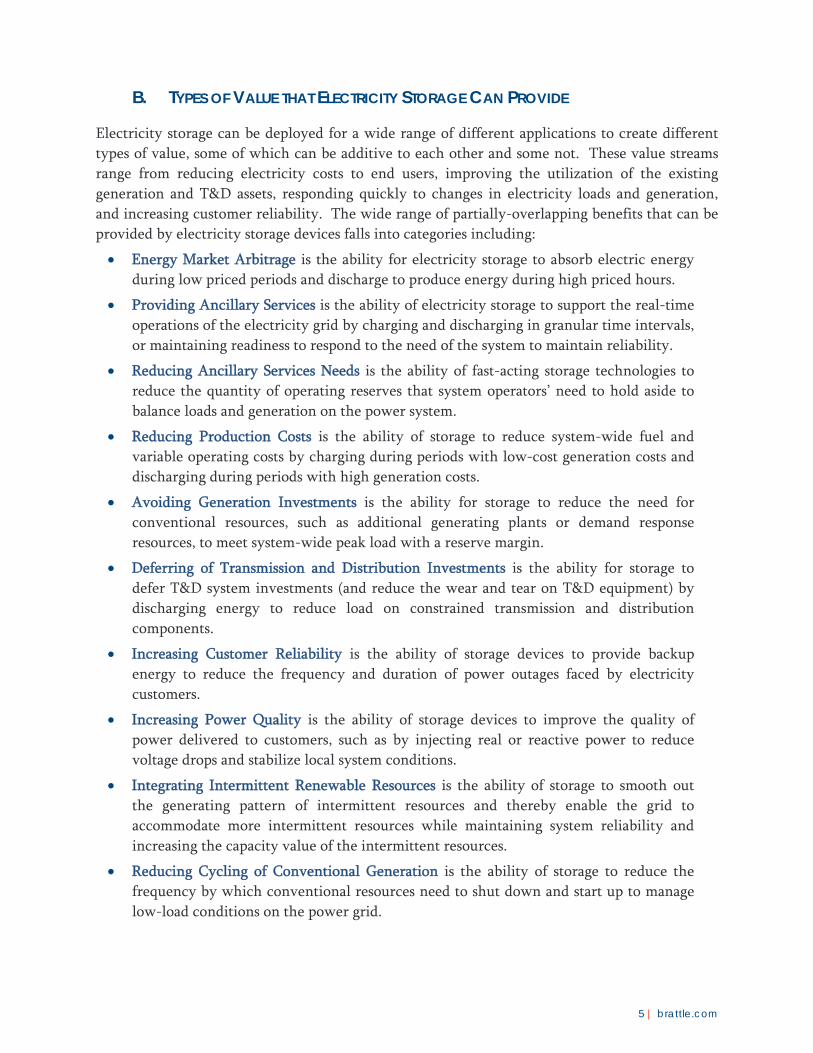
B. TYPES OF VALUE THAT ELECTRICITY STORAGE CAN PROVIDE
Electricity storage can be deployed for a wide range of different applications to create different
types of value, some of which can be additive to each other and some not. These value streams
range from reducing electricity costs to end users, improving the utilization of the existing
generation and T&D assets, responding quickly to changes in electricity loads and generation,
and increasing customer reliability. The wide range of partially-overlapping benefits that can be
provided by electricity storage devices falls into categories including:
Energy Market Arbitrage is the ability for electricity storage to absorb electric energy
during low priced periods and discharge to produce energy during high priced hours.
Providing Ancillary Services is the ability of electricity storage to support the real-time
operations of the electricity grid by charging and discharging in granular time intervals,
or maintaining readiness to respond to the need of the system to maintain reliability.
Reducing Ancillary Services Needs is the ability of fast-acting storage technologies to
reduce the quantity of operating reserves that system operators’ need to hold aside to
balance loads and generation on the power system.
Reducing Production Costs is the ability of storage to reduce system-wide fuel and
variable operating costs by charging during periods with low-cost generation costs and
discharging during periods with high generation costs.
Avoiding Generation Investments is the ability for storage to reduce the need for
conventional resources, such as additional generating plants or demand response
resources, to meet system-wide peak load with a reserve margin.
Deferring of Transmission and Distribution Investments is the ability for storage to
defer T&D system investments (and reduce the wear and tear on T&D equipment) by
discharging energy to reduce load on constrained transmission and distribution
components.
Increasing Customer Reliability is the ability of storage devices to provide backup
energy to reduce the frequency and duration of power outages faced by electricity
customers.
Increasing Power Quality is the ability of storage devices to improve the quality of
power delivered to customers, such as by injecting real or reactive power to reduce
voltage drops and stabilize local system conditions.
Integrating Intermittent Renewable Resources is the ability of storage to smooth out
the generating pattern of intermittent resources and thereby enable the grid to
accommodate more intermittent resources while maintaining system reliability and
increasing the capacity value of the intermittent resources.
Reducing Cycling of Conventional Generation is the ability of storage to reduce the
frequency by which conventional resources need to shut down and start up to manage
low-load conditions on the power grid.

6 | brattle.com
Reducing Emissions is the ability for storage to reduce the operation of certain fossil
fuel-based generation and thereby reduce air emissions and other pollutants from
power plants.
Reducing Line Losses is the ability of storage devices located close to load to reduce the
energy lost in transmitting power from generating resources to load by charging during
off peak conditions (with low system losses) and discharging energy during on-peak
periods (with high system losses).
The location of the electricity storage has implications on the type of benefits and the magnitude
of the values that may be realized. Utility scale storage located on the transmission system would
naturally be capable of providing energy market arbitrage and ancillary services, integrating grid-
scale renewables, and deferring specific transmission investments, among others. Deploying
storage throughout the distribution system may allow for capturing more value because
distributed storage can potentially perform all of the functions that utility-scale storage performs,
while also deferring distribution upgrades, improving distribution reliability, and reducing line
losses. We focus on estimating the value of this type of distributed storage in this study. In
Section III, we estimate the value of four types of benefits: energy arbitrage and associated
production cost savings, providing ancillary services, reducing generation investment needs, and
deferring T&D investments. We also briefly discuss other storage-related benefits for which we
have not yet estimated a value.
II. Prior Analyses Estimating the Value of Electricity Storage
Several prior studies have analyzed a range of potential economic benefits associated with
electricity storage. The benefits analyzed include energy arbitrage, ancillary services, avoided
generation and demand-side capacity investments, T&D improvements and deferral, improving
grid reliability, and integrating renewables.
A. SUMMARY OF VALUATION APPROACHES
Several of the recent studies have been prepared by Sandia National Laboratories (Sandia) as a
part of the Department of Energy Storage System Program.10 Other studies, such as the recent
study conducted by Southern California Edison (SCE) or the study commissioned by the
California Public Utility Commission (CPUC), focus on the potential benefits of adding storage to
a specific electricity system.11 Most of these prior studies concluded that even with a wide range
of economic benefits, the costs of electricity storage were too high compared to the then-current
investment costs. In addition, though several studies identified and quantified the likely range of
economic benefits associated with electricity storage, because grid-based electricity storage is not
yet a cost-effective investment (except under certain limited market conditions), the studies have
10 For example, see Sandia (2010).
11 For example, see Kaun and Chen (2013).
7 | brattle.com
not “packaged together” all of the benefits in such a way that investors could monetize the
benefits and build a robust business model at a significant scale that would yield a return
commensurate with the associated costs and risks.
Almost all prior studies that examine the economic benefits of electricity storage consider that
electricity storage installed on the distribution system can improve distribution reliability and
defer future investments. The studies that discussed distribution-related benefits include Sandia
(2009), Gyuk (2003), and SCE (2011). They explain that if installed downstream of a distribution
system failure, electricity storage can avoid customer outages. Outages, whether planned or
unplanned, can be avoided by discharging the battery to serve the load that would otherwise
have lost power during the outage. The outage reduction benefit is then calculated by
multiplying the value of lost load (VOLL) with the MWh-size of outages avoided. SCE (2011)
and other studies point out that benefit estimates depend heavily on the VOLL, which varies
widely across customer types.12
Some prior studies also explain that storage can defer large and infrequent distribution system
upgrades. For example, an expensive distribution system upgrade to handle load growth, which
will be needed only for a few hours of the year, can be deferred by installing a battery. By
discharging at periods of peak demand, the battery is able to reduce peak load and thereby
increase the capability of the existing distribution system. In a few of the studies we reviewed,
the batteries are sized to defer the upgrade one or two years, with the savings from T&D deferral
estimated based on the levelized cost of the T&D upgrade multiplied by the number of deferral
years.13
While many of these studies discuss, in a general manner, that a deployment strategy should aim
to maximize value (for example by deploying for energy arbitrage or T&D deferral value), almost
all of them stop short of conducting a more detailed examination of where and how in the T&D
systems storage can be used most effectively, considering specific system configurations and load
growth patterns. One exception is a SCE (2011) study that evaluated the benefits of deploying
storage at different locations on SCE’s transmission and distribution system, including near
generation locations, end-user sites, and various points within the T&D system. A Sandia report
(2009) describes the type of transmission and distribution costs that can be deferred when an
existing transmission network is constrained to serve “load pockets” (where the load is greater
than the amount of transmission needed to transfer lower-cost energy from outside of the load
center) and when distribution substations are or will become overloaded due to load growth.14
Energy arbitrage is another of the primary storage values most commonly analyzed in prior
studies. For example, Byrne and Silva-Monroy (2012), Denholm, et al. (2013) and Kinter-Meyer,
et al. (2013) analyzed the impact of using electricity storage on wholesale markets. They
12 See SCE (2011), p. 47.
13 See Sandia (2009, 2010), Energy Storage Association (2014), and EPRI (2010).
14 See Sandia (2009).
8 | brattle.com
simulated the use of electricity storage in the ERCOT, CAISO, MISO, and NYISO markets by
conducting wholesale market simulations and estimating the revenues that the storage
operator/owner would receive from the wholesale markets by charging the storage during low-
priced hours, producing energy in the high-priced hours, and providing ancillary services such as
frequency regulation.
Some studies explain the differentiating factors across different storage technologies and discuss
the strengths, weaknesses, and suitability of certain technologies to certain grid-based
applications.15 Sandia (2010) categorizes applications into either providing power (MW) or
energy (MWh). Power applications (such as providing frequency regulation) require the
technologies that are able to inject and absorb large amounts of power for a short period of time
(e.g., flywheel storage). Energy applications (such as price arbitrage) require technologies that
are able to hold and discharge large amounts of energy over a longer period of time (e.g., traditionally provided by pumped-hydro storage and more recently, by compressed air storage).16
Most of the studies we reviewed do not “add up” all of the different types of potential benefits
due to concerns that some of the benefits cannot be realized simultaneously. Sandia (2010) notes
that, while a grid-based battery can provide both frequency regulation and electricity time
shifting (energy arbitrage and T&D deferral), operational constraints will limit the extent to
which both services can be provided simultaneously.17 For instance, as recognized in our study,
while storage can often provide regulation while either charging or discharging, it cannot
provide regulation up if it is already discharging at its maximum rate. To provide regulation up
while producing energy, the storage may need to set aside some discharging capability and limit
the amount of energy it can produce simultaneously. The same is true for absorbing energy and
providing regulation down. By not “adding up” the values associated with electricity time
shifting and frequency regulation, the authors of the Sandia report avoid overstating the benefits
of electricity storage.18
Nevertheless, at least some of the individual value streams can be realized simultaneously and
therefore “added up.” In that regard, some studies have noted that when storage is deployed a
certain way or at a certain location, many of the benefits can be realized simultaneously. For
example, the Sandia (2010) study states that using batteries to decrease peak load can
simultaneously defer both T&D and generation investments.19 According to the authors of that
15 There are a variety of technologies that are classified as energy storage, including: pumped-hydro;
solid state batteries which use electrochemical reactions to store energy; flow batteries where energy
is stored in electrolyte solution; flywheels, which store energy as rotational energy; and compressed
air storage, which uses a compressor and the compressed air is converted back to energy typically
through a combustion turbine. For example see, Sandia (2010), p. 11–12 and Carnegie et al. (2013).
16 See Sandia (2010), p. 21–22.
17 See Sandia (2010), p. 124.
18 See Sandia (2010), p. 124.
19 See Sandia (2010).
9 | brattle.com
report, by discharging during peak hours (as the storage devices would already do to maximize
the value of energy arbitrage), the storage will naturally tend to help defer some T&D and
generation investments.20
We describe three of the most detailed and comprehensive studies by SCE (2011), Sandia (2010),
and the Electric Power Research Institute (EPRI) (2010) in more detail below.
The SCE study identifies 20 operational uses for electricity storage and organizes these as
“building blocks” to provide “practical applications.”21 Examples of these applications include:
off-to-on peak intermittent energy shifting and firming; on-peak intermittent energy smoothing
and shaping; ancillary services provision; black start provision; transmission infrastructure;
distribution infrastructure; transportable distribution-level load mitigation; peak load shifting
down-stream of distribution system; variable distributed generation integration; end-user time-
of-use optimization; uninterruptable power supply; and micro grid formation.22 The SCE study
also includes estimates of the benefit-to-cost ratios of each application and how much the costs of
the storage must decrease and/or the values must increase to achieve benefits-to-cost ratios
greater than 1.0.23
The SCE study finds that the ability of storage to provide energy during peak times increases the
system’s peak generating capability as well as providing other related benefits. Accordingly, the
SCE study finds the peak serving capability as the most cost-effective application by creating
multiple simultaneous value streams including energy arbitrage, smoothing of renewable output,
reducing outages, and deferring T&D upgrades.24 The authors of the SCE study state that the
storage benefits when deployed on the T&D system can be very large, but the opportunities to
take advantage of them may be limited and highly subject to individual circumstances because
the T&D system upgrade costs can vary dramatically, even across different locations within a
single system.25
Examining a wide spectrum of the value proposition, the Sandia (2010) report is one of the most
in-depth analyses of the range of benefits of energy storage. The study identifies 26 types of
benefits and estimates the economic value of each. Similar to the SCE study, the Sandia (2010)
report identifies which of the potential benefits may be achieved simultaneously. Specifically,
they find that T&D deferral, energy time shifting (which also helps integrate intermittent
renewable energy by smoothing its generation), and avoided capacity investment can be
captured simultaneously. However, the report states that these benefits cannot easily be
20 See Akhil, et al. (2013), p. 116.
21 See SCE (2011).
22 See SCE (2011), Figure 5.
23 See SCE (2011), pp. 36–61.
24 See SCE (2011), p. 9.
25 See SCE (2011), p. 8.
10 | brattle.com
combined with obtaining the full benefits of improving system reliability. As we recognize in
our analysis, this is because a storage device that is fully discharged after reducing peak load
conditions would no longer be able to supply customers during a transmission or distribution
system outage.26 As a result, storage that is used to participate in energy markets and to reduce
peak loads in order to defer T&D upgrades will be able to provide only a portion of the full
outage-related value.
While Sandia (2010) provides a theoretical and methodological foundation for estimating various
types of benefits associated with electricity storage, the authors do not make conclusions about
what costs, when compared to the magnitudes of the benefits, would yield financially-viable
storage investments.
In another study conducted by EPRI (2010), the authors estimated the present values of
deploying electricity storage for T&D support applications to be approximately $500 per kWh of
storage. The T&D applications analyzed by the authors included the ability for storage to
simultaneously improve system reliability, provide generating capacity during peak, and support
distribution systems. The same EPRI report states that if the same storage facilities can provide
frequency regulation, generating capacity, and defer transmission investment, the present value
of benefits would be in the range of $1,228–2,755 per kWh.27 The study also estimates some of
the benefits (such as deferred transmission investment, arbitrage, and selling ancillary services)
separately for an “average” system as well as in different independent system operator (ISO)
regions, which gives the study more regional granularity than most others and enables reviewing
where storage would be most valuable. With such high benefits estimates, it is one of the few
studies to imply that energy storage could be economical at then-current capital costs. However,
that EPRI study calculated these values individually and did not address the potentially
associated operational issues that would likely arise by “adding up” all the benefits.
One important theme from these studies is that because there are many different beneficiaries to
electricity storage deployment, it would be difficult to coordinate the stakeholders to capture the
bulk of the benefits in such a way that the overall benefits would exceed the costs to yield
financially viable projects. Several studies have stated that investment in electricity storage has
been hindered by the inability to simultaneously involve all stakeholders to cooperate in ways
that allow all storage-related benefits to be captured.28 For instance, Sandia (2010) notes that
storage benefits “tend to be difficult to aggregate in practice because, for example, different
benefits accruing to several stakeholders must be coordinated for a given value proposition to be
financially attractive and operationally viable.”29 We address this specific challenge in Sections V
and VI of our report.
26 See Sandia (2010), p. 124.
27 See EPRI (2010).
28 See Hoffman, et al. (2010), Sandia (2010), Kaun and Chen (2013), and Akhil, et al. (2013).
29 See Sandia (2010), p. 123.

11 | brattle.com
B. ESTIMATED VALUE OF ELECTRICITY STORAGE IN PRIOR STUDIES
The estimated benefits associated with electricity storage have ranged widely across many
studies, even within individual categories of benefits, as summarized in Table 1. Some studies
quantified the values in terms of dollars per kW of a storage device’s generating capability,
similar to the method used to evaluate the financial viability of generators, while others estimate
benefits on an annualized $/kW-year or express benefits per kWh of storage.
The wide discrepancy in analytical assumptions and the resulting wide ranges of estimated value
estimates make the comparison of the findings less meaningful than had the metrics been
entirely consistent. Nevertheless, these study results provide helpful reference points. Estimated
benefits range over an enormous span from $5/kW of storage for providing voltage support to
$6,400 per kW of storage for deferring T&D upgrades. A smaller number of studies estimate the
range of annualized benefits from $20/kW-year to $130/kW-year of storage. Many of these
studies analyze only one type of benefit, which accounts for some of the discrepancies. Table 1
below summarizes the wide range of storage benefits estimated in various prior studies we have
reviewed.
As shown in Table 1, Kaun and Chen (2013) found that the breakeven cost for energy storage
ranged from $1,000 to $4,000 per kW of storage (with battery lives of 5, 7, and 10 years), which
includes all societal benefits (not just the benefits that can be captured by the storage owners).30
Sandia (2010) estimated the benefits of storage to be ranging from $31/kW to $3,000/kW over a
ten year period.31 Since the authors did not explicitly combine their value estimates, they do not
produce an estimate of the maximum value of storage per MW of battery as we do in this study
(although they do suggest that numerous benefits might be achievable simultaneously).
Denholm, et al. (2013) estimated the energy and reserve values of a 100 MW storage device
installed in Colorado to be approximately $128/kW-year for a battery that could provide reserves
while it was charging and $115/kW-year if it could not.32 They also compiled a list of other
studies’ estimates on the value of energy storage in numerous U.S. electricity markets (none of
which specifically studied ERCOT), with values ranging from $29/kW to $429/kW.33 Kinter-
Meyer, et al. (2013) estimated that the annual energy arbitrage values from storage in ERCOT
range from $101 to 116/kW-year. The authors concluded that electricity storage focused solely
on arbitrage was not viable in ERCOT, given the current cost of storage.34
30 Note that storage benefit values are reported as they appear in the study. A few are in $/kW and most
are in $/kW-year. See Kaun and Chen (2013), p. v.
31 See Sandia (2010), p. xix.
32 See Denholm, et al. (2013), p. 32.
33 See Denholm, et al. (2013), p. 3.
34 See Kinter-Meyer, et al. (2013), Table 8.8.

12 | brattle.com
Table 1 Storage Benefits Estimated in Other Studies
Note: *Compiled in Denholm, et al. (2013), Table 2‐1.
Type of Benefits Study Value in $/kW Value in $/kW‐yr
Ancillary Services
Load Following Sandia (2010) $785–$2,010
Area Regulation Sandia (2010) $600–$1,000
Regulation EPRI (2010) $255–$426
Regulation Denholm and Letendre (2007) $236–$429*
Regulation Walawalkar, et al. (2007) $163–$248*
Regulation Byrne and Silva‐Monroy (2012) $117–$161*
Operating Reserves Sandia (2010) $57–$225
Spinning Reserves EPRI (2010) $80–$220
Contingency Reserves Denholm and Letendre (2007) $66–$149*
Voltage Support Sandia (2010) $400
Voltage Support EPRI (2010) $9–$24
VAR Support EPRI (2010) $4–$17
Ancillary Services Denholm, et al. (2013) $115–$128
Arbitrage
Retail Time‐of‐Use Energy Charges Sandia (2010) $1,226
Retail Time‐of‐Use Energy Charges EPRI (2010) $1,508–$3,258
Energy Arbitrage Sandia (2010) $400–$700
Energy Arbitrage EPRI (2010) $134–$800
Energy Arbitrage Sandia (2004) $49Energy Arbitrage Kirby (2012) $46*
Energy Arbitrage Figueiredo, et al. (2006) $37–$45*
Energy Arbitrage Walawalkar, et al. (2007) $29–$240*
Energy Arbitrage Byrne and Silva‐Monroy (2012) $25–$41*
Energy Arbitrage Kinter‐Meyer, et al. (2013) $101–$116
Energy Arbitrage Sioshansi, et. al. (2009) $60–$110
Energy Arbitrage Jenkin and Weiss (2005) $50–$75
Production Cost Savings Denholm, et al. (2013) $23–$75
Capacity
Avoided Capacity Investment Sandia (2010) $359–$710
Avoided Capacity Investment EPRI (2010) $88–$726
Retail Demand Charges EPRI (2010) $710–$5,049
Retail Demand Charges Sandia (2010) $582
Renewables
Renewables Capacity Firming Sandia (2010) $709–$915
Wind Integration, Short Duration Sandia (2010) $500–$1,000
Wind Integration, Long Duration Sandia (2010) $100–$782
Renewable Energy Integration EPRI (2010) $104–$1,866
Renewables Energy Time‐shift Sandia (2010) $233–$389
T&D
T&D Upgrade Deferral EPRI (2010) $1,242–$6,444
T&D Upgrade Deferral 90th Percentile Sandia (2010) $759–$1,079
T&D Upgrade Deferral 50th Percentile Sandia (2010) $481–$687
Transmission Support Sandia (2010) $192
Transmission Congestion Relief EPRI (2010) $114–$2,208
Transmission Congestion Relief Sandia (2010) $31–$141
Substation On‐Site Power Sandia (2010) $1,800–$3,000
Electric Reliability and Power Quality Sandia (2010) $359–$978
Power Reliability EPRI (2010) $47–$537
Power Quality EPRI (2010) $19–$571
Multiple Benefits
Arbitrage and Contingency Reserves Drury, et al. (2011) $38–$180*
Arbitrage and Regulation Kirby (2012) $62–$75*
T&D, Capacity, Arbitrage, A/S Kaun and Chen (2013) $1,000–$4,000
13 | brattle.com
III. Analytical Approach to Estimating Storage Costs and Benefits
In this section, we describe our analytical approach to estimating the costs and benefits of
deploying storage throughout the ERCOT distribution systems and dispatching it into the
ERCOT wholesale power markets. We show various projections of the expected reduction in
storage costs—consistent with the installed cost of $350/kWh that we use in our study—and
describe our financing assumptions for translating these costs into levelized annual costs. We
then describe our analytical approach to estimating the wholesale power market value streams of
storage, including avoided production costs and avoided capacity investments, as well as
distribution system value streams such as deferred T&D costs and avoided outages experienced
by end-use electricity customers. These value streams are generally additive as we analyze them,
with some types of value quantified differently, depending on the benefits perspective taken.
A. STORAGE COSTS
Historically, the costs of storage have been prohibitively high for many applications, but recent
trends and current projections indicate substantial cost reductions that will make storage more
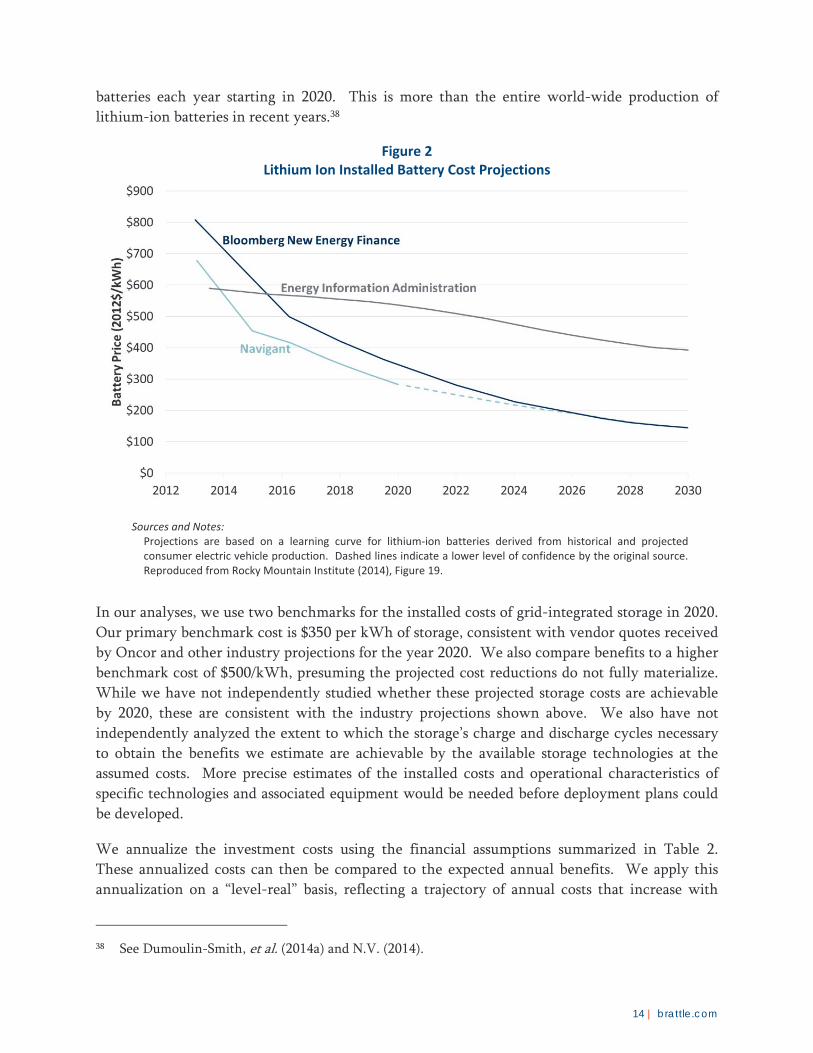
economically attractive in the near future. As illustrated in Figure 2, current projections indicate
that lithium-ion battery costs will decline from the current $700–$3,000 per kWh of installed
electricity storage in 2014 to less than half of that over the next three years.35,36 Two other
projections, from Morgan Stanley and UBS analysts, point to even more significant cost
reductions, forecasting battery-only costs of $125–$150/kWh in the near future, which would
likely correspond to total installed costs of somewhat below $350/kWh by 2020.37
A primary driver of declining costs is the large scale and technological improvements expected
with electric vehicle (EV) development and deployment, particularly by Tesla Motors. Tesla is
currently constructing a “Gigafactory,” which will have the capacity to manufacture 35 GWh of
35 Many storage developers quote costs on a per kWh or MWh basis. This represents the capital cost in
terms of how much energy it can store, as opposed to the maximum instantaneous power output that
would be quoted in kW terms. For example, a 300 kWh device at $350/kWh would have a capital
cost of $105,000. The capacity that it can output instantaneously depends on the energy to power (or
kWh:kW) ratio of the device, which we assume to be 3:1 in our study. That means, the 300 kWh
device would be capable of outputting a maximum of 100 kW for three hours continuously.
36 Navigant notes that current storage costs for a four-hour battery are $720–$2,800/kWh depending on
the scale of the battery. According to Sam Jaffe of Navigant Research, battery-only costs are currently
around $500–700/kWh with the remaining installation costs due to system costs. Also see Dumoulin-
Smith, et al. (2014a), p. 1.
37 The $350/kWh projection of the installed cost of a battery system is based on Oncor’s discussions with
vendors, consistent with industry sources. For example, Morgan Stanley and UBS predict that
battery-only costs may reach $125–$150/kWh in the near future, down from the $500/kWh currently,
see Byrd, et al. (2014), p. 40, and Dumoulin-Smith, et al. (2014a). See also Jaffe (2014), p. 30.
14 | brattle.com
batteries each year starting in 2020. This is more than the entire world-wide production of
lithium-ion batteries in recent years.38
Figure 2 Lithium Ion Installed Battery Cost Projections
Sources and Notes: Projections are based on a learning curve for lithium‐ion batteries derived from historical and projected consumer electric vehicle production. Dashed lines indicate a lower level of confidence by the original source. Reproduced from Rocky Mountain Institute (2014), Figure 19.
In our analyses, we use two benchmarks for the installed costs of grid-integrated storage in 2020.
Our primary benchmark cost is $350 per kWh of storage, consistent with vendor quotes received
by Oncor and other industry projections for the year 2020. We also compare benefits to a higher
benchmark cost of $500/kWh, presuming the projected cost reductions do not fully materialize.
While we have not independently studied whether these projected storage costs are achievable
by 2020, these are consistent with the industry projections shown above. We also have not
independently analyzed the extent to which the storage’s charge and discharge cycles necessary
to obtain the benefits we estimate are achievable by the available storage technologies at the
assumed costs. More precise estimates of the installed costs and operational characteristics of
specific technologies and associated equipment would be needed before deployment plans could
be developed.
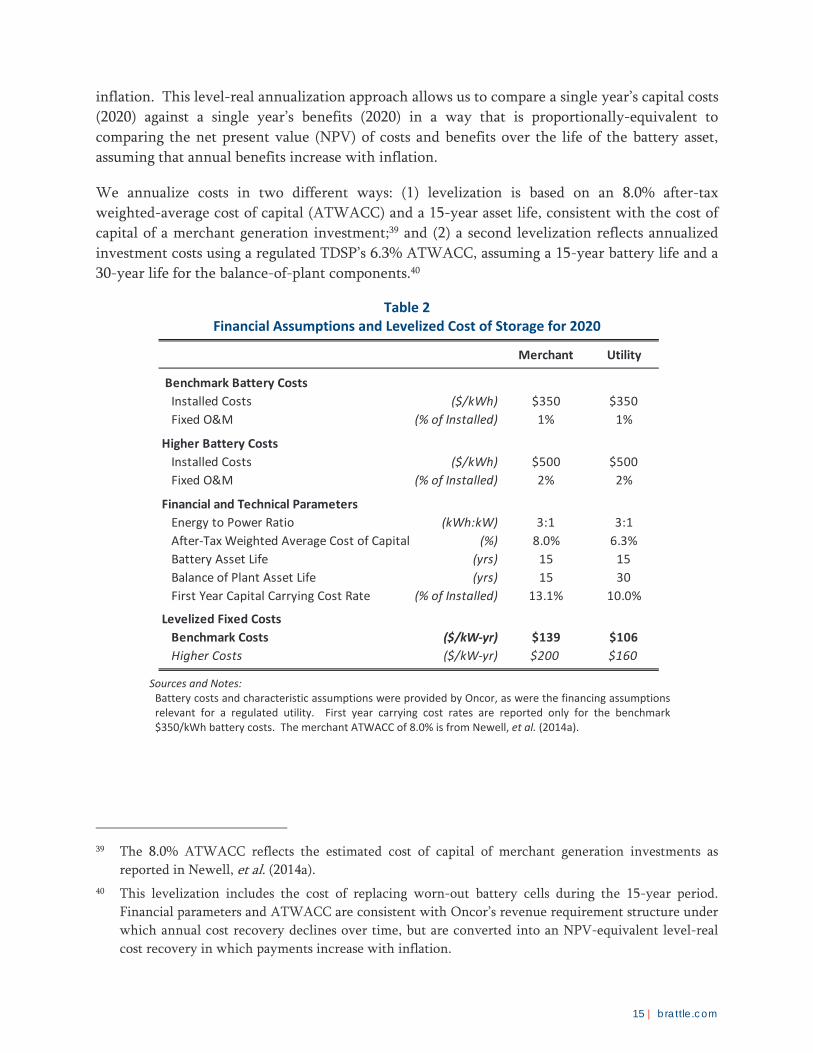
We annualize the investment costs using the financial assumptions summarized in Table 2.
These annualized costs can then be compared to the expected annual benefits. We apply this
annualization on a “level-real” basis, reflecting a trajectory of annual costs that increase with
38 See Dumoulin-Smith, et al. (2014a) and N.V. (2014).
15 | brattle.com
inflation. This level-real annualization approach allows us to compare a single year’s capital costs
(2020) against a single year’s benefits (2020) in a way that is proportionally-equivalent to
comparing the net present value (NPV) of costs and benefits over the life of the battery asset,
assuming that annual benefits increase with inflation.
We annualize costs in two different ways: (1) levelization is based on an 8.0% after-tax
weighted-average cost of capital (ATWACC) and a 15-year asset life, consistent with the cost of
capital of a merchant generation investment;39 and (2) a second levelization reflects annualized
investment costs using a regulated TDSP’s 6.3% ATWACC, assuming a 15-year battery life and a
30-year life for the balance-of-plant components.40
Table 2 Financial Assumptions and Levelized Cost of Storage for 2020
Sources and Notes: Battery costs and characteristic assumptions were provided by Oncor, as were the financing assumptions relevant for a regulated utility. First year carrying cost rates are reported only for the benchmark $350/kWh battery costs. The merchant ATWACC of 8.0% is from Newell, et al. (2014a).
39 The 8.0% ATWACC reflects the estimated cost of capital of merchant generation investments as
reported in Newell, et al. (2014a).
40 This levelization includes the cost of replacing worn-out battery cells during the 15-year period.
Financial parameters and ATWACC are consistent with Oncor’s revenue requirement structure under
which annual cost recovery declines over time, but are converted into an NPV-equivalent level-real
cost recovery in which payments increase with inflation.
Merchant Utility
Benchmark Battery Costs
Installed Costs ($/kWh) $350 $350
Fixed O&M (% of Installed) 1% 1%
Higher Battery Costs
Installed Costs ($/kWh) $500 $500
Fixed O&M (% of Installed) 2% 2%
Financial and Technical Parameters
Energy to Power Ratio (kWh:kW) 3:1 3:1
After‐Tax Weighted Average Cost of Capital (%) 8.0% 6.3%
Battery Asset Life (yrs) 15 15
Balance of Plant Asset Life (yrs) 15 30
First Year Capital Carrying Cost Rate (% of Installed) 13.1% 10.0%
Levelized Fixed Costs
Benchmark Costs ($/kW‐yr) $139 $106
Higher Costs ($/kW‐yr) $200 $160
16 | brattle.com
B. WHOLESALE POWER MARKET VALUES OF STORAGE
We discuss the various business models for electricity storage in Texas and the regulatory
framework necessary to enable those business models in Section VI. For the purpose of
evaluating and aggregating the values of storage, we assume that grid-integrated storage assets are
allowed to be dispatched into the wholesale ERCOT energy and ancillary services markets. We
simulate the storage assets’ participation in these wholesale markets under 2020 market
conditions and under varying levels of storage penetration. We then estimate the impact of
adding storage on wholesale prices, customer costs, storage asset operating margins, investments
in new conventional generation, and system-wide production costs.
1. Overview of ERCOT Energy-Only Market Modeling Approach
As the basis for estimating each of the value streams stemming from storage participation in the
wholesale power markets, we conduct market simulations to estimate how storage would
participate in the market and how it would impact the market and market participants.41 We
conduct this simulation using the Polaris Systems Optimization (PSO) model. Key inputs and
simulation parameters include fuel prices, ERCOT’s scarcity pricing mechanisms, ERCOT
generation mix, and load shapes reflecting a range of weather conditions. We first simulated a
historical year (2012) to calibrate the model and then simulated 2020 under equilibrium market
conditions for different levels of storage deployment as discussed further below.42 We use
ERCOT’s 2014 load forecast and Capacity Demand and Reserves (CDR) report to project future
load and supply mix changes respectively, while adjusting supply appropriately to reflect
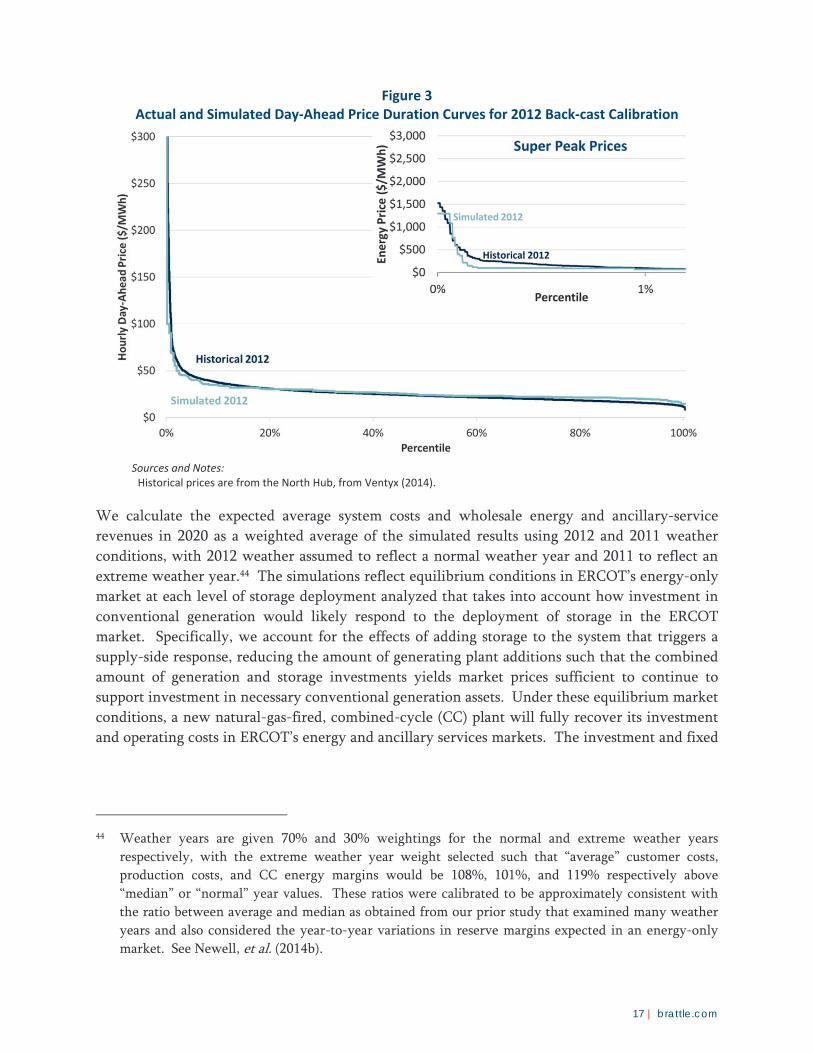
equilibrium conditions.43 Figure 3 compares the price duration curves that we realized in our
historical calibrated simulation analysis, to actual day-ahead market prices in 2012, showing a
relatively accurate reflection of prices across high, moderate, and low price hours.
41 We conduct an hourly simulation model consistent with ERCOT’s day-ahead wholesale market. We
do not attempt to estimate the potentially higher value that might be realized if storage were able to
capture additional value from the shorter-term price fluctuations and uncertainties in the ERCOT
real-time market. Our hourly market simulations also consider the ability of electricity storage to
provide ancillary services.
42 Monthly fuel prices are expressed as a basis above Powder River Basin and Houston Ship Channel
forward curves for 2020 pulled as of July 30, 2014 (plus historical basis differentials escalated with
inflation). The annual average delivered fuel prices we implemented are $2.54/mmBtu for sub-
bituminous coal, $2.77/mmBtu for bituminous coal, and $5.60/mmBtu for natural gas. Prices are based
on data from Bloomberg and Ventyx, see ERCOT (2014c) and Newell, et al. (2014b).
43 For load forecast data see ERCOT (2014b). For CDR see ERCOT (2014c).
17 | brattle.com
Figure 3 Actual and Simulated Day‐Ahead Price Duration Curves for 2012 Back‐cast Calibration
Sources and Notes: Historical prices are from the North Hub, from Ventyx (2014).
We calculate the expected average system costs and wholesale energy and ancillary-service
revenues in 2020 as a weighted average of the simulated results using 2012 and 2011 weather
conditions, with 2012 weather assumed to reflect a normal weather year and 2011 to reflect an
extreme weather year.44 The simulations reflect equilibrium conditions in ERCOT’s energy-only
market at each level of storage deployment analyzed that takes into account how investment in
conventional generation would likely respond to the deployment of storage in the ERCOT
market. Specifically, we account for the effects of adding storage to the system that triggers a
supply-side response, reducing the amount of generating plant additions such that the combined
amount of generation and storage investments yields market prices sufficient to continue to
support investment in necessary conventional generation assets. Under these equilibrium market
conditions, a new natural-gas-fired, combined-cycle (CC) plant will fully recover its investment
and operating costs in ERCOT’s energy and ancillary services markets. The investment and fixed
44 Weather years are given 70% and 30% weightings for the normal and extreme weather years
respectively, with the extreme weather year weight selected such that “average” customer costs,
production costs, and CC energy margins would be 108%, 101%, and 119% respectively above
“median” or “normal” year values. These ratios were calibrated to be approximately consistent with
the ratio between average and median as obtained from our prior study that examined many weather
years and also considered the year-to-year variations in reserve margins expected in an energy-only
market. See Newell, et al. (2014b).

18 | brattle.com
operating costs of a new CC plant are estimated to be equal to a levelized cost of new entry
(CONE) of $149/kW-year.45
Figure 4 below shows our estimate of the total installed ERCOT generating capacity at different
levels of storage deployment. The chart shows that in the 2020 Base Case scenario (without any
storage), 5,500 MW of net generation additions will be needed between 2014 and 2020 to meet
2020 peak loads (with additional generation additions needed to replace any potential
retirements). The chart also shows the estimated levels of generation investment under different
levels of storage deployment. At these generation investment levels, ERCOT market prices
would remain at a level sufficient to fully support cost recovery of the necessary generation
additions. As also shown, each MW of storage displaces less than one MW of conventional
generation.
Figure 4 Capacity Investments in ERCOT
Sources and Notes:
Year 2014 installed capacity from ERCOT (2014c). Capacity additions from new conventional generation report the net additions that we estimate would be added into the ERCOT market under our simulation modeling for the year 2020. Under the no‐storage case we estimate 5,500 net additions would be needed (or 6,300 MW of gross additions once considering the more than 800 MW of retirements reported in the CDR, which are not explicitly shown in the chart. Actual retirements may significantly exceed the 800 MW already reported in the CDR)
Deploying 1,000 MW of storage in ERCOT would displace approximately 900 MW of
conventional generation; deploying 5,000 MW of storage would reduce new generation
45 Our study assumptions are adapted from a CONE study for PJM with necessary adjustments for
ERCOT, see Newell, et al. (2012) and Spees, et al. (2011). Updated estimates apply escalation rates
derived from Newell, et al. (2013).

19 | brattle.com
investment needs by approximately 3,100 MW. This means that at the 5,000 MW storage
deployment level, 2,400 MW of generation investments would be needed just to meet load
growth. Additional new generation would be required to replace retirements, which are not
reflected in the chart. The 2014 ERCOT CDR projects an additional 840 MW of retirements by
2020, while the ERCOT Long-Term System Assessment projects 7,600 MW of coal and gas steam
retirements by 2029 in its Base Case scenario or upwards of 20,000 MW of total retirements in its
2029 stringent environmental scenario.46
It is important to note that in both cases, with and without storage, new generation investment
will be forthcoming only if the operating margins earned in ERCOT’s energy and ancillary
services markets are sufficient to support the investment. Our simulations show that, once we
account for investment response (e.g., recognizing that 3,100 MW of less new generation would
be built in response to deploying 5,000 MW of storage), the remaining generation investments
and the existing generation will be equally profitable with or without storage deployment. If
that were not the case, market participants would respond by further reducing generation
investment until such equilibrium is approximately reached. From a societal perspective, the
avoided capital investments from conventional capacity additions represent a category of benefit
that offsets the total societal costs of adding storage, with the avoided capacity investments
valued at $149/kW-year.
Our analysis shows that, even at the 8,000 MW storage deployment level examined in our study,
approximately 1,600 MW of new generation investment would still be necessary by 2020 to
reach equilibrium market conditions. The ERCOT energy-only market supports new generation
investment through prices sufficient to recover the investment costs, including an adequate
return on the investment. This means that even a very large deployment of storage is not likely
to create excess supply conditions that would suppress market prices below equilibrium levels,
with related adverse consequences for existing generation suppliers. This is particularly true if
the deployment plans are publicly available and the anticipated gradual increase in storage
investments can be anticipated by generation investors. The share of traditional generation
investment need that would actually be displaced by storage may be even less than we have
estimated, because storage will be deployed gradually and the TDSPs will require many years—
likely beyond 2020—before reaching multiple thousands of MWs of storage investments.
2. Storage Dispatch into Energy and Ancillary Markets
We simulate the storage assets’ participation in the ERCOT wholesale market similarly to other
resources. Like with other generators, the PSO model optimally dispatches the storage to charge,
discharge, and provide ancillary services in a way that minimizes system-wide production costs.
Based on that market-dispatch-based schedule and the realized market prices for energy and
ancillary services, we determine the storage assets’ realized market-based costs and revenues.
46 See ERCOT (2014c) and ERCOT (2014e).
20 | brattle.com
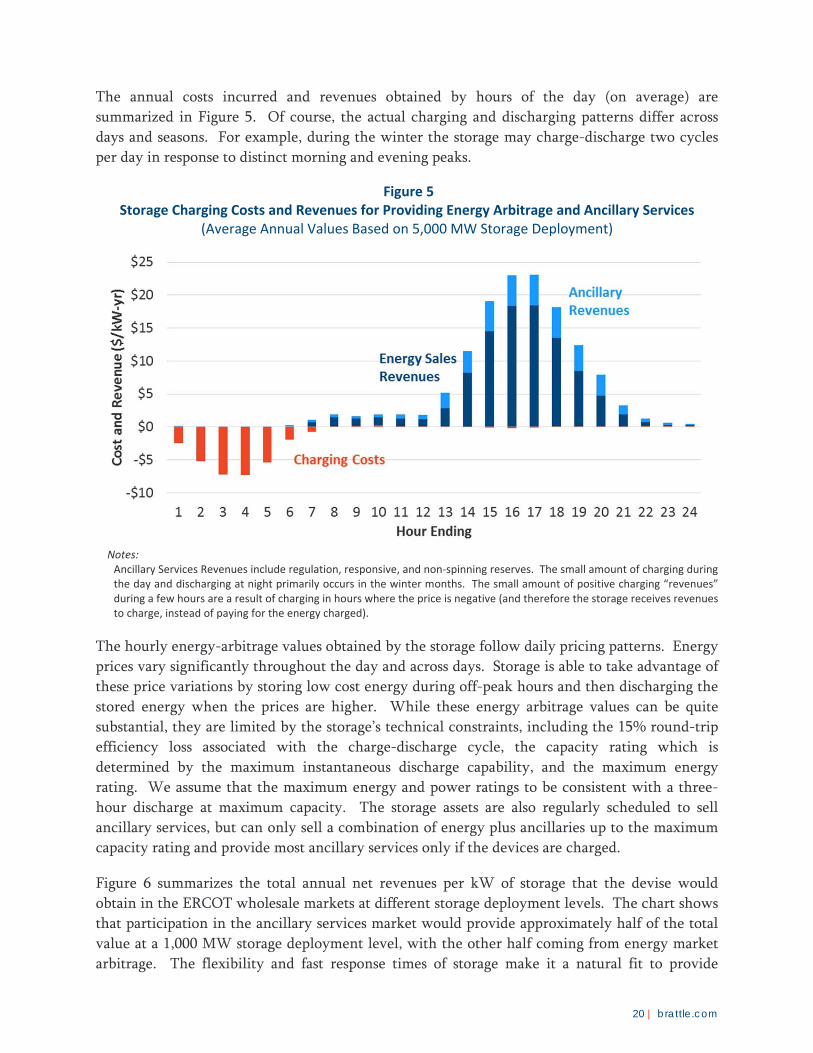
The annual costs incurred and revenues obtained by hours of the day (on average) are
summarized in Figure 5. Of course, the actual charging and discharging patterns differ across
days and seasons. For example, during the winter the storage may charge-discharge two cycles
per day in response to distinct morning and evening peaks.
Figure 5 Storage Charging Costs and Revenues for Providing Energy Arbitrage and Ancillary Services
(Average Annual Values Based on 5,000 MW Storage Deployment)
Notes: Ancillary Services Revenues include regulation, responsive, and non‐spinning reserves. The small amount of charging during the day and discharging at night primarily occurs in the winter months. The small amount of positive charging “revenues” during a few hours are a result of charging in hours where the price is negative (and therefore the storage receives revenues to charge, instead of paying for the energy charged).
The hourly energy-arbitrage values obtained by the storage follow daily pricing patterns. Energy
prices vary significantly throughout the day and across days. Storage is able to take advantage of
these price variations by storing low cost energy during off-peak hours and then discharging the
stored energy when the prices are higher. While these energy arbitrage values can be quite
substantial, they are limited by the storage’s technical constraints, including the 15% round-trip
efficiency loss associated with the charge-discharge cycle, the capacity rating which is
determined by the maximum instantaneous discharge capability, and the maximum energy
rating. We assume that the maximum energy and power ratings to be consistent with a three-
hour discharge at maximum capacity. The storage assets are also regularly scheduled to sell
ancillary services, but can only sell a combination of energy plus ancillaries up to the maximum
capacity rating and provide most ancillary services only if the devices are charged.
Figure 6 summarizes the total annual net revenues per kW of storage that the devise would
obtain in the ERCOT wholesale markets at different storage deployment levels. The chart shows
that participation in the ancillary services market would provide approximately half of the total
value at a 1,000 MW storage deployment level, with the other half coming from energy market
arbitrage. The flexibility and fast response times of storage make it a natural fit to provide
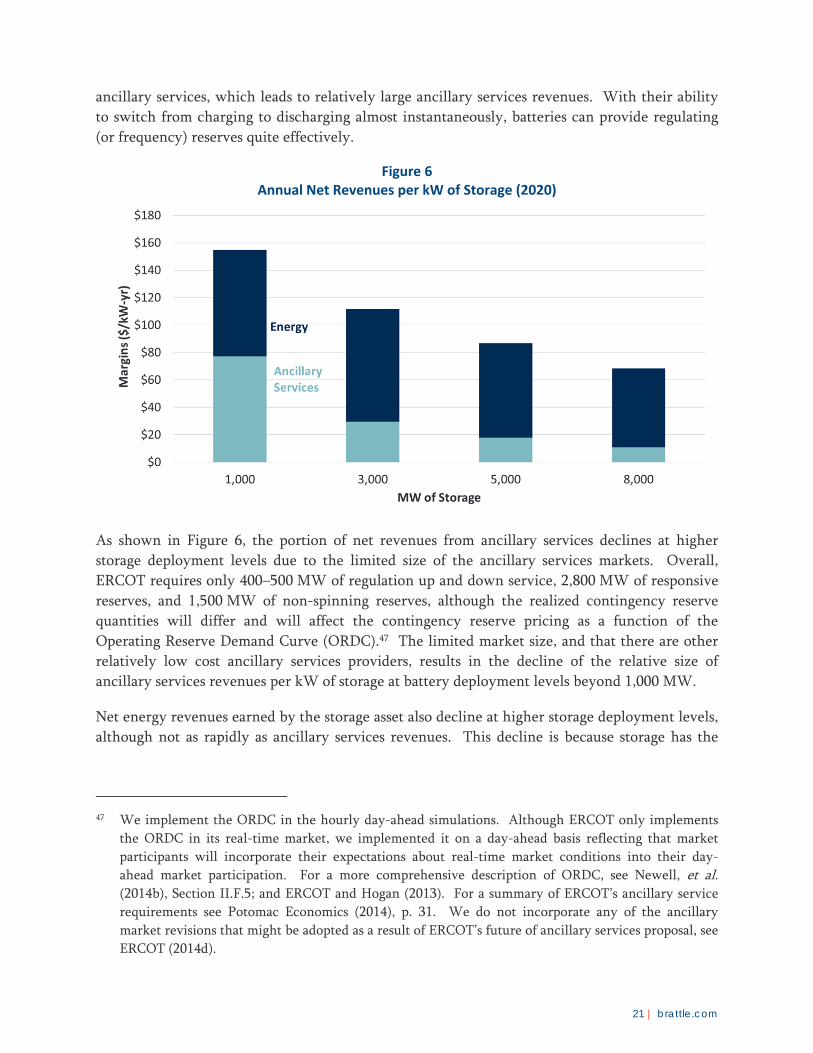
21 | brattle.com
ancillary services, which leads to relatively large ancillary services revenues. With their ability
to switch from charging to discharging almost instantaneously, batteries can provide regulating
(or frequency) reserves quite effectively.
Figure 6 Annual Net Revenues per kW of Storage (2020)
As shown in Figure 6, the portion of net revenues from ancillary services declines at higher
storage deployment levels due to the limited size of the ancillary services markets. Overall,
ERCOT requires only 400–500 MW of regulation up and down service, 2,800 MW of responsive
reserves, and 1,500 MW of non-spinning reserves, although the realized contingency reserve
quantities will differ and will affect the contingency reserve pricing as a function of the
Operating Reserve Demand Curve (ORDC).47 The limited market size, and that there are other
relatively low cost ancillary services providers, results in the decline of the relative size of
ancillary services revenues per kW of storage at battery deployment levels beyond 1,000 MW.
Net energy revenues earned by the storage asset also decline at higher storage deployment levels,
although not as rapidly as ancillary services revenues. This decline is because storage has the
47 We implement the ORDC in the hourly day-ahead simulations. Although ERCOT only implements
the ORDC in its real-time market, we implemented it on a day-ahead basis reflecting that market
participants will incorporate their expectations about real-time market conditions into their day-
ahead market participation. For a more comprehensive description of ORDC, see Newell, et al. (2014b), Section II.F.5; and ERCOT and Hogan (2013). For a summary of ERCOT’s ancillary service
requirements see Potomac Economics (2014), p. 31. We do not incorporate any of the ancillary
market revisions that might be adopted as a result of ERCOT’s future of ancillary services proposal, see
ERCOT (2014d).
22 | brattle.com
effect of reducing peak prices and increasing off-peak prices, such that increasing deployment
reduces the arbitrage opportunities.
Our analysis of storage merchant value in the ERCOT day-ahead energy and ancillary services
markets is based on a zonal representation of the market.48 Our analysis does not yet capture the
additional value that can be obtained by participating in the more volatile real-time market or
deploying in targeted locations where arbitrage values may be higher. Because price changes in
the five-minute real time market tend to exhibit more volatility, storage would be able to capture
an additional arbitrage value in the more volatile but short-lived real-time pricing events.
However, the additional charge and discharge cycles of real-time operations may negatively
impact the lifespan of the batteries, a factor that we have not yet analyzed.
Higher merchant values might be achieved by targeting storage deployments to locations with
greater arbitrage opportunities. Figure 7 below shows locational arbitrage values of storage
devices based on actual 2012 real-time market prices. This diagram provides an indication of the
range of locational differences in arbitrage values that could be realized within the ERCOT
market. At the relatively low market prices that existed in 2012, many locations in ERCOT
would have yielded only $20–50/kW in annual arbitrage revenues. In some export-constrained
regions of western Texas, however, annual revenues from arbitrage value could have been as
high as $150/kW-year. These highest-value locations in west Texas experienced very low or
sometimes negative prices during a portion of the day due to high levels of wind generation and
transmission constraints that prevented the export of that generation to the rest of ERCOT.
However, these congestion patterns have been mitigated as major new transmission lines
interconnecting western Texas with the load centers in the east were placed into service during
2013.49 As additional renewable generation is added to the system, similar congestion patterns
may reemerge over time and thereby increase the arbitrage value at certain locations.
48 We model twelve different zones with generation and load mapped into each zone, consistent with
ERCOT weather zones and major cities.
49 The effects of these transmission upgrades are reflected in our modeling, which represents the system
in year 2020.

23 | brattle.com
Figure 7 Illustrative Example of Locational Price Arbitrage Value based on 2012 Market Prices
Note:
Reflects a price‐taking dispatch simulation against historical 2012 hourly, real‐time nodal prices. Results represent a battery charging in the three lowest price hours and discharging in the three highest priced hours per day.
3. Market Price and Production Cost Impacts
Integrating a substantial amount of storage into the wholesale power markets can have a strong
impact on system-wide costs and market prices. Our simulation-based estimates of these impacts
are shown in Figure 8 below. The left chart in Figure 8 shows system-wide production cost for
the different levels of storage deployment, while the chart on the right shows load-weighted
average market prices.
From a system-wide or societal perspective, production cost savings are the relevant metric for
measuring the benefits of storage in terms of its impact on fuel costs, variable operations and
maintenance (O&M) costs, and demand response deployment costs. Storage will reduce some of
these costs by reducing the dispatch of high-cost peaking resources and increasing the dispatch of
lower-cost baseload resources. Our estimate of total production costs is shown as a solid line in
the left chart of Figure 8.
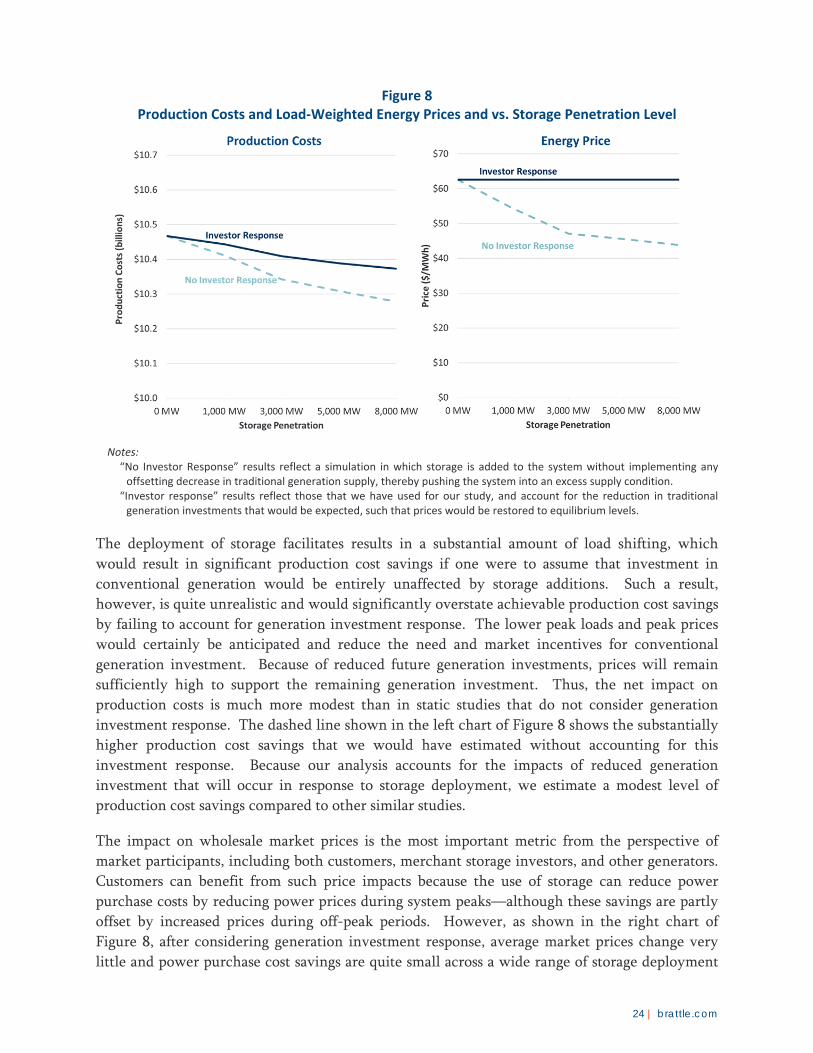
24 | brattle.com
Figure 8 Production Costs and Load‐Weighted Energy Prices and vs. Storage Penetration Level
Notes: “No Investor Response” results reflect a simulation in which storage is added to the system without implementing any
offsetting decrease in traditional generation supply, thereby pushing the system into an excess supply condition. “Investor response” results reflect those that we have used for our study, and account for the reduction in traditional
generation investments that would be expected, such that prices would be restored to equilibrium levels.
The deployment of storage facilitates results in a substantial amount of load shifting, which
would result in significant production cost savings if one were to assume that investment in
conventional generation would be entirely unaffected by storage additions. Such a result,
however, is quite unrealistic and would significantly overstate achievable production cost savings
by failing to account for generation investment response. The lower peak loads and peak prices
would certainly be anticipated and reduce the need and market incentives for conventional
generation investment. Because of reduced future generation investments, prices will remain
sufficiently high to support the remaining generation investment. Thus, the net impact on
production costs is much more modest than in static studies that do not consider generation
investment response. The dashed line shown in the left chart of Figure 8 shows the substantially
higher production cost savings that we would have estimated without accounting for this
investment response. Because our analysis accounts for the impacts of reduced generation
investment that will occur in response to storage deployment, we estimate a modest level of
production cost savings compared to other similar studies.
The impact on wholesale market prices is the most important metric from the perspective of
market participants, including both customers, merchant storage investors, and other generators.
Customers can benefit from such price impacts because the use of storage can reduce power
purchase costs by reducing power prices during system peaks—although these savings are partly
offset by increased prices during off-peak periods. However, as shown in the right chart of
Figure 8, after considering generation investment response, average market prices change very
little and power purchase cost savings are quite small across a wide range of storage deployment

25 | brattle.com
levels. Again, for illustrative purposes, we show a dashed line representing the much greater
price impact that we would have estimated without accounting for generation investment
response. By accounting for the impact of generation investment response, our simulation results
reflect a more realistic market outcome in which market prices continue to be at a high enough
level to fully support investment in necessary additional generation resources.
Figure 9 below summarizes average market prices and storage charging and discharging patterns
over the course of a day. The grey solid lines in Figure 9 show hourly market prices over the
course of a sample average day in an ERCOT system without storage and a system with 5,000
MW of storage. As expected, charging during the off peak hours slightly increases prices, while
discharging during the on peak period lowers peak prices. Interestingly, however, the reduction
in peak prices broadens and flattens the peak pricing profile; while peak prices are lower, they
are realized during more hours of the day, resulting in almost the same price on average over the
course of a day.
Figure 9 Average Energy Prices Without Storage and with 5,000 MW of Storage
Vs. Daily Charging/Discharging Patterns of 5,000 MW Storage
Notes: This graph reflects hourly average schedules and prices in each hour of day, averaged across the year.
4. Impacts on Other Generation Suppliers
One important consideration when adding a substantial quantity of storage to the power system
is the impact those additions might have on other generation suppliers. This is of particular
concern to ERCOT’s energy-only market and its ability to maintain sufficient incentives to
attract necessary investments in conventional generating resources. Existing generation
suppliers will have an interest in whether storage additions will materially affect the value of

26 | brattle.com
their assets. From a public policy perspective, it is important to ensure that developing storage
will not inefficiently distort energy markets, undermine investment incentives, or create
regulatory uncertainties.
The primary worry, for both policy-makers and generation suppliers, might be that adding a
large quantity of storage could create excess supply that would artificially suppress market prices.
While we share these concerns, our analysis shows that a substantial quantity of storage can be
developed in ERCOT without creating these problems and introducing such distortions. This
would require storage additions to be anticipated by market participants and phased in over a
sufficiently long period such that these additions will not fully replace the need for new
generation capacity. Doing so will avoid excess supply conditions in which prices would be
suppressed below the levels needed to attract new generation investments.
As we explained in Section III.B.1, even deploying 8,000 MW of storage in ERCOT by 2020
would not displace all of the necessary new generation additions. A deployment level of 3,000 to
5,000 MW would represent even less risk. While some developers of new generating plants
would be unable to proceed with the development of their projects during this time period,
prices would nevertheless need to remain high enough to attract the necessary generation
resources. Therefore, the net revenues for efficient existing and new generating plants would
remain approximately the same with and without storage.
Despite the net revenues of efficient new and existing generating plants remaining
approximately the same once generation investment response is taken into consideration, adding
storage to the ERCOT system would change the profile over which these revenues are earned.
This impact is shown in Figure 10 and Figure 11 below for deploying 5,000 MW of storage on the
ERCOT system. The first chart shows the differences in price duration curves over the year for
our market simulations with and without storage. Similar to the results presented above, this
price duration curve shows that off-peak and non-scarcity on-peak prices would increase, while
frequency and magnitude of extreme scarcity prices would decline. Generation suppliers would
benefit from a slight increase in price stability, while enjoying very similar average prices and
anticipated operating margins in aggregate across the year.
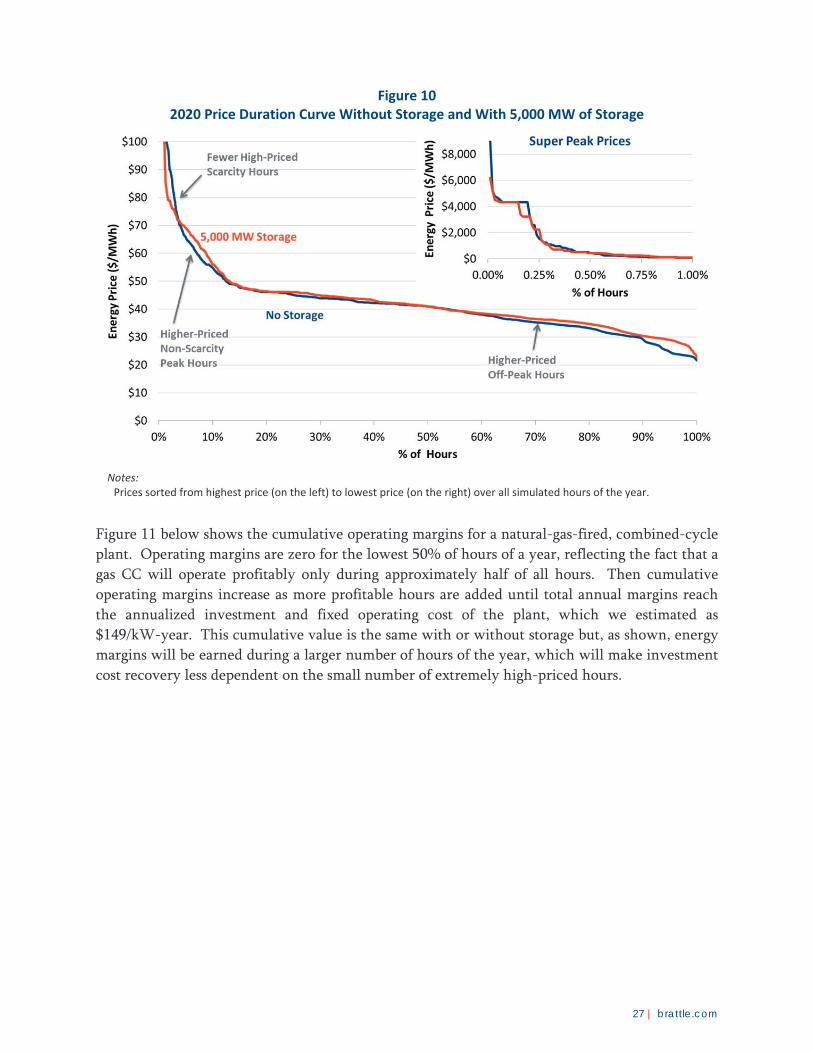
27 | brattle.com
Figure 10 2020 Price Duration Curve Without Storage and With 5,000 MW of Storage
Notes: Prices sorted from highest price (on the left) to lowest price (on the right) over all simulated hours of the year.
Figure 11 below shows the cumulative operating margins for a natural-gas-fired, combined-cycle
plant. Operating margins are zero for the lowest 50% of hours of a year, reflecting the fact that a
gas CC will operate profitably only during approximately half of all hours. Then cumulative
operating margins increase as more profitable hours are added until total annual margins reach
the annualized investment and fixed operating cost of the plant, which we estimated as
$149/kW-year. This cumulative value is the same with or without storage but, as shown, energy
margins will be earned during a larger number of hours of the year, which will make investment
cost recovery less dependent on the small number of extremely high-priced hours.
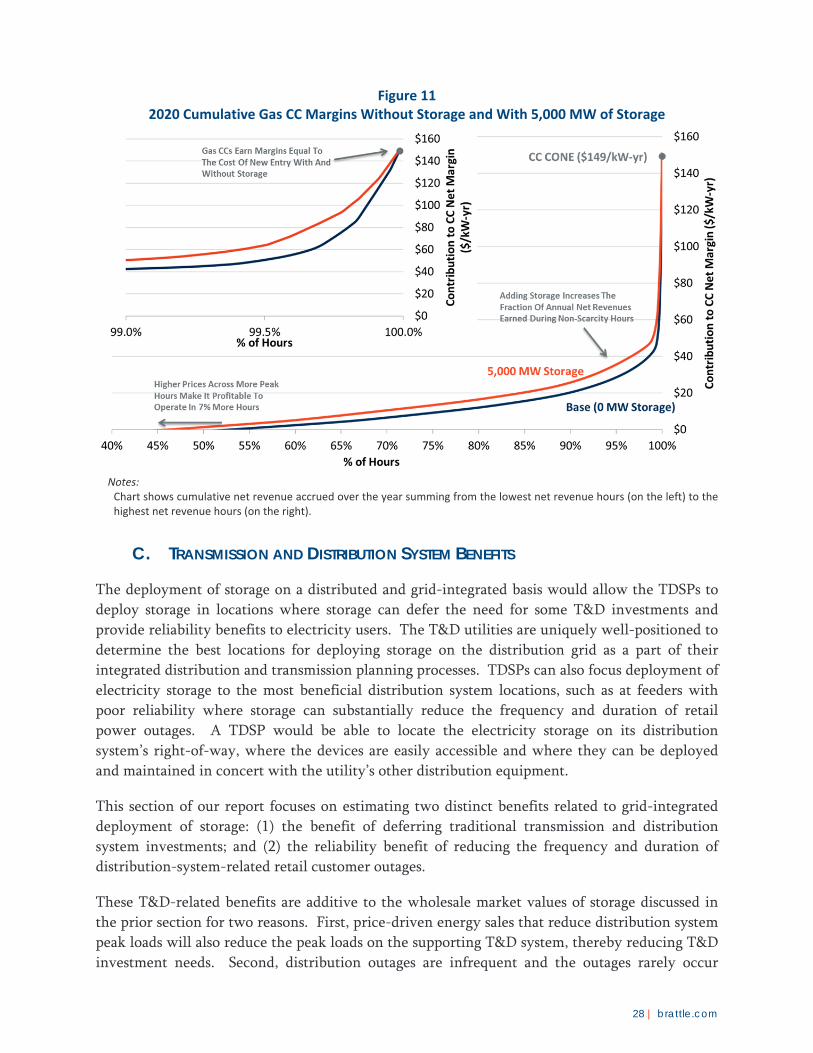
28 | brattle.com
Figure 11 2020 Cumulative Gas CC Margins Without Storage and With 5,000 MW of Storage
Notes: Chart shows cumulative net revenue accrued over the year summing from the lowest net revenue hours (on the left) to the highest net revenue hours (on the right).
C. TRANSMISSION AND DISTRIBUTION SYSTEM BENEFITS
The deployment of storage on a distributed and grid-integrated basis would allow the TDSPs to
deploy storage in locations where storage can defer the need for some T&D investments and
provide reliability benefits to electricity users. The T&D utilities are uniquely well-positioned to
determine the best locations for deploying storage on the distribution grid as a part of their
integrated distribution and transmission planning processes. TDSPs can also focus deployment of
electricity storage to the most beneficial distribution system locations, such as at feeders with
poor reliability where storage can substantially reduce the frequency and duration of retail
power outages. A TDSP would be able to locate the electricity storage on its distribution
system’s right-of-way, where the devices are easily accessible and where they can be deployed
and maintained in concert with the utility’s other distribution equipment.
This section of our report focuses on estimating two distinct benefits related to grid-integrated
deployment of storage: (1) the benefit of deferring traditional transmission and distribution
system investments; and (2) the reliability benefit of reducing the frequency and duration of
distribution-system-related retail customer outages.
These T&D-related benefits are additive to the wholesale market values of storage discussed in
the prior section for two reasons. First, price-driven energy sales that reduce distribution system
peak loads will also reduce the peak loads on the supporting T&D system, thereby reducing T&D
investment needs. Second, distribution outages are infrequent and the outages rarely occur
29 | brattle.com
during peak-load periods, and therefore reducing distribution outages would not typically affect
T&D investments that are driven by peak load. However, to be certain that we are not too
aggressive in assuming no overlap between the two types of benefits, we heavily discount our
estimate of theoretically-achievable reliability value (if the TDSP had perfect foresight of the
time and locations of all outages) to account for times when the storage devices may already be
discharged or when a distribution outage may occur downstream from the storage location.
1. Deferred Transmission and Distribution Investments
As we discussed in our review of prior studies, deploying grid-integrated storage devices can help
defer T&D investments. Because storage can be discharged during high-price periods that
typically correspond to peak load conditions, the storage will reduce the net load that the T&D
system must support. Since we contemplate a distributed deployment of storage, the injection of
energy from storage would be co-located with end-user loads on the distribution system. The
net load that distribution substations and major transmission facilities would need to support
would then be the end-user load minus the energy injections from storage.50 Consequently, the
peak-shaving impact of storage will reduce the pace and magnitude of the T&D investments that
otherwise would need to be made to meet growing system loads. We describe our approach to
estimating the magnitude of these investment deferrals first in the transmission system, and then
in the distribution system.
Deferred Transmission Investments. Storage can defer transmission system upgrades by reducing
peak load net of storage’s energy discharge. Electricity storage also may defer some necessary
transmission investments by providing reactive power, voltage support, and by injecting energy
into the transmission system on a temporary basis to reduce the impact of contingencies that
would otherwise create thermal overloads that limit the capability of the transmission system.51
To exactly estimate the magnitude of transmission investment deferrals enabled by electricity
storage, one would need to conduct a detailed transmission planning analysis and examine each
potential deferral opportunity. We have not conducted such a transmission planning analysis.
Instead, we assume that the benefit of achievable future transmission investment deferrals is
approximately equal to the average annual system-wide transmission cost for every unit of peak
demand reduced. Thus, to estimate the value of potential transmission investment deferral, we
50 Note that storage devices located at generator nodes in the transmission system would not reduce the
net peak load that the T&D system would need to support. However, storage deployed at other
targeted locations in the transmission system may be able to defer other types of transmission
upgrades.
51 For a discussion of these types of transmission-related benefits, see the proposal by Western Grid
Development for which FERC has approved incentive rates of returns in January 2010 (see 130 FERC
¶ 61,056).

30 | brattle.com
used the average annual transmission cost per kW of summer coincident peak (CP) load at
$36/kW-year, multiplied by the peak load reduction at each storage deployment level.52
For locations where the incremental cost of transmission upgrades per kW of peak load is less
than the average cost of the existing system, using this average cost will overstate the value of
deferred transmission upgrades. On the other hand, for locations with high upgrade costs, our
approach will understate the value. Our average cost approach is a conservative proxy for
transmission investment deferral benefits because: (a) the marginal costs of upgrading a
constrained system tend to be above the average cost (thus not yet already upgraded); (b) the
average transmission rates in ERCOT have been increasing, indicating that marginal costs are in
fact above average costs; and (c) targeted deployments may make it possible to focus storage
development into high-value locations or grid services beyond just peak load reductions.
To estimate the magnitude of peak load reductions from storage, we rely on the results of our
wholesale power market simulation, comparing peak load without storage to net peak load with
storage. As shown in Figure 12 below, each incremental unit of storage reduces peak load by a
declining amount. This decreasing effect occurs because electricity storage is energy-limited and
the number of discharge hours needed to further reduce peak load increases (e.g., the load
duration curve becomes flatter with more storage).53 The chart shows that deploying 5,000 MW
with 15,000 MWh of storage in ERCOT would reduce peak loads by approximately 3,600 MW.
It also shows that using the average cost of $36/kW-year in transmission investment deferral
benefits yields a storage-related value of approximately $130 million per year at the 5,000 MW
storage penetration level.
52 Transmission costs reflect the transmission rate applicable to one class of customers in Oncor’s system
as of 2014 ($2.840117 per 4CP kW), escalated with inflation to 2020 nominal dollars. This 2014
transmission rate is in line with the transmission rates applied to other customer classes and in other
distribution systems across ERCOT, see PUCT (2014).
53 We examine this interaction among storage power, energy, and load duration curve only as aggregated
to the ERCOT wholesale market level. A more detailed examination of individual customer segments’
load profiles on each feeder in concert with distribution system capabilities would need to be
conducted as part of a distribution system plan to identify the best placement of storage to achieve the
most beneficial net load reductions. Once such a detailed assessment is done, it could also account for
the discrete nature of distribution system upgrades such that some threshold level of load is a trigger
point for a major upgrade as discussed further below.

31 | brattle.com
Figure 12 Peak Load Reduction and Deferred Transmission Investments
Notes: Peak Load reductions are measured as load minus discharge from storage during the coincident peak hour.
Deferred Distribution Investments. In addition to transmission investment deferrals,
deployment of storage on the distribution system will also reduce peak load growth on the
distribution feeders. While the overall distribution system spending will increase with the
deployment of distributed storage devices, the deferral of some of the traditional distribution
investments will create a partial offset to those cost increases. As a substitute for conducting a
full location-specific distribution system needs assessment with and without storage, we assume
that each kW of discharge capability from storage can reduce one kW of distribution system load
growth and defer incremental distribution system investments.54
We estimate the value of distribution investment deferrals on the Oncor system using two
approaches. The first approach is based on targeted investments at specific substations and the
second approach is based on an average system investment cost similar to the approach we use
for estimating the transmission investment deferrals. Conducting the distribution system
deferral using these two approaches allows us to benchmark the range of distribution upgrade
costs that electricity storage is likely to defer. Once we have a range of deferral cost, we assume
that the highest-value deferral opportunities would be pursued first.
54 Unlike transmission costs, which we assume are driven primarily by ERCOT coincident peak loads,
we assume that distribution system costs are driven by non-coincident peak loads on each feeder so
that each kW of storage would reduce distribution feeder peak loads by one kW.

32 | brattle.com
First, to obtain substation-specific estimates, we worked with Oncor to identify the number of
high-value distribution investment deferral opportunities within the Oncor system, where
reducing the distribution peak load would defer a major substation investment. The types of
upgrades we examined were the installation of new distribution substations to expand existing
feeders, adding new transformers to existing substations, and upgrading existing transformers to a
larger size. While there are many other types of distribution system cost deferrals that could be
considered, we focused only on these three types of investments for the purpose of our analysis.
We then sized a potential storage asset at each substation such that it would be large enough to
offset 15 years of load growth, thereby deferring the need for the identified upgrade for 15 years.
Table 3 below provides an illustrative calculation of these values for two locations with the same
upgrade costs (the approximate cost of building a new distribution substation), in locations with
low and high load growth. As the table illustrates, locations with low load growth will have a
higher investment deferral value when measured on a $/kW-yr basis because distribution
investments can be quite lumpy, and under low load growth, even a small investment in storage
can defer a costly substation investment for many years.
We estimated the total number and size of these substation cost deferral opportunities based on
Oncor’s current distribution plan, which includes upgrades of varying costs and in locations with
different levels of load growth. We also considered that some storage deployments may occur at
locations that would not have needed upgrades in the immediate year, but that would have
needed upgrades one to four years in the future. Locations where the upgrade would not be
needed until a later year have lower realized deferral value. Using this approach, we estimated
210 MW of storage applications with high deferral value on the Oncor system, or approximately
580 MW when extrapolated to all of ERCOT.

33 | brattle.com
Table 3 Example of Location‐Specific Distribution Cost Deferral in High and Low Load Growth Locations
Notes: [1] and [2]: Illustrative assumptions are approximately consistent with substation in Oncor’s system. [3]: [1] × (1 + [2])15 [4]: [3] – [1] [5]: Illustrative assumption approximately consistent with the cost of building a new substation. [6]: NPV of deferring investments for 15 years, consistent with Oncor financing cost rates. [7]: ([6] × [5]) / (1,000 × [4]) [8]: Payment on a level‐real annualization of [7], levelized over a 30‐year distribution investment life. [9]: [7] × [8]
Second, we assumed that in addition to these high-value opportunities, storage deployment in
any location would be able to provide some average level of distribution investment deferral.
These average-value investment deferrals would be achieved in proportion to peak load
reductions, given that peak load growth is the primary driver of incremental distribution
investment costs. Based on Oncor’s average annual distribution investments and average load
growth in 2014, we estimated a levelized annual distribution-investment-deferral value of
$14 per kW of storage ($14/kW-year).55 Figure 13 below summarizes these incremental values of
distribution deferral opportunities, assuming that the highest-value opportunities are pursued
first.
55 Annual distribution investment on the Oncor system will likely increase relative to the recent past
few years for which we have investment data. Thus, the estimated value of distribution investment
deferral benefits likely is conservatively low.
High Load
Growth
Location
Low Load
Growth
Location
Starting Peak Load [1] (MW) 10 10
Peak Load Growth Rate [2] (%) 3% 1%
Peak Load in 15 years [3] (MW) 15.6 11.6
Battery Size to Defer Upgrade 15 Years [4] (MW) 5.6 1.6
Substation Upgrade Cost [5] ($) $3,000,000 $3,000,000
Investment Cost Avoided by 15‐Yr Deferral [6] (%) 60% 60%
Deferral Savings [7] ($/kW) $323 $1,118
Charge Rate [8] (%) 7.9% 7.9%
Deferral Savings [9] ($/kW‐yr) $25 $88

34 | brattle.com
Figure 13 Estimated Incremental Distribution‐Investment‐Deferral Savings
Sources and Notes: Distribution deferral savings decline to the $14/kW‐yr average incremental value at approximately 580 MW for ERCOT‐wide deployment and 210 MW for Oncor‐only deployment.
Total Deferred T&D Investment Savings. Our estimates of the combined average annual benefits
of deferring transmission and distribution investments through storage range from $35 to $48
per kW-year of storage deployed. The higher end of this range ($48/kW-year) is associated with
1,000 MW of storage on an ERCOT-wide basis because the highest-value opportunities are
pursued first, while the lower end of this range ($35/kW-year) is associated with 8,000 MW of
storage.
These estimates are on the lower end of the T&D deferral savings reported in other studies of
storage-related benefits. For example, a 2013 study of the peak-load reducing benefits of energy
efficiency policies found that the average annual benefits of T&D deferral savings ranged from
approximately $20 to $170 per kW of peak-load reduction for utilities in New England.56 Sandia
(2010), which we reviewed in Section II of this report, estimated T&D savings in the context of
energy storage and found one-year-deferral values ranging from $481 to $1,821 per kVA of
storage, which would annualize to savings of approximately $40–$140/kVA-year under Oncor’s
financing assumptions. An earlier report, Sandia (2004) estimated deferred T&D savings at
$880/kW-year for the first deferred year and $264/kW-year for the second deferred year, but did
not calculate the average savings over the life of typical distribution system investments.57 EPRI
56 See Hornby, et al. (2013).
57 See Sandia (2004), pp. 16–20.
35 | brattle.com
(2010) estimated that the value of mobile energy storage could defer transmission investments at
a value of $208–$354 per kW of storage per year of deferral.58
Our estimates are much lower than those in some of these studies primarily because these other
studies examine only the benefits associated with short-term deferrals (two years or less) where a
large amount of savings can be realized with only small storage size. We assume that storage
devices would be sized to defer investment by the life of the storage (which we have assumed to
be 15 years), which means that we assume a much larger size of storage for a longer-term deferral
than in some of the other studies that focus only on the first incremental deferral. Thus, the
estimated benefits associated with distribution investment deferrals are conservative in our
study. Further, our estimated distribution-related benefits are quite small compared to Oncor’s
average distribution annual revenue requirement per kW of peak load, which was $84/kW-year
in 2014,59 because many of the costs associated with distribution would not be deferred by
storage deployment. Such distribution system costs would include meters, meter-reading, tree-
trimming, other operations and maintenance, and many administrative costs.
There have been several regions in the U.S. where electricity storage has been proposed as a
potential way to defer T&D spending. For example, Puget Sound Energy is installing a 3 MW
battery on Bainbridge Island, WA, to defer distribution investment to accommodate forecasted
load growth for about 9 years.60 Puget found this to be cost effective even at a battery cost of
$2,300/kW. Consolidated Edison, serving the metropolitan New York area, has filed a proposal
with the New York State Public Service Commission to defer the cost of building $1 billion in
major distribution and sub-transmissions upgrades to meet future load growth in Brooklyn and
Queens by using a range of distributed resources, including storage, energy efficiency, and
distributed generation.61
Similarly, SCE has applied to the CPUC for approval of 23 storage offers totaling 264 MW that it
selected from four counterparties in response to a request for offers to address its capacity needs
in the West Los Angeles Basin region of its service area.62 The diverse set of storage applications
will be deployed both in-front-of-the-meter and behind-the-meter locations on the company’s
T&D system, and SCE would control the charge and discharge of the storage device. SCE’s
contracts with storage providers are reported to incorporate guaranteed energy efficiencies on
the charge and discharge cycles, operating characteristics (e.g., number of cycles per month or
year, number of deep discharges per day/month/year, number of MWh of discharge per year),
and responsibilities for charging energy versus auxiliary load for onsite energy needs. While
58 See EPRI (2010), p. A-17.
59 Data provided by Oncor staff.
60 See Balducci, et al. (2013).
61 See Heslin (2014).
62 See Cordner (2014).
36 | brattle.com
SCE’s solicitation was in response to a CPUC mandate, the storage portion of the SCE-selected
capacity resources amount to over five times the minimum amount required by the CPUC.
2. Reliability Improvements on the Distribution System
Grid-integrated electricity storage can improve the reliability and resiliency of supplying
electricity to end users at both the transmission and distribution levels. For example, the ability
to inject energy can help maintain grid reliability and provide black-start services to help re-
energize the transmission grid after wide-spread outages.63 Further, on the distribution system,
electricity storage can be located near or at customers’ sites to provide backup power during
transmission or distribution system outages, with the proximity to customers introducing
relatively little or no environmental or customer impact compared to other types of backup
power. In the event of an outage on a distribution line, the system can be almost instantaneously
switched to the battery, thereby providing uninterrupted power supply for several hours while
the fault is investigated and resolved.64 The causes of these distribution outages can range from
storm damage to unexpected equipment failures. Oncor has already installed 25 kW, 25 kWh
batteries in South Dallas neighborhoods for the sole purpose of providing backup power. Each
battery can provide power for three to five houses for three hours.65
To deploy electricity storage in the most effective and efficient manner for reducing customer
outages, a distribution utility would first install storage devices at locations with low reliability or
high-value end users, thereby avoiding the most costly and frequent outages. Depending on the
location of the storage devices and the location of the fault, there may be instances where a
storage device is unable to completely eliminate interruptions to customers’ service. At times,
the outage may last longer than what can be covered by the storage.
The value of avoiding power outages is generally estimated at customers’ VOLL, which is an
estimated measure of how different electricity users value access to reliable electricity. We have
reviewed a number of studies estimating VOLL by customer classes and found that the VOLL of
residential customers tends to range from $1,000 to $5,000/MWh, while the VOLL of
commercial and industrial (C/I) customers tends to range from $10,000 to $80,000/MWh.66 For
63 The Long Island Power Authority (LIPA) included storage as part of a 1,630 MW resource
procurement effort, in which up to 150 MW of storage will be procured to assist black-start
operations. See LIPA (2013).
64 For example, a 1 MW sodium-sulfur (NaS) battery installed in a remote town in British Columbia
allows the town to operate islanded from the grid in the event of a transmission line outage. Two
weeks after its installation, the town experienced the first outage and the battery system provided
backup power for 7 hours while utility crews repaired the line to the town. See S&C Electric
Company (2014).
65 See Cameron (2014).
66 For example, Sullivan, et al. (2009) conducted a meta-analysis that combines the results of 28
individual VOLL studies, finding an average VOLL of $2,600/MWh for residential customers and an
Continued on next page
37 | brattle.com
the purpose of this analysis, we assume that the average VOLL for commercial and industrial
customers is $20,000/MWh and the average VOLL for residential customers is $3,000/MWh.
These assumed values are consistent with the $9,000/MWh system-wide VOLL that the PUCT
and ERCOT use for wholesale market pricing purposes.67
To assess the value of reducing customer outages, we analyzed historical outage statistics on
Oncor’s distribution substations and feeders, approximately 3,000 locations in total. We
estimated the number and duration of customer interruptions that could have been avoided if
Oncor had deployed storage assets on each distribution feeder to maintain customer power
supply during outage events.68
We use five years of historical outage patterns to simulate a storage deployment targeted at
feeders with lower than average reliability, recognizing that historical outages are an imperfect
predictor of future outage patterns. Using three years of the available historic data, we developed
a targeted (but imperfectly-optimized) storage deployment strategy by first selecting locations to
install storage at feeders with the highest outage frequencies. During this process, we ignored
the impact of storm-related outages in the historical outage data as storms can result in large
outage events that may not be indicative of a feeder’s typical level of reliability. We assume a
minimum storage installation equal to the average load at each feeder. This minimum
installation requirement based on feeder size generally exceeds the typical outage size, which
significantly reduces the estimated outage benefit per MW of installed storage device relative to
the hypothetically achievable level where storage deployment is optimized to the outage size.
We then use the remaining two years of outage data to estimate the customer interruptions that
the selected storage deployment would likely avoid if fully-charged storage devices could be used
to supply all of the customers that experience an outage on that feeder.69 Recognizing, however,
that storage devices will not always be fully charged or may not be able to deliver power to all
Continued from previous page
average value of $25,000/MWh for medium and large C/I (in 2008 dollars). Similarly, a literature
review by MISO (2006) found that estimates of VOLL ranged from $1,500 to $3,000/MWh for
residential, $10,000 to $50,000/MWh for commercial, and $10,000 to $80,000/MWh for industrial
loads (in 2005 dollars). A recent study undertaken on behalf of ERCOT by London Economics
International (2013) found VOLLs ranging from $3,000/MWh to $53,907/MWh for C/I customers and
from $0/MWh to $17,976/MWh for residential customers.
67 See ERCOT (2014a).
68 The raw data were based on customer interruption-minutes that we converted into MWh of
interruptions based on the number of customers by class at each feeder and the average customer sizes
of 17.6 kW for C/I customers and 1.8 kW for the average residential customer. Average residential
customer size of 1,300 kWh/month was provided by Oncor, and average C/I customer size of 12,720
kWh/month is based on EIA data, see EIA (2014).
69 We conducted this same analysis using three years of outage “training data” and two years of outage
“test data” using every combination of possible years, although to simplify our description we report
only one combination of training and test data.
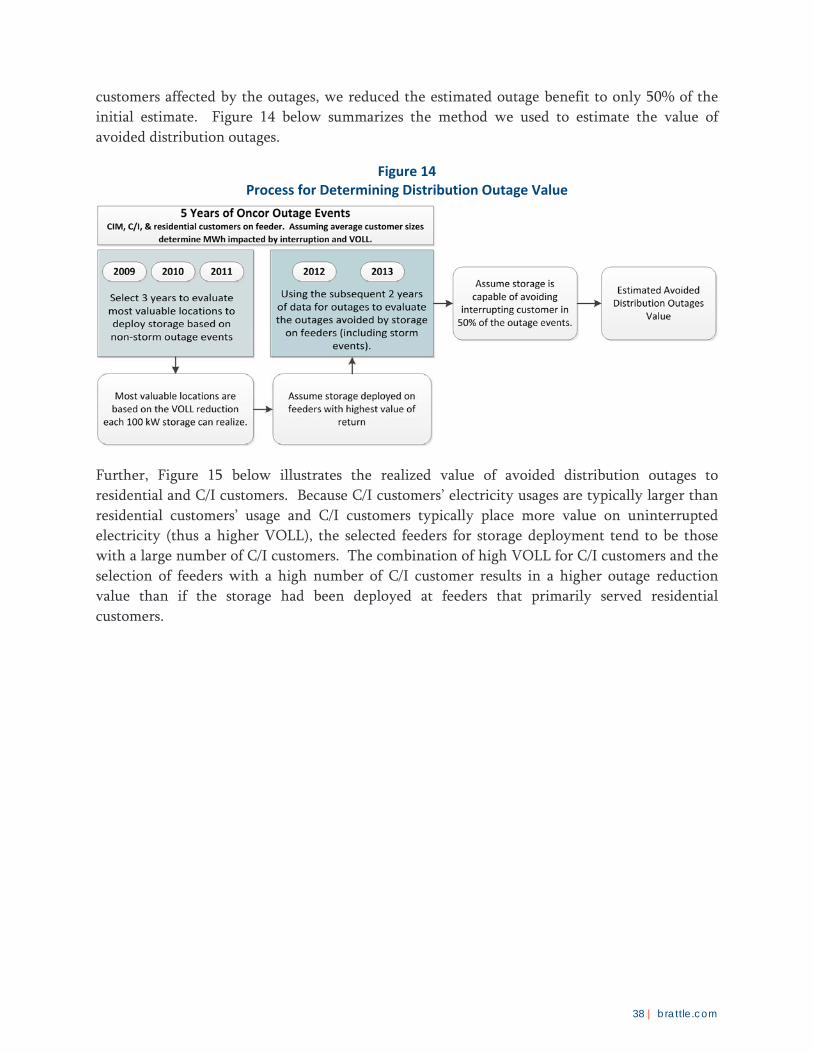
38 | brattle.com
customers affected by the outages, we reduced the estimated outage benefit to only 50% of the
initial estimate. Figure 14 below summarizes the method we used to estimate the value of
avoided distribution outages.
Figure 14 Process for Determining Distribution Outage Value
Further, Figure 15 below illustrates the realized value of avoided distribution outages to
residential and C/I customers. Because C/I customers’ electricity usages are typically larger than
residential customers’ usage and C/I customers typically place more value on uninterrupted
electricity (thus a higher VOLL), the selected feeders for storage deployment tend to be those
with a large number of C/I customers. The combination of high VOLL for C/I customers and the
selection of feeders with a high number of C/I customer results in a higher outage reduction
value than if the storage had been deployed at feeders that primarily served residential
customers.
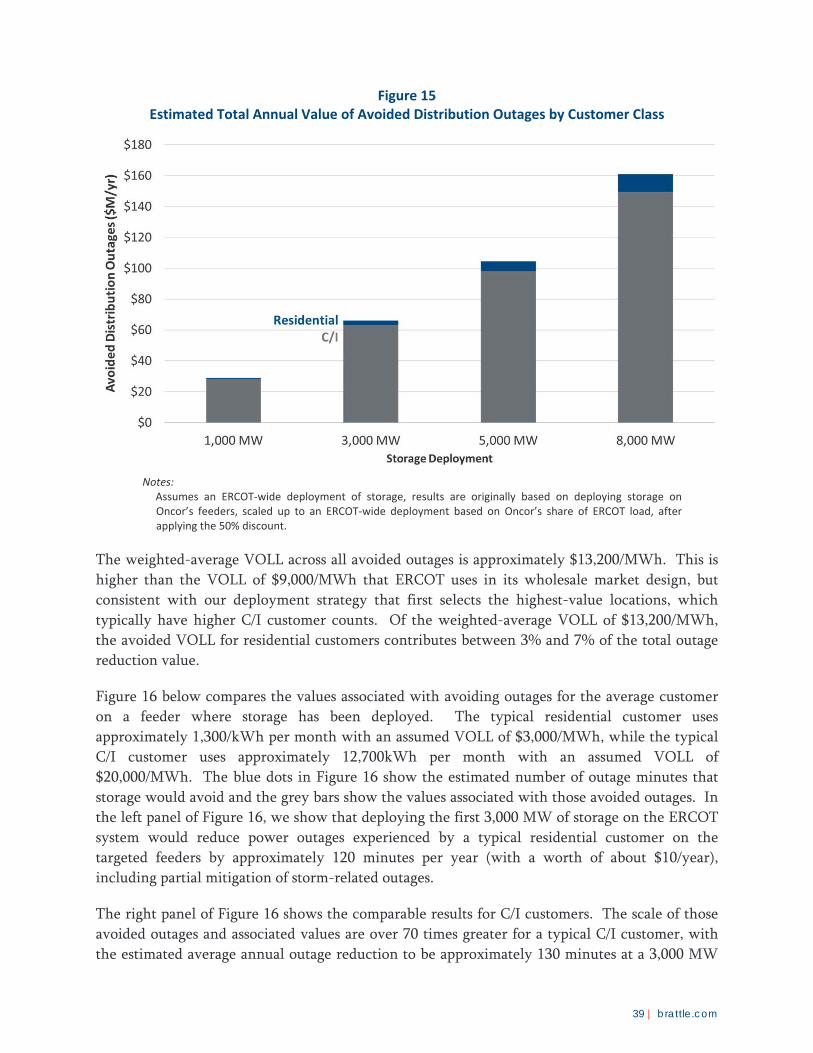
39 | brattle.com
Figure 15 Estimated Total Annual Value of Avoided Distribution Outages by Customer Class
Notes: Assumes an ERCOT‐wide deployment of storage, results are originally based on deploying storage on
Oncor’s feeders, scaled up to an ERCOT‐wide deployment based on Oncor’s share of ERCOT load, after applying the 50% discount.
The weighted-average VOLL across all avoided outages is approximately $13,200/MWh. This is
higher than the VOLL of $9,000/MWh that ERCOT uses in its wholesale market design, but
consistent with our deployment strategy that first selects the highest-value locations, which
typically have higher C/I customer counts. Of the weighted-average VOLL of $13,200/MWh,
the avoided VOLL for residential customers contributes between 3% and 7% of the total outage
reduction value.
Figure 16 below compares the values associated with avoiding outages for the average customer
on a feeder where storage has been deployed. The typical residential customer uses
approximately 1,300/kWh per month with an assumed VOLL of $3,000/MWh, while the typical
C/I customer uses approximately 12,700kWh per month with an assumed VOLL of
$20,000/MWh. The blue dots in Figure 16 show the estimated number of outage minutes that
storage would avoid and the grey bars show the values associated with those avoided outages. In
the left panel of Figure 16, we show that deploying the first 3,000 MW of storage on the ERCOT
system would reduce power outages experienced by a typical residential customer on the
targeted feeders by approximately 120 minutes per year (with a worth of about $10/year),
including partial mitigation of storm-related outages.
The right panel of Figure 16 shows the comparable results for C/I customers. The scale of those
avoided outages and associated values are over 70 times greater for a typical C/I customer, with
the estimated average annual outage reduction to be approximately 130 minutes at a 3,000 MW

40 | brattle.com
ERCOT-wide deployment level. Because C/I customers are ten times larger and place a much
greater value on avoided power outages, the average C/I customer would realize a reliability
value of approximately $750/year for customers located on feeders with storage.70
Figure 16 Avoided Outage Value and Outage Duration per Customer by Customer Class
Sources and Notes:
Results are based on our analysis of five years of Oncor outage data, with the storage deployed throughout ERCOT. The average duration of outages avoided declines with storage deployment because early installations are targeted to the feeders that could benefit the most from outage prevention. Residential value is based on a standard residential consumer using 1,300 kWh/month and a VOLL of $3,000/MWh. C/I value is based on an average customer size of 12,700 kWh/month and a VOLL of $20,000/MWh.
The same results can be used to estimate the reduction in Oncor’s System Average Interruption
Duration Index (SAIDI) metric at each storage penetration level. We estimate that if Oncor were
to install 3,000 MW of storage on its system, its system-wide SAIDI would decrease by 10%.71
While improving distribution system reliability does not translate directly to cost savings
through customers’ electricity bills, increasing the reliability of the system may help defer the
need for investing in other reliability improvement measures, whose separate values (aside from
the deferred T&D investments) are not estimated in this report.
D. OTHER POTENTIAL STORAGE VALUES NOT QUANTIFIED
As discussed in Sections I and II of this report, deploying storage onto T&D systems within the
ERCOT system can provide a wide range of different types of benefits. Our estimate of the
system-wide storage value covers only some of these potential benefits. Other additional benefits
70 Assumes an average commercial or industrial customer consumes 12,700 kWh per month.
71 Calculation is based on the reduction in non-storm outage events on Oncor’s system.
41 | brattle.com
that we have not estimated, that may or may not be additive to those that we have estimated,
include:
Real-Time Wholesale Market Benefits. Our wholesale market simulations focused on the
energy and ancillary services value of electricity storage that would be realized in the
day-ahead market, which is based on forecast, not actual, system conditions, including
load and wind generation. Because actual system conditions during real-time operations
generally differ and, at times, significantly from day-ahead forecasts due to variance in
load, wind generation, and other factors, such as unanticipated generation or transmission
outages, storage facilities can provide incremental balancing benefits that market
participants could realize by participating in ERCOT’s more volatile real-time energy
market. Simulating the interaction between day-ahead and real-time markets adds a
level of complexity that we have not yet addressed in our analysis. We also have not
estimated the potentially higher value of a focused deployment at ERCOT nodes with
higher potential values.
Renewable Integration Benefits. Electricity storage can be used to avoid renewable
generation curtailment during transmission constraints by charging when there is excess
renewable generation and discharging when load is high. These values can be
particularly high on a sub-hourly basis when wind output is more volatile and in real-
time when the system operator can be surprised by unexpected highs or lows in load or
wind. Many other studies have focused on this aspect of the storage capability and we
have not repeated those analyses in this report. We do assume a substantial 8,600 MW of
nameplate renewable growth in ERCOT between now and 2020.72 However, we only
simulated the integration of these renewables in the day-ahead wholesale electricity
market on a zonal basis. Thus, the value we estimate does not capture the ability of
storage to reduce renewable generation curtailments, which mostly occur in real-time
market operations and on a nodal level. Electricity storage’s ability to absorb excess
generation would also increase the value of renewable energy resources, and such value
would be magnified as additional wind and solar generation is added. Further, as
renewable penetrations increase, larger amounts of flexible resources will be required to
maintain operation of the electric system; storage would help meet a portion of that
requirement and reduce its costs. The growing development of renewable generation is
likely to increase ancillary services requirements and thus provide additional
opportunities for storage to earn revenues from participating in the ancillary services
market. We have not estimated the incremental value associated with these aspects of
renewable integration, but note that a portion of the value realized via storing excess
renewable generation will be captured by our estimate of the day-ahead energy arbitrage
value. A larger portion of this value would be captured in an assessment of the
incremental benefit of storage in ERCOT’s real-time market.
72 Consistent with the May 2014 ERCOT capacity demand and reserves (CDR) report, see ERCOT
(2014c).

42 | brattle.com
Reduction in Regulating Reserve Requirement. While it is too early to evaluate the full
impact of the proposed ERCOT market changes on its ancillary services needs and market
design, the experience in PJM shows that after fast regulation resources began to
participate in its regulation market, PJM could reduce its overall regulation needs without
compromising its system reliability. Since October 1, 2012 when PJM redesigned its
frequency regulation market, fast moving resources that participate in the regulation
market, such as storage technologies, have grown to provide a combined regulating
capability of approximately 490 MW. These fast regulation resources allowed PJM to
reduce the amount of regulation requirement from 1.0% of peak load to 0.7% of peak
load.73 Storage not only reduces the need to rely on conventional ancillary services
resources, but also reduces the overall quantity of ancillary services needed. This
experience shows that storage can avoid future generation needs both in terms of
generation’s ability to meet peak load as well as ancillary service needs. We have not
estimated the extent to which storage could reduce ancillary services needs in ERCOT.
Reduced Cycling of Conventional Generators. Deploying electricity storage that charges
during off-peak conditions and discharges during peak-load conditions will reduce the
extent to which conventional generation units will be required to cycle up and down.
Reduced cycling can increase generators’ reliability, avoid certain maintenance costs, and
increase the lifespan of their equipment and thus their asset value. A study of power
plants in the Western U.S. found that more cycling increases conventional power plants’
maintenance costs and forced outage rates, accelerates heat rate deterioration, and
reduces the lifespan of critical equipment and the generating plant overall. For example,
that study estimated that the total hot-start costs for a conventional 500 MW coal unit are
about $200/MW per start (with a range between $160/MW and $260/MW). The costs
associated with equipment damage account for more than 80% of this total.74 Our
analysis captures the fuel and variable O&M costs of cycling conventional generators, but
not the impact on plants’ capital needs for major maintenance and refurbishment.
Emissions Reduction. Electricity storage can increase the overall fuel efficiency of a
power system by reducing the dispatch of inefficient peaking units during peak-load
periods and increasing the dispatch of more efficient generation during off-peak periods,
though these gains are offset by the round-trip efficiency of storage. Such efficiency
gains can reduce power plant emissions, particularly in systems that are dominated by
renewable, nuclear, or natural gas generation during off-peak periods. In power systems
where coal plants represent a significant share of marginal resources during off-peak
periods (this is the case in systems such as PJM and MISO, but is not the case in ERCOT),
the efficiency gain may not translate to emissions reductions. Because even in off-peak
hours the marginal resource type in ERCOT is often an efficient gas CC, our market
simulations show that deploying storage on the current ERCOT system is approximately
73 See PJM Interconnection Regulation Senior Task Force (2013).
74 See Kumar, et al. (2012).

43 | brattle.com
emissions neutral. Storage, as part of an efficient wholesale market, might play a more
substantial role in reducing or mitigating emissions in the future if a more substantial
pricing regime for CO2 or other emissions emerges in the future, as the economics would
create more incentives for storage and the system as a whole to avoid producing these
pollutants.
Reduction of Line Losses. Deploying electricity storage on the distribution system will
reduce loading on the circuits during periods of peak demand, and will also reduce
average losses incurred on the T&D system. Because losses increase with the square of
line loadings, the reduction in losses during peak load conditions due to storage
discharging close to load will exceed the increase in losses incurred when charging the
storage during off-peak conditions. We developed a rough estimate of this effect for the
Oncor system and found that its additional annual value was approximately $4–5 per kW
of installed storage capacity, declining slightly with increasing storage deployment. Since
this additional value is modest compared to the estimated range of value associated with
deferring T&D investments, we have not included this value in the overall results
presented in this report.
Reduced Wear and Tear of Distribution System Elements. Reducing circuit loadings
during peak load conditions also reduces the wear and tear of distribution equipment,
e.g., due to thermal stressing or frequent tap changer resetting. While this will tend to
increase equipment life and defer distribution system replacement needs, we have not
analyzed the potential magnitude of this benefit.
Increased Power Quality. Storage can be deployed in the distribution system to improve
the quality of power delivered to customers. The electronics associated with storage
devices can be designed to inject reactive power to offset voltage drops caused by
momentary load spikes on the distribution system (such as those caused by motor
startups) or to inject energy to stabilize the local system (such as may be necessary due to
fluctuations in distributed solar generations under cloudy weather conditions). We have
not attempted to quantify this benefit.
These additional benefits may provide significant system-wide value beyond what we have
estimated in our analysis. However, as noted in the discussion of the individual types of benefits,
estimating the additional overall value provided by these benefits is challenging analytically and
great care would need to be taken to avoid double-counting the overlapping portions of these
values.
IV. Aggregate Value of Electrical Energy Storage
We evaluate the net benefits of adding electricity storage in Texas from the perspectives of
wholesale market participants, society as a whole, and retail electric customers. We first
consider how a merchant developer may analyze the market-based incentives for storage
investment compared to investment costs. We then report the societal, system-wide benefits of
44 | brattle.com
storage, regardless of whether suppliers or customers would realize those benefits, and estimate
the deployment scale that would likely offer the highest system-wide value.
Finally, we estimate the net benefits to retail electricity customers if storage assets were deployed
under a regulated framework that would allow the full value of the storage assets to be captured.
In this analysis, we assume that customers would pay for the storage investments just as they pay
for T&D investments. Customers would then obtain offsetting reductions in retail electricity
costs from the storage deployment through deferred T&D investments, refunds from the
wholesale market auction proceeds, and reduced power purchase costs. Customers would
additionally benefit through increased system reliability in the form of reduced distribution
outages, although the improved reliability does not directly affect the customers’ electricity bills.
The storage would likely be deployed and operated in ways that provide a number of additional
benefits that we have not analyzed, as specified in III.D.
A. THE MERCHANT VALUE OF STORAGE
To assess whether storage investment might be attractive to wholesale market participants, we
estimate the net revenues that storage could earn in ERCOT’s wholesale power markets.75 Figure
17 below presents our estimate of expected annual merchant value and costs at varying levels of
storage deployment. The top of each bar shows the total annual market value that merchant
investors could privately capture in ERCOT’s energy and ancillary services markets. This
realized merchant value is identical to the value reported on a per kW-year basis in Section
III.B.2 above, except that we now report the value on a total market-wide basis.
Figure 17 compares this merchant value (shown in the bar) to the annualized storage costs that a
merchant developer would face (shown as the red horizontal lines), assuming an 8% ATWACC
and 15-year life as previously discussed. We also compare the merchant value obtainable in
ERCOT’s wholesale power markets with the annualized storage costs that a regulated TDSP
would face (shown as the grey lines, at 6.3% ATWACC, 15-year battery life, and 30-year power
system life). As explained earlier, comparing annualized costs and annual benefits is equivalent
to an NPV analysis normalized for the life of the investment, as long as we assume that realized
benefits will increase with inflation.
Figure 17 shows that the wholesale market benefits of storage alone are limited in comparison to
storage costs. This discrepancy between benefits and costs is consistent with the observation that
private investments in storage have been minimal to date. Wholesale market value that can be
captured is well below current storage costs, which still exceed $500/kWh. However, if storage
costs drop to the $350/kWh benchmark used in this study, a modest amount of storage (possibly
75 If certain retail electricity customers are interested in deploying electricity storage on their premises,
we assume that they too would be interested in capturing the values associated with transacting in the
wholesale markets. Thus, the merchant value we estimate in the report is the value that any storage
investor should be able to capture via participating in the wholesale market either through direct or
third-party participation.

45 | brattle.com
up to 1,000 MW) could break even purely on a merchant, wholesale-market basis. However, the
aggregate merchant value is well below storage costs at greater deployment scales. This value to
cost gap is due to merchant participants’ inability to directly capture values outside of the
wholesale market, and within the wholesale market, the ancillary services market opportunities
would quickly be saturated and the wholesale energy price difference between peak and off-peak
periods (on which merchant investors rely) diminishes as storage deployment increases.76
Figure 17 Merchant Storage Value that Could be Captured by Wholesale Market Participants
Sources and Notes: Merchant value represents the margins that a merchant investor would receive by participating in ERCOT’s energy and ancillary services markets, assuming storage with a 3‐hour discharge capability, 85% round‐trip efficiency, and no other variable operations and maintenance (VOM) costs. Storage costs of $350/kW‐y are based on battery vendors’ estimates of $200/kWh as quoted to Oncor, plus an Oncor‐estimated installation cost of $150/kWh, plus fixed operations and maintenance costs equal to 1% and 2% of investment costs for the “expected” and “high” cost levels.
B. SYSTEM-WIDE SOCIETAL BENEFITS
Figure 18 below reports the estimated system-wide societal value of electricity storage, when
deployed on a distributed and grid-integrated basis, regardless of who receives those benefits. In
the top chart, we report the total annual costs and benefits of deploying increasing levels of
storage in millions of dollars per year. The colored stacked bars show the estimated net benefits
based on four components of storage value from an annualized, system-wide societal perspective,
76 Note that we estimate a relatively more gradual decline in merchant value compared to many other
studies estimating the value of storage. This is because we account for the partially offsetting effects of
generation investment response, such that wholesale power prices remain high enough to attract
needed conventional generation investments as explained earlier.

46 | brattle.com
including: (1) the value of reduced distribution outages; (2) deferred T&D investments;
(3) production cost savings; and (4) avoided generation investments. These estimated annual
benefits of storage are then compared with annualized storage costs, shown by the red lines.
The top chart of Figure 18 shows that the total benefits exceed the costs by a substantial margin
even at a relatively high ERCOT-wide storage deployment level of 8,000 MW. By comparing the
difference between the top of the stacked bars and the red lines, the same chart also shows that
the net benefits in absolute dollars are maximized at a deployment level of approximately
5,000 MW, after which the net benefits begin to decline due to the diminishing returns from
investments. The bottom chart in Figure 18 shows the incremental net benefits (or incremental
benefits minus incremental costs), in $/kW of storage, of adding one more MW of storage onto
the ERCOT system. Incremental benefits exceed the incremental costs up to approximately
5,000 MW of deployment.
These results indicate that at a storage cost of $350/MWh and the forecast system conditions for
2020, the ERCOT system-wide benefits are maximized at a deployment of approximately
5,000 MW. Beyond 5,000 MW, the incremental value of installing additional storage facilities
falls below its cost. If storage costs fall below $350/MWh, a larger amount of distributed storage
investments would become beneficial.

47 | brattle.com
Figure 18 System‐Wide Annual Benefits Compared to Expected 2020 Storage Costs
Top: Total Benefits and Costs, Bottom: Net Incremental Benefits
Sources and Notes: The Expected 2020 Battery Costs are based on Oncor’s 6.3% ATWACC, with 15‐ and 30‐year assumed lifetime for
the battery and balance of plant respectively.
C. CUSTOMER BENEFITS
While the system-wide, net societal benefit is the appropriate metric for forming policy
decisions, regulators and utilities also need to be concerned about the benefits and costs to
electricity customers. If the electricity storage investment is funded through a T&D utility’s
regulated rates, then retail customers will be paying for the investment, thus we evaluate the
potential benefits and costs to electricity customers.
While not all of the economic benefits of electricity storage would be received directly by retail
customers, we assess the likely impacts on average customer bills and reliability as a proxy to
48 | brattle.com
estimating the overall value of storage from a customer perspective. If customer bills decrease or
reliability increases due to the storage investment, then customers receive a net benefit from the
investment. However, if customer bills increase by more than the value of reliability
improvements, then customers are paying more than the value they receive.
The net benefits of storage from a customer perspective are summarized in Figure 19 below.
Customers realize most (but not all) of the benefits we estimate from a societal perspective.
Benefits realized by customers include the value associated with deferred T&D investments,
which help offset the costs customer incur by paying for the storage. Improved reliability is also
a direct benefit to customers, although it does not affect customer electricity bills. In addition,
customers would benefit from power purchase cost savings and offsets from merchant value
received through the auction proceeds. Since the use of storage can reduce power purchase costs
by reducing power purchases during system peaks (net of any increases in the cost of purchases
during off-peak periods), this value will directly affect customer bills subject to retail ratemaking
mechanisms. As we explained in Section III.B.1, after considering the market price impacts of
generation investment response, we estimate that power purchase cost savings are quite small
across a wide range of storage investments.
Since we envision that installed storage facilities will be used by independent third-parties to
participate in the ERCOT wholesale energy and ancillary services markets, the value of this
wholesale market participation would be obtained as an offset to customer bills through an
auction process as discussed further below in Section VI. If storage were to be deployed by T&D
utilities with the investment costs recovered through regulated retail rates, we would
recommend a regulatory framework under which retail customers who pay for the storage assets
would also receive a portion of the merchant revenues earned in wholesale markets. For the
purpose of our analysis, we assume that approximately 75% of merchant market value would be
returned to customers through such auction proceeds, with the remaining 25% kept by the
independent entity that contracts for the right to use the storage facilities for participation in the
wholesale market.77
Figure 19 compares the aggregated customer benefits to the costs of the electricity storage, with
the simulated 2020 wholesale market conditions. The stacked bars represent the values that the
customers would obtain, while the red horizontal lines reflect expected storage costs at
$350/kWh. This analysis shows that customers are likely to experience significant net benefits
even as the cost of the storage investments is recovered through regulated retail rates. We
estimate that net customer benefits are maximized between 3,000 MW and 5,000 MW of
ERCOT-wide storage deployment. However, note that the current regulations would not allow a
battery deployed by TDSPs to be dispatched into the wholesale market, and therefore would not
allow the merchant value component to be captured by the TDSPs. Without that value
component, it would not be net beneficial for a TDSP to develop storage at a substantial scale.
77 This 25% net revenue sharing assumption is approximately consistent with typical net revenue
sharing levels for third-party demand response providers. See Newell, et al., (2013) pp. 52–55.

49 | brattle.com
Figure 19 Estimated 2020 ERCOT‐Wide Customer Benefits and Storage Costs
Sources and Notes: The expected 2020 battery costs are annualized based on Oncor’s 6.3% ATWACC, with 15‐ and 30‐year assumed lifetime for the battery and balance of plant respectively.
To take the analysis of customer impacts a step further, Figure 20 below illustrates how a typical
Oncor residential customer’s bill would be affected by the deployment of 3,000 MW
(9,000 MWh) of ERCOT-wide storage, assuming that 1,000 MW of that storage would be
deployed on Oncor’s system and the remaining 2,000 MW were deployed in other distribution
systems across ERCOT.
We start with a typical residential customer’s monthly bill, estimated at $180 in 2020 (based on
forecast wholesale power prices without storage). All else equal, deploying 3,000 MW (9,000
MWh) of storage on an ERCOT-wide basis at a storage cost of $350/kWh would increase Oncor’s
average monthly residential bills by approximately $1.44 as shown by the orange bar. These
slightly higher residential customer bills are then offset by the various benefits shown as blue
bars. The first benefit is a minor cost reduction due to a slight decrease in the residential load-
weighted average of wholesale energy prices, followed by larger bill reductions from deferred
T&D investments, and the 75% of merchant value assumed to be credited back to ratepayers. As
a result, deploying 3,000 MW (9,000 MWh) of storage on an ERCOT-wide basis would slightly
reduce Oncor’s typical residential bill.78 In addition to the small residential customer bill
78 Note that the cost comparison that we are reporting here reflects the cumulative cost and benefit
impacts to a residential customer comparing a no-storage case to a case with 3,000 MW of storage.
This residential bill impact estimate reflects cumulative costs and benefits, not the incremental bill
impact of adding one more unit of storage.
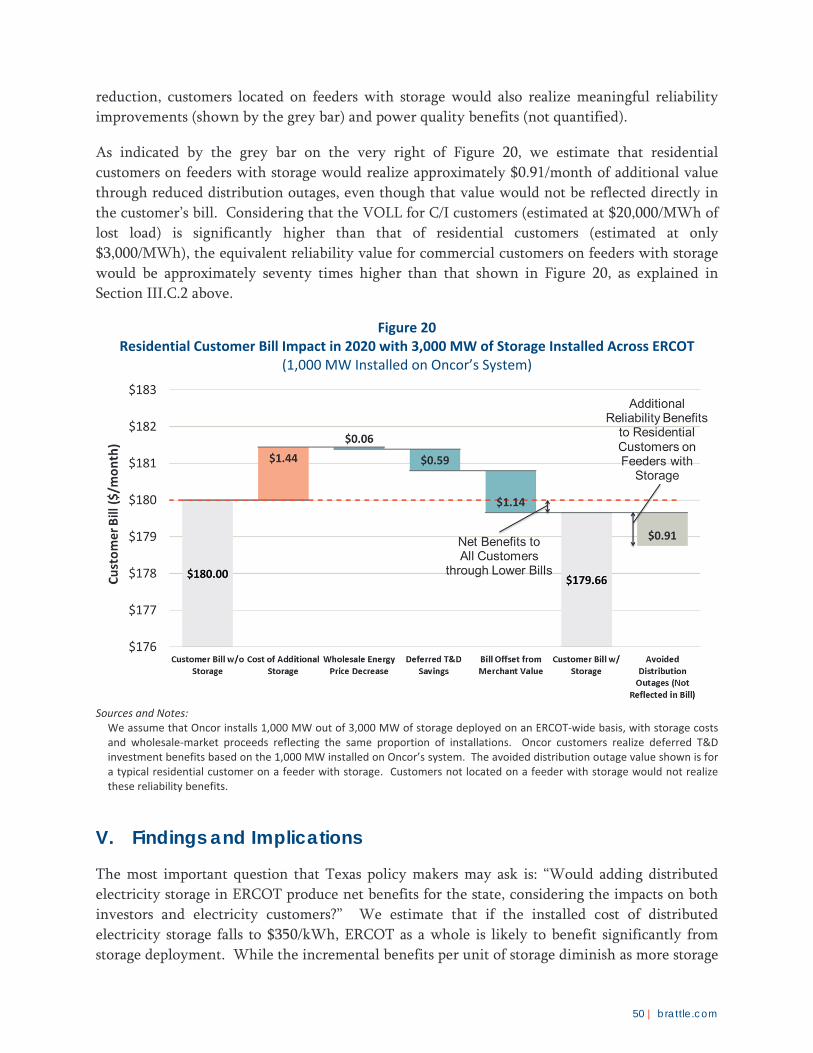
50 | brattle.com
reduction, customers located on feeders with storage would also realize meaningful reliability
improvements (shown by the grey bar) and power quality benefits (not quantified).
As indicated by the grey bar on the very right of Figure 20, we estimate that residential
customers on feeders with storage would realize approximately $0.91/month of additional value
through reduced distribution outages, even though that value would not be reflected directly in
the customer’s bill. Considering that the VOLL for C/I customers (estimated at $20,000/MWh of
lost load) is significantly higher than that of residential customers (estimated at only
$3,000/MWh), the equivalent reliability value for commercial customers on feeders with storage
would be approximately seventy times higher than that shown in Figure 20, as explained in
Section III.C.2 above.
Figure 20 Residential Customer Bill Impact in 2020 with 3,000 MW of Storage Installed Across ERCOT
(1,000 MW Installed on Oncor’s System)
Sources and Notes: We assume that Oncor installs 1,000 MW out of 3,000 MW of storage deployed on an ERCOT‐wide basis, with storage costs and wholesale‐market proceeds reflecting the same proportion of installations. Oncor customers realize deferred T&D investment benefits based on the 1,000 MW installed on Oncor’s system. The avoided distribution outage value shown is for a typical residential customer on a feeder with storage. Customers not located on a feeder with storage would not realize these reliability benefits.
V. Findings and Implications
The most important question that Texas policy makers may ask is: “Would adding distributed
electricity storage in ERCOT produce net benefits for the state, considering the impacts on both
investors and electricity customers?” We estimate that if the installed cost of distributed
electricity storage falls to $350/kWh, ERCOT as a whole is likely to benefit significantly from
storage deployment. While the incremental benefits per unit of storage diminish as more storage
51 | brattle.com
is added to the system, increasing net benefits are realized until approximately 5,000 MW (or
15,000 MWh) of storage is deployed.
Texas policy makers may also ask: “Why not leave it to the market to make the storage
investments?” Our analysis shows that merchant investors, who would only invest in storage if
the revenues received in the market would pay for their investment costs, would under-invest in
electricity storage relative to the societally efficient scale, because as other studies have observed
and we have confirmed, the value of storage is dispersed across the system and merchant
investors alone would not be able to collect all of its value directly from the wholesale market.
Moreover, pure merchant electricity storage facilities would be under-utilized and not capture
the high value offered by targeted deployment within the T&D systems. If electricity customers
are left to make the investment themselves, their interests in avoiding power outages would be
well-aligned with the T&D utilities’ interests, except that the TDSPs will be in a much better
position to select and deploy the storage to capture other benefits, including T&D cost reductions
and, through third parties, capture the wholesale market value of the storage assets.
Alternatively, one may ask: “Why wouldn’t the transmission and distribution utility go ahead
and install storage, if deploying storage can reduce T&D costs and customer outages?” Based on
our estimate of benefits associated with deferred T&D investments and the value of improved
distribution reliability, we find that those values alone do not justify deploying storage at a
system-wide efficient scale. Thus, as with merchant investors, if storage investment is focused
only on T&D benefits without capturing the benefits of wholesale power market participation,
T&D utilities will similarly under-invest in storage and under-utilize storage compared to a
deployment that would maximize net benefits on an ERCOT system-wide basis.
In contrast, if the full value of wholesale-market and T&D-related electricity storage can be
captured, we estimate that ERCOT system-wide benefits will be greatest for a distributed storage
investment level of about 5,000 MW (or 15,000 MWh), assuming that the installed storage cost
decreases to about $350/MWh. And if the cost of storage decreases further, additional
investments may also be beneficial.
Deploying grid-integrated, distributed storage also raises the question “What will storage
deployment do to existing generation and the investment incentives for new generation needed
to maintain resource adequacy in Texas?” As we have shown earlier, if 5,000 MW of storage
could be deployed by 2020, it would reduce the need for new generation by approximately
3,100 MW. Even with such reduction, a significant amount of new generation investment would
still be needed. Our simulations show that, once we recognize that approximately 3,100 MW
less generation would be built, the resulting wholesale market prices would still be high enough
to fully support the remaining investment in new generation that is needed to maintain resource
adequacy. New generating plants (as well as efficient existing plants) would earn operating
margins that are nearly identical to those in a market without storage. Since the deployment of
storage would yield less high-priced scarcity hours but more higher-priced non-scarcity peak
hours than a system without storage, generators would earn their operating margins in a slightly
more predictable fashion and over a larger number of hours in the year. Such implications may
52 | brattle.com
leave generators less dependent on a few very high-priced scarcity hours, which are less
predictable both in magnitude and in timing.
VI. Policies for Enabling Economic Storage Investments
Electricity storage offers benefits that span both the restructured wholesale market and the
regulated T&D systems. However, under the current policy framework in Texas, neither
merchant storage investors nor regulated wires companies can independently capture both
streams of benefits and will therefore underinvest in this technology. This is the case because
regulated wires companies are not currently allowed to own or operate assets that are offered
into the ERCOT wholesale electricity market, while wholesale market participants cannot
capture wires and customer reliability benefits.
We therefore review various policy options for addressing this problem and enabling storage
investments in Texas. First, we briefly discuss a wide range of policy options that can be used to
support storage, including options such as subsidies and mandates that would encourage
investments in the technology but at a net cost to ratepayers or taxpayers. Second, we narrow
our discussion by assuming that viable policy options in Texas should not contemplate any
subsidization of the technology, but only enable cost-effective storage investments. We review a
range of business models that the Texas policy makers could contemplate, and the ability for each
business model to capture a portion or the full set of storage-related values. Because the
economics are such that the value of storage is spread across a wide range of uses and market
segments, the best policy environment is one that supports the deployment of storage on the
system where most of the value streams can be captured under multiple different business
models. Finally, we expand our discussion of the business model that relies on TDSP investment
in storage, accompanied by third-party dispatch of those resources into the wholesale market.
We propose that Texas policy makers consider establishing a regulatory framework that will
enable the state to capture the full value of deploying grid-integrated electricity storage through
this and related business models. In developing a policy framework that could support the
development of electricity storage in ERCOT, we identify a few objectives that must be met
where possible. First, the policy framework should allow investors to maximize the value that
can be captured by electricity storage. Second, the approach should maintain a clear functional
separation between the regulated transmission and distribution companies’ role and the
competitive wholesale market suppliers’ role. Most importantly, the policy should protect
investment signals provided by the deregulated wholesale market from potential collateral
impacts that might be introduced by regulated storage investments. Third, the policy framework
should yield efficient investment decisions and not create adverse incentives for companies to
over- or under-invest given the costs of the storage facilities. Considering these objectives, we
separate the range of available policy frameworks into two general categories that:
Subsidize or mandate storage investments at a net cost to taxpayers or ratepayers, or
Remove barriers to capturing the full value to enable cost-effective storage whenever it is
the most economic technology for a particular application.

53 | brattle.com
The first option, to subsidize or mandate investments in electricity storage at a net cost to
ratepayers or taxpayers, may take the form of direct government investment, subsidies to
merchant or regulated storage developers, or through a policy mandate that directs regulated
entities to invest in a certain quantity of storage, with subsidies collected from customers’
charges.79 There are many examples where a state or federal government has used direct
subsidies and mandates to stimulate investments in storage or other technologies that a market-
based approach has not yielded. For example, state renewable portfolio standards (RPSs)
mandate that load-serving entities procure a certain fraction of their supply from renewable
energy resources. Those mandates result in a payment of renewable energy credits (RECs) to
renewable resources, providing revenues beyond those earned in the wholesale electricity
market. For electricity storage, mandates would similarly result in additional payments from
ratepayers or taxpayers to support storage investment. Depending on their policy objectives,
governments also have used incentives and mandates to stimulate economic development and
local employment, or to support a nascent technology such as storage. These types of policies
may be quite effective at stimulating storage, but we do not view them as the best current policy
choice in Texas given the unique nature of the ERCOT market structure and the state’s reliance
on market mechanisms as the preferred policy and regulatory approach.
The second option for a policy framework involves removing barriers that hinder the use of
storage in a manner that maximizes the values captured. Such a framework would, therefore,
encourage storage investment only to the extent that it is economically efficient to do so. In
ERCOT, this will also require maintaining the functional separation between regulated and
competitive services.80 To achieve these goals, the policy framework must allow investors and
operators to enter into contractual relationships to “share the uses” of the storage and thereby
encourage the owners and users of the storage devices to reach agreements about how to
maximize the value and associated revenues for the services that storage delivers to customers.
Once the barriers for efficient investments are removed, we believe that ERCOT will attract
substantial investments in storage if battery costs decline to the projected levels that we have
analyzed in this report.
79 As an example of a direct government investment, Duke Energy received a matching $22 million
dollar grant from the U.S. Department of Energy (DOE) as part of the 2009 stimulus program to install
energy storage with its Notrees Windpower Project in Texas, funded by DOE under the American
Recovery and Reinvestment Act of 2009, see Duke Energy (2009). As an example of a procurement
mandate, San Diego Gas and Electric announced that they are seeking offers for at least 25 MWs of
energy storage as part of California’s state mandate to develop energy storage. This procurement
contributes to the target of 1,325 MW of energy storage to be procured by the three investor-owned
utilities by 2020, with the first procurement in March 2014 and facilities installed by the end of 2024.
See Public Utility Commission of the State of California (2013) and San Diego Gas & Electric (2014).
80 We note that policy frameworks that allow for the combination of value streams do not preclude
investment in storage for the sole purpose of merchant participation in the wholesale market, or for
specific T&D deferral by a TDSP, they only augment the range of business models that can be
accommodated to develop storage units.
54 | brattle.com
In Table 4 below, we describe the range of business models that could be considered, describing
their advantages and disadvantages with respect to the amount of storage developed, customer
benefits, and overall costs. In particular, we focus on the ability of each business model to
capture and monetize the currently-fragmented value streams for storage. We focus on business
models for in-front-of-the-meter storage that allow for direct participation in ERCOT’s
wholesale power markets. Significant additional policy, retail pricing, and customer incentive
challenges would be associated with capturing wholesale market benefits through behind-the-
meter storage devices owned by customers or retail energy service providers.81
As summarized in Table 4, a policy framework that enables capturing the fragmented value
streams will need to support one of the business models that involves joint ownership or
operations of the storage devices by wholesale market participant and the TDSPs. Specifically,
the three joint business models include:
1. Leaving the storage investment to merchant wholesale market participants and allowing
the TDSPs to pay the merchant investors for any values associated with reducing T&D
costs or improving customer reliability;
2. Allowing TDSPs to invest in electricity storage with regulated cost recovery and allowing
them to enter into agreements with third-party entities to dispatch the storage into
wholesale markets at an arm’s length from the TDSP functions; and
3. Allowing TDSPs and wholesale market participants to jointly own storage, such that the
joint venture parties would share investment, operations, on-going costs, and the
revenues received from the wholesale market or T&D customers.
81 While we do not provide a full discussion of the challenges associated with developing storage on a
behind-the-meter basis, we note here a subset of the issues that would need to be addressed to enable
these assets. For example, many customers, particularly smaller customers, face volumetric rather
than demand-based charges for distribution costs, making it difficult to capture avoided T&D value
and incurring excess distribution costs through volumetric charges, including those on the additional
energy needed for round-trip efficiency losses. Retail rates generally do not reflect real-time or day-
ahead wholesale market prices (except possibly for some of the largest customers), making it very
difficult to capture the wholesale energy market value of storage. In addition, it is very difficult and
potential infeasible to capture ancillary service value with behind-the-meter storage devices, because
ancillary services must be sold directly into ERCOT’s wholesale power market.
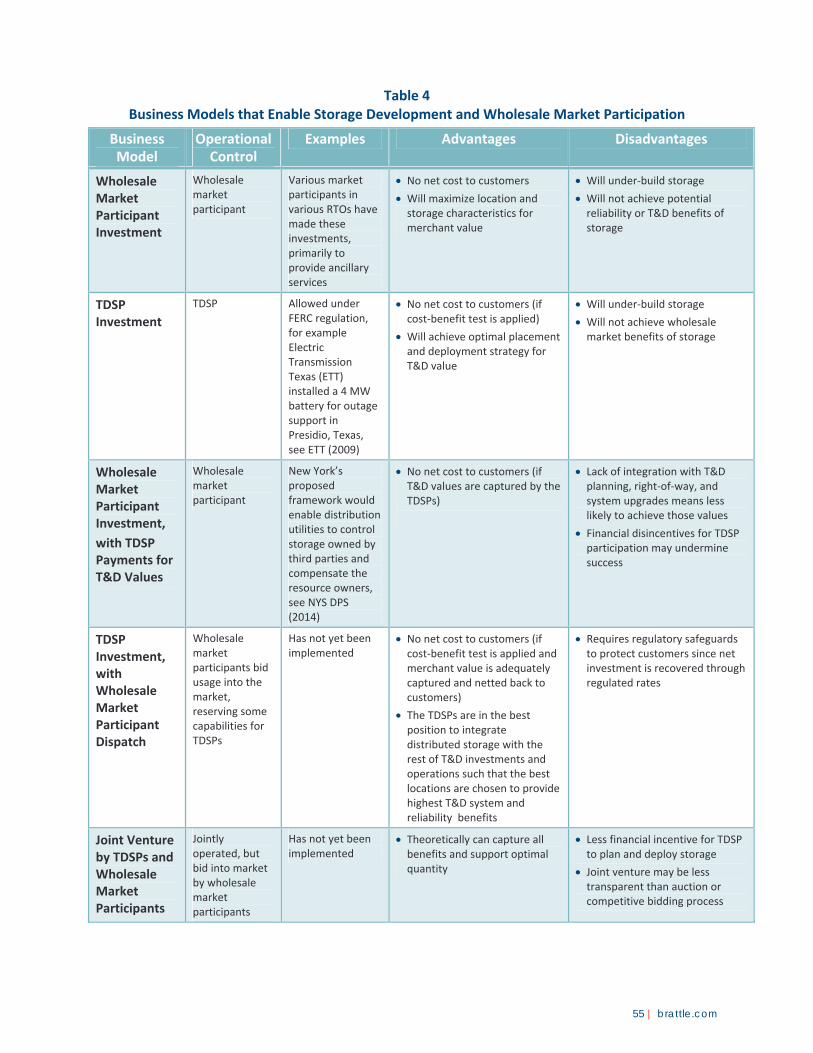
55 | brattle.com
Table 4 Business Models that Enable Storage Development and Wholesale Market Participation
Business Model
Operational Control
Examples Advantages Disadvantages
Wholesale Market Participant Investment
Wholesale market participant
Various market participants in various RTOs have made these investments, primarily to provide ancillary services
No net cost to customers
Will maximize location and storage characteristics for merchant value
Will under‐build storage
Will not achieve potential reliability or T&D benefits of storage
TDSP Investment
TDSP Allowed under FERC regulation, for example Electric Transmission Texas (ETT) installed a 4 MW battery for outage support in Presidio, Texas, see ETT (2009)
No net cost to customers (if cost‐benefit test is applied)
Will achieve optimal placement and deployment strategy for T&D value
Will under‐build storage
Will not achieve wholesale market benefits of storage
Wholesale Market Participant Investment,
with TDSP Payments for T&D Values
Wholesale market participant
New York’s proposed framework would enable distribution utilities to control storage owned by third parties and compensate the resource owners, see NYS DPS (2014)
No net cost to customers (if T&D values are captured by the TDSPs)
Lack of integration with T&D planning, right‐of‐way, and system upgrades means less likely to achieve those values
Financial disincentives for TDSP participation may undermine success
TDSP Investment, with Wholesale Market Participant Dispatch
Wholesale market participants bid usage into the market, reserving some capabilities for TDSPs
Has not yet been implemented
No net cost to customers (if cost‐benefit test is applied and merchant value is adequately captured and netted back to customers)
The TDSPs are in the best position to integrate distributed storage with the rest of T&D investments and operations such that the best locations are chosen to provide highest T&D system and reliability benefits
Requires regulatory safeguards to protect customers since net investment is recovered through regulated rates
Joint Venture by TDSPs and Wholesale Market Participants
Jointly operated, but bid into market by wholesale market participants
Has not yet been implemented
Theoretically can capture all benefits and support optimal quantity
Less financial incentive for TDSP to plan and deploy storage
Joint venture may be less transparent than auction or competitive bidding process

56 | brattle.com
While each of these three joint business models has its own advantages and disadvantages, we
will more fully discuss the second option of TDSP deployment with third-party dispatch. We
believe that this is an attractive business model for deploying grid-integrated storage and
reducing barriers to capturing the full set of storage-related values in ERCOT. This policy
framework would allow TDSPs to:
1. Make the storage investments based on Commission-approved deployment plans;
2. Rate base the investments for regulated cost recovery;
3. Integrate the storage deployment with the TDSP’s transmission and distribution planning
activities;
4. Operate storage to improve grid reliability and avoid customer outages;
5. Auction off the market dispatch to third-party wholesale market participants who would
schedule the charging and discharging of the storage devices to maximize revenues from
the wholesale market; and
6. Credit back the auction proceeds to ratepayers to reduce the regulated rates that the
TDSPs’ retail customers pay for the storage investments.
Under this policy framework, the TDSPs would continue to be involved only in transmission and
distribution services without direct wholesale market participation. Third-party wholesale
market participants who obtained market dispatch rights would need to accept certain
restrictions on their dispatch into the wholesale market before entering into these contracts (e.g., by agreeing to fully charge the batteries at times when major storms are forecasted and
distribution outages anticipated).82
One significant advantage of allowing TDSPs to invest in storage is that they are in the best
position to identify, deploy, and operationally integrate storage in the most beneficial locations
within the distribution system, thereby capturing the most value from transmission and
distribution cost deferrals and improved customer reliability. TDSPs also have access to existing
distribution system rights-of-way for the placement of the storage devices and can leverage their
82 Even though at times, the use of the storage to avoid customers’ power outages may be in conflict with
maximizing the value the storage can obtain from the wholesale markets, we anticipate those times
would be infrequent because the most foreseeable outages occur with forecast storm events that do
not typically occur during times of peak electricity demand. Thus, batteries can be charged up and
held at full charge before an anticipated storm event. At the same time, it is important to avoid
constraints on wholesale market operations that reduce the wholesale market value of the storage
devices by more than the incremental reliability and T&D benefits provided by the operational
constraints. These potentially conflicting uses must also be accounted for in cost-benefit analyses to
make sure the aggregate benefits are simultaneously achievable. For example, in this study,
recognizing that the storage devices would go through a full charge and discharge cycle on an almost
daily basis (and considering the fact that the devices are near but not within customer premises), we
assumed that only approximately 50% of the full reliability value would be captured.

57 | brattle.com
existing operations and maintenance infrastructure to operate and maintain the devices. But in
evaluating this business model and the benefit-cost analysis in each individual storage
deployment plan, Texas policy makers will need to weigh the tradeoff between: (1) the advantage
of allowing the TDSPs to own the storage devices and optimize the deployment based on T&D
and reliability benefits; and (2) the potential risks associated with allowing TDSPs to recover the
investment costs associated with storage deployment from ratepayers.
We believe that the advantages of grid-integrated storage owned by TDSPs exceed its risks if
appropriate regulatory safeguards and market mechanism are implemented. Risks can be
mitigated, for example, through a regulatory process that ensures that TDSP storage investments
are made gradually with deployment plans evaluated and approved by the Texas Public Utilities
Commission. The deployment plans would include assessing the expected value proposition for
each round of investments. The experience gained in (smaller) earlier rounds of investment
could then inform the value proposition of the subsequent (larger) tranches of investments.
We envision a regulatory process that would allow TDSPs to make the investment in electricity
storage and recover the associated investment costs through regulated rates as long as: (a) a
significant fraction of the value of these storage assets is associated with transmission and
distribution system benefits that are not captured through wholesale market participation; (b) it
is shown that the incremental system-wide benefits are expected to exceed costs by a sufficient
margin; and (c) the aggregate TDSP storage investments are sufficiently limited in scale and
phased-in over time such that they would not create excess supply conditions in the ERCOT
wholesale market or eliminate the need for new generation investments. In addition, regulations
would be needed to maintain a clear delineation between the storage-related functions of the
regulated TDSPs and those of the wholesale market participants.
While the detailed design remains to be developed, we believe that this proposed regulatory
framework has substantial promise for a deployment of grid-integrated storage. The benefits of
storage associated with improved system reliability, deferred transmission and distribution
investments, and participation in ERCOT’s wholesale energy and ancillary services markets could
all be captured simultaneously while aligning market participants’ and customers’ interests with
those of the T&D utilities making the storage investments. This approach could resolve the
barriers created by fragmented value streams that will otherwise lead to under-investment in
electric energy storage in Texas.
While we have provided a sketch of this policy framework, we also acknowledge a number of
important components that have not yet been designed or evaluated comprehensively. Areas
that we have not addressed in this report include:
1. We have not developed an actionable deployment plan. We envision that realistic
deployment plans would involve a phased-in approach during which the cost-
effectiveness could be proven based on actual experience with the necessary operational,
regulatory, contractual, and financial arrangements. We also anticipate that the
regulatory process could allow for a phase of “learning by doing” before larger-scale
deployment and financial commitments are approved.
58 | brattle.com
2. We have not developed the parameters of the auction design, the detailed regulatory
framework, or the specific safeguards that would be needed to operationally and
financially unbundle the regulatory and competitive market functions of the storage
devices in ERCOT’s market structure. Some of the parameters that would need to be
developed include:
a. The scope and process for regulatory approvals;
b. The specific roles of TDSPs and other market participants in asset ownership and
operations;
c. The terms and durations of the contracts between the TDSP and third-party
market participants;
d. The structure of the auction or procurement process that could be used to
financially unbundle regulated and competitive uses; and
e. The allocation and regulatory treatment of auction proceeds (as a revenue credit
or ratebase offset, an up-front or annual payment, etc.).
3. We also have not specified the optimal operational limits that would need to be imposed
on charging and discharging cycles to make it possible to obtain a sizable portion of the
evaluated transmission, distribution, and reliability benefits, while also allowing the
storage devices to participate in ERCOT’s energy and ancillary services markets to
maximize the overall value of deploying grid-integrated storage.
To move beyond the conceptual regulatory framework outlined in this report, these three areas
should be considered in developing a regulatory roadmap for Texas. In addition, we suggest that
policy makers, regulators, and market participants engage in a dialogue to carefully consider this
policy and regulatory framework, along with other potential electricity storage business models
described above. Further, careful evaluation of the advantages and disadvantages of each
proposed business model would help all involved in developing a robust approach for Texas to
maximize the benefits of grid-integrated electricity storage.

59 | brattle.com
List of Acronyms ATWACC After-Tax Weighted-Average Cost of Capital
CAISO California Independent System Operator
CC Combined-Cycle
CDR Capacity Demand and Reserves
C/I Commercial and Industrial
CIM Customer Interruption Minutes
CO2 Carbon Dioxide
CONE Cost of New Entry
CP Coincident Peak
CPUC California Public Utilities Commission
DOE Department of Energy
EIA Energy Information Administration
EPRI Electric Power Research Institute
ERCOT Electric Reliability Council of Texas
EV Electric Vehicle
FERC Federal Energy Regulatory Commission
GRR Generator Revenue Reduction
GWh Gigawatt Hour
ISO Independent System Operator
kVA Kilo Volt Amp (1,000 Volt Amp)
kWh Kilowatt-hour
LIPA Long Island Power Authority
MISO Midcontinent Independent System Operator
mmBtu One Million British Thermal Units
MW Megawatt
MWh Megawatt-hour
NaS Sodium-Sulfur
NPV Net Present Value
NYISO New York Independent System Operator

60 | brattle.com
O&M Operations and Maintenance
ORDC Operating Reserve Demand Curve
PCS Production Cost Savings
PJM PJM Interconnection
PSO Polaris Systems Optimization
PUCT Public Utility Commission of Texas
REC Renewable Energy Credit
RPS Renewable Portfolio Standard
SAIDI System Average Interruption Duration Index
SCE Southern California Edison
T&D Transmission and Distribution
TDSP Transmission and Distribution Service Provider
VOLL Value of Lost Load
VOM Variable Operations and Maintenance
WA Washington

61 | brattle.com
Bibliography AES Energy Storage (2013), “AES Marks Energy Storage Milestone with 400,000 MW-h of PJM
Service from Laurel Mountain.” News Release. Online at
http://www.aesenergystorage.com/2013/04/11/aes-marks-energy-storage-milestone-with-
400000-mw-h-of-pjm-service-from-laurel-mountain/
Akhil, Abbas, Georgianne Huff, Aileen B. Currier, Benjamin C. Kaun, Dan M. Rastler, Stella
Bingqing Chen, Andrew L. Cotter, Dale T. Bradshaw, and William D. Gauntlett (2013),
DOE/EPRI 2013 Electricity Storage Handbook in Collaboration with NRECA, Sandia
National Laboratories, July 2013. Posted at
http://energy.gov/sites/prod/files/2013/08/f2/ElecStorageHndbk2013.pdf
American Electric Power (2009), Electric Transmission Texas Signs Contract for Largest Utility-
scale Battery in U.S., News Release. Online at
http://www.aep.com/newSroom/newSreleaSeS/Default.aspx?id=1560
Balducci, Patrick, Patrick Leslie, Chunlian Jin, Charles Daitch, Di Wu, Andy Marshall, and
Michael Kintner-Meyer, (2013), Assessment of Energy Storage Alternatives in the Pudget Sound Energy System, Volume 1: Financial Feasibility Analysis, Pacific Northwest National
Laboratory, PNNL-23040, December 2013 (“Balducci, et al., 2013”). Posted at
http://www.pnnl.gov/main/publications/external/technical_reports/PNNL-23040.pdf
Bhatnager, Dhruv, Aileen Currier, Jacquelynne Hernandez, Ookie Ma and Brendan Kirby (2013),
Market and Policy Barriers to Energy Storage Deployment: A Study for the Energy Storage Systems Program, Sandia National Laboratories, SAND2013-7606. September 2013. Posted at
http://www.consultkirby.com/files/SAND2013-
7606_Market_and_Policy_Barriers_to_Energy_Storage_Development_September_2013.pdf
Bjelovuk, George (2010), American Electric Power’s Utility-Scale Energy Storage, presented at
NARUC Summer Committee Meetings 2010. Posted at
http://www.narucmeetings.org/Presentations/Bjelovuk,%20Energy%20Storage%20and%20R
enewables,%20NARUC,%207-18-10.pdf
Byrd, Stephan, Timothy Radcliff, Simon Lee, Bobby Chada, Dominik Olszewski, Yuka
Matayoshi, Parag Gupta, Miguel Rodrigues, Adam Jonas, Peter J. Mackey, Paul R. Walsh,
Mary Curtis Roy Campbell, and Dimple Gosai (2014), Morgan Stanley Blue Paper- Solar Power and Energy Storage: Policy Factors v Improving Economics, July 28, 2014. Posted at
http://energystorage.org/system/files/resources/morgan_stanley_solar_power_energy_storage
_blue_paper_july_29_2014.pdf
Byrne, Raymond H., César A. Silva-Monroy (2012), Estimating the Maximum Potential Revenue for Grid Connected Electricity Storage: Arbitrage and Regulation: A Study for the DOE Energy Storage Systems, Sandia National Laboratories, SAND2012-3863, December 2012.
Posted at http://www.sandia.gov/ess/publications/SAND2012-3863.pdf

62 | brattle.com
Byrne, Raymond H., Matthew K. Donnelly, Verne W. Loose, and Daniel J. Trudnowski (2012),
Methodology to Determine the Technical Performance and Value Proposition for Grid-Scale Energy Storage Systems: A Stud for the DOE Energy Storage Systems Program, Sandia
National Laboratories, SAND2012-10639, December 2012. Posted at
http://www.sandia.gov/ess/publications/SAND2012-10639.pdf
Cameron, Claire (2014), “Oncor to test battery storage on grid,” Utility Dive, May 12, 2014.
Online at http://www.utilitydive.com/news/oncor-to-test-battery-storage-on-grid/262122/.
Carnegie, Rachel, Douglas Gotham, David Nderitu, and Paul V. Preckel (2013), Utility Scale Energy Storage Systems: Benefits, Applications and Technologies, State Utility Forecasting
Group. June 2013. Posted at
http://www.purdue.edu/discoverypark/energy/assets/pdfs/SUFG/publications/SUFG%20Ener
gy%20Storage%20Report.pdf
Carson, Erin, Eric Davis (2014), “Non-Hydro Energy Storage Gaining Traction in Grid-Scale
Applications: Technological Advancements, Supportive Polices, and Economies of Scale
Drive Energy Storage Growth,” EnerKnol Research, November 24, 2014. Online at
http://enerknol.com/wp-content/uploads/2014/11/EnerKnol-Research-Energy-Storage-
11.24.14.pdf
Chang, Judy and Jurgen Weiss (2012), Comparing Energy Storage Business Models and Applications, presented at Energy Storage Forum Europe 2012, June 2012.
Chang, Judy, Kathleen Spees, and Jürgen Weiss (2010), Renewables and Storage—Does Size Matter?, The Brattle Group, March 11, 2010. Posted at
http://www.brattle.com/system/publications/pdfs/000/004/708/original/Renewables_and_Stor
age_-_Does_Size_Matter_Chang_Spees_Weiss_Mar_11_2010.pdf?1378772123.
Cordner, Christine (2014), “SoCalEd seeks Calif. PUC Approval of Energy Storage, Local Capacity
Contracts,” SNL Article, November 24, 2014.
Denholm, Paul, Jennie Jorgenson, Marissa Hummon, Thomas Jenkin, and David Palchak (2013),
The Value of Energy Storage for Grid Applications, National Renewable Energy Laboratory,
NREL/TP-6A20-58465, May 2013. Posted at http://www.nrel.gov/docs/fy13osti/58465.pdf.
Denholm, P., S.E Letendre (2007), “Grid Services From Plug-in Hybrid Electric Vehicles: A Key
to Economic Viability?,” Electrical Energy Storage—Applications and Technology Conference, September 25, 2007.
Duke Energy (2009), “Duke Energy Receives $22 Million Federal Grant for Wind Power
Storage.” News Release. Online at http://www.duke-
energy.com/news/releases/2009112402.asp
Dumoulin-Smith, Julien, Colin Langan, Michael Weinstein, and Paul Zimbardo (2014a), US Electric Utilities and IPPs: The Storage Opportunity, UBS Global Research, October 2, 2014.
Posted at https://neo.ubs.com/shared/d1vn32UwCm8eh
63 | brattle.com
Dumoulin-Smith, Julien, Michael Weinstein, and Paul Zimbardo (2014b), US Electric Utilities and IPPs: Exploring the Frequency Regulation Opportunity for Batteries (Incl. Conf Call Transcript), December 11, 2014. Posted at https://neo.ubs.com/shared/d1fWmcmSfOViGc
Drury, E., P. Denholm, and R. Sioshansi (2011), “The Value of Compressed Air Energy Storage in
Energy and Reserve Markets,” Energy (36); pp. 4959–4973.
Electric Power Research Institute (2010), Electricity Energy Storage Technology Options: A White Paper Primer on Applications, Costs, and Benefits, D. Rastler (Proj. Mgr.), EPRI
1020676, December 2010. Posted at
http://large.stanford.edu/courses/2012/ph240/doshay1/docs/EPRI.pdf
Electric Power Research Institute (2015), The Integrated Grid: A Benefit-Cost Framework, K.
Forsten (Proj. Mgr.), EPRI 3002004878, February 2015. Posted at
http://www.epri.com/abstracts/Pages/ProductAbstract.aspx?ProductId=000000003002004878
&Mode=download
Electric Reliability Council of Texas and William Hogan (2013), Back Cast of Interim Solution B+ to Improve Real-Time Scarcity Pricing, March 21, 2013. Posted at
http://www.ercot.com/content/gridinfo/resource/2015/mktanalysis/White_Paper_Back_Cast_
of_Interim_Solution_B+_to_Improve_Re.pdf
Electric Reliability Council of Texas (2014a), About the Operating Reserve Demand Curve and Wholesale Electric Prices, Press Release, May 2014. Online at
http://www.ercot.com/content/news/presentations/2014/ORDCUpdate_FINAL1.pdf
Electric Reliability Council of Texas (2014b), 2014 ERCOT Planning Long-Term Hourly Peak Demand and Energy Forecast, March 31, 2014. Posted at
http://www.ercot.com/gridinfo/load/2014%20Long-
Term%20Hourly%20Peak%20Demand%20and%20Energy%20Forecast.pdf
Electric Reliability Council of Texas (2014c), Report on the Capacity, Demand, and Reserves in the ERCOT Region, May2014. Posted at
http://www.ercot.com/content/news/presentations/2014/CapacityDemandandReserveReport-
May2014.pdf
Electric Reliability Council of Texas (2014d), Future Ancillary Services Team. Online at
http://www.ercot.com/committees/other/fast.
Electric Reliability Council of Texas (2014e), 2014 Long-Term System Assessment for the ERCOT Region, December 2014. Posted at
http://www.ercot.com/content/news/presentations/2014/CapacityDemandandReserveReport-
May2014.pdf
Electric Transmission Texas (2009), “Electric Transmission Texas signs contract for largest utility-
scale battery in the U.S.” News Release. Posted at
http://www.ettexas.com/projects/docs/NAS_PressRelease_Presidio%20NaS%20Battery_09010
9.pdf
64 | brattle.com
Electricity Advisory Committee (2008), Bottling Electricity: Storage as a Strategic Tool for Managing Variability and Capacity Concerns in the Modern Grid, December 2008. Posted at
http://energy.gov/sites/prod/files/oeprod/DocumentsandMedia/final-energy-storage_12-16-
08.pdf
Energy Information Administration (2014). Electricity, Electricity Detailed Survey Data Files,
Form EIA-826 detailed data, May 20, 2014. Online at
http://www.eia.gov/electricity/data/eia826/
Energy Storage Association (2014), T&D Upgrade Deferral. Online at
http://energystorage.org/energy-storage/technology-applications/td-upgrade-deferral
Federal Energy Regulatory Commission, Order on Rate Incentives and Compliance Filings, in the
matter of Nevada Hydro Company, Inc., Docket Nos. ER06-278-000 through 006, Issued
March 24, 2008 (122 FERC ¶ 61,272). Posted at
http://elibrary.ferc.gov/idmws/file_list.asp?document_id=13591825
Federal Energy Regulatory Commission, Order on Petition for Declaratory Order, in the matter
of Western Grid Development, LLC, Docket No. EL10-19-000, Issued January 21, 2010 (130
FERC ¶ 61,056). Posted at https://www.ferc.gov/whats-new/comm-meet/2010/012110/E-
6.pdf
Federal Energy Regulatory Commission, Order 755, Frequency Regulation Compensation in the Organized Wholesale Power Markets, Issued October 20, 2011 (137 FERC ¶ 61,064). Posted
at http://www.ferc.gov/whats-new/comm-meet/2011/102011/E-28.pdf
Federal Energy Regulatory Commission, Order 784, Third-Party Provision of Ancillary Services; Accounting and Financial Reporting for New Electric Storage Technologies, Issued July 18,
2013 (144 FERC ¶ 61,056). Posted at http://www.ferc.gov/whats-new/comm-
meet/2013/071813/E-22.pdf
Figueiredo, F.C., P.C. Flynn, and E.A. Cabral (2006), “The Economics of Energy Storage in 14
Deregulated Power Markets,” Energy Studies Review (14), pp. 131–152.
Gyuk, Imre (Proj.Mgr.) (2003), EPRI-DOE Handbook of Energy Storage for Transmission & Distribution Applications, U.S. Department of Energy and Electric Power Research Institute,
1001834, Final Report, December 2003. Posted at
http://www.sandia.gov/ess/publications/ESHB%201001834%20reduced%20size.pdf
He, Xian, Erik Delarue, William D’haeseleer, and Jean-Michel Glachant (2010), A Novel Business Model For Aggregating The Values Of Electricity Storage. EUI Working Papers, Robert
Schuman Centre for Advanced Studies. Posted at
http://cadmus.eui.eu/bitstream/handle/1814/14994/RSCAS_2010_82.pdf
Heslin, Martin F. (2014), Letter from Martin F. Heslin (conEdison) to Hon. Kathleen H. Burgess
(Secretary, NYPSC) re Con Edison’s Electric, Gas, and Steam Rates, Con Edison’s Brownsville
Load Area Plan, Cases 13-E-0030, et al., August 21, 2014. Posted at
http://documents.dps.ny.gov/public/Common/ViewDoc.aspx?DocRefId={FA6E8548-E790-
4E6A-8BF2-61DDF62EAB4E}
65 | brattle.com
Hoffman, M.G., A Sadovsky, MC Kintner-Meyer, and JG DeSteese (2010), Analysis Tools for Sizing and Placement of Energy Storage in Grid Applications: A Literature Review, prepared
by the Pacific Northwest National Laboratory for U.S. Department of Energy, PNNL-19703,
September 2010. Posted at
http://www.pnl.gov/main/publications/external/technical_reports/PNNL-19703.pdf
Hornby, Rick, Paul Chernick, David White, John Rosenkranz, Ron Denhardt, Elizabeth A.
Stanton, Jason Gifford, Bob Grace, Max Chang, Patrick Luckow, Thomas Vitolo, Patrick
Knight, Ben Griffiths, and Bruce Biewald (2013), Avoided Energy Supply Costs in New England: 2013 Report, Synapse Energy Economics, Inc., July 12, 2013. Posted at
http://publicservice.vermont.gov/sites/psd/files/Topics/Energy_Efficiency/AESC%20Report%
20-%20With%20Appendices%20Attached.pdf
Hummel, Patrick, Philippe Houchois, Joe Dewhurst, Alberto Gandolfi, Stephen Hunt, David
Lesne, Stephen Oldfield, David Leitch, Julien Dumoulin-Smith, Thomas Gilbert, Fredric
Stahl, and Takaaki Muramatsu (2014), Q-Series: Global Utilities, Autos & Chemicals: Will Solar, Batteries and Electric Cars Re-shape the Electricity System?, UBS Global Research.
August 20, 2014. Posted at https://neo.ubs.com/shared/d1Q20lDOUv.
ICF Consulting (2005), Avoided Energy Supply Costs in New England, December 2005. Posted at
http://www.mass.gov/eea/docs/dpu/energy-efficiency/avoided-energy-supply-costs-in-new-
england/2005-avoided-energy-supply-costs-report.pdf
IEE USA (2014), Summary of the IEE Report to DOE QER on Priority Issues, prepared for US
Department of Energy. Posted at
http://www.ieeeusa.org/volunteers/committees/epc/documents/IEEEJointTaskForceonQER-
Summary.pdf.
International Energy Agency (2014), Technology Roadmap Energy Storage. Posted at
http://www.iea.org/publications/freepublications/publication/TechnologyRoadmapEnergysto
rage.pdf.
Jaffe, Sam (2014), “Energy Storage Supply Chain Opportunities,” Navigant Research, September
2014. Posted at
http://www.eastmanbusinesspark.com/uploads/blog/pdf/Sam_Jaffe_Navigant%20_Energy_Su
pply_Chain.pdf
Jenkin, Thomas, Jurgen Wess (2005), Estimating the Value of Electricity Storage: Some Size, Location, and Market Structure Issues, October 2005. Posted at
http://www.nrel.gov/docs/legosti/old/38988.pdf
Kaun, B., S. Chen (Proj.Mgrs.) (2013), Cost-Effectiveness of Energy Storage in California: Application of the EPRI Energy Storage Valuation Tool to Inform the California Public Utility Commission Proceeding R. 10-12-007, Electric Power Research Institute, June 2013.
Posted at
http://www.epri.com/abstracts/Pages/ProductAbstract.aspx?ProductId=000000003002001162
Kinter-Meyer, M, P Balducci, W Colella, M Elizondo, C Jin, T Nguyen, V Viswanathan, and Y
Zhang (2013), National Assessment of Energy Storage for Grid Balancing and Arbitrage :
66 | brattle.com
Phase: II: WECC, ERCOT, EIC, Volume 1: Technical Analysis, Pacific Northwest National
Laboratories, September 2013. Posted at
http://energyenvironment.pnnl.gov/pdf/National_Assessment_Storage_PHASE_II_vol_1_fina
l.pdf
Kirby, Brendan (2011), Energy Storage Management for VG Integration, presentation prepared
for UWIG FALL Technical Workshop, Golden, CO: National Renewable Energy Laboratory,
NREL/PR-5500-53295, October 13, 2011. Posted at
http://www.nrel.gov/docs/fy12osti/53295.pdf
Kirby, Brendan (2012), Co‐Optimizing Energy and Ancillary Services from Energy Limited Hydro and Pumped Storage Plants. (Palo Alto, CA: EPRI, HydroVision, July 2012).
Kumar, Nikhil, Philip M. Besuner , Steven A. Lefton , Dwight D. Agan, and Douglas D. Hilleman (2012), Power Plant Cycling Costs, AES 12047831-2-1, prepared by Intertek APTECH for
National Renewable Energy Laboratory and Western Electricity Coordinating Council, April
2012. Posted at http://wind.nrel.gov/public/WWIS/APTECHfinalv2.pdf
Long Island Power Authority (2013), Request for Proposals for New Generation, Energy Storage and Demand Response Resources (“2013” GS & DR RFP”), November 25, 2013. Posted at
http://www.lipower.org/proposals/docs/GSDR-clean.pdf
London Economics International LLC (2013), Estimating the Value of Lost Load, Briefing paper
prepared for ERCOT, June 17, 2013. Posted at
http://www.ercot.com/content/gridinfo/resource/2014/mktanalysis/ERCOT_ValueofLostLoad
_LiteratureReviewandMacroeconomic.pdf
Midwest Independent System Operator (2006), Value of Lost Load Final Report, May 15, 2006.
Posted at
https://www.midwestiso.org/Library/Repository/Meeting%20Material/Stakeholder/SAWG/20
06/20060515/20060515%20SAWG%20RAWG%20VOLL%20Final%20Report.pdf
Newell, Samuel, Kathleen Spees, Johannes Pfeifenberger, Robert Mudge, Michael DeLucia, and
Robert Carlton (2012), ERCOT Investment Incentives and Resource Adequacy, prepared for
ERCOT, June 1, 2012. Posted at
http://www.ercot.com/content/news/presentations/2012/Brattle%20ERCOT%20Resource%2
0Adequacy%20Review%20-%202012-06-01.pdf
Newell, Samuel, J. Michael Hagerty, and Quincy X. Liao (2013), 2013 Offer Review Trigger Prices Study, prepared for ISO- New England, October 2013. Posted at
http://www.brattle.com/system/publications/pdfs/000/004/981/original/2013_Offer_Review_
Trigger_Prices_Study_Newell_Hagerty_Liao_ISONE_Oct_2013.pdf?1391611215
Newell, Samuel A., J. Michael Hagerty, Kathleen Spees, Johannes P. Pfeifenberger, Quincy Liao,
Christopher D. Ungate, and John Wroble. (2014a), Cost of New Entry Estimates for Combustion Turbine and Combined Cycle Plants in PJM with June 1, 2018 Online Date, May
15, 2014. Posted at
http://www.brattle.com/system/publications/pdfs/000/005/010/original/Cost_of_New_Entry_
Estimates_for_Combustion_Turbine_and_Combined_Cycle_Plants_in_PJM.pdf?1400252453
67 | brattle.com
Newell, Samuel, Kathleen Spees, Johannes P. Pfeifenberger, Ioanna Karkatsouli, Nick
Wintermantel, and Kevin Karden. (2014b), Estimating the Economically Optimal Reserve Margin in ERCOT, prepared for ERCOT, January 31, 2014. Posted at
http://www.brattle.com/system/publications/pdfs/000/004/978/original/Estimating_the_Econ
omically_Optimal_Reserve_Margin_in_ERCOT_Revised.pdf?1395159117
N.V. (2014), “Difference engine: Tesla’s high-stakes gamble,” Babbage Science and Technology,
The Economist, September 22, 2014. Posted at
http://www.economist.com/blogs/babbage/2014/09/difference-engine-1
NYS Department of Public Service (2014), Reforming the Energy Vision. Case 14-M-0101. April
24, 2014. Posted at
http://www3.dps.ny.gov/W/PSCWeb.nsf/96f0fec0b45a3c6485257688006a701a/26be8a93967e
604785257cc40066b91a/$FILE/ATTK0J3L.pdf/Reforming%20The%20Energy%20Vision%20(
REV)%20REPORT%204.25.%2014.pdf
PJM Interconnection Regulation Senior Task Force (2013), Performance Based Regulation: Year
One Analysis, October 12, 2013; Attachment I to Letter from James M. Burlew and Craig
Glazer (PJM Interconnection) to Hon. Kimberly D. Bose, re Performance-Based Regulation
Revisions, Docket Nos. ER12-1204-004 and ER12-2391-003, dated October 16, 2013. Posted
at http://www.pjm.com/~/media/documents/ferc/2013-filings/20131016-er12-1204-004.ashx
Potomac Economics. (2014) 2013 State of the Market Report for the ERCOT Wholesale Electricity Markets, September 2014. Posted at
https://www.potomaceconomics.com/uploads/ercot_documents/2013_ERCOT_SOM_REPOR
T.pdf
Public Utility Commission of the State of California (2013), Decision Adopting Energy Storage
Procurement Framework and Design Program, Rulemaking 10-12-007 (Filed December 16,
2010), Decision 13-10-040, October 17, 2013 Posted at
http://docs.cpuc.ca.gov/PublishedDocs/Published/G000/M079/K533/79533378.PDF
Public Utility Commission of Texas (2012), Order Adopting Amendment to §25.101 as Approved
at the March 7, 2012 Open Meeting, Rulemaking Proceeding to Implement HB 971 Relating
to Economic Criteria for a Certificate of Convenience and Necessity for an Electric
Transmission Project, Project No. 39537, n.d. Posted at
http://www.puc.texas.gov/agency/rulesnlaws/subrules/electric/25.101/39537adt.pdf
Public Utility Commission of Texas (2014), “Generic Transmission and Distribution Rates,”
Updated September 1, 2014. Posted at
http://www.puc.texas.gov/industry/electric/rates/Trans/TDGenericRateSummary.pdf
Qian, Kejun, Chengke Zhou, Zhaohui Li, and Yue Yuan (2009), Benefits of Energy Storage in Power Systems with High Level of Intermittent Generation, 20th International Conference
on Electricity Distribution. June 2009.
Rocky Mountain Institute (2014), The Economics of Grid Defection. Posted at
http://www.rmi.org/electricity_grid_defection#economics_of_grid_defection

68 | brattle.com
Sandia National Laboratories (2004), Eyer, James, Joseph J. Iannucci , and Garth P. Corey,
Energy Storage Benefits and Market Analysis Handbook: A Study for the DOE Energy Storage Systems Program, Sandia National Laboratories, SAND2004-6177, December 2004.
Posted at http://prod.sandia.gov/techlib/access-control.cgi/2004/046177.pdf
Sandia National Laboratories (2008), Eyer, Jim, 17 Electric Utility-Related Electricity Storage
Benefits, Featuring T&D Deferral, presentation prepared for the U.S. Department of Energy
Peer Review 2008, Washington, DC, September 2008. Posted at
http://energy.gov/sites/prod/files/ESPE%202008%20Peer%20Review%20-
%2017%20Electric%20Utility-Related%20Electricity%20Storage%20Benefits%20-
%20Jim%20Eyer,%20Distributed%20Utility%20Associates.pdf
Sandia National Laboratories (2009), Eyer, Jim, Electric Utility Transmission and Distribution Upgrade Deferral Benefits from Modular Electricity Storage: A Study for the DOE Energy Storage Systems Program, Sandia National Laboratories, SAND2009-4070, June 2009. Posted
at http://prod.sandia.gov/techlib/access-control.cgi/2009/094070.pdf
Sandia National Laboratories (2010), Eyer, Jim, Garth Corey, Energy Storage for the Electricity Grid: Benefits and Market Potential Assessment Guide: A Study for the DOE Energy Storage Systems Program, Sandia National Laboratories, SAND2010-0815, February 2010. Posted at
https://www.smartgrid.gov/sites/default/files/resources/energy_storage.pdf
Sandia National Laboratories, DOE Global Energy Storage Database (2014), Projects. Online at
http://www.energystorageexchange.org/projects
San Diego Gas & Electric (2014), “SDG&E To Procure More Local Energy Resources for Long-
Term Regional Reliability,” News Release. Online at http://www.sdge.com/newsroom/press-
releases/2014-09-08/sdge-to-procure-more-local-energy-resources-for-long-term-regional-
reliability
Schoenung, Susan M. and William Hassenzahl (2007), Long vs. Short-Term Energy Storage: Sensitivity Analysis: A Study for the DOE Energy Storage Systems Program, Sandia National
Laboratories, SAND2007-4253, July 2007. Posted at http://prod.sandia.gov/techlib/access-
control.cgi/2007/074253.pdf
Sioshansi, Ramteen, Paul Denholm, Thomas Jenkin, and Jurgen Weiss (2009), Estimating the value of electricity storage in PJM: Arbitrage and some welfare effects, Energy Economics,
Volume 31, Issue 2, March 2009, Pages 269-277.
S&C Electric Company (2014), “Canada’s First Utility-Scale Energy Storage System Islands
Remote Town During Outages,” Case Study, Energy Storage, March 3, 2014. Posted at
http://www.sandc.com/edocs_pdfs/EDOC_078092.pdf
Southern California Edison (2011), Moving Energy Storage from Concept to Reality Case Study, May 2011. Posted at http://www.energy.ca.gov/2011_energypolicy/documents/2011-04-
28_workshop/comments/TN_60861_05-20-
11_Southern_California_Edison_Company_Comments_Re_Energy_Storage_for_Renewable_
Integration.pdf
69 | brattle.com
Spees, Kathleen, Samuel A. Newell, Robert Carlton, Bin Zhou, and Johannes P. Pfeifenberger.
(2011) Cost of New Entry Estimates for Combustion Turbine and Combined-Cycle Plants in PJM. August 24, 2011. Posted at
http://www.brattle.com/system/publications/pdfs/000/004/834/original/Brattle_CC_and_CT_
CONE_study_final_REDACTED.pdf?1391180812
Sullivan, M., M. Mercurio, and J. Schellenberg (2009), Estimated Value of Service Reliability for Electric Utility Customers in the United States. Lawrence Berkley National Laboratory.
Posted at http://certs.lbl.gov/pdf/lbnl-2132e.pdf
Texas Utilities Code (1999), Title 2. Public Utility Regulatory Act, Subtitle B. Electric Utilities,
Chapter 35. Alternative Energy Providers, posted at
http://www.statutes.legis.state.tx.us/Docs/UT/htm/UT.35.htm
Ventyx Energy Velocity Suite (2014), Data accessed over summer and fall of 2014.
Walawalkar, R., J. Apt, and R. Mancini (2007), “Economics of Electric Energy Storage for Energy
Arbitrage and Regulation in New York,” Energy Policy (35:2007), pp. 2558–2568.

\