The Valuation of Equity Futures on the Tokyo Stock ...
87
Background Data Theory Results The Valuation of Equity Futures on the Tokyo Stock Exchange, 1920-23 Toby Daglish 1 and Lyndon Moore 2 1 NZ Institute for the Study of Competition and Regulation 2 University of Melbourne 4 Nov 2011 Toby Daglish and Lyndon Moore Japanese Futures
Transcript of The Valuation of Equity Futures on the Tokyo Stock ...
BackgroundData
TheoryResults
The Valuation of Equity Futures on the TokyoStock Exchange, 1920-23
Toby Daglish 1 and Lyndon Moore 2
1NZ Institute for the Study of Competition and Regulation
2University of Melbourne
4 Nov 2011
Toby Daglish and Lyndon Moore Japanese Futures

BackgroundData
TheoryResults
Big picture
I How well can investors price financial assets, when pricingtheory not fully developed?
I Equity options: quite well, e.g. Murphy (2009) 17th centuryLondon, Moore and Juh (2006) South Africa in early 20thcentury.
I Commodity futures: hard to tell, since data on storage costsand convenience yield are needed (e.g. Wakita (2001) andBell, Brooks and Dryburgh (2007)).
I Equity futures: not yet been studied in a historical setting,theoretically much easier to price since no storage orconvenience.
Toby Daglish and Lyndon Moore Japanese Futures

BackgroundData
TheoryResults
Big picture, cont’d
I Historically important since (commodity) forwards have beenused in commerce for 4000 years. Financial futures haveexisted for 400 years in Western Europe, since development ofjoint-stock corporations.
I Although the intuition of how to price futures and forwardswas well understood in the early 20th century, the pricingrelation was not perfectly understood.
I Academic debate in the 1930s regarding whether preferenceswere important for pricing futures.
I Debate settled by 1940s.I Black (1976) showed how to calculate futures options in a
constant interest rate situation, and Hilliard and Reis (1998)demonstrate how to price futures under stochastic interestrates.
Toby Daglish and Lyndon Moore Japanese Futures

BackgroundData
TheoryResults
Big picture, cont’d
I Historically important since (commodity) forwards have beenused in commerce for 4000 years. Financial futures haveexisted for 400 years in Western Europe, since development ofjoint-stock corporations.
I Although the intuition of how to price futures and forwardswas well understood in the early 20th century, the pricingrelation was not perfectly understood.
I Academic debate in the 1930s regarding whether preferenceswere important for pricing futures.
I Debate settled by 1940s.
I Black (1976) showed how to calculate futures options in aconstant interest rate situation, and Hilliard and Reis (1998)demonstrate how to price futures under stochastic interestrates.
Toby Daglish and Lyndon Moore Japanese Futures

BackgroundData
TheoryResults
Big picture, cont’d
I Historically important since (commodity) forwards have beenused in commerce for 4000 years. Financial futures haveexisted for 400 years in Western Europe, since development ofjoint-stock corporations.
I Although the intuition of how to price futures and forwardswas well understood in the early 20th century, the pricingrelation was not perfectly understood.
I Academic debate in the 1930s regarding whether preferenceswere important for pricing futures.
I Debate settled by 1940s.I Black (1976) showed how to calculate futures options in a
constant interest rate situation, and Hilliard and Reis (1998)demonstrate how to price futures under stochastic interestrates.
Toby Daglish and Lyndon Moore Japanese Futures

BackgroundData
TheoryResults
Why study Japan?
I Japan was the first place in the world to develop commodityfutures (i.e. with a centralized clearing house, standardizedcontracts, marking to market) around 1730 for the delivery ofrice.
I Tokyo Stock Exchange (TSE) founded in 1878 and futureswere present from the start, presumably due to familiaritywith the concept from rice trading.
I By the early 20th century the TSE was the largest market inJapan (Osaka was the only serious rival) and futures tradingwas far more important than the small spot market. Thefutures market may have helped facilitate liquid trading ofsecurities.
Toby Daglish and Lyndon Moore Japanese Futures
BackgroundData
TheoryResults
Features of the TSE
I Around 600-800 stocks traded in the (illiquid) spot market.
I Around 200 of these traded in the futures market. Contractscould be resold as many times as desired, at expiry thedifference between the spot price and the futures price wasusually paid/received in cash.
I No marking to market. Makes valuation easier, since these areeffectively forward contracts.
I There were three contracts in existence for each stock:delivery at end of current month, delivery at end of nextmonth, delivery at end of subsequent month. E.g. on 15January 1920 the contracts for delivery were: 31 January1920, 28 February 1920 and 31 March 1920.
Toby Daglish and Lyndon Moore Japanese Futures

BackgroundData
TheoryResults
Features of the TSE, cont’d
I From 1914 futures needed to be from:
I Firms at least 2 years old.I With a total paid-in nominal value of at least 1 million Yen
(approx. $0.5m).I If a firm already had shares traded on the futures market,
subsequent issues need to have a paid-in nominal value of atleast 500 000 Yen.
Toby Daglish and Lyndon Moore Japanese Futures

BackgroundData
TheoryResults
Features of the TSE, cont’d
I From 1914 futures needed to be from:I Firms at least 2 years old.
I With a total paid-in nominal value of at least 1 million Yen(approx. $0.5m).
I If a firm already had shares traded on the futures market,subsequent issues need to have a paid-in nominal value of atleast 500 000 Yen.
Toby Daglish and Lyndon Moore Japanese Futures

BackgroundData
TheoryResults
Features of the TSE, cont’d
I From 1914 futures needed to be from:I Firms at least 2 years old.I With a total paid-in nominal value of at least 1 million Yen
(approx. $0.5m).
I If a firm already had shares traded on the futures market,subsequent issues need to have a paid-in nominal value of atleast 500 000 Yen.
Toby Daglish and Lyndon Moore Japanese Futures

BackgroundData
TheoryResults
Features of the TSE, cont’d
I From 1914 futures needed to be from:I Firms at least 2 years old.I With a total paid-in nominal value of at least 1 million Yen
(approx. $0.5m).I If a firm already had shares traded on the futures market,
subsequent issues need to have a paid-in nominal value of atleast 500 000 Yen.
Toby Daglish and Lyndon Moore Japanese Futures

BackgroundData
TheoryResults
Futures data
I We collect futures data from Japan Times and Mail (English)a Tokyo daily newspaper. Suspicious prices are checkedagainst Yomiuri Shimbun (Japanese). TSE only beganpublishing an official list post WW2.
I Both papers only report a small section of the market, 40-50securities, presumably the larger and more liquid securities.Other newspapers (e.g. Asahi Shimbun) do not report pricesfor a larger selection of securities. We choose 29 of the mostfrequently traded securities from the Japan Times and Mail.
I Only transaction prices are reported (no bid-ask quotesavailable), if no trade occurred, no price is reported.
I We collect daily data from January 6, 1920 to August 28,1923 (earthquake in September 1923 shuts the exchange for 2months).
Toby Daglish and Lyndon Moore Japanese Futures

BackgroundData
TheoryResults
Toby Daglish and Lyndon Moore Japanese Futures

BackgroundData
TheoryResults
Interest rate data
I We collect interest rate data from the Yomiuri Shimbun everyday. We collect the overnight rate and the over month rate.
I Interpolate between the two rates for maturities between 1day and 1 month.
I Assume rates for longer maturity are equal to 1 month rate.
Toby Daglish and Lyndon Moore Japanese Futures

BackgroundData
TheoryResults
Theoretical Pricing
I For futures pricing to preclude arbitrage (between contractpairs) the following relation needs to hold between all possiblecontract pairs (e.g. 1-month and 2-month, 2-month and3-month and 1-month and 3-month):
FT = er(T−t)Ft
If prices do not follow this relationship, then arbitrage profitsexist.
Toby Daglish and Lyndon Moore Japanese Futures

BackgroundData
TheoryResults
Theoretical pricing, cont’d
I Example: On 1 Jan 1921, we observe:I Jan future = 50.I Feb future = 51.I r = 6%.
I We buy 1 January contract, cost = 50 Yen.
I Borrow 50 Yen from end Jan to end Feb: cost =50e0.06/12 − 50 = 0.2506.
I Short 1 February contract: revenue = 51 Yen.
I Take delivery of the stock at end-Jan and deliver at end-Feb.
I To perfectly arbitrage this we would need to be able to enterinto forward rate agreement (i.e. contract today to borrow for1 month at the end of January). The extent to which this isdifficult or costly will reduce arbitrage opportunities.
Toby Daglish and Lyndon Moore Japanese Futures

BackgroundData
TheoryResults
Mispricing
I We calculate mispricing as the observed futures price (for thelonger term contract) less the predicted price for the longerterm contract (given the observed shorter term futures price)and normalise by dividing by the observed longer maturityfutures price:
ε =FT − d(t)
d(T )Ft −PVt−PVT
d(T )
FT
We do this every day for every contract pair. We calculateroot mean squared errors (averaged over time) for eachfirm-pair.
Toby Daglish and Lyndon Moore Japanese Futures

BackgroundData
TheoryResults
Dividends and other oddities
I The TSE produced a yearbook, from which we are able toobtain dividend information. Unfortunately, it is only monthly.
I We choose the dividend date which best prices the preceding1 month and 2 month futures pair.1
I We remove pairs when there has clearly been a capitaloperation.
I We also remove contracts maturing at end of April 1920.Stock exchange was closed part way through month due topanic following collapse of Chinese export market.
1Our results are robust to using the worst date, and the middle of the month.Toby Daglish and Lyndon Moore Japanese Futures

BackgroundData
TheoryResults
Firm All 1-2 1-3 2-3Kanegafuchi Cotton (40 yen) 0.0092 0.0072 0.0114 0.0086Nisshin Cotton 0.0217 0.0197 0.0265 0.0179Kanegafuchi Cotton (50 yen) 0.0116 0.0082 0.0139 0.0120Tokyo Stock Exchange 0.0096 0.0078 0.0118 0.0090Yokohama Stock Exchange 0.0318 0.0106 0.0522 0.0114Dai Nippon Sugar 0.0165 0.0160 0.0201 0.0128Fuji Gas (50 yen) 0.0349 0.0327 0.0420 0.0280Tokyo Stock Exchange (new) 0.0078 0.0067 0.0099 0.0064Nippon Yusen Kaisha 0.0114 0.0102 0.0124 0.0111Jomo Muslin 0.0300 0.0136 0.0476 0.0130Ensuiko Sugar 0.0220 0.0113 0.0342 0.0101Toyo Muslin 0.0311 0.0260 0.0386 0.0261Tokyo Woollen Cloth 0.0204 0.0248 0.0180 0.0186Toyo Sugar 0.0602 0.0436 0.0816 0.0418Nippon Kinematographe 0.0202 0.0180 0.0234 0.0183
Toby Daglish and Lyndon Moore Japanese Futures
BackgroundData
TheoryResults
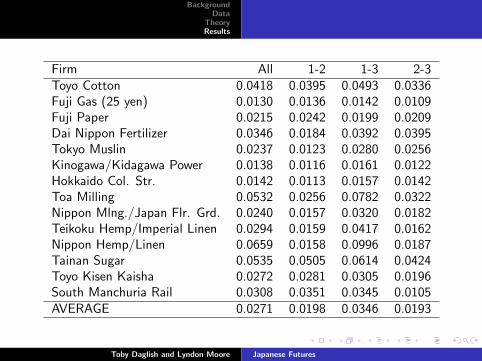
Firm All 1-2 1-3 2-3Toyo Cotton 0.0418 0.0395 0.0493 0.0336Fuji Gas (25 yen) 0.0130 0.0136 0.0142 0.0109Fuji Paper 0.0215 0.0242 0.0199 0.0209Dai Nippon Fertilizer 0.0346 0.0184 0.0392 0.0395Tokyo Muslin 0.0237 0.0123 0.0280 0.0256Kinogawa/Kidagawa Power 0.0138 0.0116 0.0161 0.0122Hokkaido Col. Str. 0.0142 0.0113 0.0157 0.0142Toa Milling 0.0532 0.0256 0.0782 0.0322Nippon Mlng./Japan Flr. Grd. 0.0240 0.0157 0.0320 0.0182Teikoku Hemp/Imperial Linen 0.0294 0.0159 0.0417 0.0162Nippon Hemp/Linen 0.0659 0.0158 0.0996 0.0187Tainan Sugar 0.0535 0.0505 0.0614 0.0424Toyo Kisen Kaisha 0.0272 0.0281 0.0305 0.0196South Manchuria Rail 0.0308 0.0351 0.0345 0.0105AVERAGE 0.0271 0.0198 0.0346 0.0193
Toby Daglish and Lyndon Moore Japanese Futures

BackgroundData
TheoryResults
Problems with asynchronicity
I Since we deal with transaction data, we have no guaranteethey are observed at the same point in time. We may becalculating mispricing with asynchronous data, which will tendto increase the measured mispricing.
I We run a simulation exercise to estimate, given volatility andtrade frequency, the anticipated mispricing if the data wereasynchronous.
I If 2 futures contracts for the same firm were priced correctlyat a moment in time, but possibly observed at different timesduring the same day ε = ST−St
ST.
Toby Daglish and Lyndon Moore Japanese Futures

BackgroundData
TheoryResults
Problems with asynchronicity, cont’d
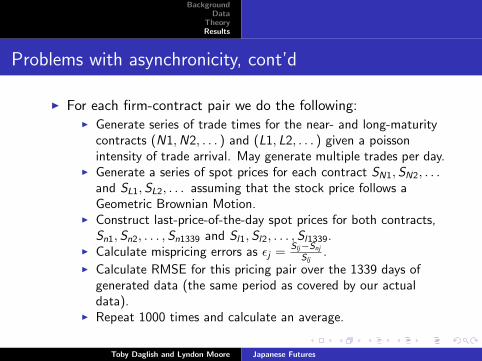
I For each firm-contract pair we do the following:
I Generate series of trade times for the near- and long-maturitycontracts (N1,N2, . . . ) and (L1, L2, . . . ) given a poissonintensity of trade arrival. May generate multiple trades per day.
I Generate a series of spot prices for each contract SN1,SN2, . . .and SL1,SL2, . . . assuming that the stock price follows aGeometric Brownian Motion.
I Construct last-price-of-the-day spot prices for both contracts,Sn1,Sn2, . . . ,Sn1339 and Sl1,Sl2, . . . ,Sl1339.
I Calculate mispricing errors as εj =Slj−Snj
Slj.
I Calculate RMSE for this pricing pair over the 1339 days ofgenerated data (the same period as covered by our actualdata).
I Repeat 1000 times and calculate an average.
Toby Daglish and Lyndon Moore Japanese Futures

BackgroundData
TheoryResults
Problems with asynchronicity, cont’d
I For each firm-contract pair we do the following:I Generate series of trade times for the near- and long-maturity
contracts (N1,N2, . . . ) and (L1, L2, . . . ) given a poissonintensity of trade arrival. May generate multiple trades per day.
I Generate a series of spot prices for each contract SN1,SN2, . . .and SL1,SL2, . . . assuming that the stock price follows aGeometric Brownian Motion.
I Construct last-price-of-the-day spot prices for both contracts,Sn1,Sn2, . . . ,Sn1339 and Sl1,Sl2, . . . ,Sl1339.
I Calculate mispricing errors as εj =Slj−Snj
Slj.
I Calculate RMSE for this pricing pair over the 1339 days ofgenerated data (the same period as covered by our actualdata).
I Repeat 1000 times and calculate an average.
Toby Daglish and Lyndon Moore Japanese Futures

BackgroundData
TheoryResults
Firm All 1-2 1-3 2-3Kanegafuchi Cotton (40 yen) -0.0184 -0.0215 -0.0165 -0.0177Nisshin Cotton 0.0108* 0.0084* 0.0156* 0.0075*Kanegafuchi Cotton (50 yen) 0.0036* -0.0002 0.0058* 0.0044*Tokyo Stock Exchange -0.0001 -0.0023 0.0019* -0.0004Yokohama Stock Exchange 0.0185* -0.0032 0.0391* -0.0016Dai Nippon Sugar 0.0070* 0.0061* 0.0107* 0.0034*Fuji Gas (50 yen) 0.0264* 0.0239* 0.0337* 0.0195*Tokyo Stock Exchange (new) -0.0030 -0.0041 -0.0009 -0.0043Nippon Yusen Kaisha 0.0052* 0.0039* 0.0065* 0.0049*Jomo Muslin 0.0171* 0.0004 0.0348* 0.0002Ensuiko Sugar 0.0107* -0.0003 0.0231* -0.0010Toyo Muslin 0.0165* 0.0111* 0.0242* 0.0116*Tokyo Woollen Cloth 0.0049* 0.0091* 0.0027* 0.0030*Toyo Sugar 0.0483* 0.0315* 0.0701* 0.0300*Nippon Kinematographe 0.0062* 0.0038* 0.0095* 0.0044*
Toby Daglish and Lyndon Moore Japanese Futures

BackgroundData
TheoryResults
Firm All 1-2 1-3 2-3Toyo Cotton 0.0316* 0.0291* 0.0393* 0.0235*Fuji Gas (25 yen) -0.0005 0.0000 0.0008* -0.0025Fuji Paper 0.0106* 0.0132* 0.0093* 0.0100*Dai Nippon Fertilizer 0.0124* -0.0040 0.0174* 0.0171*Tokyo Muslin 0.0104* -0.0011 0.0148* 0.0123*Kinogawa/Kidagawa Power 0.0043* 0.0019* 0.0066* 0.0026*Hokkaido Col. Str. 0.0026* -0.0005 0.0044* 0.0025*Toa Milling 0.0244* -0.0035 0.0496* 0.0033*Nippon Mlng./Japan Flr. Grd. -0.0001 -0.0085 0.0081 -0.0059Teikoku Hemp/Imperial Linen 0.0146* 0.0010* 0.0270* 0.0014*Nippon Hemp/Linen 0.0470* -0.0032 0.0809* -0.0003Tainan Sugar -0.0372 -0.0405 -0.0286 -0.0488Toyo Kisen Kaisha 0.0129* 0.0137* 0.0162* 0.0052*South Manchuria Rail 0.0212* 0.0254* 0.0249* 0.0008*AVERAGE 0.0106* 0.0031* 0.0183* 0.0029*
Toby Daglish and Lyndon Moore Japanese Futures

BackgroundData
TheoryResults
Which figures to believe?
I If we believed that:
I all observed prices were generated by arbitrageurs trading (all 3maturities) simultaneously,
I or by investors who adjust their portfolios by trading allmaturities at the same time,
I or perhaps all trading in the day is concentrated at a point intime (e.g. just before lunch, just before close of trading).
I then asynchronicity does not exist, and the unadjustednumbers give the best picture of how well investors pricedfutures.
Toby Daglish and Lyndon Moore Japanese Futures
BackgroundData
TheoryResults
Which figures to believe?
I If we believed that:I all observed prices were generated by arbitrageurs trading (all 3
maturities) simultaneously,
I or by investors who adjust their portfolios by trading allmaturities at the same time,
I or perhaps all trading in the day is concentrated at a point intime (e.g. just before lunch, just before close of trading).
I then asynchronicity does not exist, and the unadjustednumbers give the best picture of how well investors pricedfutures.
Toby Daglish and Lyndon Moore Japanese Futures
BackgroundData
TheoryResults
Which figures to believe?
I If we believed that:I all observed prices were generated by arbitrageurs trading (all 3
maturities) simultaneously,I or by investors who adjust their portfolios by trading all
maturities at the same time,
I or perhaps all trading in the day is concentrated at a point intime (e.g. just before lunch, just before close of trading).
I then asynchronicity does not exist, and the unadjustednumbers give the best picture of how well investors pricedfutures.
Toby Daglish and Lyndon Moore Japanese Futures

BackgroundData
TheoryResults
Which figures to believe?
I If we believed that:I all observed prices were generated by arbitrageurs trading (all 3
maturities) simultaneously,I or by investors who adjust their portfolios by trading all
maturities at the same time,I or perhaps all trading in the day is concentrated at a point in
time (e.g. just before lunch, just before close of trading).
I then asynchronicity does not exist, and the unadjustednumbers give the best picture of how well investors pricedfutures.
Toby Daglish and Lyndon Moore Japanese Futures

BackgroundData
TheoryResults
Which figures to believe? cont’d
I If we believe that trades for one firm’s futures, of a certainmaturity, are independent of the trades of that firm’s othermaturity futures, then asynchronicity does exist, and ourmethod should accurately tell us how much mispricing weshould expect to measure even if (at a point in time)mispricing does not exist.
I In reality, the situation is probably between these twoextremes, and we have plausible bounds for the amount of“true” mispricing in the Japanese futures market.
Toby Daglish and Lyndon Moore Japanese Futures

BackgroundData
TheoryResults
How big is big?
I It would be nice to compare mispricing in early 20th centuryJapan with contemporary Japan, which has access to a moredeveloped futures pricing model with deeper financial markets.
I However, single-stock futures do not exist in modern Japan(only index futures).
I Therefore, we turn to US data and OneChicago market:
I OneChicago is not a very liquid market. We compare the 22(out of 1300) futures which are more liquid than the leastliquid firm we study on the TSE.
I OneChicago uses marking to market, which needs to betreated carefully in valuing futures. We use the method ofHillard and Reis (1998) to measure pricing errors, using theLIBOR yield curve.
Toby Daglish and Lyndon Moore Japanese Futures

BackgroundData
TheoryResults
How big is big?
I It would be nice to compare mispricing in early 20th centuryJapan with contemporary Japan, which has access to a moredeveloped futures pricing model with deeper financial markets.
I However, single-stock futures do not exist in modern Japan(only index futures).
I Therefore, we turn to US data and OneChicago market:I OneChicago is not a very liquid market. We compare the 22
(out of 1300) futures which are more liquid than the leastliquid firm we study on the TSE.
I OneChicago uses marking to market, which needs to betreated carefully in valuing futures. We use the method ofHillard and Reis (1998) to measure pricing errors, using theLIBOR yield curve.
Toby Daglish and Lyndon Moore Japanese Futures

BackgroundData
TheoryResults
Firm All 1-2 1-3 2-3
Apple 0.0130 0.0121 0.0125 0.0166Research in Motion 0.0195 0.0187 0.0202 0.0216Citigroup 0.0598 0.0549 0.0757 0.0544Bank of America 0.0303 0.0341 0.0254 0.0224Freeport McMoran 0.0317 0.0280 0.0417 0.0357Goldman Sachs 0.0267 0.0253 0.0320 0.0245JP Morgan 0.0200 0.0195 0.0202 0.0222Google 0.0142 0.0139 0.0149 0.0145Amazon 0.0173 0.0186 0.0151 0.0142Qualicomm 0.0151 0.0146 0.0164 0.0153Nucorp 0.0181 0.0156 0.0267 0.0131
Toby Daglish and Lyndon Moore Japanese Futures

BackgroundData
TheoryResults
Firm All 1-2 1-3 2-3
Walmart 0.0086 0.0090 0.0080 0.0063Exxon Mobil 0.0128 0.0102 0.0195 0.0090Gilead 0.0123 0.0126 0.0125 0.0101Johnson and Johnson 0.0088 0.0081 0.0127 0.0051Wells Fargo 0.0301 0.0245 0.0484 0.0347Sears 0.0462 0.0357 0.0723 0.0443Morgan Stanley 0.0492 0.0465 0.0393 0.0799CME 0.0268 0.0230 0.0333 0.0291US Steel 0.0265 0.0270 0.0280 0.0107Microsoft 0.0144 0.0172 0.0073 0.0116Intel 0.0177 0.0154 0.0269 0.0189
AVERAGE 0.0239 0.0223 0.0277 0.0236
Toby Daglish and Lyndon Moore Japanese Futures

BackgroundData
TheoryResults
Firm All 1-2 1-3 2-3
Apple -0.0008 -0.0001 -0.0027 0.0018*Research in Motion -0.0048 -0.0043 -0.0051 -0.0035Citigroup 0.0119* 0.0094* 0.0256* 0.0045Bank of America -0.0056 -0.0008 -0.0116 -0.0143Freeport McMoran 0.0024* -0.0006 0.0120* 0.0061*Goldman Sachs 0.0016 0.0006 0.0064* -0.0011JP Morgan -0.0082 -0.0082 -0.0084 -0.0063Google -0.0018 -0.0017 -0.0014 -0.0017Amazon -0.0039 -0.0021 -0.0065 -0.0073Qualicomm -0.0004 -0.0008 0.0007 -0.0005Nucorp -0.0077 -0.0098 0.0006 -0.0130
Toby Daglish and Lyndon Moore Japanese Futures

BackgroundData
TheoryResults
Firm All 1-2 1-3 2-3
Walmart -0.0015 -0.0010 -0.0022 -0.0040Exxon Mobil 0.0000 -0.0025 0.0066* -0.0040Gilead -0.0019 -0.0014 -0.0018 -0.0042Johnson and Johnson -0.0003 -0.0009 0.0036* -0.0040Wells Fargo 0.0038* -0.0015 0.0219* 0.0081*Sears 0.0171* 0.0069* 0.0430* 0.0151*Morgan Stanley 0.0101* 0.0078* 0.0001 0.0406*CME 0.0005 -0.0030 0.0068* 0.0025US Steel -0.0039 -0.0029 -0.0027 -0.0200Microsoft -0.0001 0.0028* -0.0073 -0.0030Intel 0.0009 -0.0013 0.0100* 0.0021
AVERAGE -0.0055 -0.0053 -0.0023 -0.0028
Toby Daglish and Lyndon Moore Japanese Futures

BackgroundData
TheoryResults
Transaction costs
I We do not have reliable data on transaction costs for theTSE, but we do for OneChicago.
I Bid-ask spreads are, on average, 0.22% of the futures price,and brokerage charges add 0.01-0.04%.
I After removing these, along with asynchronicity, two of the 18contract pairs become insignificant.
I A similar calculation for Japan renders 11 of the 59 contractpairs insignificant.
Toby Daglish and Lyndon Moore Japanese Futures

BackgroundData
TheoryResults
Regressions
I We now investigate which contracts tend to be priced moreaccurately by investors, perhaps due to more activearbitrageurs.
I We regress mispricing on the firm’s volatility, liquidity, andsize.
I We include dummies for contract pair type.
I We also include a dummy variable based on whether ε wasnegative. These would be contracts where the arbitrage wouldrequire holding a short position in the stock.
Toby Daglish and Lyndon Moore Japanese Futures
BackgroundData
TheoryResults
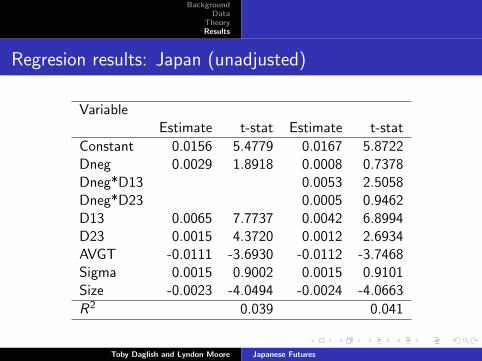
Regresion results: Japan (unadjusted)
VariableEstimate t-stat Estimate t-stat
Constant 0.0156 5.4779 0.0167 5.8722Dneg 0.0029 1.8918 0.0008 0.7378Dneg*D13 0.0053 2.5058Dneg*D23 0.0005 0.9462D13 0.0065 7.7737 0.0042 6.8994D23 0.0015 4.3720 0.0012 2.6934AVGT -0.0111 -3.6930 -0.0112 -3.7468Sigma 0.0015 0.9002 0.0015 0.9101Size -0.0023 -4.0494 -0.0024 -4.0663
R2 0.039 0.041
Toby Daglish and Lyndon Moore Japanese Futures

BackgroundData
TheoryResults
Regression results: Japan (adjusted)
VariableEstimate t-stat Estimate t-stat
Constant 0.0106 4.3538 0.0117 4.7253Dneg 0.0029 1.9127 0.0008 0.7573Dneg*D13 0.0052 2.4723Dneg*D23 0.0006 1.0773D13 0.0072 8.6757 0.0049 8.4023D23 0.0013 3.8083 0.0010 2.3394AVGT -0.0040 -1.4162 -0.0042 -1.4729Sigma -0.0311 -28.3145 -0.0311 -28.3759Size -0.0021 -3.7218 -0.0021 -3.7112
R2 0.1346 0.1365
Toby Daglish and Lyndon Moore Japanese Futures
BackgroundData
TheoryResults
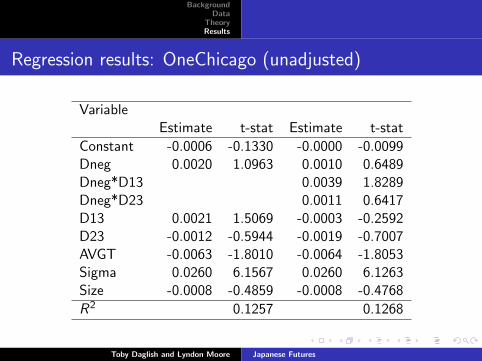
Regression results: OneChicago (unadjusted)
VariableEstimate t-stat Estimate t-stat
Constant -0.0006 -0.1330 -0.0000 -0.0099Dneg 0.0020 1.0963 0.0010 0.6489Dneg*D13 0.0039 1.8289Dneg*D23 0.0011 0.6417D13 0.0021 1.5069 -0.0003 -0.2592D23 -0.0012 -0.5944 -0.0019 -0.7007AVGT -0.0063 -1.8010 -0.0064 -1.8053Sigma 0.0260 6.1567 0.0260 6.1263Size -0.0008 -0.4859 -0.0008 -0.4768
R2 0.1257 0.1268
Toby Daglish and Lyndon Moore Japanese Futures

BackgroundData
TheoryResults
Regression results: OneChicago (adjusted)
VariableEstimate t-stat Estimate t-stat
Constant -0.0025 -0.5317 -0.0019 -0.4053Dneg 0.0020 1.0938 0.0010 0.6396Dneg*D13 0.0040 1.8706Dneg*D23 0.0012 0.6542D13 0.0013 1.0548 -0.0011 -1.0091D23 -0.0009 -0.4413 -0.0016 -0.6155AVGT -0.0032 -0.8806 -0.0033 -0.8917Sigma -0.0084 -1.8015 -0.0083 -1.7790Size -0.0006 -0.3357 -0.0006 -0.3264
R2 0.0153 0.0167
Toby Daglish and Lyndon Moore Japanese Futures
BackgroundData
TheoryResults
Conclusions
I Asynchronicity can disguise poor pricing performance.
I Some “arbitrage opportunities” in modern market.
I Slightly more in early 20th century Japan, but only for 1-3pair. Other pairs can be explained by asynchronicity.
I Negative RMSEs hint that we may have correlated trading,perhaps caused by arbitrageurs.
Toby Daglish and Lyndon Moore Japanese Futures


![SPECIAL PROVISIONS FOR TRADING …[English Translation] SPECIAL PROVISIONS FOR TRADING REGULATIONS FOR EQUITY INDEX DAILY FUTURES TRANSACTIONS TOKYO FINANCIAL EXCHANGE INC. (This is](https://static.fdocuments.us/doc/165x107/5f0b07417e708231d42e7f40/special-provisions-for-trading-english-translation-special-provisions-for-trading.jpg)