The Utilisation of Additive Manufacturing Techniques in ...
100
The Utilisation of Additive Manufacturing Techniques in the Prototyping and Development of New Medical Devices Phillip G Kitchen BEng MIET A Thesis Submitted for the Degree of Master of Science in Engineering (By Research) Lancaster University December 2018
Transcript of The Utilisation of Additive Manufacturing Techniques in ...

The Utilisation of Additive Manufacturing
Techniques in the Prototyping and Development
of New Medical Devices
Phillip G Kitchen BEng MIET
A Thesis Submitted for the Degree of Master of Science in Engineering (By
Research)
Lancaster University
December 2018

1
The Utilisation of Additive Manufacturing Techniques in the Prototyping
and Development of New Medical Devices
Phillip G. Kitchen BEng MIET
ABSTRACT
As a technology, additive manufacturing has remained largely unchanged since its introduction in
the 1980’s. However, advancements in computer aided design (CAD), the selection of available
materials and more complex manufacturing requirements have allowed its value to extend beyond
being a research tool into one that is capable of providing a financially viable and production feasible
manufacturing solution.
Healthcare product innovation is currently a resource not being used to its full capacity within the
healthcare sector in the UK [1]. Professionals within this sector often have ideas for technical
innovation but the development is often thwarted due to a lack of engineering knowledge. In addition
to this, the opportunities to develop these ideas are often limited through lack of time and resources.
It is the aim of this dissertation to show how healthcare professionals can advance their product
ideas by utilising research facilities and additive manufacturing technology to produce proof-of-
concept models for evaluation purposes.
It is integral to the development of an innovative product to be able to explain the value of an idea
to external stakeholders. One method by which to achieve this is to produce concept designs and/or
prototypes. Additive manufacturing technology is ideally suited to this because it can allow the rapid
development of a concept which can then be used to produce a 3D model to aid the healthcare
professional in relating their idea(s) to others.
The dissertation uses four case studies to show how the utilisation of additive manufacturing
technology and design for additive manufacturing principles can be used to advance the early-stage
development of new healthcare devices.

2
TABLE OF CONTENTS
RATIONALE ............................................................................................................................................ 7
1 INTRODUCTION ............................................................................................................................. 8
1.1 What is Additive Manufacturing............................................................................................... 8
1.2 Additive Manufacturing Technologies ..................................................................................... 9
1.2.1 Stereolithography .............................................................................................................. 10
1.3 Fused Deposition Modelling .................................................................................................. 13
1.3.2 Selective Laser Sintering .................................................................................................. 16
1.4 Current uses of Additive Manufacturing ................................................................................ 18
1.4.1 Aerospace Industry ........................................................................................................... 18
1.4.2 Automotive Industry .......................................................................................................... 19
1.4.3 Medical industry ................................................................................................................ 20
1.5 Examples of Additive Manufacturing in a Research Environment ........................................ 22
1.6 Disadvantages of Additive Manufacturing ............................................................................. 28
1.7 How Additive Manufacturing Can Encourage Innovation ..................................................... 28
1.8 University Collaboration with Industry ................................................................................... 29
1.8.1 Medical Industry ................................................................................................................ 29
1.9 Future of Additive Manufacturing .......................................................................................... 30
2 DEVELOPMENT AND PROTOTYPING OF A BLUNT DISSECTION TOOL ............................... 32
2.1 Background ........................................................................................................................... 32
2.2 Method of approach .............................................................................................................. 33
2.3 Dissector Concept 1 .............................................................................................................. 34
2.4 Dissector Concept 2 .............................................................................................................. 37
2.5 Conclusions ........................................................................................................................... 41
2.6 Further work .......................................................................................................................... 42
2.6.1 Development of dissection finger ...................................................................................... 42
2.6.2 Material selection .............................................................................................................. 42
2.6.3 Sterilisation ........................................................................................................................ 42
3 3D MODELLING CT/MRI SCAN DATA FOR ADDITIVE MANUFACTURE .................................. 43
3.1 Background ........................................................................................................................... 43

3
3.1.1 Surgical guides using CT imagery .................................................................................... 43
3.2 Method of approach .............................................................................................................. 44
3.2.1 Medical image acquisition ................................................................................................. 45
3.2.2 Conversion into a 3D model .............................................................................................. 46
3.3 Conclusions ........................................................................................................................... 57
3.4 Further Work ......................................................................................................................... 58
4 DEVELOPMENT AND PROTOTYPING OF A NOVEL FLUID-MIXING DEVICE WITH POTENTIAL
CLINICAL APPLICATIONS ................................................................................................................... 59
4.1 Background ........................................................................................................................... 59
4.2 Passive micromixers ............................................................................................................. 60
4.2.1 Parallel lamination ............................................................................................................. 61
4.2.2 Injection ............................................................................................................................. 61
4.2.3 Chaotic advection .............................................................................................................. 61
4.2.4 Active micromixers ............................................................................................................ 62
4.2.5 Method of approach .......................................................................................................... 63
4.2.6 Design of a novel micromixer ............................................................................................ 64
4.2.7 Mixing Efficiency................................................................................................................ 67
4.2.8 Conclusion ......................................................................................................................... 79
4.2.9 Further work ...................................................................................................................... 80
5 DESIGN FOR ADDITIVE MANUFACTURE OF A CLINICAL RECONFIGURABLE CELL
CULTURE BOX ..................................................................................................................................... 81
5.1 Background ........................................................................................................................... 81
5.2 Creation of photorealistic renderings .................................................................................... 82
5.2.1 Applying appearances ....................................................................................................... 82
5.2.2 Scene set-up ..................................................................................................................... 82
5.2.3 Rendering generation ........................................................................................................ 84
5.3 Development of culture blocks .............................................................................................. 86
5.4 Manufacture of the prototype blocks ..................................................................................... 88
5.5 Assembly of cell culture box/feature overview ...................................................................... 90
5.6 Conclusions ........................................................................................................................... 91
5.7 Future work ........................................................................................................................... 91
6 DISCUSSION ................................................................................................................................. 93

4
7 REFERENCES .............................................................................................................................. 95

5
LIST OF FIGURES
Figure 1: General process of AM [9] ....................................................................................................... 8
Figure 2: Overview of SL technology [15] ............................................................................................. 10
Figure 3: Technical specification of the Form1 3D printer [18] ............................................................. 12
Figure 4: FDM process overview [22] ................................................................................................... 13
Figure 5: Illustration of cylinder print orientation [24] ............................................................................ 14
Figure 6: Technical specification of the Ultimaker 2 3D printer [26] ..................................................... 15
Figure 7: Overview of SLS technology [27] ........................................................................................... 16
Figure 8: Technical specification of the Sinterstation 2000 .................................................................. 17
Figure 9: AM bracket utilised in the aerospace industry [29] ................................................................ 19
Figure 10: AM bracket utilised in the automotive industry [30] ............................................................. 20
Figure 11: Additive manufactured representation of a brain tumour [35] ............................................. 21
Figure 12: Design process of a device utilised in a research facility .................................................... 25
Figure 13: Development of the device in the previous figure ................................................................ 26
Figure 14: Design of an enclosure in a research facility ....................................................................... 27
Figure 15: How an engineer with input from a medical professional can exploit a segment of the medical
engineering market ............................................................................................................................... 30
Figure 16: A diagram to illustrate the Calots triangle [49] ..................................................................... 32
Figure 17: Detailed view of the blunt dissector mechanism .................................................................. 35
Figure 18: Additive manufactured blunt dissector ................................................................................. 37
Figure 19: Secondary blunt dissector concept ...................................................................................... 39
Figure 20: Movement of the dissector mechanism ............................................................................... 41
Figure 21: Additive manufactured surgical guide [56] ........................................................................... 44
Figure 22: Extent of the cyst within the patient ..................................................................................... 45
Figure 23: High resolution image obtained from MRI data ................................................................... 46
Figure 24: User interface of the modelling software ............................................................................. 47
Figure 25: Location of the appropriate data set .................................................................................... 48
Figure 26: Data used to estimate the approximate dimensions of the cyst .......................................... 49
Figure 27: Visualisation of the cyst ....................................................................................................... 49
Figure 28: Cropped plot of the cyst data ............................................................................................... 50
Figure 29: Process of modelling the cyst .............................................................................................. 51
Figure 30: Manipulation of the cyst stl .................................................................................................. 53
Figure 31: Part of the stl manipulation process..................................................................................... 54
Figure 32: Simplification of the cystic mass stl ..................................................................................... 56
Figure 33: Smoothing of the cystic mass stl ......................................................................................... 57
Figure 34: Examples of mixing nozzles ................................................................................................ 61
Figure 35: Illustration of polymeric micromachining [64] ....................................................................... 63
Figure 36: Internal geometry of the micromixer .................................................................................... 64
Figure 37: Sectioned views of the mixer geometry ............................................................................... 65
Figure 38: Principle of diffusion measurement within the study ............................................................ 67

6
Figure 39: Mixing plots of the 30° mixer ................................................................................................ 69
Figure 40: Distribution of the cut plots .................................................................................................. 70
Figure 41: Mixing plots of the 45° mixer ................................................................................................ 72
Figure 42: Distribution of the cut plots .................................................................................................. 73
Figure 43: Mixing plots of the 65° mixer ................................................................................................ 75
Figure 44: Distribution of the cut plots .................................................................................................. 76
Figure 45: Mixing plots of the 90° mixer ................................................................................................ 78
Figure 46: Distribution of cut plots ........................................................................................................ 79
Figure 47: comparison of angled jets at 5mm mix distance .................................................................. 79
Figure 48: Selection of materials .......................................................................................................... 82
Figure 49: Scene set-up ........................................................................................................................ 83
Figure 50: Camera set-up within the scene .......................................................................................... 84
Figure 51: Addition of light sources ....................................................................................................... 84
Figure 52: Photorealistic rendering of the cell box ................................................................................ 85
Figure 53: Photorealistic rendering with lid exploded view ................................................................... 86
Figure 54: Cell block concept design .................................................................................................... 87
Figure 55: Second concept design ....................................................................................................... 87
Figure 56: Exploded rendering of the cell block divider concept .......................................................... 88
Figure 57: Failed SLS build of the cell blocks ....................................................................................... 88
Figure 58: Successful build of the cell blocks utilising the SL technique .............................................. 89
Figure 59: Stacked cell blocks .............................................................................................................. 89
Figure 60: Side-by-side for comparison ................................................................................................ 90
Figure 61: Example of a cell box assembly .......................................................................................... 91

7
RATIONALE
The purpose of the activity undertaken within this dissertation, was to study and explore how additive
manufacturing (AM) technology could facilitate the development of products for the medical industry.
The study focuses upon the initial prototyping and development of medical devices. By definition a
medical device is any instrument or apparatus which is intended by the manufacturer to be used for the
treatment of human beings. This can range from diagnosis e.g. laboratory equipment to disinfectant
substances used in a surgical theatre. [1]
Chapter 1 introduces additive manufacturing technology which is defined as the process of creating 3D
parts from computer generated models, the manufacture of these parts is achieved through the addition
of layers of material as opposed to conventional subtractive manufacturing [2], and details how it is
currently used in industry. This includes a review of three of the most prevalent AM processes:
Stereolithography, Selective Laser Sintering and Fused Deposition Modelling. This was enabled by an
analysis of how AM technology is currently utilised within the Automotive, Aerospace, Healthcare &
Medical industries. The chapter predominantly focuses upon current uses of additive manufacturing
technology within a research environment. This aims to highlight how National Health Service is being
readily utilised to achieve rapid product development and proof of concept of non-medical devices. It is
the purpose of this chapter to show that additive manufacturing could be used to provide proof of
concept of medical devices. This chapter concludes with a section which discusses how universities
can work with medical professionals to achieve accelerated product development through the utilisation
of additive manufacturing.
Chapters 2 to 5 contain four individual case studies which were presented for consideration by medical
and non-medical professionals to the author. Each of the studies explored how additive manufacturing
could be utilised to reduce the amount of time between concept generation and final production by
providing proof of concept designs and prototype models. The studies achieved this by using computer
aided design and additive manufacturing technologies.
The main driver for this study was the rationale that National Health Service surgeons, consultants,
clinicians and nursing staff often require access to an effective engineering design service. With such
a service, they would be given access to engineers and additive manufacturing equipment so that they
can develop their medically based product ideas. A service of this kind may benefit the wider population
by increasing the efficiency and effectiveness of the National Health Service. The study expanded from
this rationale to also include medically based ideas from non-medical professionals.
In conclusion, the study achieved the advancement of four concept ideas and provided a proof of
concept for each. Each of the case studies included within this thesis constitute an initial research phase
of medically linked projects, In three of four cases these projects have been developed further either by
dedicated PhD projects or used in grant funding proposals.
8
1 INTRODUCTION
1.1 What is Additive Manufacturing
Additive Manufacturing (AM) is the current term used to describe a manufacturing method originating
from the 1980’s [3] which was initially called Rapid Prototyping (RP) [4]. The original term described the
use of the technology, not the mechanics of the process. The main function of AM in its infancy was to
develop prototypes and provide proof of concept which is still a very valid use today. However, the
technology has now expanded into the manufacture of consumer goods, tooling and functional parts
for many industrial sectors. AM is a more apt description as it fundamentally refers to the stacking of
layers of material with a defined thickness (dependant on the machine specifications) vertically in the
Z-axis. This is enabled by firstly creating a 3-Dimensional (3D) model, which is generated through the
use of either computer aided design (CAD) software or 3D scanning data. This file can then be
converted into a standard tessellation language file (stl) to allow the AM machine to interpret the model
(other formats are also used, they are briefly discussed later in the study). The geometry of the 3D
model is converted into a mesh of triangulated surfaces which are mapped using a 3D Cartesian
coordinate system. A by-product of this is that whilst the file is correctly proportioned, there is no scale
or measurement unit information.
Within the activity discussed in this dissertation, stl files are used exclusively; the geometries created
within this study did not require a more advanced file type. More advanced file types such as the Additive
Manufacturing File Format (amf) [6] or 3D Manufacturing Format (3mf) [7] are utilised in AM machines
which are capable of fabricating components in multiple colours and/or different materials, such as the
Stratasys J750 [8]. These newer more advanced file types are among many others which allow for more
detailed models to be generated. The extra details include but are not limited to: material type and
colour [5]. The amf format was released in 2011 and not only allows for colour and material information,
but also has the capability to incorporate curved triangular patches which improve the geometric fidelity
of a part. In turn, this provides a significantly more customisable and complete part. After the file is
processed, it can be transferred to the AM machine, where it is deconstructed into layers of a specific
thickness dependent upon the capability of the machine. The AM machine then builds the model one
layer at a time in the Z-axis.
Figure 1: General process of AM [9]
Some processes, such as Fused Deposition Modelling (FDM) require support material for angles of
+45° in order to facilitate the printing process [10]. Also discussed in this dissertation is

9
Stereolithography (SL) which utilises support structures and Selective Laser Sintering (SLS) which is
self-supporting.
1.2 Additive Manufacturing Technologies
There are many different types of AM technology. Some require support material in order to achieve
complex geometries, whereas others can achieve this without the need for support structures. It is
significant distinctions such as this which help to categorise the different types of AM. Generally, AM
can be grouped into four categories based upon the material state: liquid, filament, powder and solid
sheet. However, the American Standards Organisation ASTM subcategorises AM technology into
seven segments detailed in Table 1 [11, 12].
Process category Technology Material
Vat
Photopolymerisation/liquid polymer
SL
UV curable resins
Material Jetting
MJM (MultiJet Modelling)
Waxes Ceramics
UV curable resins
Binder Jetting
3DP (3D Printing)
Waxes Composites Polymers Ceramics
Material Extrusion
FDM
Thermoplastics
Powder Bed Fusion
SLS SLM (Selective Laser Melting) EBM (Electron Beam Melting)
Thermoplastics Metals
Sheet Lamination
LOM (laminated object manufacturing)
Paper Metals
Thermoplastics
Direct Energy Deposition
LMD (Laser Material Deposition) LENS (Laser Engineered Net Shaping)
EBAM (Electron Beam AM)
Metals
Table 1: Additive manufacturing subcategories [11]
There are three types of AM utilised in this study, these were chosen as they were the AM technology
types available at the Lancaster engineering department laboratories. A brief description of these
processes are given below, and each is concluded with a technical specification of the specific machine
that was used in achieving the production of prototype models for the case studies that are described
in subsequent chapters.

10
1.2.1 Stereolithography
Stereolithography (SL) as a term was used by 3D systems in 1986 [10]. The term briefly lost its
specificity in the 1990’s where it became a catchall term for AM. The proliferation of FDM in subsequent
years in the hobbyist market helped SL reclaim its individuality as a term.
SL uses ultraviolet (UV) laser light to cure photosensitive polymers. A vat of resin sits above a UV laser
and a build plate is initially submerged within the resin. The laser then traces the desired path which is
specified for the first layer of the build. After each layer has been cured, the base plate will index away
from the resin so that the previous layer’s cured structure is all that is submerged within the uncured
resin vat. This process is repeated until the build is complete. The information provided to the SL
machine is often in stl format, the machine converts this, first into layers and then into X, Y toolpaths
and the desired Z index [14].
Figure 2: Overview of SL technology [15]
SL is a high resolution method of AM, the layer height is generally in the region of 25 – 100 μm. In laser
systems, the thickness of the layer is not determined by the index distance of the Z axis, instead the
index height is based upon a relationship between the intensity of the UV laser light and the scanning
speed. The Z axis index distance is dependent upon the intensity of the laser light because the more
intense the light or the slower the scan speed, the greater the penetration depth. This relationship is
described mathematically as such:
Cd = Dp ln (E/Ec) (Eq. 1)
Where:
Cd = Cure depth (mm)
Dp = Penetration depth (mm)

11
E = Irradiation dose mJ/mm2
Ec= Gel point mJ/mm2
The equation describes how the cure depth increases logarithmically with time. The gel point is specific
to each polymer, as the gel point is exceeded by the irradiation dose the cure depth increases [16].
There are disadvantages to SL method, one of which being the storage of resins. Unlike the filament
used in FDM and the powder used in SLS, the photosensitive resins perish in sunlight which means
that the quality of the resin decreases the more it comes in to contact with light [14]. Some contact with
light is highly probable when setting up a build, during a build and during the builds post processing
stage. These factors have to be taken into consideration when utilising a photosensitive resin.
An advantage of SL over its FDM and SLS counterparts is the resolution of the parts it can produce.
The higher resolution results in a more accurate final product when compared with FDM in particular.
The resolution is determined by the focal diameter of the laser which in general is a degree of magnitude
small than the aperture of an extruder head. Further to this, the resolution is a product of the cure depth
of the system, the lower the cure depth the greater the resolution.

12
1.2.1.1 Form1 - Form Labs
An example of SL AM technology is the Form 1 (Figure 3), which applies SL technology whereby a
laser cures each layer of the photopolymer resin as the bed indexes in the positive Z direction. This
technology was used as it was the highest resolution AM machine available at the Lancaster
engineering department laboratories at the time of conducting the research in this study.
Technical Specification
Technology: Stereolithography Material: Photoreactive Resin [15] Build Volume: 125 x125 x165 mm Layer Resolution: 25, 50, 100, 200 microns Laser Spot Size: 155 microns
Figure 3: Technical specification of the Form1 3D printer [18]

13
1.3 Fused Deposition Modelling
As a layer addition process, FDM utilises production grade thermoplastics to create parts, which can
be either fully finished end-use products or functional prototypes.
FDM is the main AM technique that is utilised by hobbyist machines. This is due to the relatively low
cost of the machines themselves and the materials. The materials used in FDM range from standard
Acrylonitrile Butadiene Styrene (ABS) or Polylactic Acid (PLA) to much more exotic materials such as
Carbon impregnated ABS.
The process of FDM begins in the same way as the other methods of AM within this study in that it
begins with the slicing of 3D CAD data into layers. This data is them processed by the machine, which
converts the slices into a toolpath for the extruder head. A toolpath is produced for each slice on the
XY plane. Following the completion of the toolpath the machine then indexes a distance in the Z
direction based upon the thickness of the extruded material.
Figure 4: FDM process overview [22]
The thermoplastic is extruded through a heated nozzle and precisely deposits material following the
generated toolpath. The accuracy in this plane is dependent on the quality of the machines linear axis.
One advantage of FDM is that it is relatively accurate in the XY, compared with selective laser sintering.
The resolution of FDM printers tends to be larger than that of SL and SLS.[23] This results in a more a
pronounced stepping effect on the parts it produces. It is important to take this into account when
building models using this method because actions can be taken to minimise its effect. Stepping is
particularly pronounced within the FDM process due to its typically larger layer thickness. An analysis
of where the required part needs to accurate should be carried out. For example, a cylindrical bush is
to be manufactured to have a tight tolerance fit with a shaft. The bush could be printed vertically,
horizontally or any angle in between. However, to produce a highly accurate part, the cylinder must be
printed horizontally. In this orientation, the FDM machine will stack layer upon layer of 2D circles atop
one another. This means that the part is of the highest possible accuracy across its diameter and of the
lowest accuracy in its length.

14
Figure 5: Illustration of cylinder print orientation [24]
FDM is advantageous over SL and SLS in many ways. The material used is cheaper, the process is
faster and large FDM machines are available to facilitate the production of large models. However, FDM
has disadvantages also, such as layer delamination, requirement for support material, (this can make
parts less economical to produce because more material is used and more energy has to be used to
extrude this extra material). And FDM also typically cannot achieve the resolution of its SL and SLS
counterparts [25].
FDM parts have a distinctive stepped appearance. The parts can be post processed to produce a
smooth finish utilising:
Chemicals such as acetone, which dissolve the outer layer of ABS parts;
Abrasives such as fine grade sandpaper, used to physically smooth a part;
Resins such as two-part clear epoxy resin, this is used to fill the steps, the part can then be
polished to achieve a smooth finish.
Following these methods, a part can be painted to achieve a desired level of finish.
1.3.1.1 Ultimaker 2 –Ultimaker
An example of FDM AM technology is the Ultimaker 2 (Figure 6). In brief, the Ultimaker utilises a
thermoplastic (usually PLA or ABS) which is heated to its glass transition phase (material specific
temperature) within the extruders ‘hot-end’. It is then extruded onto the heated bed which indexes in
the negative Z direction. This is repeated as many times as necessary in order to produce the completed
product.
This technology was used as it was the highest resolution AM machine available at the Lancaster
engineering department laboratories at the time of conducting the research in this study.

15
Technical Specification
Technology: Fused Deposition Modelling (FDM)
Material: ABS, PLA etc. Build Volume: 223 x223 x205 Layer Resolution: 20-600 microns
Build Speed: 24 mm^3/s
Figure 6: Technical specification of the Ultimaker 2 3D printer [26]

16
1.3.2 Selective Laser Sintering
Selective Laser Sintering (SLS) is a form of additive manufacturing technology which utilises a laser to
raise the temperature of precise regions of a powdered polymer to its glass transition phase.
The process involves slicing 3D CAD data into 2D layers, the 2D layers are imported into the AM
machine where each is generated into a toolpath for the laser. The build area is heated to reduce the
amount of energy required of the laser to heat the powdered material to sinter point. The temperature
is maintained through the use of infrared heaters. The build base indexes downward after each pass of
the laser. The powder is then replenished by two powder feed cartridges which index upwards, these
bins are serviced by a counter rotating roller which travels horizontally thereby distributing a layer of
powder across the build area. Each new layer of powder is approximately 0.1mm thick [4].
Figure 7: Overview of SLS technology [27]
The chamber is filled with an inert gas to limit the amount of oxidation of the powdered material during
the sintering process.
SLS parts are susceptible to warping which is due to the power imparted by the laser and non-uniform
distribution of heat within the chamber. The longer the laser is active the greater the energy dispersed
within the powder, this means that a warped part with a poor surface finish may be produced. It is for
this reason that the temperature of the build area and the duration the laser is activated is important.
The duration that the laser is active within each layer can be minimised with careful planning of the build
stack. Following a successful build, the chamber is allowed to cool uniformly. If the parts are prematurely
removed from the chamber thereby being exposed to cooler ambient temperatures, they can warp due
to irregular thermal contraction [4].
One major advantage to SLS in comparison with SL and FDM is the lack of need for support structure
as the powder itself supports the component being built. This in turn allows for assemblies with tight
tolerances to be produced together on the same build. In industry this would improve production time
by minimising the need for a fabrication stage.
A disadvantage is the surface finish of SLS parts. The parts have a poor surface quality when compared
to conventionally machined parts (The surface roughness of an SLS part can be in the range of
17
28~35µm. [28]); however, this can be overcome with the application of appropriate post processing
methods such as sanding, followed by painting. SLS parts can be geometrically more complex than
FDM. For example, SLS can facilitate the production of parts with almost totally enclosed voids (with
the exception of a small hole to allow the excess powder to be removed). The powder that supports the
structure of the void can be removed through a comparatively small hole in the structure which is easily
sealed to complete the desired internal void. This cannot be achieved as easily with FDM and SL
because the support structure is larger.
From the discussion (above) which outlines some AM technologies, it can be concluded that SLS has
benefits in that it allows for geometries that are not possible with the FDM and SL methods. However,
parts can have poor geometric accuracy because of the possibility of part warpage due to laser over
exposure and irregular heat distribution.
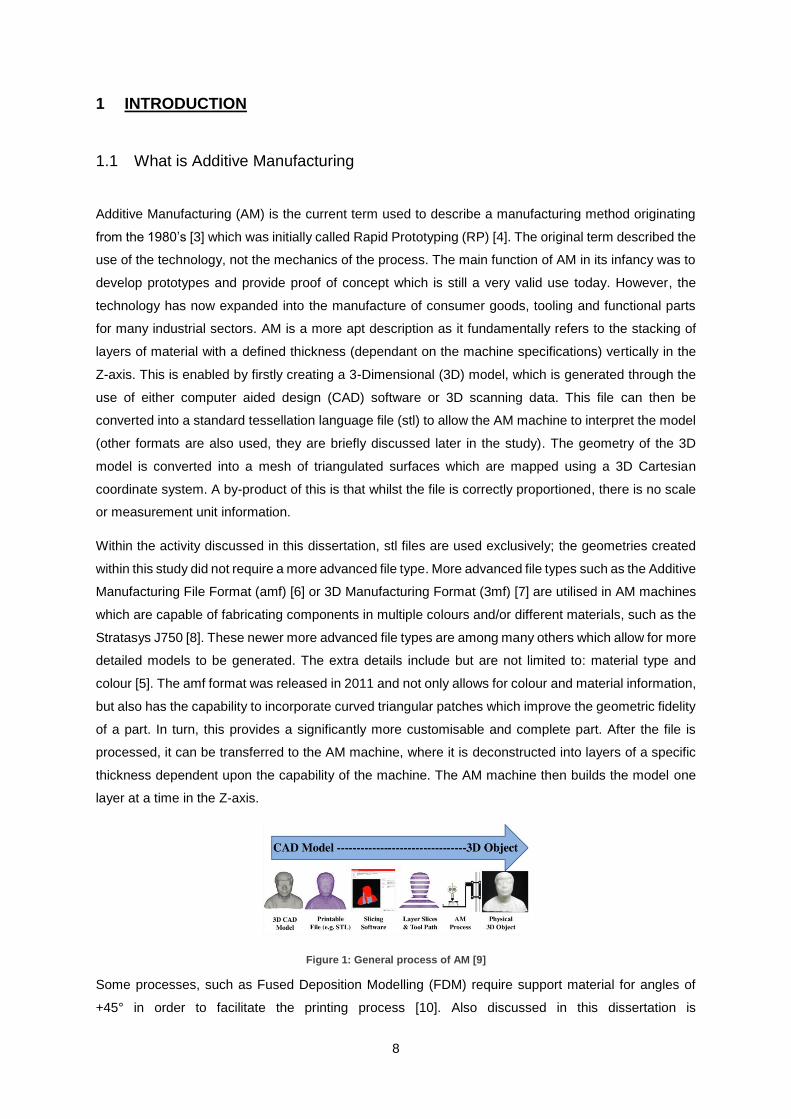
1.3.2.1 Sinterstation 2000 from 3D Systems Inc
An example of a SLS machine is the Sinterstation 2000 (Figure 8) which is an industrial machine using
an 50Watt CO2 air cooled laser to raise the temperature of specific areas of a powder layer to just below
melting point. Nylon 12 was the material used to build some of the prototype models for the case study
applications discussed within this dissertation.
Technical Specification
Technology: Selective Laser Sintering Material: Nylon-12 (powder) Build Volume: 320mm (diameter) x 380mm Layer Resolution: .25mm
Figure 8: Technical specification of the Sinterstation 2000

18
1.4 Current uses of Additive Manufacturing
AM is currently used across a wide range of industrial sectors and for varying applications. Despite it
being highly useful in producing complex geometries, it isn’t necessarily the solution to all manufacturing
problems as later discussed. AM is being used for batch production, tooling creation and prototyping
and certainly is an enabling technology as manufacturing moves towards automation and mass
customisation.
Three major industries which are currently utilising AM, and discussed in more detail below, are
Aerospace, Automotive and Medical. These industries have been chosen to show how AM is used in
high value/ low volume industries, this aligns with the general theme of this study.
1.4.1 Aerospace Industry
The aerospace industry is utilising AM to realise parts that have high geometric complexity and highly
complex functionality. For example, the integration of honeycomb internal structures whereby small air
pockets within a part allow it to be lightweight yet structurally capable. Furthermore, AM provides the
ability to create complex cooling channels that allow liquid to flow through a thermally dependent part
and thus maintaining the parts correct operating temperature. Complex cooling channels would be
either impossible or very costly to manufacture conventionally.
Polymer AM parts are already being used within military aircraft [10], but metals such as titanium will
be utilised more and more in coming years due to its high strength to weight ratio and the development
of machines capable of processing it such as SLM and EBM.
The Airbus Space and Defence Division specialises in the production of parts for satellite systems. In
2014 they encountered a problem with the titanium retaining brackets used to fix composite panels to
a satellite’s structure. The brackets were manufactured using conventional means which meant that the
geometry of the bracket was dictated by Design for Manufacture (DFM) criteria rather than geometry
that was optimised to reduce stress around the panel-bracket interface [29].
With conventional manufacturing deemed as unsatisfactory for these reasons, an AM solution was
sought. CAD and Finite Element Analysis (FEA) allowed for an optimised part to be designed that was,
crucially, not hindered by the need to subscribe to DFM criteria. Further to this, the part was then able
to be constructed in one step (Figure 9), rather than multiple stages as is common with conventional
manufacturing of metal parts.
A disadvantage of AM in the aerospace industry is the strict regulation surrounding material properties
and the predisposition of the industry to use tried and tested methods of production, particularly for
structural components.

19
Figure 9: AM bracket utilised in the aerospace industry [29]
1.4.2 Automotive Industry
Automotive manufacturers have used AM to gain a competitive advantage over other car manufacturers
as it is used as a bridge-tooling process. A bridge-tooling process can be defined as the production of
a part as a placeholder until an end-use part can be manufactured [10].
In the Formula Student competition 2012, Stuttgart University utilised AM to produce a topology
optimised steering stub axle. The challenge was to use AM to improve the performance of a part that
was being manufactured using high precision casting. The rationale was stated that although the current
part functioned well, it was limited by its subscription to DFM criteria [13].
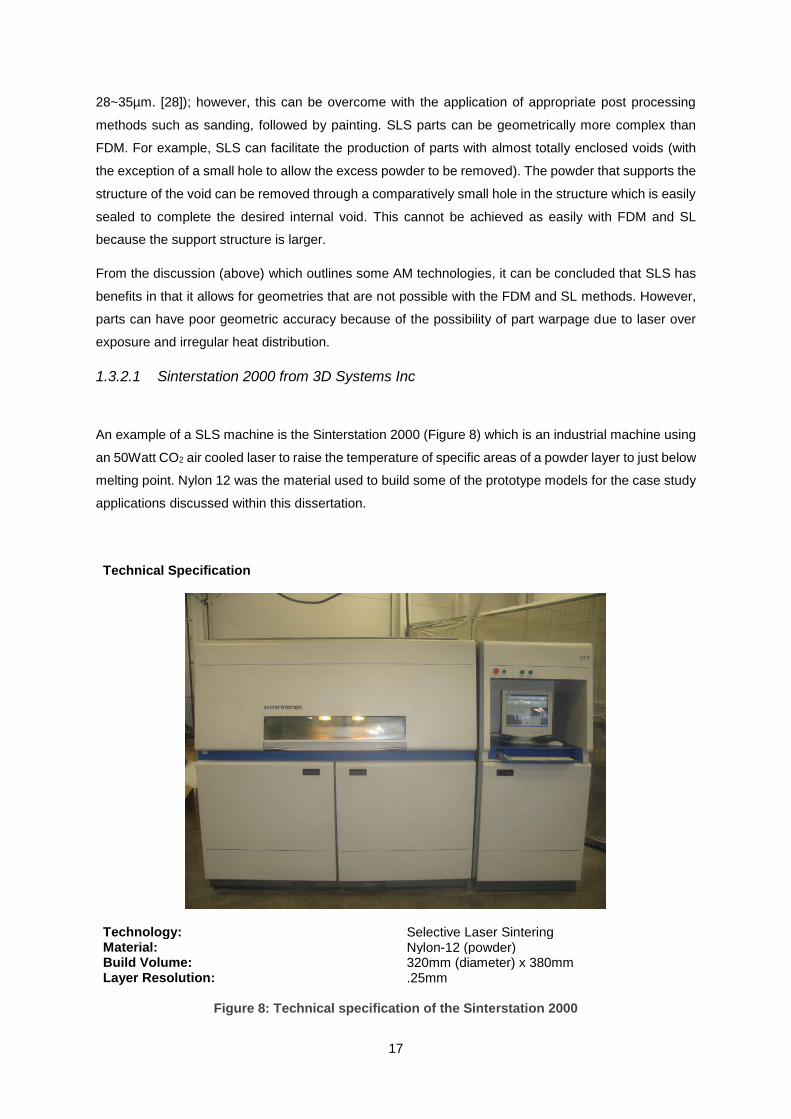
AM allowed for an optimised design to be prepared and manufactured with a short lead time (Figure
10). This is crucial in a competitive motorsport environment in order to produce products rapidly to keep
up with the competitive market. The weight of the final part was reduced by 660g (approximately 35%)
with a 20% increase in rigidity [30].
A disadvantage for the use of AM in the automotive industry is that the automotive (in general) produces
have volume parts. For high volume parts, traditional methods are more cost effective. E.g. injection
moulding.
20
Figure 10: AM bracket utilised in the automotive industry [30]
1.4.3 Medical industry
The Medical industry is an area of particular importance for AM with regards to how it has the potential
to drastically improve the wellbeing of patients. One major component to which this collaboration is
hinged is the ease at which medical imaging data (e.g. Magnetic Resonance Imaging (MRI) and
Computerised Tomography (CT)) can be converted into a 3D model [31].
For example, a 3D model of a patients injured mandible could be used to create a surgical guide tool.
This tool enables a surgeon to complete a surgery quicker and in a more efficient manner. Any surgical
method or tool that reduces a patient’s time under anaesthesia and overall surgery time is highly
valuable.
The accuracy of AM models produced using CT and MRI images has been scrutinised in studies
conducted by Mika et al [32] concluded that Polyjet technology [10] was the most accurate with a
percentage error of ±0.12% and 3DP to be the least accurate with a percentage error of ±0.43% [33].
A study conducted by Diethard et al [44] focused on image scan process parameters, in order to
investigate how to optimise a CT or MRI scan for fabrication of AM models. The study concluded that
medical images required a degree of pre-processing to produce an accurate model. It was important
for this study to confirm the suitability of medical images for the production of AM models to ensure the
validly of the case study discussed from Chapter 3.2.

21
Surgical tools in general could benefit from AM. For example, a surgeon who is an expert at using the
current tools available to perform a surgery, could drive the advancement of more sophisticated tools
through the application of AM principles.
It can be postulated that a surgeon who specialises in a particular type of surgery has the knowledge
to improve surgical tools but possibly doesn’t have the necessary engineering knowledge to bring any
improvement ideas to fruition. Collaboration with a research institution could help combine two areas of
expertise (engineering/medical) to allow for an accelerated route to manufacture [3]. AM could help
provide the proof of concept that is crucial when attempting to attract investment. This would allow the
medical professional to drive new technologies by utilising resources that were not previously available
to them.
AM can be used to produce 3D models of a patient’s ailment. For instance, if a patient has a brain
tumour, AM can be used to recreate a model of it. The benefit of this is that it can be used in conjunction
with counselling to give a patient empowerment and ownership over their condition. MRI and CT scans
can be shown to patients but they are difficult to interpret, so difficult in fact that the interpretation of
them is a medical specialism: Radiology. A radiologist specialises in the modalities of medical imaging
which include MRI, CT ultrasound (UT) and nuclear medicine (NM), in order that a patient can develop
an understanding of their condition. Viewing their medical images falls short of the mark due to its vague
and uninformative nature to the untrained patient. This is where AM can be of use as a physical, 3D
representation of a condition could provide a patient with the empowerment of more complete
understanding [35].
The process detailed above has taken place in a children’s hospital in Phoenix (USA). A patient was
found to have a benign but growing brain tumour. The tumour was removed and a 3D replica was made
which helped with the healing process (Figure 11). One recipient stated "I could see how big it was and
how the shape was, so I could see what was inside my head at the time" [35]. Another said "Lock it in
a box and put in your drawer or destroy it with a hammer, you can do that, so it gives you both a physical
and psychological outlet” [35]. A small change in how an illness is approached can make a positive
difference in how a patient copes.
Figure 11: Additive manufactured representation of a brain tumour [35]

22
1.5 Examples of Additive Manufacturing in a Research Environment
AM has particular importance within research facilities such as the Lancaster Product Development
Unit (LPDU) and the Advanced Manufacturing Research Centre – Integrated Manufacturing Group
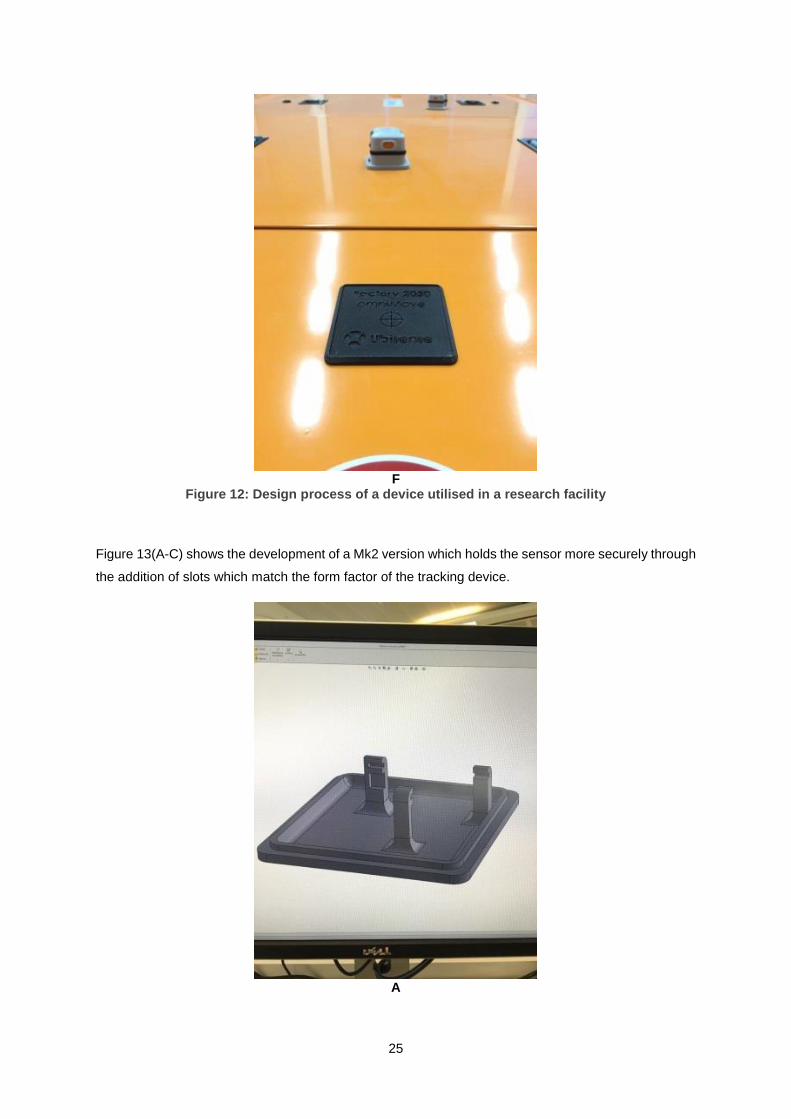
(AMRC - IMG) which utilises FDM to speed up its concept realisation. An example of this is in the
production of housing for an active RFID tag produced by Ubisense. The tag transmits a radio signal to
sensors which are located around the circumference of the AMRC’s Factory 2050 building.
The sensor records the angle of arrival and time of flight of the signal sent out by the tag. From this,
provided that the tag is visible by two or more sensors, the position can be triangulated to within +-
150mm of its actual position. The driving force behind the use of the Ubisense system is asset tracking.
It is increasingly important within the aerospace industry, and indeed in general manufacturing, to know
where parts are so that the time to completion can be calculated and resources assigned. In this case,
two sensors needed to be housed on an Automatically Guided Vehicle (AGV) so that not only could it
be tracked but the orientation could be deduced and displayed on a real-time dashboard.
AM enabled a housing of this type to be prototyped rapidly, which went through a design iteration within
one working day. This speed can’t be achieved by traditional methods and is important in ensuring that
a successful end use part is developed and useable quickly (Figure 12A-12F).
A

23
B
C

24
D
E
25
F
Figure 12: Design process of a device utilised in a research facility
Figure 13(A-C) shows the development of a Mk2 version which holds the sensor more securely through
the addition of slots which match the form factor of the tracking device.
A

26
B
C
Figure 13: Development of the device in the previous figure
A further example of this is given in Figure 14(A-D), where FDM was used to create the housing for an
optical encoder. The encoder was used to measure the linear motion of a rack within a sealant
distribution tool. The encoder enclosure had to match the curvature of the device to ensure that the

27
encoder disk was isolated from the working environment. This allowed for consistent measurement of
the linear motion of the tool as shown in the image below.
A
B
C
D
Figure 14: Design of an enclosure in a research facility

28
From the above examples provided above, it is clear to see that AM is invaluable in a research
environment for its ability to rapidly visualise designs, assess form-fit-function and to optimise the design
through an iterative process.
1.6 Disadvantages of Additive Manufacturing
There are some major drawbacks to AM which have hindered its advance into industry, namely:
Time: AM can be considered slow in comparison to high speed machining, which can remove material
much faster than an AM machine can add it. Further to this, AM is hindered by its previous moniker
‘Rapid Prototyping’ as it is assumed to be more or less an instant fabrication proces. This is not the
case; a stacked build on a Sinterstation for example can take upwards of 60hours to complete. Time
per part might be relatively low, but overall time is in excess of the expectations of non-technical people,
such as business managers. However, what must be considered is that machining is often just one
stage in the manufacturing process whereas AM can be considered in some applications as single
stage production.
Accuracy: Dimensional accuracy is best along certain axis, for example in FDM the best resolution is
in X and Y because these are determined to a large extent by the accuracy of the machine, while Z has
inherent inaccuracies associated with the interaction of each layer. [36]
Mechanical Properties: The layering of multiple interfaces can introduce undesirable mechanical
properties. Each layer of material is a potential failure mode; this physical characteristic can cause parts
to exhibit mechanical failures that are not characteristic of its material properties. [37]
1.7 How Additive Manufacturing Can Encourage Innovation
Innovation can be encouraged through the exploitation of AM. Conventional manufacturing methods
require expensive tooling. The cost of the tooling is made economically viable by mass production of
non-customised products. For example, a simple plastic car made through the convention means of
injection moulding would use a mould tool. The tooling for this process is expensive but, the cost of the
mould is spread across the number of cars produced. This makes it economical for businesses and
therefore injection moulding is almost always preferable for mass production of generic non customised
parts. Conversely AM is ideal for one-off and sometimes batch production. It is particularly desirable if
parts are to be used for prototyping and to demonstrate proof of concept.
It can be seen that mass production stifles customisation through the need to make a product easy to
manufacture and the need to make it standardised. AM allows for customisation at a realistic margin
(low volume/high value), thus allowing for innovation to be explored.

29
1.8 University Collaboration with Industry
1.8.1 Medical Industry
The design and development of medical devices is essential for the improvement of healthcare services,
in particular for the NHS where the demand for products to manage, prevent and treat illnesses in the
UK is set to increase with the increasing general and geriatric population. According to the Office for
National Statistics, the proportion of the UK’s population aged 65 and over will increase from 17.9% in
2014 to 22.9 in 2033 [38]. The prevalence of long-standing illnesses which require medical devices is
closely linked with age; the strength of this relationship is alluded to by the statistic which states that
people aged 75 or over are five times as likely to have a long term illness than those aged between 16
to 24 [39]. In addition to this, it can be hypothesised that the rise in sedentary and unhealthy lifestyles
adopted in the UK will further perpetuate the need for healthcare devices to manage conditions in
younger patients, such as diabetes and heart disease etc. An indication of the financial size of the
market is the UK’s expenditure on the national health which in 2012 reached £144.5 billion [40] and the
projected size of the Western European medical device market which increased from $73.11 billion in
2010 to $103 billion in 2015 [41].
The demands faced here can be met in part through the innovation and creation of new medical devices.
A need or area for improvement can often be identified by a physician but while they have expertise in
the medical field, they often lack the engineering knowledge to develop their ideas into useable
products, engineers have this knowledge and are able to translate an idea into a product.
The NHS requires innovation in order to be successful and provide the best patient care, so it is the aim
of this dissertation to understand (through case studies) how an initial concept, formulated by a NHS
physician, can be realised through AM methods.
Physicians have in-depth knowledge about the needs of patients with respect to medical devices and
can identify areas in which they can be improved but they lack the engineering knowledge to create the
devices or even to fully convey their ideas in a technical way.
Engineers using conventional subtractive and formative methods have the technical knowledge to
convey ideas and to design devices based on information from a physician but they are limited by DFM
criteria which leads to a product that has potentially compromised functionality.
Engineers utilising AM methods can provide proof of concept for a medical device without compromising
the design of the device. Figure 15 illustrates how these differing elements all interact, identifying the
knowledge segment that can be exploited in developing new products using the tools and knowledge
available.

30
1.9 Future of Additive Manufacturing
The future of AM is in a state of flux. The general public have high expectations, bolstered by sensational
articles in the media, that AM is both a brand new technology and the answer to any and all
manufacturing problems. In reality, AM has been around for c.30 years [42] and whilst it has its place
within manufacturing, it suffers from the limitations and drawbacks discussed previously.
Having said this, AM has the potential to revolutionise the way in which products are developed. AM
gives the engineer more control over the geometry and the internal structure of a product when
compared to conventional manufacturing [43]. This translates into an accelerated prototyping stage of
a particular products life cycle [44]. The following areas may be influenced by AM in the future:
If the rate at which a part can be fabricated increases, AM could revolutionise the consumer
goods market. A product that can be customised and sent to your door the next day would
drastically change the way in which companies produce and market their goods, mass
manufacture could be succeeded by mass customisation through the use of AM [44, 45].
The proliferation of AM used in conjunction with conventional machining is likely to take place.
AM will enable a company to be more capable to react to changes in a market. Mass production
Knowledge Segment to Exploit
Figure 15: How an engineer with input from a medical professional can exploit a segment of the medical engineering market

31
stifles a company’s ability to be agile. However, AM in conjunction with conventional machining
could give a company the ability to react to market changes.
The development of machines to process a greater array of materials is likely to increase the
value of the AM market. Machines that can utilise multiple exotic materials at once could
strengthen the UK’s high value manufacturing industry in the future. The UK must trend towards
high value manufacturing as it will not be able to compete with the volume or price of goods
manufactured in the developing world.
Tissue engineering is an area that is currently undergoing rapid growth due to the utilisation of
AM. The Bioengineering Research Group in Manchester is a flagship centre for tissue
engineering where electrospinning is being utilised to create scaffolding upon which cells can
be grown. This type of research will become vitally important as the average age of the
population increases because the requirement for innovative medical solutions will follow this
trend.
Material development will become an enabling technology for any future advances in AM as it
will drive innovation in the same manner in which it has in conventional manufacturing [12]. It
can be hypothesised that there will be an energy efficiency slant applied to future developments
due to climate change and energy/waste sanctions imposed upon the manufacturing industry,
so the development of materials with lower melting points but with good structural properties
might be a future branch of AM material development.

32
2 DEVELOPMENT AND PROTOTYPING OF A BLUNT DISSECTION TOOL
2.1 Background
Lancaster University’s product development unit (LPDU) received a project brief through its professional
network from Mr Ravindra Date who is a consultant surgeon at Royal Preston hospital. The aim of the
project was to develop a prototype of a concept surgical tool which could then be used by Mr Date to
further its development.
Following on from the initial prototype, utilising additive manufacturing, a PhD project was to be
undertaken within the Lancaster University engineering department to advance the concept further.
A specification to design a laparoscopic surgical tool that has the functionality to bluntly dissect the
gallbladder of a patient, whose condition is not conducive to laparoscopy by conventional methods was
developed within this study. AM was used to create the prototype to fulfil the design brief. With this
specification came the need to develop novel mechanisms with which to dissect a gallbladder from
surrounding inflamed tissue without the use of a sharp snipping or cutting tool. A sharp tool would be
likely to perforate the gallbladder causing bile to leak into a patient’s abdominal cavity; this is considered
a major complication and would hinder patient recovery [46].
Current laparoscopic gallbladder removal (Cholecystectomy) is carried out with the patient laying face
up upon the operating table whilst anesthetised. Small incisions are made in the abdomen (10-12mm)
to insert the laparoscopy tools. With the tools situated in place, the surgeon inflates the abdominal cavity
to create a working area. The surgeon then uses a camera to identify the gallbladder [47]. It is at this
stage that the operation can progress in one of two directions:
Scenario one: The gallbladder is resituated to expose the Calots Triangle, clamped in position and then
clipped with a titanium laparoscopic snipping tool allowing for it to be removed [48].
Figure 16: A diagram to illustrate the Calots triangle [49]

33
Scenario two: The gallbladder and surrounding area is deemed to be too inflamed to be removed
laparoscopically. In this scenario an open surgery is required. This involves a 100-200mm incision in
the abdomen, after which a surgeon manually separates the gallbladder from the surrounding inflamed
tissue. To do this the surgeon applies a pressure similar to that required to separate an orange from its
loosely bound peel [46]. This type of surgery significantly increases the risk of complications and results
in the patient having a longer recovery time. Therefore, a blunt dissection tool is of high value as it
would negate the need for this open surgery.
The conversion from laparoscopic to open surgery occurs in approximately one in five cases [48]. For
this reason, the need to develop a prototype that would aid in the development of the idea was required
by the collaborating NHS surgeon.
The critical mechanical design objectives for the tool were as follows:
To comprise of two fingers with a curvature to mimic the action of a surgeons fingers;
To fit within a 12mm diameter envelope;
To be able to be operated with two hands;
To be constructed with as few components as possible.
2.2 Method of approach
The design of this device was driven by the requirements set out by the NHS collaborator as discussed
above. It was agreed that a proof of concept should be prototyped so that the idea could be taken further
in the future.
The chosen route to manufacture the prototype was additive manufacturing due to the requirement for
the device to be made with as few parts as possible and due to AM allowing for the production of a
relatively low cost prototype. As such the design was focussed towards Design for Additive Manufacture
(DFAM). This is contrary to conventional DFM criteria where the focus is towards minimising
manufacturing complexity. Whilst DFM is a simple principle of reducing complexity to reduce cost, in
practice it requires a high degree of manufacturing knowledge and expertise in all aspects of
engineering, from materials to the assembly process. Conversely DFAM allows for added geometric
complexity at no extra manufacturing cost and removes to a certain extent the requirement for a high
level of engineering knowledge [51].
One of the design criteria was for the device to have as few components as possible. SLS was chosen
for this reason as it allowed the device to be fabricated without support material and with acceptably
tight tolerance enclosed hinges and pivot points.
The rationale behind the use of AM in this case study was to:
Remove geometric complexity constraints which served to enable design innovation;
34
Enable a short lead time from design to manufacture to allow for several iterations if required;
Facilitate the manufacture of AM joints to reduce the amount of components used.
2.3 Dissector Concept 1
Dissector concept 1 consists of two fingers hinged on internal sealed pivots, with each fixture on
independent cylinders. The internal pivot points serve three purposes:
1) To fulfil the criteria to reduce the number of components of the device;
2) To reduce the possibility of a pinch point which could interact with surrounding tissue causing
unwanted complications;
3) To reduce the number of cavities which would have to be cleaned more thoroughly.
The device’s fingers are curved to mimic the curvature of a surgeon’s fingers which expedite the blunt
dissection during open surgery. The required curvature violates the requirement for the device to fit
within a 12mm envelope.
It is a possibility that a composite design of a soft material combined with a skeletal structure composing
of a denser material to provide the required rigidity could be investigated in the future. Currently there
is not a requirement to pursue this opportunity because the complexity means that it can be deemed
out of scope for a proof of concept study.
The pins at the bottom of each finger were fabricated as one in the assembly. They serve as the location
point for the actuators which produce the pinching action of the device. The actuators run through the
shaft of the device to the conventional scissor action component of a laparoscopy tool.
The most innovative parts of the device are the concentric cylinders which allow the fingers to act as
the surgeon’s fingers do during an open surgery. This function is the pivotal purpose of the design and
requires two hands to operate. The surgeon would hold the stem of the tool (outer cylinder) with their
left hand and use this fixed point as the main pivot with which to guide the tool. At the same time the
surgeon would rotate the scissor action module which is connected to the inner cylinder, this would
allow for a dissecting motion to be achieved.
Figure 17 (A) shows the outer (white) cylinder and the inner (red) cylinder, each are supporting the
dissecting fingers by way of an internal hinge.
Figure 17 (B) illustrates the curvature of the fingers and shows the 270 degree extruded cut which
allows the actuating wire to transfer unhindered linear motion. The actuation wire was not modelled.

35
A
B
Figure 17: Detailed view of the blunt dissector mechanism

36
Figure 18 shows a prototype of the device after being fabricated on the SLS Sinterstation 2000. The
SLS process was utilised to manufacture this part from powdered Nylon-12. It was the aim of this
prototype to show that a tool that fulfilled the blunt dissecting function could be realised, and this
overarching aim was satisfied with this scaled model.
Figure 18 (A) shows the device in the closed position. In this position the fixed dissection finger would
support the posterior of the gallbladder prior to the initiation of the dissection.
In Figure 18 (B), the red ring highlights how the inner and outer cylinders interface. This interaction acts
as a solid end stop which provides feedback to the user, informing them that they have reached the
rotational limit of movement.
Figure 18 (C) displays the tool in the gripping position. Actuation wires would pull on the pins located at
the bottom of each dissection finger. This would cause them to pivot about the concealed pivot point
within the mounting boss. This functionality is non-critical.
In Figure 18 (D), the image displays the extremes of movement of which the device is capable. The
position illustrated would not be required during service but could be utilised during the sterilisation
process.

37
A B
C D
Figure 18: Additive manufactured blunt dissector
2.4 Dissector Concept 2
This section aims to illustrate an alternative idea for the blunt dissection of the gallbladder from the
surrounding tissue, whereby the dissection finger more accurately represents the form and function of
a surgeon’s finger. Following a review of the initial prototype with the NHS collaborator, it was decided
38
that the curvature of the fingers prohibited the insertion of the device through the 12mm diameter hole.
To overcome this, it was decided that concept designs for a mechanism which would both achieve the
desired curvature whilst retaining the ability to fit through the12mm diameter hole should be generated.
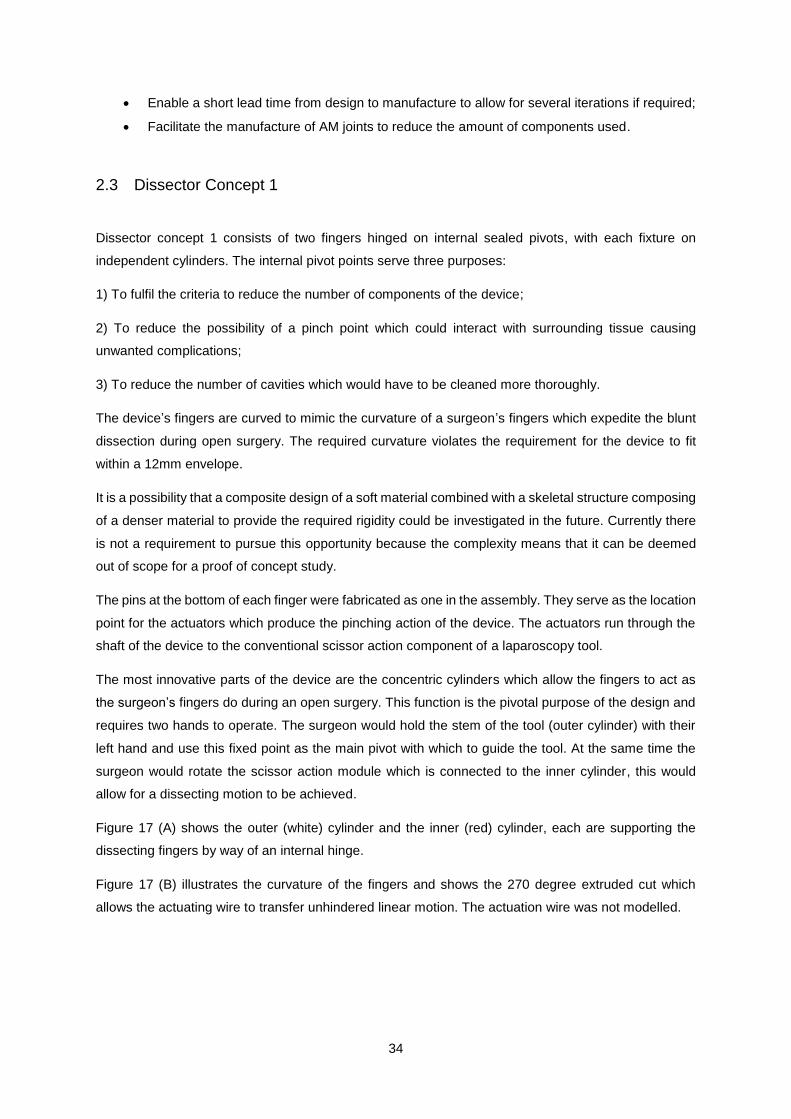
The instrument detailed has five incremental steps of movement in the Y direction but is also capable
of free movement in the same plane within the 80° limit (+40° and -40°). The finger also has 90° of
movement in the X direction (+45° and -45°). The finger and mechanism could be sheathed in a flexible
biocompatible material. The device would be operated in a similar way to current laparoscopic
instruments.
Figure 19 (A) shows the limits of movement of the device in Y direction (±40°). The pivot point is
concealed within the head of the device and the finger is stabilised by the toothed supports.
Figure 19 (B) shows how the device can replicate the movement of a finger. This movement would be
actuated with the use of tendon-like actuation wires.
A

39
B
Figure 19: Secondary blunt dissector concept
Figure 20 (A, B and C) shows the range of movement of which the device is capable in the Y direction.
Figure 20 (D and E) shows the ability of the mechanism to mimic the action of a human finger.
A

40
B
C
D

41
e
Figure 20: Movement of the dissector mechanism
2.5 Conclusions
In this study, a prototype was manufactured which successfully demonstrated that:
a) The principle of a blunt dissection tool could be realised within the limitations of a laparoscopic
device.
b) Additive manufacturing is a suitable means of development for a prototype surgical tool of this
kind due to its inherent benefits as discussed previously.
Concept 1 achieved the design brief and demonstrated that a blunt dissector is an achievable concept.
The prototype allows for the promise of the idea to be more easily articulated to prospective
investor/developers. The main benefit of this device is its potential ability to perfume a blunt
laparoscopic dissection of the gallbladder; this is currently unachievable with available surgical tools.
Concept 2 endeavoured to explore the possibility of a more complex mechanism which would mimic
the movements of a human finger more accurately. Although it achieved its aim as a concept design, it
would be complex to manufacture. It is for this reason that concept one is the most appropriate model
to carry forward.
The advancement of this device would reduce the number of Cholecystectomies (gallbladder removal
surgery) which have to be converted from laparoscopic to open surgery. The benefits of this are
multifaceted and far reaching but they can be summarised into: a reduction of overall surgery time, a
reduction in post-operative complications.

42
The scale of the prototype tool was sufficient to convey the idea behind the development of the new
tool; however, a prototype which more closely matches the size of the end use tool would give greater
credibility to the concept as it progresses.
To scale the device down slight modifications may have to be made, namely the hinge by which the
fingers pivot. As the scale decreases the gap between the hinge pin and its pivot body decreases.
Because of this it may be appropriate to produce this in two parts and not as an assembly.
The second concept for a blunt dissection finger is advantageous in that it more accurately replicated
the action of a human finger but the design requires development as it does not thoroughly detail how
the system would be actuated, be it wires or pneumatic etc.
2.6 Further work
2.6.1 Development of dissection finger
The dissection finger could be optimised further. An attempt at further optimisation was made in concept
2 but was limited by time. A device that mimics the form and function of a surgeon’s finger would be an
optimum solution for this device. This challenge would require an investigation into the properties of all
biocompatible materials; from this, a judgement could be made regarding its feasibility.
2.6.2 Material selection
In service, this tool will be in contact with bodily fluids and it is intended that the tool can be sterilised
and reused. These two criteria help to define which materials would be suitable. A part-metallic, part-
plastic construction would be suitable, particularly stainless steel or titanium as these have a proven
track record for in-vivo applications [35]. The plastic fingers of the device are required to allow the device
to have a degree of flexibility and structural conformance. The exact material selection is beyond the
scope of this report but it is important to point out that if the tool is to be reused it will require a sterilisation
pathway.
2.6.3 Sterilisation
It is envisaged that the tool would not be autoclaved, which is a process that serves to destroy bacteria
and biological pathogens by heating the tool to a high temperature in a pressurised vessel [50]. This
would cause plastic parts to fail and so instead a low temperature option must be considered such as
the STERRAD sterilisation system, this process utilises hydrogen peroxide gas plasma to sterilise
equipment to medical standards [50].

43
3 3D MODELLING CT/MRI SCAN DATA FOR ADDITIVE MANUFACTURE
3.1 Background
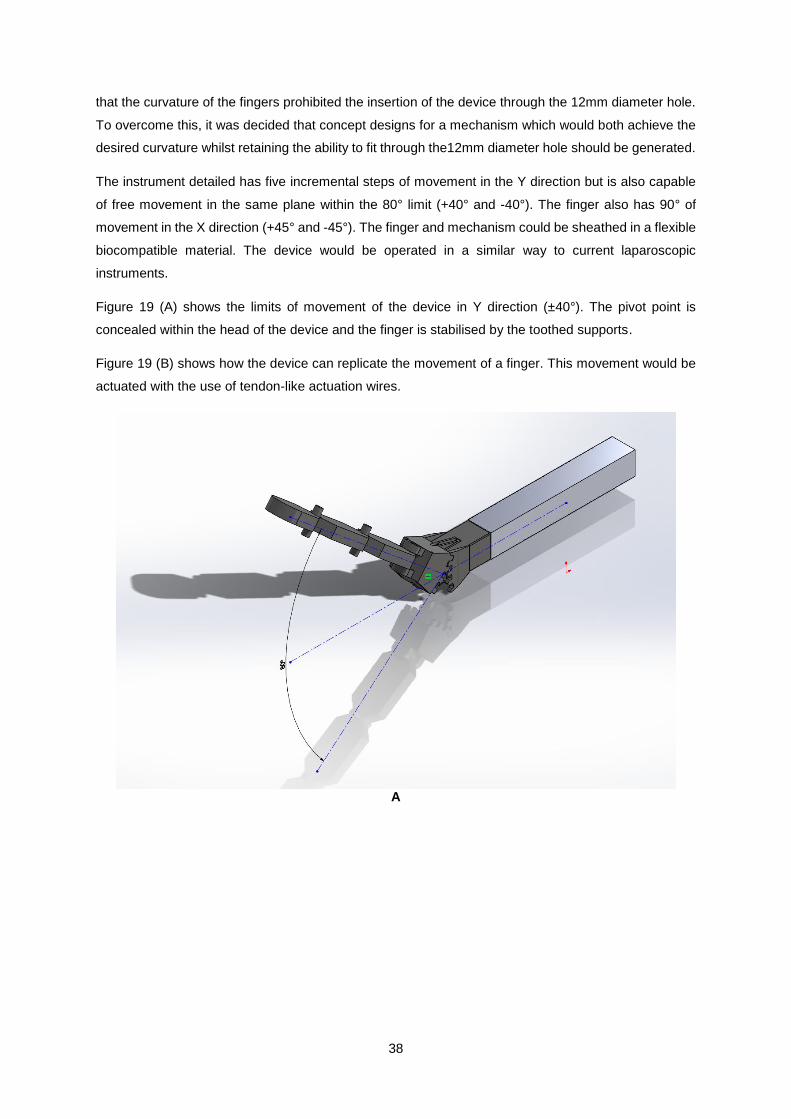
The brief for the 3D modelling of medical scan data was provided by the author of this study. A large
multilocular cyst was discovered when the author was admitted to the acute surgical ward with
abdominal pain which they had suffered from intermittently for approximately 13 years. The aim of this
study was to use 3D modelling to help with understanding of the condition.
It was acutely apparent to the author that a brief description of the condition by a doctor, coupled with
a review of the 2D scan images, was not sufficient to provide a patient with even partial understanding
of their condition. A 3D model would provide a patient with greater understanding of geometry and size
of a cyst or tumour, the author believes that 3D modelling and possibly even 3D printing of tumour or a
large cyst could help with a patents recovery process in many way. For example, in the early stages it
could be used by a doctor to provide a patient with a greater understanding of their condition.
3D modelling is becoming more frequently used in the medical industry due it being easily accessible
and relatively cost efficient. It is used currently in a variety of applications, the most well-known of which
being the production of hearing aids and cosmetic dental devices. The reduction in cost of AM as a
technology and the improvement in CAD systems have given rise to a whole host of other applications
within the medical industry, from cutting edge research to consumer-ready products, 3D printing is
contributing to the advancement of medical treatment.
The following sub-chapters detail how AM is currently being utilised within the medical industry and aim
to situate and validate the case study that follows within the current state-of-the-art.
3.1.1 Surgical guides using CT imagery
A recent study detailed the processes for how a surgical guide to aid mandibular reconstruction surgery
could be produced using medical data, CAD software and additive manufacturing [43]. The geometry
of the afflicted mandible was captured with a CT scanner which in this case was a 64-channel Philips
Healthcare machine. The images taken by this machine were of 1mm slice thickness and of 512 x 512
pixel resolution. The images were saved using the Digital Imaging and Communications in Medicine
(DICOM) format [56].
The images were processed into a 3D model using a commercial medical modelling software called
Mimics which is a subsidiary software package offered by the company Materialise. In this case, the
software produced a model in three steps: firstly, it used the Hounsfield value (HU) setting of cancerous
bone to +700 (The Hounsfield unit is a measure of radiodensity which can be applied to CT scan images
to separate parts of the human anatomy, for example bone from organ - the HU of distilled water is
defined as 0 whereas the HU of air is -1000). Secondly, it defines a ‘growing region’ which is effectively
a threshold to include/exclude areas of a scan that are bordering on the required HU. Finally, a 3D

44
model calculation combines the layers of the image by effectively performing a lofted boss between the
outer edges of the defined area in each layer.
The 3D model was then fabricated using the SLS technique. The SLS machine within this study used
biocompatible DuraForm to produce the surgical guide. This is a nylon based plastic. Typically Nylon-6
or Nylon-12 are used in commercial applications. The bed was heated to 70°C before the build was
initiated, this preheating allows for a laser to heat each section to just below the melting point of the
material. A 15Watt laser power was utilised with a scan speed of 1.25m/s at a layer thickness of 100μm.
The layer thickness is defined by the step resolution of the Z axis of the machine.
Figure 21 below shows:
A) The 3D reconstruction of the afflicted mandible with the surgical guide superimposed in-situ.
B) An individual isometric view of the surgical guide. The internal curvature of the guide perfectly
matches the form of the mandible; it has two holes for two 2mm titanium screws which are designed to
hold the guide in place during surgery. Finally, the guide outlines the required cutting path to be
performed by the surgeon.
A B
Figure 21: Additive manufactured surgical guide [56]
This surgical guide saved 20% operating time and improved the mandible reconstuction in the patient.
The guide improves speed and accuracy of the procedure which results in a cost saving and a more
repeatable and superior result for the patient.
3.2 Method of approach
The following sub-sections detail the method of approach for the modelling of the aforementioned large
multilocular abdominal cyst.

45
3.2.1 Medical image acquisition
The patient underwent a MRI scan at the Royal Lancaster Infirmary which resulted in the diagnosis of
the aforementioned large cystic mass. The scan was performed using a Siemens 1.5T MRI scanner
under the following conditions: Gadovist contrast agent at 7.5 unit volume, GR scanning sequence,
1mm slice thickness, 63Hz imaging frequency, 1.5T magnetic field strength, 580 x 580 pixel band width
and a total of 245 images were obtained [57].
An MRI scan works by aligning the protons within the body using a large electromagnet. The scanner
then disrupts the position of the protons using radio waves. The realignment of the protons after the
radio emitter is turned off produces magnetic fluctuations; these are detected by receivers within the
body of the machine. Sophisticated algorithms then build a detailed picture, discerning different tissue
types based upon the time it takes each proton to return to its undisturbed position [58].
An individual MRI consists of a 2D flat image taken at a specified depth within the body, which can then
be combined with other images at different depths to form what is known as an MRI scan. This
construction is very similar to that of 3D printed files so it lends itself to being reproduced in 3D using
additive manufacturing.
Figure 22 (A) is an image obtained from a CT scan; it shows a large multiloculated mass engulfing
almost the entirety of the bottom half of the abdominal cavity. The large/small intestines and appendix
have been displaced into the upper left of the patient’s abdominal cavity. The mass has a diameter of
approximately 300mm and an average depth of approximately 150mm.
Figure 22 (B) illustrates the human anatomy and details the internal organs. It can be seen that the
small intestine, large intestine and appendix are located within the lower half of the abdominal cavity.
A B
Figure 22: Extent of the cyst within the patient
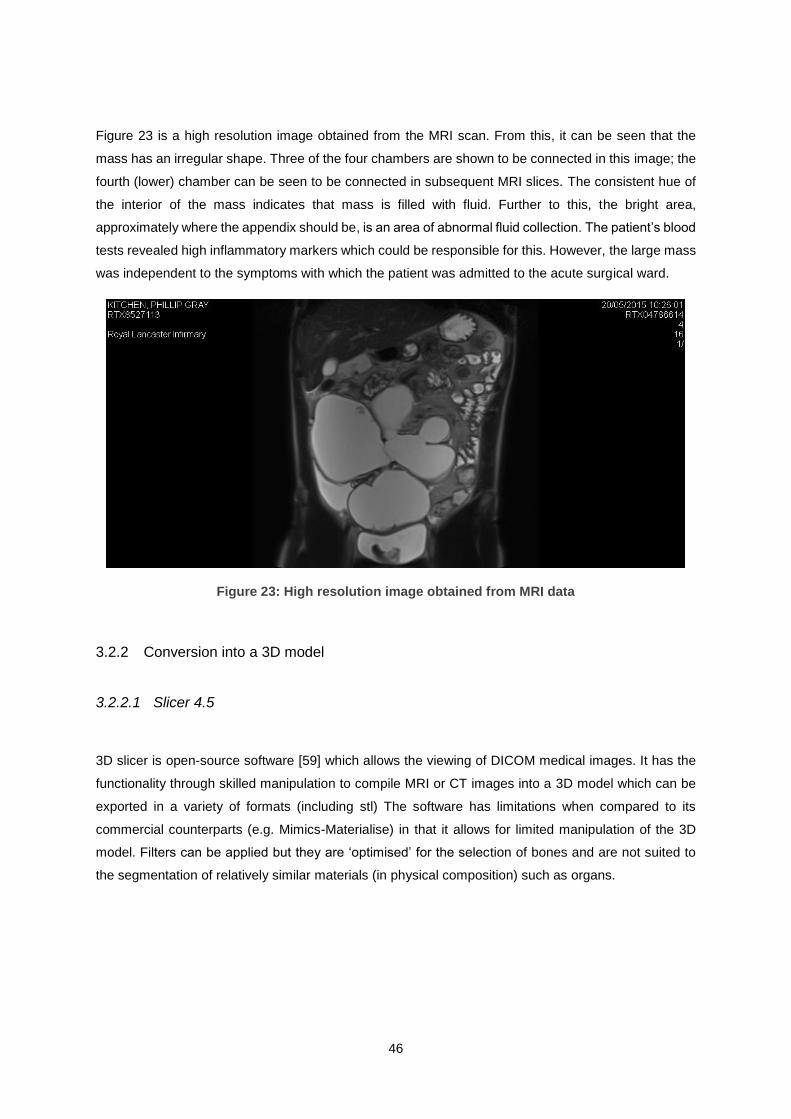
46
Figure 23 is a high resolution image obtained from the MRI scan. From this, it can be seen that the
mass has an irregular shape. Three of the four chambers are shown to be connected in this image; the
fourth (lower) chamber can be seen to be connected in subsequent MRI slices. The consistent hue of
the interior of the mass indicates that mass is filled with fluid. Further to this, the bright area,
approximately where the appendix should be, is an area of abnormal fluid collection. The patient’s blood
tests revealed high inflammatory markers which could be responsible for this. However, the large mass
was independent to the symptoms with which the patient was admitted to the acute surgical ward.
Figure 23: High resolution image obtained from MRI data
3.2.2 Conversion into a 3D model
3.2.2.1 Slicer 4.5
3D slicer is open-source software [59] which allows the viewing of DICOM medical images. It has the
functionality through skilled manipulation to compile MRI or CT images into a 3D model which can be
exported in a variety of formats (including stl) The software has limitations when compared to its
commercial counterparts (e.g. Mimics-Materialise) in that it allows for limited manipulation of the 3D
model. Filters can be applied but they are ‘optimised’ for the selection of bones and are not suited to
the segmentation of relatively similar materials (in physical composition) such as organs.
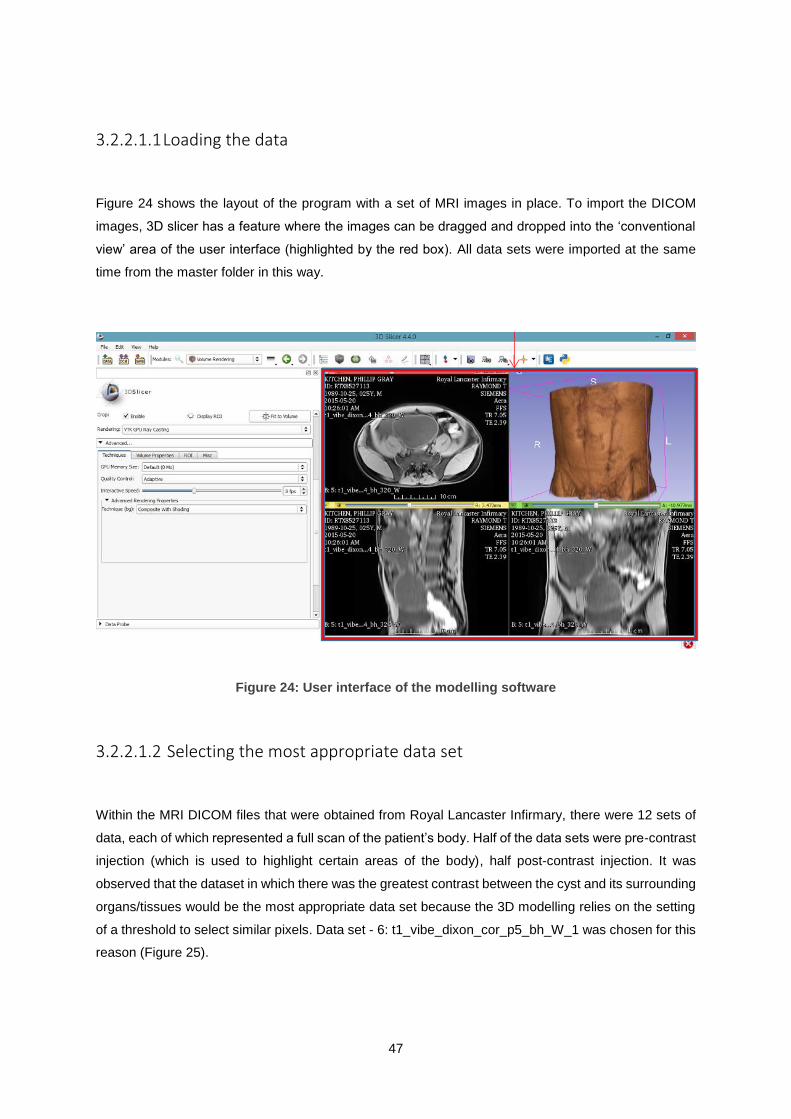
47
3.2.2.1.1 Loading the data
Figure 24 shows the layout of the program with a set of MRI images in place. To import the DICOM
images, 3D slicer has a feature where the images can be dragged and dropped into the ‘conventional
view’ area of the user interface (highlighted by the red box). All data sets were imported at the same
time from the master folder in this way.
Figure 24: User interface of the modelling software
3.2.2.1.2 Selecting the most appropriate data set
Within the MRI DICOM files that were obtained from Royal Lancaster Infirmary, there were 12 sets of
data, each of which represented a full scan of the patient’s body. Half of the data sets were pre-contrast
injection (which is used to highlight certain areas of the body), half post-contrast injection. It was
observed that the dataset in which there was the greatest contrast between the cyst and its surrounding
organs/tissues would be the most appropriate data set because the 3D modelling relies on the setting
of a threshold to select similar pixels. Data set - 6: t1_vibe_dixon_cor_p5_bh_W_1 was chosen for this
reason (Figure 25).

48
Figure 25: Location of the appropriate data set
3.2.2.1.3 Estimating the dimensions of the cyst
The data set 6: t1_vibe_dixon_cor_p5_bh_W_1 was also deemed the most appropriate to gather
approximate measurements of the cyst. The depth of the cyst can be approximated from the sliding
scale on each segmentation image. It can be seen that the cyst’s anterior region begins at +66.47mm
and the posterior region ends at -45.53. This means the maximum depth of the cyst is approximately
112mm. The maximum width can be approximated from the scale provided at the bottom of each image;
it is approximately 210mm across at its widest point (Figure 26).

49
Figure 26: Data used to estimate the approximate dimensions of the cyst
3.2.2.1.4 Volume Rendering
This feature allows the viewing of the MRI scan data in 3D (Figure 27). This is not a model that can be
exported as a stl file, it is merely a feature that allows for easier cropping of the image. The filter that
highlighted the cysts most precisely was the filter specifically thresholder and colourised to visualise
coronary arteries (CT-Coronary-Arteries).
Figure 27: Visualisation of the cyst

50
3.2.2.1.5 Cropping the area of interest
The volume rendering helps to inform the region of interest about which the cropping is to be performed.
The region of interest is cropped to create a sub-volume with which to create a 3D model in the later
stages.
In the upper right image of the conventional view in Figure 28, it can be seen that the cyst has been
segmented as much as possible from the surrounding anatomy. The bladder, which has a similar
threshold range has been cropped out. This is important as it would be difficult to segment them at a
later stage.
Figure 28: Cropped plot of the cyst data
3.2.2.1.6 Creating a 3D volume
A label map was created in the editor module in which the cyst was segmented out as much as possible
from its surrounding tissues/organs. A label map is a scalar volume in which each volume is assigned
a number. Zero is automatically defined as the background (anything not highlighted) and the cyst is
recorded as ‘309’, this is just a pre-set number, it holds no special information. The numbering system
would be useful if more than one organ/bone/tissue was to be modelled.
Figure 29 (A) shows the initial set up of the threshold feature. It can be seen that Cyst 309 is selected
and that the threshold slider scale does not fully match the volume of the cyst.

51
Figure 29 (B) shows that with the threshold set to between 300-580, the entirety of the cyst’s volume is
highlighted throughout each cross-section. The limitation of the software is that it is not sensitive enough
to differentiate the cyst completely from its surrounding tissues. The software does not provide an easy
solution to model the cyst but it does allow for a representative 3D model to be created which can be
edited in separate software such as MeshLab as a refinement stage.
This Scalar volume was then saved as a stl file to be imported to a secondary software package for
refinement.
A
B
Figure 29: Process of modelling the cyst

52
3.2.2.1.7 Model refinement
Nettfabb (software used to view, repair and edit stl files [60]) was used to improve the stl file and to
remove the bulk of the excess tissue which remained after the processing in Slicer 4.5. The file was
saved at different stages to detail the progress and to protect against sudden computer failures
provoked by the act of preforming the cleaning process. Removing vertices and faces from a high poly
model is a RAM intensive process, so it was prudent to perform it in stages.
The following images show three stages in the clean-up of the file, it can be seen that a large proportion
of the excess data has been removed from the model.
Figure 30 (A) shows the most unrefined stage of the model which has been superimposed onto a later
improved stage. It can be seen that the Slicer 4.5 method of creating a model is not very sensitive to
the anatomical differences of cysts and other organs in the abdominal cavity.
Figure 30 (B) shows an intermediate stage of refinement which was saved to prevent data loss in the
event of the program crashing as this is a common occurrence within this operation due to its RAM
intensive procedure.
Figure 30 (C) shows the final stage of model refinement, indicating that the cystic mass is free from the
majority of its surrounding tissue.
A

53
B
C
Figure 30: Manipulation of the cyst stl
3.2.2.1.8 Further model refinement
MeshLab, a software package which offers tools to edit, heal and inspect large stl files [61]. Offered the
opportunity to further refine the model. Figure 31 (A) shows how the highlight and deletion of faces
enabled the model to more accurately represent the surface of the cyst. There were many erroneous

54
structures which had to be edited. At this stage the model had 72,407 faces which were scanned for
abnormalities.
Figure 31 (B) shows that the deletion of these faces created holes in the mesh, which were filled using
the ‘fill hole’ function. The fill hole function bridges the gaps in a mesh, it is important for this model to
be ‘water tight’ – have no holes in the mesh so that it is representative of the mass and so that it could
be 3D printed.
A
B
Figure 31: Part of the stl manipulation process

55
3.2.2.1.9 Model simplification
After the model was improved, a simplification process was carried out with a view to removing the
number of faces and therefore making the model easier to process by the AM machine. A model of this
size would not benefit geometrically in any discernible way from being so high poly (high polygon count
mesh which is fine resolution), so a reduction will reduce the print time and processing time with no
detrimental effect to its quality. This was achieved using the Quadric Edge Collapse Decimation
function; this facilitated the reduction from 74,000 to 4000 faces (Figure 32 A-C). Quadric Edge Collapse
Decimation is a common method of mesh simplification [62] and is a built in function within MeshLab.
The boundary of the mesh was preserved to maintain the external geometry of the model.
A

56
B
C
Figure 32: Simplification of the cystic mass stl
3.2.2.1.10 Smoothing
The reduction in faces detailed above resulted in the model becoming too angular. To rectify this, it was
possible to utilise the ‘Depth Smooth’ function within MeshLab. This increased the number of faces from
4000 to 5500, but resulted in a more representative model (Figure 33). Simplifying the model to 4000

57
and then adding detail to the mesh to 5500 faces allowed the model to become smoother/ less angular
and more true to life. The result of this can be seen in the figure below.
Figure 33: Smoothing of the cystic mass stl
3.3 Conclusions
The model produced using Slicer 4.5 was not as representative of the cyst as it was first envisaged.
The software was not sensitive enough to fully differentiate between the cyst and its surrounding tissue,
as later discussed software packages exist which may be more suited to the task. Due to this lack of
sensitivity an extended amount of time was required to improve and simplify the model in secondary stl
manipulation software.
The lack of sensitivity lead to the model produced not being as useful to the patient. A fully
representative model would provide the patient with a greater understanding of their condition. As
discussed earlier in this study, a patient cannot hope to garner a full picture of their condition from
observing an MRI scan as they don’t have the training to interpret it. A 3D model would give the patient
a clearer understanding.
In conclusion, a more sophisticated software package would be an appropriate step forward in the
development of this study. In particular a piece of commercial software called Mimics InPrint from
Materialise facilitates the generation of 3D models from scan data but a seat of this software costs in
excess of £20k so it was deemed to be beyond the scope of this thesis to investigate this software.

58
3.4 Further Work
The modelling of the cyst could be performed in commercial medical image specific software such as
Mimics by Materialise. This software could have provided a more representative model, however access
was not granted to a free version of this software and the cost of purchasing a commercial licence would
have exceeded the budget of the project.
However, the modelling could be performed in SolidWorks which is a powerful 3D CAD software already
available to the author. The process of producing a 3D representation of the cyst would consist of four
main steps:
1. Create a plane for each image along one axis;
2. Trace the outline of the cyst in each image using the spline tool;
3. Perform a lofted boss to follow the contour of each slice;
4. Export the model as an stl file.
This method could produce a more representative model which could be improved and simplified more
easily as a secondary stl file using a manipulation software package, such as MeshLab.

59
4 DEVELOPMENT AND PROTOTYPING OF A NOVEL FLUID-MIXING DEVICE WITH POTENTIAL CLINICAL APPLICATIONS
4.1 Background
A brief was presented to the author to simulate and manufacture a prototype novel fluid mixing device.
This prototype is to be investigated as a potential medical/biomedical device, in line with current trends
over the past decades towards micro mixing devices being applied in the biomedical industry,
particularly for disease diagnosis and genetic analysis. There is a drive towards (1) increasing efficiency
- resulting in less biological material requirements (2) less material requirement – resulting in lower
manufacturing cost.[63]
Additive manufacturing was selected for this study as it would facilitate the device to be manufactured
in one piece, thereby reducing construction cost and computational fluid dynamics (CFD) was utilised
to simulate the most efficient mixing angle so that the device could mix fluids in the most efficient way.
The purpose of this study was to develop, 3D model and prototype a novel method of mixing fluids
utilising the creation of a vortex within a chamber. To achieve this, the study first details the state-of-
the-art with regards to how current micromixers function. This is followed by a description of the process
which was undertaken to develop and simulate the effectiveness of a novel mixing device. During initial
assessment of the potential design and function of the device it was clear that the complex geometry
would mean that the device could only be manufactured through additive manufacturing methods.
Micromixing devices are loosely defined as mixers which contain channels from a few millimetres in
diameter down to nanometres. Within these parameters normal mixing mechanisms such as convection
do not apply, the major mixing mechanism in micro-mixing applications is diffusion [66].
It is necessary to establish why this is the case. This can be established with a description of how
laminar flow affects mixing, followed by proof to show that laminar flow is likely in small diameter pipes.
The Reynolds number is a dimensionless value which aids in the prediction of how laminar a fluid will
be, given certain parameters. Equation 2 below illustrates why this behaviour occurs in channels of
small diameters.
(Eq 2)
Where U is defined as the flow velocity, D is the diameter of the pipe and v is the kinematic viscosity of
the fluid. As mentioned above, micro-mixing applications utilise pipes and channels which are of the
order of 2-3mm or less so it can be deduced that a small number in the top half of the equation will
result in a low Reynolds Number. This can be assumed with the assumption that U is also relatively
small. The lower the Re number, the more laminar the flow [67].

60
A laminar flow is not conducive to mixing. Laminar flow has the following characteristics all of which are
not ideal for the mixing of fluids and all of which are present in small diameter pipes of less than 2mm:
no lateral mixing, no cross currents or eddy currents [67].
It is turbulent flow and convection which aids in the mixing of fluids. In the absence of these, diffusion
is the main mixing mechanism. Diffusion is a relatively slow process defined in micro-channels by
Equation 3:
(Eq 3)
Where U is defined as the flow velocity, D is the diameter of the pipe and Dmol is the molecular
diffusivity of the fluid. Pe is the Peclet number which is equal to the product of the Schmidt Number
(viscous diffusion rate / mass diffusion rate) and the Reynolds Number. So it can be seen that the rate
of diffusion is defined and constrained by the diameter of the channel within which it flows [66].
The mixing of fluids in the medical and pharmaceutical industry is a challenge of principle importance.
The rapid mixing over short distances is essential for many industries, it is utilised within cell activation
processes for medical research, drug delivery systems in hospitals and to facilitate the chemical
reaction within lab-on-chip platforms for chemical research [66].
Micromixers can be subcategorised into two categories, passive and active. Passive devices require
no external impetus, instead they utilise diffusion or varying degrees of chaotic advection through the
use of a staged internal geometry which forces the liquid to take turbulent paths. Contrary to this, active
micromixers utilise external forces to agitate the flow thus creating more conducive mixing conditions.
Some examples of external impetuses applied to active micromixers are: pressure, magnetism,
vibration, acoustics and temperature. Because of the added complexity of active micromixers the
fabrication process is more complex which results in a much higher cost to manufacture. Active
micromixers also cost more to operate due to the associated energy costs or running an external
agitator, whereas, passive micromixers require no extra energy. The choice is a compromise between
running/manufacturing costs versus functionality [67]. In this study, a novel passive micromixer is
designed and the mixing efficiency is simulated to optimise the design.
4.2 Passive micromixers
Passive micromixers have two main mechanisms for mixing: diffusion and chaotic advection.
Micromixing devices aim to decrease the diffusion path and increase the total area in which the two
fluids are in contact. If the above aims are achieved, it can result in a shortened mixing time/distance
which is desirable for most applications.

61
4.2.1 Parallel lamination
Parallel lamination micromixers split the two fluids into two streams and direct them in line with each
other thereby increasing the distance at which the fluids are in contact with one another. This means
that there is a greater overall surface area contact between the two streams resulting in greater mixing.
This method utilises molecular diffusion as its main mixing mechanism, this means that long channels
are needed and it is advantageous to input the fluids at low velocity to achieve a low Reynolds Number
which will extend the mixing length.
4.2.2 Injection
Injection micromixers can offer a significant improvement in mixing efficiency over parallel and serial
lamination. The mixer splits the fluid to mix into separate channels and injects them into the main base
fluid, this creates micro-plumes which creates turbulent flow and increases the area of contact between
the two fluids.
4.2.3 Chaotic advection
Advection is a principle method to increase the rate of mixing within micromixing devices which exhibit
a low Reynolds number. The increased mixing rate is achieved though the creation of complex
geometries within the fluidic channel. Furthermore, these complex geometries are commonplace in
macromixing static mixing devices. Figure 34 shows examples of the chaotic advection technique
utilised within macromixing nozzles. The nozzles pictured are used to mix a two-part adhesive. They
are used within an automated adhesive application cell at the Sheffield AMRC. The nozzles are
mounted on an end effector of a robotic arm and the two-part adhesive is extruded through, using large
stepper motors which index in the negative Z direction through reservoirs of adhesive and promoter.
Figure 34: Examples of mixing nozzles

62
The principle of chaotic advection is to agitate the flow by modifying the channel diameter, breaking and
inhibiting the flow. Physically this is achieved by adding structures within the channel which act as
obstacles to the flow.
4.2.4 Active micromixers
Active micromixers utilise a vast array of mechanisms to achieve an increased rate of mixing. External
equipment which ranges in approach from magnetism to acoustics, facilitate this rate increase.
4.2.4.1 Pressure field disturbance
As an early development in micromixing technology, this approach was manufactured using silicon,
which has become common place for active micromixers.
Pressure disturbances can be applied in a variety of methods however a common and reliable method
is achieved by pulsing the velocity of the fluid. In these systems the mixing efficiency is related to the
pulsing frequency.
4.2.4.2 Electrohydrodynamic disturbance
The structure of electrohydrodynamic disturbance mixing devices is similar to that of pressure field
disturbance devices, however, the mixing channel can be upwards of 30mm long. Titanium wires are
placed at regular intervals perpendicular to the flow of the fluid. In these systems the mixing efficiency
is related to the electric current and signal frequency.
4.2.4.3 Thermal disturbance
The rate of diffusion between fluids is closely linked to temperature; the greater the temperature of a
fluid, the more active it becomes on an atomic level which increases diffusion. Methods which attempt
to achieve greater mixing efficiency using thermal disturbance have included: introducing a temperature
gradient across a standard parallel mixing channel and the creation of a thermal bubble within a channel
to agitate the flow.

63
4.2.4.4 Acoustic disturbance
An acoustic disturbance micromixing devise utilises acoustic agitators to achieve an increased rate of
mixing. One challenge with the acoustic disturbance technique is that the act of agitating in this manner
increases the temperature of the fluid. This would be an undesirable side effect if the fluids
characteristics were altered detrimentally by the temperature change. For this reason, the acoustic
disturbance technique is not recommended for some biological fluid applications. In acoustic systems
the mixing efficiency is related to frequency of the sound waves [67, 68]
4.2.5 Method of approach
4.2.5.1 Current manufacturing methods
The current manufacturing techniques used for manufacture of micromixers are polymeric
micromachining (plastics laser micromachining) and silicon micromachining.
Figure 35: Illustration of polymeric micromachining [64]
In the infancy of micromixing development, silicon was the most common material choice, with the
channels ether wet or dry etched. A clear acrylic or glass cover would then be bonded over the etched
channels to provide a seal and visibility. Further to this, a passive micromixer can be manufactured
entirely of glass if the application requires a non-electrically conductive device.
Active micromixers are almost solely manufactured from silicon. There are compromises to this in that
they are expensive to manufacture, due to the requirement for tight controls of the environmental
conditions. A further compromise is that silicon is not compatible with some chemical applications.

64
Polymeric machining can provide a lower manufacturing cost and also allows for quicker design
improvement/iterations because it is a faster manufacturing process [64, 65].
4.2.5.2 Exploitation of additive manufacturing
The device in this study was designed using the principles of DFAM as opposed to DFM. DFM is the
process of designing a part or assembly with the aim of it being simple to manufacture and fabricate,
which often relies on reducing geometric complexity. DFAM in some respects nullifies the need to
compromise geometric complexity. The geometric complexity within the design of the novel micromixer
would render it impossible to manufacture by conventional means. The design of the micromixer in this
study includes four jet channels which are concealed within an annulus.
4.2.6 Design of a novel micromixer
This section aims to outline the geometric design of the novel micromixer illustrated in Figure 36. The
geometric complexity of this mixer required it to be manufactured through AM means. It had overhangs
and internal voids which would make the device impossible to manufacture in one piece by conventional
processes.
Figure 36: Internal geometry of the micromixer
The design of this micromixer separates from its fluid mixing counterparts in that it aims to increase
mixing efficiency by generating a vortex within the main channel. It achieves this with the use of jets
which are angled in the X, Y and Z planes.
10mm

65
Figure 37 details the geometry of the jets within the mixer to illustrate how they aim to achieve a vortex.
It can be seen that the jets in this case are angled at 35° to the horizontal, and this is to ensure that the
introduction of the second fluid does not decrease the flow rate of the primary fluid. This was decided
using the rationale that if the flow rate of the primary fluid was inhibited, it would create turbulence which
could influence the mixing of the two fluids. It was the purpose of this study to asses solely if the creation
of a vortex increases the rate of mixing.
It can also be seen from this image that the flow of the secondary fluid is guided to follow the form of
the internal wall of the main channel; this was implemented so that the device would have a good
possibility of creating a vortex.
Figure 37: Sectioned views of the mixer geometry
Figure 38 (A) highlights with the use of a ‘detail cut’, the angle of one of the prototype mixers. This
image shows 1.5mm jets at a 45° angle to the normal (denoted by the centreline). The main channel is
10mm and has 1mm wall thickness. The length of the shaft is oversized to allow for full investigation of
the devices mixing properties.
Figure 38 (B) displays the vortex created by the device and gives an indication of the devices mixing
capabilities. A representation of the sensor was modelled for this trial to simulate where the mass
fraction of the mixed fluid could be measured from in practice.

66
Figure 38 (C) shows a cut plot which briefly details the distribution of the mass fraction values within
the main tube. There are no measurements shown on this figure as it is intended to illustrate the
potential of the device only.
Figure 38 (D) details the mass fraction values at the point at which the sensor is situated. It can be seen
that at this point, the mass fraction of the mixture is 2/3 methanol to 1/3 ethanol.
A
B
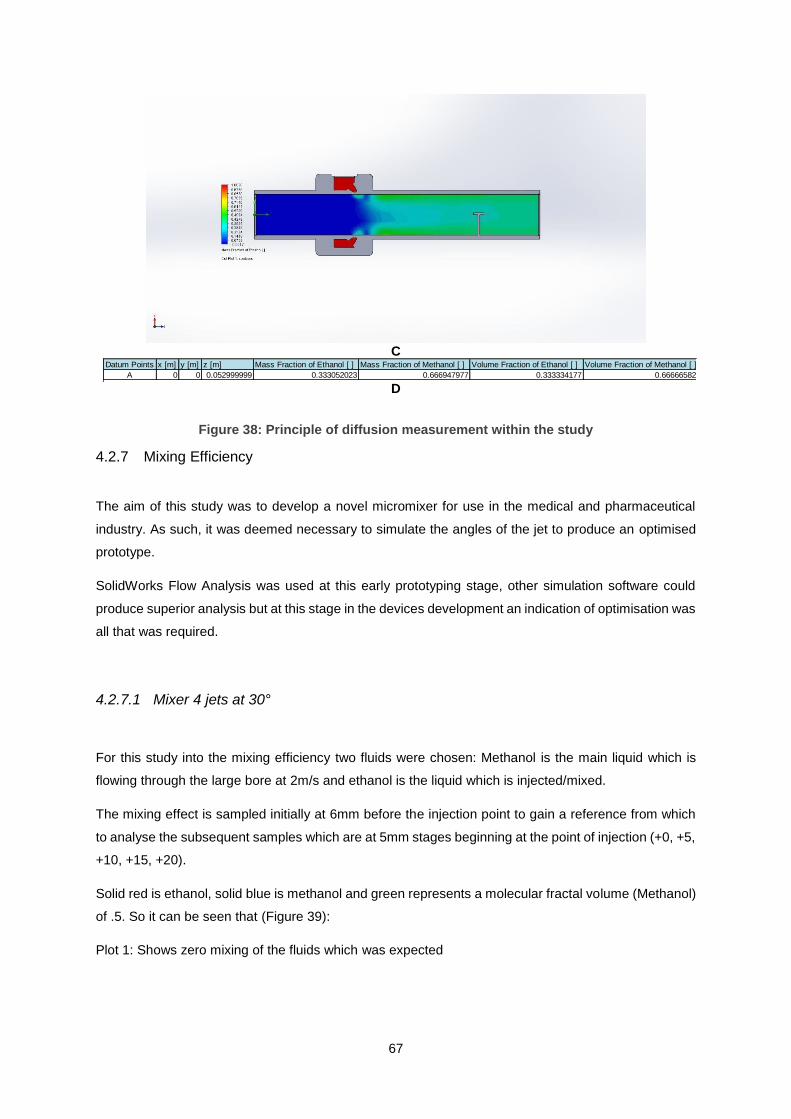
67
C
D
Figure 38: Principle of diffusion measurement within the study
4.2.7 Mixing Efficiency
The aim of this study was to develop a novel micromixer for use in the medical and pharmaceutical
industry. As such, it was deemed necessary to simulate the angles of the jet to produce an optimised
prototype.
SolidWorks Flow Analysis was used at this early prototyping stage, other simulation software could
produce superior analysis but at this stage in the devices development an indication of optimisation was
all that was required.
4.2.7.1 Mixer 4 jets at 30°
For this study into the mixing efficiency two fluids were chosen: Methanol is the main liquid which is
flowing through the large bore at 2m/s and ethanol is the liquid which is injected/mixed.
The mixing effect is sampled initially at 6mm before the injection point to gain a reference from which
to analyse the subsequent samples which are at 5mm stages beginning at the point of injection (+0, +5,
+10, +15, +20).
Solid red is ethanol, solid blue is methanol and green represents a molecular fractal volume (Methanol)
of .5. So it can be seen that (Figure 39):
Plot 1: Shows zero mixing of the fluids which was expected
Datum Points x [m] y [m] z [m] Mass Fraction of Ethanol [ ] Mass Fraction of Methanol [ ] Volume Fraction of Ethanol [ ] Volume Fraction of Methanol [ ]
A 0 0 0.052999999 0.333052023 0.666947977 0.333334177 0.666665823
B 0 0 0.057 0.335455685 0.664544315 0.335738852 0.664261148

68
Plot 2: Shows an immediate encroachment of ethanol into the sectioned diameter of methanol. The
encroachment can be described as uniform and radial diffusion at the outlet of each jet, which amounts
to less than half of the total area.
Plot 3: Shows a non-uniform diffusion of ethanol into methanol. There are four areas of strong even
mixing along the circumference of the plot, and a non-uniform area of concentrated methanol in the
centre.
Plot 4: Shows a lessened correlation to the position of the jets with the concentration of ethanol; the
concentration is more evenly distributed along the circumference of the plot and not as influenced by
the outlets. The high concentration of methanol has been replaced by an area which was slightly more
methanol than ethanol, however this central region appears to be uniform.
Plot 5: Shows a similar concentration distribution to plot 4, this indicates that the rate of mixing is
beginning to decrease by 15mm from the jet outlets. However, the concentration of the fluids was more
uniform.
Plot 6: Shows that at 20mm from the outlets, the rate of mixing had decreased to an extent that nullified
any further sampling.
Plot 1: -6mm
Plot 2: +0mm

69
Plot 3: +5mm
Plot 4: +10mm
Plot 5: +15mm
Plot 6: +0.20mm
Figure 39: Mixing plots of the 30° mixer

70
Figure 40 shows how the model was sectioned to achieve the samples above. For each experiment,
the first section was taken just before the outlet of the jets to provide a reference for each subsequent
sample.
Figure 40: Distribution of the cut plots
4.2.7.2 Mixer 4 jets at 45°
A second simulation was carried out to determine if a 45° angled jet would provide a more efficient
mixing, it was postulated that there would be an optimum angle which would produce a mixed solution
in the shortest distance. Below are the observations for the 45° angled jets.
Solid red is Ethanol, solid blue is methanol and green represents a molecular fractal volume (methanol)
of .5. So it can be seen that (Figure 41):
Plot 1: Shows zero mixing of the fluids which was expected.
Plot 2: Shows an immediate encroachment of ethanol into the sectioned diameter of methanol, which
is slightly greater than that of the 35° jets. The encroachment can be described as uniform and radial
diffusion at the outlet of each jet, which amounts to half of the total area.
Plot 3: Shows a more uniform distribution when compared to the 35° jet simulation. There are four areas
of slightly stronger mixing along the circumference of the plot, and a small area of non-uniform
concentration in the centre.
Plot 4: Shows an outer ring of highly mixed fluid, along with a lessened correlation to the position of the
jets with the concentration of ethanol; the concentration is more evenly distributed along the
circumference of the plot and not as influenced by the outlets. The high concentration of methanol has

71
been replaced by an area which was slightly more methanol than ethanol, however this central region
appears to be uniform.
Plot 5: Shows a similar concentration distribution to plot 4, this indicates that the rate of mixing is
beginning to decrease by 15mm from the jet outlets. However, the concentration of the fluids was more
uniform.
Plot 6: Shows that at 20mm from the outlets the rate of mixing had decreased to an extent that nullified
any further sampling.
Plot 1: -4mm
Plot 2: +0mm
Plot 3: +5mm

72
Plot 4: +10mm
Plot 5: +15mm
Plot 6: +0.20mm
Figure 41: Mixing plots of the 45° mixer
Figure 42 shows how the model was sectioned to achieve the samples above. For each experiment,
the first section was taken just before the outlet of the jets to provide a reference for each subsequent
sample.

73
Figure 42: Distribution of the cut plots
4.2.7.3 Mixer 4 jets 65°
A third simulation was carried out to determine if a 65° angled jet would provide a more efficient mixing.
It was postulated that there would be an optimum angle which would produce a mixed solution in the
shortest distance. Below are the observations for the 65° angled jets.
Solid red is Ethanol, solid blue is methanol and green represents a molecular fractal volume (methanol)
of .5. So it can be seen that (Figure 43):
Plot 1: Shows zero mixing of the fluids which was expected
Plot 2: Shows an immediate encroachment of ethanol into the sectioned diameter of methanol, which
is much greater than that of the 35° jets and also much greater than the initial mixing achieved by the
45° jets. The encroachment can be described as uniform and radial diffusion at the outlet of each jet,
which amounts to more than half of the total area.
Plot 3: Shows a very uniform concentration is achieved, with no area of high methanol concentration in
the centre.
Plot 4: Shows a mixture uniformity that was achieved by plot 6 in both the 35° and 45° trials.
Plot 5: Shows a similar concentration distribution to plot 4, which indicates that the rate of mixing is
beginning to decrease by 15mm from the jet outlets. However, the concentration of the fluids was more
uniform.

74
Plot 6: Shows that at 20mm from the outlets the rate of mixing had decreased to an extent that nullified
any further sampling.
Plot 1: -2.77mm
Plot 2: +0mm
Plot 3: +5mm
Plot 4: +10mm

75
Plot 5: +15mm
Plot 6: +20mm
Figure 43: Mixing plots of the 65° mixer
Figure 44 shows how the model was sectioned to achieve the samples above. For each experiment,
the first section was taken just before the outlet of the jets to provide a reference for each subsequent
sample.

76
a
Figure 44: Distribution of the cut plots
4.2.7.4 Mixer 4 jets 90°
A fourth simulation was carried out to determine if a 90° angled jet would provide more efficient mixing,
it was postulated that there would be an optimum angle which would produce a mixed solution in the
shortest distance. It was hypothesised that the 90° set-up would produce the least efficient mixing. Each
of the other test scenarios produce a vortex within the chamber which serves to mix the fluids more
quickly. The 90° set-up will merely inject the ethanol. Below are the observations for the 90° angled
jets.
Solid red is Ethanol, solid blue is methanol and green represents a molecular fractal volume (methanol)
of .5. So it can be seen that (Figure 45):
Plot 1: Shows some mixing 2mm before the outlet of the jets. This was not anticipated because it was
expected that the flow of methanol would be sufficient to direct the flow of ethanol immediately upon
entering the main bore. However, this observation does correlate with the postulation that the 90° jets
would not create stable vortex like flow within the chamber.
Plot 2: Shows a greater degree of mixing than observed in the previous simulation. The ethanol from
the jets meets in the centre of the bore where it mixes with the methanol.
Plot 3: Shows that the methanol has been displaced to the outer edges of the bore on the upper left
segment of the plot. This indicates that the set-up will not produce even mixing.
Plot 4: Shows no improvement in the mixture uniformity.

77
Plot 5: Shows a similar concentration distribution to plot 4, this indicates that the rate of mixing is
beginning to decrease by 15mm from the jet outlets. Furthermore, the mixing is not as uniform as that
achieved by the shallower angled jets.
Plot 6: Shows that at 20mm from the outlets the rate of mixing had decreased to an extent that nullified
any further sampling. Sufficient mixing of the fluids hadn’t been achieved.
Plot 1: -2mm
Plot 2: +0mm
Plot 3: +5mm

78
Plot 4: +10mm
Plot 5: +15mm
Plot 6: +20mm
Figure 45: Mixing plots of the 90° mixer
Figure 46 shows how the model was sectioned to achieve the samples above. For each experiment,
the first section was taken just before the outlet of the jets to provide a reference for each subsequent
sample.

79
Figure 46: Distribution of cut plots
4.2.8 Conclusion
Clearly, the mixing distance is shortened when the device achieves a vortex when compared with the
90° condition. The 90° trial could be categorised as a plume condition which was discussed above in
the passive-injector section. The plume condition achieves mixing through increasing the mixing area
of the fluid but still relies on the diffusion mixing mechanism. Whereas the vortex conditions achieved a
more even mass fraction in a shorted distance, this could be attributed to the turbulent flow created by
the vortex.
Below is a table to illustrate the difference in mixing efficiency of each simulated jet angle. A more
detailed description is detailed earlier in the chapter for each specific jet angle.
30° jets at 5mm 45° jets at 5mm 65° jets at 5mm 90° jets at 5mm
Figure 47: comparison of angled jets at 5mm mix distance

80
The prototype was manufactured using the SLS process; this was the most appropriate fabrication
method which was available because it did not require the use of structured supports. The powder itself
was the support which could then be easily excavated from the cavity. The material used was Nylon-
12, which can leave a porous component, therefore it was not ideal to test the theory behind the design.
The jet geometry was non-uniform and would have acted as holes rather than jets; an investigation into
the optimum jet geometry for AM is needed.
4.2.9 Further work
The prototype model required further optimisation and the material selection must go beyond what was
available towards a waterproof material that can be printed to an appropriate resolution. Materials which
achieve this are available commercially at AM service bureaux providers. For example, the 3D Printing
service Shapeways has a range of watertight acrylics which allow for a minimum feature size of 1mm.
A more detailed analysis of the output of each mixer would be appropriate. The simulation was basic
and provided an indication only of the possible benefits in creating a vortex to increase mixing rate. A
more in depth study using a more sophisticated fluid dynamics software such as ANSYS or COMSOL
would be appropriate.
Following further simulation, a wider array of fluids should be sampled to build a foundation of
consistency which proves the concept. Physical trials should only be embarked upon when the
simulations have strongly indicated the concept’s validity.
A mathematical description of how the device functions would help to develop a more efficient device
and benchmark the device against its current competitors within the macromixing market. This
mathematical analysis would follow the simulation stage. Since the degree of complexity outweighs the
usefulness of the mathematical analysis during the proof of concept stage. It is envisaged that the
analysis will be simplified into a 2D plane and will initially investigate the turbulent flow around the jet
nozzle. This simplification would be an essential first step into the further investigation into the
phenomenon of vortex mixing within small diameter pipes.
An investigation of how the characteristics of the micromixer change as the jets and channels become
narrower may be appropriate as the characteristics will change as the device moves towards the nano
range of micromixing. This could require design adaptations or may result in a specification which
dictates the devices suitability within a particular range. This could help the device corner a certain area
of the mixing market.

81
5 DESIGN FOR ADDITIVE MANUFACTURE OF A CLINICAL RECONFIGURABLE CELL CULTURE BOX
5.1 Background
The brief for this study was to design a reconfigurable cell culture box. The concept behind the cell
culture box envisaged that it would be used in the medical research sector to improve the adaptability
and re-configurability of cell culture experiments. The brief included a rough sketch of the device and
details of the design concept were provided. From this, a more detailed design was constructed in the
3D modelling software SolidWorks, which included concept designs for a cell culture block arrangement.
The collaborating partner is a spinout company of Lancaster University. As a research and development
company, it has access to state-of-the-art research facilities and benefits from scientific collaboration
with world class scientists and research centres. Currently the company is focused to further develop
and promote its paradigm shifting invention that has extensive applications in pharmaceutical and nano-
biotechnology research.
The brief for this study was to generate concepts based around an initial sketch for a cell culture device,
which will allow a user greater flexibility when conducting biological experiments
The company required the device to be modelled in 3D so that a set of photorealistic renderings could
be produced. These images were then to be used as artwork in future funding applications.
The outcome for this study was to develop concepts for a reconfigurable cell culture box with
geometrically complex features which would only be capable of manufacture using an AM approach,
and to produce a set of photorealistic renderings. Further to this, a set of manufacturing drawings were
produced for the outer case of the device. It was envisioned that a prototype would be made from clear
acrylic for demonstration/testing purposes.
One of the unique design features of the device is the honeycombed cell blocks, which provided
structure to media with a gelatine like consistency. The cell blocks were suitable for AM because of
their complex geometry. A series of prototype blocks were produced to determine the ideal wall
thickness and the ideal structure of the supports. These were produced using both SLS and SL.
Figure 48 shows an isometric view rendering of the completed reconfigurable cell culture box. As stated
above, this was to be used as artwork to apply for funding to further develop the concept. The renderings
were created in the SolidWorks add-in software, PhotoView 360. This program allows for the adjustment
of lighting, camera angles, shadows and materials, amongst many other features.

82
5.2 Creation of photorealistic renderings
5.2.1 Applying appearances
Initially the appearances of each of the components within the image must be specified. SolidWorks
provides a directory of material choices ranging from metals through to plastics. Glass of varying
colours were used to represent the gelatine like medium, the cell box was represented by transparent
polycarbonate and the cell blocks and divides were represented by medium gloss white plastics. The
colours used in the rendering are not completely representative of the materials that will be used in
practice but it was decided that the aesthetics of the rendering was of paramount importance due to its
future use in funding applications.
Figure 48 shows the selection of the discussed materials.
Figure 48: Selection of materials
5.2.2 Scene set-up
Careful preparation of the scene ensures a more realistic rendering. The initial step was to ensure that
the cell box correctly interfaced with the floor of the scene. To do this the basic settings tab was located,
the floor section was navigated to where the select face option can be selected. The base of the cell
box was selected with zero offset. This allowed the cell box to sit as if on a surface. Further to this, the
floor reflections were turned on to give the appearance of a slightly reflective surface.

83
A ‘3 Point Beige’ scene was applied to the rendering. SolidWorks Scene backgrounds consist of lighting,
hue, light intensity and in some cases background images, for this rendering a plain background was
chosen so as not to distract focus from the device.
A camera was added to give greater manipulability of the scene. Within the camera setting it is possible
to alter the field of view, change the depth of field, apply a focal point and accurately position the device
in the centre of the scene. The addition of the camera also splits the workbench into two pains so that,
by utilising the integrated preview option, the device could be viewed as a partial render in real time.
This allowed for easier application of addition lighting because it displayed how each additional light
would affect the scene.
Additional lighting was added to give the image more depth, it was important to utilise this feature
because there were many translucent faces within the rendering. Carefully positioned additional lighting
sources enhanced the image by highlighting the refracted structures within the cell box.
Figure 49 shows the selection of the bottom face of the device which was specified as the interface with
the floor of the scene.
Figure 49: Scene set-up
Figure 50 shows the application of the camera settings. Many of the settings were left as default, but
the depth of field and area of focus were altered extensively to achieve a realistic rendering.

84
Figure 50: Camera set-up within the scene
Figure 51 shows the addition of extra light sources; these highlight how refraction affected the
appearance of the structures within the cell box.
Figure 51: Addition of light sources
5.2.3 Rendering generation
The renderings were produced utilising the highest quality settings within PhotoView 360. The
renderings took approximately 240 minutes to complete. It can be seen from Figure 52 that the box is

85
sat on a slightly reflective floor. The scene is neutral and does not detract from the focus of the image.
There are multiple shadows from multiple light sources and the refraction of the glass creates a realistic
optical illusion.
Figure 52: Photorealistic rendering of the cell box
Figure 53 shows a partial exploded view of the cell culture box. It can be seen from this image that the
lid has segments with which to add labels, these segments could simply be numbered and referenced
within the experiments literature or they could have detailed printed labels attached to them which would
allow the user to identify what is in each compartment.
It can also be seen from this image that both the upper and lower sections of the box have three holes
located on the left and right, these holes are intended to allow the release of any gasses produced by
the experiment. Without these holes the lid may be jettisoned allowing the culture to be exposed to
potential contamination.
The design also incorporates the introduction of a box dividing barrier which enables the user to
separate the box into two sections therefore allowing for two experiments to be carried out concurrently.
Both experiments would be influenced by the same environmental conditions but could have separate
variables. This function is not currently available with standard cell culture boxes. Further to this the
image below also shows the use of an individual block barrier, this would serve to limit the interaction
between single blocks. This adds to the configurability of the cell box and thereby allows for more
adaptable experiments.

86
Figure 53: Photorealistic rendering with lid exploded view
5.3 Development of culture blocks
The design specification for the cell blocks was to create a structure that could support a medium which
has gelatine like consistency, and develop a system by which the blocks could be reconfigurable within
the cell culture box. This could be achieved by stacking and though the development of a slider system.
The cell block displayed in Figure 54 shows a block which aims to achieve the above design criteria. It
has honeycomb structured outer walls to support the material, the gaps are important to allow for
diffusion between desired cells. The block also has pins underneath which lock into the cell box to allow
for the device to be reconfigurable.

87
Figure 54: Cell block concept design
The concept block (Figure 55) was designed to show what is geometrically possible with the utilisation
of AM within this application. This block has complex inner geometry which could support a relatively
non-viscous medium. The section view shows the complexity of the geometry. This geometry is only
achievable using AM. The block also incorporates a blanked out section which could be utilised to limit
interaction between cell blocks. This concept would require the use of high tolerance SLS; this is due
to the unsuitability of techniques which require support material. Support material would be difficult to
remove during post processing.
Figure 55: Second concept design
Figure 56 shows a concept design which would limit the interaction between two stacked blocks. Within
the design brief it was specified that concepts should be developed to meter the interaction between
stacked blocks. This concept utilises the pins located on the bottom of the blocks, which have the dual
purpose of locating into the cell box channels, to fix a separating plate into position between the stacked
cells.

88
Figure 56: Exploded rendering of the cell block divider concept
5.4 Manufacture of the prototype blocks
The prototype culture box was initially manufactured using the SLS technique, where the minimum
feature size producible on the Sinterstation machine was 1mm, so the design was on the cusp of the
capabilities of the machine. As can be seen in Figure 57, the intricate honeycomb structure failed to
build. The honeycomb structure failed during the post processing stage, as the structure was extremely
brittle. It can be seen that the outer box structure had built with sufficient strength to maintain its shape
but the honeycomb panels had either failed to build or failed to build with sufficient strength to survive
post processing.
Because of this SLS failure, it was decided that SL would be a more appropriate method to prototype
the boxes. The SL technique has a resolution of 25µm, so the intricate structure was comfortably within
the capabilities of the machine.
Figure 57: Failed SLS build of the cell blocks

89
Figure 58 shows two prototype blocks manufactured utilising the SL technique. It can be seen that the
honeycomb structure has built successfully, along with the box edges and the base of the block which
is intended to interface with the cell box floor.
Figure 58: Successful build of the cell blocks utilising the SL technique
Figure 59 shows how the two boxes connect in a stacked configuration. This configuration allows for
an extra dimension in the design and implementation of cell culture experiments when compare with
conventional cell culture boxes. The pins help to locate and fix the upper box securely into position
while the pins on the lower box locate the stack within the cell culture box using the channels.
Figure 59: Stacked cell blocks
Figure 60 shows the two builds side by side. It is easy to see that SL produced a far superior prototype.
SL produced a consistent and uniform block whereby all features were complete and without defect

90
whereas SLS only produced a consistent outer edge and a failed to successfully build the honeycomb
structure.
Figure 60: Side-by-side for comparison
5.5 Assembly of cell culture box/feature overview
Box channels: Channels which run perpendicular to each other and adjacent to the cell box
divider provide structure to the cell culture box. These channels interface with the pins located
on the base of the base blocks.
Base blocks: The base blocks have honeycomb structured walls which sere to support the
gelatine like medium and also allow for a diffusion surface between pairs of blocks. The base
blocks also have a solid base because there isn’t a requirement for the base blocks to have a
diffusion surface with the base of the cell culture box.
Top level block: The top level block was identical to the base block in all but one respect. The
top level block has a honeycombed base to allow for diffusion between the upper and lower
levels.
Single block divider: This feature gives the user the option to limit the interaction between two
blocks.
Stack divider: The stack divider is a solid piece with four location holes which interface with the
pins of the top level block. This feature allows the user to limit the interaction between a top
level block and a base block.
Cell box divider: The cell block divider creates a break between two sides of the cell culture
box. The feature consists of a rectangular outer structure with vertical supports. The feature is
hollow to allow the user to add a solid partition if required.
Gas release holes: The gas release holes serve to prevent the lid from jettisoning from a build-
up of internal pressure created by the production of gas during a cell culture experiment. The
holes allow the gas to escape thereby keeping the pressure equal.
Label indicators: The label organisation structure on the lid of the cell culture box allows the
user to easily label and therefor keep track of complex culture experiment arrangements.

91
Figure 61 shows a simple culture experiment arrangement. It can be seen that the cell blocks can be
reconfigured to suit multiple experiments.
Figure 61: Example of a cell box assembly
5.6 Conclusions
There were two main aims to this study:
1) Develop concepts for a reconfigurable cell culture box;
2) Produce a set of photorealistic renderings for use in future funding applications.
The first aim stated above can be considered a success, as a multitude of concepts were developed,
all of which are guided towards reconfigurability. The cell blocks were produced utilising AM methods,
initially through SLS which was unsuccessful followed by SL which produced a satisfactory prototype.
The base and top blocks which were produced interfaced perfectly which was testament to the accuracy
and resolution of the SL process.
The second aim stated above was achieved by utilising PhotoView 360. The images are of sufficient
quality to form part of future funding applications for the external industrial collaborator. The images
could be improved further by the Implementation of more sophisticated stand-alone rendering software.
5.7 Future work
To validate the concepts produced in this study, it would first be appropriate test the cell blocks, which
are designed to support the gelatine like medium. The validity of the system is hinged upon the success
of the block design, so if following testing, the blocks are deemed fit for purpose, then the cell culture
box and all other components should be manufactured.

92
Further development should be applied to the dividers; these were secondary considerations during the
concept phase because a higher degree of importance was placed upon the blocks and the cell culture
box. The basic principle of a divider which is hollow to allow the insertion of a partition is believed to be
sound but the concept requires work. For this reason, a detailed description has not been provided
within the design section.
The rendering of the photorealistic images could be improved with the use of more sophisticated
software. Photoview 360 can achieve high quality images, as can be seen in the study but the level of
detail is second to that achievable in software packages such as 3D Studio Max.
3D Studio Max is a premium rendering software from Autodesk which is used in the videogame and
film graphics industries. However, the use of PhotoView 360 was sufficient for the production of the
images in this study. The additional time to produce them utilising more sophisticated software would
not be outweighed by the improvement in quality.

93
6 DISCUSSION
The research and activity detailed within this dissertation aimed to show how AM could potentially be
utilised within the medical and healthcare industry. It did this by targeting three major areas:
1. The development of surgical tools;
2. The creation of 3D models from MRI data;
3. The development of novel medical devices.
Each of the studies served an initial research project, following from this initial prototyping/research
phase, further development has taken place. In some cases it has taken the form of a dedicated PhD
project and in other cases it has taken the form of further research grant proposals.
In the development of a novel surgical tool, this study considered how AM could be utilised to provide
a proof of concept. This was successful in that the design was approved by the external collaborator
and an AM prototype was produced.
In the creation of a 3D model from MRI data, the study showed how this could be achieved utilising
free-source software and made recommendations as to where commercial software may produce
superior results. However, a 3D model was created which is not commonplace within the medical
sector. This model provided the patient with the desired appreciation of their medical ailment. As such,
this case study was considered to be successful with the caveat that if further modelling was to be
required, it may be appropriate to use more sophisticated software. However, the requirements of this
study did not specify that the model had to be particularly geometrically accurate because it was not to
be used as a surgical guide, it was for information only.
In the development of novel medical devices, this study considered two separate cases. The first was
the development of a novel mixing device which utilised the creation of a vortex within a pipe to increase
mixing efficiency when compared to other micromixing devices. This study simulated how the device
performed for different jet angles but did not directly compare the novel device’s mixing ability to that of
any current micromixing devices. This was a not carried out for two reasons:
1. The definition of micromixer (defined in case study three) is wide reaching, so it was
inappropriate to compare to a single device;
2. The novel vortex mixing method was unique among micromixing devices which meant that a
direct comparison was not achievable.
The case study succeeded in developing a novel device which could only be manufactured utilising AM
methods. There are areas with which the study could be progressed further, in that physical testing
could be carried out. Further to this, research into the selection of an appropriate device to benchmark
the novel mixer against should be carried out. The selected device should be currently on the market.
The second case study which investigated how AM could be used to develop a medical device, was
the development of a novel cell culture box. The brief required the production of concepts which would

94
allow the device to be reconfigurable and flexible to allow for greater freedom when designing cell
culture experiments. The study detailed this process which utilised 3D modelling and AM.
This study succeeded in achieving a reconfigurable cell culture box which satisfied the expectations of
the external collaborator. Extensive 3D modelling was carried out to facilitate the creation of
photorealistic renderings which the external collaborator could use in applications to fund the further
development of the idea.
The study could be expanded into more detailed development of the dividing sections; the sections
were an addition by the external collaborator at a late stage and would require additional time to
conclude the development. However, the principle behind the divider concept was agreed to and the
collaborator was enthusiastic towards the idea for further development.
The major area in which this study requires expansion is by the initiation of physical testing. The cell
blocks are currently concept designs. The designs should be validated with the completion of physical
testing.
The study as a whole aimed to show the relevance of AM within the medical industry. There is no
shortage of literature which allude to AMs applicability in this industry, but this dissertation provides
case studies which detail how it can be used to solve real-world challenges within the sector.
The dissertation is not exhaustive of all the applications in which AM could be utilised within the medical
industry and indeed the studies in which it focuses are not exhaustive within themselves, but each study
does indicate the validity of an AM approach in the solving medical challenges. In this respect, the study
fulfils its aim to show that AM can be utilised within the medical sector.

95
7 REFERENCES
[1] World Health Organisation. (2019). Medical Device - Full Definition. Available:
https://www.who.int/medical_devices/full_deffinition/en/. Last accessed 16/04/19.
[2] Wohlers Associates. (2010). What is Additive Manufacturing? Available:
https://wohlersassociates.com/additive-manufacturing.html. Last accessed 16/04/19.
[3] Gibson, I. (2015). Simplifying Medical Additive Manufacturing: Making the Surgeon the
Designer. Procedia Technology. 20 (1), p237-242.
[4] Gibson, I. (2015). Additive Manufacturing Technologies. 2nd ed. London: Springer. P10-201.
[5] Kaufui, V. (2012). A Review of Additive Manufacturing. Mechanical Engineering. 12 (2), p10-
55.
[6] Sculpteo (2016). AMF File Format for 3D Printing. Available:
https://www.sculpteo.com/en/glossary/amf-definition/. Last accessed 12/12/16.
[7] 3MF Consortium (2016). Specification. Available: http://3mf.io/specification/. Last accessed
12/01/17.
[8] Stratasys Ltd. (2017). Stratasys J750. Available: http://www.stratasys.com/3d-
printers/production-series/stratasys-j750. Last accessed 01/01/2017.
[9] Zhang, Longyu & Dong, Haiwei & El Saddik, Abdulmotaleb. (2015). From 3D Sensing to
Printing: A Survey. ACM Transactions on Multimedia Computing, Communications, and
Applications. 12. 1-23. 10.1145/2818710.
[10] Gibson, I. (2015). Additive Manufacturing Technologies. 2nd ed. London: Springer. P45-60.
[11] Huang, Y. (2015). Additive Manufacturing: Current State, Future Potential, Gaps and Needs,
and Recommendations. Journal of Manufacturing Science and Engineering. 137 (1), p1-10.
[12] Conner, B.P., Manogharan, G.P., Martof, A.N., Rodomsky, L.M., Rodomsky, C.M., Jordan,
D.C. and Limperos, J.W. (2014). Making sense of 3-D printing: Creating a map of additive
manufacturing products and services. Additive Manufacturing. 1-4 (1), p64-76.
[13] Campbell, I., Bourell, D. and Gibson, I. (2012). Additive manufacturing: rapid prototyping
comes of age, Rapid prototyping Journal, 18 (4), pp. 255‐258.
[14] Melchels, F. (2010). A review on stereolithography and its applications in biomedical
engineering. Biomaterials. 31 (11), p6000–6005.
[15] All3DP. (2018). Stereolithography (SLA) – 3D Printing Simply Explained. Available:
https://all3dp.com/2/stereolithography-3d-printing-simply-explained/. Last accessed 15/04/19.
[16] 3D Systems Inc. (1992). FUNDAMENTALS OF STEREOLITHOGRAPHY. Available:
http://sffsymposium.engr.utexas.edu/Manuscripts/1992/1992-23-Jacobs.pdf. Last accessed
15/04/19.
[17] Melchels, F.P.W., Feijen, J. and Grijpma, D.W. (2010). A review on stereolithography and its
applications in biomedical engineering. Biomaterials. 31 (24), p6121-6130.
[18] Formlabs. (2016). Photopolymer Resin for Form 1+. Available: http://docs-
europe.electrocomponents.com/webdocs/142f/0900766b8142facd.pdf. Last accessed
04/01/17.

96
[19] FormLabs. (2016). buy-materials. Available: http://formlabs.com/store/eu/form-2/buy-
materials/. Last accessed 20/07/16.
[20] Formlabs. (2016). SAFETY DATA SHEET. Available: http://docs-
europe.electrocomponents.com/webdocs/1453/0900766b814537ce.pdf. Last accessed
04/01/2017.
[21] Form1. (2016). Tech Specs. Available: http://formlabs.com/products/3d-printers/tech-specs/.
Last accessed 30/06/16.
[22] Alafaghani, Ala'aldin & Qattawi, Ala & Alrawia, Buraaq & Guzmana, Arturo. (2017).
ScienceDirect Experimental Optimization of Fused Deposition Modelling Processing
Parameters: a Design-for-Manufacturing Approach. Procedia Manufacturing 10 (2017) 791 –
803. 10. 10.1016/j.promfg.2017.07.079.
[23] Formlabs. (2017). 3D Printing Technology Comparison: FDM vs. SLA vs. SLS. Available:
https://formlabs.com/blog/fdm-vs-sla-vs-sls-how-to-choose-the-right-3d-printing-technology/.
Last accessed 20/04/19.
[24] 3dhubs. (2019). How does part orientation affect a 3D Print?. Available:
https://www.3dhubs.com/knowledge-base/how-does-part-orientation-affect-3d-print. Last
accessed 20/04/19.
[25] Grieser, F. (2015). FDM vs SLA: 3D Printing Explained and Compared. Available:
https://all3dp.com/fdm-vs-sla/. Last accessed 15/07/16.
[26] Ultimaker. (2016). Ultimaker 2. Available: https://ultimaker.com/en/products/ultimaker-2-plus.
Last accessed 26/07/16.
[27] Krkovic, Matija & Brojan, Miha & Bombač, David & Hermann, Dejan. (2013). Internal fixation
of radial head fractures with an intramedullary nail. Biomedical Engineering Applications Basis
and Communications. 25. 1350007. 10.4015/S1016237213500075.
[28] Dongping, S. (1998). Surface Finishing of Selective Laser Sintering Parts with Robot.
Available: http://sffsymposium.engr.utexas.edu/Manuscripts/1998/1998-03-Shi.pdf. Last
accessed 20/04/19.
[29] Wiebke, J. (2016). Additive Manufacturing process by EOS optimizes Satellite
Technology. Available:
http://www.eos.info/case_studies/additive_manufacturing_technology_otimizes_satellite_tech
nology. Last accessed 22/07/16.
[30] Wiebke, J. (2015). EOS supports racing team by producing a topology-optimized steering
stubaxle. Available:
http://www.eos.info/press/customer_case_studies/rennteam_uni_stuttgart. Last accessed
14/07/16.
[31] NHS. (2015). MRI Scan. Available: http://www.nhs.uk/conditions/MRI-
scan/Pages/Introduction.aspx. Last accessed 23/07/16.
[32] Christensen, A. (2004), Medical Modelling: Wohlers Report 2004, p195‐206.
[33] Mika, S et al. (2013). Accuracy of medical models made by additive manufacturing (rapid
manufacturing). Journal of Cranio-Maxillofacial Surgery. 41 (7), p603-609.

97
[34] Diethard B, (2009) Accuracy of medical RP models, Rapid Prototyping Journal, 15 (5),
p.325-332
[35] Lifshitz, J. (2014). 3D Printing Brain Tumors for Patient Empowerment. Available:
http://heart.phoenixchildrens.org/3d-printing-brain-tumors. Last accessed 29/06/16.
[36] Lee, Pil-Ho & Chung, Haseung & Won Lee, Sang & Yoo, Jeongkon & Ko, Jeonghan. (2014).
Review: Dimensional Accuracy in Additive Manufacturing Processes. V001T04A045.
10.1115/MSEC2014-4037.
[37] Lewandowski, John & Seifi, Mohsen. (2016). Metal Additive Manufacturing: A Review of
Mechanical Properties. Annual Review of Materials Research. 46. 151-186. 10.1146/annurev-
matsci-070115-032024.
[38] Office of National Statistics. (2011). The Ageing of the United Kingdom. Available:
http://www.ons.gov.uk/ons/interactive/theme-pages-1-2/age-interactive-map.html. Last
accessed: 08/07/14.
[39] Office of National Statistics. (2011). Adult Health in Great Britain. Available:
http://www.ons.gov.uk/ons/rel/ghs/opinions-and-lifestyle-survey/adult-health-in-great-britain--
2012/stb-health-2012.html#tab-Prevalence-of-Long-Standing-Illnesses-or-Disabilities-in-2012.
Last accessed: 08/07/14.
[40] Office of National Statistics. (2011). UK healthcare spending reaches £144.5 billion in 2012,
up 1.9%. Available: http://www.ons.gov.uk/ons/rel/psa/expenditure-on-healthcare-in-the-
uk/2012/sty-cost-of-healthcare.html. Last accessed 08/07/14.
[41] Acemite. (2007). World Medical Device Market. Available:
http://www.acmite.com/brochure/Brochure-Medical-Devices-Market-Report.pdf. Last accessed
08/07/14.
[42] Yan, Y., Li, S., Zhang, R., Lin, F., Wu, R., Lu, Q., Xiong, Z. and Wang, X. (2009). Rapid
Prototyping and Manufacturing Technology: Principle, Representative Technics, Applications,
and Development Trends. Tsinghua Science & Technology. 14 (1), p1-12.
[43] Baumers, M. (2016). The cost of additive manufacturing: machine productivity, economies of
scale and technology-push. Technological Forecasting and Social Change. 102 (1), p193-201.
[44] Wei, G et al. (2015). The status, challenges, and future of additive manufacturing in
engineering. Computer-Aided Design. 69 (6), p65-89.
[45] Kruth, J et al. (1998). Progress in Additive Manufacturing and Rapid Prototyping. CIRP. 47 (2),
p525-540.
[46] Dr Ravindra Date (2015). Interviewed by Phillip Kitchen. 3rd December 2015.
[47] Miller, J. (2008). Novel Mechanical Actuation of a Modular Laparoscopic Surgical Tool. Journal
of Medical Devices. 2 (3), p1-44.
[48] Richardson, W.S. and Hunter, J.G. (2000), Laparoscopic Nissen Fundoplication,
W.S.Eubanks, L.L.Swanström, and N.J.Soper, eds., Williams and Wilkins, Philadelphia, PA,
pp. 143–153.
[49] Teach Me Anatomy. (2019). CALOT’S TRIANGLE. Available:
https://teachmeanatomy.info/abdomen/areas/calots-triangle/. Last accessed 16/04/19.

98
[50] Sterrad, NX. (2016). Quickly and Safely Process Instruments for the Operating
Room. Available: https://www.us.aspjj.com/product/sterilization/sterrad-nx. Last accessed
22/07/16.
[51] Klahn, C. (2014). Design for Additive Manufacturing – Supporting the Substitution of
Components in Series Products. Procedia CIRP. 21 (5), 138-143.
[52] Rojahn, S. (2014). Artificial Organs May Finally Get a Blood Supply. Available:
https://www.technologyreview.com/s/525161/artificial-organs-may-finally-get-a-blood-supply/.
Last accessed 20/07/16
[53] Williams, R. (2016). Surgeon Uses 3D Printed Heart To Improve Surgery. Available:
http://news.sky.com/story/surgeon-uses-3d-printed-heart-to-improve-surgery-10344327. Last
accessed 03/06/16.
[54] Storrs, C. (2015). How a 3-D-printer changed a 4-year-old's heart and life. Available:
http://edition.cnn.com/2015/10/06/health/3d-printed-heart-simulated-organs/. Last accessed
04/05/16.
[55] Ebling, M. (2014). Project Daniel: 3-D Printing Prosthetic Arms for Children in
Sudan. Available: http://www.notimpossiblenow.com/labs/project-daniel. Last accessed
21/07/16.
[56] Yun-feng, L. (2014). Technical procedures for template-guided surgery for mandibular
reconstruction based on digital design and manufacturing. BioMedical Engineering. 13 (63).
[57] Siemens. (2015). healthcare-seimems.co.uk.
Available: https://www.healthcare.siemens.co.uk/magnetic-resonance-imaging/0-35-to-1-5t-
mri-scanner/magnetom-amira. Last accessed 12/12/16.
[58] Gibson, I. Cheung, L.K. and Chow, S.P. (2006). The use of rapid prototyping to assist medical
applications. Rapid Prototyping Journal, 12 (1), 53-58
[59] Slicer4. (2014). 3D Slicer. Available: http://download.slicer.org/. Last accessed 07/07/16.
[60] Edutech Wiki. (2017). Netfabb Studio tutorial. Available:
http://edutechwiki.unige.ch/en/Netfabb_Studio_tutorial. Last accessed 20/04/19.
[61] Meshlab inc. (2019). Meshlab. Available: https://en.wikipedia.org/wiki/MeshLab. Last
accessed 20/04/19.
[62] tanford University. (2019). Mesh Simplification. Available:
http://graphics.stanford.edu/courses/cs468-10-fall/LectureSlides/08_Simplification.pdf. Last
accessed 20/04/19.
[63] Chew Y.T., Xia H.M., Shu C. (2007) Fluid Micromixing Technology and Its Applications
for Biological and Chemical Processes. In: Ibrahim F., Osman N.A.A., Usman J., Kadri
N.A. (eds) 3rd Kuala Lumpur International Conference on Biomedical Engineering 2006.
IFMBE Proceedings, vol 15. Springer, Berlin, Heidelberg
[64] Shiu, Pun et al. “Rapid Fabrication of Micromolds for Polymeric Microfluidic Devices.” 2007
Canadian Conference on Electrical and Computer Engineering (2007): 8-11.

99
[65] Pietila, T. (2014). Saving a newborn with the support of 3D Printing. Available:
http://www.materialise.com/cases/saving-a-newborn-with-the-support-of-3d-printing. Last
accessed 08/07/16.
[66] Kim, R. (2015). 3D Printing Makes Heart Surgery Safer for Children. Available:
http://www.newswise.com/articles/3d-printing-makes-heart-surgery-safer-for-children. Last
accessed 06/06/16.
[67] Nguyen, N. (2005). Micromixers - a review. Journal of Micromechanics and Microengineering.
15 (2), p2-45.
[68] Mouza, A. (2008). Mixing performance of a chaotic micro-mixer. Chemical Engineering
Research and Design. 86 (5), p1128-1134.
[69] Melchels, F. (2010). A review on stereolithography and its applications in biomedical
engineering. Biomaterials. 31 (11), p6121–6130.