The use of pulse amplitude modulated fluorescence ...
223
THE USE OF PULSE AMPLITUDE MODULATED FLUORESCENCE TECHNIQUES FOR METAL TOXICITY ASSESSMENT IN FLUVIAL BIOFILMS Natàlia CORCOLL CORNET Dipòsit legal: Gi.599-2012 http://hdl.handle.net/10803/78995 ADVERTIMENT. L'accés als continguts d'aquesta tesi doctoral i la seva utilització ha de respectar els drets de la persona autora. Pot ser utilitzada per a consulta o estudi personal, així com en activitats o materials d'investigació i docència en els termes establerts a l'art. 32 del Text Refós de la Llei de Propietat Intel·lectual (RDL 1/1996). Per altres utilitzacions es requereix l'autorització prèvia i expressa de la persona autora. En qualsevol cas, en la utilització dels seus continguts caldrà indicar de forma clara el nom i cognoms de la persona autora i el títol de la tesi doctoral. No s'autoritza la seva reproducció o altres formes d'explotació efectuades amb finalitats de lucre ni la seva comunicació pública des d'un lloc aliè al servei TDX. Tampoc s'autoritza la presentació del seu contingut en una finestra o marc aliè a TDX (framing). Aquesta reserva de drets afecta tant als continguts de la tesi com als seus resums i índexs. ADVERTENCIA. El acceso a los contenidos de esta tesis doctoral y su utilización debe respetar los derechos de la persona autora. Puede ser utilizada para consulta o estudio personal, así como en actividades o materiales de investigación y docencia en los términos establecidos en el art. 32 del Texto Refundido de la Ley de Propiedad Intelectual (RDL 1/1996). Para otros usos se requiere la autorización previa y expresa de la persona autora. En cualquier caso, en la utilización de sus contenidos se deberá indicar de forma clara el nombre y apellidos de la persona autora y el título de la tesis doctoral. No se autoriza su reproducción u otras formas de explotación efectuadas con fines lucrativos ni su comunicación pública desde un sitio ajeno al servicio TDR. Tampoco se autoriza la presentación de su contenido en una ventana o marco ajeno a TDR (framing). Esta reserva de derechos afecta tanto al contenido de la tesis como a sus resúmenes e índices. WARNING. Access to the contents of this doctoral thesis and its use must respect the rights of the author. It can be used for reference or private study, as well as research and learning activities or materials in the terms established by the 32nd article of the Spanish Consolidated Copyright Act (RDL 1/1996). Express and previous authorization of the author is required for any other uses. In any case, when using its content, full name of the author and title of the thesis must be clearly indicated. Reproduction or other forms of for profit use or public communication from outside TDX service is not allowed. Presentation of its content in a window or frame external to TDX (framing) is not authorized either. These rights affect both the content of the thesis and its abstracts and indexes.
Transcript of The use of pulse amplitude modulated fluorescence ...
THE USE OF PULSE AMPLITUDE MODULATED FLUORESCENCE TECHNIQUES FOR METAL
TOXICITY ASSESSMENT IN FLUVIAL BIOFILMS
Natàlia CORCOLL CORNET
Dipòsit legal: Gi.599-2012 http://hdl.handle.net/10803/78995
ADVERTIMENT. L'accés als continguts d'aquesta tesi doctoral i la seva utilització ha de respectar els drets de la persona autora. Pot ser utilitzada per a consulta o estudi personal, així com en activitats o materials d'investigació i docència en els termes establerts a l'art. 32 del Text Refós de la Llei de Propietat Intel·lectual (RDL 1/1996). Per altres utilitzacions es requereix l'autorització prèvia i expressa de la persona autora. En qualsevol cas, en la utilització dels seus continguts caldrà indicar de forma clara el nom i cognoms de la persona autora i el títol de la tesi doctoral. No s'autoritza la seva reproducció o altres formes d'explotació efectuades amb finalitats de lucre ni la seva comunicació pública des d'un lloc aliè al servei TDX. Tampoc s'autoritza la presentació del seu contingut en una finestra o marc aliè a TDX (framing). Aquesta reserva de drets afecta tant als continguts de la tesi com als seus resums i índexs. ADVERTENCIA. El acceso a los contenidos de esta tesis doctoral y su utilización debe respetar los derechos de la persona autora. Puede ser utilizada para consulta o estudio personal, así como en actividades o materiales de investigación y docencia en los términos establecidos en el art. 32 del Texto Refundido de la Ley de Propiedad Intelectual (RDL 1/1996). Para otros usos se requiere la autorización previa y expresa de la persona autora. En cualquier caso, en la utilización de sus contenidos se deberá indicar de forma clara el nombre y apellidos de la persona autora y el título de la tesis doctoral. No se autoriza su reproducción u otras formas de explotación efectuadas con fines lucrativos ni su comunicación pública desde un sitio ajeno al servicio TDR. Tampoco se autoriza la presentación de su contenido en una ventana o marco ajeno a TDR (framing). Esta reserva de derechos afecta tanto al contenido de la tesis como a sus resúmenes e índices. WARNING. Access to the contents of this doctoral thesis and its use must respect the rights of the author. It can be used for reference or private study, as well as research and learning activities or materials in the terms established by the 32nd article of the Spanish Consolidated Copyright Act (RDL 1/1996). Express and previous authorization of the author is required for any other uses. In any case, when using its content, full name of the author and title of the thesis must be clearly indicated. Reproduction or other forms of for profit use or public communication from outside TDX service is not allowed. Presentation of its content in a window or frame external to TDX (framing) is not authorized either. These rights affect both the content of the thesis and its abstracts and indexes.
THE USE OF PULSE AMPLITUDE MODULATED
FLUORESCENCE TECHNIQUES FOR METAL
TOXICITY ASSESSMENT IN FLUVIAL BIOFILMS
Ph.D.THESIS
Universitat de Girona
NATÀLIA CORCOLL I CORNET
2011
Universitat de Girona
Institut d’Ecologia Aquàtica
Ph.D. Thesis
THE USE OF PULSE AMPLITUDE MODULATED
FLUORESCENCE TECHNIQUES FOR METAL TOXICITY
ASSESSMENT IN FLUVIAL BIOFILMS
Natàlia Corcoll i Cornet
2011
PROGRAMA DE DOCTORAT EN CIÈNCIES EXPERIMENTALS
I SOSTENIBIBILTAT
Dirigida per:
Dra. Helena Guasch Padró Dr. Manel Leira Campos
Institut d’Ecologia Aquàtica Facultat de Ciències
Universitat de Girona Universitat de Lisboa
Memòria presentada per a optar al títol de Doctora per la Universitat de Girona

Universitat de Girona
Institut d’Ecologia Aquàtica
La Dra. Helena Guasch i Padró, professora titular del departament de Ciències
Ambientals de la Universitat de Girona i el Dr. Manel Leira Campos, investigador de la
Facultat de Ciències de la Universitat de Lisboa,
CERTIFIQUEN:
Que aquest treball, titulat “The use of pulse amplitude modulated fluorescence
techniques for metal toxicity assessment in fluvial biofilms”, que presenta Natàlia
Corcoll i Cornet, per a l’obtenció del títol de Doctora, ha estat realitzat sota la meva
direcció.
Signatura,
Dra. Helena Guasch Padró Dr. Manel Leira Campos
Girona, 2011


AGRAÏMENTS
És molta la gent que ha estat implicada en aquesta tesi i vull aprofitar l’ocasió
per agrair-los-hi la seva ajuda.
En primer lloc vull agrair a la meva directora de tesi, l’Helena, haver-me ofert la
possibilitat d’embarcar-me en aquesta aventura. Així com el suport i dedicació que hi
ha posat en tot moment. N’he après molt, en especial, que les coses s’han de lluitar.
També agrair al meu co-director, en Manel, el interès i l’ajuda rebuda, tot i les
limitacions que suposa la distància.
Agreixo molt als meus pares el suport i l’ajuda que em van donar per poder
estudiar. També agraeixo a les meves germanes el recolzament i els ànims rebuts en
tot moment.
La majoria d’experiments els he compartit amb la Berta, tan al camp com al
laboratori, crec que ens hem coordinat molt bé i que hem sabut treure el millor de
nosaltres per fer un bon equip. Tinc molt bons records de l’expedició a Decazeville a
posar substrats al riu Mort que mai vam recuperar, dels mostrejos a la riera d’ Osor, o
del tip de riure que ens vam fer quan se’ns va trencar la taula que aguantava la
banyera dels canals a mig experiment. Déu ni do quantes vivències. Ha estat molt
enriquidor! També agrair les primeres lliçons de la Sandra sobre el món dels metalls i
els canals artificials, va ser un bon inici que em va convidar a continuar. Agrair a la
Chloé la bona predisposició per discutir de ciència i l’amistat compartida. L’ambient
amb la resta del grup “fluecoteam” i companys de seminari sempre ha estat molt bo, i
això fa que tingui un molt bon record dels anys de tesi. Moltes gràcies Irene, Susana,
Marta, Lorenzo, Gemma, Joans, Juanita, Xisca, Leslie, Elisabeth, Albert, Jordi, Anna,
Sergi i a tota resta de l’àrea d’ecologia per l’interès, suport i sobretot bons moments
compartits. També donar les gràcies als zoòlegs, botànics i geòlegs per alegrar els
dinars en comunitat.
Agrair l’acceptació i bona acollida que vaig rebre durant les estades de recerca
a l’estranger, tan a l’equip d’en Philippe Juneau a l’Univesitat de Québec a Montréal,
com a l’equip d’en Bernard Montuelle al CEMAGREF de Lyon. Anar al Canadà va ser
un gran experiència, vaig aprendre molt tan a nivell professional com personal,
Gabrielle i Marie-Claude moltes gràcies per la bona rebuda.
Ha estat molt enriquidora la colaboració amb l’Ahmed i la Soizic, sou uns
cracks del PICT i de les diatomees. Gràcies Soizic per la identificació de diatomees.
Tinc molt bons records dels mostrejos a Osor, també del SETAC a Sevilla.
A nivell tècnic voldria agrair l’ajuda rebuda tan a la Facultat de Ciències per part
de l’Esther i la Sílvia, com al Servei Tècnic de Recerca durant els anàlisis de metalls
per part de la Lluïsa i la Imma. Aquesta tesi no hauria estat possible sense el
finançament dels projectes espanyols: FLUVIALFITOMARC (CL 2006-12785/HID) i
FLUVIALMULTISTRESS (CTM2009-14111-CO2-01), i del projecte europeu
KEYBIOEFFECTS (MRTN-CT-2006-035695).
Author thanks the reviewers of this thesis for their comments and suggestions
which have greatly improved the final version of this manuscript thesis.
També voldria agrair a tots els amics i amigues que sempre s’han interessat
per saber com avançava la meva tesi. En especial a les empordaneses (Elena i Rusó),
Elena moltes gràcies per la portada i contraportada, i a les gaseles de biologia i Girona
(Aitana, Emma, Gemmes, Isabel, Olga i Cati) per ser tan ben texides. No em podria
descuidar de la colla escaladora i muntanyenca, amb qui he desconnectat tants caps
de setmana i sempre us heu encuriosit per saber què feia ben be amb les algues.
Per últim, agraeixo molt especialment a en Riki per haver endolcit aquests
darrers anys de tesi amb el seu suport, paciència i bons consells.
Moltes gràcies a tots!

LIST OF PUBLICATIONS DERIVED FROM THIS THESIS
Corcoll, N., Ricart, M., Franz, S., Sans-Piché, F., Schmitt-Jansen, M., Guasch,
H. The use of photosynthetic fluorescence parameters from autotrophic biofilms for
monitoring the effect of chemicals in river ecosystems. In Guasch., H., Ginebreda, A. &
Geiszinger, A. [Eds]. Emerging and Priority Pollutants in Rivers: Bringing science into
River Management Plans.The Handbook of Environmental Chemistry. Springer, Berlin,
Germany (in press).
Corcoll, N., Bonet, B., Leira, M., Guasch, H. 2011. Chl-a fluorescence parameters
as biomarkers of metal toxicity in fluvial biofilms: an experimental study. Hydrobiologia
673: 119-136.
Corcoll, N., Bonet, B., Leira, M., Morin, S., Tlili, A., Guasch, H. The effect of metals
on photosynthesis processes and diatoms metrics of biofilm from a metal contaminated
river: a translocation experiment. (Submitted).
Corcoll, N., Bonet, B., Leira, M., Montuelle, B., Tlili, A., Guasch, H. Light history
influences the response of fluvial biofilms to Zn exposure. (Submitted).


CONTENTS
SUMMARY 13
RESUM 21
CHAPTER I General introduction 29
CHAPTER II Methodology used 51
CHAPTER III Review of the use of PAM fluorometry for monitoring 61
the effect of chemicals on fluvial biofilms
CHAPTER IV Chl-a fluorescence parameters as biomarkers of metal 81
toxicity in fluvial biofilms: an experimental approach
based on the Riou-Mort river case study
CHAPTER V Metal effects on photosynthetic and diatom metrics 117
of metal contaminated fluvial biofilms. A translocation
experiment
CHAPTER VI Light history influences the response of fluvial 151
biofilms to Zn exposure
CHAPTER VII General discussion 177
GENERAL CONCLUSIONS 193
REFERENCES 199


SUMMARY

Summary
13
SUMMARY
Metal pollution is an issue of great concern in fluvial ecosystems affected mainly
by mining and other industrial and urban activities occurring in its watershed, causing a
loss of their integrity. Consequently, governments have developed different regulations
to reduce pollution. In Europe, the implementation of the Water Framework Directive
(WFD, Directive 2000/60/EC) aims to reduce chemical pollution of water bodies by
2015 and thus obtain a good ecological status of aquatic ecosystems (preserving the
structure and function). In this context, phytobenthos (or phototrophic organims of
biofilms) have been defined by the WFD as a "biological quality element (BQE)" to
assess the ecological status of fluvial systems. Biofilms are microphytobenthic
communities made up of a consortium of organisms (algae, cyanobacteria, bacteria
and protozoa among others) which live on submerged surfaces. Biofilms have an
important role in many river ecosystems, being the main primary producers of these
and therefore the base of the food chain. The relevance of the use of biofilms for the
evaluation of chemical toxicity (e.g. metal toxicity) is attributed (1) to the fact that they
offer the possibility to assess chemical toxicity at community level, (2) that they are
sensitive to a wide range of toxic substances (including metals) and (3) to the fact that
the observed effects at the level of biofilm can allow adverse effects on higher trophic
levels to be predicted.
This thesis aims to evaluate the effects of metals on phytobenthic community of
fluvial biofilms, refered in the text as biofilms, and the pertinence of the use of chl-a
fluorescence parameters as biomarkers of metal toxicity. This study includes
experiments with different types of time exposure (from hours to weeks) and with
different scales of complexity (from microcosms to field conditions).
Photosynthetic processes play a key role in aquatic ecosystems. These
processes are highly sensitive to the presence of toxicants, leading to an increase in

Summary
14
their use as ecotoxicological endpoints. Particularly, the use of chlorophyll-a
fluorescence techniques to assess the impact of toxicants on the photosynthesis of the
autotrophic component of fluvial biofilms has increased in the last decades. However,
these photosynthetic endpoints are not currently used in water quality monitoring
programs.
A review of the currently available literature -including studies dealing with
toxicity assessment of metals and herbicides is presented in Chapter III. It allowed the
discussion of the pros and cons of their use as metal pollution ecotoxicological
endpoints in fluvial systems as well as their inclusion in regular monitoring programs.
Chlorophyll-a fluorescence measurements have the ability to respond to a large
panel of chemical substances affecting fluvial biofilms, covering both functional and
structural aspects of the photosynthetic apparatus of oxygenic photoautotrophs
organisms found in the biofilm community. Moreover, they might provide early warning
signals of toxic effects. The most relevant Chl-a fluorescence parameters used are: (1)
the effective quantum yield (Φ’PSII) which allows the assessment of the photosynthetic
efficiency at photosystem II, (2) the optimal quantum yield (ΦPSII) which allows
determining the maximal photosynthetic capacity, (3) the minimal fluorescence (Fo)
which is used as a surrogate of algal biomass and (4) the non-photochemical
quenching (NPQ) used to evaluate the amount of light energy dissipated in non-
photochemical reactions.
Thus, the application of the chlorophyll-a fluorescence measurement is
recommended as a complementary measurement of metal stress in aquatic
ecosystems (Chapter IV). Their application is of special interest in the context of the
Water Framework Directive (WFD, Directive 2000/60/EC), which requires the
development of new structural and functional endpoints of the biological quality
elements (e.g. biofilms).

Summary
15
A study was carried out to evaluate the sensitivity of different chl-a fluorescence
parameters measured in freshwater biofilms as metal pollution biomarkers of short- and
long-term metal exposures at environmentally realistic concentrations (Chapter IV). A
microcosm experiment was performed using indoor channels. Mature biofilms were
exposed from hours to weeks to three different treatments: No-Metal, Zn (400 µg/L);
and Zn plus Cd (400 µg/L and 20 µg/L, respectively). Metal concentration was based
on a real case study: the Riou-Mort River (France) which presents a Zn and Cd metal
pollution of 500-1000 µgZn/L and 12-15 µgCd/L measured in June 2008 Biofilms
exposed to Zn bioaccumulated similar Zn contents per dry weight to those exposed to
the mixture (Zn plus Cd) causing a similar inhibition of the effective quantum yield
(Φ’PSII) during the first hours of exposure. A reduction of the algal biomass, a shift in the
community composition (a high reduction of diatoms), a reduction of the maximal
quantum yield (ΦPSII) and a strong reduction of non-photochemical quenching (NPQ)
were observed from day 14 until the end of the experiment (35 days). The results
indicate that the effects of the metal mixture present in the Riou-Mort on biofilms could
be attributed to Zn toxicity. The use of a set of chl-a fluorescence measurements,
including photochemical and NPQ parameters, are recommended as a reliable
biomarker tool box to evaluate both short- and long-term effects of metals on biofilms
containing oxygenic photoautotrophs, suggesting its use in field applications.
With the aim of evaluating cause-effect relationships between metal pollution and
biofilm structure and function, a translocation study was performed in a metal polluted
stream (la riera d’Osor, NE Spain). Biofilm responses were measured as temporal
changes in chl-a fluorescence parameters, pigment composition and diatom species
composition (Chapter V). Biofilms from a non polluted site were translocated to four
downstream sites presenting a gradient of metal pollution, corresponding to scenarios
of low and moderate metal pollution. Metal effects (Zn bioaccumulation, Fe
bioaccumulation and Zn in water) were distinguished from other stressors (phosphate

Summary
16
concentration in water). Based on the results obtained, a fast bioaccumulation of Zn
(after few hours of exposure) was linked to a decrease of photosynthetic efficiency and
an enhancement of mechanisms of protection through the xanthophylls cycle. After
longer exposure, differences in Zn and Fe bioaccumulation as well as Zn water
concentration between sites were linked to diatom community changes; decrease of
diatoms cell biovolume along with a decrease of the IPS index of diatoms. Based on
our results, we recommend including Zn in the list of priority pollutants substances of
the European Water Framework Directive (2000/60/EC) due to its occurrence and
toxicity. In addition, our study supports the use of chl-a fluorescence parameters jointly
with the analysis of photosynthetic pigmens (physiological markers) as suitable
functional endpoints of early toxicity. Furthermore, diatom composition studies are
recommended for their clear response after chronic exposure. However, new diatom
indices beyond the use of the IPS are required to increase their sensitivity to metal
pollution, e.g. identify the damage caused by moderate to low metal pollution.
Fluvial biofilms are exposed to multi-stress situations in natural ecosystems,
such as the co-occurrence of light stress and metal toxicity. Many studies have
examined these two factors separately, but studies simultaneously addressing both
factors are rare. In Chapter VI, it was evaluated in microcosms the relationship
between short-term light stress and Zn toxicity on the structure and function of fluvial
biofilm communities photoadapted to different light conditions (shade and sun
conditions). Biofilm communities photoadapted to low light (25 µmols photons /m2/s, LL
biofilms), to medium light (100 µmols photons/m2/s, ML biofilms) and to high light (500
µmols photons/m2/s, HL biofilms) were characterized by different attributes: chl-a, total
biomass (AFDW), extracellular polymeric substances (EPS), algal groups, diatom
taxonomy and photosynthesis-irradiances curves. HL biofilms showed a higher light
saturation intensity and a higher production of xanthophylls than LL biofilms. In
Summary
17
contrast, LL biofilm communities had many structural differences, a higher proportion of
diatoms in the community, lower AFDW and EPS contents than ML and HL biofilms.
A clear effect of light stress on Zn toxicity (1500 µgZn/L) was also
demonstrated. Zn toxicity was enhanced when light stress (an increase or decrease of
light intensity in comparison to growth light intensity) also occurred mainly to shade-
adapted communities causing a higher inhibition of both the effective quantum yield
(Φ’PSII) and the maximal quantum yield (ΦPSII). A decoupling of non-photochemical
quenching (NPQ) versus de-epoxidation (DR) processes was also observed, indicating
substantial damage on the photoprotective mechanisms of biofilms (i.e. xanthophylls
cycle of diatoms) due to Zn toxicity.
Fluvial ecosystems are frequently exposed to strong spatial and temporal
variations of light, from 20 µmols photons/m2/s in shaded sites to full sunlight (1700
µmols photons/m2/s) (Guasch and Sabater, 1998).This study highlights the need to
account for environmental stress (e.g. light stress) caused by such variations in order
to better assess the environmental risks of chemicals (e.g. metals)
.


RESUM


Resum
21
RESUM
La contaminació per metalls en els ecosistemes fluvials és un problema
ambiental de gran preocupació. Està lligada principalment a la mineria i a altres
activitats industrials i urbanes que tenen lloc a la conca fluvial, causant una pèrdua de
la seva integritat ecològica. En conseqüència, els governs han desenvolupat diverses
normatives per tal de reduir la contaminació. A Europa, l’aplicació de la Directiva Marc
de l'Aigua (DMA, Directiva 2000/60/CE) té per objectiu reduir la contaminació química
de les masses d'aigua abans de 2015 i així, obtenir un bon estat ecològic dels
ecosistemes aquàtics (conservant l'estructura i la funció). En aquest context, el
fitobentos (o els organismos fototròfics del biofilm) s’han definit per la DMA com uns
“elements de qualitat biològica (EQB)” per a l’avaluació de l’estat ecològic dels
sistemes fluvials. Els biofilms són comunitats microfitobentòniques composades per
diversos organismes (algues, cianobacteris, bacteris i protozous entre altres) que viuen
unides a les superficies submergides. Els biofilms tenen un paper important en molts
ecosistemes fluvials, sent els principals productors primaris d’aquests i per tant la base
de la cadena tròfica.
La pertinència de l’ús dels biofilms per a l'avaluació de la toxicitat química (per
exemple, la toxicitat dels metalls) s’atribueix a que els biofilms ofereixen (1) la
possibilitat d'avaluar la toxicitat química a nivell de comunitat, (2) a que són sensibles
a un ampli grup de substàncies tòxiques (entre elles els metalls) i (3) al fet que els
efectes observats a nivell de biofilm permeten predir efectes adversos en els nivells
tròfics superiors.
Aquesta tesi té com a objectiu avaluar els efectes dels metalls en els
organismos fototròfics dels biofilms fluvials, i la pertinència de la utilització dels
paràmetres de fluorescència de la chl-a com a biomarcadors de la toxicitat dels
metalls. Aquest estudi inclou experiments realitzats amb diferents de temps d'exposició
Resum
22
(des d'hores fins a setmanes) i amb diferents escales de complexitat (des de
condicions experimentals en microcosmos a condicions de camp).
Els processos fotosintètics juguen un paper clau en els ecosistemes aquàtics.
Aquests processos són molt sensibles a la presència de substàncies tòxiques, el que
porta a un augment del seu ús com a paràmetres de valoració ecotoxicològica. L’ús de
les tècniques de fluorescència de la chl-a per avaluar l’impacte de les substàncies
tòxiques en el processos fotosintètics del compartiment autotròfic del biofilm fluvial ha
incrementat en les darreres dècades. No obstant, el seu ús no és aplicat de forma
rutinària en els programes de seguiment de la qualitat de l’aigua.
En el Capítol III s’ha fet una revisió de la literatura actualment disponible sobre
l’ús de la fluorimetria PAM en biofilms fluvials, incloent estudis que tracten tan de
l’avaluació de la toxicitat dels metalls com dels herbicides. Aquesta revisió ha permès
la discussió dels pros i contres del seu ús com a paràmetres ecotoxicològics en
ecosistemes fluvials així com, la seva inclusió en programes de seguiment de la
qualitat de l’aigua.
Els paràmetres de la fluorescència de la chl-a tenen la capacitat de respondre a
un ampli grup de substàncies químiques que afecten el biofilm fluvial, que cobreixen
tan aspectes funcionals com estructurals de l’aparell fototosintétic dels organismes
fotòtrofs oxigènics que es troben en el biofilm. A més, poden proporcionar senyals
d'alerta primerenca dels efectes de les substàncies tòxiques. Els paràmetres més
utilizats de la fluorescencia de la chl-a són: (1) l’eficiència fotosintètica (Φ’PSII) que
permet avaluar l’activitat fotosintètica del PSII, (2) la capacitat fotosintètica (ΦPSII) que
permet determinar la capacitat fotosintètica màxima, (3) la fluoresència basal (Fo) que
és utilitzada com un indicador de biomassa algal i (4) l’esmorteïment no fotoquímic
(NPQ) que s’utilitza per avaluar la quantiat d’energia llumínica dissipada en reaccions
no fotoquímiques.
Resum
23
L’ús dels paràmetres de fluorescència de la chl-a dels biofilms per avaluar la
toxicitat dels metalls en els sistemes fluvials seria d’especial interès en el context de la
Directiva Marc de l’Aigua (DMA, Directiva 2000/60/EC), en la qual es requereix el
desenvolupament de nous paràmetres indicadors de l’estat estructural i funcional dels
elements de qualitat biològics (EQB), com són els organismes fotosintètics del biofilm.
Es va portar a terme un estudi per avaluar la sensibilitat de diferents
paràmetres de la fluorescència de la chl-a mesurats en biofilms fluvials com a
biomarcadors d’exposició de curt i llarg termini a la contaminació per metalls a
concentracions ambientalment realistes (Capítol IV). Es va realitzar un experiment en
microcosmos mitjançant l’ús de canals artificials. Biofilms madurs van ser exposats des
d’hores a setmanes a tres tractaments diferents: No-Metall, Zn (400 µgZn/L) i Zn més
Cd (400 µgZn/L i 20 µgCd/L, respectivament). La concentració de metalls escollida
estava basada en el cas d’estudi: el riu Riou-Mort (França) el qual presenta una
contaminació per Zn i Cd de 500-1000 µgZn/L i 12-15 µgCd/L (Juny 2008). Els biofilms
exposats a Zn van bioacumular un contingut de Zn per pes sec similar als biofilms
exposats a la barreja (Zn+Cd), causant una inhibició semblant de l’eficiència
fotosintètica (Φ’PSII) durant les primeres hores d’exposició. Una reducció de la
biomassa algal, un canvi de la composició de la comunitat (una elevada reducció de
les diatomees), una reducció de la capacitat fotosintètica (ΦPSII) i una forta reducció de
l’esmorteïment no fotoquímic (NPQ) van ser observats des del dia 14 fins al final de
l’experiment (35 dies). Els resultats indiquen que l’efecte de la barreja de metalls del
riu Riou-Mort en els biofilms podria ser atribuït a la toxicitat del Zn. L’ús d’un conjunt de
mesures de fluorescència de la chl-a, inclosos els paràmetres fotoquímics i no
fotoquímics, es recomana com una caixa d'eines de biomarcadors fiables per avaluar
els efectes a curt i llarg termini dels metalls en els biofilms que contenen organismes
fotòtrofs oxigènics: el que suggereix el seu ús en aplicacions de camp.
Resum
24
Amb l'objectiu d'avaluar relacions causa-efecte entre la contaminació per
metalls i l’estructura i la funció dels biofilms, es va dur a terme un estudi de
translocació en una riera contaminada per metalls (la Riera d’Osor, NE, Catalunya).
Les respostes dels biofilms als canvis temporals es van mesurar amb els paràmetres
de fluorescència de la chl-a, la composició de pigmentes i la composició d’espècies de
diatomees (Capítol V). Els biofilms d'un lloc no contaminat van ser traslladats a quatre
llocs aigües avall del riu, els quals presentaven un gradient de contaminació per
metalls: corresponent a escenaris de baixa i moderada contaminació per metalls. Els
efectes dels metalls (la bioaccumulació del Zn, la bioacumulació del Fe i la
concentració de Zn en l'aigua) es van distingir d’altres factors d'estrès (concentració de
fosfat en l'aigua). Segons els resultats obtinguts, una ràpida bioacumulació de Zn
(després de poques hores d'exposició) es va relacionar amb una disminució de
l'eficiència fotosintètica del biofilm i un increment dels mecanismes de protecció
d’estrès a través del cicle de les xantofil·les. Després d’una exposició més prolongada,
les diferències en la bioaccumulació del Zn i del Fe, així com en la concentració de Zn
en l’aigua entre els llocs de translocació es van vincular a canvis en la riquesa
d’espècies de diatomees, a una disminució del biovolum de diatomees i amb una
disminució de l'índex IPS (índex de sensibilitat de la contaminació basat en la
comunitat de diatomees). D'acord amb els nostres resultats, es recomana incloure el
Zn en la llista de substàncies contaminants prioritàries de la Directiva Marc de l'Aigua
(2000/60/CE), per la seva presència i toxicitat. A més, el nostre estudi recolza l'ús dels
paràmetres de fluorescència de la chl-a en forma conjunta amb l'anàlisi de pigments
fotosintètics (indicadors fisiològics) dels biofilms com a eines adequades de valoració
funcional de toxicitat primerenca. En canvi, els estudis de la composició de diatomees
es recomanen per la seva resposta clara després de l'exposició crònica. No obstant
això, nous índexs de diatomees, més enllà de l'ús de l’IPS, són necessaris per

Resum
25
augmentar la seva sensibilitat a la contaminació per metalls, per exemple, identificar
els danys causats per escenaris de contaminació moderada i baixa per metalls.
Els biofilms fluvials estan exposats a múltiples situacions d'estrès en els
ecosistemes naturals com és per exemple la co-ocurrència d’un estrès llum i
l’exposició a metalls. Molts estudis han examinat com un d'aquests factors afecten els
biofilms, però estudis que abordin ambdós factors al mateix temps són més rars. En el
Capítol VI, es va realizar un estudi per tal d’avaluar en condicions experimentals
(microcosmos) i a curt termini (hores), la relació entre l'estrès llum i la toxicitat del Zn
en l’estructura i la funció en comunitats de biofilm fluvial fotoadaptades a diferents
condicions de llum (condicions d’ombra i de llum). Les comunitats del biofilm
fotoadaptades a poca llum (25 µmols fotons/m2/s, LL biofilms), a mitjana llum (100
µmols fotons/m2/s, ML biofilms) i a alta llum (500 µmols fotons/m2/s, HL biofilms) es
van caracteritzar mitjançant diferents atributs: la chl-a, la biomassa total (AFDW),
substàncies polisacàrides extracel·lulars (EPS), els grups algals, la taxonomia de
diatomees i les corbes d’irràdiancia-fotosíntesis. Els HL biofilms van mostrar una major
intensitat de llum de saturació i una major producció de xantofil·les que els LL biofilms.
Per contra, les comunitats de LL biofilms presentàven varies diferències estructurals;
una major proporció de diatomees en la comunitat, menor contingut de AFDW i EPS
que els ML and HL biofilms.
Es va demostrar un clar efecte de l’estrès de llum sobre la toxicitat del Zn (1500
µgZn/L). La toxicitat del Zn en el biofilms va ser major en condicions d’estrès de llum
(un increment of disminució de la intensitat de llum en comparació a la intensitat de
llum de creixement), i els efectes més grans es van veure en les comunitats
fotoadaptades a l’ombra (LL biofilms) causant una major inhibició de l’eficiència
fotosintètica (Φ'PSII) i de la capacitat fotosintètica (ΦPSII). També es va observar un
desacoblament dels processos d’esmorteïment no fotoquímic (NPQ) versus la reacció
Resum
26
de de-epoxidació (DR), la qual cosa indica un dany substancial als mecanismes de
fotoprotecció dels biofilms (en particular el cicle de xantofil.les de les diatomees) degut
a la toxicitat del Zn.
Els ecosistemes fluvials estan sovint exposats a fortes variacions de la intensiat
de llum des de 20 µmols photons/m2/s en llocs d’ombra a 1700 µmols photons/m2/s en
llocs de plena llum del sol (Guasch and Sabater, 1998). Aquest estudi posa de
manifest que cal tenir en compte l’estrès ambiental (per exemple, l’estrès de llum) per
tal d'avaluar millor els riscos ambientals de les entrades de substàncies tòxiques (per
exemple, els metalls) en el ecosistemes fluvials.
CHAPTER I
GENERAL INTRODUCTION


General Introduction
29
FLUVIAL ECOSYSTEMS AND THE OCCURRENCE OF METALS
In fluvial ecosystems there is a close relationship between water quality and
landscape uses in the watershed. The anthropogenic activities occurring in their
catchment will be relevant factors for understanding fluvial pollution. In the case of
metals, their inputs to the fluvial ecosystems can take place mainly through two ways:
point-sources, such as punctual spills or wastewater effluent discharges from urban or
industrial activities, and diffuse-inputs from catchment drainage or mine run-off after
rainfall events, among others. Consequently, metal inputs in fluvial ecosystems may
produce adverse effects on biota and contribute to ecosystem integrity deterioration
(Admiraal et al., 1999; Hill et al., 2000; Morin et al., 2008). Specifically, metal toxicity in
aquatic organisms is influenced by metal speciation that may alter bioavailability,
toxicity (Tessier et al., 1995; Morel and Hering 1993) and metal accumulation (Meylan
et al., 2004).
In agreement with the well-recognized environmental risk of pollution, regulatory
documents have been developed by management entities. For instance, in Europe the
Water Framework Directive (Directive 2000/60/EC) aims to reduce chemical pollution in
water bodies by 2015. This directive highlights the importance of evaluating the effects
of priority pollutants (composed mainly by metals and organic substances with known
mode of action) and emerging contaminants (compounds that are not currently covered
by existing water-quality regulations and are thought to be potential threats to
environmental ecosystems) on biota.
Metals in river ecosystems may be detected in different compartments: in the
water body (e.g. metal concentration in surface water), in the sediment (e.g. metal
accumulation in sediments) or accumulated in the biota (e.g. metal accumulation in
biofilms). A list of different metallic elements are set out as priority pollutants in the EU
according to the Water Framework Directive (WFD, Directive 2000/60/EC) and in the
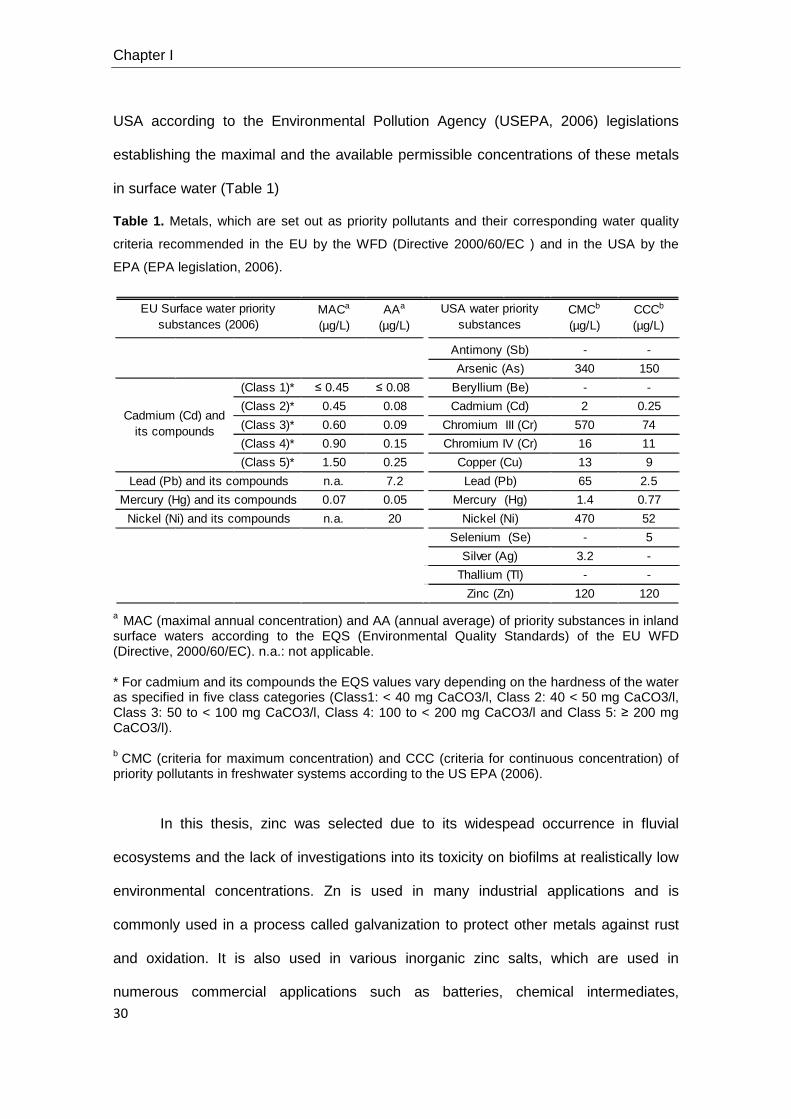
Chapter I
30
USA according to the Environmental Pollution Agency (USEPA, 2006) legislations
establishing the maximal and the available permissible concentrations of these metals
in surface water (Table 1)
Table 1. Metals, which are set out as priority pollutants and their corresponding water quality
criteria recommended in the EU by the WFD (Directive 2000/60/EC ) and in the USA by the
EPA (EPA legislation, 2006).
a MAC (maximal annual concentration) and AA (annual average) of priority substances in inland surface waters according to the EQS (Environmental Quality Standards) of the EU WFD (Directive, 2000/60/EC). n.a.: not applicable. * For cadmium and its compounds the EQS values vary depending on the hardness of the water as specified in five class categories (Class1: < 40 mg CaCO3/l, Class 2: 40 < 50 mg CaCO3/l, Class 3: 50 to < 100 mg CaCO3/l, Class 4: 100 to < 200 mg CaCO3/l and Class 5: ≥ 200 mg CaCO3/l). b CMC (criteria for maximum concentration) and CCC (criteria for continuous concentration) of priority pollutants in freshwater systems according to the US EPA (2006).
In this thesis, zinc was selected due to its widespead occurrence in fluvial
ecosystems and the lack of investigations into its toxicity on biofilms at realistically low
environmental concentrations. Zn is used in many industrial applications and is
commonly used in a process called galvanization to protect other metals against rust
and oxidation. It is also used in various inorganic zinc salts, which are used in
numerous commercial applications such as batteries, chemical intermediates,
- -
340 150
(Class 1)* ≤ 0.45 ≤ 0.08 - -
(Class 2)* 0.45 0.08 2 0.25
(Class 3)* 0.60 0.09 570 74
(Class 4)* 0.90 0.15 16 11
(Class 5)* 1.50 0.25 13 9
n.a. 7.2 65 2.5
0.07 0.05 1.4 0.77
n.a. 20 470 52
- 5
3.2 -
- -
120 120
Antimony (Sb)
Arsenic (As)
Beryllium (Be)
Cadmium (Cd)
Chromium III (Cr)Cadmium (Cd) and
its compounds
Silver (Ag)
Thallium (Tl)
Zinc (Zn)
Lead (Pb) and its compounds
Mercury (Hg) and its compounds
Nickel (Ni) and its compounds
Chromium IV (Cr)
Copper (Cu)
Lead (Pb)
Mercury (Hg)
Nickel (Ni)
Selenium (Se)
MACa
(µg/L)AAa
(µg/L)CMCb
(µg/L)CCCb
(µg/L)EU Surface water priority
substances (2006)USA water priority
substances

General Introduction
31
catalysts, pigments, vulcanization activators and accelerators in the rubber industry,
UV stabilizers, and supplements in animal feeds and fertilizers. The anthropogenic
sources of zinc in ecosystems are mining, steel production, combustion of coal and
waste (ATSDR, 2005). In nature it is not found in its elemental form and is mostly
present as zinc sulphides (ZnS) and smithsonite (ZnCO3). It reacts relatively easily with
weak acids and is of special concern in aquatic ecosystems, as it is more soluble than
the majority of other metals (ATSDR 2005).
The Zn concentrations found in the study-cases of this thesis ranged between
400 and 900 µgZn/L in the Riou-Mort river (in France) and between 10 and 450 µgZn/L
in the Riera d’Osor river (in Spain). In both cases metal pollution was linked to mining
activities.
Cadmium was also investigated due to its common co-occurrence with Zn
(Morin et al. 2007; Santos et al., 2010). Cd enters into the environment through mining,
combustion of fossil fuels, incineration of household and industrial waste, and the
disposal of metal containing waste and fertilizers. In water ecosystems Cd forms
complexes with organics and is removed from the dissolved phase by sorption onto
organics, clay minerals and hydrous Fe and Mn oxides (Burton and Pitt, 2002).
The Cd concentrations found in the case study of Riou-Mort river (France)
ranged between 12 and 15 µgCd/L and its origin was linked to mining activities. In the
Riera d’Osor river (Spain), no Cd pollution was detected.
BIOFILMS, A PERTINENT COMMUNITY ECOTOXICOLOGY APPROACH
Fluvial biofilms are benthic complex biological structures composed mainly by
algae, cyanobacteria, bacteria, fungi and microfauna, located in close physical contact
and embedded in a mucopolysacharide matrix that lives on stones and rocks (Lock et
al., 1984) (Fig.1). In rivers and streams, biofilm has an important role in primary
production (Guasch and Sabater, 1998) and in organic matter processing (Romaní and
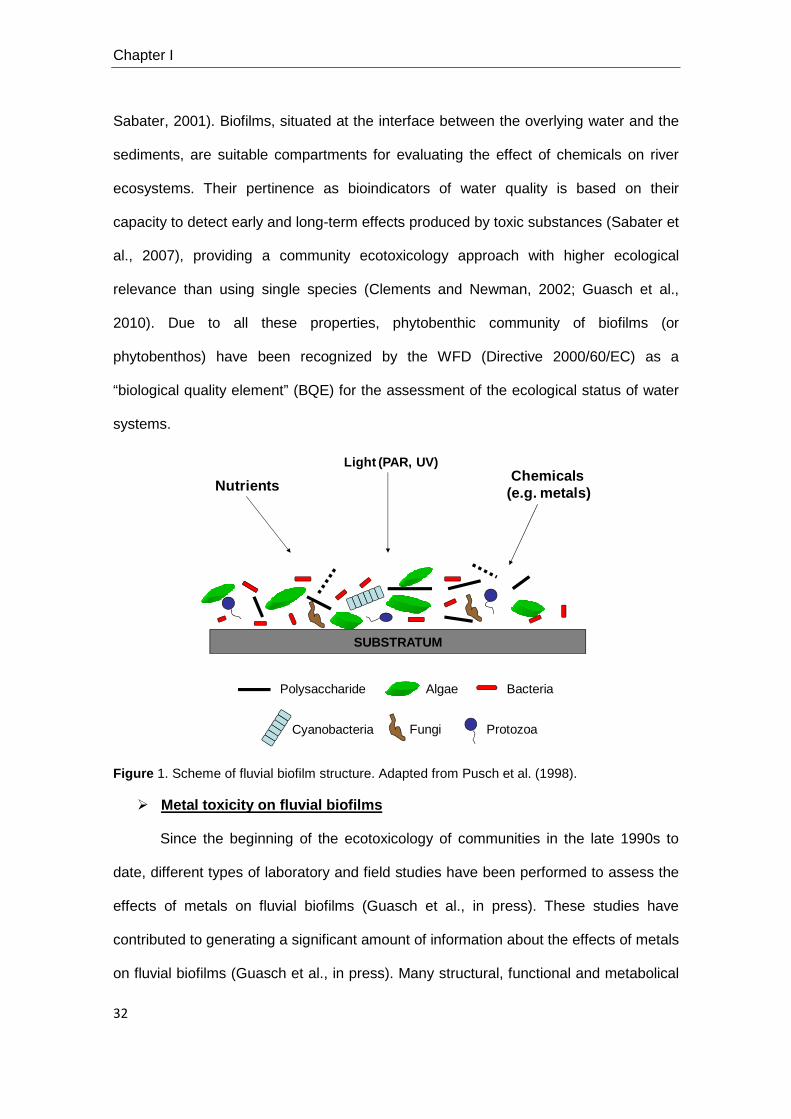
Chapter I
32
Sabater, 2001). Biofilms, situated at the interface between the overlying water and the
sediments, are suitable compartments for evaluating the effect of chemicals on river
ecosystems. Their pertinence as bioindicators of water quality is based on their
capacity to detect early and long-term effects produced by toxic substances (Sabater et
al., 2007), providing a community ecotoxicology approach with higher ecological
relevance than using single species (Clements and Newman, 2002; Guasch et al.,
2010). Due to all these properties, phytobenthic community of biofilms (or
phytobenthos) have been recognized by the WFD (Directive 2000/60/EC) as a
“biological quality element” (BQE) for the assessment of the ecological status of water
systems.
Figure 1. Scheme of fluvial biofilm structure. Adapted from Pusch et al. (1998).
Metal toxicity on fluvial biofilms
Since the beginning of the ecotoxicology of communities in the late 1990s to
date, different types of laboratory and field studies have been performed to assess the
effects of metals on fluvial biofilms (Guasch et al., in press). These studies have
contributed to generating a significant amount of information about the effects of metals
on fluvial biofilms (Guasch et al., in press). Many structural, functional and metabolical
SUBSTRATUM
Chemicals (e.g. metals)
Light (PAR, UV)
Polysaccharide BacteriaAlgae
Fungi Protozoa
Nutrients
Cyanobacteria
General Introduction
33
biofilm metrics have been applied to assess metal effects on biofilms. In general terms
it has been reported that metals affect algal biomass (Paulsson et al., 2002; Navarro et
al., 2002), the species composition and the structure of biofilm communities (Guasch et
al., 2002). However, the co-occurrence of other environmental factors in field studies
such as high nutrients and organic matter may mask metal effects on biofilms
(Admiraal et al., 1999; Morin et al., 2007; Duong et al., 2008). Changes in diatom
composition has widely been used to assess metal toxicity on biofilms in moderate and
high-metal polluted mining areas contaminated by Cu, Zn, Fe, Cd, Pb and As (Hill et
al., 2000; Holding et al., 2003; Sabater et al., 2000; Morin et al., 2007; Duong et al.,
2008). Physiological biofilm parameters such as photosynthetic activities measured as
chl-a fluorescence parameters, among others, have been applied to check
photosynthesis-related effects of metals after a few hours (Barranguet et al., 2000;
Serra et al., 2009) or several weeks of exposure (Barranguet et al., 2003), as well as in
studies aiming to obtain the effective concentration of a compound that had the 50% of
effect (EC50) and/or assess pollution-induced community tolerance (PICT) (Guasch et
al., 2003, Tlili et al., 2010). Within metal detoxification mechanisms, the production of
extracellular polysaccharide substances (EPS) has been reported as an extracellular
mechanism of metal protection by reducing metal penetration into cells (Admiraal et al.,
1999; García-Meza et al., 2005). At intracellular level, the synthesis of phytochelatins to
bind metals has been observed in biofilms exposed to metals, such as Cd (Le
Faucheur et al., 2005). More recently, it has been demonstrated that biofilms also use
different intracellular antioxidant enzymatic activities to cope with metal toxicity
(Guasch et al., 2010a; Bonet et al., submitted).
In this thesis, the ecotoxicology of Zn, as well as its specific co-occurrence with
Cd has been studied in fluvial biofilms. Zn is a trace element for photosynthetic
organisms and therefore essential for life in low concentrations (0.78 to 65 ng/L) (Lane
and Morel, 2000; Sunda and Huntsman, 2005). It is a coafactor of several enzymes
Chapter I
34
and a component of organic molecules such as carbonic anhydrase (Lane and Morel,
2000). Nevertheless, Zn toxicity is reported at very different concentrations depending
on the species tested and the endpoint assessed: Chaloub et al. (2005) found Zn
toxicity on cyanbacteria cultures between 30-332 mg/L and Posthuma et al. (2001)
describes an EC50 of 15 µg/L in Selenastrum capricornutum algae. There is no
regulation for the maximal concentration of Zn permissible in surface waters in the EU
and, in the USA permissible maximal annual concentration in surface water is
significantly higher for Zn than for most other metals (Table 1). The mode of action of
Zn on algae is believed to be at the photosystem II (PSII) (Chaloub et al., 2005), like
the majority of metals.
Cd and its compounds are not essential for photosynthetic organisms and are
toxic to most species. They are classified as priority hazardous substances in the WFD
(Directive 2000/60/EC). Water hardness also affects the toxicity of Cd (Table 1). In
algae, PSII is believed to be the most sensitive target to Cd (Singh et al., 1993).
Studies performed with Selenastrum acutus (Tupin) Kützing (Ilangovan et al. 1998)
have shown Cd toxicity at high Cd concentration (EC50= 500 µg/L). Zhou et al. (2006),
observed Cd toxicity on cyanobacteria cultures of Microcystis aeruginosa at 448
µgCd/L.
Accordingly, in this thesis metal toxicity on fluvial biofilms has been assessed
using several biofilm metrics focusing on chl-a fluorescence parameters as potential
metal biomarkers, targeting mainly the autotrophic compartment of biofilms. To address
this challenge, a multi-scale approach was followed, including different temporal and
spatial scales.
Biofilm metrics
Using a set of biofilm endpoints covering functional processes and structural
changes, allows different degrees of effects/damage produced by metals on biofilms to
General Introduction
35
be evaluated. Biomarkers have been described as biochemical, physiological, or
histological indicators of either exposure to or effects of xenobiotic chemicals (Huggertt
et al. 2002). A broader application of the biomarker concept, defined as any
quantitative measure of changes in the biological system that can be related to the
exposure / toxic effects of environmental chemicals, has also been suggested and will
be used in the this thesis. In biofilm communities, structural endpoints as total biomass,
species abundances and biodiverstity will reflect more persistent and probably
irreversible effects and metabolical or functional endpoints will inform about transitory
effects on metabolism or community functioning (Geizinger et al. 2009).
The set of biofilm endpoints used in the thesis are: metal accumulation, biofilm
structure and diatom composition, photosynthetic pigments and chl-a fluorescence
parameters.
Metal accumulation in biofilms was used as an indicator of metal
exposure and potential toxicity, as weight of metal per biofilm dry weight (DW). Metal
toxicity occurs once the toxic compound has entered into the cell (Escher and
Hermens, 2002). The importance of biofilms in retaining metals from the water column
has been extensively described (Newman and McIntosh, 1989; Farag et al., 1998;
Behra et al., 2002; Meylan et al., 2003). Although biofilms could accumulate metals
following abiotic factors (e.g. metal precipitation or sediment deposition), they can also
follow different biotic mechanisms; absorption in extracellular polymeric substances,
adsorption in cell surface or intracellular uptake of algae (Holding et al., 2003). Biotic
accumulation often depends on time of exposure, species and kind of metal (Zbigniew
et al., 2006). For biofilms, a high capacity to accumulate Zn, in comparison to other
metals (Cu and Pb) has been reported (Ancion et al. 2010). To predict the toxicological
effects of trace metals, several models have been developed that relate chemical
speciation and bioavailability (e.g. free-ion activity model (FIAM); Morel and Hering
(1983), biotic ligand model (BLM); Di Toro et al., 2001). However, these models may

Chapter I
36
fail in cases where intrinsic biological regulation is present (Hassler and Wilkinson,
2003). However, in this thesis these models were not applied. Aquatic organisms will
accumulate less metal during a short exposure, causing a transient metabolic and
physiological response than after a longer metal exposure, causing increases in toxicity
and/or the development of mechanisms to regulate the accumulation of metals
(Hassler and Wilkinson, 2003; Hassler et al., 2005). Thus, in this thesis, metal
accumulation has been used as an indicator of metal exposure and potential indicator
of metal toxicity on biofilms.
Metal accumulation and toxicity in biofilm may be influenced by different biotic
and abiotic processes not addressed in this thesis. It is well reported that the pH has an
influence on metal accumulation and toxicity (Sunda and Hunstsman, 1998). The
presence of ligands in the media can also interact with metals, whether they are of
mineral origin, such as chlorine and orthophosphates (Guasch et al., 2004; Rauch et
al., 2004), or organics like fulvic acids (Ma et al., 2003). The structure of biofilms may
also influence the bioavailabily of metals, and, therefore, their toxicity (Barranguet et
al., 2000; Bradac et al., 2009).
Biofilm structure and diatom species composition. Biofilm communities are
characterized by a three-dimensional complex organization within a few millimetres
thickness (cells are embedded in a polysaccharide matrix). This structure is susceptible
to metal toxicity. To quantify algal biomass and total biomass the chl-a concentration
and the ash-free dry weight (AFDW) respectively have commonly been measured.
Both measurements may be used as indicators of metal toxicity (Navarro et al., 2002;
Serra et al., 2009).
The quantity of extra polysaccharides (EPS) in which the algae are encased is
influenced by the species composition, among other factors, and may play an important
role in the biofilm structure and protection against metal toxicity (Admiraal et al., 1999;

General Introduction
37
Serra et al., 2009). Lower metal toxicity has been reported in biofilms presenting higher
EPS content. Chronic metal exposure may cause an increase in the metal-binding sites
of the biofilm linked to the enhancement of EPS production (García-Meza et al., 2005)
as a detoxification mechanism.
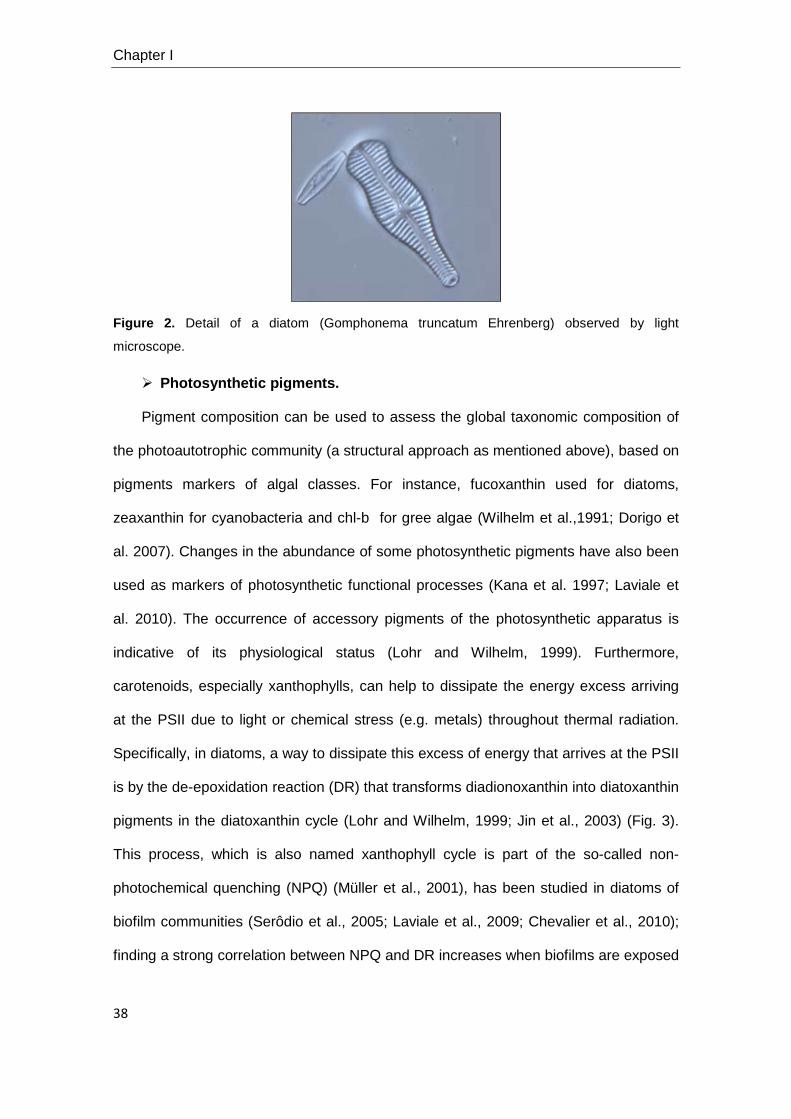
Biofilm structure is also influenced by the algal assemblage composition
presenting different sensitivity to metal exposure. Fluvial biofilms exposed during a long
period of time to metals are characterized by presenting metal-resistant species.
Tolerance of cyanobacteria and green algae to long-term exposures of Zn (Genter,
1987; Ivorra et al., 2000; Corcoll et al., 2011) and Zn mixtures (Takamura et al., 1989;
Corcoll et al., 2011) has been reported in contrast to diatoms, which are more sensitive
to long-term metal pollution (Guasch et al., 2002, Morin et al., 2008; Corcoll et al.,
2011). Consequently, diatoms are widely used as biological indicators of water quality
and a number of methods for monitoring European rivers based on diatoms have been
already proposed (Kelly et al., 1998; Prygiel et al., 2002). They usually account for the
highest number of species among the primary producers in aquatic systems (Pan et al.,
1999) and often represent the major autotrophic proportion of biofilms (Navarro et al.,
2002; McClellan et al., 2008; Morin et al. 2010). Several diatom metrics have been
widely applied in ecotoxicology to assess metal pollution; not only at community level
through shifts in dominant taxa and diversity patterns but also at an individual level with
the appearance of teratological forms or size decrease (Gold et al., 2003; Morin et al.,
2007; Falasco et al., 2009; Ferreira da Silva et al., 2009).
Chapter I
38
Figure 2. Detail of a diatom (Gomphonema truncatum Ehrenberg) observed by light
microscope.
Photosynthetic pigments.
Pigment composition can be used to assess the global taxonomic composition of
the photoautotrophic community (a structural approach as mentioned above), based on
pigments markers of algal classes. For instance, fucoxanthin used for diatoms,
zeaxanthin for cyanobacteria and chl-b for gree algae (Wilhelm et al.,1991; Dorigo et
al. 2007). Changes in the abundance of some photosynthetic pigments have also been
used as markers of photosynthetic functional processes (Kana et al. 1997; Laviale et
al. 2010). The occurrence of accessory pigments of the photosynthetic apparatus is
indicative of its physiological status (Lohr and Wilhelm, 1999). Furthermore,
carotenoids, especially xanthophylls, can help to dissipate the energy excess arriving
at the PSII due to light or chemical stress (e.g. metals) throughout thermal radiation.
Specifically, in diatoms, a way to dissipate this excess of energy that arrives at the PSII
is by the de-epoxidation reaction (DR) that transforms diadionoxanthin into diatoxanthin
pigments in the diatoxanthin cycle (Lohr and Wilhelm, 1999; Jin et al., 2003) (Fig. 3).
This process, which is also named xanthophyll cycle is part of the so-called non-
photochemical quenching (NPQ) (Müller et al., 2001), has been studied in diatoms of
biofilm communities (Serôdio et al., 2005; Laviale et al., 2009; Chevalier et al., 2010);
finding a strong correlation between NPQ and DR increases when biofilms are exposed

General Introduction
39
to increasing light irradiances. Moreover, a reduction of DR when the biofilm was
exposed to isoproturon has also been observed (Laviale et al., 2010).
Figure 3 . The xanthophyll cycle. In diatoms, the epoxidated xanthophylls (diadinoxanthin) is
enzymatically de-epoxidated and converted to diatoxanthin in the light. The backreaction is
enzymaticaly catalyzed in the dark. Diatoxanthin appears to be a quencher of excitation.
Modified from Falkowsky and Raven (2007).
Chl-a fluorescence parameters allow quantify the fluorescence emissions
from Chl of photsystem II after excitation by light conditions. As fluvial biofilms are
made up by a great variety of phototrophic organisms (aglae and cyanobacteria), the
chl-a fluorescence parameters are presented as fast descriptors of photosynthetic
processes (photochemical and non-photochemical) of algae and cyanobacteria
composing biofilms, being sensitive to chemical compounds targeting photosynthesis,
either directly (e.g. herbicides) or indirectly (e.g. metals). So, despite chl-a fluorescence
parameters are not specific to metal toxicity, they are very sensitive to metal effects
(Ralph et al., 2007). Chl-a fluorescence parameters are obtained after in vivo chl-a
The Diatoxanthin Cycle
Diadionoxanthin
Diatoxanthin
DarkLight

Chapter I
40
fluorescence measurements by pulse amplitude modulated (PAM) fluorometers. It is
based on the principle that light energy absorbed by PSII pigments of algae can either
drive the photochemical energy conversion at PSII reaction centres (which allow
photosynthesis activity), be dissipated into heat (non-photochemical energy) or be
emitted in the form of chl-a fluorescence (Fig.4). As these three pathways of energy
conversion are complementary, the fluorescence yield may serve as a convenient
indicator of time- and state-dependent changes in the relative rates of photosynthesis
and heat dissipation (Maxwell and Johnson, 2000).
Figure 4. Possible fates of excited Chl. When Chl absorbs light it is excited from its ground state
to its singlet excited stat, 1Chl*. From there it has several ways to relax back to the ground state.
It can relax by emitting light, as seen as fluorescence (1). Its excitation can be used to fuel
photosynthetic reactions (2), or it can de-excite by dissipating heat (3); both of these
mechanisms reduce the amount of fluorescence. They are therefore referred to as
photochemical quenching and non-photochemical quenching of Chl fluorescence. Last, 1Chl*
can, by intersystem crossing, produce 3Chl* (4), which in turn is able to produce 102*, a very
reactive oxygen species. Modified from Müller et al. (2001)
photochemistry (photochemical quenching)
fluroescence
heat (non-photochemical quenching)
General Introduction
41
Several related chl-a fluorescence parameters have been applied in this thesis.
The minimal fluorescence yield (Fo) reflects the chl-a fluorescence emission
of all open reaction centres in an non-excited status. Fo can be used as a surrogate of
algal biomass since chlorophyll fluorescence is proportional to total chlorophyll content
(Serôdio et al., 1997; Rysgaard et al., 2001), but it has been shown that this method
has its limitations at high biomasses (Guasch et al., 2003; Schmitt-Jansen and
Altenburger, 2008). It is expected that Fo will decrease if the toxicants cause a
reduction in the number of cells due to cell death (structural damage) or the chlorophyll
content of a sample.
The maximal or optimal quantum yield ( ФPSII) is a photochemical quenching
parameter that reflects the quantum yield of PSII electron transport in a dark-adapted
state. It has been shown in many studies that ФPSII can also be a measure of the
quantum yield of photosynthesis (Schreiber et al., 1994; Genty et al., 1989). It is an
estimate of the potential maximal photosynthetic activity and it is expected to be
effected if a chemical produces alterations in the structure of the photosynthetic
apparatus (i.e. shade-adapted chloroplasts). In general, this situation occurs when
biofilms are exposed to chemicals at high concentrations or during long-term exposure
(García-Meza et al., 2005; Schmitt-Jansen and Altenburger, 2005a). Photochemical
quenching (qP) , represents the proportion of excitation energy “trapped” by opens
PSII reaction centers used for electron transport (Horton et al., 1999). It has been
applied in algal cultures to monitor the energy used by the electron transport chain
which leads to carbon fixation. It presents a similar significance with ФPSII. An inhibition
of qP has been observed in algal cultures exposed to Cu (Juneau et al., 2002) and Hg
(Juneau and Popovic, 1999).
The effective or operation quantum yield ( Ф’PSII) is also a photochemical
quenching parameter that reflects the efficiency of excitation energy capture by the

Chapter I
42
open PSII reaction centres under light conditions (Schreiber et al., 1986; Genty et al.,
1989). A reduction of the Ф’PSII after toxic exposure indicates that the toxicant is
reducing the electron flow in the PSII (Barranguet et al., 2000, 2003; Serra et al.,
2009). This parameter is very sensitive to PSII-inhibiting compounds if they block the
electron transport flow.
The non-photochemical quenching (qN) reflects the amount of light energy
dissipation inducing fluorescence quenching that a non-radiative energy process
involves (Horton et al., 1999). Algal cultures exposed for 5h to Cu showed an increase
in qN (Juneau et al., 2002). Similar results were observed when algal cultures were
exposed to Hg (Juneau and Popovic, 1999). Another way to evaluate the excess of
light energy arriving to PSII and dissipated in non-radiative processes is non-
photochemical quenching (NPQ). It is a simplified non-photochemical quenching
value, which assumes that NPQ is caused only by one quenching factor (Buschmann,
1999), omitting the many energy-consuming processes, not directly involved in the PSII
activity (Pospísil, 1997). Non-photochemical quenching parameters have been used
less on biofilms than photochemical quenching parameters. An inhibition of the NPQ
could be linked to damage in the pigments where the NPQ occurs and has been
observed in biofilms exposed to toxic organic compounds (Laviale et al., 2010; Ricart et
al., 2010b).
Measurements of chl-a fluorescence can also be applied to quantify the relative
contribution from the different algal components of the whole biofilm community. This
can be carried out by using a multi-wavelength PAM fluorometer (e.g. PhytoPAM
flurometer, Walz, Germany). This instrument addresses this challenge by
simultaneously using light at different wavelengths for excitation of the algal class-
specific light harvesting complexes based on the internal ‘reference excitation spectra’
of a pure culture (Schreiber et al., 2002). So, the biofilm strucuture (in terms of algal

General Introduction
43
groups composition) using chl-a fluorescence parameters could also be addressed
(see more details about biofilm structure in the previous section). In biofilms exposed
chronically to Cu, Serra et al. (2009) an increase of the fluorescence linked to
cyanobacteria was observed. In Boninneau et al. (2010), the toxicity of β-blockers to
biofilm communities was assessed by analyzing the sensitivity of the different
phototrophic groups through their specific photosynthetic efficiencies.
A multi-scale approach
With the aim of evaluating cause-effect relationships between metal(s)
exposure, confounding factors (i.e. nutrients, light …) and biological responses; in this
thesis, metal toxicity on fluvial biofilms was addressed using experimental approaches
performed at different temporal and spatial scales (Fig.3).
This thesis pesents several experiments addressing the role of time in toxic
exposure by performing experiments at different temporal scales (Chapter IV and V). In
this way it has been possible to evaluate functional alterations occurring after a few
hours of exposure, as well as the structural changes caused after several days or
weeks of exposure.
Experiments were performed at different spatial scales. Experimental testing in
indoor artificial channels (Fig. 4) allowed us to identify the effects caused by specific
stress factors (Chapter IV and VI), either alone or in combination, while field
experiments (Chapters IV and V) were used to describe metal exposure effects under
real multi-stress situations.

Chapter I
44
Figure 3 . Graph illustrating the steps conducted in this thesis to derive causality (metal toxicity
and biofilm responses). Hypothesis formulated on the basis of field observations should be
experimentally tested for confirmation.
Figure 4. Artificial channels used to evaluate the toxicity of metals on biofilms in microcosm
conditions.
FIELD OBSERVATIONS
EXPERIMENTAL TESTING
Zn+Cd pollution +
Multi-stress situation
CAUSALITY
Zn and Zn+Cd
exposures
Photo-adapation+
Zn + Light exposures
Zn exposure +
Multi-stress situation
(Riou-Mort river) (Riera d’Osor stream) (Microcosm conditions)
Multi-scale approach

General Introduction
45
OBJECTIVES OF THIS STUDY
The present thesis aims to investigate the potential use of chl-a fluorescence
techniques on biofilms for the assessment of metal toxicity in fluvial ecosystems and to
find cause-effect relationships between metal(s) exposure, other environmental factors
(i.e. light) and biological responses.
This main objective was approached by the following specific objectives:
• To evaluate the sensitivity of different chl-a fluorescence parameters as metal
pollution biomarkers of short- and long-term metal exposures under realistic Zn
exposure concentrations applied either alone or in combination with Cd.
• To explore the convenience of using a set of biofilm metrics, including chl-a
fluorescence parameters, for the assessment of metal effects under a real field
exposure situation in fluvial systems.
• To explore the response of biofilms to a multiple-stress situation, i.e.
environmental stress caused by light and Zn toxicity. And, also, to assess if
adaptation to one of these stress factors (i.e. light) modifies the response.
HYPOTHESIS OF THIS STUDY
Based on the current knowledge of metal ecotoxicology in fluvial biofilms and
chl-a fluorescence methods development, the following hypotheses have been
formulated:
• The use of several chl-a fluorescence parameters measured in biofilms will
allow the evaluation of the effects of metal pollution (Zn alone or Zn in
combination with Cd) at realistic concentrations. Short-term exposure will mainly
cause functional alterations, whereas structural changes will appear after long-
term exposure. Shifts in algal composition will also occur due to selection

Chapter I
46
pressure according to differences in the metal tolerances or sensitivities of
species (addressed in chapter IV).
• The use of chl-a fluorescence parameters will provide a pertinent set of biofilm
metrics for the assessment of cause-effect relationships between Zn pollution
and biological damage in fluvial systems (addressed in chapter V).
• Zn toxicity on photosynthesis of fluvial biofilms will be influenced by light
conditions prevailing during biofilm growth before exposure as well as sudden
changes in the light regime during Zn exposure (addressed in chapter VI).
PROJECT DEVELOPMENT
This manuscript thesis includes an introductory chapter, a methodological
chapter, a review literature of investigations dealing about the application of chl-a
fluorescence parameters on biofilms for metal toxicity assessment, experimental
researches on field and microcosms conditions and a general discussion chapter.
In the introductory chapter it is presented the environmental problematic of
metal pollution in rivers, focused on Zn and Cd pollution, the pertinence of use several
biofilm metrics to assess chemical pollution and some concepts about cause-effect
relationship. The objectives and hyphothesis of this study are also presented.
The methodological chapter describes the methods applied in this thesis for
water and biological analysis.
Then a bibliographical chapter is presented, it reviews the most relevant
literature about studies using chl-a fluorescence parameters to assess chemical
pollution on fluvial biofilms. A publication was derived from this work;

General Introduction
47
- Corcoll, N., Ricart, M., Franz, S., Sans-Piché, F., Schmitt-Jansen, M., Guasch, H. The
use of photosynthetic fluorescence parameters from autotrophic biofilms for monitoring
the effect of chemicals in river ecosystems, In Guasch, H., Ginebreda, A. & Geizinger,
A. [Eds].The Handbook of Environmental Chemistry. Spriner, (in press).
Based on experimental research, a field survey in a highly metal polluted area,
Riou-Mort river (in France), was performed to assess metal toxicity on biofilms. The
main remark of this field study was that metal pollution was linked to Zn and Cd
pollution and caused a decrease of algal biomass. Then, a microcosms experiment
was performed in controlled conditions to investigate the contribution of Zn, the metal
found a higher concentration in the Riou-Mort river, on the the effects produced by Zn
plus Cd. Also the role of time exposure, short vs. long-term exposures was addressed.
The obtained experimental results showed that metal toxicity was attributed to Zn
pollution. A publication was derived from the microcosm experiment:
-Corcoll, N., Bonet, B., Leira, M., Guasch, H. 2011. Chl-a fluorescence parameters as
biomarkers of metal toxicity in fluvial biofilms: an experimental study. Hydrobiologia
673: 119-136.
In another field study, in the Riera d’Osor stream (Calalunya, Spain), the
convenience of using a set of biofilm endpoints, including chl-a fluorescence
parameters, pigments composition and diatom metrics, as indicators of Zn pollution
was evaluated in a biofilms translocation experiment. Functional biomarkers responded
to short-term metal exposures (hours) meanwhile, structural ones were more sensitive
to long-term (weeks) metal pollution. A scientific article will be published derived to this
work:

Chapter I
48
-Corcoll, N., Bonet, B., Leira, M., Morin, S., Tlili, A., Guasch, H. The effect of metals on
photosynthesis processes and diatoms metrics of biofilm from a metal contaminated
river: a translocation experiment. (Submitted).
The following microcosm experiment deals to evaluate the biofilm response to a
multiple-stress situation, i.e. environmental stress caused by light and Zn toxicity. The
study also aimed to assess if adaptation to one of these stress factors (i.e. light)
modifies this response. A clear effect of light stress on Zn toxicity was demonstrated.
Zn toxicity was enhanced when light stress also occurred mainly to shade-adapted
communities causing a higher inhibition of photosynthetic processes and a de-coupling
between non-photochemcial quenching process and the de-expoxidation reaction of
diatoms. A scientific article will be published derived to this work:
-Corcoll, N., Bonet, B., Leira, M., Montuelle, B., Tlili, A., Guasch, H. Light history
influences the response of fluvial biofilms to Zn exposure. (Submitted).
The last part of this manuscript presents a general discussion focusing on the
main results derived from this thesis.

CHAPTER II
METHODOLOGY USED


Methodology
51
In order to achieve the planned objectives, several methodologies were used for
water and biofilm analyses in the different studies presented (Chapters IV, V and VI).
WATER ANALYSIS
Temperature (ºC), pH, dissolved oxygen (mg/L) and conductivity (µS/cm )
were measured using multiparametric probes (WTW METERS, Weilheim, Germany).
Applied in Chapters IV, V and VI.
Phosphate concentration in terms of soluble reactive phosphorus was
analysed using the Murphy and Riley (1992) molybdenum blue colorimetric method
following APHA (1989). Applied in Chapters IV, V and VI.
Nitrate concentration and the major cations and anions concentrations
were analysed by ion chromatography (761 Compact IC, METROHM, Herisau,
Switzerland) following standard methods (APHA, 1989). Applied in Chapters IV, V and
VI.
Dissolved organic carbon (DOC) was measured on a Shimadzu TOC 5000
following standard method (APHA, 1989). Applied in chapters IV and V.
Total dissolved metals in water were analysed by ICP-MS (7500c Agilent
Technologies, Inc. Wilmington, DE) according to Serra et al. (2009a). In Chapter IV (Al,
Fe, Zn, Cd, Ni, Cu and Pb), in Chapter V (Al, Fe, Zn, Cd, Ni, Cu, Pb and Sb).
BIOFILM ANALYSIS
Bioaccumulation . In order to measure the total amount of metals accumulated
in the biofilm, dried biofilm samples were lyophylized and weighed (g) to determine the
dry weight (DW) (Meylan et al., 2004). Then, c. 200 mg of DW were digested with 4 mL
of concentrated HNO3 (65%, suprapure) and 1 mL of H2O2 (31%, suprapure). After
Chapter II
52
dilution with MiliQ water, water samples were acidified (1% nitric acid suprapure) and
stored at 4ºC. Digested samples were analyzed following the procedure described for
dissolved metals in water. Metal bioaccumulation was expressed as dissolved metal
contents per biofilm dry weight (µg/gDW). It was applied in Chapters IV and V.
Chlorophyll-a (Chl-a) concentration and the carotenoid ratio (430:665)
were obtained from biofilm samples after extraction with 90% acetone and measured
spectrophotometrically (Jeffrey and Humphrey, 1975). Chl-a concentration was used as
a measure of algal biomass. Carotenoid ratio was calculated as the quotient between
optical densities at 430 and 665 nm (Margalef, 1983) and it was used as an indicator of
the proportion of protection pigments such as carotenoids per unit of active chlorophyll.
These techniques were applied in chapter IV. On the other hand, in Chapter VI, chl-a
concentration was estimated from pigment analysis by high pressure liquid
chromatography (HPLC) (see photosynthetic pigments analysis). Quantification of
identified chl-a was made from external calibration on standard chl-a (C55H72MgN405,
Carl Roth GmBH & Co). Final chl-a concentration was given as µgChl-a/cm2.
Total biomass content was measured by calculating the ash-free dry weight
(AFDW). Biofilm was dried for 24h at 105 ºC in order to calculate dry matter.
Afterwards, samples were combusted in an oven at 450 ºC (Obersal MOD MF12-124,
Spain) for 4h, and then weighed again to calculate the mineral matter content. The
AFDW was calculated by subtracting the mineral matter from the total dry matter.
Results are expressed as g/cm2. It was applied in Chapter VI.
Content of extracellular polymeric substances (EPS) was extracted by using
cation exchange resin (Dowex Marathon C, Na-form, strongly acid, Sigma-Aldrich)
according to the procedure described in Romaní et al. (2008) and Ylla et al. (2009).
Polysaccharide content was measured by the phenol–sulfuric acid assay (Dubois et al.,
1956) after the extraction of EPS. Standards of glucose (0–200 mg/mL) were also

Methodology
53
prepared. Results are expressed as µg glucose equivalents / cm2. It was applied in
Chapter VI.
Diatoms metrics. Diatom species identification and counting was used to
calculate several diatom metrics: species richness (S) in chapters V and VI, the
Shannon index of diversity (H’) in Chapter V and VI, relative abundance of each specie,
cell biovolume, % teratological forms and the Index of Pollution Sensitivity-IPS (Indice
de Polluosensibilité Spécifique, Coste in Cemagref, 1982) in Chapter V. IPS values
were used to characterize water quality (Coste in Cemagref, 1982). Samples were
digested with hydrochloric acid (37% HCl) and hydrogen peroxide (30% H2O2)
according to Leira and Sabater (2005). Frustules were mounted on permanent slides
using Naphrax (r.i. 1.74; Brunel Ltd, UK) and at least 400 valves were counted on each
slide in random transects under light microscopy using Nomarski differential
interference contrast optics at a magnification of (1000X). Krammer & Lange-Bertalot
(1986-1991) and recent nomenclature updates were used for identification, and
theoretical biovolumes of each species were also calculated following the geometric
formulas of Hillebrand et al. (1999), and expressed as mean cell biovolume per
sample.
Photosynthetic pigments were analysed by high pressure liquid
chromatography (HPLC) according to Tlili et al. (2008). Pigments were extracted with
4mL of methanol/0.5M ammonium acetate (98/2, v/v) solution as described in Dorigo et
al. (2007). An injection volume of 100 µL of purified biofilm extract was used to
determine the lipophilic pigment composition of the biofilm by HPLC. Pigments were
separated on a 4.6mm×250mm column (Waters Spherisorb ODS5 25 µm). Solvents
and elution gradient used for HPLC analysis are presented in Table. Standard
pigments used for calibration were: chl-a, chl-b, zeaxanthin, lutein and fucoxanthin
(Carl Roth GmBH & Co). Each pigment was identified from its retention time and
absorption spectrum using a diode array detector (DAD) according to the scientific

Chapter II
54
committee for oceanic research (SCOR) (Jeffrey et al. 1997). Each pigment was
expressed as the percentage of the sum of the areas for all the pigments in the sample.
It was applied in Chapters V and VI. The percentage area obtained for diadinoxanthin
and diatoxanthin pigments were used to calculate the de-epoxidation ration (DR): DR=
diatoxanthin / (diadinoxanthin + diatoxanthin) in Chapter VI.
Table 1. Gradient of HPLC elution used for pigment analysis. Solvent A: 0.5 M ammonium
acetate, Solvent B: 90% acetonitrile, Solvent C: ethyl acetate.
time (minutes)
Solvent A (%) Solvent B (%) Solvent C (%) Event
0-4 100 0 0 injection
4-18 0 100 0 logarithmic gradient
18-21 0 20 80 linear gradient
21-24 0 100 0 linear gradient
24-32 100 0 0 linear gradient
32 100 0 0 return to equilibrium
In vivo chl-a fluorescence measurements of biofilms were performed by
using pulse amplitude modulated-PAM fluorometry based on the method described by
Schreiber et al. (1986) by Mini-PAM fluorometer (Walz, Effeltrich, Germany) in chapter
V and by Phyto-PAM fluorometer version EDF (Walz, Effeltrich, Germany) in chapters
IV and VI. The difference between both flurometers is due to Mini-PAM only excites
chlorophyll fluorescence at one measuring light wavelenght (665nm) unlike the Phyto-
PAM employs an array of light-emitting diodes (LED) to excite chlorophyll fluorescence
at different wavelengths (470, 520, 645 and 665 nm). Hence, using the Phyto-PAM
instrument is possible to evaluate the fluorescence contribution of main algal group
composing biofilm. This instrument addresses this challenge by simultaneously using
light at different wavelengths for excitation of the algal class-specific light harvesting
complexes based on the internal ‘reference excitation spectra’ of a pure culture
(Schreiber et al., 2002). This application has been validated in fluvial biofilms by

Methodology
55
Schmitt-Jansen and Altenburger (2008) and provides a relative measure of the
fluorescence abundance of each phototrophic group composing biofilm (green algae,
diatoms and cyanobacteria). For instance, Chl b, which characterises chlorophytes as
a key pigment, shows absorption peaks at 470 nm and 645 nm. Diatoms which are
characterized by the key pigments Chl c and carotenoids, especially fucoxanthin, can
be studied by fluorescence excitation in the blue and green spectral range. On the
other hand, in the case of cyanobacteria, fluorescence excitation in the blue and green
spectral range is weak, while strong excitation is observed around 620-640 nm, in the
absorption range of phycocyanin / allophycocyanin.
Accessory equipment was designed to adapt Phyto-PAM fluorescence
measurements to biofilm samples (Fig.1). This material consisted in: 1) a set of
transparent Perspex boxes (9 x 9 x 6 cm3) used to incubate biofilm samples and
measure fluorescence parameters avoiding the manipulation of the samples (Chapter
IV), and 2) a micrometric device used for fixing the sensor of the Phyto-PAM under the
transparent boxes which contained the biofilm samples (chapter IV, V and VI). The
Phyto-PAM sensor was placed below the box at 6 mm of total distance from the biofilm
samples. The measuring distance was kept constant for all PAM measurements.
PAM fluorometry is also so-called saturation pulse quenching analysis. The
PAM-fluorescence method employs a combination of three different types of light
(modulated or measuring= 0.05 µmols photons/m2·s in µsec pulses; actinic= from 1 to
600 µmols photons/m2·s and saturating= 8000 µmols photons/m2·s) (Fig. 2), which
allow the adequate analysis of the fluorescence-induction kinetics of photosynthetic
organisms.
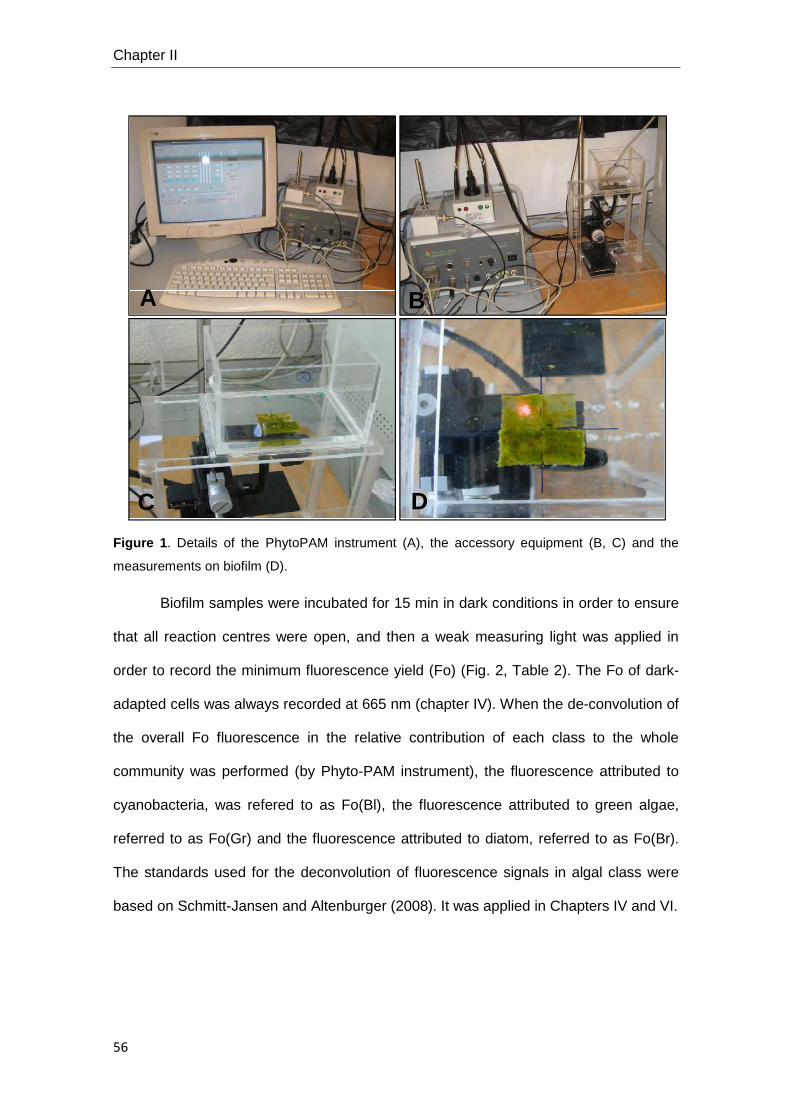
Chapter II
56
Figure 1 . Details of the PhytoPAM instrument (A), the accessory equipment (B, C) and the
measurements on biofilm (D).
Biofilm samples were incubated for 15 min in dark conditions in order to ensure
that all reaction centres were open, and then a weak measuring light was applied in
order to record the minimum fluorescence yield (Fo) (Fig. 2, Table 2). The Fo of dark-
adapted cells was always recorded at 665 nm (chapter IV). When the de-convolution of
the overall Fo fluorescence in the relative contribution of each class to the whole
community was performed (by Phyto-PAM instrument), the fluorescence attributed to
cyanobacteria, was refered to as Fo(Bl), the fluorescence attributed to green algae,
referred to as Fo(Gr) and the fluorescence attributed to diatom, referred to as Fo(Br).
The standards used for the deconvolution of fluorescence signals in algal class were
based on Schmitt-Jansen and Altenburger (2008). It was applied in Chapters IV and VI.
C D
A B
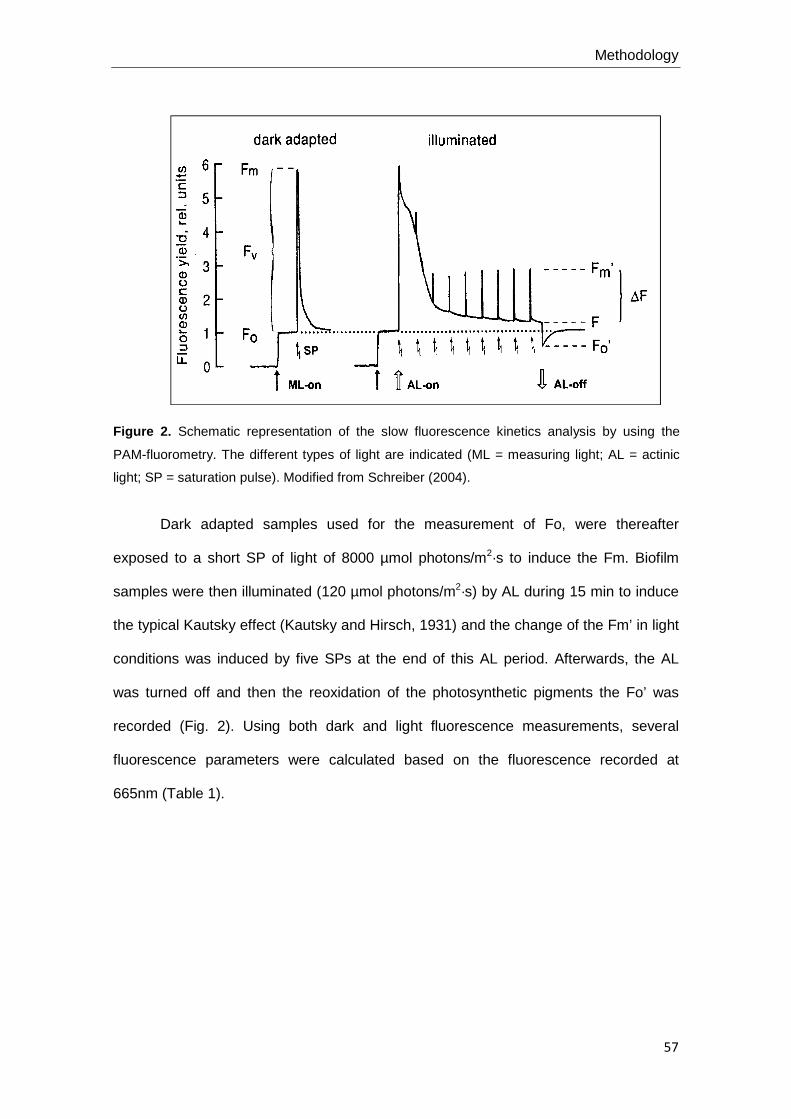
Methodology
57
Figure 2. Schematic representation of the slow fluorescence kinetics analysis by using the
PAM-fluorometry. The different types of light are indicated (ML = measuring light; AL = actinic
light; SP = saturation pulse). Modified from Schreiber (2004).
Dark adapted samples used for the measurement of Fo, were thereafter
exposed to a short SP of light of 8000 µmol photons/m2·s to induce the Fm. Biofilm
samples were then illuminated (120 µmol photons/m2·s) by AL during 15 min to induce
the typical Kautsky effect (Kautsky and Hirsch, 1931) and the change of the Fm’ in light
conditions was induced by five SPs at the end of this AL period. Afterwards, the AL
was turned off and then the reoxidation of the photosynthetic pigments the Fo’ was
recorded (Fig. 2). Using both dark and light fluorescence measurements, several
fluorescence parameters were calculated based on the fluorescence recorded at
665nm (Table 1).
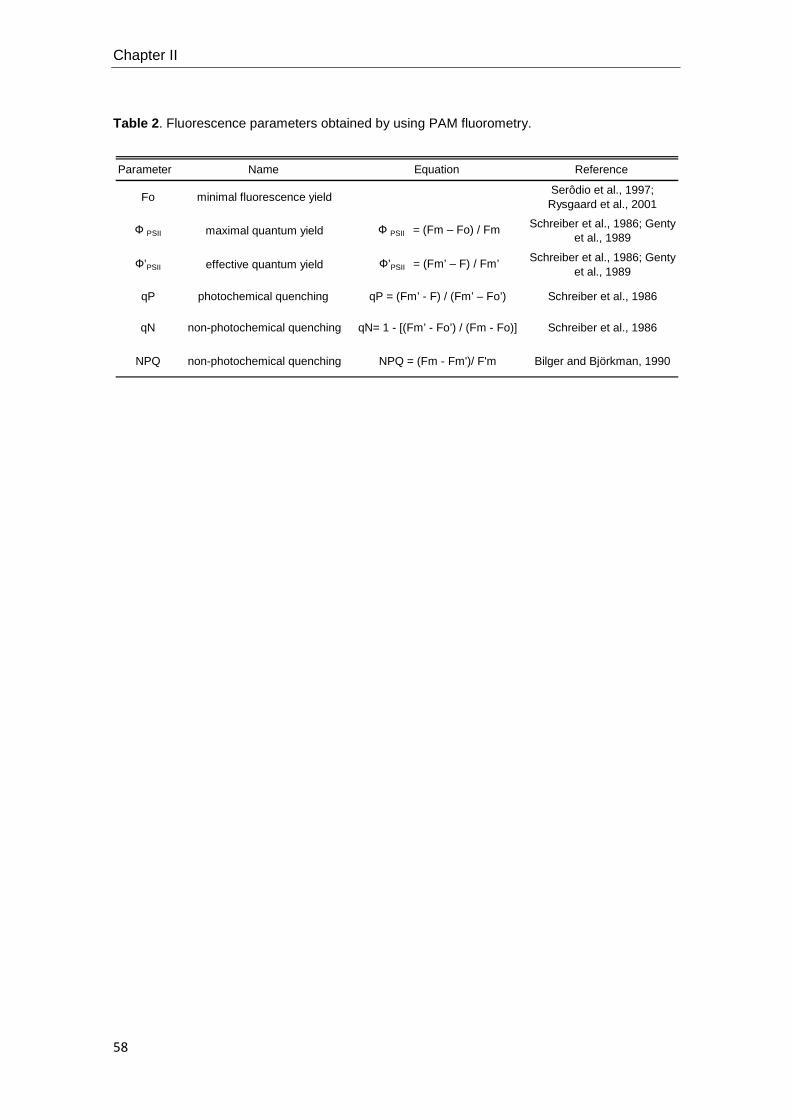
Chapter II
58
Table 2 . Fluorescence parameters obtained by using PAM fluorometry.
Parameter Name Equation Reference
non-photochemical quenching
Ф PSII maximal quantum yield Ф PSII = (Fm – Fo) / Fm
qP = (Fm’ - F) / (Fm’ – Fo’) Schreiber et al., 1986
qN qN= 1 - [(Fm’ - Fo’) / (Fm - Fo)]
Serôdio et al., 1997; Rysgaard et al., 2001
minimal fluorescence yieldFo
Schreiber et al., 1986
photochemical quenching
Schreiber et al., 1986; Genty et al., 1989
Ф’PSII effective quantum yield Ф’PSII = (Fm’ – F) / Fm’ Schreiber et al., 1986; Genty et al., 1989
NPQ non-photochemical quenching NPQ = (Fm - Fm')/ F'm Bilger and Björkman, 1990
qP

CHAPTER III
REVIEW OF THE USE OF PAM FLUOROMETRY FOR MONITORING
THE EFFECT OF CHEMICALS ON FLUVIAL BIOFILMS

60

Review: PAM fluorometry on biofilms
61
INTRODUCTION
The use of pulse amplitude modulated (PAM) fluorometry techniques to assess
photosynthesis performance under changing environmental conditions has widely been
proved as a rapid, non-invasive, reliable method (Krause and Weis 1991; Schreiber et
al., 1994). Since the first acknowledgement of the analytical potential of chl-a
fluorescence techniques (Kautsky and Franck, 1943; Kautsky et al., 1960) until now,
extensive research has been carried out to apply this technique in different research
fields. In the case of ecotoxicology, chl-a fluorescence techniques have been used to
evaluate the toxicity of different pollutants (mainly herbicides) and to locate their
primary sites of damage in photosynthetic organisms.
This chapter focuses on the use of chl-a fluorescence parameters (measured by
pulse amplitude modulated (PAM) fluorometry) to assess metal effects on the
autotrophic component of fluvial biofilms, a non-target community present in aquatic
systems. A detailed description of the basis, interpretation and measurement of chl-a
fluorescence parameters are provided in Chapters I and II (“chl-a fluorescence
parameters” pages 39-42 and “in vivo chl-a fluorescnece mesuraments” pages 54-58,
respectively).
Fluvial biofilms are made up mainly of algae, bacteria, fungi and other micro-
and meiofauna organisms, embedded in a matrix of extracellular polymeric substances
(Sabater and Admiraal, 2005). In contrast to other autotrophic groups, such as
phytoplankton, biofilms stand out for living immobile; they are therefore suitable for
long-term monitoring and allow chemical toxicity to assessessed at community level.
This community-approach is much closer to the processes of an ecosystem than the
regularly monitoring of single species tests and a biological quality element (Clements
and Newman, 2002; Guasch et al., 2010) for the assessment of the ecological status of
water systems. Biofilms have the capacity to modify the transport and accumulation of

Chapter III
62
substances such as nutrients (Freeman et al., 1995) as well as organic toxicants and
heavy metals (Gray and Hill, 1995). Several studies have highlighted the sensitivity of
these communities to a large panel of toxicants such as herbicides (Leboulanger et al.,
2001; Guasch et al., 2003; Schmitt-Jansen and Altenburger, 2005a, b; Pesce et al.,
2006) and heavy metals (Guasch et al., 2002; Ivorra et al., 2002; Pinto et al., 2003).
Due to this sensitivity, fluvial biofilms can be used as early warning systems for the
detection of the effects of toxicants on aquatic systems (Sabater et al., 2007). The
pertinence of the use of chl-a fluorescence techniques for toxicity assessment on fluvial
biofilms is attributed to the basis that if a chemical produces effects on the
photosynthesis processes (either directly or indirectly), the chl-a fluorescence
parameters will reflect it. In the last decade several investigations have followed this
approach (Barranguet et al., 2000; Navarro et al., 2002; Guasch et al., 2002, 2003,
2004; Schmitt-Jansen and Altenburger, 2005a; Schmitt-Jansen et al., 2007; Serra et
al., 2009; Ricart et al., 2009, 2010a; Bonnineau et al., 2010; Corcoll et al. 2011).
Several PAM fluorescence instruments are provided to assess the photosynthetic
performance in biofilms; each one presenting a specific characteristic: 1) Standard
PAM fluorometers excite chlorophyll fluorescence at one wavelength (665 nm,
excitation maximum of the chlorophyll a molecule) and have been applied on biofilms
to evaluate the global photosynthetic response of the autotrophic compartment (e.g.
Barranguet et al., 2000; Guasch et al., 2003). PAM fluorometers are available in
different technical settings (Fa. Walz, Effeltrich, Germany). 2) Next to standard
applications working with cuvettes, a microscopy PAM-fluorometer is available, suitable
for the assessment of selected cells within a biofilm on a microscopic scale (Schmitt-
Jansen and Altenburger, 2007). 3) The Maxi-Imaging PAM fluorometer was developed
to assess the photosynthetic capacity of large surfaces, e.g. leaves or multiwell plates
and is also suitable for measuring biofilms (McClellan et al., 2008; Schreiber et al.,
2007).
Review: PAM fluorometry on biofilms
63
4) Multi-wavelength excitation PAM fluorometers (e.g., Phyto-PAM) stand out for
working with several excitation wavelengths, exciting pigments with different absorption
spectra, e.g. carotenoids, which are characteristic for defined algal classes. After de-
convolution of the fluorescent signals from mixed algal samples the multi-wavelength
PAM-fluorometry has the potential to reveal the contribution of algal groups with
different absorption spectra (Schreiber et al., 2002).
Different sources of chemical contamination (industrial, agricultural or urban
activities) discharge a wide variety of compounds with different modes of action, toxic
concentrations and persistence into the ecosystem (accumulation, degradation, etc.).
The Water Framework Directive (2000/60/EC) defines a strategy for protecting and
restoring clean waters across Europe. As a first step of this strategy, a list of priority
substances was adopted in the Directive 2008/105/EC, in which 33 substances of
priority concern were identified and regulated. The list includes mainly organic
contaminants, such as pesticides and herbicides, and four toxic metals (Coquery et al.,
2005). The WFD follows two different assessment strategies; chemical status
evaluation and the ecological status. The “ecological status” represents the “quality of
the structure and functioning of aquatic ecosystems associated with surface waters”
(Directive 2000/60/EC). In order to establish the “ecological status”, the WFD requires
the sampling and interpretation of data on a broad suite of “biological quality elements
(BQEs)”. Observed metric values for BQEs in a water body undergoing monitoring are
mathematically compared with the expected values of reference condition sites based
on predictive modelling, hind-casting or expert judgment (Furse et al., 2006).
Phytobenthic community of biofilms, referred to as phytobenthos in the WFD, have
been included as one major BQE. Concerning this BQE, the WFD recognized the
diatoms index within biofilms to evaluate structural effects, which has been widely
applied for water managers. There is no recognized parameter to be evaluated for non-
diatom species from biofilm.

Chapter III
64
This chapter summarizes studies which assess the toxicity of metals on
autotrophic biofilms by using chl-a fluorescence techniques. Moreover, studies that
evaluate the toxicity of herbicides (targeting PSII) on biofilms by using these same
techniques are also reported because of their recognized sensitivity to PSII inhibitors
(Juneau et al., 2007).
The aim of this chapter is to analyze the pros and cons of the use of chl-a
fluorescence-techniques on biofilms for metal pollution quality monitoring programs in
the context of the Water Framework Directive, based on the current bibliography.
THE USE OF FLUORESCENCE PARAMETERS TO ASSESS THE EFFECTS OF
TOXICANTS ON BIOFILMS
PAM fluorometry gives the opportunity of evaluating both functional and
structural alterations in oxygenic photosynthetic organisms. These alterations are
related to the mode of action (MoA) of toxicants as well as the dose and time of
exposure.
Several studies are presented in order to illustrate the pros and cons of the
application of PAM fluorometry techniques on the growth of biofilm communities in the
laboratory to assess the chemical toxicity of herbicides (compounds targeting PSII) and
metals (not directly targeting PSII). The use of PAM fluorometry to assess chemical
toxicity in field studies is also presented.
Herbicides, laboratory experiments
Pollutants with MoA (mode of action) directly interfering with the PSII are mainly
represented by organic herbicides (e.g. diuron, atrazine, isoproturon). Due to their
specific MoA, studies dealing with their toxicity commonly use photosynthetic
endpoints. The inhibition of the maximal and the effective quantum yield (ΦPSII and
Φ’PSII, respectively) in biofilms exposed to PSII inhibitors for short periods of time

Review: PAM fluorometry on biofilms
65
(hours) has already been demonstrated. McClellan et al. (2008) detected a reduction of
the ΦPSII in biofilms exposed to diuron. Similar results have been obtained with atrazine,
prometryn and isoproturon (Schmitt-Jansen and Altenburger, 2005b, 2007, 2008). The
sensitivity of biofilms to isoproturon under different light intensities was determined by
Laviale et al. (2010), showing a clear reduction of photosynthesis (Φ’PSII and ΦPSII) and,
under dynamic light conditions, a clear reduction of the non-photochemical quenching
(NPQ) mechanisms. Effects of PSII inhibitors on the ΦPSII and algal biomass measured
by basal fluorescence (Fo) are less reported, especially in short-term toxicity
assessment. Schmitt-Jansen and Altenburger (2005a) found a reduction on ΦPSII of
90% after 1 hour of exposure to isoproturon. Focusing on long-term toxicity studies,
Ricart et al. (2009) analyzed the long-term effect of the herbicide diuron on fluvial
biofilms and detected a clear decrease in the Φ’PSII with increasing concentrations of
diuron, indicating a clear dose-dependent effect, probably attributable to the MoA of the
herbicide. A reduction of the ΦPSII of biofilms was also observed by Tlili et al. (2010)
after 3 weeks of exposure to diuron. Schmitt-Jansen and Altenburger (2005a, 2008)
used these techniques to evaluate the long-term effects of isoproturon to biofilm
structure. They detected a reduction of Fo and a shift in the algal classes to a
dominance of green algae. Effects of diuron on a simple food chain (biofilm and
grazers (snail Physella [Costatella] acuta)) have also been evaluated using PAM
fluorometry techniques. In a long-term experiment, López-Doval et al. (2010) used
Φ’PSII to monitor the physiological state of the biofilm, as well as to detect the effect of
diuron, grazers and their interaction on the biofilm community. A significant reduction in
Φ’PSII was detected in both diuron and diuron+grazers microcosms.
Chl-a fluorescence parameters have been used as a physiological endpoint to
investigate community adaptation following the Pollution Induced Community
Tolerance (PICT) approach (Blanck et al., 1988). Briefly, the replacement of sensitive
species by tolerant ones driven by the selection pressure from toxicants is expected to

Chapter III
66
increase the EC50 of the community measured in acute dose-response tests using
physiological endpoints such as Ф’PSII. PICT of periphyton to isoproturon (Schmitt-
Jansen and Altenburger, 2005a, 2008), atrazine, prometryn (Schmitt-Jansen and
Altenburger, 2005b) and diuron (Tlili et al., 2010) has been determined by testing
inhibition of Ф’PSII on pre-exposed and non pre-exposed biofilm communities.
Metals, laboratory experiments
Chl-a fluorescence parameters have commonly been used to assess the toxicity of
metals, chemicals not directly targeting PSII. Chemicals that damage membranes or
proteins associated with photosynthetic electron transport or that inhibit any cellular
process downstream of PSII, such as carbon assimilation or respiration, will lead to
excitation pressure on PSII (Marwood et al., 2001). Therefore, chl-a fluorescence
methods can also be used to assess the effects of chemicals affecting metabolic
processes not directly linked to photosynthetic electron transport. In these cases, the
obtained parameters may indicate secondary effects on the performance of the
photosynthetic apparatus or on algal biomass. For instance, copper is a phytotoxic
chemical affecting the activity of photosystem II and electron transfer rates (Mallick and
Mohn, 2003). However, this metal is also known to cause the oxidation of sulphydryl
groups of enzymes leading to their inhibition (Teisseire and Guy, 2000) or to generate
reactive oxygen species like superoxide and hydroxyl radicals causing oxidative stress
(for a review see Pinto et al. (2003)), reducing growth as well as photosynthetic and
respiratory activities (Nalewajko and Olaveson, 1994). Several biofilm studies have
used copper as a model toxic compound (Table 1), applying, in many cases chl-a
fluorescence parameters to assess biological responses.
Serra et al. (2009) measured Ф’PSII to check the photosynthetic performance of
biofilms during the Cu retention experiment that lasted for a few hours. Transient

Table 1. Summary of studies applying chl-a fluorescence techniques to assess metal toxicity on fluvial biofilm communities. Significant responses observed
are indicated by “-” for inhibition or by “+” for increase and its approximate magnitude by: “-“ or “+” if it was slight (10-30% of control), by: “- -” or “+ +” if it was
moderate (30-50% of control) and by: “- - -” or “+ ++” if it was high (>50% of control). n.s.: not significant (p>0.05).
Toxicant Biofilm
Community Exposure Conc. ФPSII Ф’PSII NPQ Fo Fo(Bl) Fo(Gr) Fo(Br) Reference
Cu Microcosms 24h; 3d 445-1905; 126 µg/L - / - - - - - Barranguet et al.,
2000; 2003
Zn Microcosms 72 h 320 µg/L n.s. - n.s n.s. n.s. n.s. n.s.
Corcoll et al., 2011 5 wk 320 µg/L - n.s. - - - - - - n.s. n.s. -
Cu Microcosms 6 d; 16d 0- 100 µg/L - - - - Guasch et al.,
2002; 2004
Cu, Zn, Cu+Zn
Microcosms 5 d 636; 6356 µg/L - n.s. - - - - - - García-Meza et
al., 2005
Cu
Microcosms 4 wk 30 µg/L +++ n.s. - - -
Serra et al., 2009 no Cu vs Cu pre-
exposure 6 h 100 µg/L - / n.s. n.s
Cu Microcosms 3 wk 30 µg/L -
Tlili et al., 2010 30 µg/L + PO4
3- n.s.

Chapter III
68
inhibition of Ф’PSII was also observed by Corcoll et al. (2011) after a few hours of Zn
exposure; however, this parameter recovered after longer exposure (Table 1). In a
study of Rotter et al. (2011), the capacity of biofilm to recover photosynthesis after
long-term prometyn exposure was linked with a physiological adaptation and a
selection of tolerant biofilm species. Physiological chl-a parameters such as Ф’PSII may
not consistently show toxic effects caused by metals after longer exposure due to
community adaptation. Barranguet et al. (2003) observed that biofilms exposed during
two weeks to Cu presented alterations in the Fo and that Ф’PSII was less affected. In
another study, Barranguet et al. (2000) have also observed that the main factor
regulating the sensitivity of biofilms to Cu toxicity (based on the Φ’PSII endpoint) during
short-term exposures was the physical structure of the biofilm (package of cells and
thickness), and not to the species composition. In this case, these endpoints were used
to show differences in sensitivity between suspended cells and intact biofilm
communities.
Fo and Ф’PSII were also used by Guasch et al. (2002) and Garcia-Meza et al.
(2005) to assess Cu and Cu plus Zn toxicity on biofilms for 6 and 5 days of exposure,
respectively. In both cases, Fo appeared to be the most sensitive endpoint, whereas
effective concentrations based on Ф’PSII were always much higher (Table 1). In the
second example, multi wave-length fluorometers allowed the effects on cyanobacteria
and green-algae biomass to be followed as well as their respective ФPSII. Similarly,
Serra et al. (2009a) demonstrated that community composition differed among biofilms
with different Cu-exposure history. Community changes were identified using multi
wave-length fluorimetry, whereas Cu adaptation was assessed by comparing the Ф’PSII
responses to short Cu exposure (Table 1). Tlili et al. (2010) used the ФPSII to evaluate
the role of phosphorus on Cu toxicity on biofilms. They observed that biofilms pre-
exposed to Cu presented a lower ФPSII than biofilms non pre-exposed to Cu or pre-
exposed to Cu plus phosphorus (Table 1).

Review: PAM fluorometry on biofilms
69
Field studies
Pollution in fluvial ecosystems is related to the main activities that are carried
out in their catchments. As a general rule, agricultural areas are more affected by
organic chemicals (herbicides, insecticides or fungicides), industrial and mining areas
by metals, and urban areas by personal care products and pharmaceuticals via
sewage treatment plant effluents (Metcalfe et al., 2003; Halling-Sørensen et al., 1998).
However, the predominant scenario found in most polluted rivers is a mixture of
different chemicals. From an ecotoxicological point of view, mixture pollution implies
that compounds with different chemical properties, modes of action and concentrations
will coexist. Moreover, environmental factors such as light, nutrients or flow regime may
also influence the fate and effects of chemicals on fluvial communities. Due to their
complexity, the effects of toxicants on biofilm communities have been addressed by
different methodological approaches including periodic monitoring sampling,
translocation experiments or PICT approaches. In addition, different biofilm targeting
endpoints have been used, including, in many cases, chl-a fluorescence parameters.
Ricart et al. (2010a) examined the presence of pesticides in the Llobregat river
basin (Barcelona, Spain) and their effects on benthic communities (invertebrates and
natural biofilms) (Table 2). Several biofilm metrics, including PAM parameters, were
used as response variables to identify possible cause-effect relationships between
pesticide pollution and biotic responses. Certain effects of organophosphates and
phenylureas in both structural (chl-a content and ФPSII) and functional aspects (Ф’PSII) of
the biofilm community were suggested. The authors concluded that complemented with
laboratory experiments, which are needed to confirm causality, this approach could be
successfully incorporated into environmental risk assessments to better summarize
biotic integrity and improve ecological management.

Table 2. Review of field studies where chl-a fluorescence techniques have been applied to assess the effects of toxicants on photosynthesis performance of
fluvial biofilm communities. The significant responses observed are indicated by “-” for inhibition or by “+” for increase and its approximate magnitude by: “-“ or “+”
if it was slight (10-30% of control), by: “- -” or “+ +” if it was moderate (30-50% of control) and by “- - -” or “+ + +” if it was high (>50% of control). n.s.: not
significant (p>0.05). The terminology used for mentioning the mode of action (MoA) of each compound was: “a” for PSII inhibitors and “b” for photosynthesis
inhibitors not directly targeting PSII.
Toxicant MoA River Growth
substrate Experimental Conditions ФPSII Ф’PSII NPQ Fo Fo(Bl) Fo(Gr) Fo(Br) Reference
Cu b Ter River,
Spain artificial substrata
Biofilm from different polluted sites (spring and summer) was transported to the
laboratory for Cu and atrazine short-term toxicity tests
- - - Navarro et al. 2002
Atrazine a - - -
22 pesticides (mixture)
a Llobregat
River, Spain
natural biofilm
Field monitoring of biofilm from different polluted sites during two years - natural
exposure - -
Ricart et al. 2010a
Atrazine a 7 streams from
Catalonia Area, Spain
artificial substrata
Biofilm from different polluted sites and during different seasons was transported
to the laboratory for atrazine and Zn short-term toxicity tests
- - -
Guasch et al. 2003
Zinc b - -
Atrazine a Ozanne River, France
artificial substrata
Biofilm from different polluted sites and during different seasons was transported
to the laboratory for atrazine and isoproturon toxicity tests - PICT concept
- - - Dorigo et al. 2001,
2004 Isoproturon a - - -
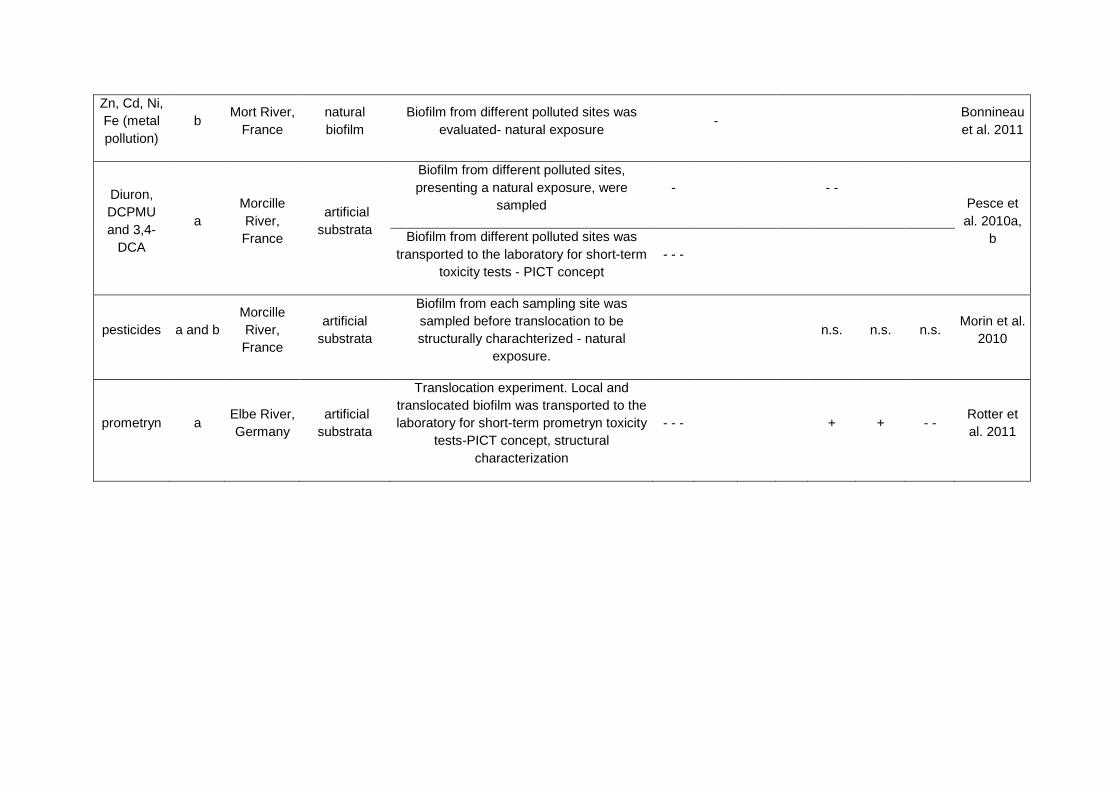
Zn, Cd, Ni, Fe (metal pollution)
b Mort River,
France natural biofilm
Biofilm from different polluted sites was evaluated- natural exposure
- Bonnineau et al. 2011
Diuron, DCPMU and 3,4-
DCA
a Morcille River, France
artificial substrata
Biofilm from different polluted sites, presenting a natural exposure, were
sampled - - -
Pesce et al. 2010a,
b Biofilm from different polluted sites was transported to the laboratory for short-term
toxicity tests - PICT concept - - -
pesticides a and b Morcille River, France
artificial substrata
Biofilm from each sampling site was sampled before translocation to be structurally charachterized - natural
exposure.
n.s. n.s. n.s. Morin et al.
2010
prometryn a Elbe River, Germany
artificial substrata
Translocation experiment. Local and translocated biofilm was transported to the laboratory for short-term prometryn toxicity
tests-PICT concept, structural characterization
- - - + + - - Rotter et al. 2011

Chapter III
72
In the Morcille River, located in a vineyard area of France, several studies have
been performed to evaluate the effects of pesticides on biofilms (Morin et al., 2010;
Pesce et al. 2010a, 2010b) (Table 2). Morin et al. (2010) studied the structural changes
in biofilm assemblages induced by the transfer of biofilm communities from two
contaminated sites to a reference site, expecting a recovery of the translocated
communities, either in structure or in diversity. The proportions of the different algal
groups in biofilms were estimated by in vivo chl-a fluorescence measurements,
observing that biofilm was mainly composed by diatoms before and after translocation
(Table 2). In the same river, Pesce et al. (2010a), used the ΦPSII to evaluate individual
and mixture effects of diuron and its main metabolites (DCPMU and 3,4-DCA) on
biofilms. They observed that diuron was the most toxic of the evaluated compounds
and that biofilms from contaminated sites presented a higher tolerance to diuron and
DCPMU than biofilms from a reference site. In another study (Pesce et al., 2010b),
diuron tolerance acquisition by photoautrophic biofilm communities due to their
previous in situ exposure to this herbicide was investigated. For this purpose, the PICT
approach (using the ΦPSII as endpoint) together with multivariate statistical analyses,
were combined. A spatio-temporal variation in diuron tolerance capacities of
photoautotrophic communities was observed, the biofilm from the most polluted site
being the most tolerant (Table 2). Similar tolerance results were found by Rotter et al.
(2011) in a study in the Elbe River where prometryn toxicity on biofilm was evaluated
by combining a translocation experiment and the PICT approach (Table 2). They
observed that biofilms from a polluted site presented a higher EC50 (based on Φ’PSII
measures) than biofilms from a reference site, suggesting a prometryn tolerance
induction. The proportion of each group (cyanobacteria, green algae and diatoms) in
transferred and control biofilms was also measured by PAM fluorometry. In other
studies, Dorigo et al. (2001, 2004) also used the PICT approach to investigate the
toxicity of atrazine and isoproturon on biofilm from a herbicide-polluted river (Ozanne
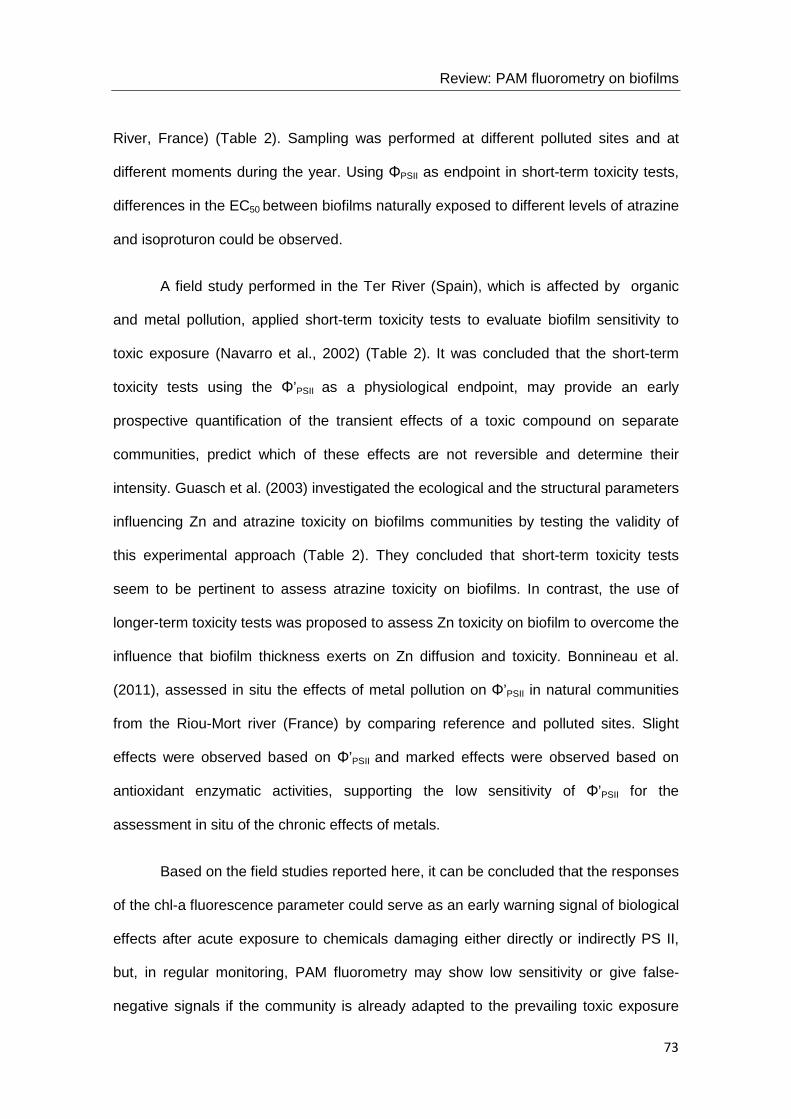
Review: PAM fluorometry on biofilms
73
River, France) (Table 2). Sampling was performed at different polluted sites and at
different moments during the year. Using ΦPSII as endpoint in short-term toxicity tests,
differences in the EC50 between biofilms naturally exposed to different levels of atrazine
and isoproturon could be observed.
A field study performed in the Ter River (Spain), which is affected by organic
and metal pollution, applied short-term toxicity tests to evaluate biofilm sensitivity to
toxic exposure (Navarro et al., 2002) (Table 2). It was concluded that the short-term
toxicity tests using the Φ’PSII as a physiological endpoint, may provide an early
prospective quantification of the transient effects of a toxic compound on separate
communities, predict which of these effects are not reversible and determine their
intensity. Guasch et al. (2003) investigated the ecological and the structural parameters
influencing Zn and atrazine toxicity on biofilms communities by testing the validity of
this experimental approach (Table 2). They concluded that short-term toxicity tests
seem to be pertinent to assess atrazine toxicity on biofilms. In contrast, the use of
longer-term toxicity tests was proposed to assess Zn toxicity on biofilm to overcome the
influence that biofilm thickness exerts on Zn diffusion and toxicity. Bonnineau et al.
(2011), assessed in situ the effects of metal pollution on Φ’PSII in natural communities
from the Riou-Mort river (France) by comparing reference and polluted sites. Slight
effects were observed based on Φ’PSII and marked effects were observed based on
antioxidant enzymatic activities, supporting the low sensitivity of Φ’PSII for the
assessment in situ of the chronic effects of metals.
Based on the field studies reported here, it can be concluded that the responses
of the chl-a fluorescence parameter could serve as an early warning signal of biological
effects after acute exposure to chemicals damaging either directly or indirectly PS II,
but, in regular monitoring, PAM fluorometry may show low sensitivity or give false-
negative signals if the community is already adapted to the prevailing toxic exposure

Chapter III
74
conditions. Tolerance induction evaluations and multi-biomarker approaches, together
with the use of appropriate multivariate statistical analyses may partially overcome this
limitation.
GENERAL DISCUSSION AND PROSPECTS
The main aim of this chapter was to analyse the pros and the cons of the use of
chl-a fluorescence techniques for water metal pollution monitoring programs. While not
being an exhaustive review, 19 different investigations have been analysed, including
only field and laboratory investigations dealing about the application of chl-a
fluorescence parameters on biofilm communities.
The use of chl-a fluorescence parameters as biomarkers of metal toxicity on
biofilm communities has increased in the last few years, illustrating their applicability to
show early and long-term effects of toxicants at community level using functional and
structural descriptors.
Differences in sensitivity are reported between chl-a fluorescence parameters.
Focusing on functional parameters, the effective quantum yield (Φ’PSII) seems to be a
very sensitive parameter to detect the effects on algae of toxic compounds targeting
the PSII. Its use is well reported in both laboratory and field studies, supporting its use
for these type of compounds. On the other hand, its sensitivity to chemicals with a
mode of action different to the PSII, is highly influenced by the time of exposure of the
toxicant (short-term vs. long-term exposure). In short-term studies, the Φ’PSII seems to
be a sensitive endpoint of toxicity but in long-term studies its sensitivity is often less
obvious. This lack of sensitivity during long-term exposures could be related to a
development of biofilm tolerance or recovery after longer exposures. It has been
described that the exposure history of communities is defining the time-response of
recovery and adaptation (Rotter et al. 2011, Morin et al. 2010). PICT-concept is shown
Review: PAM fluorometry on biofilms
75
to be a suitable tool for analysis of recovery and adaptation processes of communities
Rotter et al. (2011). Therefore, in long-term studies both in field and in laboratory
conditions, supplementary methodological approaches, such as PICT tests based on
Φ’PSII may be used to show community adaptation.
The maximal photosynthetic capacity of biofilms (ΦPSII) showed a similar
sensitivity to chemicals as the Φ’PSII. This parameter has been used more in
ecotoxicological studies than the Φ’PSII, probably due to its simplicity for being
measured. The ΦPSII, which is measured on dark-adapted samples, is independent of
the light conditions prevailing during the incubation period. Therefore, it is more
suitable than Φ’PSII for comparing results of experiments using different light conditions
(Laviale et al., 2010). In a recent study, Laviale et al. (2011) recomended the combined
use of both photosynthetic parameters, the ΦPSII and the Φ’PSII, to get a better
understanding of herbicides toxicity on biofilms. The use of the non-photochemical
quenching parameter (NPQ) to assess chemical toxicity on biofilm is less documented
than those reported above and applied only in microcosm studies. However, its use is
promising due to its sensitivity to different types of toxicants, and also due to its
complementarity to the more classical photosynthetic related parameters (Φ’PSII and
ΦPSII) (Laviale et al., 2010; Ricart et al,. 2010b; Corcoll et al., 2011).
Concerning more structural chl-a fluorescence parameters; the minimal fluorescence
parameter (Fo) has been applied for monitoring algal biomass and biofilm growth rate
in microcosm studies (Serra et al., 2009; Corcoll et al., 2011). It has been successfully
applied in ecotoxicological studies focusing on metals, compounds that damage
photosynthetic processes without targeting the PSII. Since Fo is influenced by
measuring conditions: instrument settings, distance between sensor and the biofilm
sample or the light intensity measurement, absolute values are difficult to compare
between different studies without using the same calibration. However, toxic effects on

Chapter III
76
Fo, in ecotoxicological studies, are usually reported in comparison to a non-exposed
community (in relative terms) to avoid this limitation. The measurements of Fo may
present other limitations not related to the algal biomass or biofilm thickness. Fo may
increase if the addition of a herbicide causes a transfer of the electron on
plastoquinone B (PQB) to the primary quinine acceptor, the plastoquinone A (PQA) and
displacement of PQB by the herbicide; the reduced PQA leads to a higher Fo (Hiraki et
al., 2003). Consequently, an overestimation of Fo could occur. Also, it is known that
some chemicals emit fluorescence under excitation light (e.g. DCMU) that could not be
distinguished from the fluorescence emitted from excited Chl-a (Fo measure). In these
cases, the use of Fo to assess algal biomass is not recommended. In field applications,
this phenomenon could play an important role, since pollution is often due to a mixture
of compounds of unknown origin. On the other hand, the “greening effects”, in which
Chl-a synthesis increases maintaining an efficient conversion of light energy to
chemical energy (Waring et al. 2007), could also contribute to limit the use of Fo for
measuring algal biomass or algal growth. This phenomenon may occur due to an
increase in the number of chl-a molecules per unit of cell, without increasing the
number of cells (Guasch et al., 1997; Ricart el al., 2009). This situation could produce
an increase of Fo values with no increase in the number of cells.
A significant portion of the ecotoxicological studies included in this chapter has
incorporated the deconvolution of the chl-a fluorescence signal into the contribution of
the main autotrophic groups. These measurements allow the main autotrophic groups
of biofilms (structural approach) to be characterized being in agreement with one of the
most important assessment aims of the BQE. Nowadays, PAM fluorometers which
incorporate a four-wavelength excitation method to deconvolute these photosynthetic
parameters of microalgal communities (Fo(Bl), Fo(Gr) and Fo(Br)) by incorporating
spectral groups based on a single species pigment spectra. This calibration could be
improved in the future if spectres used for calibrating the fluorometer are based on a

Review: PAM fluorometry on biofilms
77
mix of species from each group, based on the key species of each autotrophic group.
This procedure could probably help to decrease uncertainty in these measurements.
Accordingly, the use of Fo to assess algal classes as BQE , two main requeriments
should be fulfilled: (1) fix a distance of measurement between sample and sensor to
obtain comparable measurements between differents analysis, and (2) use standards
calibrations for the deconvolution of main algal groups.

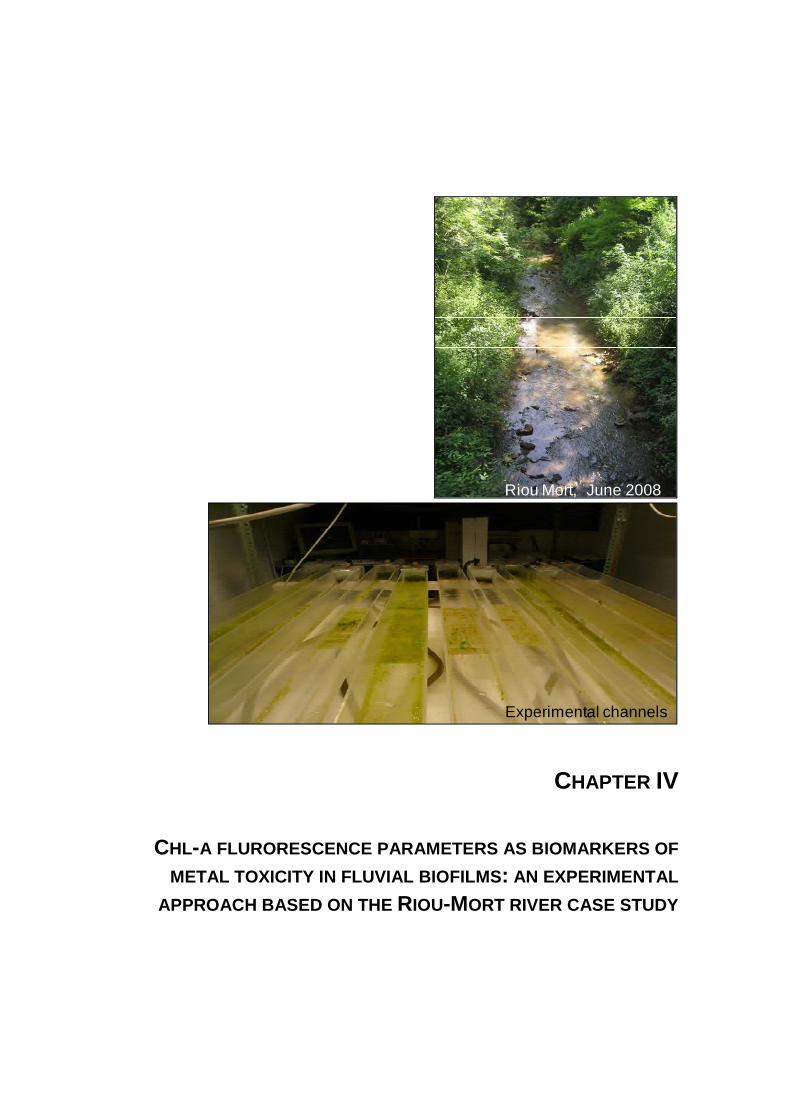
CHAPTER IV
CHL-A FLURORESCENCE PARAMETERS AS BIOMARKERS OF
METAL TOXICITY IN FLUVIAL BIOFILMS : AN EXPERIMENTAL
APPROACH BASED ON THE RIOU -MORT RIVER CASE STUDY
Riou Mort, June 2008
Experimental channels


Zn effects on biofilms
81
INTRODUCTION
Among the great varieties of pollutants interfering with the metabolism of
photosynthetic organisms at different stages, trace metals are one of the most common
non-biodegradable pollutants reported at elevated concentrations in many parts of the
world (Mallick and Mohn, 2003). Metal pollution is of great concern in freshwater
systems affected by agricultural, mining and industrial activities. Recent studies
performed in the Riou-Mort river, a river draining an active mining area in France, have
demonstrated that the mixture of metals found is toxic to biofilms causing structural
alterations such as growth inhibition and changes in the architecture and composition
of the diatom community (Gold et al., 2003a; Duong et al., 2010; Bonnineau et al.,
2011). Although this river presents high concentrations of Fe, metal pollution is
attributed to Zn and Cd due to seepage from an active zinc factory (Morin et al., 2008).
It is not clear, however, if the effects reported on biofilm were caused by Zn, Cd or
mixture of both. Most of the previous experimental studies considered Cd alone as
responsible of the toxicity observed, without taking into account either the role of Zn nor
of the mixture (Cd + Zn) (Gold et al., 2003b; Morin et al., 2008; Duong et al., 2010).
This study was focused on assessing the contribution of Zn to toxicity.
Zn ions at low concentrations are indispensable for algal growth but at high
concentration they become toxic (Silver, 1998). Zinc toxicity on algae may affect the
oxidizing side of PSII by noncompetitively inhibiting Ca2+ and Mn2+ binding at their
native sites on the water oxidizing complex (Rashid et al., 1994). Based on algal
monocultures, Zn toxicity is reported at very different concentrations depending on the
species tested and the biomarker assessed: Chaloub et al. (2005) found Zn toxicity on
cyanobacteria cultures between 30-332 mg/L and Posthuma et al. (2001) describe an
EC50 of 15 µg/L in Selenastrum capricornutum. Cd is considered an important
contaminant of natural waters due to its high toxicity at low concentrations (Deckert,

Chapter IV
82
2005). Cd displaces metal cofactors (Zn2+ and Ca2+) from undefined protein targets or
directly binds amino acid residues, including cysteine, glutamate, aspartate, and
histidine (Faller et al., 2005). However, Cd toxicity to autotrophic organisms at
environmentally realistic concentrations is less documented. Studies performed with
Selenastrum acutus (Turpin) Kützing (Ilangovan et al., 1998) have shown Cd toxicity at
high Cd concentration (EC50= 500 µgCd/L). Zhou et al. (2006), observed Cd toxicity on
cyanobacteria cultures of Microcystis aeruginosa at 448 µgCd/L.
In our investigation, metal toxicity was assessed on biofilms because of its
capacity to detect effects produced by toxic substances at the base of the trophic chain
(Sabater et al., 2007) and to provide a community ecotoxicology approach with higher
ecological relevance than using single species (Clements and Newman, 2002; Guasch
et al., 2010a). Biofilms, also known as microphytobenthos or periphyton, are complex
biological structures composed mainly by algae, cyanobacteria, bacteria, fungi and
microfauna, located in close physical contact and embedded in a mucopolysaccharide
matrix (Lock et al., 1984). In rivers and streams, the biofilm has an important role in the
primary production (Guasch and Sabater, 1998) and in the organic matter processing
(Romaní and Sabater, 2001).
Metal toxicity on biofilms differs from the results obtained with free-living
organisms. Paulsson et al. (2000) reported an EC50 of 3640 µgZn/L based on the
photosynthetic activity. In another study, this author (Paulsson et al., 2002) observed
that Zn produced indirect effects on biofilms between 6-25 µgL. Guasch et al. (2003),
reported that Zn toxicity on biofilms was highly related to algal biomass and for this
reason the range of EC10 values based on photosynthesis tests was so broad (455 –
65,000 µgZn/L). In the case of Cd, previous studies (Gold et al., 2003b; Morin et al.,
2008) showed slight effects at 10 µg/L and a marked reduction of the biofilm biomass

Zn effects on biofilms
83
and diatom density, after chronic exposure to 100 µg/L (Gold et al., 2003b; Morin et al.,
2008).
Based on the results reported above concerning fluvial biofilms, it is expected
that the type of pollution present in the Riou-Mort river, Zn pollution ranges between
400 and 900 µgZn/L and Cd pollution ranges between 12 and 15 µgCd/L, may cause
marked effects due to chronic Zn pollution and slight effects due to Cd. However, it is
not clear whether the effects of the exposure to both metals will be similar, higher or
lower than the exposure to Zn alone. While Morin et al. (2008) already investigated the
response of biofilm to Cd exposure, showing slight effects, in the present investigation
we focus on the difference between the effects of Zn alone and Zn with Cd. This
approach will allow us to investigate the effects of the type of metal pollution found in
the field and to elucidate the specific influence of Zn on freshwater biofilms. Zn and Cd
pollution has been described in other metal polluted streams at higher concentrations:
in the Dommel stream in Belgium (Ivorra et al., 1999) reached up to 282 µgCd/L and
3147 µgZn/L or the Guadiamar stream, in Spain, (Santos et al., 2010) presented up to
286 µgCd/L and 1001 µgZn/L. On the other hand, lower levels of Zn have been
reported in other metal-polluted areas; i.e. around 600 µgZn/L in Osor River, Spain
(ACA-Catalan Water Agency) or between 150 and 400 µgZn/L in Furtbach River,
Switzerland (Le Faucheur et al., 2005).
Toxic concentrations of trace metals have been reported to act on the
photosynthesis in higher plants (Sheoran and Singh, 1992), green algae (Samson et
al., 1988), cyanobacteria and diatoms (Juneau et al., 2001). The pulse amplitude
modulated (PAM) fluorimetry technique can be used to assess the direct and indirect
effects of toxicants on photosynthetic processes (Ralph et al., 2007). In particular, the
electron transport rate (Ralph and Burchet, 1998) or the water-splitting apparatus
(Moustakas et al., 1994) can be inhibited. Within biofilms, PAM fluorimetry has been
Chapter IV
84
used in several studies to evaluate metal toxicity based on the effective quantum yield
(Ф’PSII) and the maximal photosynthetic capacity (Ф PSII) parameters (e.g. Guasch et al.,
2002; Barranguet et al., 2003, Serra et al. 2009). However, the effects of metals in the
use of the energy designated to radiative (qP) or non-radiative processes (qN and
NPQ) is less documented in biofilm studies. These quenching parameters were
incorporated in our study in order to widen the applications of the fluorescence
parameters for the assessment of metal pollution effects on biofilm communities.
Recent studies based on biofilms showed the potential use of the non-photochemical
parameter (NPQ) as a pertinent fluorescence parameter to assess the effects of
organic toxic substances (Laviale et al., 2010; Ricart et al., 2010a).
The duration of metal exposure is of great relevance for biofilms since metal
bio-accumulation and toxicity increase with the time of exposure. Short-term metal
toxicity on biofilms is usually found at concentrations higher than those described in
free-living organisms (Guasch et al., 2010a,b). This marked difference is explained by
the structure of biofilms, reducing metal penetration into the cells. On the other hand,
longer metal exposures may allow the metals to reach the different types of organisms
embedded in the biofilm (Guasch et al., 2003) increasing metal toxicity once the toxic
compounds have entered into the cell (Escher et al., 2002). In field situations, point-
sources of metal pollution might cause chronic and variable metal exposure depending
on flow conditions (of lower concentration under high-flow conditions due to dilution)
whereas diffuse sources such as the urban runoff would cause short-term metal
exposures directly linked with rainfall episodes (Guasch et al. 2010a). Aquatic
organisms will accumulate less metal during a short exposure causing a transient
metabolic and physiological response. Internal concentration will increase after longer
metal exposure causing increases in toxicity and/or the development of mechanisms to
regulate the accumulation of metals (e.g. Hassler and Wilkinson, (2003); Hassler et al.,
(2005)).

Zn effects on biofilms
85
Since the different species of algae and cyanobacteria found in a biofilm may
differ in their metal sensitivity, it is also expected that long-term exposures to low metal
concentrations may lead to changes in their competitive interactions producing
community changes as it was observed by Serra et al. (2009a) in an experiment of
chronic exposure of biofilms to Cu. In this study, cyanobacteria were the autotrophic
group better adapted to Cu exposure. Thus, it is of great interest to investigate both
short- and long-term effects of metal exposure providing the most appropriate
endpoints for each temporal scale of exposure.
The main aim of this study was to evaluate the sensitivity of different chl-a
fluorescence parameters as metal pollution biomarkers of short and long-term metal
exposures under realistic metal exposure conditions by performing an experimental
approach. Firstly, a field monitoring campaign was conducted in the Riou-Mort river to
characterize water and biofilm from three different metal polluted sites (Bonnineau et
al., 2011). Secondly, based on the Riou-Mort river case study (June 2008), a
microcosm experiment was performed in which biofilm communities were chronically
exposed to 400 µgZn/L and 20 µgCd/L. Moreover, the study also aimed to investigate
the contribution of Zn, the metal found at higher concentration, on the effects produced
by Zn plus Cd. With this aim, the effects of Zn alone were also investigated.
Our hypotheses are that: 1) The set of parameters studied will allow us to show
the effects of metal pollution (Zn+Cd) at realistic concentrations. 2) Short-term
exposure will mainly cause functional alterations, whereas structural changes will
appear after long-term exposure.
Functional alterations will cause changes in qP and Ф’PSII, closely related to the
electron transport chain, and NPQ and qN activated to avoid stress. Structural damage
of the photosynthetic apparatus such as the ultra-structure of the thylakoid membrane
and the pigments composition, will lead, respectively, to a reduction of the ФPSII and the

Chapter IV
86
NPQ. Shifts in algal composition will also occur due to selection pressure according to
differences in the species metal tolerances or sensitivities.
FIELD SURVEY
Study site
In order to evaluate in situ metal effects on biofilms, a field sampling was carried
out in the Riou-Mort river (SW Aveyron department, France), a small tributary of the Lot
River located in an industrial basin. This stream is highly contaminated by different
metals from its confluence with the Riou-Viou, a stream carrying seepage from a
former active zinc factory (Morin et al., 2007). Three sites located on the main course
of the Riou-Mort were chosen; one before the confluence with Riou-Viou (S1, Fig. 1)
and two downstream (S2, S3, Fig. 1). Sampling was conducted in June 2008. S1 was
considered a reference site. S2 was situated immediately after the confluence of Riou-
Viou and Riou-Mort streams, so it was expected to receive point-source of metal
pollution from zinc factory seepage (Fig.1). S3 was located further downstream and it
was expected receiving lower metal loads due to upstream dilution and/or retention
(Fig.1).
Figure1 . Localization of sampling sites (S1, S2, S3) on the Riou-Mort river (adapted from Morin
et al., 2007).

Zn effects on biofilms
87
Field sampling
Each site was sampled three times; in the morning at 8:00h, after 6h and after
24h. This strategy allowed accounting for diurnal variability in water chemistry and
biofilm characteristics. Three replicates were collected at each sampling site.
Temperature, conductivity, pH and dissolved oxygen were measured in situ by a multi-
parametric probe (WTW Meters, Weilheim, Germany). Light was also measured in situ
at each sampling site (LI-COR Inc., Lincoln, Nebraska,USA). Light measurements were
performed on submerged biofilm in order to measure light irradiance arriving on biofilm
communities. Water samples were taken for the analysis of phosphate, nitrate,
dissolved organic carbon (DOC), alkalinity and dissolved metal concentrations. All
water samples were immediately filtered (Whatman nylon filters 0.2 µM nylon).
Samples for metal analysis were also acidified with 1% HNO3 (65 % suprapure, Merck).
All samples were transported to the laboratory and stored until analysis.
Biofilm sub-samples were obtained from different cobbles. A surface of 20 cm2
of biofilm was scraped from each sample for metal bioaccumulation analysis and 1.5
cm2 for chl-a analysis. For chl-a fluorescence analysis 1.5 cm2 of biofilm was scarped
and conserved in transparent glass vials filled with 10ml of water from the
corresponding sampling site. Afterwards, chl-a fluorescence analysis were performed
in vivo by Phyto-PAM instrument. All water and biofilm analysis followed the
procedures described in Chapter II.
Field data analysis
In order to integrate the mixture effects of metals present in the Riou-Mort river,
the metal concentrations were used to calculate CCUs (Cumulative Concentration
Units) and used as estimates of potential metal toxicity (Clements et al., 2000). The
CCU is a score based on the sum of the ratios between metal concentrations
measured in surface waters and the corresponding criterion value (US EPA’s National
Recommended Water Quality Criteria, http://www.epa.gov/waterscience/criteria/

Chapter IV
88
wqctable/) used to investigate the responses of aquatic organisms to metals (Clements
et al., 2000). Three categories of CCU were used; CCU below 1 corresponded to
“background” category, CCU between 1 and 2 corresponded to “low” category
indicating low potential toxicity, and CCU between 2 and 10 corresponded to
“moderate” category indicating moderate metal potential toxicity. Above 10 CCU we
added a further high metal category “high”, compared to Guasch et al. (2009) and
Morin et al. (in press) indicating high potential toxicity.
One-way ANOVA was performed to detect significant differences (p<0.05) in the
light irradiance, water physical and chemical parameters, CCUs, metal accumulation in
biofilm and biofilm metrics among sites. Data were transformed to achieve normality.
Tukey’s HSD test was applied to identify significant differences (p<0.05) between sites
(S1, S2 and S3).
Principal Component Analysis (PCA) was employed to explore the ordination of
sampling sites according to physical and chemical characteristics of water and
according to the different biofilm metrics measured. The PCA analyses were done after
standardization and normalization of variables (PRIMER, Clarke and Warwick, 2001).
MICROCOSM APPROACH
Experimental design
The experiment was carried out indoors in recirculating channels. The
microcosm system was made of nine independent Perspex channels (170 cm long, 9
cm wide and 9 cm high each) as those described in Serra et al. (2009a), except the
light intensity that was between 100 and 120 µmolphotons/m2s1. In each channel, two
sizes of glass substrates (8.5 x 12 cm and 8.5 x 2 cm) were placed horizontally to
facilitate biofilm growth. Water was recirculated by means of water pumps and renewed
every 2-3 days in order to minimize water chemistry changes.
Zn effects on biofilms
89
The experiment lasted for ten weeks: the first five weeks were dedicated for
colonization and the next five weeks for metal exposure. Sampling strategy was
planned to monitor the colonization (referred to as colonization samples) and to
compare mature biofilms before metal exposure (referred to as Pre-exposure) and
during metal exposure (referred to as short-term and long-term exposures). Samples
corresponding to the short-term exposure phase were taken after 6, 24 and 72h of
exposure whereas those corresponding to the long-term exposure were taken at weeks
1, 2, 3, 4 and 5.
Pre-exposure samples were analysed at three different moments at the end of
the colonization period: five and three days before exposure and the same day metal
additions started. These samples are labelled as -5 d, -3 d and 0 d, respectively; and
the moment when metal addition started is considered time zero (T0). From this
moment on, the three channels with no metal addition will be referred to as “No-Metal
treatment”; the three with Zn addition as: “Zn treatment” and the three channels with
the addition of Zn and Cd as “Zn+Cd treatment”.
Colonization
In the channels system described above, inocula obtained from natural biofilms
were used to colonize the surface of etched glass substrates during five weeks, after
Serra et al. (2009a). Natural biofilms were sampled from the Llémena River, a small
calcareous tributary of the Ter River (North-East Spain). This river is relatively
unpolluted by metals (Catalan Water Agency) making it possible to avoid communities
already pre-selected for zinc or cadmium tolerance. No metals were added during the
whole colonization period (five weeks).

Chapter IV
90
Metal exposure
After the five weeks of biofilm colonization, the additions of the Zn and Zn+Cd
started (T0). From T0 until week 5, three channels were exposed to a nominal
concentration 400 µgZn/L (Zn treatment), another three to nominal concentrations of
400 µgZn/L plus 20 µgCd/L (Zn+Cd treatment), and the remaining three were not
exposed to metals (No-Metal treatment). Zn and Cd metal solutions were prepared from
ZnCl2 and CdCl2 from Tritisol (Merck, Darmstadt, Germany) with deionised water (18Ω
Q-H2O grade Barnstead Nonopure). Equilibration of the metal with the water was done
in carboys during a period of 24 hours at room temperature, before water renewals.
Water Sampling
During the colonization period, water samples were taken to characterize the
content in dissolved organic carbon (n=3), alkalinity (n= 15), anions (n=39) and cations
(n=20). Physical and chemical parameters (temperature, pH, dissolved oxygen and
conductivity) were measured before and after each water renewal (three times per
week in three different channels each time) during the colonization period (n=114) and
during metal exposure (n=57). Water samples (10 mL) were taken in triplicate to
determine phosphate concentration during the colonization (n=54) and during the metal
exposure (n=27). Water samples (5 mL) were also taken before and after each water
renewal for Zn and Cd analysis during the colonization (n=18) and during the metal
exposure (n=27). All water samples were immediately filtered through 0.2 µM nylon
membrane filters (Whatman). Samples for metal analysis were also acidified with 1%
HNO3 (65% HNO3, Suprapur, Merck, Germany). Samples were stored at 4 ºC.
For detailed information about methodologies applied for water analysis see Chapter II.

Zn effects on biofilms
91
Biofilm sampling
In order to monitor the changes in algal biomass during the colonization period
and to know the growth phase of biofilm communities at the moment when metal
additions began, biofilms were sampled twice a week (total n=49). Each sampling time,
three colonized glass substrata (17cm2) were randomly removed from each channel.
These samples were used for Fo measurements using a Phyto-PAM fluorometer
(version EDF, Walz, Effeltrich, Germany), see PAM measurements paragraph. Since
Phyto-PAM measurement is a non-destructive technique, glass substrata were
returned back to the channels after these fluorescence measurements.
During Pre-exposure (-5, -3 and 0d; n=9 for each treatment), Short-term
exposure (6, 24 and 72h; n=9 for each treatment) and chronic exposure (wk1, wk2,
wk3, wk4 and wk5; n=15 for each treatment) three glass substrates (17cm2) were also
removed at random from each treatment and fluorescence parameters measured.
Specifically, following measurements were done: 1) the fluorescence of the different
algal classes composing the biofilm communities, 2) the Fo as indirect measure of algal
biomass and 3) ФPSII, Ф’PSII, qP, qN and NPQ (see PAM measurements).
A total number of 81 biofilm samples were taken for chl-a concentration and
also used to calculate the carotenoids ratio (430:665). During the Pre-exposure (at
days -5,-3 and 0d and three samples per treatment), during Short-term exposure (at
hours 6, 24 and 72h and the same number of samples per treatment) and during Long-
term exposure (at weeks W1, W3, W5 and the same number of samples). Samples for
chl-a analysis were obtained after scraping biofilms from a small substratum (17cm2)
and were kept in polypropylene vials at -4ºC until further analysis (see biofilm analysis).
A total of 72 samples were taken for bioaccumulation analyses (Cd.B: the Cd
content per dry weight in µgCd/gDW, Zn.B: the Zn content per dry weight in
µgZn/gDW). Each sample corresponded to 51 cm2 of colonized substrata (half of a big

Chapter IV
92
substratum). The biofilm was scraped and stored at -80ºC until their laboratory analysis
(see biofilm analysis). Biofilms were taken in triplicate twice (at days -5 and 0) per
treatment during the Pre-exposure; three times (at 6, 24 and 72h) per treatment during
the Short-term exposure; and three more times (at wk1, wk3 and wk5) per treatment
during Long-term exposure. Substrata were always randomly chosen.
For detailed information about methodologies applied for biofilm analysis see
Chapter II.
Data analysis of microcosm experiment
Changes in algal biomass (Fo) throughout the ten weeks of the experiment
(from the beginning of colonization until the end of the metal exposure period) were
adjusted to a logistic model in order to compare the growth curves between channels
throughout the different stages of growth (including the periods of colonization and
metal exposure). Data from the three channels assigned to each different treatment
were used to fit the corresponding growth curve. Data were fitted to a logistic model
using the SIGMAPLOT software (Version 8.0).
−−+=
b
xox
ky
exp1
The 1/b parameter represents the growth rate ( r ), the xo parameter represents the
time when maximal community growth rate is achieved and the k parameter represents
the carrying capacity. In our experiment the r parameter was used to compare the
growth rates during the colonization period, the xo parameter to evaluate when biofilms
reached the maximal growth rate and the k parameter to evaluate the carrying capacity
(Romaní, 2010).

Zn effects on biofilms
93
An ANOVA of repeated measures was applied to examine the temporal
tendency of each biological parameter (chl-a, 430:665, Zn.B, Cd.B, Fo(Bl), Fo(Gr),
Fo(Br), ФPSII, Ф’PSII, qP, qN and NPQ) during the Pre exposure, the Short-term
exposure and the Long-term exposure periods. The post-hoc Tukey’s HSD test was
applied to check if tendencies were different between treatments. ANOVA analyses
were realized by SPSS software (Version 17.0).
Principal Component Analysis (PCA) was used to explore the ordination of
samples according to the different biofilm variables measured. The data set included
photosynthetic parameters, structural parameters (pigment analysis, Fo and the
fluorescence of each algal class) and bio-accumulation values. A preliminary PCA was
done using all sampling times in order to check the supposed difference in responses
during short and long-term exposures.
PCA analyses were done after elimination of auto-correlated variables
(R2>0.8), and standardization and normalization of remaining variables (chl-a, 430:665,
Zn.B, Cd.B, Fo(Bl), Fo(Gr), Fo(Br), ФPSII, Ф’PSII, qP, qN and NPQ) (PRIMER, Clarke
and Warwich, 2001).
RESULTS
Field sampling
Physical and chemical parameters are summarized in ST1 (Supplementary
Table 1). Detection limit for total metals dissolved in water (Al, Fe, Zn, Cd, Ni, Cu and
Pb) was <0.001 µg/L.Cu and Pb concentrations were below detection limit in all cases.
Accordingly, these metals were considered of low significance and were not included in
the multivariate analysis. Based on the Concentation Cumulative Units (CCUs)
differences were observed between sites. The highest values were obtained in S2 and
S3 sites with a “high” potential toxicity level mainly attributed to Cd (50%), Zn (30%)

Chapter IV
94
and Fe (14%). CCUs were lower in S1 with “moderate” potential toxicity mainly
attributed to Fe (86%) and Al (17%). Light irradiance reaching biofilms at S1 was
615±684, while at S2 was 768±721 and at S3 was 1656±45 (AVG±SD; n=3), being
comparable between sites (p>0.05; F=1.747).
PCA analysis of water physical and chemical parameters showed the ordination
of sampling points within the first two axes (Fig. 2a). The first axis explained 78.9% of
variance and separated the most polluted sites (S2 and S3) with highest Zn, Cd and
NO32- concentrations in water from S1 with a highest alkalinity, conductivity and Fe and
SO42- concentrations in water. The PCA second axis explained a smaller part of total
variation (12.2%), and separated S3 from S1 and S2 sites (Fig. 2a). In fact, PO43- and
Cl- concentrations were higher at S3 than at the other sites (Fig.2a).
Metal accumulation in biofilms and biofilm metrics (chl-a, carotenoids ratio-
430:665, ΦPSII, Φ’PSII and NPQ) measured during biofilm field monitoring are shown in
sumplementary tables 2 and 3 (Annex Chapter IV), respectively. PCA analysis of these
data showed the ordination of sampling points within the first two axes (Fig. 2b). The
first axis explained the 85.3% of the variance and separated the most polluted sites (S2
and S3) with highest metal accumulation (Zn, Cd, Pb, Ni and Cu) and a higher
carotenoids ratio (430:665) from biofilms at S1 site. In contrast, biofilms from S1 had
higher chl-a concentration and slightly higher ΦPSII than biofilms form polluted sites (S2
and S3). The second axis accounted only for a 5.8% of total variance, showing that in
occasional samplings at S1 and S2, biofilm accumulated higher amounts of Fe and Al
(Fig.2) which was negatively correlated with chl-a fluorescence parameters (NPQ,
ΦPSII and Φ’PSII).

Zn effects on biofilms
95
Figure 2. a) Principal Components Analysis (PCA) based on the physical and chemical
parameters of Riou-Mort river water measured at each site (S1, S2 and S3) during field
sampling. The acronym of each parameter is defined in ST1 (Annexe Chapter IV). b) Principal
Components Analysis (PCA) based on biofilm metal accumulation and biofilm metrics measured
at each site of Riou-Mort river (S1, S2 and S3) during field sampling. The acronym of each
parameter is defined in ST2 and ST3 (Annexe Chapter IV).
-1.5 1.5
-1.0
1.0
Cl-
NO2-
NO3-SO4 -
Na+ K+Ca2+
Mg+
PO4-
Al.W
Fe.W
Ni.W
Zn.WCd.W
DOC
AlkCond
TºCpH
Oxy
Axis 1 (78.9%)
Axi
s 2
(1
2.2
%)
-1.5 1.0
-1.0
1.0
NPQ
Chl-a
430:665
Ni.BCu.B
Pb.B
Cd.BZn.B
Al.B Fe.B
Axi
s 2
(5.2
%)
Axis 2 (85.2%)
Φ’PSII ΦPSII
a)
b)
-1.5 1.0
SO42-
PO43-
NO32-
NO2-

Chapter IV
96
Microcosm study
Physical and chemical characteristics of the water from the artificial
channels system
Major anions and cations, as well alkalinity and DOC concentrations are
summarized in Table 1. Physical and chemical conditions remained stable during the
colonization and metal exposure periods and were similar between treatments (Table
2). Metal concentration in the No-Metal treatment was always <10 µg/L (Table 2). Zn
concentration was similar in the Zn and Zn+Cd treatments. Zn concentration in the Zn
treatment was 21 % below nominal concentration (400 µgZn/L), Zn concentration in the
Zn+Cd treatment was 20 % below nominal concentration (400 µgZn/L) and Cd
concentration in the Zn+Cd treatment was 28% below nominal concentration (20
µgCd/L).
Table 1. Chemical characteristics of water channels. Average (AVG) and standard error (SE) of
water samples (n) taken throughout the duration of the microcosm experiment.
Table 2. Summary of dissolved oxygen (Oxy), water temperature (Temp); conductivity (Cond);
phosphate (PO43-); zinc (Zn) and cadmium (Cd) concentrations during the colonization and
metal exposure periods for each treatment (No-Metal, Zn and Zn+Cd). Each value corresponds
to the average (AVG) of before and after water renewals and ± standard error (SE). b.d.l.: below
detection limit.
SO42- Cl- K+ Na+ Ca2+ Mg2+
Alkalinity NO3- NH4
+ DOC
(mg.L-1) (mg.L-1) (mg.L-1) (mg.L-1) (mg.L-1) (mg.L-1) (mEq.L-1) (mg.L-1) (mg.L-1) (mg.L-1)
AVG 73.33 86.13 3.34 24.88 41.4 8.06 1.47 4,353 0.05 4.92SE ±8.75 ±3.98 ±0.11 ±0.94 ±1.75 ±0.30 ±0.03 ±0.204 ±0.03 ±0.95n 39 39 20 20 20 20 14 20 20 3
Colonization Metal Exposure
AVG SE n AVG SE n AVG SE n AVG SE nOxy. (mg·L-1) 8.82 0.04 114 9.44 0.05 57 9.08 0.03 57 9.15 0.04 57Temp. (ºC) 19.29 0.14 114 18.55 0.14 57 18.40 0.15 57 18.41 0.02 57pH 8.36 0.02 114 8.61 0.03 57 8.52 0.02 57 8.53 0.02 57Cond. (µS·cm-1) 326.72 1.40 114 310.72 3.62 57 341.72 2.58 57 341.51 2.66 57PO4
-3(µg·L-1) 29.18 2.59 54 23.12 2.08 27 28.81 3.66 27 29.20 3.26 27
Zn (µg·L-1) 8.64 0.76 18 4.88 0.75 27 317.53 24.94 27 321.44 22.08 27Cd (µg·L-1) bdl 18 bdl 27 bdl 27 14.30 1.09 27
No-Metal Treatment Zn Treatment Zn+Cd Treatment
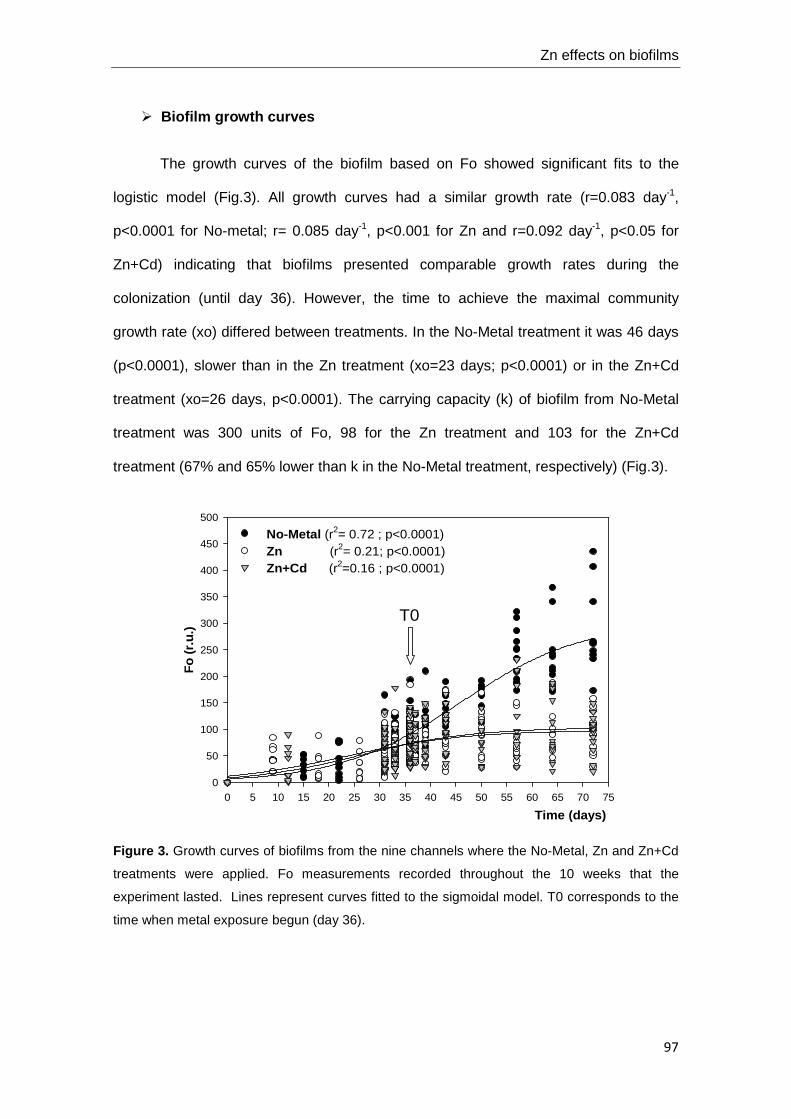
Zn effects on biofilms
97
Biofilm growth curves
The growth curves of the biofilm based on Fo showed significant fits to the
logistic model (Fig.3). All growth curves had a similar growth rate (r=0.083 day-1,
p<0.0001 for No-metal; r= 0.085 day-1, p<0.001 for Zn and r=0.092 day-1, p<0.05 for
Zn+Cd) indicating that biofilms presented comparable growth rates during the
colonization (until day 36). However, the time to achieve the maximal community
growth rate (xo) differed between treatments. In the No-Metal treatment it was 46 days
(p<0.0001), slower than in the Zn treatment (xo=23 days; p<0.0001) or in the Zn+Cd
treatment (xo=26 days, p<0.0001). The carrying capacity (k) of biofilm from No-Metal
treatment was 300 units of Fo, 98 for the Zn treatment and 103 for the Zn+Cd
treatment (67% and 65% lower than k in the No-Metal treatment, respectively) (Fig.3).
Figure 3. Growth curves of biofilms from the nine channels where the No-Metal, Zn and Zn+Cd
treatments were applied. Fo measurements recorded throughout the 10 weeks that the
experiment lasted. Lines represent curves fitted to the sigmoidal model. T0 corresponds to the
time when metal exposure begun (day 36).
Time (days)0 5 10 15 20 25 30 35 40 45 50 55 60 65 70 75
Fo
(r.u
.)
0
50
100
150
200
250
300
350
400
450
500
No-Metal (r2= 0.72 ; p<0.0001)Zn (r2= 0.21; p<0.0001)Zn+Cd (r2=0.16 ; p<0.0001)
T0
Time (days)0 5 10 15 20 25 30 35 40 45 50 55 60 65 70 75
Fo
(r.u
.)
0
50
100
150
200
250
300
350
400
450
500
No-Metal (r2= 0.72 ; p<0.0001)Zn (r2= 0.21; p<0.0001)Zn+Cd (r2=0.16 ; p<0.0001)
T0

Chapter IV
98
Biofilm characterization
Chlorophyll-a concentration. During Pre-exposure and the first days of
exposure (Short-term exposure period), chl-a concentration was low and remained
stable in all treatments (Table 3). The carotenoids ratio (430:665) was also similar
between treatments (Table 3). However, after longer exposure (Long-term exposure
period), chl-a concentration and the carotenoids ratio showed significant differences
between treatments (ANOVA of repeated measures; F= 52.53, p<0.001 and F= 11.96,
p<0.001, respectively). Chl-a increased progressively over time in the No-Metal
treatment, reaching values 3 times higher than those measured in the Zn and Zn+Cd
treatments (Table 3). Ch-a was significantly correlated to Fo measurements during
biofilm growth (R2=0.86; p<0.05). The carotenoids ratio showed a trend to decrease in
the No-Metal treatment, while it remained stable in the Zn+Cd treatment and increased
in the Zn treatment as well, showing significant differences between the No-Metal and
the Zn treatments (Table 3).
Bioaccumulation. During Pre-exposure, biofilm metal contents remained low
and stable (Table 3). Metal bioaccumulation increased over time in the biofilms
exposed to metals. A positive trend was observed for Zn during both Short and Long-
term exposure periods in both metal treatments (ANOVA of repeated measures;
F=101.14, p<0.05 and F= 45. 45, p<0.05, respectively) reaching in both cases values
between 1 and 2 orders of magnitude higher than controls (Table 3). Cd
bioaccumulation was also observed in the Zn+Cd treatment, both during Short and
Long-term exposures (ANOVA of repeated measures; F=57.55, p<0.0001 and F=
36.88, p<0.0001, respectively), reaching up to 74 µgCd/gDW (Table 3).
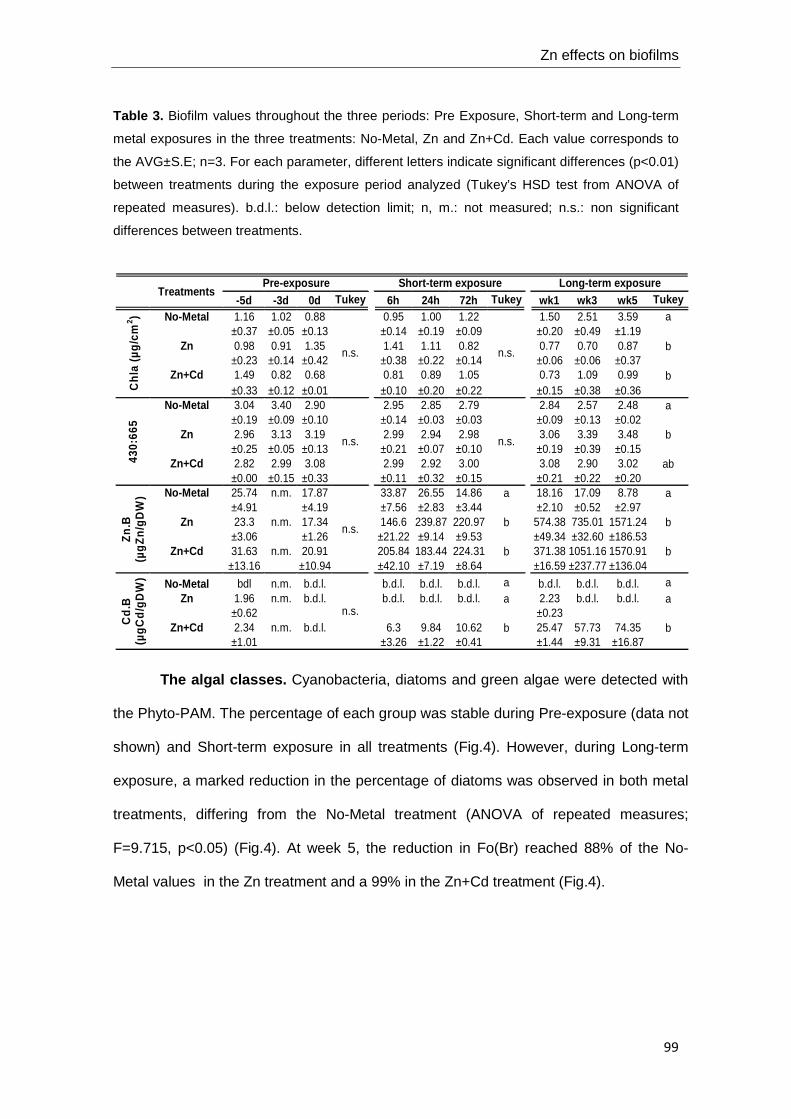
Zn effects on biofilms
99
Table 3. Biofilm values throughout the three periods: Pre Exposure, Short-term and Long-term
metal exposures in the three treatments: No-Metal, Zn and Zn+Cd. Each value corresponds to
the AVG±S.E; n=3. For each parameter, different letters indicate significant differences (p<0.01)
between treatments during the exposure period analyzed (Tukey’s HSD test from ANOVA of
repeated measures). b.d.l.: below detection limit; n, m.: not measured; n.s.: non significant
differences between treatments.
The algal classes. Cyanobacteria, diatoms and green algae were detected with
the Phyto-PAM. The percentage of each group was stable during Pre-exposure (data not
shown) and Short-term exposure in all treatments (Fig.4). However, during Long-term
exposure, a marked reduction in the percentage of diatoms was observed in both metal
treatments, differing from the No-Metal treatment (ANOVA of repeated measures;
F=9.715, p<0.05) (Fig.4). At week 5, the reduction in Fo(Br) reached 88% of the No-
Metal values in the Zn treatment and a 99% in the Zn+Cd treatment (Fig.4).
-5d -3d 0d Tukey test
6h 24h 72h Tukey test
wk1 wk3 wk5 Tukey testNo-Metal 1.16 1.02 0.88 0.95 1.00 1.22 1.50 2.51 3.59 a
±0.37 ±0.05 ±0.13 ±0.14 ±0.19 ±0.09 ±0.20 ±0.49 ±1.19Zn 0.98 0.91 1.35 1.41 1.11 0.82 0.77 0.70 0.87 b
±0.23 ±0.14 ±0.42 ±0.38 ±0.22 ±0.14 ±0.06 ±0.06 ±0.37Zn+Cd 1.49 0.82 0.68 0.81 0.89 1.05 0.73 1.09 0.99 b
±0.33 ±0.12 ±0.01 ±0.10 ±0.20 ±0.22 ±0.15 ±0.38 ±0.36No-Metal 3.04 3.40 2.90 2.95 2.85 2.79 2.84 2.57 2.48 a
±0.19 ±0.09 ±0.10 ±0.14 ±0.03 ±0.03 ±0.09 ±0.13 ±0.02Zn 2.96 3.13 3.19 2.99 2.94 2.98 3.06 3.39 3.48 b
±0.25 ±0.05 ±0.13 ±0.21 ±0.07 ±0.10 ±0.19 ±0.39 ±0.15Zn+Cd 2.82 2.99 3.08 2.99 2.92 3.00 3.08 2.90 3.02 ab
±0.00 ±0.15 ±0.33 ±0.11 ±0.32 ±0.15 ±0.21 ±0.22 ±0.20No-Metal 25.74 n.m. 17.87 33.87 26.55 14.86 a 18.16 17.09 8.78 a
±4.91 ±4.19 ±7.56 ±2.83 ±3.44 ±2.10 ±0.52 ±2.97Zn 23.3 n.m. 17.34 146.6 239.87 220.97 b 574.38 735.01 1571.24 b
±3.06 ±1.26 ±21.22 ±9.14 ±9.53 ±49.34 ±32.60 ±186.53Zn+Cd 31.63 n.m. 20.91 205.84 183.44 224.31 b 371.38 1051.16 1570.91 b
±13.16 ±10.94 ±42.10 ±7.19 ±8.64 ±16.59 ±237.77 ±136.04
No-Metal bdl n.m. b.d.l. b.d.l. b.d.l. b.d.l. a b.d.l. b.d.l. b.d.l. aZn 1.96 n.m. b.d.l. b.d.l. b.d.l. b.d.l. a 2.23 b.d.l. b.d.l. a
±0.62 ±0.23Zn+Cd 2.34 n.m. b.d.l. 6.3 9.84 10.62 b 25.47 57.73 74.35 b
±1.01 ±3.26 ±1.22 ±0.41 ±1.44 ±9.31 ±16.87
430:
665
n.s. n.s.
Zn.
B
(µgZ
n/gD
W)
n.s.
Cd.
B
(µgC
d/gD
W)
n.s.
TreatmentsPre-exposure Short-term exposure Long-term exposure
Chl
a (µ
g/cm
2 )
n.s. n.s.

Chapter IV
100
Figure 4. Percentage of fluorescence of each class: cyanobacteria (Fo(Bl)), green algae (Fo(Gr))
and diatoms (Fo(Br)) from biofilms of No-Metal, Zn and Zn+Cd treatments in each sampling time
during Short and Long-term metal exposures (AVG; n=3).
Photosynthetic parameters . All photosynthetic parameters remained stable and
were similar in the different channels before metal exposure (Pre-exposure). The qP and
qN were stable over time showing similar values in all treatments. Ф’PSII ranged between
0.1 ± 0.01 and 0.2 ± 0.02 (AVG±SE; n=3), ФPSII between 0.41 ± 0.02 and 0.54 ± 0.05
and NPQ between 0.53 ± 0.03 and 1.02 ± 0.13 in the No-Metal treatment, and were
differently affected by metal exposure.
% F
o of
eac
h al
gal c
lass
% F
o of
eac
h a
lgal
cla
ss
% Fo(Gr) % Fo(Br)
% Fo(Br) % Fo(Bl)
Short–term exp.
% F
o of
eac
h al
gal c
lass
Long-term exp.
6h 24h 72h . W1 W2 W3 W4 W50
20
40
60
80
100No - Metal
6h 24h 72h . W1 W2 W3 W4 W50
20
40
60
80
100Zn
6h 24h 72h . W1 W2 W3 W4 W50
20
40
60
80
100Zn+Cd
% F
o of
eac
h al
gal c
lass
% F
o of
eac
h a
lgal
cla
ss
% Fo(Gr) % Fo(Br)
% Fo(Br) % Fo(Bl)
Short–term exp.
% F
o of
eac
h al
gal c
lass
Long-term exp.
6h 24h 72h . W1 W2 W3 W4 W50
20
40
60
80
100No - Metal
6h 24h 72h . W1 W2 W3 W4 W50
20
40
60
80
100Zn
6h 24h 72h . W1 W2 W3 W4 W50
20
40
60
80
100Zn+Cd

Zn effects on biofilms
101
Short-term exposure. The Ф’PSII parameter was inhibited in both metal treatments
showing significant differences with the No-Metal treatment and also between them
(ANOVA of repeated measures: F=37.157, p<0.001). It was 23% below controls in the
Zn treatment and 8% below controls in the Zn+Cd treatment (Fig.5). Metal exposure
effects on NPQ were less consistent, showing a significant difference between the No-
Metal and the Zn+Cd treatments after 6h of exposure (ANOVA one way: F=13.22,
p<0.05) as it is shown in (Fig.5) in percentage of controls.
Long-term exposure. ФPSII decreased in both metal treatments (ANOVA of repeated
measures; F= 22.35, p<0.01) reaching values up to 38% below controls (Fig.5). Ф’PSII
slightly decreased over time in biofilms from No-Metal treatment and was not affected
by metal exposure (Ф’PSII from metal treatments was not significantly different from the
No-Metal treatment). Effects of metal exposure on NPQ were significant (ANOVA of
repeated measures; F=26.57, p<0.01), reaching, in both metal treatments, values up to
74% below controls (Fig.5).
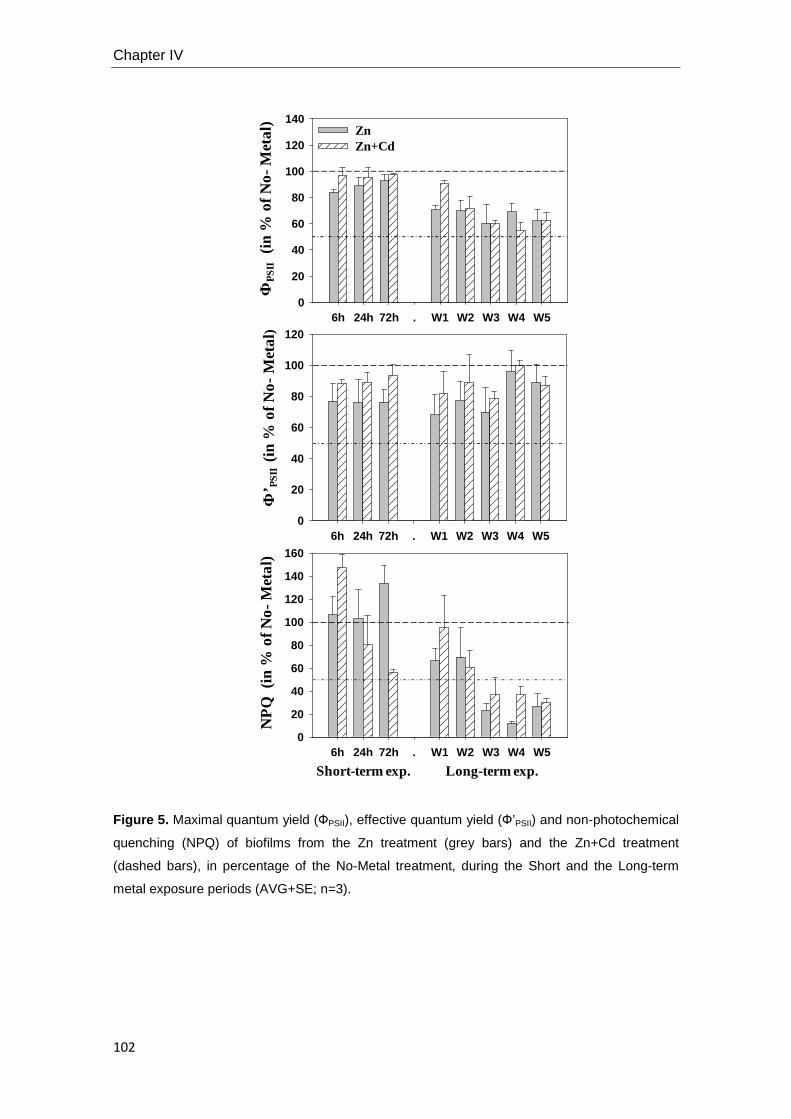
Chapter IV
102
Figure 5. Maximal quantum yield (ФPSII), effective quantum yield (Ф’PSII) and non-photochemical
quenching (NPQ) of biofilms from the Zn treatment (grey bars) and the Zn+Cd treatment
(dashed bars), in percentage of the No-Metal treatment, during the Short and the Long-term
metal exposure periods (AVG+SE; n=3).
ФP
SII
(in
% o
f No
-Met
al)
6h 24h 72h . W1 W2 W3 W4 W50
20
40
60
80
100
120
140ZnZn+Cd
Ф’ P
SII
(in
% o
f No
-M
eta
l)
6h 24h 72h . W1 W2 W3 W4 W50
20
40
60
80
100
120
Short-term exp. Long-term exp.
NP
Q
(in %
of N
o-M
eta
l)
6h 24h 72h . W1 W2 W3 W4 W50
20
40
60
80
100
120
140
160
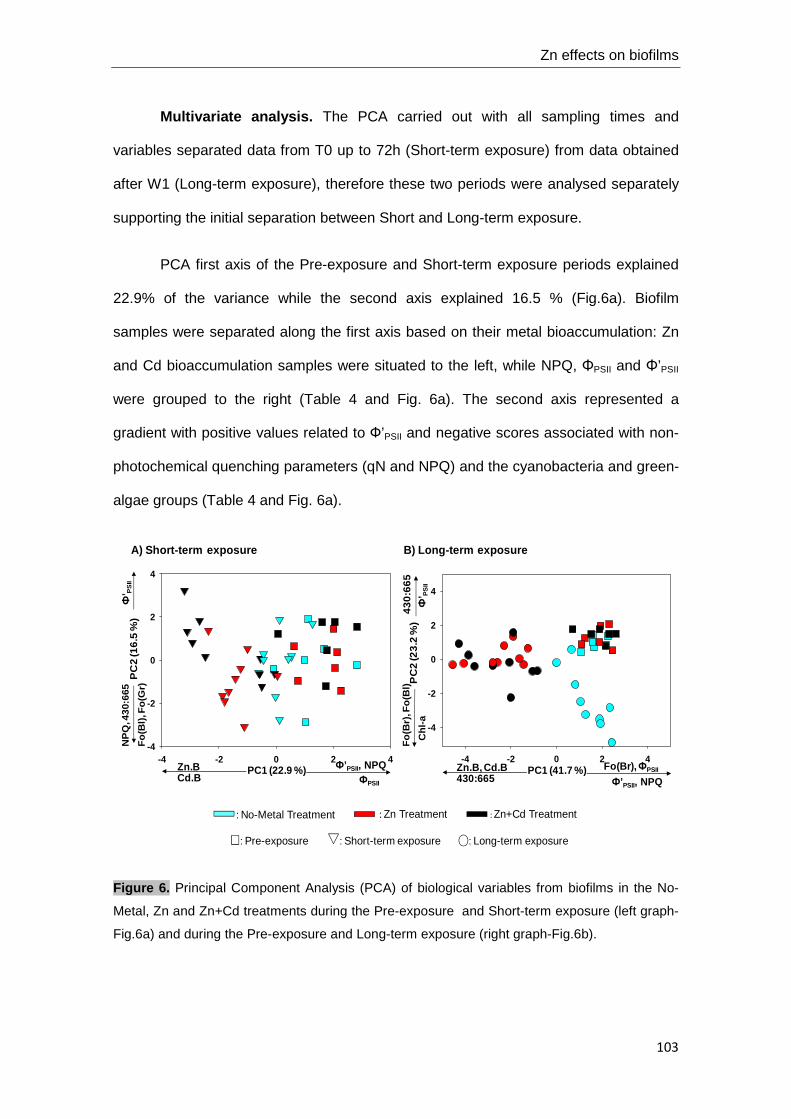
Zn effects on biofilms
103
Multivariate analysis. The PCA carried out with all sampling times and
variables separated data from T0 up to 72h (Short-term exposure) from data obtained
after W1 (Long-term exposure), therefore these two periods were analysed separately
supporting the initial separation between Short and Long-term exposure.
PCA first axis of the Pre-exposure and Short-term exposure periods explained
22.9% of the variance while the second axis explained 16.5 % (Fig.6a). Biofilm
samples were separated along the first axis based on their metal bioaccumulation: Zn
and Cd bioaccumulation samples were situated to the left, while NPQ, ΦPSII and Φ’PSII
were grouped to the right (Table 4 and Fig. 6a). The second axis represented a
gradient with positive values related to Ф’PSII and negative scores associated with non-
photochemical quenching parameters (qN and NPQ) and the cyanobacteria and green-
algae groups (Table 4 and Fig. 6a).
Figure 6. Principal Component Analysis (PCA) of biological variables from biofilms in the No-
Metal, Zn and Zn+Cd treatments during the Pre-exposure and Short-term exposure (left graph-
Fig.6a) and during the Pre-exposure and Long-term exposure (right graph-Fig.6b).
Ф’ P
SII
: Zn+Cd Treatment: Zn Treatment: No-Metal Treatment
Ф’PSII, NPQZn.BCd.B ФPSII
Fo(Br), ФPSIIZn.B, Cd.B430:665 Ф’PSII, NPQ
43
0:6
65
Chl
-aФ
’ PS
II
: Pre-exposure : Short-term exposure : Long-term exposure
-4 -2 0 2 4-4
-2
0
2
4
-4 -2 0 2 4
-4
-2
0
2
4
PC1 (41.7 %)
PC
2 (1
6.5
%)
Fo
(Bl),
Fo
(Gr)
NP
Q, 4
30:6
65
PC
2 (2
3.2
%)
Fo
(Br)
, Fo
(Bl)
A) Short-term exposure B) Long-term exposure
PC1 (22.9 %)

Chapter IV
104
Table 4. Axis loadings of biological variables for principle components analysis (PCA) of the
biological correlation matrix (Short and Long-term exposures). Zn.B: the Zn content per dry
weight (µgZn/gDW), Cd.B: the Cd content per dry weight (µgCd/gDW).
The first axis of the PCA carried out with data from the Pre-exposure and Long-
term exposure periods explained a 41.7% of the variance (Fig.6b). This first axis was
related with metal toxicity. Samples with high Zn and Cd bioaccumulation values were
palced on the left (see Table 4 and Fig. 6b) and those with low NPQ, ФPSII and Fo(Br)
values on the right (see Table 4 and Fig. 6b). The second axis explained a 23.2% of
the variance and was related with the maturity of the community, thus positively
associated with the chl-a content and the relative abundance of green algae (Fo(Gr))
and cyanobacteria (Fo(Bl)), and negatively with the degradation state of the pigments
(430:665) and the effective quantum yield (Ф’PSII).
First axis Second axis First axis Second axis
Eigenvalues 2.74 1.99 5 2.78
% Variation 22.9 16.5 41.7 23.2
Chl-a 0.109 -0.034 0.201 -0.451
430:665 0.043 -0.338 -0.235 0.322
qP 0.128 -0.067 0.107 -0.132
qN 0.177 -0.534 0.236 -0.104
NPQ 0.306 -0.359 0.358 -0.176ΦPSII 0.461 -0.036 0.409 0.153
Φ 'PSII 0.376 0.424 0.331 0.266
Fo(Bl) -0.262 -0.339 -0.165 -0.515
Fo(Gr) -0.286 -0.301 -0.162 -0.513
Fo(Br) 0.183 -0.222 0.378 -0.09
Zn.B -0.464 -0.014 -0.415 0.049
Cd.B -0.302 0.172 -0.252 -0.016
PCA loadings
PCA: Short-term exposure PCA: Long-term exposure
Biological variable
Eigenvectors PC1
Eigenvectors PC2
Eigenvectors PC1
Eigenvectors PC2
Zn effects on biofilms
105
DISCUSSION
Field sampling
The field sampling conducted in the Riou-Mort river allowed us to characterize the
three sites in terms of water physical and chemical variables, metal accumulation and
some biofilm metrics (e.g. chl-a concentration). According to CCUs results, S2 and S3
sites had a high metal pollution, mainly attributed to Zn and Cd. Metal pollution was
comparable between S2 and S3 sites, probably due to groundwater inputs before S3
(Coynel et al. 2007). However, S1 had a moderated metal pollution, mainly attributed to
Fe and Al probably due to the geochemical background of the stream (gres and lutite).
S1, the reference site, had also a slightly higher concentration of DOC than
downstream sites (S2 and S3), probably it could be explained due to the depuration
effect of a water treatment plant (WWTP) between S1 and S2 sites. Accordingly, S1
was not a pertinent reference site, highlighting the difficulty in finding good reference
sites in polluted areas (Guasch et al., in press; Hurlbert, 1984). Nevertheless, S1
differed from highly polluted sites (S2 and S3) which accumulated high amounts of Zn
and Cd, had a lower algal biomass (chl-a) and a slightly lower photosynthetic capacity
(ΦPSII) than biofilms from S1, indicating that Zn and Cd accumulation caused structural
and functional damaging effects on biofilms. A reduction of algal biomass due to
chronically metal exposure has also been reported in Barranguet et al. (2002). On the
other hand, ФPSII alterations may indicate that the structure of the PSII complex is
indeed damaged by metals (Rosenqvist and van Kooten, 2003). The observed
decrease in ФPSII could be linked with a reduction of antennae pigments (Lazar, 1999)
due to the observed increase of degraded pigments (430:665). In contrast, no metal
effects on NPQ and Φ’PSII of biofilm from high polluted sites (S2 and S3) were detected.
We hypothesize that these functional processes, which are crucial for biofilm fitness
and survive, were maintained in biofilms from high metal polluted sites by two
Chapter IV
106
processes: (1) a physiological acclimatation; e.g. by a reconstruction of the
photosystem and (2) adaptative processes; e.g. by replacing sensitive species for
tolerant ones (Foster, 1982; Deniseger et al., 1986; Lindstrom and Rorslett, 1991). In
the case of diatoms, this adaptative process has been shown by previous studies along
the Riou-Mort river (Gold et al. 2003b, Morin et al. 2008, Duong et al 2010): at least,
strong community changes were demonstrated. We conclude that the observed metal
effects in the Riou-Mort river could be mainly attributed to the co-occurrence of Zn+Cd
pollution. However, experimental approaches in controlled conditions are needed to
corroborated cause-effect relationship and evaluate separately the contribution of Zn,
the metal bioaccumulated at higher proportions, to the observed Zn plus Cd toxicity on
biofilms. These field observations also point out the relevance to evaluate the effects of
Fe on biofilms due to its high occurrence in metal polluted rivers.
Microcosm study
In agreement with our hypothesis, under controlled conditions metal pollution
(Zn and Zn+Cd) at realistic concentrations and exposure time (hours to weeks) led to a
variety of biofilm community alterations including changes in the kinetics of algal
growth, metal bioaccumulation, chl-a concentration, community composition, and
different PSII related fluorescence parameters(ФPSII, Ф’PSII and NPQ) that are discussed
below.
The kinetics of growth summarizes the integrated response of biofilms
throughout the entire metal exposure period. The effect of metals on the growth curves
was very marked and no differences were observed between metal treatments (Zn or
Zn+Cd). In contrast to Non-exposed biofilms that reached the highest biomass at the
end of the experiment, algal growth in metal-exposed biofilms was clearly reaching
plateau values up to three times lower than non exposed biofilms (considered as
controls). In comparison with controls, plateau values were around 66-67% lower in
both metal treatments indicating a lower carrying capacity, which is in agreement with

Zn effects on biofilms
107
the chl-a difference observed at the end of the experiment (63-65% below controls).
Serra et al. (2009) also found that biofilms exposed to Cu reached a plateau state (in
terms of Fo) before controls. The observed growth reduction may have marked effects
on the fluvial ecosystem due to their role in the uptake or retention of inorganic and
organic nutrients (Fischer et al., 2002; Romaní et al., 2004) affecting self-depuration
processes (Cazelles et al., 1991), and transfer of energy to higher trophic levels (Hall
and Meyer, 1998; Schmitt et al., 1995; Sheldon and Walker, 1997). On the other hand,
biofilms exposed to Zn and Zn + Cd bioaccumulated these metals reaching values 1-2
orders of magnitude higher than the non metal-exposed communities. Metal
bioaccumulation can have adverse effects for fish and invertebrates that prey on it due
to biomagnification (Rhea et al., 2006; Farag et al., 2007; Hill et al., 2010).
Zn and Cd effects depending on the time of exposure
After short-term metal exposure, the effects observed were of low magnitude,
always below 30% in comparison to controls, and this was attributed to the relatively
low metal exposure conditions simulated. NPQ, ФPSII and Ф’PSII, decreased as metal
bioaccumulation increased (Fig.7a and Table 6) but these changes explained a small
portion of total variance based on the PCA analysis (22.9% of the variance). Zn
bioaccumulation was 8 times higher in metal exposed biofilms than in the non-exposed
ones, causing, in agreement with our hypothesis, mainly functional community
responses. The Ф’PSII decreased (23% and 8% in the Zn and Zn+Cd treatments,
respectively) indicated an inhibition in the electron transport flow during the light-
dependent photosynthesis activity (Juneau et al., 2007). This effect could also be
attributed to the in vivo substitution of magnesium, the central atom of chlorophyll, by
heavy metals leading to a breakdown in photosynthesis (Küpper et al., 1998,
Zvezdanovic and Markovic, 2009). This damage mechanism, reported in heavy metal
stressed plants, was not directly addressed in this investigation. NPQ response was
Chapter IV
108
less consistent. Although a tendency to decrease with exposure is indicated by the
PCA analyses, a significant increase was observed after 6h of exposure in the Zn+Cd
treatment (Fig.3). Niyogi (2000) described an increase in the NPQ as a mechanism to
avoid damage on the photosynthetic apparatus produced by an excess of light
reaching the PSII which cannot be used in the photosynthetic process. Similar NPQ
responses have been observed in bioassays with algal monocultures (Perales-Vela et
al., 2007) and cyanobacteria (Juneau et al., 2001) exposed during few hours to metals.
The maximal photosynthetic activity (ΦPSII) showed a similar pattern than Ф’PSII (Fig. 7),
indicating that structural damage was already occurring during the first hours of metal
exposure.
Other studies indicate that higher Zn concentrations (450 µgZn/L to 40 mgZn/L)
are required to affect biofilm photosynthesis (50% inhibitions) after short-term exposure
(Admiraal et al., 1999; Blanck et al., 2003; Guasch et al., 2003). The structure of biofilm
could play an important protective role against Zn toxicity (Guasch et al., 2010a) since
metal toxicity is linked to metal penetration into cells (Escher et al., 2002) and biofilm
thickness reduces Zn and Cd diffusion (Ivorra et al., 2000; Duong et al. ,2010). Since
our biofilm was exposed after 4 weeks of colonization, a slow rate of diffusion into the
biofilm matrix was expected during the first hours.
During long-term metal exposures, clear effects were observed on metal
exposed biofilms: algal growth was deeply inhibited (above 50% of controls),
community composition was altered and most chl-a fluorescence parameters remained
affected. In agreement with our expectations, these marked effects were linked to a
higher metal bioaccumulation, result of a longer time of metal exposure. According to
PCA analysis, metal exposure effects account for a high portion (around 42%) of the
total variance (Fig.7b and Table 7). Zn bioaccumulation increased progressively over
time, reaching values 1-2 orders of magnitude higher than the non metal-exposed
Zn effects on biofilms
109
communities, within the range found in Zn polluted rivers (Behra et al., 2002; Morin et
al., 2008, Hill et al., 2010). Biofilm endpoints linked to Zn and Cd bioaccumulation were
NPQ, Fo(Br) and ΦPSII. In NPQ inhibition was very marked (above 50% controls in both
metal treatments), indicating that this non-photochemical quenching mechanism did not
take place. It supports the hypothesis that metal toxicity caused structural effects, and
these effects included the damage of pigments where NPQ processes occur. Ricart et
al. (2010a) also found a drastic reduction of this parameter when biofilms were
exposed during a long period of time to triclosan and they also attributed these findings
to an alteration of the photosynthetic pigments. In our study the NPQ was even more
sensitive than qN to metal stress, so it can, therefore be considered the most sensitive
photosynthesis-related parameter evaluated. This high sensitivity of NPQ versus qN
was reported recently in a review work about the use of PAM fluorometry to assess
herbicides toxicity on monocultures (Juneau et al., 2007). In contrast, slight effects
were observed in the ФPSII. The reduction of the ФPSII indicates that the structure of the
PSII complex was indeed damaged by metals. The maximal photosynthetic capacity is
a parameter extremely sensitive to alterations of the PSII/LHCII complex in the
thylakoids (Rosenqvist and van Kooten, 2003). Lazar (1999) also suggested that a
destruction of the antennae pigments may be partially responsible for the reduction of
ФPSII. An increase in the carotenoids ratio (430:665) was also observed (mainly in the
Zn treatment), supporting the occurrence of structural damage (Martínez-Abaigar and
Núñez-Olivera, 1998). Photosynthesis efficiency was slightly affected after long-term
metal exposures following the same pattern observed during the first hours of
exposure. Ф’PSII remained inhibited, indicating a persistent alteration on the electron
transport chain when a metal exposure takes place over a long period. However,
photosynthesis inhibition decreased over time reaching values similar to controls. This
apparent lack of inhibition can be explained by the patterns observed in controls,
decreasing their Ф’PSII due to maturity.
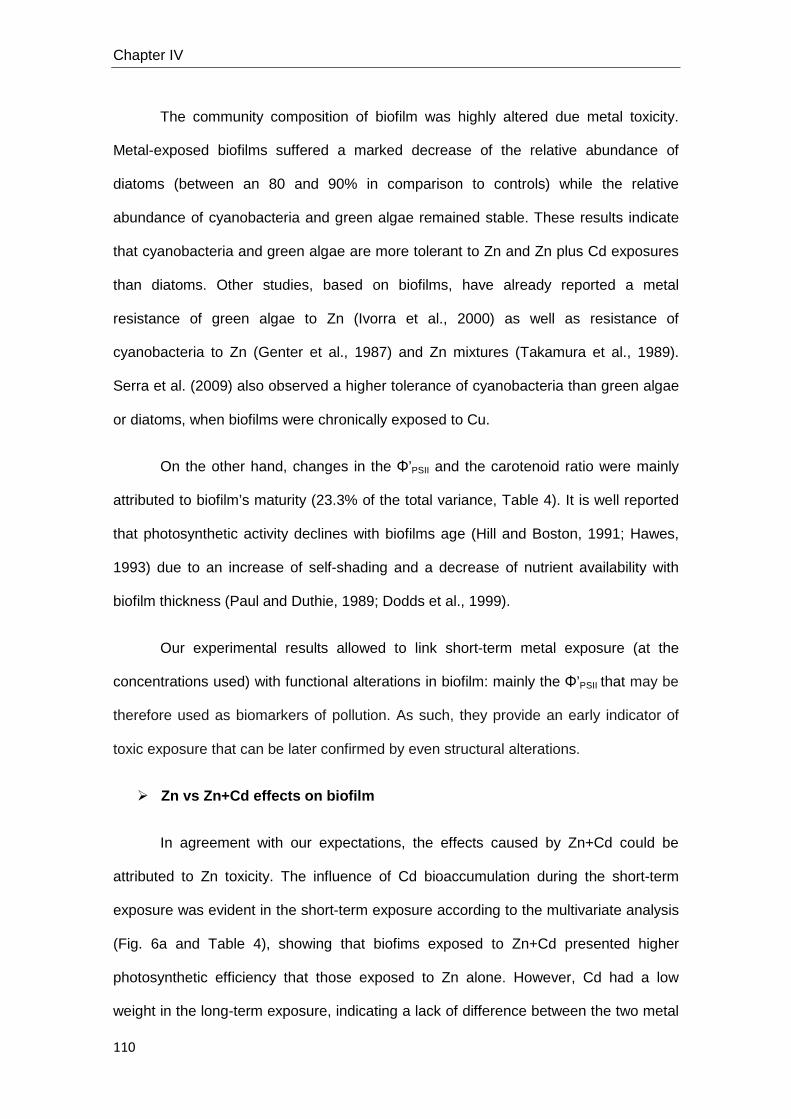
Chapter IV
110
The community composition of biofilm was highly altered due metal toxicity.
Metal-exposed biofilms suffered a marked decrease of the relative abundance of
diatoms (between an 80 and 90% in comparison to controls) while the relative
abundance of cyanobacteria and green algae remained stable. These results indicate
that cyanobacteria and green algae are more tolerant to Zn and Zn plus Cd exposures
than diatoms. Other studies, based on biofilms, have already reported a metal
resistance of green algae to Zn (Ivorra et al., 2000) as well as resistance of
cyanobacteria to Zn (Genter et al., 1987) and Zn mixtures (Takamura et al., 1989).
Serra et al. (2009) also observed a higher tolerance of cyanobacteria than green algae
or diatoms, when biofilms were chronically exposed to Cu.
On the other hand, changes in the Φ’PSII and the carotenoid ratio were mainly
attributed to biofilm’s maturity (23.3% of the total variance, Table 4). It is well reported
that photosynthetic activity declines with biofilms age (Hill and Boston, 1991; Hawes,
1993) due to an increase of self-shading and a decrease of nutrient availability with
biofilm thickness (Paul and Duthie, 1989; Dodds et al., 1999).
Our experimental results allowed to link short-term metal exposure (at the
concentrations used) with functional alterations in biofilm: mainly the Φ’PSII that may be
therefore used as biomarkers of pollution. As such, they provide an early indicator of
toxic exposure that can be later confirmed by even structural alterations.
Zn vs Zn+Cd effects on biofilm
In agreement with our expectations, the effects caused by Zn+Cd could be
attributed to Zn toxicity. The influence of Cd bioaccumulation during the short-term
exposure was evident in the short-term exposure according to the multivariate analysis
(Fig. 6a and Table 4), showing that biofims exposed to Zn+Cd presented higher
photosynthetic efficiency that those exposed to Zn alone. However, Cd had a low
weight in the long-term exposure, indicating a lack of difference between the two metal
Zn effects on biofilms
111
treatments applied. Wang et al. (1995) reported in a study with marine algae, that when
the Cd concentration was low and Zn concentration was high, the toxicity depends
upon Zn concentration.
As it was pointed out before, the Zn and Cd concentrations were very different:
Zn concentration was 22 times higher than Cd concentration, so no equal toxicity can
be expected. The similarities observed between Zn and Zn+Cd treatments agree with
the results obtain by Gold et al. (2003b), showing low effects of 10 µgCd/L in laboratory
biofilms, but clear effects of Zn+Cd in the field (Gold et al., 2003a). Ivorra et al. (2000),
based on different endpoints to the ones we used (chl-a concentration and diatoms
taxonomy), also found that biofilm suffered similar effects when it was exposed to
Zn+Cd or Zn alone.
The use of chl-a fluorescence parameters in biofilms as early warning
systems for metal toxicity detection
The set of chl-a fluorescence parameters included in this experimental study
was very sensitive to metal exposure. However, its sensitivity to detect metal effects in
field studies may be lower due to a lack of specificity and, for this reason,
supplementary chemical analysis are needed. In our experiment, the effects observed
after short-term exposure may be indicative of changes that will be detected after
longer exposure. The selection towards a metal-adapted community had an energetic
cost detected after short-term exposure as a physiological alteration leading to marked
growth changes. Based on our results, the reduction of Ф’PSII and the alterations on
ФPSII and NPQ in biofilm communities could be used as biomarkers of short-term metal
impact if they are compared to controls and complemented with metal exposure and
accumulation data.

Chapter IV
112
CONCLUSIONS
Our results suggest that chronic exposure of biofilms to the Zn concentrations
found in several fluvial systems (Morin et al., 2007; Blanck et al., 2003), may have
negative effects on biofilms. Our experimental approach demonstrates that in natural
streams such as the Riou-Mort river, with a chronic pollution of Zn plus Cd, most of the
metal toxicity reported on the autotrophic component of biofilms could be attributed to
the metal found at higher concentration (in this case Zn). However, based on the high
amounts of Fe detected in Riou-Mort river it is suggested the need of evaluate in
controlled conditions the effects of Zn on biofilms when Fe pollution is also co-
occurring. The use of chl-a fluorescence parameters seems to be a potential tool to
assess metal pollution in natural ecosystems. Metals effects can be assessed in vivo at
different temporal scales, following a community ecotoxicology approach. Its use can
inform about: a) functional and quick alterations on photosynthesis processes (that
could occur after a punctual spill during a short period of time) as well as, b) structural
changes or functional alterations linked to changes in the community composition (that
could occur in situations of chronic metal pollution). However, chemical analysis and
comparisons between metal-impacted and non metal-impacted (reference) sites should
also be performed because of its lack of specificity.

Annexe Chapter IV
113
ANNEX CHAPTER IV
Supplementary table 1. Physical and chemical characteristics of stream water of Riou-Mort
river determined at each sampling site. Each value corresponds to the AVG ±SD of n=3. Cond.:
conductivity, Temp.: Temperature, Alk.: alkalinity, CCU: cumulative concentration unit. Tt:
toxicity threshold according to EPA. n.d.: not detected.
F p value
pH 7.84 ± 0.50 8.30 ±0.11 8.28 ± 0.15 2.11 n.sCond. (µS/cm) 1535 ± 35a 1037 ± 14b 1041 ± 36b 266.9 <0.05
Temp. (ºC) 21.33 ± 2.57 22.70 ± 2.20 22.10 ± 1.73 0.29 n.sO2 (mg/L) 8.30 ± 1.26a 10.08 ± 0.23b 10.36 ± 0.23b
6.64 <0.05
Alk.(meq/L) 4.65 ± 0.07a 2.95 ± 0.07b 2.80 ± 0.04b 894.1 <0.05Cl- (mg/L) 17.35 ± 0.87a 14.36 ± 0.65b 17.53 ± 0.15b 23.72 <0.05
NO2- (mg/L) 0.85 ± 0.35a 1.92 ± 0.48ab 2.21 ± 0.6b
6.43 <0.05
NO32- (mg/L) 0.39 ± 0.07a 27.83 ± 5.56b 29.43 ± 6.72b
31.53 <0.05SO4
2- (mg/L) 110.9 ± 2.9 70.4 ± 3.7 64.9 ± 1.7 0.122 n.s
PO43- (µg/L) 30.40 ± 15.02a 42.97 ± 21.3a 807.5 ± 383.6b
12.06 <0.05Na+ (mg/L) 40.27 ± 7.10 29.56 ± 1.45 33.73 ± 1.34 4.83 n.sNH4
+ (mg/L) 0.52 ± 0.45 0.44 ± 0.18 1.05 ± 0.48 2.16 n.sK+ (mg/L) 18.7 ± 2.67 13.73 ± 0.84 15.04 ± 2.49 4.26 n.s
Ca2+ (mg/L) 161.6 ± 10.8 136.1 ± 16.4 142.7 ± 3.4 4.01 n.sMg+ (mg/L) 175.1 ± 35.3a 117.7 ± 9.8b 113.5 ± 1.9b 7.91 <0.05DOC (mg/L) 6.96 ± 0.88a 5.34 ± 0.34b 5.88 ± 0.21b 6.61 <0.05
Al (µg/L) 102.9 ± 30.1 75.55 ± 29.6 46.32 ± 11.30 150 3.77 n.sFe (µg/L) 4364 ± 276a 3222 ± 117b 2927 ± 93b 1000 52.45 <0.05Ni (µg/L) 3.90 ± 1.26 86.49 ± 110.8 60.02 ± 21.77 96 0.840 n.sZn (µg/L) 8.01 ± 4.16a 753.1 ± 175.1b 619.7 ± 191.6b 106 21.08 <0.05Cd (µg/L) n.d. a 14.09 ± 0.92b 12.84 ± 0.76b 1.1 380.5 <0.05
CCU 5.17 ± 0.09a 24.54 ± 1.74b 21.38 ± 3.25b 2 71.67 <0.05
S1 S2 S3 Tt (µg/L)ANOVA
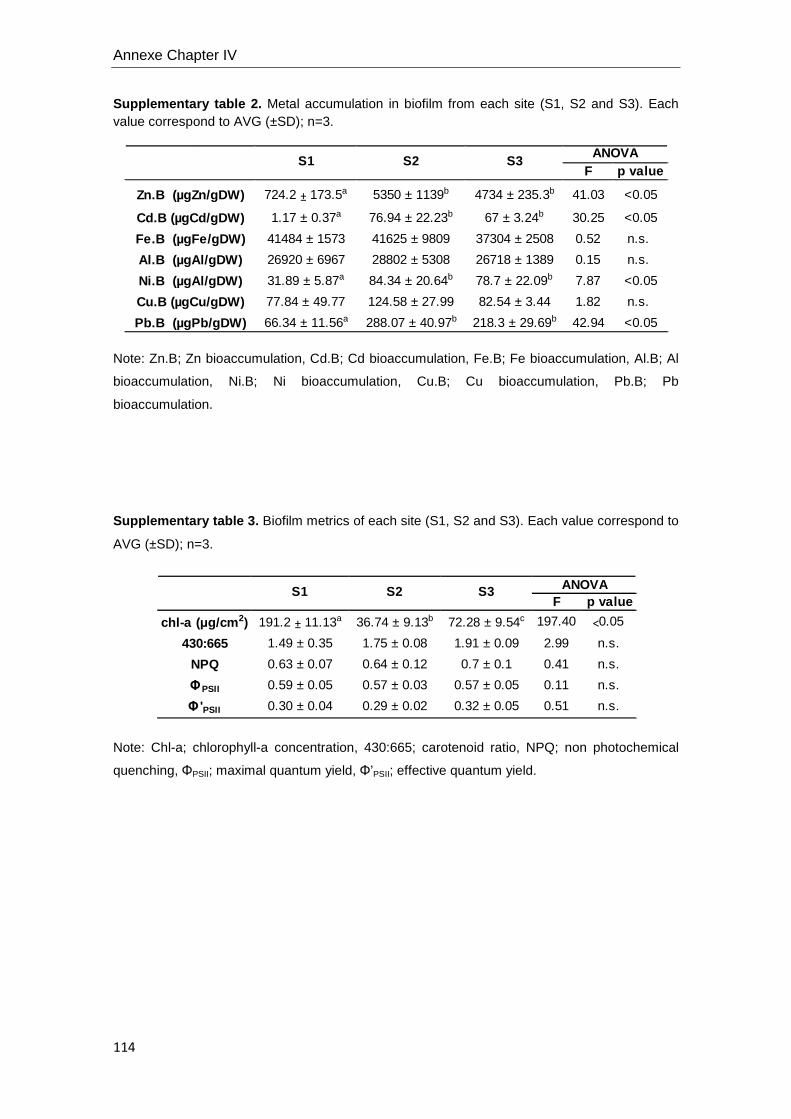
Annexe Chapter IV
114
Supplementary table 2. Metal accumulation in biofilm from each site (S1, S2 and S3). Each value correspond to AVG (±SD); n=3.
Note: Zn.B; Zn bioaccumulation, Cd.B; Cd bioaccumulation, Fe.B; Fe bioaccumulation, Al.B; Al
bioaccumulation, Ni.B; Ni bioaccumulation, Cu.B; Cu bioaccumulation, Pb.B; Pb
bioaccumulation.
Supplementary table 3. Biofilm metrics of each site (S1, S2 and S3). Each value correspond to
AVG (±SD); n=3.
Note: Chl-a; chlorophyll-a concentration, 430:665; carotenoid ratio, NPQ; non photochemical
quenching, ΦPSII; maximal quantum yield, Φ’PSII; effective quantum yield.
F p value
724.2 ± 173.5a 5350 ± 1139b 4734 ± 235.3b 41.03 <0.05
1.17 ± 0.37a 76.94 ± 22.23b 67 ± 3.24b 30.25 <0.05
41484 ± 1573 41625 ± 9809 37304 ± 2508 0.52 n.s.
26920 ± 6967 28802 ± 5308 26718 ± 1389 0.15 n.s.
31.89 ± 5.87a 84.34 ± 20.64b 78.7 ± 22.09b 7.87 <0.05
77.84 ± 49.77 124.58 ± 27.99 82.54 ± 3.44 1.82 n.s.
66.34 ± 11.56a 288.07 ± 40.97b 218.3 ± 29.69b 42.94 <0.05
ANOVA
Zn.B (µgZn/gDW)
Cd.B (µgCd/gDW)
Fe.B (µgFe/gDW)
S1
Al.B (µgAl/gDW)
Ni.B (µgAl/gDW)
Cu.B (µgCu/gDW)
Pb.B (µgPb/gDW)
S2 S3
F p value
chl-a (µg/cm 2) 191.2 ± 11.13a 36.74 ± 9.13b 72.28 ± 9.54c 197.40 <0.05
430:665 1.49 ± 0.35 1.75 ± 0.08 1.91 ± 0.09 2.99 n.s.
NPQ 0.63 ± 0.07 0.64 ± 0.12 0.7 ± 0.1 0.41 n.s.
ΦPSII 0.59 ± 0.05 0.57 ± 0.03 0.57 ± 0.05 0.11 n.s.
Φ 'PSII 0.30 ± 0.04 0.29 ± 0.02 0.32 ± 0.05 0.51 n.s.
S1 S2 S3 ANOVA

CHAPTER V
METAL EFFECTS ON PHOTOSYNTHESIS AND DIATOM
METRICS OF METAL CONTAMINATED FLUVIAL BIOFILMS . A
TRANSLOCATION EXPERIMENT
Riera d’Osor, May 2009


Field study, Zn toxicity on fluvial biofilm
117
INTRODUCTION
The occurrence of metal contamination in fluvial ecosystems is commonly due
to urban and mining activities occurring in its watershed (Guasch et al., 2009; Ferreira
da Silva et al., 2009; Sierra and Gómez, 2010). This is the case of the Osor stream (NE
Spain), our case of study, which presents Zn pollution due to old mining activities in its
watershed (Bruguera, 2004). Trace metals may produce toxic effects on aquatic
organisms depending on metal speciation, which, in turn, determines bioavailability,
toxicity (Tessier et al., 1995) and metal accumulation (Meylan et al., 2004). In
accordance with this environmental problem, regulatory documents have been
developed by management entities. In Europe, the Water Framework Directive
(Directive 2000/60/EC) aimed at reducing chemical pollution in water bodies to reach a
“good ecological status” (i.e. close to reference conditions) by 2015, highlighting the
importance of evaluating the effects of chemical substances on the biota. To date, no
water quality criterion has been recommended for Zn according to the WFD. However,
its occurrence is still a matter of concern in Europe. For instance, in the Furtbach river,
Switzerland, Zn concentrations ranged from 150 to 400 µgZn/L (Le Faucheur et al.,
2005), in the Dommel river, Belgium, ranged from 76 to 2216 µgZn/L (Ivorra et al.,
2002), in the Riou-Mort river, France, reached up to 1000µgZn/L and 3000µgZn/L
(Bonnineau et al. 2011 and Morin et al. 2008, respectively) and/or in Osor stream,
Spain, our case of study, ranged from 25 to 450 µgZn/L (ACA, Catalan Water Agency).
According to the criteria proposed by the US Environmental Protection Agency (US
EPA, 2006), Zn concentrations reported in these polluted cases are above the toxicity
threshold (120 µgZn/L). In Osor stream, significant concentrations of Fe are also
reported (60 - 500 µg/L) (ACA, 2009) but no toxicity on biota is expected according to
the EPA’s criteria, which sets the Fe toxicity threshold at 1000 µgFe/L.
Chapter V
118
Fluvial biofilms are microbenthic communities mainly composed by algae and
cyanobacteria, as well as bacteria, protozoa and fungi, which live attached to
submerged substrata (Boeije et al., 2000). They have been widely used for bio-
monitoring in rivers due to their rapid response to environmental changes which makes
them suitable as early warning systems for toxicity evaluation (Sabater et al., 2007).
Phytobenthic community of biofilms (named also phytobenthos) are recognized for the
WFD as a “biological quality element” (BQE) for the assessment of the ecological
status of water systems. Biofilms constitute an integrative indicator of metal exposure
occurring over a period of days or weeks (Ancion et al., 2010), supporting its use as
metal pollution indicators (Mages et al., 2004; Ancion et al., 2010). However, the
relationships between metal toxicity and biofilm responses may differ depending on the
metal dose and exposure time. It is expected that metal exposure will produce firstly
metabolic and functional alterations and secondly, after long-term exposures when
much higher metals will be accumulated, it will cause structural changes (Serra et al.,
2009; Guasch et al., 2010). Hence, the relevance of using a multi-biomarkers approach
including functional and structural indicators (Bonnineau et al., 2010). Focusing on
functional biofilm community endpoints, the use of chl-a fluorescence parameters will
reflect direct or indirect damage caused by a toxicant (e.g. a metal) (Barranguet et al.,
2000; Guasch et al., 2002; Serra et al., 2009). Changes in the composition of
photosynthetic pigments have also been used as indicators of changes in the
physiological processes in the photosynthetic apparatus of plants, aglae or
phytobenthic communities as response mechanism to avoid environmental stress
(Demming et al. 1998; Kana et al. 1997; Chevalier et al. 2010; Laviale et al., 2010).
Accordingly, several accessory photosynthetic pigments of chl-a (diadinoxanthin,
diatoxanthin, β-carotene, antheroxanthi or zeaxanthin, among others) were chosen in
this study as functional markers of physiological processes of photosynthetic
apparatus.
Field study, Zn toxicity on fluvial biofilm
119
Focusing on structural biofilm endpoints, diatom metrics have been widely
reported to respond to chemical stress not only at the community level through shifts in
dominant taxa and diversity patterns but also at the individual level with increasing
occurrence of frustules deformities or decrease in cell size (Morin et al., 2007; Falasco
et al., 2009). Diatom indices have been considered in the WFD for water quality
assessment. Although the WFD mentions the relevance of preserving the function and
structure of aquatic ecosystems, no functional biofilm endpoint has to date been
included. Hence, the interest in developing new structural and functional parameters as
BQEs (Johnson et al., 2006) for the assessment of water quality
In field studies, finding causality between chemical toxicity and biofilm
responses is not always an easy task because of the common occurrence of
confounding factors (Guasch et al., 2010). Moreover, any disturbance in the river
ecosystem might be buffered or enhanced by complex biological interactions
(Geiszinger et al., 2009). To address this issue, in this study an experimental design
based on biofilms translocation (active bio-monitoring; De Kock and Kramer, 1994) was
applied and multivariate statistical techniques were used for data analysis. Active bio-
monitoring is based on the translocation of organisms from one place to another and
quantifying their biochemical, physiological and/or organismal responses for the
purpose of water quality monitoring (De Kock and Kramer, 1994). Few hours and
several weeks after starting translocations, biofilm metrics were measured to assess
acute and chronic effects of metal exposure. This approach has been successfully
applied for the assessment of stress responses (Ivorra et al., 1999; Sierra and Gómez;
2010) or recovery (Morin et al., 2010; Rotter et al., 2011) in polluted rivers. Multivariate
techniques have been used to evaluate the combined effects of environmental factors
and toxicants substances on biofilms (Guasch et al., 2009; Ricart et al., 2010a). In
particular, variance partitioning (Borcard et al., 1992) was used in this study to
Chapter V
120
distinguish the effects caused by metal pollution from those caused by other chemical
and physical factors.
The main aim of this study was to evaluate the convenience of using a set of
biofilm endpoints, including chl-a fluorescence parameters, pigments composition and
diatoms metrics as indicators of Zn pollution in a fluvial ecosystem.
STUDY SITE
The translocation experiment was conducted in the Osor stream “riera d’Osor”,
a second order stream situated in Girona (NE, Spain) tributary of the River Ter (Fig.1).
The climate of this region is Mediterranean. Annual average precipitation is 950 mm
and mean temperature is 12ºC. The Osor stream is 23.5 km long and drains a
catchment area of 8890 ha (mainly from Guilleries Mountains). Stream type is a
siliceous Mediterranean mountain stream (Munné et al., 2004). It is relatively well
preserved with low human pressure. Urban activities are limited, discharging low
amounts of waste waters from the Osor village (354 inhabitants) and from a
wastewater treatment plant located upstream (St. Hilari Sacalm with 5064 inhabitants).

Field study, Zn toxicity on fluvial biofilm
121
Figure 1. The watershed of Osor stream “la riera d’Osor” (NE Spain, Ter river Basin), showing
the location of the sites involved in the biofilm translocation experiment (CS, Upstream, M1, M2
and M3).
The stream is mainly affected by continuous (mine effluent) and diffuse metal
inputs (mine run-off) remaining from former mining activities (finished in 1980). The
mine effluent is a canal draining old underground galleries of the mine. The mine ore
exploited were fluorite (CaF2), sphalerite (ZnS) and galena (PbS) (Bruguera, 2004).
EXPERIMENTAL DESIGN
For the translocation study, 5 sites located on the main course of the Osor
stream were chosen (Fig.1). The experiment was conducted from May to June 2009.
Biofilms were grown on submerged artificial substrata. Each artificial substratum was
made up of heavy stoneware (40x40cm) with attached sand-blasted glass substrata
(70 units of 8.5x2cm and 80 units of 1.2x1.2cm) in horizontal position. All substrata
were first placed in the same site, called colonization site (CS) (Fig.1), and left for 5
St.HilariSacalm
Osor
Anglès
CS
Upstream
M1
M2M3
Mineeffluent

Chapter V
122
weeks to obtain mature biofilms. The CS, is located upstream of the mining area. Metal
inputs are expected to be low, mainly coming from urban and agricultural activities.
Mature biofilms from CS were translocated to four sites (Fig.1): the upstream
site (Upstream), and three sites located within the mining area: mining 1 (M1), mining 2
(M2) and mining 3 (M3). In this way, all translocated biofilms had the same origin and
maturity and suffered comparable stress during their transport. This moment was
considered as T0 of the translocation. The Upstream was located after the CS and before
the mine effluent (Fig.1). It is considered a reference site, similar to the CS, with good
ecological status and background metal pollution. The M1 is situated immediately
before the main mine effluent and expected to receive diffuse metal pollution (Fig.1).
The M2, is located after the mine effluent (Fig.1), receiving continuously metals.
Further downstream, the M3 is expected to have lower metal concentrations than M2
due to metal retention in zones of sediment deposition and/or dilution (Fig.1).
SAMPLING
During the experiment water was sampled 9 times and biofilms 4 times. At the
colonization site, water samples were taken at days 29 and 31 (6 and 4 days before
T0, respectively) and at T0. In the translocation sites (Upstream, M1, M2 and M3), water
and biofilm samples were taken 6 and 24 hours (acute exposure) and 3 and 5 weeks
(chronic exposure) after the translocation. During the course of the experiment, high
precipitations were recorded between weeks 3 and 5, which potentially influenced the
metal dilution factor of the continuous source as well as the diffuse input via run-off.
At each sampling time, temperature, conductivity, pH and dissolved oxygen
were measured in situ with a multi-parametric probe (WTW Meters, Weilheim,
Germany). Light was also measured in situ at each sampling site (LI-COR Inc., Lincoln,

Field study, Zn toxicity on fluvial biofilm
123
Nebraska, USA). Light measurements were performed in the middle of the stream and
at both banks in order to calculate the percentage cover (Cover %). Water samples
were taken for the analysis of phosphate, nitrate, dissolved organic carbon (DOC) and
dissolved metals concentrations. All water samples were taken in triplicate and
immediately filtered through 0.2 µM nylon membrane filters (Whatman), while samples
for metal analysis were also acidified with 1% HNO3 (65 % suprapure, Merck). All
samples were transported to the laboratory and stored until analyses. All biofilm
samples were also taken in triplicate. Two big colonized substrata (8.5 x 2 cm) were
scrapped for metal bioaccumulation, and used for each replicate. For chl-a
fluorescence analysis a small colonized substrata (1.5 x 1.5 cm) was used for each
replicate. Each colonized substrata was individually placed on the bottom of a
transparent glass vial filled with 10ml of water from the corresponding sampling site
and used for chl-a fluorescence measurements. As this measurement is non
destructive; the same samples were fixed after measurements with formaldehyde 4%
for further diatoms analysis. Several metrics from the diatom community were obtained:
species richness (S), cell biovolume, % teratological forms and the Index of Pollution
Sensitivity-IPS (Indice de Polluosensibilité Spécifique, Coste in Cemagref, 1982). S
and IPS were calculated using Omnidia 4.1 software (Lecointe et al., 1993). IPS values
were used to characterize water quality (Coste in Cemagref, 1982). The WFD
recognize five categories of IPS to determine water river quality. Values of IPS higher
than 16 correspond to “very good” quality, between 13 and 16 correspond to “good”
quality, between 9 and 12 correspond to “moderate” quality, between 5 and 8
correspond to “poor” quality and below 5 correspond to “bad” quality. For pigment
analysis, a small glass was used for each replicate. Samples were placed in individual
centrifuge tubes (Corning) and kept at -25ºC until analysis. All biofilm samples were
transported to the laboratory in a dark cool box. Samples for pigments and
bioaccumulation analysis were kept frozen until analysis. Details about water and

Chapter V
124
biofilm analysis are provided in Chapter II focused on material and methods for water
and biofilm analysis.
DATA ANALYSIS
In order to use an estimate of metal concentration and potential toxicity level,
metal concentrations were used to calculate CCUs (Cumulative Concentration Units)
and used as estimates of potential metal toxicity (Clements et al., 2000). The CCU is a
score based on the sum of the ratios between metal concentrations measured in
surface waters and the corresponding criterion value (US EPA’s National
Recommended Water Quality Criteria), http://www.epa.gov/waterscience/criteria/
wqctable/) used to investigate the responses of aquatic organisms to metals (Clements
et al., 2000). Three categories of CCU were used; CCU below 1 corresponded to
“background” category, CCU between 1 and 2 corresponded to “low” category
indicating low potential toxicity and CCU between 2 and 10 corresponded to
“moderate” category indicating moderate metal potential toxicity.
One way ANOVA was performed to detect significant differences in the physical
and chemical water characteristics among sites and between the biofilm metrics (chl-a
fluorescence parameters, metal accumulation, photosynthetic pigments and diatoms
metrics) in the translocated biofilms during acute and chronic exposures. Data were
transformed to achieve normality. If metal concentrations were below detection limits, a
value equal to half of the method detection limit was assigned to these data in the
statistical analyses (Helsel, 1990). Tukey’s HSD test was applied to identify significant
differences between sites (Upstream, M1, M2 and M3). ANOVA analyses were realized
by SPSS software. A 5% significance level (p<0.05) was used for rejection of null
hypothesis in all cases.
Multivariate analyses were performed using the CANOCO software version 4.5
(Ter Braak and Smilauer, 1998). Except pH, all variables were previously log-

Field study, Zn toxicity on fluvial biofilm
125
transformed to reduce skewed distributions. Principal component analysis (PCA) was
used to analyse the variability of water physical and chemical environment. Detrended
correspondence analysis (DCA) was used to determine the maximum gradient length
of biofilm metrics in order to decide between linear or unimodal methods.
Relationships between biofilm metrics and metal concentrations, and water physical
and chemical variables during acute and chronic exposures were assessed with
redundancy detrended analysis (RDA). Two independent RDA analysis were
performed; one using data from acute exposure (RDA acute exposure) and another
including data from chronic exposure (RDA chronic exposure). Biofilm metrics included
in the first RDA (acute exposure) were chl-a fluorescence parameters and
photosynthetic pigments, while in the second RDA (chronic exposure) diatom metrics
were also included. To avoid co-linearity, variables were selected based on inspection
of variance inflation factors (VIF<20) (Ter Braak and Smilauer, 1998). Forward
selection was used to select the environmental variables that significantly explained the
distribution pattern of the biofilm metrics with a cut-off point of p=0.1. Significance of
the RDA axes was assessed using the Monte Carlo permutation test (999 unrestricted
permutations). Probabilities for multiple comparisons were corrected using the
Bonferroni correction. The variance partitioning technique was applied to separate the
effects of metal concentrations on biofilm metrics distribution from other chemical and
physical variables, when pertinent (i.e. acute exposure) (Borcard et al., 1992).
Accordingly, the explanatory variables were grouped into two subsets: (a) physical and
chemical variables and (b) metals.
RESULTS
Physical and chemical conditions
Physical and chemical conditions during the experiment are summarized in
Table 1 covering the colonization period at the CS (May 2009) and the translocation

Chapter V
126
period at Upstream, M1, M2 and M3 (June 2009). Percentage of cover (% cover) was
similar between CS and all mining sites (M1, M2 and M3) but it was lower in the
Upstream (Table 1). Lower temperature was observed at CS in comparison to the other
sites due to seasonality. Cu, Pb and Cd concentrations were in most cases (94%)
below detection limit. Accordingly, these metals were considered of low significance
and were not included in the multivariate analysis. Detection limit for Cu was 0.12 µg/L,
for Zn was 2.82 µg/L, for Al was 0.72 µg/L, for Pb was 0.40 µg/L, for Ni was 2.44 µg/L,
for Fe was 17.18 µg/L and for Cd was 0.32 µg/L. Based on the calculated
Concentration Cumulative Units (CCU) the highest value was obtained in M2 with a
“moderate” potential toxicity level. Upstream and M1 sites had a “low” potential toxicity
while M3 had a “background” level (Table 1).

Table 1. Average and standard errors (in parenthesis) of physical and chemical parameters: in the colonization site (CS) during the colonization
period (n=9) and, in the translocation sites: upstream (Upstream), mining 1 (M1), mining 2 (M2) and mining 3 (M3) during the translocation period (n= 12). For
each parameter, different letters indicate significant differences (p<0.05) between sites after ANOVA and Tukey’s HSD test. n.s.: non significant differences
between sites. Tt: Toxicity threshold (µg/L) according to EPA.
Parameter Colonization
Site up stream M1 M2 M3
ANOVA results
AVG ( ± SE ) AVG ( ± SE ) AVG ( ± SE ) AVG ( ± SE ) AVG ( ± SE ) Tt F(4,52) p value
Cover (%) 37.53 (3.46)a 4.48 (1.93)b 34.28 (12.60)a 59.81 (11.23)a 38.00 (12.7)a 12.37 < 0.001
pH 8.14 (0.02)a 8.14 (0.04)a 8.13 (0.07)a 8.15 (0.04)a 7.68 (0.07)b 7.25 < 0.001
Cond.(µS/cm) 183.3 (6.60)a 226.7 (5.17)abc 370.1 (77.84)bc 356.8 (29.80)c 222.9 (4.03)ab 5.64 < 0.001
Oxy. (mg/L) 9.40 (0.06)a 9.12 (0.09)ab 8.84 (0.18)b 9.11 (0.07)ab 9.23 (0.09)ab 3.25 < 0.05
TºC 14.27 (0.43)a 18.02 (0.27)b 18.22 (0.23)b 18.6 (0.2)b 17.63 (0.19)b 25.77 < 0.001
DOC (mg/L) 4.69 (0.92)a 3.45 (0.23)ab 3.59 (0.25)ab 3.29 (0.28)b 4.21 (0.39)ab 3.06 n.s.
PO43- (µg/L) 220.8(18.89)ab 380.2 (33.60)a 316.5 (20.75)ab 218.4 (10.02)b 298.6 (29.44)ab 2.8 < 0.05
NO3- (mg/L) 3.04 (0.12)ab 3.05 (0.21)a 2.24 (0.14)bc 1.87 (0.18)c 2.89 (0.16)ab 9.06 < 0.001
Cu (µg/L) bdl bdl bdl bdl bdl 9
Zn (µg/L) bdla 19.19 (9.65)a 31.11 (11.24)a 289.9 (44.19)b 21.04 (10.71)a 120 16.14 < 0.001
Al (µg/L) 11.89 (3.32)a 5.52 (1.43)b 9.74 (1.95)a 0.88 (0.29)b bdlb nd 16.1 < 0.001
Pb (µg/L) bdl bdl bdl bdl bdl 2.5
Ni (µg/L) 3.65 (0.42)ab 3.26 (0.27)a 9.53 (3.73)b bdla bdla 52 6.29 < 0.001
Fe (µg/L) 280.4(13.45)a 295.8 (4.8)a 303.9 (8.74)a 455.9 (40.80)a 88.17 (27.42)b 1000 13.32 < 0.001
Cd (µg/L) bdl bdl bdl bdl bdl 0.25
CCU 1.74 (0.17)a 1.17 (0.06)ac 1.36 (0.09)ac 3.04 (0.33)b 0.93 (0.09)c 2 14.76 < 0.001
bdl: below detection limit
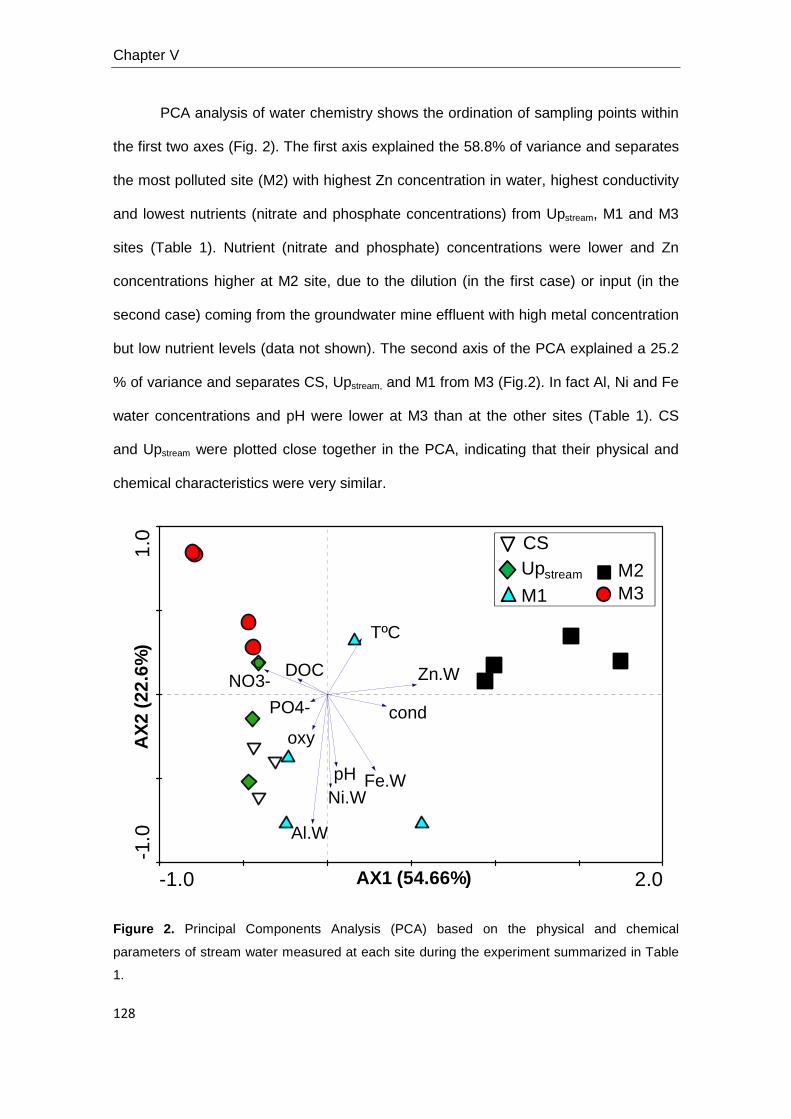
Chapter V
128
PCA analysis of water chemistry shows the ordination of sampling points within
the first two axes (Fig. 2). The first axis explained the 58.8% of variance and separates
the most polluted site (M2) with highest Zn concentration in water, highest conductivity
and lowest nutrients (nitrate and phosphate concentrations) from Upstream, M1 and M3
sites (Table 1). Nutrient (nitrate and phosphate) concentrations were lower and Zn
concentrations higher at M2 site, due to the dilution (in the first case) or input (in the
second case) coming from the groundwater mine effluent with high metal concentration
but low nutrient levels (data not shown). The second axis of the PCA explained a 25.2
% of variance and separates CS, Upstream, and M1 from M3 (Fig.2). In fact Al, Ni and Fe
water concentrations and pH were lower at M3 than at the other sites (Table 1). CS
and Upstream were plotted close together in the PCA, indicating that their physical and
chemical characteristics were very similar.
Figure 2. Principal Components Analysis (PCA) based on the physical and chemical
parameters of stream water measured at each site during the experiment summarized in Table
1.
-1.0 2.0
-1.0
1.0
pH
condoxy
TºC
DOC
PO4-
NO3-
Al.W
Fe.WNi.W
Zn.W
CSUpstream
M1M2M3
AX1 (54.66%)
AX
2 (2
2.6%
)

Field study, Zn toxicity on fluvial biofilm
129
Metal bioaccumulation
Translocated biofilms accumulated different amount of metals depending on the
translocation site (Upstream, M1, M2 or M3) and the time of exposure (acute vs. chronic)
(Fig.3). Cd bioaccumulation was always below detection limit. Few hours after
translocation (after 6 and 24h), Al and Fe bioaccumulation were similar in most sites
(Table 1), except at M3, where Fe bioaccumulation was slightly lower (Fig. 3). Ni, Cu
and Pb bioaccumulation were two orders of magnitude lower than Al and Fe and were
comparable between sites (Fig.3). Zn bioaccumulation was 2.5 times higher at M1, M2
and M3 than at Upstream (Fig.3).
After several weeks of exposure (after 3 and 5 weeks), Al and Fe remained
lower or similar than during the first hours of exposure, whereas Pb and Zn showed a
clear increase in the most metal polluted sites (M1, M2 and M3). Al and Cu were 1.5
and 2 times higher at M1 and M3 than Upstream and M2, respectively. Ni
bioaccumulation during chronic exposure was comparable to that one observed during
acute exposure. Differences in Pb bioaccumulation between sites were similar to those
observed for Zn, but with lower concentrations. Pb bioaccumulation was 9 times higher
at M1, M2 and M3 than at Upstream. Zn bioaccumulation was maximum at M2; 6 and 7
times higher than at M1 and M3, respectively, and 43 times higher than at Upstream (Fig.
3).
Acute exposure
Six hours after translocation, a decrease of the Φ’PSII was observed in biofilms
from mining sites (M1,M2 and M3) in comparison to biofilms from Upstream (Fig. 4)
(p<0.05; F=43.29). Later on, 24h after translocation, a reduction of the ΦPSII was also
observed in biofilms from M1 and M2 in comparison to Upstream and M3 (Fig. 4) (p<0.05;
F=8.53). A marked change in NPQ was observed between 6h (p<0.05; F=78.26) and

Chapter V
130
24h (p<0.05; F=40.59) after translocation (Fig.4), and this change was mainly observed
at Upstream and M1. After acute exposure, the relative abundance of dinoxanthin
pigment was higher in mining sites (M1, M2 and M3) than in Upstream (Table 2).
Otherwise, violaxanthin decreased in mining sites (M1, M2 and M3) in comparison to
Upstream (Table 2).
Figure 3. Metal bioaccumulation in biofilms translocated to Upstream, M1, M2 and M3, after acute
(6 and 24h) and chronic (3 and 5 weeks) exposures. Each column corresponds to the
AVG±S.E; n=6. Different letters indicate significant differences (p<0.05) between sites after
ANOVA and Tukey’s HSD test.
0
5000
10000
15000
20000
25000
30000
35000Al Fe
0
50
100
150
200
250Ni Cu Pb
0
10003000
4000
5000
Zn
0
5000
10000
15000
20000
25000
30000
35000Al Fe
0
50
100
150
200
250Ni Cu Pb
0
10003000
4000
5000Zn
ACUTE EXPOSURE( after 6 and 24h)
CHRONIC EXPOSURE( after 3 and 5 weeks)
µg
me
tal /
g D
W
µg
met
al /
g D
W
µg
Zn
/ g D
W
µg
meta
l / g D
W
µg
meta
l / g D
W
µg
Zn / g
DW
a
ab
b
b
ba ab
b
a
b
aa
a
b
b
b
aaabb
b
b
a
a
c
b
b
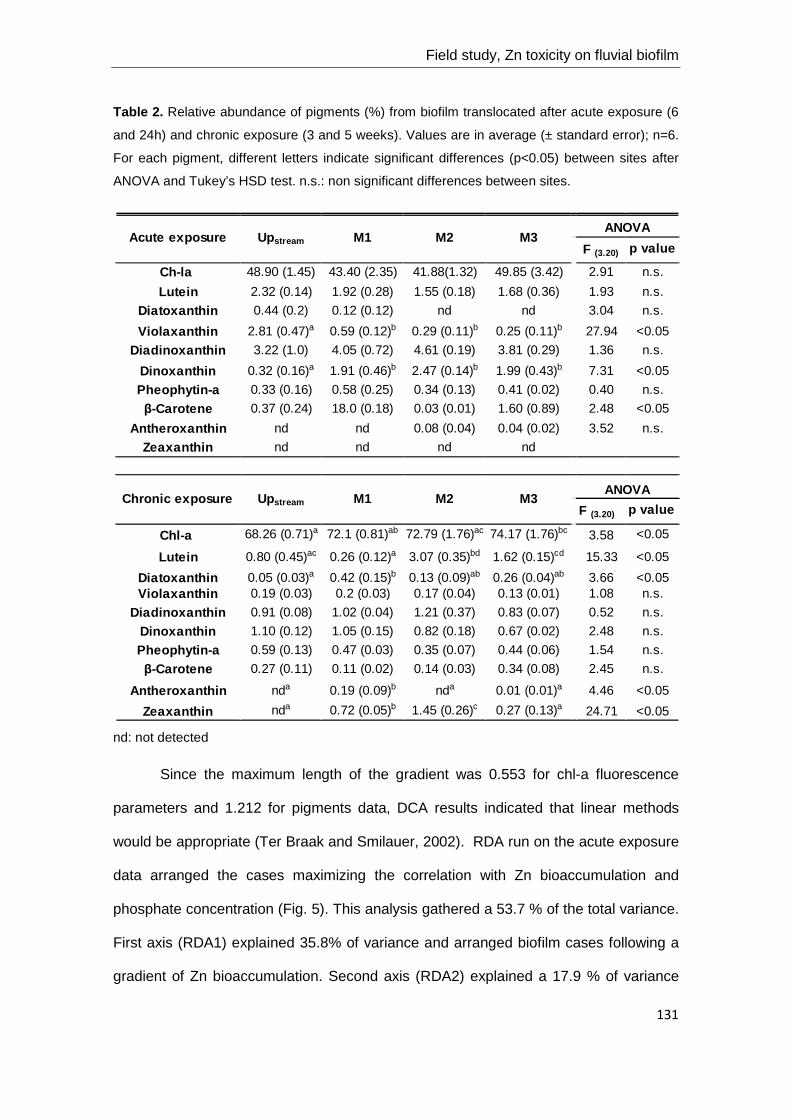
Field study, Zn toxicity on fluvial biofilm
131
Table 2. Relative abundance of pigments (%) from biofilm translocated after acute exposure (6
and 24h) and chronic exposure (3 and 5 weeks). Values are in average (± standard error); n=6.
For each pigment, different letters indicate significant differences (p<0.05) between sites after
ANOVA and Tukey’s HSD test. n.s.: non significant differences between sites.
nd: not detected
Since the maximum length of the gradient was 0.553 for chl-a fluorescence
parameters and 1.212 for pigments data, DCA results indicated that linear methods
would be appropriate (Ter Braak and Smilauer, 2002). RDA run on the acute exposure
data arranged the cases maximizing the correlation with Zn bioaccumulation and
phosphate concentration (Fig. 5). This analysis gathered a 53.7 % of the total variance.
First axis (RDA1) explained 35.8% of variance and arranged biofilm cases following a
gradient of Zn bioaccumulation. Second axis (RDA2) explained a 17.9 % of variance
F (3.20) p value
Ch-la 48.90 (1.45) 43.40 (2.35) 41.88(1.32) 49.85 (3.42) 2.91 n.s.
Lutein 2.32 (0.14) 1.92 (0.28) 1.55 (0.18) 1.68 (0.36) 1.93 n.s.
Diatoxanthin 0.44 (0.2) 0.12 (0.12) nd nd 3.04 n.s.
Violaxanthin 2.81 (0.47)a 0.59 (0.12)b 0.29 (0.11)b 0.25 (0.11)b 27.94 <0.05
Diadinoxanthin 3.22 (1.0) 4.05 (0.72) 4.61 (0.19) 3.81 (0.29) 1.36 n.s.
Dinoxanthin 0.32 (0.16)a 1.91 (0.46)b 2.47 (0.14)b 1.99 (0.43)b 7.31 <0.05
Pheophytin-a 0.33 (0.16) 0.58 (0.25) 0.34 (0.13) 0.41 (0.02) 0.40 n.s.
β-Carotene 0.37 (0.24) 18.0 (0.18) 0.03 (0.01) 1.60 (0.89) 2.48 <0.05
Antheroxanthin nd nd 0.08 (0.04) 0.04 (0.02) 3.52 n.s.
Zeaxanthin nd nd nd nd
F (3.20) p value
Chl-a 68.26 (0.71)a 72.1 (0.81)ab 72.79 (1.76)ac 74.17 (1.76)bc 3.58 <0.05
Lutein 0.80 (0.45)ac 0.26 (0.12)a 3.07 (0.35)bd 1.62 (0.15)cd 15.33 <0.05
Diatoxanthin 0.05 (0.03)a 0.42 (0.15)b 0.13 (0.09)ab 0.26 (0.04)ab 3.66 <0.05Violaxanthin 0.19 (0.03) 0.2 (0.03) 0.17 (0.04) 0.13 (0.01) 1.08 n.s.
Diadinoxanthin 0.91 (0.08) 1.02 (0.04) 1.21 (0.37) 0.83 (0.07) 0.52 n.s.
Dinoxanthin 1.10 (0.12) 1.05 (0.15) 0.82 (0.18) 0.67 (0.02) 2.48 n.s.
Pheophytin-a 0.59 (0.13) 0.47 (0.03) 0.35 (0.07) 0.44 (0.06) 1.54 n.s.
β-Carotene 0.27 (0.11) 0.11 (0.02) 0.14 (0.03) 0.34 (0.08) 2.45 n.s.
Antheroxanthin nda 0.19 (0.09)b nda 0.01 (0.01)a 4.46 <0.05
Zeaxanthin nda 0.72 (0.05)b 1.45 (0.26)c 0.27 (0.13)a 24.71 <0.05
Chronic exposure Up stream M1 M2 M3ANOVA
Acute exposure Up stream M1 M2 M3ANOVA

Chapter V
132
and arranged biofilm communities maximizing the correlation with phosphate
concentration. Biofilms sampled after 6h were separated to those sampled at 24h (Fig.
5) that accumulated higher amounts of Zn, had lower Φ’PSII, lower relative abundance
of violaxanthin and a higher relative abundance of dinoxanthin than biofilms from
Upstream (Fig.5 and Table 3). The second RDA axis was related to a gradient of
phosphate (Fig.5) and focussing on biofilm metrics related to this axis it was observed,
on the one hand, that biofilms had a higher NPQ activity after 24h of exposure than
after 6h of exposure. On the other hand, biofilms had a higher ΦPSII and a higher
relative abundance of pheophytin-a at 6h than at 24h (Fig.5 and Table 3). Variance
partitioning revealed that bioaccumulated Zn was the only metal (31.6%) and that
phosphate concentration in water was the only physical or chemical variable presenting
significant effects on biofilms (24%). The shared variance between metal and
physicochemical variables accounted for a 1.9%. Six pigments and Φ’PSII were the only
biofilm metrics exclusively related to Zn bioaccumulation (Table 3).
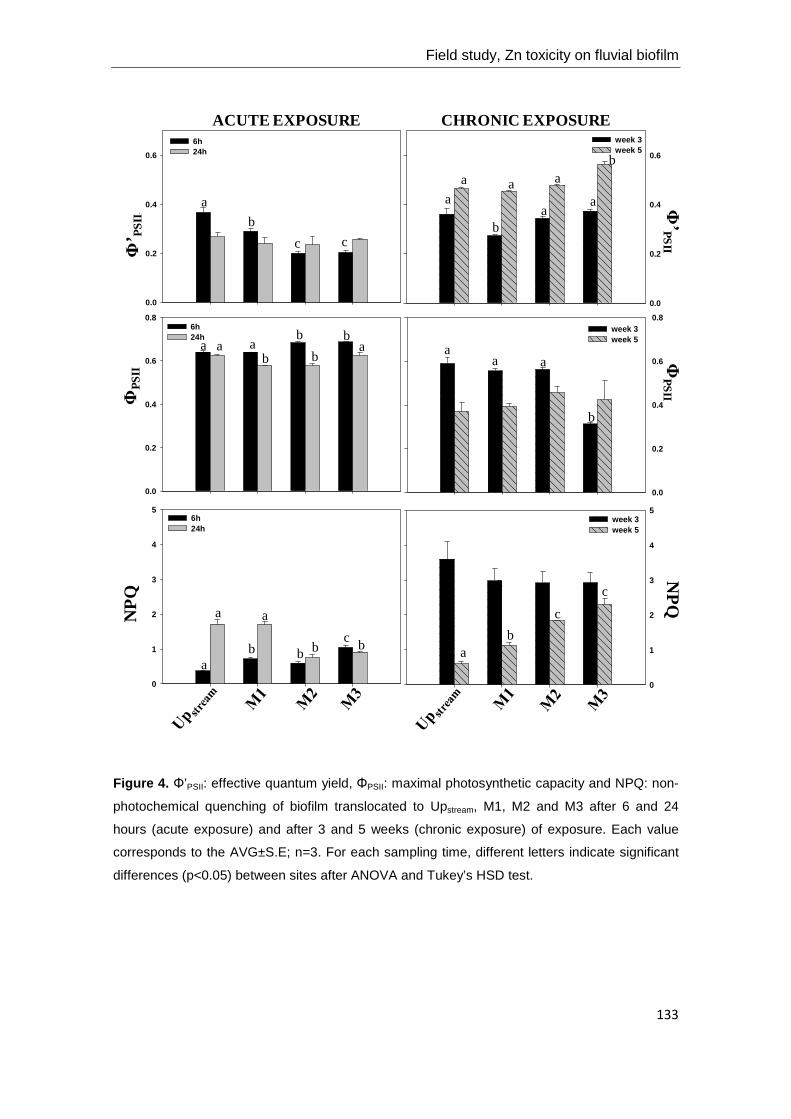
Field study, Zn toxicity on fluvial biofilm
133
Figure 4. Φ’PSII: effective quantum yield, ΦPSII: maximal photosynthetic capacity and NPQ: non-
photochemical quenching of biofilm translocated to Upstream, M1, M2 and M3 after 6 and 24
hours (acute exposure) and after 3 and 5 weeks (chronic exposure) of exposure. Each value
corresponds to the AVG±S.E; n=3. For each sampling time, different letters indicate significant
differences (p<0.05) between sites after ANOVA and Tukey’s HSD test.
0.0
0.2
0.4
0.6
0.86h 24h
week 3week 5
0.0
0.2
0.4
0.6
0.8
effQ
Y
0.0
0.2
0.4
0.6
6h24h
0.0
0.2
0.4
0.6
week 3week 5
Y D
ata
0
1
2
3
4
56h24h
0
1
2
3
4
5week 3week 5
Φ’ P
SII
ΦP
SII
NP
QΦ
’PS
IIΦ
PS
IIN
PQ
a
b
c c
a
ba
a
a
a
a ab
abb
abb
aa
a
a
b
a
ba
b
a
cb
a
bb
a
c
ac
ACUTE EXPOSURE CHRONIC EXPOSURE
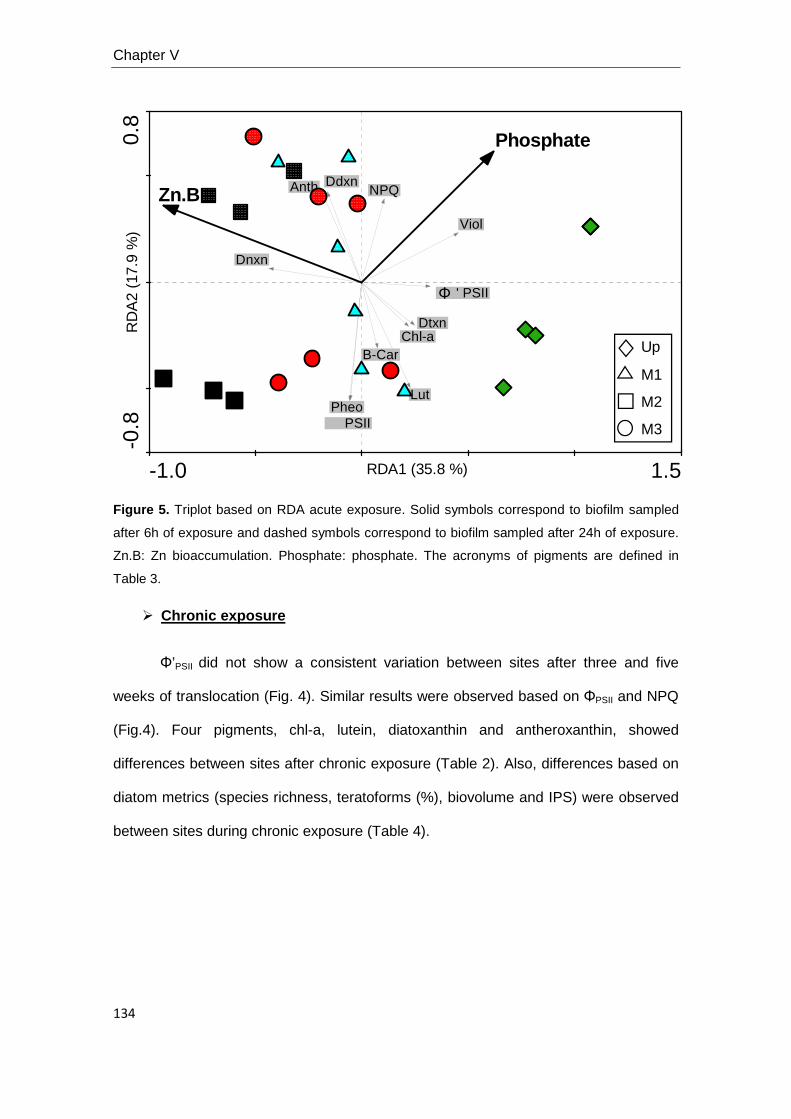
Chapter V
134
Figure 5. Triplot based on RDA acute exposure. Solid symbols correspond to biofilm sampled
after 6h of exposure and dashed symbols correspond to biofilm sampled after 24h of exposure.
Zn.B: Zn bioaccumulation. Phosphate: phosphate. The acronyms of pigments are defined in
Table 3.
Chronic exposure
Φ’PSII did not show a consistent variation between sites after three and five
weeks of translocation (Fig. 4). Similar results were observed based on ΦPSII and NPQ
(Fig.4). Four pigments, chl-a, lutein, diatoxanthin and antheroxanthin, showed
differences between sites after chronic exposure (Table 2). Also, differences based on
diatom metrics (species richness, teratoforms (%), biovolume and IPS) were observed
between sites during chronic exposure (Table 4).
-1.0 1.5
-0.8
0.8
Chl-a
Lut
Dtxn
Viol
Ddxn
Dnxn
Pheo
B-Car
Anth
PSII
' PSII
NPQ
Phosphate
Zn.B
Up
M1
M2
M3
RDA1 (35.8 %)
RD
A2
(17.
9 %
)
Φ

Field study, Zn toxicity on fluvial biofilm
135
Table 3. Results of RDA acute exposure (Fig.5). On the left, the fraction of total variance is
shown; bold is used to indicate the total variance higher than 10% for physicochemical variables
or metals. On the right, the fraction of explained variance (%) is shown: bold and underlined
values indicate biofilm metrics mainly related with physicochemical or metal variables (% of
explained variance >60 % for one group of variables and <30% for the other group of variables).
Table 4. Diatom metrics from biofilm translocated to Upstream, M1, M2 and M3 after 3 and 5
weeks of exposure. Each value corresponds to the AVG± SE; n=6. For each parameter,
different letters indicate significant differences (p<0.05) between sites after ANOVA and Tukey’s
HSD test.
The maximum length of the gradient (DCA) for the chronic exposure diatom
metrics data was 0.556 for chl-a fluorescence parameters, 0.846 for pigments and
0.504 for diatoms indicating that again linear methods would be appropriate (Ter Braak
ΦPSII 44.83 7.14 86.26 13.74
Φ'PSII 11.31 30.37 27.14 72.86
NPQ 29.66 0.62 97.95 2.05
Chl-a 0.03 25.34 0.12 99.88
Lutein (Lut) 8.64 49.11 14.96 85.04
Diatoxanthin (Dtxn) 0.30 29.82 1.00 99.00
Violaxanthin (Viol) 57.39 37.03 60.78 39.22
Diadinoxanthin (Ddxn) 7.95 29.98 20.96 79.04
Dinoxanthin (Dnxn) 17.31 59.84 22.44 77.56
Pheophytin-a (Pheo) 45.79 7.11 86.56 13.44
β-Carotene (B-Car) 6.70 10.52 38.91 61.09
Antheroxanthin (Anth) 6.20 34.04 15.41 84.59
Biofilm metrics
Fraction of total variance
MetalsPhysical and
chemical variables
Fraction of explained variance (%)
Physical and chemical variables
Metals
F(3,8) p value
37.83 (1.27)a 35.0 (1.93)ab 29.17 (1.30)b 39.17 (2.06)a 7.173 <0.05
0.54 (0.23)a 2.39 (0.56)b 3.35 (0.65)b 2.52 (0.25)b 10.33 <0.001
1358 (49.5)a 1830 (118.7)a 225.3 (26.45)b 1573 (83.6)a 178.78 <0.001
15.22 (0.16)a 14.25 (0.31)ac 8.62 (0.23)b 13.55 (0.21)c 159.4 <0.001
Chronic exposureANOVA
up stream M1
S
teratoforms (%)
biovolume
IPS
M2 M3
Chapter V
136
and Smilauer, 2002). RDA gathered a 68.6 % of the total variance and arranged the
cases maximizing the correlation with Zn and Fe bioaccumulation and Zn in water
(Fig.6). First axis explained 54.2 % of the variance and arranged biofilms along a joint
gradient of Zn bioaccumulation and Zn in water and Fe bioaccumulation (Fig.6).
Second axis explained 9.2 % of the total variance and showed mainly a gradient of Zn
in water (Fig.6). A positive correlation between Zn in water and Zn bioaccumulation in
biofilm was observed. Diatoms biovolume, IPS index, and zeaxanthin and β-carotene
pigments relative abundance were the biofilm metrics better explained (>60% of the
variance) by the model (Table 6). According to the first axis, biofilms from M2 were
strongly separated of biofilms from the other sites (Upstream, M1 and M3) because of the
higher amounts of bioaccumulated Zn and water Zn, and lower amounts of
bioaccumulated Fe than biofilms from Upstream, M1 and M3. Biofilms from M2 were
mainly characterized by a lower diatom biovolume, lower IPS value, and higher relative
abundance of zeaxanthin and lutein pigments than biofilm communities from Upstream,
M1 and M3 (Fig. 6). The percentage of diatom teratological forms was higher in mining
sites (M1, M2 and M3) than in Upstream , reaching the maximum values at M2 (Table 4).
The IPS values at Upstream , M1 and M3 qualify their biological status as “good quality”
whereas at M2 the IPS value corresponded to a “poor” biological status.

Field study, Zn toxicity on fluvial biofilm
137
Figure 6. Triplot based on redundancy analysis of RDA chronic exposure. Solid symbols
correspond to biofilm sampled after 3 weeks of exposure and dotted symbols correspond to
biofilm sampled after 5 weeks of exposure. Zn.B: Zn bioaccumulation, Zn.W: Zn dissolved in
water and Fe.B: Fe bioaccumulation. The acronyms of pigments are defined in table 3 and
those from diatoms metrics in table 4.
DISCUSSION
The experimental setup allowed us to simulate two different metal pollution
scenarios. First a low metal pollution scenario, characterized by elevated metal
contents in biofilms but not a detectable metal concentration increase in the water
phase (at sites M1 and M3). Secondly, a more clear case of metal pollution,
characterized by elevated Zn concentration in the water phase (above toxicity
thresholds) in addition to increased metals contents in biofilms that we define as a
moderate M-pollution scenario (Table 5). Metal concentration in water is highly variable
in time and space depending on the source of pollution (diffuse or point-source), the
hydrological regime and the processes affecting their transfer from the water phase to
-1.0 1.5
-0.8
0.8
S
% teratos
IPS
biovol Chl-a
Lut
Dtxn
Viol
Ddxn
Dnxn
Pheo
B-Car
Anth
Zea
NPQ
Zn.W
Fe.B Zn.B
Φ’PSII
Φ PSII
Up
M1
M2
M3
RDA1 (54.2 %)
RD
A2
(9.2
%)
Chapter V
138
other compartments. However, metal content in biofilms, may better reflect the real
metal exposure of biofilm organisms since metal content in biofilms integrate the
different biotic and abiotic processes occurring in biofilms through time (Guasch et al.,
2010).
In addition, it was also possible to simulate metal exposure scenarios of
different duration: 1) within 24h: simulating a short-term episode of metal pollution and
2) after several weeks: simulating a situation of chronic metal pollution.
Table 5. Summary of significant biofilm metrics showing metal toxicity and their potential
goodness associated as biological indicators for fluvial ecotoxicological studies. n.m.: not
measured, n.s.: no significant.
Bilofilm metrics
Metal bioaccumulation . The Zn content in biofilms from Upstream, the reference
site in Osor stream, ranged between 75 and 150 µgZn/gDW. Comparable values have
been found in biofilms at non-contaminated river sites (Ivorra et al., 1999; Behra et al.,
2002). Biofilms translocated to M1, M2 and M3 bioaccumulated enough Zn after few
Low
M-p
ollu
tion
Mod
erat
e M
-pol
lutio
n
Low
M-p
ollu
tion
Mod
erat
e M
-pol
lutio
n
Sen
sitiv
ity
Leve
l exp
osur
e-de
pend
ency
Spe
cific
ity
Fas
t effe
cts
dete
ctio
n
Chr
onic
effe
cts
dete
ctio
n
Eas
y to
mea
sure
M-bioac Zn-bioac
Chl-a fluor. Φ'PSII n.s. n.s.
Xantophylls cycle n.s. n.s.
Green algae & cyanobacteria
n.s. n.s. n.s.
Richness n.m. n.m. n.m.
Biovolume n.m. n.m. n.s. n.m.
% teratoforms n.m. n.m. n.m.
IPS n.m. n.m. n.m.
HPLC
Diatoms
biofilm analysis
biofilm metrics
SCENARIOSMETRICS GOODNESSShort-
exposureChronic-exposure

Field study, Zn toxicity on fluvial biofilm
139
hours of exposure (2.5 times more than biofilm translocated to Upstream) to produce
inhibitory effects on Φ’PSII and a change on the photosynthetic pigments composition in
spite of the low dissolved metal concentration found at M1 and M3. Our results are in
agreement with other studies which also observed that metal toxicity is more related to
metal bioaccumulation than to metal concentration in water (Bradac et al., 2009).
Furthermore, several weeks after the biofilm translocations, Zn bioaccumulation
continued increasing in the biofilms translocated to all metal-impacted sites but differed
between them. Zn bioaccumulation was 6 and 7 times higher at M1 and M3,
respectively, than in Upstream site, and 43 times higher at M2 site than at Upstream site. It
is known that biosorption of trace metals by algal cells generally increase with time of
exposure (Collard and Matagne, 1994). On the other hand, Ni, Cu, Al and Fe
accumulation didn’t increase with time of exposure, suggesting that the amounts
observed could be considered the background contents for the biofilm of this stream.
During this period, the RDA indicates that biofilm responses were mainly attributed to
metals: to Zn bioaccumulation, followed by Fe bioaccumulation and Zn in water.
According to the obtained results, metal -bioaccumulation (M-bioac.) is shown to be a
biofilm metric sensitive to short and chronic exposure scenarios, level exposure-
dependent and specific to metal pollution (Table 5).
Chl-a fluorescence parameters . Φ’PSII was inhibited at M1, M2 and M3 after
few hours of exposure following the same pattern than Zn bioaccumulation (RDA
analysis). This response could be explained by the mode of action of Zn targeting
several photosynthetic processes of algae and cyanobacteria (Admiraal et al., 1999;
Prasard et al., 1999). The observed decrease of Φ’PSII shows that Zn exposure caused
an inhibition of the electron transport flow during the light -dependent photosynthesis
activity (Juneau et al., 2007). Under microcosm’s conditions, where direct toxicity is
easier to assess, Corcoll et al. (2011) observed similar results at a similar

Chapter V
140
concentration (400 µgZn/L) after few hours of exposure. Similar effects were also
observed by Ivorra et al. (2000), two days after the addition of higher Zn concentrations
(2216 µgZn/L) on young biofilms. In contrast to Φ’PSII , ФPSII and NPQ did not show a
response linked to metal exposure, indicating that these parameters are less sensitive
to metal exposure. Under microcosm conditions, García-Meza et al. (2005) also
observed a higher sensitivity of Ф’PSII than ФPSII to Zn exposure (24h of exposure
biofilms to high Zn concentrations: 6500 and 65000 µgZn/L). After chronic exposure
(Table 5) biofilm communities from mining sites (M1, M2 and M3) did not show
alterations either in Φ’PSII, ΦPSII or NPQ attributed to metals, suggesting a recovery after
chronic exposure. The observed response could be attributed to an adaptation
process, where sensitive species to metals were replaced by tolerant ones. Similar
results were observed in biofilms exposed chronically to metals (García-Meza et al.,
2005; Serra et al., 2009). However, some authors found in microcosms experiments a
decrease of NPQ mechanisms after long term exposures of triclosan (Ricart et al.
2010b) or Zn (Corcoll et al. 2011). Temporal variability of ФPSII and NPQ (during acute
and chronic-exposures) was higher at Upstream and M1 than at M2 and M3, and was
attributed to physical and chemical variations. Overall, we can conclude that among the
chl-a fluorescence metrics investigated, which are relatively easy to measure, Φ’PSII is
the most sensitive metric that allow to detect quick effects of low and moderate M-
pollution (Table 5).
Pigments analysis . Focusing on photosynthetic pigments, concomitant effects
to the inhibition of Ф’PSII were observed during acute exposure. The RDA indicates that
Zn toxicity may enhance the synthesis of dinoxanthin as well as the synthesis of
antheroxanthin and diadinoxanthin, which could result from an activation of the
xanthophylls cycle of brown and green algae as protective mechanism to avoid Zn
toxicity (e.g. on Ф’PSII). Xanthophylls play an important role in the use of the excess in

Field study, Zn toxicity on fluvial biofilm
141
excited energy to avoid photoinhibition due to effects of high light irradiances or
chemical substances (e.g. metals) that could potentially block light-dependent
photosynthesis reactions (Armstrong and Hearst, 1996; Martínez-Abaigar and Núñez-
Olivera, 1998). Specifically, a way to dissipate this excess of excited energy that
arrives at the PSII is the xanthophylls cycle. In brown algae (dinoflagellates and
diatoms) and in green algae (chlorophytes) it occurs by the de-expoxidation reaction.
Diadinoxanthin is transformed into dinoxanthin / diatoxanthin (brown algae) and
violaxanthin into antheroxanthin or zeaxanthin (green algae) (Lohr and Wilhelm, 1999;
Jin et al., 2003). On the other hand, after chronic exposure biofilms from M2 presented
a higher relative abundance of lutein and zeaxanthin in comparision to biofilm
translocated to Upstream. The occurrence of lutein and zeaxanthin could be linked either
to the presence of green algae and cyanobacteria species, respectively, in biofilms
(Wilhelm, 1991) or to the synthesis of accessory pigments composing the light
harvesting complex as a mechanism to avoid a blockage of the light-dependent
photosynthesis reactions (Armstrong and Hearst, 1996). A negative correlation
between β-carotenes and violaxanthin with lutein and zeaxanthin, respectively, due to
carotenoids transformation would confirm this last hypothesis, (Armstrong and Hearst,
1996). Since, this situation was not observed in our study we have attributed the
increase of the abundance of lutein and zeaxanthin in M2 to a community composition
change: an increase in the abundance of green algae and cyanobacteria. Changes in
the community composition have been described previously in biofilms as a response
to an induction of tolerance to metals. For example, Corcoll et al. (2011) showed that
green algae and cyanobacteria were more selected after several weeks of Zn exposure
(400 µgZn/L) in microcosm experiments. A metal resistance of green algae and
cyanobacteria were also reported by Ivorra et al. (2000) and Genter et al. (1987) to Zn
exposures. Thus, based on pigment analysis we can conclude that pigments linked to
the xanthophylls cycle are suitable and sensitive biofilm metrics allowing the detection

Chapter V
142
of short-term effects caused by low and moderate M-pollution (Table 5). On the other
hand, photosynthetic pigments linked to different groups (green algae and
cyanobacteria) are less sensitive but dose-dependent biofilm metrics responding to
chronic and moderate M-pollution (Table 5).
Diatoms metrics. In agreement with our expectations, after a relatively long
period of exposure, metal effects on biofilms were mainly structural (species
composition). Diatoms, which presented a significant abundance (20-30%) in all biofilm
communities (Tlili et al. 2011), were strongly affected. Based on diatoms metrics,
biofilm communities from the highest Zn impacted site (M2) were largely different to
those from Upstream, M1 and M3. Among the 132 diatom taxa identified, the
assemblages were characterised by an association of Achnanthidium minutissimum
(Kützing) Czarnecki, A. pyrenaicum Hustedt, Cocconeis placentula var. placentula
Ehrenberg, C. placentula var. lineata (Ehrenberg) Van Heurck, C. placentula var.
euglypta (Ehrenberg) Grunow, Eolimna minima (Grunow) Lange-Bertalot and
Planothidium frequentissimum (Lange-Bertalot) Round & L. Bukhtiyarova. Diatom
communities of biofilm translocated to M2 were characterized by small-sized diatom
species (low biovolume), either pioneer, substrate-adherent species which are more
metal-tolerant (Medley and Clements, 1998), or species that are frequently reported in
metal-contaminated environments (Morin et al., in press). The decrease in the diatom
biovolume is associated with the predominance of smaller growth forms in the biofilms
in impacted sites (Sabater and Admiraal, 2005). IPS values recorded at M2 indicate a
“poor” biological quality of the water (according to the WFD) which supports its
relevance to assess chronic point sources of Zn pollution. However, though significant
differences between diatom richness (S) and IPS values were obtained between
Upstream, M1 and M3. Based on IPS, the water quality of these sites presented the same
category (“good” biological quality) according to the WFD. According to the results, the

Field study, Zn toxicity on fluvial biofilm
143
IPS is not sensitive enough to detect situations of diffuse pollution of Zn, given that Zn
bioaccumulation in biofilms from M1 and M3 was significantly higher than Upstream site
and the IPS index did not differentiate these situations. The limitations of IPS for the
assessment of metal pollutions have been recently pointed out (e.g. Morin et al. 2008)
and are mainly due to the fact that this index was originally built to assess trophic
pollution. The specific responses may however differ depending on the type of stressor
(trophic vs. toxic). More specific endpoints are needed, such as cell size decrease or
the occurrence of diatom deformities that was fairly high in M1, M2 and M3 (with values
> 1%, proving metal stress; Morin et al. in press). Combining both data on cell size and
abundances of deformities thus allows for the discrimination of different levels of metal
stress, lower in M1 and M3 (only deformities) than in M2 (where deformities are
associated to very low biovolumes). Thus, in chronic exposure scenarios the use of IPS
and diatoms richness offers a similar goodness to assess the effects of low and
moderate-M pollution in terms of sensitivity and level exposure-dependency. The
percentage of teratoforms will also provide specific information on metal pollution
(Table 5).
CONCLUSIONS
Our results indicate that the Zn concentrations found in Osor stream may
produce different damaging effects on biofilms depending on the time and intensity of
metal exposure. Early effects are mostly affecting biofilms function, supporting the use
of chl-a fluorescence techniques in combination with the analysis of the photosynthetic
pigments as signals of early toxicity. Longer-term exposure effects are better detected
using diatom indices and traits such as cell biovolume or deformities of diatoms.
Nevertheless, more research is needed to develop diatom indices that may allow
identifying situations of low metal pollution.
Overall, our results provide information about the goodness of several biofilm
metrics of interest to assess the effects of metal pollution. It also provides enough
Chapter V
144
evidences of occurrence and toxicity of Zn for recommending the inclusion of Zn in the
list of priority pollutants substances of the European Water Framework Directive.
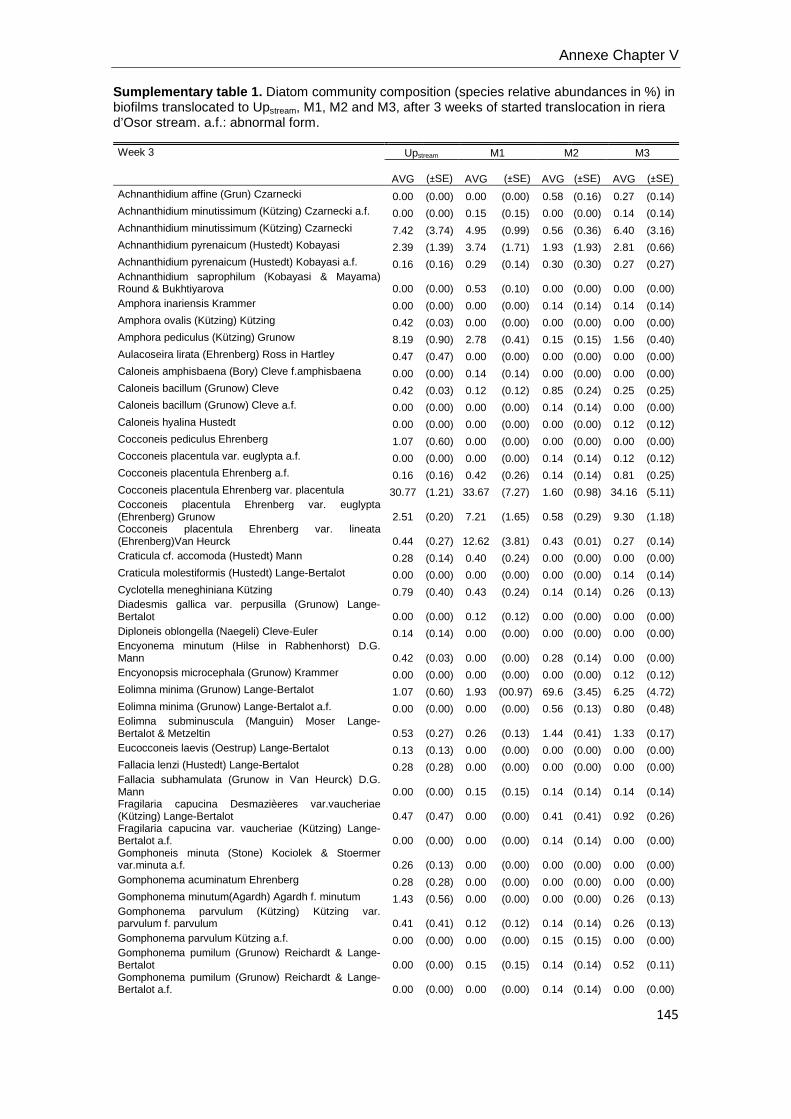
Annexe Chapter V
145
Sumplementary table 1. Diatom community composition (species relative abundances in %) in biofilms translocated to Upstream, M1, M2 and M3, after 3 weeks of started translocation in riera d’Osor stream. a.f.: abnormal form.
Week 3 Upstream M1 M2 M3
AVG
(±SE) AVG (±SE) AVG
(±SE) AVG
(±SE)
Achnanthidium affine (Grun) Czarnecki 0.00 (0.00) 0.00 (0.00) 0.58 (0.16) 0.27 (0.14) Achnanthidium minutissimum (Kützing) Czarnecki a.f. 0.00 (0.00) 0.15 (0.15) 0.00 (0.00) 0.14 (0.14) Achnanthidium minutissimum (Kützing) Czarnecki 7.42 (3.74) 4.95 (0.99) 0.56 (0.36) 6.40 (3.16) Achnanthidium pyrenaicum (Hustedt) Kobayasi 2.39 (1.39) 3.74 (1.71) 1.93 (1.93) 2.81 (0.66) Achnanthidium pyrenaicum (Hustedt) Kobayasi a.f. 0.16 (0.16) 0.29 (0.14) 0.30 (0.30) 0.27 (0.27) Achnanthidium saprophilum (Kobayasi & Mayama) Round & Bukhtiyarova 0.00 (0.00) 0.53 (0.10) 0.00 (0.00) 0.00 (0.00) Amphora inariensis Krammer 0.00 (0.00) 0.00 (0.00) 0.14 (0.14) 0.14 (0.14) Amphora ovalis (Kützing) Kützing 0.42 (0.03) 0.00 (0.00) 0.00 (0.00) 0.00 (0.00) Amphora pediculus (Kützing) Grunow 8.19 (0.90) 2.78 (0.41) 0.15 (0.15) 1.56 (0.40) Aulacoseira lirata (Ehrenberg) Ross in Hartley 0.47 (0.47) 0.00 (0.00) 0.00 (0.00) 0.00 (0.00) Caloneis amphisbaena (Bory) Cleve f.amphisbaena 0.00 (0.00) 0.14 (0.14) 0.00 (0.00) 0.00 (0.00) Caloneis bacillum (Grunow) Cleve 0.42 (0.03) 0.12 (0.12) 0.85 (0.24) 0.25 (0.25) Caloneis bacillum (Grunow) Cleve a.f. 0.00 (0.00) 0.00 (0.00) 0.14 (0.14) 0.00 (0.00) Caloneis hyalina Hustedt 0.00 (0.00) 0.00 (0.00) 0.00 (0.00) 0.12 (0.12) Cocconeis pediculus Ehrenberg 1.07 (0.60) 0.00 (0.00) 0.00 (0.00) 0.00 (0.00) Cocconeis placentula var. euglypta a.f. 0.00 (0.00) 0.00 (0.00) 0.14 (0.14) 0.12 (0.12) Cocconeis placentula Ehrenberg a.f. 0.16 (0.16) 0.42 (0.26) 0.14 (0.14) 0.81 (0.25) Cocconeis placentula Ehrenberg var. placentula 30.77 (1.21) 33.67 (7.27) 1.60 (0.98) 34.16 (5.11) Cocconeis placentula Ehrenberg var. euglypta (Ehrenberg) Grunow 2.51 (0.20) 7.21 (1.65) 0.58 (0.29) 9.30 (1.18) Cocconeis placentula Ehrenberg var. lineata (Ehrenberg)Van Heurck 0.44 (0.27) 12.62 (3.81) 0.43 (0.01) 0.27 (0.14) Craticula cf. accomoda (Hustedt) Mann 0.28 (0.14) 0.40 (0.24) 0.00 (0.00) 0.00 (0.00) Craticula molestiformis (Hustedt) Lange-Bertalot 0.00 (0.00) 0.00 (0.00) 0.00 (0.00) 0.14 (0.14) Cyclotella meneghiniana Kützing 0.79 (0.40) 0.43 (0.24) 0.14 (0.14) 0.26 (0.13) Diadesmis gallica var. perpusilla (Grunow) Lange-Bertalot 0.00 (0.00) 0.12 (0.12) 0.00 (0.00) 0.00 (0.00) Diploneis oblongella (Naegeli) Cleve-Euler 0.14 (0.14) 0.00 (0.00) 0.00 (0.00) 0.00 (0.00) Encyonema minutum (Hilse in Rabhenhorst) D.G. Mann 0.42 (0.03) 0.00 (0.00) 0.28 (0.14) 0.00 (0.00) Encyonopsis microcephala (Grunow) Krammer 0.00 (0.00) 0.00 (0.00) 0.00 (0.00) 0.12 (0.12) Eolimna minima (Grunow) Lange-Bertalot 1.07 (0.60) 1.93 (00.97) 69.6 (3.45) 6.25 (4.72) Eolimna minima (Grunow) Lange-Bertalot a.f. 0.00 (0.00) 0.00 (0.00) 0.56 (0.13) 0.80 (0.48) Eolimna subminuscula (Manguin) Moser Lange-Bertalot & Metzeltin 0.53 (0.27) 0.26 (0.13) 1.44 (0.41) 1.33 (0.17) Eucocconeis laevis (Oestrup) Lange-Bertalot 0.13 (0.13) 0.00 (0.00) 0.00 (0.00) 0.00 (0.00) Fallacia lenzi (Hustedt) Lange-Bertalot 0.28 (0.28) 0.00 (0.00) 0.00 (0.00) 0.00 (0.00) Fallacia subhamulata (Grunow in Van Heurck) D.G. Mann 0.00 (0.00) 0.15 (0.15) 0.14 (0.14) 0.14 (0.14) Fragilaria capucina Desmazièeres var.vaucheriae (Kützing) Lange-Bertalot 0.47 (0.47) 0.00 (0.00) 0.41 (0.41) 0.92 (0.26) Fragilaria capucina var. vaucheriae (Kützing) Lange-Bertalot a.f. 0.00 (0.00) 0.00 (0.00) 0.14 (0.14) 0.00 (0.00) Gomphoneis minuta (Stone) Kociolek & Stoermer var.minuta a.f. 0.26 (0.13) 0.00 (0.00) 0.00 (0.00) 0.00 (0.00) Gomphonema acuminatum Ehrenberg 0.28 (0.28) 0.00 (0.00) 0.00 (0.00) 0.00 (0.00) Gomphonema minutum(Agardh) Agardh f. minutum 1.43 (0.56) 0.00 (0.00) 0.00 (0.00) 0.26 (0.13) Gomphonema parvulum (Kützing) Kützing var. parvulum f. parvulum 0.41 (0.41) 0.12 (0.12) 0.14 (0.14) 0.26 (0.13) Gomphonema parvulum Kützing a.f. 0.00 (0.00) 0.00 (0.00) 0.15 (0.15) 0.00 (0.00) Gomphonema pumilum (Grunow) Reichardt & Lange-Bertalot 0.00 (0.00) 0.15 (0.15) 0.14 (0.14) 0.52 (0.11) Gomphonema pumilum (Grunow) Reichardt & Lange-Bertalot a.f. 0.00 (0.00) 0.00 (0.00) 0.14 (0.14) 0.00 (0.00)
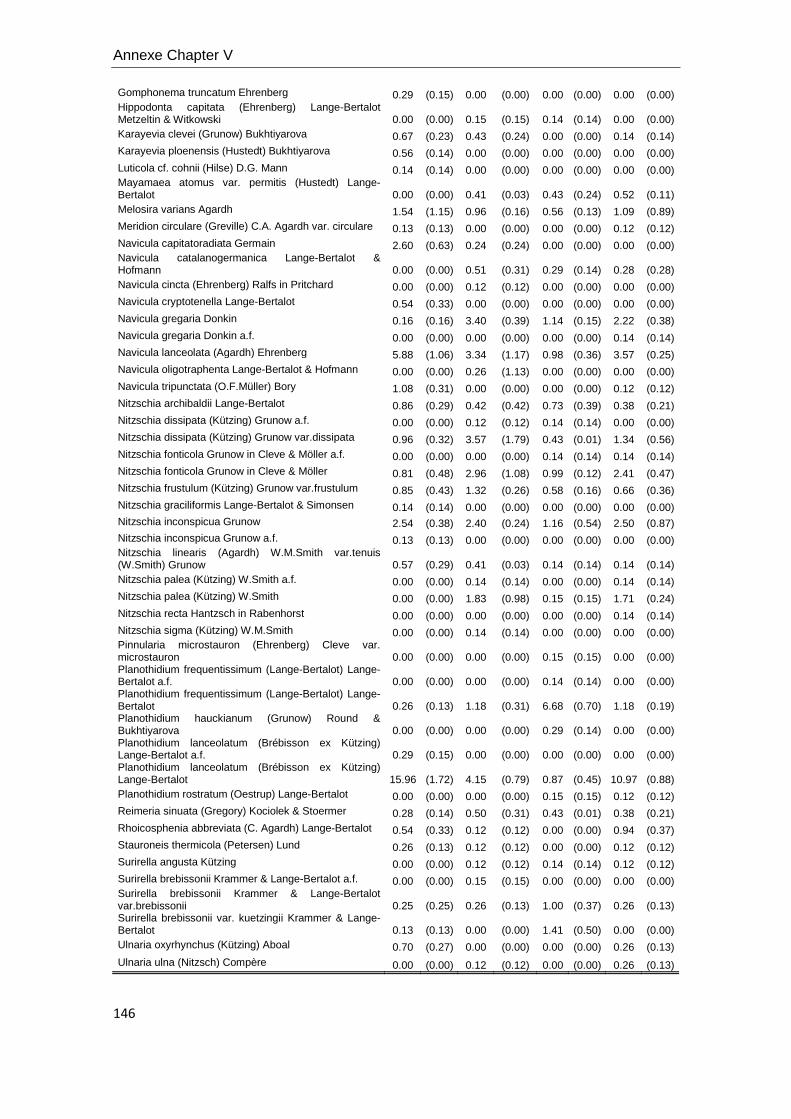
Annexe Chapter V
146
Gomphonema truncatum Ehrenberg 0.29 (0.15) 0.00 (0.00) 0.00 (0.00) 0.00 (0.00) Hippodonta capitata (Ehrenberg) Lange-Bertalot Metzeltin & Witkowski 0.00 (0.00) 0.15 (0.15) 0.14 (0.14) 0.00 (0.00) Karayevia clevei (Grunow) Bukhtiyarova 0.67 (0.23) 0.43 (0.24) 0.00 (0.00) 0.14 (0.14) Karayevia ploenensis (Hustedt) Bukhtiyarova 0.56 (0.14) 0.00 (0.00) 0.00 (0.00) 0.00 (0.00) Luticola cf. cohnii (Hilse) D.G. Mann 0.14 (0.14) 0.00 (0.00) 0.00 (0.00) 0.00 (0.00) Mayamaea atomus var. permitis (Hustedt) Lange-Bertalot 0.00 (0.00) 0.41 (0.03) 0.43 (0.24) 0.52 (0.11) Melosira varians Agardh 1.54 (1.15) 0.96 (0.16) 0.56 (0.13) 1.09 (0.89) Meridion circulare (Greville) C.A. Agardh var. circulare 0.13 (0.13) 0.00 (0.00) 0.00 (0.00) 0.12 (0.12) Navicula capitatoradiata Germain 2.60 (0.63) 0.24 (0.24) 0.00 (0.00) 0.00 (0.00) Navicula catalanogermanica Lange-Bertalot & Hofmann 0.00 (0.00) 0.51 (0.31) 0.29 (0.14) 0.28 (0.28) Navicula cincta (Ehrenberg) Ralfs in Pritchard 0.00 (0.00) 0.12 (0.12) 0.00 (0.00) 0.00 (0.00) Navicula cryptotenella Lange-Bertalot 0.54 (0.33) 0.00 (0.00) 0.00 (0.00) 0.00 (0.00) Navicula gregaria Donkin 0.16 (0.16) 3.40 (0.39) 1.14 (0.15) 2.22 (0.38) Navicula gregaria Donkin a.f. 0.00 (0.00) 0.00 (0.00) 0.00 (0.00) 0.14 (0.14) Navicula lanceolata (Agardh) Ehrenberg 5.88 (1.06) 3.34 (1.17) 0.98 (0.36) 3.57 (0.25) Navicula oligotraphenta Lange-Bertalot & Hofmann 0.00 (0.00) 0.26 (1.13) 0.00 (0.00) 0.00 (0.00) Navicula tripunctata (O.F.Müller) Bory 1.08 (0.31) 0.00 (0.00) 0.00 (0.00) 0.12 (0.12) Nitzschia archibaldii Lange-Bertalot 0.86 (0.29) 0.42 (0.42) 0.73 (0.39) 0.38 (0.21) Nitzschia dissipata (Kützing) Grunow a.f. 0.00 (0.00) 0.12 (0.12) 0.14 (0.14) 0.00 (0.00) Nitzschia dissipata (Kützing) Grunow var.dissipata 0.96 (0.32) 3.57 (1.79) 0.43 (0.01) 1.34 (0.56) Nitzschia fonticola Grunow in Cleve & Möller a.f. 0.00 (0.00) 0.00 (0.00) 0.14 (0.14) 0.14 (0.14) Nitzschia fonticola Grunow in Cleve & Möller 0.81 (0.48) 2.96 (1.08) 0.99 (0.12) 2.41 (0.47) Nitzschia frustulum (Kützing) Grunow var.frustulum 0.85 (0.43) 1.32 (0.26) 0.58 (0.16) 0.66 (0.36) Nitzschia graciliformis Lange-Bertalot & Simonsen 0.14 (0.14) 0.00 (0.00) 0.00 (0.00) 0.00 (0.00) Nitzschia inconspicua Grunow 2.54 (0.38) 2.40 (0.24) 1.16 (0.54) 2.50 (0.87) Nitzschia inconspicua Grunow a.f. 0.13 (0.13) 0.00 (0.00) 0.00 (0.00) 0.00 (0.00) Nitzschia linearis (Agardh) W.M.Smith var.tenuis (W.Smith) Grunow 0.57 (0.29) 0.41 (0.03) 0.14 (0.14) 0.14 (0.14) Nitzschia palea (Kützing) W.Smith a.f. 0.00 (0.00) 0.14 (0.14) 0.00 (0.00) 0.14 (0.14) Nitzschia palea (Kützing) W.Smith 0.00 (0.00) 1.83 (0.98) 0.15 (0.15) 1.71 (0.24) Nitzschia recta Hantzsch in Rabenhorst 0.00 (0.00) 0.00 (0.00) 0.00 (0.00) 0.14 (0.14) Nitzschia sigma (Kützing) W.M.Smith 0.00 (0.00) 0.14 (0.14) 0.00 (0.00) 0.00 (0.00) Pinnularia microstauron (Ehrenberg) Cleve var. microstauron 0.00 (0.00) 0.00 (0.00) 0.15 (0.15) 0.00 (0.00) Planothidium frequentissimum (Lange-Bertalot) Lange-Bertalot a.f. 0.00 (0.00) 0.00 (0.00) 0.14 (0.14) 0.00 (0.00) Planothidium frequentissimum (Lange-Bertalot) Lange-Bertalot 0.26 (0.13) 1.18 (0.31) 6.68 (0.70) 1.18 (0.19) Planothidium hauckianum (Grunow) Round & Bukhtiyarova 0.00 (0.00) 0.00 (0.00) 0.29 (0.14) 0.00 (0.00) Planothidium lanceolatum (Brébisson ex Kützing) Lange-Bertalot a.f. 0.29 (0.15) 0.00 (0.00) 0.00 (0.00) 0.00 (0.00) Planothidium lanceolatum (Brébisson ex Kützing) Lange-Bertalot 15.96 (1.72) 4.15 (0.79) 0.87 (0.45) 10.97 (0.88) Planothidium rostratum (Oestrup) Lange-Bertalot 0.00 (0.00) 0.00 (0.00) 0.15 (0.15) 0.12 (0.12) Reimeria sinuata (Gregory) Kociolek & Stoermer 0.28 (0.14) 0.50 (0.31) 0.43 (0.01) 0.38 (0.21) Rhoicosphenia abbreviata (C. Agardh) Lange-Bertalot 0.54 (0.33) 0.12 (0.12) 0.00 (0.00) 0.94 (0.37) Stauroneis thermicola (Petersen) Lund 0.26 (0.13) 0.12 (0.12) 0.00 (0.00) 0.12 (0.12) Surirella angusta Kützing 0.00 (0.00) 0.12 (0.12) 0.14 (0.14) 0.12 (0.12) Surirella brebissonii Krammer & Lange-Bertalot a.f. 0.00 (0.00) 0.15 (0.15) 0.00 (0.00) 0.00 (0.00) Surirella brebissonii Krammer & Lange-Bertalot var.brebissonii 0.25 (0.25) 0.26 (0.13) 1.00 (0.37) 0.26 (0.13) Surirella brebissonii var. kuetzingii Krammer & Lange-Bertalot 0.13 (0.13) 0.00 (0.00) 1.41 (0.50) 0.00 (0.00) Ulnaria oxyrhynchus (Kützing) Aboal 0.70 (0.27) 0.00 (0.00) 0.00 (0.00) 0.26 (0.13) Ulnaria ulna (Nitzsch) Compère 0.00 (0.00) 0.12 (0.12) 0.00 (0.00) 0.26 (0.13)

Annexe Chapter V
147
Sumplementary table 2. Diatom community composition (species relative abundances in %) in biofilms translocated to Upstream, M1, M2 and M3, after 5 weeks of started translocation in riera d’Osor stream. a.f.: abnormal form.
Week 5 Upstream M1 M2 M3
AVG (±SE) AVG (±SE) AVG (±SE) AVG (±SE)
Achnanthidium affine (Grunow) Czarnecki 0.73 (0.14) 0.00 (0.00) 0.00 (0.00) 0.00 (0.00) Achnanthidium eutrophilum (Lange-Bertalot) Lange-Bertalot
0.08 (0.08) 0.00 (0.00) 0.00 (0.00) 0.00 (0.00)
Achnanthidium minutissimum (Kützing) Czarnecki a.f. 0.00 (0.00) 0.18 (0.18) 0.64 (0.29) 0.24 (0.15)
Achnanthidium minutissimum (Kützing) Czarnecki 3.00 (0.45) 0.86 (0.31) 1.16 (0.59) 3.99 (1.27)
Achnanthidium pyrenaicum (Hustedt) Kobayasi 1.38 (0.78) 1.17 (0.42) 0.47 (0.26) 2.59 (1.12)
Achnanthidium pyrenaicum (Hustedt) Kobayasi a.f. 0.00 (0.00) 0.00 (0.00) 0.00 (0.00) 0.32 (0.06) Achnanthidium saprophilum (Kobayasi & Mayama) Round & Bukhtiyarova 0.00 (0.00) 0.00 (0.00) 0.23 (0.13) 1.24 (0.49)
Achnanthidium subatomus (Hustedt) Lange-Bertalot 0.24 (0.14) 0.09 (0.09) 0.00 (0.00) 0.00 (0.00)
Amphipleura cf. pellucida Kützing 0.00 (0.00) 0.00 (0.00) 0.00 (0.00) 0.08 (0.08)
Amphora copulata (Kützing) Schoeman & Archibald 0.08 (0.08) 0.08 (0.08) 0.00 (0.00) 0.00 (0.00)
Amphora pediculus (Kützing) Grunow 4.70 (0.34) 1.57 (0.66) 0.24 (0.14) 2.26 (0.73)
Caloneis bacillum (Grunow) Cleve 0.16 (0.08) 0.35 (0.18) 0.16 (0.08) 0.77 (0.30)
Cocconeis sp. a.f. 0.00 (0.00) 0.50 (0.28) 0.00 (0.00) 0.09 (0.09)
Cocconeis pediculus Ehrenberg 0.32 (0.08) 0.08 (0.08) 0.00 (0.00) 0.08 (0.08)
Cocconeis pediculus Ehrenberg a.f. 0.00 (0.00) 0.09 (0.09) 0.00 (0.00) 0.00 (0.00) Cocconeis placentula Ehrenberg var. euglypta (Ehrenberg) Grunow a.f. 0.00 (0.00) 0.08 (0.08) 0.00 (0.00) 0.00 (0.00)
Cocconeis placentula Ehrenberg a.f. 0.00 (0.00) 1.12 (0.19) 0.00 (0.00) 0.67 (0.32)
Cocconeis placentula Ehrenberg var. placentula 18.36 (1.13) 31.77 (3.17) 0.47 (0.22) 35.29 (3.45) Cocconeis placentula Ehrenberg var.euglypta (Ehrenberg) Grunow 0.41 (0.41) 6.53 (2.26) 0.24 (0.14) 12.37 (1.40)
Cocconeis placentula Ehrenberg var. lineata (Ehrenberg) Van Heurck 13.18 (1.32) 16.27 (2.20) 0.08 (0.08) 0.53 (0.28)
Cocconeis pseudolineata (Geitler) Lange-Bertalot 1.71 (1.00) 0.17 (0.08) 0.00 (0.00) 0.55 (0.18)
Cyclotella meneghiniana Kützing 0.32 (0.08) 0.34 (0.08) 0.00 (0.00) 0.16 (0.08)
Diadesmis biceps Arnott ex Grunow 0.08 (0.08) 0.00 (0.00) 0.00 (0.00) 0.09 (0.09) Diadesmis gallica var. perpusilla (Grunow) Lange-Bertalot 0.41 (0.17) 0.00 (0.00) 0.00 (0.00) 0.00 (0.00)
Diatoma mesodon (Ehrenberg) Kützing 0.08 (0.08) 0.00 (0.00) 0.00 (0.00) 0.00 (0.00)
Diploneis oblongella (Naegeli) Cleve-Euler 0.00 (0.00) 0.00 (0.00) 0.00 (0.00) 0.07 (0.07)
Encyonema minutum (Hilse in Rabhenhorst) D.G. Mann 0.00 (0.00) 0.36 (0.24) 0.08 (0.08) 0.47 (0.24)
Encyonema prostratum (Berkeley) Kützing 0.00 (0.00) 0.08 (0.08) 0.00 (0.00) 0.00 (0.00)
Eolimna minima (Grunow) Lange-Bertalot 2.34 (0.44) 1.11 (0.08) 61.99 (4.44) 2.59 (0.46)
Eolimna minima (Grunow) Lange-Bertalot a.f. 0.00 (0.00) 0.17 (0.08) 3.38 (0.80) 0.17 (0.09) Eolimna subminuscula (Manguin) Moser Lange-Bertalot & Metzeltin 1.13 (0.21) 0.18 (0.09) 0.49 (0.15) 0.59 (0.30)
Fallacia subhamulata (Grunow in Van Heurck) D.G. Mann
0.16 (0.16) 0.08 (0.08) 0.00 (0.00) 0.00 (0.00)
Fragilaria capucina Desmazières a.f. 0.00 (0.00) 0.00 (0.00) 0.08 (0.08) 0.07 (0.07)
Fragilaria capucina Desmazières var.capucina 0.00 (0.00) 0.00 (0.00) 0.08 (0.08) 0.00 (0.00) Fragilaria capucina Desmazières var.vaucheriae (Kützing) Lange-Bertalot 0.73 (0.13) 0.50 (0.39) 0.25 (0.25) 0.16 (0.08)
Fragilaria capucina var. vaucheriae (Kützing) Lange-Bertalot a.f.
0.00 (0.00) 0.00 (0.00) 0.08 (0.08) 0.00 (0.00)
Gomphoneis minuta (Stone) Kociolek & Stoermer var.minuta 0.16 (0.08) 0.00 (0.00) 0.00 (0.00) 0.00 (0.00)
Gomphonema clavatum Ehrenberg 0.08 (0.08) 0.00 (0.00) 0.00 (0.00) 0.00 (0.00)
Gomphonema micropus Kützing var. micropus 0.08 (0.08) 0.17 (0.17) 0.00 (0.00) 0.00 (0.00)
Gomphonema minutum (Agardh) Agardh f. minutum 0.24 (0.14) 0.09 (0.09) 0.00 (0.00) 0.00 (0.00) Gomphonema olivaceum var. olivaceum (Hornemann) Brebisson 0.16 (0.08) 0.00 (0.00) 0.00 (0.00) 0.08 (0.08)
Gomphonema parvulum (Kützing) Kützing var. parvulum f. parvulum 0.65 (0.09) 0.18 (0.18) 0.23 (0.13) 0.80 (0.16)
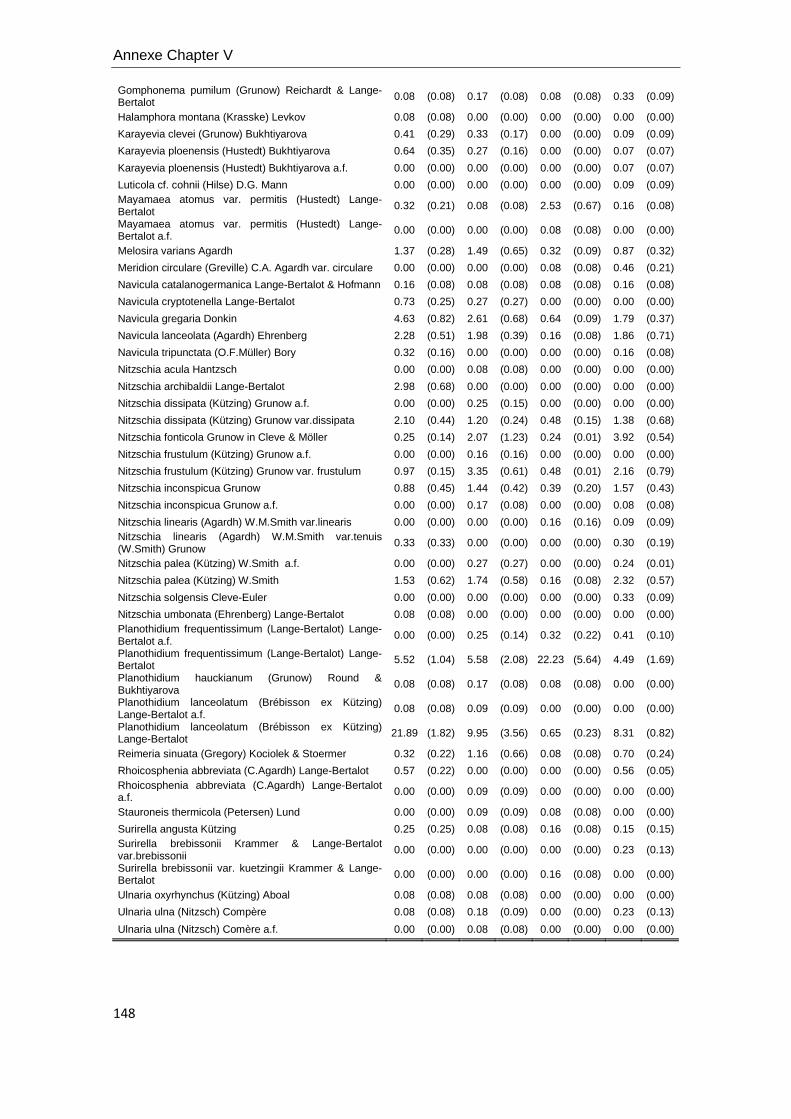
Annexe Chapter V
148
Gomphonema pumilum (Grunow) Reichardt & Lange-Bertalot 0.08 (0.08) 0.17 (0.08) 0.08 (0.08) 0.33 (0.09)
Halamphora montana (Krasske) Levkov 0.08 (0.08) 0.00 (0.00) 0.00 (0.00) 0.00 (0.00)
Karayevia clevei (Grunow) Bukhtiyarova 0.41 (0.29) 0.33 (0.17) 0.00 (0.00) 0.09 (0.09)
Karayevia ploenensis (Hustedt) Bukhtiyarova 0.64 (0.35) 0.27 (0.16) 0.00 (0.00) 0.07 (0.07)
Karayevia ploenensis (Hustedt) Bukhtiyarova a.f. 0.00 (0.00) 0.00 (0.00) 0.00 (0.00) 0.07 (0.07)
Luticola cf. cohnii (Hilse) D.G. Mann 0.00 (0.00) 0.00 (0.00) 0.00 (0.00) 0.09 (0.09) Mayamaea atomus var. permitis (Hustedt) Lange-Bertalot 0.32 (0.21) 0.08 (0.08) 2.53 (0.67) 0.16 (0.08)
Mayamaea atomus var. permitis (Hustedt) Lange-Bertalot a.f. 0.00 (0.00) 0.00 (0.00) 0.08 (0.08) 0.00 (0.00)
Melosira varians Agardh 1.37 (0.28) 1.49 (0.65) 0.32 (0.09) 0.87 (0.32)
Meridion circulare (Greville) C.A. Agardh var. circulare 0.00 (0.00) 0.00 (0.00) 0.08 (0.08) 0.46 (0.21)
Navicula catalanogermanica Lange-Bertalot & Hofmann 0.16 (0.08) 0.08 (0.08) 0.08 (0.08) 0.16 (0.08)
Navicula cryptotenella Lange-Bertalot 0.73 (0.25) 0.27 (0.27) 0.00 (0.00) 0.00 (0.00)
Navicula gregaria Donkin 4.63 (0.82) 2.61 (0.68) 0.64 (0.09) 1.79 (0.37)
Navicula lanceolata (Agardh) Ehrenberg 2.28 (0.51) 1.98 (0.39) 0.16 (0.08) 1.86 (0.71)
Navicula tripunctata (O.F.Müller) Bory 0.32 (0.16) 0.00 (0.00) 0.00 (0.00) 0.16 (0.08)
Nitzschia acula Hantzsch 0.00 (0.00) 0.08 (0.08) 0.00 (0.00) 0.00 (0.00)
Nitzschia archibaldii Lange-Bertalot 2.98 (0.68) 0.00 (0.00) 0.00 (0.00) 0.00 (0.00)
Nitzschia dissipata (Kützing) Grunow a.f. 0.00 (0.00) 0.25 (0.15) 0.00 (0.00) 0.00 (0.00)
Nitzschia dissipata (Kützing) Grunow var.dissipata 2.10 (0.44) 1.20 (0.24) 0.48 (0.15) 1.38 (0.68)
Nitzschia fonticola Grunow in Cleve & Möller 0.25 (0.14) 2.07 (1.23) 0.24 (0.01) 3.92 (0.54)
Nitzschia frustulum (Kützing) Grunow a.f. 0.00 (0.00) 0.16 (0.16) 0.00 (0.00) 0.00 (0.00)
Nitzschia frustulum (Kützing) Grunow var. frustulum 0.97 (0.15) 3.35 (0.61) 0.48 (0.01) 2.16 (0.79)
Nitzschia inconspicua Grunow 0.88 (0.45) 1.44 (0.42) 0.39 (0.20) 1.57 (0.43)
Nitzschia inconspicua Grunow a.f. 0.00 (0.00) 0.17 (0.08) 0.00 (0.00) 0.08 (0.08)
Nitzschia linearis (Agardh) W.M.Smith var.linearis 0.00 (0.00) 0.00 (0.00) 0.16 (0.16) 0.09 (0.09) Nitzschia linearis (Agardh) W.M.Smith var.tenuis (W.Smith) Grunow
0.33 (0.33) 0.00 (0.00) 0.00 (0.00) 0.30 (0.19)
Nitzschia palea (Kützing) W.Smith a.f. 0.00 (0.00) 0.27 (0.27) 0.00 (0.00) 0.24 (0.01)
Nitzschia palea (Kützing) W.Smith 1.53 (0.62) 1.74 (0.58) 0.16 (0.08) 2.32 (0.57)
Nitzschia solgensis Cleve-Euler 0.00 (0.00) 0.00 (0.00) 0.00 (0.00) 0.33 (0.09)
Nitzschia umbonata (Ehrenberg) Lange-Bertalot 0.08 (0.08) 0.00 (0.00) 0.00 (0.00) 0.00 (0.00) Planothidium frequentissimum (Lange-Bertalot) Lange-Bertalot a.f. 0.00 (0.00) 0.25 (0.14) 0.32 (0.22) 0.41 (0.10)
Planothidium frequentissimum (Lange-Bertalot) Lange-Bertalot 5.52 (1.04) 5.58 (2.08) 22.23 (5.64) 4.49 (1.69)
Planothidium hauckianum (Grunow) Round & Bukhtiyarova
0.08 (0.08) 0.17 (0.08) 0.08 (0.08) 0.00 (0.00)
Planothidium lanceolatum (Brébisson ex Kützing) Lange-Bertalot a.f. 0.08 (0.08) 0.09 (0.09) 0.00 (0.00) 0.00 (0.00)
Planothidium lanceolatum (Brébisson ex Kützing) Lange-Bertalot 21.89 (1.82) 9.95 (3.56) 0.65 (0.23) 8.31 (0.82)
Reimeria sinuata (Gregory) Kociolek & Stoermer 0.32 (0.22) 1.16 (0.66) 0.08 (0.08) 0.70 (0.24)
Rhoicosphenia abbreviata (C.Agardh) Lange-Bertalot 0.57 (0.22) 0.00 (0.00) 0.00 (0.00) 0.56 (0.05) Rhoicosphenia abbreviata (C.Agardh) Lange-Bertalot a.f. 0.00 (0.00) 0.09 (0.09) 0.00 (0.00) 0.00 (0.00)
Stauroneis thermicola (Petersen) Lund 0.00 (0.00) 0.09 (0.09) 0.08 (0.08) 0.00 (0.00)
Surirella angusta Kützing 0.25 (0.25) 0.08 (0.08) 0.16 (0.08) 0.15 (0.15) Surirella brebissonii Krammer & Lange-Bertalot var.brebissonii 0.00 (0.00) 0.00 (0.00) 0.00 (0.00) 0.23 (0.13)
Surirella brebissonii var. kuetzingii Krammer & Lange-Bertalot 0.00 (0.00) 0.00 (0.00) 0.16 (0.08) 0.00 (0.00)
Ulnaria oxyrhynchus (Kützing) Aboal 0.08 (0.08) 0.08 (0.08) 0.00 (0.00) 0.00 (0.00)
Ulnaria ulna (Nitzsch) Compère 0.08 (0.08) 0.18 (0.09) 0.00 (0.00) 0.23 (0.13)
Ulnaria ulna (Nitzsch) Comère a.f. 0.00 (0.00) 0.08 (0.08) 0.00 (0.00) 0.00 (0.00)

CHAPTER VI
LIGHT HISTORY INFLUENCES THE RESPONSE OF FLUVIAL
BIOFILMS TO ZN EXPOSURE


Light stress and Zn toxicity
151
INTRODUCTION
Fluvial biofilms are phytobenthic communities composed mainly by algae,
cyanobacteria, fungi, bacteria and protozoa embedded in a polysaccharide matrix on
benthic substrata, and are responsible for most of the primary production in many
fluvial ecosystems (Sabater et al., 2007; Romaní et al., 2010). Within biofilm
processes, photosynthesis is critical for fitness and survival of algae and
cyanobacteria. These communities are frequently exposed to strong spatial and
temporal variations of light regime, from 20 µmols photons/m2/s in shaded sites to full
sunlight (1700 µmols photons/m2/s) (Guasch and Sabater, 1998)., as well as other
environmental stresses such as low temperature, drought or nutrient deficiency.
Seasonal fluctuations in light intensity are related to the riparian vegetation canopy
(open versus close canopy cover sites), and play an important role in the development
of the structure and composition of biofilms. In headwaters and medium-sized rivers
where riparian vegetation casts its shade on the benthic autotrophs, light may become
a limiting factor below 25 µmols photons/m2/s (Hill, 1996). Hence, biofilms
photosynthetically adapted to shade or sun conditions will present a different efficiency
in the use of light energy for photosynthetic processes; biofilms adapted to shade
conditions are more efficient in the use of light energy than those that are adapted to
sunlight (Guasch and Sabater, 1998; Roberts et al., 2004; Villeneuve et al., 2010).
Furthermore, biofilms are also exposed to diurnal fluctuations in light intensity
(occurring in a period of a few hours), which can result in the absorption of more light
energy than can be utilized productively by photosynthesis. Under these conditions,
safe dissipation of excess photons and electrons is necessary to protect the
photosynthetic apparatus from light-induced damage (Niyogi, 2000). When considering
short time scales, microalgae respond to light increase by a photoinhibition of
photosynthesis efficiency while light decrease is expected to enhance photosynthesis
efficiency (Laviale et al., 2009). Among the different photoprotective mechanisms, the

Chapter VI
152
production of carotenoids, especially those of the xanthophyll cycle, can help to
dissipate energy excess throughout thermal radiation. Specifically, in diatoms, a way to
dissipate this excess of excited energy arriving at the PSII is the xanthophylls cycle
through the de-epoxidation reaction (DR) that transforms diadinoxanthin into
diatoxanthin pigments (Lohr and Wilhelm, 1999; Jin et al., 2003). This process, which is
part of so-called non-photochemical quenching, NPQ, (Müller et al., 2001), has been
recently studied in diatoms of biofilm communities (Serôdio et al., 2005; Laviale et al.,
2009; Chevalier et al., 2010), finding a strong correlation between NPQ increase and
DR activation when biofilms are exposed to increasing light irradiances.
Regarding metal pollution in freshwater ecosystems, Zn plays an important role
due to its widespread occurrence and toxicity in fluvial biofilms. Zn pollution in fluvial
ecosystems has been described from low concentrations, ranging between 150 and
600 µgZn/L (Le Faucheur et al., 2005; Tlili et al. 2011), to higher concentrations
ranging between 1000 and 3000 µgZn/L (Ivorra et al., 1999,2000; Morin et al., 2007;
Bonnineau et al., 2011). Damage caused on functional processes, such as
photosynthetic activity or the synthesis of photosynthetic accessory pigments (Ivorra et
al., 2000; Corcoll et al., submitted) and phytochelatins (Le Faucheur et al., 2005) has
been atributed to Zn toxicity on biofilms. At structural level, several studies reported Zn
effects on the diatom community, such as a decrease in the number of species (diatom
richness) and/or the replacement of sensitive species by tolerant ones (Ivorra et al.,
2000; Morin et al., 2007; Corcoll et al., submitted). In this study, Zn was selected to
evaluate, in controlled conditions, the interaction between light stress and Zn toxicity
due to their frequent co-occurrence in nature.
The influence of light history on biofilm sensitivity to chemical stress (i.e.
atrazine herbicide) has already been demonstrated (Guasch and Sabater, 1998;
Guasch et al. 2003); biofilms from open sites (with high light irradiation) were more
sensitive to atrazine than those growing in low light. Moreover, effects of the co-
Light stress and Zn toxicity
153
occurrence of chemical exposure (i.e. isoproturon herbicide) and light stress on biofilms
were also investigated (Laviale et al., 2010), showing that a dynamic light regime
increased periphyton sensitivity to isoproturon by increasing photosynthesis inhibition
and challenging its photoprotective mechanisms, such as the xanthophyll cycle. Since
chemical stress is expected to differ depending on light history; the different response
of shade or sun-adapted communities to the co-occurrence of two different stress
factors: chemical toxicity and light stress deserves further investigations.
The aim of this study was to evaluate the biofilm response to a multiple-stress
situation, i.e. environmental stress caused by light and Zn toxicity. Also, the study
aimed to assess if adaptation to one of these stress factors (i.e. light) modifies this
response. In order to reach this goal, shade- and sun-adapted biofilm communities
were first obtained. These communities were then exposed to different light intensities
(10, 25, 50, 100, 250 and 500 µmols photons/m2/s) and Zn (1500 µgZn/L). Chl-a
fluorescence parameters and photosynthetic pigments were analyzed to characterise
photosynthetic mechanisms of adaptation and to evaluate short-term responses.
We hypothesize that Zn will affect the phenotypic plasticity of biofilms to
regulate light stress and avoid photodamage. In particular, it is expected that Zn will
reduce the operation of photoprotective mechanisms, such as NPQ and the
xanthophyll cycle (Serôdio et al., 2005; Laviale et al., 2009; Chevalier et al., 2010) of
biofilms in a light stress situation. It is also expected that photoadaptation will influence
their sensitivity to light stress and Zn toxicity due to differences in pigment composition,
specifically those linked with the xanthophyll cycle (Guasch and Sabater, 1998; Laviale
et al., 2009; Chevalier et al., 2010)

Chapter VI
154
BIOFILM COLONIZATION
Fluvial biofilms were grown during four weeks (colonization period) in microcosm
conditions using an experimental set-up of nine perspex channels (Serra et al., 2009).
Carbon-dechlorinaded tap water supplied from 10 L carboys was located at the end of
each channel and was recirculated at a rate of 1 L/min through centrifuge pumps.
Water from channels was renewed three times a week. In each water renewal, 30
µgPO43-/L (nominal concentration) were added as KH2PO4 (Merck, Darmstadt,
Germany) to avoid phosphate limitation. During the colonization period, water was
sampled periodically to determine physical and chemical parameters (temperature, pH,
dissolved oxygen and conductivity), phosphate concentration, and the major cations
and anions. Glass substrata (1x1cm2) were placed at the bottom of each channel to
facilitate colonization. Biofilm communities were obtained from field inocula after
scraping three cobbles of the Llémena River. This stream is a small calcareous
tributary of the Ter River (NE Spain) and considered not polluted (ACA, Catalan Water
Agency). During the four weeks of the biofilm colonization period, a new biofilm inocula
was provided to each channel once a week. Throughout colonization, bioflms had three
different light conditions. Three channels were used for biofilm colonization under a low
light intensity of 25 µmols photons /m2 /s, far from saturating (Hill, 1996). This
community is referred to in the text as LL biofilm. Three other channels were used for
biofilm colonization under a medium light intensity of 100 µmols photons /m2 /s, within
the range of light saturation conditions commonly reported for natural stream
communities (Hill, 1996). This community is referred to as ML biofilm. The remaining
three channels were used for the colonization of biofilm al high light intensity of 500
µmols photons /m2 /s which is comparable to light inhibition levels (Hill, 1996). This
community is referred to in the text as HL biofilm (Table 1). Light was provided by LEDs
lamps (Lightech, Spain) and the light regime was 12:12h light:dark cycle. Light intensity

Light stress and Zn toxicity
155
was checked twice a week with an underwater cell (LI-COR Inc., Lincoln, Nebraska,
USA) placed above the colonized glass substrata.
BIOFILM SAMPLING
At the end of the colonization period, the different biofilm communities obtained
were characterized (Table 1) in terms of chl-a concentration (Chl-a), ash free dry
weight (AFDW), extracellular polymeric substances (EPS), algal groups, diatoms
taxonomy, photosynthetic pigments and electron transport rate vs. irradiance (ETR-I)
curves (see biofilm analysis section). For this purpose, one glass substrata from each
channel was sampled at the end of the colonization period for Chl-a, AFDW, EPS, algal
groups and photosynthetic pigment analysis, and three glass substrata for ETR-I
curves. Algal groups and ETR-I curves were measured immediately by PhytoPAM
instrument (see biofilm analysis section). As this technique is not destructive, the
sample was fixed with formaldehyde (final concentration 4%) after the PAM
measurements and used for further diatoms taxonomy analysis.
Samples for pigments were stored at -80ºC, and those for AFDW and EPS at -
20ºC until analysis.
Table 1. Experimental design including the list of endpoints measured and the light and Zn
conditions tested.
SHORT-TERM TOXICITY TESTS
After the biofilm colonization period, a short-term toxicity test (6h) was
performed with LL, ML and HL biofilms exposed to different light intensities and Zn
Light colonization
(µmols phot/m2/s)
Light incubation
(µmols phot/m2/s) Zn exposure
(µg Zn/L)biofilm endpoints
Φ'PSII, ΦPSII, NPQ, DR
ETR-I curves, photosynthetic pigments, Chl-a, AFDW, EPS, algal groups, diatom taxonomy
Biofilm colonization (lasted 4 weeks)
Light and Zn toxicity tests (lasted 6h)
25-100-500
10-25-50-100-250-500 0-1500

Chapter VI
156
concentrations to assess the effects of Zn when a sudden increase or decrease in light
irradiance was also taking place (Table 1). This test is named in the text as Light and
Zn toxicity test. It was performed in vials (10ml) containing a single colonized glass
substrata. Biofilms were incubated for 6h at 10, 25, 50, 100, 250 and 500 µmols
photons /m2/s and exposed to 1500 µgZn/L (Zn treatment) or 0 µgZn/L (NoZn
treatment). The concentration of 1500 µgZn/L was chosen because it was expected to
cause effects on the biofilm after the short duration of exposure (Paulsson et al., 2000;
Corcoll et al., 2011) and due to its realistic environmental concentration (Morin et al.,
2008; Bonnineau et al., 2011).
During incubation, samples were constantly agitated using single-speed orbital
mixers (KS260 Basic, IKA®). Light was provided by the same LEDs lamps (Lightech,
Spain) used during colonization and Zn was added as zinc chloride (ZnCl2; Zn titrisol,
Merck, Darmstadt, Germany). Biofilm samples were taken at the end of the exposure
(6h) to measure photochemical and non-photochemical quenching parameters and
analyze photosynthetic pigments (see biofilm analysis section for more details). A total
of 3 toxicity tests were run: one for LL biofilms, one for ML biofilms and one for HL
biofilms. 36 glass substrata were used for each test: 3 replicates (provided from each
channel), six light levels (10, 25, 50, 100, 250 and 500 µmols photons /m2/s) and two
concentrations (0 and 1500 µgZn/L). Growth light conditions were always included and
considered as controls in the tests performed.
ELECTRON TRANSPORT RATE – IRRADIANCE CURVES
At the end of the colonization period, three glass substrata were sampled from
each channel to analyse electron transport rate-ETR vs. irradiances-I curves (ETR-I
curves) by in vivo chl-a fluorescence measurements using the Phyto-PAM fluorometer
(Heinz Walz, Germany). The PhytoPAM instrument offers the possibility to perform
“rapid light curves-RLC” from 1 to 600 µmols photons/m2/s light intensities with
Light stress and Zn toxicity
157
illumination intervals at 10s. By using rapid light curves, relevant information on the
saturation characteristics of electron transport can be obtained (Schreiber et al., 1997;
Rascher et al., 2000). The relationship between the ETR and irradiances were fitted to
the Eilers and Peeters curve-fitting model (1988). Photosynthetic parameters assessed
with this model were: the initial slope of ETR (α) which expresses the efficiency of light
use, the maximal electron transport rate (ETRm) and the light of the semi-saturation
parameter (Ik). The use of RLCs to describe ETR-I relationships has been
demonstrated successfully in other studies of benthic algal communities (Kühl et al.,
2001; Roberts et al., 2004).
DATA ANALYSIS
ANOVA one-way. To examine differences between light treatments (LL, ML
and HL) in physical and chemical data of water (Table 2) and biofilm metrics (Chl-a,
AFDW, EPS content, algal groups: Fo(Bl), Fo(Br), Fo(Gr), diatom richness (S), diatom
diversity (H’), relative abundance of diatom species, α, ETRm and Ik parameters) after
colonization period, a one-way ANOVA test followed by a Tukey post hoc test
(p<0.05) was performed. In the first case (physical and chemical parameters), the
analysis included data from 3 to 24 sampling times (n= 9 – 84) along the colonization
period whereas biofilm metrics were compared at the end of the period (n=3). For light
and Zn toxicity tests, one-way ANOVA test was also used to detect differences of Φ’PSII
and ΦPSII parameters between biofilms exposed to Zn and those non-exposed. Before
all ANOVA tests, data were transformed to achieve normality.
ANOVA three-ways. To test for effects of light regime during colonization (Light
colonization-Lcol), irradiance of incubation (Light incubation-Linc) and biofilm sensitivity
to Zn (Zn exposure-Zn) a three-way ANOVA test was applied. The analysis included
three factors: light conditions during colonization, with three levels (LL, ML and HL),
incubation light- with six levels (10, 25, 50, 100, 250 and 500) and Zn exposure with

Chapter VI
158
two levels (0, 1500). The interactions between these factors were also evaluated. The
SPSS software was used for all ANOVA analyses.
Principal Component Analysis (PCA) and clustering analysis . To explore
the ordination of biofilm samples according to photosynthetic pigments, a principal
component analysis (PCA) was done using CANOCO software version 4.5 (Ter Braak
and Smilauer, 2002). Comparison of photosynthetic pigments and diatom communities
was done with cluster analysis (average linkage method and Bray-Curtis dissimilarity
coefficient) by means of PRIMER-6 software (Clarke and Gorley, 2005). Before
analysis, all data were square root transformed. Only diatom species representing
more than 1% relative abundance were included. The Simprof test was used to test
significant differences (p<0.05) between cluster groups.
Linear regression analysis . To test the relationship between DR and NPQ
during light and Zn toxicity tests, data of DR and NPQ were adjusted to a linear
regression model according to Chevalier et al. (2010) by SigmaPlot software. When
significant correlations between DR and NPQ were found (p<0.05), the obtained slope
parameter (b) was used for comparing kinetics between biofilm communities
RESULTS
Water physical and chemical characteristics
Physical and chemical conditions, nutrient concentrations as well as the major anions
and cations remained stable during the colonization period and were similar between
light colonization treatments (p>0.05, Table 2). Light intensity of each light colonization
treatment (25, 100 and 500 µmols photons /m2/s, respectively) remained stable along
biofilm colonization, varying in all cases <10 %. Measured Zn concentrations during
light and Zn toxicity tests were 14.78±14.47 µg Zn/L in the NoZn treatment (AVG±SD;
n=3) and 1400.67±99.22 µg Zn /L in the Zn treatment (AVG±SD; n=3).

Light stress and Zn toxicity
159
Table 2 . Summary of physical and chemical characterization of water during the biofilm
colonization period. LL: corresponds to light treatment of 25 µmols photons /m2/s; ML:
corresponds to light treatment of 100 µmols photons /m2/s and HL: corresponds to light
treatment of 500 µmols photons /m2/s.
Biofilm communities after the colonization period
Based on ETR-I curve parameters (Table 3), LL and ML biofilms had similar
initial slopes (α) which were significantly higher than those from HL biofilms (Table 3).
LL and ML biofilms had similar semi-saturation irradiances (Ik) which were lower than
those from HL biofilms (Table 3). Chl-a concentration was higher for LL biofilms than
for ML and HL biofilms (F=61.57; p<0.001) (Fig.1a). The content of extracellular
polymeric substances (EPS) was lower in LL biofilms than for ML and HL biofilms (F=
61.57; p<0.001) (Fig.1a). Total biofilm biomass was lower for LL biofilms than for ML
and HL biofilms (F= 72.96; p<0.001) (Fig.1a) leading to an autotrophic index (Chl-
a/AFDW) 10 times higher in LL biofilms than for ML and HL biofilms (F= 10.93;
p<0.001) (Fig.1a).
LL ML HL
AVG ± SD AVG ± SD AVG ± SD
pH 8.38 ± 0.17 8.35 ± 0.19 8.37 ± 0.20 87
Cond (µS/cm) 409.2 ± 25.3 402.6 ± 23.9 404.2 ± 26.9 87
Oxy (mg/L) 9.23 ± 0.22 9.31 ± 0.31 9.30 ± 0.35 87
Temp (ºC) 17.72 ± 1.19 17.53 ± 1.37 17.62 ± 1.50 87
K+ (mg/L) 5.18 ± 0.97 5.1 ± 0.66 5.07 ± 0.55 9
Ca2+ (mg/L) 121.9 ± 4.6 119.6 ± 15.8 119.6 ± 8.2 9
Mg2+ (mg/L) 21.99 ± 2.32 23.09 ± 3.64 22.68 ± 1.88 9
Cl - (mg/L) 30.99 ± 3.23 29.68 ± 1.40 31.79 ± 2.52 9
SO42- (mg/L) 56.08 ± 7.39 69.40 ± 37.28 59.63 ± 10 9
NO3- (mg/L) 0.55 ± 0.07 0.51 ± 0.04 0.55 ± 0.06 9
NO2- (mg/L) 0.11 ± 0.01 0.09 ± 0.03 0.11 ± 0.02 9
PO43- (µg/L) 28.07 ± 25.81 28.04 ± 23.76 28.18 ± 23.72 24
n
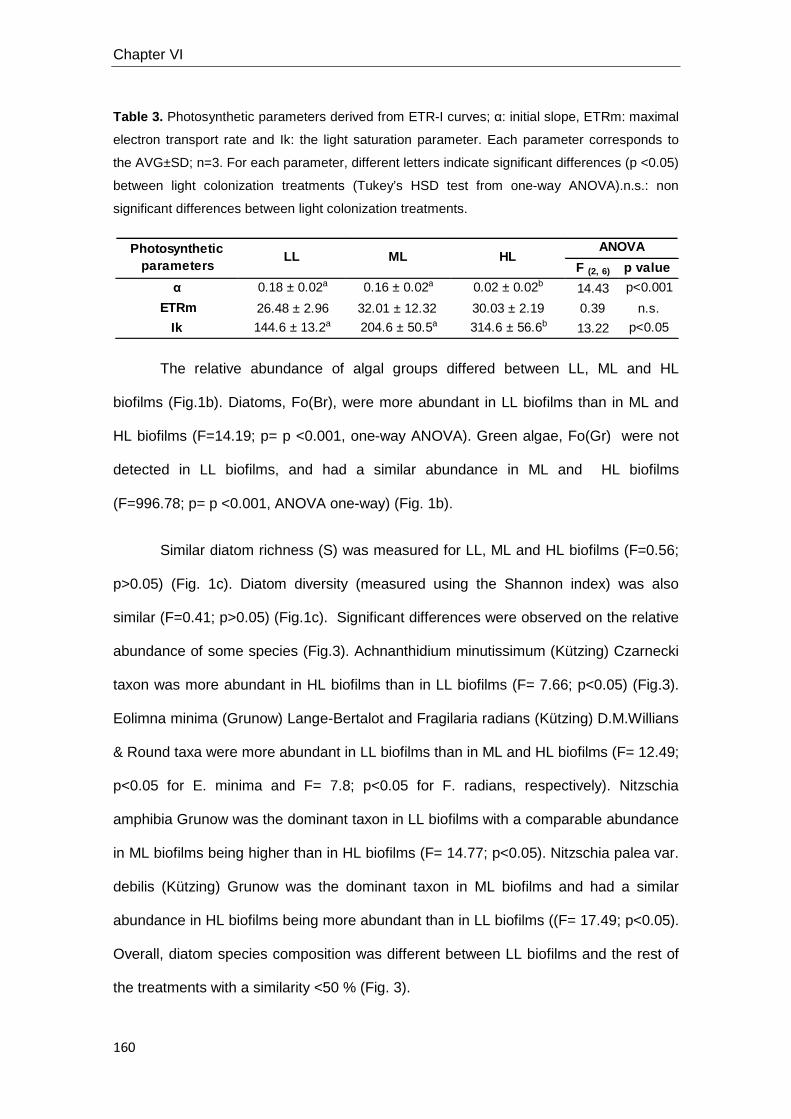
Chapter VI
160
Table 3. Photosynthetic parameters derived from ETR-I curves; α: initial slope, ETRm: maximal
electron transport rate and Ik: the light saturation parameter. Each parameter corresponds to
the AVG±SD; n=3. For each parameter, different letters indicate significant differences (p <0.05)
between light colonization treatments (Tukey’s HSD test from one-way ANOVA).n.s.: non
significant differences between light colonization treatments.
The relative abundance of algal groups differed between LL, ML and HL
biofilms (Fig.1b). Diatoms, Fo(Br), were more abundant in LL biofilms than in ML and
HL biofilms (F=14.19; p= p <0.001, one-way ANOVA). Green algae, Fo(Gr) were not
detected in LL biofilms, and had a similar abundance in ML and HL biofilms
(F=996.78; p= p <0.001, ANOVA one-way) (Fig. 1b).
Similar diatom richness (S) was measured for LL, ML and HL biofilms (F=0.56;
p>0.05) (Fig. 1c). Diatom diversity (measured using the Shannon index) was also
similar (F=0.41; p>0.05) (Fig.1c). Significant differences were observed on the relative
abundance of some species (Fig.3). Achnanthidium minutissimum (Kützing) Czarnecki
taxon was more abundant in HL biofilms than in LL biofilms (F= 7.66; p<0.05) (Fig.3).
Eolimna minima (Grunow) Lange-Bertalot and Fragilaria radians (Kützing) D.M.Willians
& Round taxa were more abundant in LL biofilms than in ML and HL biofilms (F= 12.49;
p<0.05 for E. minima and F= 7.8; p<0.05 for F. radians, respectively). Nitzschia
amphibia Grunow was the dominant taxon in LL biofilms with a comparable abundance
in ML biofilms being higher than in HL biofilms (F= 14.77; p<0.05). Nitzschia palea var.
debilis (Kützing) Grunow was the dominant taxon in ML biofilms and had a similar
abundance in HL biofilms being more abundant than in LL biofilms ((F= 17.49; p<0.05).
Overall, diatom species composition was different between LL biofilms and the rest of
the treatments with a similarity <50 % (Fig. 3).
F (2, 6) p value
0.18 ± 0.02a 0.16 ± 0.02a 0.02 ± 0.02b 14.43 p<0.001
26.48 ± 2.96 32.01 ± 12.32 30.03 ± 2.19 0.39 n.s.
144.6 ± 13.2a 204.6 ± 50.5a 314.6 ± 56.6b 13.22 p<0.05
ETRm
Ik
Photosynthetic parameters
ANOVALL ML HL
α

Light stress and Zn toxicity
161
Figure 1. a) Chlorophyll-a concentration (Chl-a) in µgChl-a/cm2, extracellular polymeric
substances (EPS) in µgGlucosa eq./cm2, ash free dry weight (AFDW) in gAFDW/cm2 and chl-
a/AFDW ratio in µgChl-a/µgAFDW cm2 of LL, ML and HL biofilms. b) The relative abundance of
each algal group based on Phyto-PAM fluorescence analysis. c) Shannon index (H’) and
richness species (S) based on diatom community. Each value corresponds to the AVG±SD;
n=3. Different letters indicate significant differences (p <0.05) between LL, ML and HL biofilms
(Tukey’s HSD test from ANOVA one way).
Photosynthetic pigments were also different between light colonization
treatments (Fig.2). PCA first axis explained 57.3% of variance and separated LL
biofilms with higher chl-a, chl-c1+c2, zeaxanthin and fucoxanthin pigments from ML
and HL biofilms (presenting an intermediate and low relative abundance of these
pigments, respectively). HL biofilms had higher relative abundance of pheophytin-a,
diatoxanthin, diadinochrome, diadinoxanthin, violaxanthin and lutein pigments than ML
and LL biofilms. The second axis of the PCA explained a 27.8 % of variance and
separated ML from LL and HL biofilm communities (Fig. 2) with higher relative
abundance of neoxanthin and unidentified pigments (others) (Fig.2). Cluster analysis
Chl-a EPS AFDW0
2
4
6
8
10
a
b b
a
b
b
a
b b
a
bb
Fo(Br) Fo(Bl) Fo(Gr)0
20
40
60
80
100
S0
5
10
15
20
25
Shannon index
LL ML HL
A)
B) C)
Ric
hess
spec
ies
Chl
-a /
EP
S /
AF
DW
Chl-a/AFDW0.0000
0.0002
0.0004
0.0006
0.0008
0.0010
H'0.0
0.5
1.0
1.5
2.0
2.5
3.0
3.5
Chl-a / A
FD
W
% o
f flu
ores
cenc
e a
bb
a
bb

Chapter VI
162
(Fig. 2) separated (p < 0.05) biofilm communities in two groups. LL biofilms (similarity
<75 %) were different from ML and HL biofilms with a similarity between them >80%
(p<0.05). In addition, a high similarity between replicates of each treatment was also
obtained (above 88%) (Fig. 2).
Figure 2 . Left graph, PCA of photosynthetic pigments of biofilm samples from LL, ML and HL
biofilms. Right graph, cluster of similarity distances between LL, ML and HL biofilm samples
based on photosynthetic pigments. Red lines denote no significantly different groups and black
lines indicate significantly different groups. Labels a, b and c indicate samples taken from three
different channel belonging to the same light colonization treatment.
Light and Zn toxicity tests
The results of the three-way ANOVA summarize the interdependence of the
treatment factors (Light colonization-Lcol, light incubation-Linc and Zn exposure-Zn)
(Table 4). LL, ML and HL biofilms had different Φ’PSII , and ΦPSII depending on the light
of colonization, lower in LL biofilms (Fig. 4). Light of incubation affected Φ’PSII and ΦPSII
of all biofilms (LL, ML and HL biofilms) but these effects were different depending on
light colonization (Lcol*Linc; p<0.05). Clearly, LL and ML biofilms were more inhibited at
high light (Table 4 and Fig. 4).
PC1 (57.3 %)
PC
2 (2
7.8
%)
100
95
90
85
80
75
70
LLc
LLb
LLa
MLb
MLa
HLc
HLb
HLa
MLc
100
95
90
85
80
75
70
LLc
LLb
LLa
MLb
MLa
HLc
HLb
HLa
MLc
100
95
90
85
80
75
70
LLc
LLb
LLa
MLb
MLa
HLc
HLb
HLa
MLc
100
95
90
85
80
75
70
LLc
LLb
LLa
MLb
MLa
HLc
HLb
HLa
MLcLL
c
LLb
LLa
MLb
MLa
HLc
HLb
HLa
MLc
Sim
ilarit
y(%
)
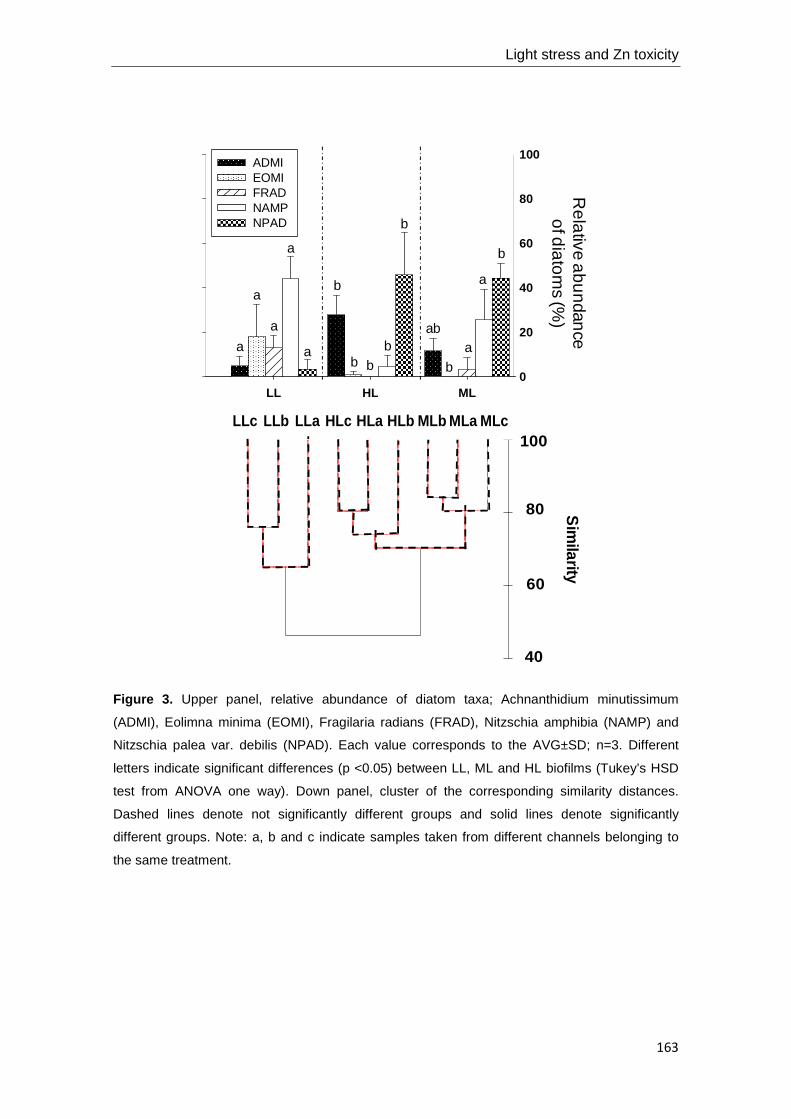
Light stress and Zn toxicity
163
Figure 3. Upper panel, relative abundance of diatom taxa; Achnanthidium minutissimum
(ADMI), Eolimna minima (EOMI), Fragilaria radians (FRAD), Nitzschia amphibia (NAMP) and
Nitzschia palea var. debilis (NPAD). Each value corresponds to the AVG±SD; n=3. Different
letters indicate significant differences (p <0.05) between LL, ML and HL biofilms (Tukey’s HSD
test from ANOVA one way). Down panel, cluster of the corresponding similarity distances.
Dashed lines denote not significantly different groups and solid lines denote significantly
different groups. Note: a, b and c indicate samples taken from different channels belonging to
the same treatment.
LL HL ML0
20
40
60
80
100
Rela
tive abu
ndance
of diatom
s (%)
b
aba
a
a
bba
a
bb
b
b
a
a
MLc
MLa
MLb
HLb
HLa
HLc
LLaLLbLLc
10080
6040
Sim
ilarity
100
80
60
40
LLc LLb LLa HLc HLa HLb MLb MLa MLc
ADMI EOMI FRAD NAMP NPAD

Chapter VI
164
Table 4. Results of analysis of variance (ANOVA 3 ways) for Φ’PSII: effective quantum yield,
ΦPSII: maximal quantum yield, NPQ: non-photochemical quenching and DR: de-epoxidation ratio
of biofilm communities influenced by light during colonization -Lcol (LL, ML and HL), by light
irradiance of incubation - Linc (10, 25, 50, 100, 250 and 500 µmols photons/m2/s) and by zinc
concentration-Zn (0 and 1500 µg/L). n.s.: non significant differences (p>0.05).
Source Φ'PSII ΦPSII NPQ DR
Fvalue pvalue Fvalue pvalue Fvalue pvalue Fvalue pvalue
Lcol 326.0 <0.001 33.01 <0.001 0.82 n.s. 2.14 n.s.
L inc 899.9 <0.001 174.8 <0.001 187.1 <0.001 7.36 p<0.001
Zn 101.1 <0.001 18.19 <0.001 0.06 n.s. 18.28 p<0.001
Lcol * L inc 39.65 <0.001 13.06 <0.001 22.94 <0.001 1.51 n.s.
Lcol * Zn 3.45 <0.05 13.48 <0.001 45.63 <0.001 18.28 p<0.001
L inc * Zn 6.07 <0.001 0.49 n.s. 40.69 <0.001 9.78 p<0.001
Lcol * L inc * Zn 4.23 <0.001 4.72 <0.001 14.78 <0.001 5.31 p<0.001
Zn affected Φ’PSII and ΦPSII producing an inhibition which was higher on Φ’PSII
than on ΦPSII. In addition, Zn inhibition differed depending on the light of colonization
being of higher magnitude in LL biofilms in comparison to ML and HL biofilms. The
Φ’PSII of all Zn exposed biofilms (LL, ML and HL biofilms) was lower (23%, 10% and
6%, respectively) than in those non Zn exposed. Similar results were observed based
on ΦPSII but treatment effects were of lower magnitude. Zn effects also depended on
the incubation light. This interaction was mainly observed at high light irradiances in LL
biofilms, and at intermediate irradiances in ML and HL biofilms. The interaction
between incubation light and Zn exposure was not significant (Linc*Zn; p>0.05) for
ΦPSII (Table 4 and Fig.4).
DR and NPQ had a positive relation in all non Zn-exposed biofilms (Fig.5). The
slope was lower in HL biofilms, presenting lower values of NPQ than in LL and ML
biofilms (Fig.5). This relationship was not observed in all Zn-exposed biofilms. It was
due to a reduction of NPQ in LL biofilms and a reduction of DR in HL bioiflms (Fig. 5).

Figure 4. Φ’PSII: effective quantum yield and ΦPSII: maximal quantum yield after 6h of exposure of biofilm communities to different light intensities (10, 25, 50,
100, 200 and 500 µmols photons /m2/s) without Zn addition (NoZn-black symbols) and with 1500 µgZn/L (Zn-white symbols). In all graphs, each value
corresponds to the AVG±SD; n=3. A plain grey line indicates the control value and the dotted lines indicate their corresponding standard deviation. Significant
differences between NoZn and Zn treatments for each light incubation are refered with *for p<0.05 and ** for p<0.001 of the one-way ANOVA.
10 25 50 100 250 5000.0
0.1
0.2
0.3
0.4
0.5
0.6LL-NoZnLL-Zn
10 25 50 100 250 5000.1
0.2
0.3
0.4
0.5
0.6
0.7LL-NoZnLL-Zn
10 25 50 100 250 5000.0
0.1
0.2
0.3
0.4
0.5
0.6ML-NoZnML-Zn
10 25 50 100 250 5000.1
0.2
0.3
0.4
0.5
0.6
0.7ML-NoZnML-Zn
10 25 50 100 250 500
effQ
Y
0.0
0.1
0.2
0.3
0.4
0.5
0.6HL-NoZnHL-Zn
10 25 50 100 250 5000.1
0.2
0.3
0.4
0.5
0.6
0.7HL-NoZnHL-Zn
Φ’ P
SII
ΦP
SII
Light incubation ( µmols phot./m 2/s) Light incubation ( µmols phot./m 2/s) Light incubation ( µmols phot./m 2/s)
****
**
*
**
*
*
**
*
**
***
**
Low Light - LL Medium Light - ML High Light - HL

Figure 5. NPQ processes as a function of de-epoxidation reaction (DR) after 6h of exposure of biofilm communities (LL, ML and HL biofilms) to different light
intensities without Zn addition (NoZn-black symbols) and with 1500 µgZn/L (Zn-white symbols). Black solid line denote significant linear regression (p<0.05)
between NPQ vs DR for NoZn exposed communities.
Low Light - LL Medium Light - ML High Light - ML
NP
Q
0.0 0.2 0.4 0.6 0.8 1.00.0
0.5
1.0
1.5
2.0
2.5
3.0LL-NoZn (y=2.53x+0.37; r 2=0.56; p<0.05)LL-Zn
0.0 0.2 0.4 0.6 0.8 1.0
ML-NoZn (y=2.77x+0.03; r 2=0.26; p<0.05)ML-Zn
0.0 0.2 0.4 0.6 0.8 1.0
HL-NoZn (y=1.5+0.04x; r 2=0.43; p<0.05)HL-Zn
DRDRDR

Light stress and Zn toxicity
167
DISCUSSION
The microcosm experiment performed allowed us to obtain three different
biofilm communities adapted structurally and physiologically to different light conditions.
A biofilm community adapted to shade conditions (a low light intensity of 25 µmols
photons/m2/s: LL biofilms); and two others adapted to sun conditions (a saturating light
intensity of 100 µmols photons/m2/s: ML biofilms and a high light intensity of 500 µmols
photons/ m2/s: HL biofilms). All of them reached comparable values of maximal ETR
after four weeks of colonization, indicating that each community could achieve a similar
efficiency to use of light energy growth but differing in their specific optimal light
conditions.
The different physiological and structural attributes observed in LL, ML and HL
biofilms allowed them to optimize the use of light. It is reported that organisms can
acquire tolerance to light conditions mainly through two mechanisms: (1) physiological
acclimation via existing cellular and enzymatic processes and (2) genetic adaptation
via mutation and selection of genes that modify physiological functions (Klerks and
Weis, 1987; Posthuma and van Straalen, 1993). Several generations of algae and
cyanobacteria were expected to occur during biofilm growth period due to their fast
division cycle. In fact, either physiological or structural attributes were affected,
suggesting that eventually both photo-accclimation and photo-adaptation occurred
within the community. Indeed, the light selection pressure caused a clear change in the
species composition, with the removal of some species and the selection of others,
actually changing the gene pool of the community. Therefore we can conclude that the
communities were photodapted.
Biofilms adapted to shade conditions were dominated by diatoms, probably
linked with their high efficiency in the use of low light (DeNicola, 1996; Hill, 1996). In

Chapter VI
168
contrast, sun-adapted communities had more green algae, in agreement with previous
investigations where their high efficiency in the use of high light intensities was
demonstrated (DeNicola, 1996; Hill, 1996). The abundance of cyanobacteria was
comparable between photo-adapted communities, suggesting that this phototrophic
group is efficient in light utilization in a wide range of light intensities (from 25 to 500
µmols photons/ m2/s). Similar differences in community composition were also reported
in other studies based on natural biofilms (Guasch and Sabater, 1998; Barranguet et
al., 2005). Diatom community structure changed considerably in response to light
conditions during growth, in agreement with other studies performed under
experimental conditions (Liess et al., 2009; Lange et al., 2011).
In agreement with our expectations, differences in the efficiency of light
utilization at different light intensities were observed between these photoadapted
communities. Algae photo-adapted to limiting and saturating light intensities were more
efficient in light utilization than those adapted to high light irradiances, as shown with
the initial slope of the P-I curve. In addition, higher light irradiance was needed to
produce saturation (Ik) on algae adapted to high light than those adapted to saturating
or limiting light conditions. These results are in agreement with other studies performed
with natural biofilms (Guasch and Sabater, 1998; Roberts et al., 2004; Laviale et al.,
2009), in which the differences in photosynthesis characteristics and/or sensitivity were
attributed either to physiological differences of some particular species within the
community or taxonomic differences in community composition. Furthermore, different
mechanisms of photoadaptation between communities were observed based on biofilm
structure and pigment composition (EPS, AFDW, chla/AFDW). Sun-adapted biofilms
had higher EPS and total biomass indicating a higher proportion of non-photosynthetic
structures. An increase in the proportion of EPS content under high light conditions
was also described by Brouwer and Stal (2002), and attributed to a product of overflow

Light stress and Zn toxicity
169
metabolism when algae and cyanobacteria grew under non limiting light irradiances.
Focusing on pigment composition, shade adaptation was clearly shown as a higher
amount of chl-a per unit of biomass. It is reported that shade-adapted plants generally
have a higher content of photosynthetic pigments than light-adapted plants of the same
species (Björkman, 1981), and the reaction centre of each PSII becomes associated
with more light-harvesting chlorophyll-a which contribute to a higher susceptibility to
photoinhibiton at high irradiances (Falkowski, 1981). Similar results were described for
shade-adapted biofilms in the field (Roberts et al., 2004). In contrast, sun-adapted
biofilms adjusted their intracellular photosynthetic pigments differently in response to
light (Kana et al., 1997). ML and HL biofilms produced higher amounts of xanthophyll
pigments (diatoxanthin, diadinoxanthin, violaxanthin, diadinochrome) as well as lutein
and pheophytin-a. Xanthophyll and lutein pigments compose the main accessory
pigments of the light harvesting complex (LHC) and their increase is used to avoid PSII
damage and to generate the reactive oxygen species when the excited energy is too
high (Demmig et al., 1987). An increase in xanthophylls has been observed in biofilms
exposed to increasing light irradiances (Laviale et al., 2009) and in macroalgae
exposed to high light irradiances (Nielsen et al., 2010).
As expected, a sudden increase or decrease in light (differing from light
conditions prevailing during biofilm growth) produced a fast change in photosynthetic
processes (Φ’PSII and Φ’PSII) and in photoprotective mechanisms (NPQ and DR) for all
biofilm communities. These quick physiological responses were attributed to the
phenotypic plasticity of algae and cyanobacteria composing biofilms to maximize
photosynthesis but also to protect the photosynthetic apparatus from light stress. It has
been extensively reported that NPQ processes play an important photoprotective role
in dissipating the excess of energy caused by a sudden increase in light (Lavaud et al.,
2004; Niyogi et al., 2005). Accordingly, we observed that all biofilm communities
showed a dependence of DR and NPQ processes, suggesting that these physiological
Chapter VI
170
mechanisms were relevant for oxygenic photosynthesis organisms composing biofilms
(i.e. algae and cyanobacteria) to cope with the effects of light on Φ’PSII and ΦPSII.
Biofilms photo-adapted to low and medium light intensities presented a higher slope
derived from DR vs NPQ linear regressions than biofilms photo-adapted to high light
irradiances (Fig. 4), suggesting that the resulting slope of the correlation between DR
vs NPQ could be an indicator of biofilm photoadaptation to shade or sun conditions.
The role of light on Zn toxicity
In agreement with our hypothesis, light history played an important role in the
sensitivity of biofilms to Zn exposure. Zn toxicity on Φ’PSII and Φ’PSII was higher in
biofilms photo-adapted to shade conditions (23 and 16%, respectively) than those
adapted to higher light conditions (10% and 3%, respectively for ML biofilms and 6%
and 1%, respectively for HL biofilms). This indicates that the structural and functional
photoadaptation mechanisms developed for ML and HL biofilms contributed to reduce
their sensitivity to Zn exposure. We hypothesize that some of the mechanisms
developed for photo-adaptation to saturating and high light irradiance might be
responsible for the observed Zn tolerance. An effect of photo-adaptation to sun
conditions was the increase in biofilm thickness by developing more EPS and total
biomass (EPS and AFDW were 3 and 1.6, respectively, times higher in ML and HL
biofilms than in LL biofilms), which could play a protective role against Zn toxicity,
reducing metal penetration into cells. EPS may reduce metal toxicity because they
contain high amounts of negatively-charged functional groups such as carboxyl,
phosphate, and sulphate groups, acting as metal-binding sites (Kaplan et al., 1987;
Loaec et al., 1997; Admiraal et al., 1999; García-Meza et al., 2005; Serra et al., 2009b).
Furthermore, it is also known that community composition plays a relevant role in the
sensitivity of biofilm to metal exposure. Previous studies reported higher tolerance to
metal exposure for green alga and cyanobacteria than for diatoms (Admiraal et al.,
1999; Guasch et al., 2004). Hence, another factor that could explain why sun-adapted

Light stress and Zn toxicity
171
biofilms (ML and HL biofilms), which were dominated by green algae and
cyanobacteria, were less sensitive to Zn than shade-adapted biofilms (LL biofilms)
which had more diatoms. Finally, according to our hypotheses another factor that could
influence the observed lower sensitivity of sunadapted biofilms to Zn exposure in
comparison to shade-adapted biofilms is the content of xanthophyll pigments. We
suggest that the observed photoprotective role of xanthophyll pigments in sun-adapted
biofilms (Guasch and Sabater, 1998; Laviale et al., 2009; Chevalier et al. 2010) may
also provide a protection to Zn exposure by avoiding Zn photo-inhibitory effects by
blocking light-dependent photosynthesis reactions, which are reported to occur under
light or chemical stressors (Armstrong and Hearst, 1996; Martínez-Abaigar and Núñez-
Olivera, 1998). Nielsen et al. (2010) observed that Cu inhibition on the PSII of the
macroalgae Fucus serratus was lower in algae adapted to high light irradiances than in
algae adapted to low light irradiances. They attributed these differences to a lower
light-harvesting potential associated with each reaction centre in algae adapted to high
light.
This study showed that Zn toxicity was enhanced in a light-stress situation. In
fact, Zn exposure caused a magnification of light inhibitory effects on photosynthesis
activity, suggesting that both stressors (light and Zn) target the PSII photochemical
reactions. In algal cultures, the decrease of chlorophyll fluorescence in response to
metal exposure has been correlated with chlorophyll damage (Küpper et al. 2002;
Nielsen et al. 2010). Furthermore, in agreement to our hypothesis, at the level of
photoprotective mechanisms, it was clearly shown that Zn produced a decoupling of
DR vs NPQ at increasing light intensities indicating a loss of biofilm phenotypic
plasticity to cope with light stress. It suggests that the xanthophyll cycle mediated NPQ
(Demming-Adams, 1998; Li et al. 2000) is also a target for Zn toxicity. This decoupling
could be linked with Zn damage effects on some factors influencing NPQ processes;
(1) the formation of a proton gradient across the thylakoid membrane (∆pH) and/or also

Chapter VI
172
(2) the operation xanthophylls cycle (e.g. de-epoxidation reaction (DR) in diatoms)
(Lavaud et al., 2004). In algal monocultures, Nielsen et al. (2005) also observed that
Cu toxicity on the marine macroalgae Fucus serratus caused an un-coupling between
NPQ and the total pool of xanthophylls.
The interaction between light stress and Zn exposure showed clear adverse
effects on the photosynthetic processes of fluvial biofilms. Besides, biofilm sensitivity
depended on its light history. These results suggest that in natural ecosystems where
metal pollution occurs along with other environmental stressors (e.g. light irradiance),
metal toxicity could be enhanced. Furthermore, it could be expected that in river sites
where canopy vegetation is well developed, generally at headstreams, the co-
occurrence of light stress and Zn exposure could cause more important damaging
effects on biofilms than in open canopy sites, generally situated at the mid or lower
sections. This study highlights the need to account for environmental stress caused by
such variations (i.e. light regime and light stress) in order to better assess the
environmental risk of chemicals.
CONCLUSIONS
Overall, this experimental study shows that the sensitivity of biofilms
photoadapted to low light exposed to a multi-stress situation (i.e. light stress and Zn
exposure) was higher than in biofilms photoadapted to saturating and high light
conditions. Hence, it is suggested that in natural ecosystems it will be necessary to
take into account the light history of biofilms to better understand the effects of multiple
stressors (i.e. light stress and Zn toxicity). Therefore, the effects of a multistress
situation (i.e. light stress and Zn toxicity) on upstream biofilms photo-adapted to a
closed canopy cover will be higher than on downstream biofilms photo-adapted to an
open canopy cover.

Light stress and Zn toxicity
173
Suplementary table 1 . Diatom community composition (species relative abundance in %) of
biofilm communities colonized at different light conditions: at 25 µmols photons/m2/s-LL biofilms,
at 100 µmols photons/ m2/s-ML biofilms and at 500 µmols photons/ m2/s-HL biofilms.
LL biofilms ML biofilms HL biofilms AVG (±SE) AVG (±SE) AVG (±SE) Achnanthidium minutissimum (Kützing) Czarnecki 4.93 (2.20) 11.80 (3.13) 27.94 (4.91) Achnanthidium catenatum (Bily & Marvan) Lange-Bertalot 0.10 (0.10) 0.00 (0.00) 0.00 (0.00) Achnanthidium lanceolatum Grunow 0.21 (0.21) 0.00 (0.00) 0.11 (0.11) Achnanthidium lineare Grunow 0.84 (0.84) 2.18 (0.79) 2.97 (0.18) Achnanthidium straubianum Lange-Bertalot 1.60 (0.73) 2.72 (0.10) 2.13 (0.90) Amphora indistincta Levkov 0.32 (0.19) 0.00 (0.00) 0.15 (0.15) Amphora pediculus (Kützing) Grunow 0.74 (0.28) 0.44 (0.29) 0.00 (0.00) Cocconeis pediculus Ehrenberg 0.10 (0.10) 0.00 (0.00) 0.15 (0.15) Cocconeis placentula var. lineata Ehrenberg 0.00 (0.00) 0.00 (0.00) 0.15 (0.15) Encyonema minutum (Hilse in Rabh.) D.G. Mann 0.00 (0.00) 0.22 (0.22) 0.00 (0.00) Eolimna minima (Grunow) Lange-Bertalot 18.18 (8.26) 0.61 (0.31) 1.05 (0.59) Fragilaria capucina Desmazières var. capucina 0.84 (0.84) 0.00 (0.00) 0.00 (0.00) Fragilaria construens (Ehrenberg) Grunow f.venter (Ehrenberg) Hustedt 0.43 (0.21) 0.22 (0.22) 0.00 (0.00) Fragilaria gracilis Østrup 0.00 (0.00) 0.11 (0.11) 0.64 (0.38) Fragilaria pararumpens Lange-Bertalot, Hofmann & Werum 4.11 (1.90) 0.51 (0.18) 2.61 (0.81) Fragilaria radians (Kützing) Williams & Round 13.04 (3.22) 3.35 (3.03) 0.39 (0.26) Gomphonema exilissimum (Grunow) Lange-Bertalot & Reichardt 2.33 (0.93) 0.69 (0.16) 3.00 (1.21) Gomphonema minutum (C.Agardh) C.Agardh 0.11 (0.11) 0.00 (0.00) 0.00 (0.00) Gomphonema parvulum Kützing 0.52 (0.52) 4.32 (1.37) 5.78 (1.57) Gomphonema parvulum var.saprophilum Lange-Bertalot & Reichardt 0.00 (0.00) 0.33 (0.33) 0.00 (0.00) Gyrosigma aff. nodiferum (Grunow) Reimer 0.11 (0.11) 0.00 (0.00) 0.00 (0.00) Halamphora veneta (Kützing) Levkov 0.10 (0.10) 0.15 (0.15) 0.00 (0.00) Melosira varians Agardh 0.43 (0.11) 0.22 (0.22) 0.91 (0.44) Navicula cryptotenella Lange-Bertalot 0.75 (0.22) 0.54 (0.29) 0.20 (0.20) Navicula gregaria Donkin 0.00 (0.00) 0.00 (0.00) 0.00 (0.00) Navicula reichardtiana Lange-Bertalot 0.43 (0.29) 0.00 (0.00) 0.00 (0.00) Navicula tripunctata (O.F.Müller) Bory 0.00 (0.00) 0.11 (0.11) 0.00 (0.00) Navicula veneta Kützing 0.64 (0.32) 0.00 (0.00) 0.00 (0.00) Nitzschia amphibia Grunow 43.96 (5.82) 25.52 (7.77) 4.54 (2.82) Nitzschia dissipata (Kützing ) Grunow 0.53 (0.21) 0.11 (0.11) 0.53 (0.29) Nitzschia fonticola Grunow 0.00 (0.00) 0.15 (0.15) 0.00 (0.00) Nitzschia frustulum var. inconspicua Grunow 0.32 (0.18) 0.87 (0.22) 0.80 (0.25) Nitzschia media Hantzsch 0.52 (0.38) 0.00 (0.00) 0.00 (0.00) Nitzschia palea var. debilis (Kützing) Grunow 3.58 (2.47) 44.21 (3.92) 45.72 (10.96) Nitzschia recta Hantzsch 0.00 (0.00) 0.00 (0.00) 0.11 (0.11) Nitzschia sociabilis Pringsheim 0.10 (0.10) 0.00 (0.00) 0.00 (0.00) Nitzschia umbonata Hustedt 0.00 (0.00) 0.15 (0.15) 0.00 (0.00) Rhoicosphenia abbreviata (C.Agardh) Lange-Bertalot 0.10 (0.10) 0.00 (0.00) 0.11 (0.11) Synedra ulna (Nitzsch) Ehrenberg 0.00 (0.00) 0.51 (0.26) 0.00 (0.00)

CHAPTER VII
GENERAL DISCUSSION


General discussion
177
GENERAL DISCUSSION
With the aim of evaluating the potential use of the chl-a fluorescence
parameters of fluvial biofilm for assessing metal toxicity in fluvial ecosystems and to
find cause-effect relationships between metal(s) exposure, confounding factors (i.e.
light) and biological responses, several experimental approaches have been performed
at different spatial and temporal scales. Experiments conducted in microcosms (using a
system of artificial channels) helped us to establish cause-effect relationships between
metal exposure and biological responses under controlled conditions and foresee the
effect of single stress factors in the environment (Chapter IV and Chapter VI) (Fig. 1).
On the other hand, the field experiment in the riera d’Osor stream allowed us to test in
situ, under multiple-stress situations, the cause-effect relationships previously
described (Chapter V) (Fig. 1). The field sampling conducted in Riou-Mort river did not
allow us to find cause-effect relationships between metal exposure and biofilm
responses (Fig. 1) suggesting that it is not a good kind of approach to assess metal
pollution in situ. Maybe the lack in cause-effects relationship in the Riou-Mort could be
linked to other confounding factors as light irradiance or nutrient availability that may
mitigate biofilms´ responses to Zn+Cd contamination. Causality, metal toxicity and
biofilm responses, was higher in experimental testing studies than in field observation
study (Fig. 1).
The duration of metal exposure was shown to be an important factor to explain
metal toxicity. Within hours of exposure (referred to as short-term metal exposure)
biofilms suffered mainly functional alterations (in the Φ’PSII and in the xanthophyll cycle),
indicating temporary alterations. Responses occurring after several weeks of exposure
(referred to as long-term exposure) were linked, in most cases, with changes in the
structure of the community (algal group composition, algal biomass, total biomass
and/or diatom community) leading to more persistent alterations. Zn accumulation in

Chapter VII
178
biofilm was shown to be a good indicator of metal exposure (level of exposure and
time) and it was linked with Zn toxicity on biofilm. In addition, Zn toxicity was also
demonstrated in environmental concentrations, as well as the influence of light history
on the responses of fluvial biofilm to Zn exposure under a multi-stress situation (i.e.
light stress and Zn exposure).
Figure 1. Graph illustrating the steps conducted in this thesis to derive causality and the main
results obtained. The arrow width is proportional to the degree of causality.
The sensitivity of chl-a fluorescence parameters of biofilm to metal
toxicity
The experiments performed showed differences in metal toxicity sensitivity
between chl-a fluorescence parameters and also between times of exposure, providing
a set of biofilm biomarkers with different sensitivities and specificity. Focusing on the
functional parameters investigated, the effective quantum yield (Φ’PSII) was the most
sensitive parameter for detecting the effects of Zn on algae and cyanobacteria
composing biofilm after a short-term exposure (few hours). Its sensitivity was observed
FIELD OBSERVATIONS
EXPERIMENTAL TESTING
Zn+Cd pollution +
Multi-stress situation
Zn and Zn+Cd
exposures
Zn exposure +
Multi-stress situation
(Riou-Mort river) (Riera d’Osor stream) (Microcosm conditions)
causes structure alterations on
biofilm (i.e. algal biomass)
causes damage on the structure and function of
biofilms
Zn toxicity is enhanced under light
stress
metal toxicity was attributed to Zn pollution
Photo-adapation+
Zn + Light exposures

General discussion
179
both in microcosms and field experiments. In microcosms, Zn concentration in water
ranged from 292 to 342 µgZn/L, similar to the one recorded at the highest Zn polluted
site (M2) in the riera d’Osor stream (from 246 to 334 µgZn/L). Lower Zn concentrations
in water were detected in the less polluted sites (M1 and M3) of the riera d’Osor
stream, which ranged from 10 to 40 µgZn/L. In the microcosm experiments, Φ’PSII was
23% below controls during the first 72h of Zn exposure. However, in the field, Φ’PSII
effects were only detected after 6h of the translocation. Φ’PSII was 46% lower both in M2
and M3 than at the Upstream site (reference site), while in M1 Φ’PSII was 22% lower.
Although, different magnitude of Zn effects on Φ’PSII were observed between
microcosm and field studies, all of them indicate negative effects of Zn on biofilm Φ’PSII
after short-term exposure at concentrations from 10 to 342 µgZn/L supporting its use
for the assessment of short-term metal toxicity. A reduction of the Ф’PSII indicates that
the toxicant is reducing electron flow in the PSII (Barranguet et al., 2000, 2003; Juneau
et al., 2002). This decrease is expected to lead to a reduction in the photosynthetic
activity, one of the main functions of algae and cyanobacteria for growth.
The sensitivity of Ф’PSII after long-term metal exposure (several weeks) was less
obvious. This lack of sensitivity was attributed to biofilm tolerance acquisition. It may
therefore be necessary in long-term studies, both in field as in laboratory conditions,
use supplementary methodological approaches, such as Pollution Induced Community
Tolerance (PICT) tests based on Φ’PSII, to demonstrate community adaptation (Tlili et
al. 2011) Briefly, the replacement of sensitive species by tolerant ones driven by the
selection pressure of the toxicant is expected to increase the EC50 of the community
measured in acute dose-response tests using physiological endpoints such as Ф’PSII
(Blanck et al., 1988). This approach has been successfully applied to assess
community adaptation to long-term chemical exposure in several studies (Schmitt-
Jansen and Altenburger, 2005a, 2008; Tlili et al., 2010). In this investigation,
community tolerance induction was addressed through changes in community
Chapter VII
180
composition. A pollution-tolerant community is expected to have either a different
genotype, strain and/or species composition compared to a sensitive community
(Eriksson et al., 2009). Detailed results are fully explained in the section focused on
algal group composition.
The maximal photosynthetic capacity of biofilms (ΦPSII) was less sensitive to
short-term metal exposure (hours, days) than the effective quantum yield (Φ’PSII). It has
been reported in monoculture bioassays that short-term metal exposures on algae
cause firstly an inhibition of photosynthetic electron transport leading to a decrease in
Φ’PSII. And secondly, if the exposure persists throughout time, damage on the PSII
structure occurs leading to a decrease in ΦPSII (Juneau et al., 2002; Geoffroy et al.,
2007). On the other hand, this parameter was more sensitive than Φ’PSII after long-term
metal exposure in microcosms showing the damaging effects on the structure of the
photosynthetic apparatus. The ΦPSII is an extremely sensitive parameter to alterations
of PSII/LHCII complex in the thylakoids (Rosenqvist and Van Kooten, 2003). Other
authors reported similar effects on ΦPSII when biofilms were exposed to chemicals at
high concentrations or during long-term exposure (García-Meza et al., 2005; Schmit-
Jansen et al., 2005a). However, ΦPSII changes were not attributed to long-term metal
exposures (weeks) in the field, indicating that this parameter is not specific to metal
toxicity, so the co-occurrence of other environmental factors (e.g. light stress,
temperature, organic matter, and so on) could influence the ΦPSII response, masking
the effects caused by metal exposure. We may conclude that the use of both
photosynthetic parameters, Φ’PSII and ΦPSII, allowed complementary information to be
obtained, including structural and functional alterations related to photosynthetic
processes.
The non-photochemical quenching parameter (NPQ) provided information about
metal effects on photoprotective mechanisms of oxygenic photoautotrophic organisms
composing biofilms. NPQ sensitivity was restricted to experiments performed in

General discussion
181
controlled conditions (microcosm conditions). Furthermore, NPQ did not show the
expected activation after short-term metal exposure in the microcosms. This
unexpected result may probably be due to the fact that NPQ activation is restricted to a
very specific period of time, from minutes to a few hours after the stress started (Müller
et al., 2001), which has not been recorded in our experiments. Laviale et al. (2010)
observed in microcosm experiments that the herbicide isoproturon caused a reduction
of NPQ when biofilm was exposed during few hours to high light irradiances over a
simulated daily cycle. The observed NPQ decrease was correlated with a decrease in
de-expoxidation from diadinoxanthin to diatoxanthin, which was attributed to a state of
relaxed proton gradient across the thylakoid membrane resulting from isoproturon
inhibition on the electron transport (Laviale et al., 2010). On the other hand, in this
thesis, NPQ showed clear effects after long-term metal exposure in the microcosms
(Chapter IV). Metal exposure caused a marked reduction of NPQ suggesting damage
on accessory pigments (xanthophylls) where NPQ processes occurred (Müller et al.,
2001). Therefore, a decrease in NPQ was indicative of damaging effects on the
pigmentary structure of the photosynthetic apparatus. Similar effects were observed in
Ricart et al. (2010b). They also observed a marked reduction in NPQ when biofilm was
exposed to high concentrations of the bactericide triclosan for 48h, damage being
expected in the pigments where the NPQ takes place. In the field experiments, this
parameter was more sensitive to physical and chemical variability (Chapter VI) than to
metal toxicity, indicating a low specificity to metal exposure. Hence, the use of NPQ is
mainly recommended for ecotoxicological experiments performed in laboratory
conditions, providing complementary information about photosynthesis processes to
the more classical photosynthetic related parameters (Φ’PSII and ΦPSII).
On the other hand, chl-a fluorescence parameters of biofilms were
demonstrated to be useful tools for monitoring alterations in photosynthetic processes
and photoprotective mechanisms under a multi-stress situation (i.e. light stress and Zn

Chapter VII
182
exposure). Zn toxicity under light stress caused an inhibition of photosynthetic
processes (Φ’PSII and ΦPSII) and an inhibition of NPQ linked with a decoupling with the
xanthophyll cycle of diatoms. So, in this investigation the pertinence of measuring chl-a
fluorescence parameters to assess effects of multiple-stress factors (i.e. light stress
and Zn toxicity) was demonstrated (Chapter V).
The minimal fluorescence parameter (Fo) was applied for monitoring algal
biomass changes over time and used to describe the kinetics of growth in biofilms
under different metal exposure conditions (Chapter IV). The kinetics of growth
summarizes the integrated response of biofilms throughout the entire metal exposure
period. It can be considered as a global indicator, which integrates effects of metals on
different metabolic processes causing pigment damage and/or cell death. The effect of
metals on the growth curves was very marked. Biofilms exposed to metals reached
plateau values up to three times lower than non metal-exposed biofilms (considered as
controls). Serra et al. (2009a) also found that biofilms exposed to Cu reached a plateau
state (in terms of Fo) earlier than controls.
The deconvolution of the Fo signal into the contribution of the main autotrophic
groups - cyanobacteria Fo(Bl), green-algae Fo(Gr) and diatoms Fo(Br) - allowed the
effects of metals on the algal groups composing biofilms to be easily evaluated
(structural approach) (Chapter IV). As expected, metal effects on algal composition
were only observed after long-term exposure. While diatoms were the most sensitive
group, cyanobacteria and green algae showed a higher tolerance to metals. Other
studies have already reported metal resistance of green algae to Zn (Ivorra et al.,
2000) as well as resistance of cyanobacteria to Zn (Genter et al., 1987) and Zn
mixtures (Takamura et al., 1989). Serra et al. (2009) also observed a higher tolerance
of cyanobacteria than green algae or diatoms, when biofilms were chronically exposed
to Cu.

General discussion
183
Zn toxicity on biofilm communities and the occurrence of Zn pollution in
fluvial ecosystems
In this investigation the potential impact of an input of Zn at realistic
concentrations (300 - 400 µgZn/L) on fluvial ecosystems was observed in situ in a Zn
metal-polluted river (the riera d’Osor stream) (Chapter V) by performing a biofilm
translocation experiment, and validated under controlled exposure conditions in
microcosms (Chapter IV). The most challenging issue in field studies is the ability to
discriminate biological responses caused by chemical pollution from those caused
by environmental factors (also named confounding factors), which generally account
for a higher significance and/or a higher explained variance (Leira and Sabater, 2005;
Ricart et al., 2010a). The results obtained in the study performed in the riera d’Osor
stream (Chapter V), pointed out the pertinence of using multivariate analysis
techniques to indicate biological responses attributable to chemical toxicity or other
environmental stress factors. Zn toxicity on biofilms was linked to Zn accumulation in
biofilms. Changes in Zn accumulation were attributed to exposure level (Zn
concentration in water) and time of Zn exposure (increasing over time). Zn toxicity on
biofilms caused an inhibition of Φ’PSII (either in the microcosms or in the field) and an
activation of the xanthophyll cycle (reported in the field) after short-term exposure.
When these functional damages took place in biofilms, Zn accumulation (both in
microcosms and in field studies) ranged between 150 and 450 µgZn/gDW. Therefore,
this range of Zn accumulation in biofilms could be considered high enough to cause
negative effects in biofilm function (Fig.1). Accordingly, from the results obtained a
toxicity threshold based of 150 µgZn/gDW (Fig.1) is suggested, based on Zn
accumulation in biofilm. The concentration of Zn in water obtained in Zn-exposed
channels during the microcosm experiment (Chapter IV) was comparable to that
observed in the highest polluted site of the riera d’Osor stream (M2) (Chapter V), being
in both cases around 300 µgZn/L. In contrast, Zn concentration in low metal polluted
Chapter VII
184
sites of the riera d’Osor stream (M1 and M3) were one order of magnitude lower,
between 10 and 40 µgZn/L. In spite of the fact that Zn concentrations in water differed
between samplings sites, all biofilms accumulated comparable amounts of Zn and
similar toxic effects were observed after short-term exposure. These results highlight
that metal accumulation in biofilm may reflect real metal exposure and toxicity better
than water concentrations. According to multivariate variance partitioning analysis
performed with the field study data (Chapter V), Zn bioaccumulation was significantly
discriminated by the Zn concentration in water, as well as by the other metals, and was
the main chemical factor correlated with biological responses observed after short-term
metal exposure. In agreement, Morin et al. (2008) demonstrated that Zn and Cd
accumulation in biofilm caused damaging effects on the diatom community. However,
Zn and Cd accumulation in biofilm were not significantly correlated with Zn and Cd
concentrations in stream water. Bradac et al. (2010) showed that Cd accumulation in
biofilm was pertinent for reflecting dynamic Cd concentrations in stream water, in this
case due to the dilution factor of rain events.
Chronic inputs of metals in nature may happen in mining areas with continuous
point-source metal pollution inputs into the river (e.g. the riera d’Osor stream, our case
of study). In this investigation based on microcosm and field data, it was noticed that
biofilms exposed for a long-term period (weeks) to Zn (from 20 to 300 µgZn/L)
accumulated significant amounts of Zn (between 500 and 1700 µgZn/gDW) leading to
a combination of functional and structural changes (Fig. 2). Thus, harmfull effects on
the biota are expected above the 20 µgZn/L threshold of chronic exposure. A cause-
effect relationship between Zn accumulation and alteration on the NPQ and ΦPSII
parameters was demonstrated in the microcosm experiment but not detected in the
field. As reported above, this lack of agreement might be due to the fact that these chl-
a fluorescence parameters have low metal specificity and high sensitivity to other
environmental factors. Furthermore, it was also observed in the microcosms that Zn

General discussion
185
toxicity occurred when Zn content in biofilms were between 500 and 1700 µgZn/gDW,
causing a decrease in algal biomass (chl-a) and an increase in carotenoid pigments
(430:665 index). In the riera d’Osor stream, Zn accumulation in the highest polluted site
(M2) reached up to 4000 µgZn/gDW 5 weeks after translocation, much higher than the
results obtained in the microcosms. Similar amounts of Zn accumulation have been
reported in natural biofilms from a moderately metal-polluted river (Behra et al. 2002)
and in biofilms translocated for two weeks in extremely Zn polluted river (Ivorra et al.
1999). Changes in algal group composition, either in the microcosms or in the field,
were reported in biofilms that accumulated up to 500 µgZn/gDW (Fig.1).
Figure 2. Zn accumulation in biofilms and its effects on functional and structural attributes of
biofilm communities based on the results obtained in this investigation. The vertical dashed red
line indicates the content of Zn accumulated in biofilm from which there are Zn toxic effects on
biofilm communities.
Φ’PSII > ΦPSII
Xanthophylls cycle
μg
Zn
/gD
W
Da
ma
gin
g e
ffe
cts
on
bio
film
NPQ > ΦPSII
430:665
Shifts algal group composition
Structural
Diatoms: S, IPS
• teratoforms
Chl-a
• biovolume
effects
Zn toxicity
threshold
(150 µgZn/gDW)
Functional
0300600900
120015001800
3800
4000Zn accumulation

Chapter VII
186
While diatoms were strongly reduced by Zn accumulation, green-
algae and cyanobacteria appear to be the most tolerant groups to Zn (either in the
microcosms or in the field), suggesting an adaptative response to Zn pollution. In
agreement, Tlili et al. (2011) reported in the same stream, the “riera d’Osor”, that Zn
contamination exerted a selection pressure proportional both to exposure level and
exposure time on the species composition of autotrophic and heterotrophic
communities composing biofilms (PICT concept), as an indicator of contaminant
effects. Within the autotrophic compartment, Zn pollution leads to a proliferation of
cyanobacteria and metal-tolerant diatom species. Accordingly, a higher EC50 based on
photosynthetic activity was reported in Zn-adapted communities than in reference
communities. Within the heterotrophic compartment, although the bacterial community
was shown to be more sensitive than fungi, Zn contamination exerted a selection
pressure on the different heterotrophic communities by eliminating Zn-sensitive
species. Our field results also showed that Zn toxicity on the diatom community caused
both a loss of diatom biodiversity (detected by a decrease of S) and also alterations of
diatoms morphology (increase of abnormal forms and decrease of cell mean
biovolume). Other studies reported similar effects on the biofilm diatom community
exposed to high amounts of metals (Gold et al., 2003; Morin et al., 2007; Ferreira da
Silva et al., 2009). Although S and IPS indexes appear to be sensitive and metal
exposure level-dependent , their potential goodness to distinguish scenarios of low and
moderate metal pollution is unlcear. However, the occurrence of diatom teratologies
showed to be a sensitive and specific metric to assess scenarios of low and moderate
metal pollution. Our results are in agreement with other studies (Dickman, 1998, Morin
et al., 2008). The occurrence of diatoms with small mean size showed to be a good
metric to assess metal pollution due to its potential metal exposure level-dependency.
Extrapolsaccharidic matrix of alga offers mechanical protection to metal toxicity by
diminishing metal uptake (Vasconcelos et al. 2001). This mechanical protection can be

General discussion
187
more effective for small-sized species, and thus this might be a mechanistic
explanation for their positive selection under chronic metal pollution areas (Joux-Arab
et al. 2000; Morin et al. 2007). Overall, according to diatom metrics applied in this
thesis, it is recommended for the assessment of chronic metal pollution in local
watersheds the relevance of comparing reference vs. polluted sites and use both
taxonomic and morphologic diatom analysis.
Applied issues and ecological implications
To preserve the ecological status of fluvial ecosystems, the conservation of
structural traits (e.g. biodiversity) and functional traits (e.g. photosynthetic activity of
primary producers) is requiered. In Europe, this goal is addressed by the WFD which
aims to reduce chemical pollution in water bodies in order to reach a “good ecological
status” (i.e. close to reference conditions) by preserving structural and functional traits
of freshwater ecosystems. To date, 33 substances have been recognized as priority
pollutants (PP’s) according to the WFD with associate water quality criteria and
limitation guidelines. Zn is not considered a priority pollutant in Europe, so neither
water nor biota quality criterions are established for Zn in freshwater ecosystems.
However, Zn occurrences in European fluvial ecosystems are well reported ranging
from 20 up to 2500 µgZn/L (Ivorra et al., 2002; Le Faucheur et al., 2005; García-Meza
et al., 2005; Morin et al., 2007; Gold et al., 2003; Bonnineau et al., 2011). In this
context, based on the studies performed in this thesis which reveal Zn adverse effects
on biofilms at range concentrations from 200 to 400 µgZn/L, we propose including Zn in
the European list of priority pollutants and thereby establishing limitation guidelines. In
this regard, Zn accumulation in biofilm reflected better the potential of Zn toxicity on
biota than Zn concentration in water. Therefore, establishing a criterion of permissible
Zn concentration in fluvial ecosystems based on a threshold of Zn accumulation in

Chapter VII
188
biota is suggested (150 µgZn/gDW). This investigation demonstrated that from 150
µgZn/gDW accumulated in biofilm functional traits of biota are damaged (Fig.2).
Although, we focused on the effects of Zn on biofilms in this investigation, we do
not forget that Zn accumulated in biofilms might cause adverse effects to other trophic
levels like fish and invertebrates that prey on it due to biomagnification (Rhea et al.,
2006; Farag et al., 2007; Hill et al., 2010).
In fluvial ecosystems, the quantity of light reaching the biofilm can vary over
several orders of magnitude depending on the season and canopy vegetation (Guasch
and Sabater, 1998), and on a time scale that ranges from minutes to hours due to the
daily light cycle (Laviale et al., 2009). Based on the experimental results obtained, it
might be expected that biofilms from a shaded river section would be more sensitive to
a multi-stress situation (i.e. light stress and Zn exposure) than biofilms from an open
section; photo-adapted to saturating and high light irradiances (Chapter VI).
Furthermore, the expected stress caused by a sudden increase in light, i.e. caused by
riparian vegetation, may also enhance Zn toxicity towards its shade-adapted
community.
PROSPECTS
Although field and laboratory studies are both needed in ecotoxicology to
establish cause-effect relationships, field investigations remain scarce. The
experimental design applied in situ in a Zn-polluted river, in the riera d’Osor stream,
was based on a biofilm translocation experiment (active monitoring). This type of
approach proved to be an efficient tool for evaluating short- and long-term effects of Zn
on biofilm in natural conditions. In addition, the simultaneous sampling of chemical and
biological data and its later use in multivariate statistical analysis has been proved as
an efficient tool for exploring the relationships between stressors and their effects.

General discussion
189
Hence, this approach could be of special interest for biomonitoring programmes in
fluvial systems.
The ecotoxicology of Zn on biofilm communities at environmental
concentrations was selected due to lack of knowledge. This investigation demonstrated
the toxicity of Zn at environmental concentrations on functional and structural biofilm
attributes. In this regard, knowledge of the ecotoxicology of other metals currently
detected in fluvial ecosystems (e.g. Cr, As, Se) still remains scarce, as well as their
regulation in water legislations, especially in Europe. In this investigation, the toxicity of
Zn plus Cd in comparison to Zn toxicity alone on fluvial biofilm was also addressed. It
was observed that at the concentrations used (300µgZn/L and 20 µCd/L), metal toxicity
on biofilms was attributed to Zn, the compound which was present at a higher
concentration. Since the co-occurrence of a large number of compounds (metals and
organic compounds) is common to fluvial ecosystems, addressing the toxicity of a
mixture of chemicals on biofilm communities is a present-day challenge for
ecotoxicology. Furthermore, in this investigation the influence of light on Zn toxicity was
also investigated. Since fluvial ecosystems are exposed to many stressors,
investigating the influence of other environmental variables like temperature, flow or
nutrients on toxicity is also necessary.
We recommend the use of chl-a fluorescence parameters of biofilms as a
complementary set of biofilm metal biomarkers to the more traditional ones applied so
far (e.g. diatom indices) due to their capacity to provide different warning signals of
early and late metal toxicity effects on fluvial biofilms. Their application is of special
interest in the context of the WFD, where the development of new structural and
functional parameters of the biological quality standards (e.g. biofilms) is required
(Johnson et al., 2006). With regards to biomarkers, it could be of special interest to
incorporate chl-a fluorescence parameters jointly with other biomarkers which have a

Chapter VII
190
higher metal specificity and level of exposure-dependence. Phytochelatins are metal-
binding polypeptides produced by algae under metal exposure and they have been
described as pertinent indicators of metal toxicity in biofilms (Le Faucheur et al., 2005).
In addition, the determination of biomarkers of metal toxicity at gene expression level
could also offer a promising tool to evaluate low concentrations of metals affecting
cellular and molecular level processes both in laboratory (Huthcins et al., 2010) and in
field approaches (Simon et al., 2011). Nevertheless, more investigations are needed to
enable the implementation of this genetic approach in biofilm ecotoxicology since the
genome sequence of most algae and cyanobacteria species living in bioifilms is still
unknown.

GENERAL CONCLUSIONS


General conclusions
193
UPDATE OF THE USE OF PAM FLUOROMETRY FOR MONITORING THE EFFECT
OF CHEMICALS ON FLUVIAL BIOFILMS
• A significant portion of ecotoxicological studies based on biofilms have incorporated
the use of chl-a fluorescence parameters to assess positively and easily the effects
of herbicides on biofilms. Their application for metal toxicity assessment on biofilms
is recommended due to their reported sensitivity for detecting direct and indirect
effects of chemicals on photosynthetic processes.
CHL-a FLUORESCENCE PARAMETERS AS BIOFILM BIOMARKERS OF METAL
TOXICITY
• Our results showed that the specific effects of metal toxicity on the chl-a
fluorescence parameters of fluvial biofilms are better detected in experimental
studies performed in microcosm than in field investigations due to their low metal
specificity and their high sensitivity to other environmental factors.
• In microcosm studies, the use of chl-a fluorescence parameters for metal toxicity
assessment on fluvial biofilms were pertinent to assess: a) functional and quick
alterations in photosynthesis processes (that could occur after a punctual spill during
a short period of time) as well as, b) structural changes or functional alterations
linked to changes in the community composition (that could occur in situations of
chronic metal pollution). In field studies, chl-a fluorescence parameters only
responded to functional and quick alterations (early responses).

General conclusions
194
Zn TOXICITY ON FLUVIAL ECOSYSTEMS AND THE PERTINENCE OF USING
DIFFERENT BIOFILM METRICS FOR ITS ASSESSMENT
• The hypothesis derived from the Riou-Mort river observations, which pointed out
that metal toxicity was mainly attributed to Zn and Cd, was confirmed in the
experimental study performed on microcosm. Furthermore, it was also
demonstrated that the observed toxicity of Zn (320 µgZn/L) plus Cd (20 µgCd/L) on
fluvial biofilms could be attributed to Zn. On the other hand, the translocation
experiment performed in the “riera d’Osor” stream, confirmed that in nature Zn alone
may cause damaging effects on biofilms at similar concentrations (between 200-400
µgZn/L).
• Zn accumulation in biofilms was shown to be a good indicator of metal exposure. Zn
effects on biofilm communities were detected from 150 µgZn/gDW.
• The study performed in the riera d’Osor stream provided enough evidence of
occurrence and toxicity of Zn to recommend its inclusion in the list of priority
pollutant substances of the European Water Framework Directive. The experiment
performed demonstrated that the use of a set of biofilm metrics which include: chl-a
fluorescence parameters, pigment analysis, metal accumulation in biofilms and
diatom taxonomic analysis, could be pertinent to assess acute and chronic Zn
effects on natural biofilms. Short-term exposure mainly affected biofilm function,
supporting the use of chl-a fluorescence techniques in combination with the analysis
of photosynthetic pigments as signals of early toxicity. Longer-term exposure effects
were better detected using diatom indices and traits such as cell biovolume or
diatom deformities.

General conclusions
195
THE ROLE OF CONFOUNDING STRESSORS (i.e. LIGHT STRESS) ON THE
TOXICITY OF Zn ON FLUVIAL BIOFILMS
• Algae and cyanobacteria that make up biofilms present several functional and
structural mechanisms adapted to the light conditions prevailing during growth and
optimizing the use of light. These mechanisms of light adaptation influence their
sensitivity to Zn exposure.
• Shade-adapted biofilms are more sensitive to a multi-stress situation (i.e. light stress
and Zn exposure) than sun-adapted biofilms, leading to a higher inhibition of
maximal and effective quantum yield as well as a decoupling between de-
epoxidation reactions and non-photochemical quenching processes.


REFERENCES


References
199
ACA-Catalan water ageny [available on internet at http://aca-web.gencat.cat].
Admiraal, W., Blanck, H., Buckert-de Jong, M., Guasch, H., Ivorra, N., Lehmann, V.,
Nystroem, B.A.H., Paulsson, M., Sabater, S. 1999. Short-term toxicity of zinc to
microbenthic algae and bacteria in a metal polluted stream. Water Research 33: 1989-
1996.
American public health association (APHA), 1989. Standard methods for the
examination of water and wastewater, 17 edition. –APHA, Washington, DC.
Ancion, P-A., Lear, G., Lewis, G. D. 2011. Three common metal contaminants of urban
runoff (Zn, Cu & Pb) accumulate in freshwater biofilm and modify embedded bacterial
communities. Environmental Pollution 158: 2738-2745.
ATSDR. 2005. Toxicological profile for zinc. U.S. Department of Health and Human
Services, Public Health Service, Agency for Toxic Substances and Disease Registry.
Barrannguet, C., Charantoni, E., Pland, M., Admiraal, W. 2000. Short-term response of
monospecific and natural algal biofilms to copper exposure. European Journal of
Phycology 35:397-406.
Barranguet, C., Plans, M., Van der Grinten, E., Sink, J.J., Admiraal, W. 2002.
Development of photosynthetic biofilms affected by dissolved and sorbed copper in a
eutrophic river. EnvironmentalToxicology and Chemistry 21:1955-65.
Barranguet, C., Van den Ende, F. P., Rugers, M., Breure, A. M., Greudanus, M.,
Sinke, J. J., Admiraal, W. 2003. Copperinduced modifications of the trophic relations in
riverine algal-bacterial biofilms. Environmental Toxicology and Chemistry 22: 1340-
1349.
Behra, R., Landwehrjohann, R., Vogael, K., Wagner, B., Sigg, L. 2002. Copper and
zinc content of periphyton from two rivers as a function of dissolved metal
concentration. Aquatic Sciences 64:300-06.

References
200
Bilger, W., Björkman, O. 1990. Role of xanthophyll cycle in photoprotection elucidated
by measurements of light-induced absorbance changes, fluorescence and
photosynthesis in leaves of Hedera canariensis. Photosynthesis Research 25:174-185.
Blanck, H., Wänkberg, S.Å., Molander, S. 1988. Pollution-induced community
Tolerance-a new ecotoxicological tool. In: Cairs Jr., J., Pratt, J.R. (Eds.), Functional
Testing of Aquatic Biota for Estimating Hazards of Chemicals, 988. ASTM STP,
Philadelphia, pp. 219-230.
Blanck, H., Admiraal, W., Cleven, R. F. M. J., Guasch, H., van den Hoop, M. A. G. T.,
Ivorra, N., Nyström, B., Paulsson, M., Petterson, R. P., Sabater, S., Tubbing, G. M. J.
2003. Variability in zinc tolerance, measured as incorporation of radio-labeled carbon
dioxide and thymidine, in periphyton communities sampled from 15 European river
stretches. Archives of Environmental Contamination and Toxicology 44: 17-29.
Björkman, O., 1981. Responses to different quantum flux densities. In: Lange, O.L.,
Nobel, P.S., Osmond, C.B., Ziegler, H. (Eds.), Physiological Plant Ecology, vol. 1.
Responses to the Physical Environment, vol. 12A. Springer Verlag, Berlin, pp.57-108.
Bonet, B., Corcoll, N., Guasch, H. Antioxidant enzyme activities as biomarkers of Zn
contamination in fluvial biofilms. Submitted.
Bonnineau, C., Guasch, H., Proia, L., Ricart, M., Geiszinger, A., Romaní, A., Sabater,
S. 2010. Fluvial biofilms: a pertinent tool to assess β-blockers toxicity. Aquatic
Toxicology 96: 225-233.
Bonnineau, C., Bonet, B., Corcoll, N., Guasch, H. 2011. Catalase in fluvial biofilms: a
comparison between different extraction methods and example of application in a
metal-polluted river. Ecotoxicology 20: 293-303.
Bradac, P., Navarro, E., Odzak, N., Behra, R., Sigg, L. 2009. Kinetics of cadmium
accumulation in periophyton under freshwater conditions. Environmental Toxicology
and Chemistry 28: 2108–2116.

References
201
Burton, G.A., Pitt, R. 2002. Stormwater Effects Handbook, A Toolbox for Watershed
Managers. Scientist, and Engineers. Lewis Publishers.
Buschmann, C. 1995. Variation of the quenching of chlorophyll fluorescence under
different intensities of the actinic light in wild-type plants of tabacco and in a Aurea
mutant deficient of light-harvesting-complex. Plant Physiology 145:245-252.
Cazelles, B., Fontvieille, D., Chau, N.P. 1991. Self-purification in a lotic ecosystem: a
model of dissolved organic carbon and benthic microorganisms dynamics. Ecological
Modelling 58: 91-117.
Cemagref 1982. Etude des méthodes biologiques d'appréciation quantitative de la
qualité des eaux. Rapport Q.E. Agence de l'Eau Rhône-Méditerranée-Corse, Lyon (in
French).
Chaloub, R. M., de Magalhaes, C. C. P., dos Santos, C. P. 2005. Early toxic effects of
Zinc on PSII of Synechocystis aquatilis F. aquatilis (Cyanophyceae). Journal of
Phycology 41: 1162-1168.
Chevalier, E. M., Gévaert, F., Créach, A. 2010. In situ photosynthetic activity and
xanthophylls cycle development of undisturbed microphytobenthos in an intertidal
mudflat. Journal of Experimental Marine Biology and Ecology 385: 44–49.
Clarke, K. R., Warwick, R. M. 2001. Changes in Marine Communities: An Approach to
Statistical Analysis and Interpretation, 2nd ed. PRIMER-E, Plymouth, UK. Clements,
W. H. & M. C. Newman, 2002. Community Ecotoxicology. John Wiley & Sons, LTD,
West Sussex, UK:336.
Clements, W. H., Carlisle, D. M., Lazorchak, J. M., Johnson, P. C. 2000. Heavy metals
structure benthic communities in Colorado mountain streams. Ecological Applications
10: 626-638.
Clements, W.H., Newman, M.C. 2002. Community ecotoxicology. John Wiley &
Sons,LTD. West Sussex, UK, 336 pp.

References
202
Coquery, M., Morin, A., Bécue, A., Lepot, B. 2005. Priority substances of the European
Water Framework Directive: analytical challenges in monitoring water quality. Trac-
Trends in Analytical Chemistry 24: 2.
Corcoll, N., Bonet, B., Leira, M., Guasch, H. 2011. Chl-a fluorescence parameters as
biomarkers of metal toxicity in fluvial biofilms: an experimental study. Hydrobiologia
673: 119-136.
Corcoll, N., Ricart, M., Franz, S., Sans-Piché, F., Schmitt-Jansen, M., Guasch, H. The
use of photosynthetic fluorescence parameters from autotrophic biofilms for monitoring
the effect of chemicals in river ecosystems, In Guasch, H., Ginebreda, A. & Geizinger,
A. [Eds].The Handbook of Environmental Chemistry. Spriner, (in press).
Coynel, A., Schafer, J., Dabrin, A., Girardot, N., Blanc, G. 2007. Groundwater
contributions to metal transport in a small river affected by mining and smelting waste.
Water Research 41: 3420-3428.
Danilov, R., Ekelund, N. 2001. Effects of Cu2+, Ni2+, Pb2+, Zn2+ and
pentachlorophenol on photosynthesis and motility in Chlamydomonas reinhardtii in
short-term exposure experiments. BMC Ecology 1: 1.
Deckert, J., 2005. Cadmium toxicity in plants: Is there any analogy to its carcinogenic
effect in mammalian cells? BioMetals 18: 475-481.
De Kock, W.C., Kramer, K.J.M., 1994. Active biomonitoring (ABM) by translocation of
bivalves mollusks. In: Kramer, K.J.M. [Ed.]. Biomonitoring of Coastal Waters and
Estuaries. CRC Press, Boca Raton, USA, pp. 51–84.
Demming, B., Winter, K., Kruger, A., Czygan, F. C. 1988. Zeaxanthin and the Heat
Dissipation of Excess Light Energy in Nerium oleander Exposed to a Combination of
High Light and Water Stress'. Plant Physiology 87: 17-24.
DeNicola, D.M. 1996. Periphyton responses to temperatura at different ecological
levels. In: Algal Ecology: Freshwater Benthic Ecosystems (Eds R.J. Stevenson, M.L.
Bothwell & R.L. Lowe), pp. 149–181. Academic Press, San Diego.

References
203
Deniseger, J., Austin, A., Lucey, W.P. 1986. Periphyton communities in a pristine
mountain stream above and below heavy metal mining operations. Freshwater Biology
16: 209-18.
Dickman, M. D. 1998. Benthic marine diatom deformities associated with contaminated
sediments in Hong Kong. Environment International 24: 749-759.
Di Toro, D.M., Allen, H.E., Bergman, H.L., Meyer, J.S., Paquin, P.R., Santore, R.C.,
2001. Biotic ligand model of the acute toxicity of metals. 1. Technical basis.
Environmental Toxicology and Chemistry 20: 2383-2396.
Dodds, W. K., Biggs, B. J. F., Lowe, R. L. 1999. Photosynthesis irradiance patterns in
benthic microalgae: variations as a function of assemblage thickness and community
structure. Journal of Phycology 35: 42-53.
Dorigo, U., Leboulanger, C. 2001. A PAM fluorescence-based method for assessing
the effects of photosystem II herbicides on freshwater periphyton. Journal of Applied
Phycology 13: 509-515.
Dorigo, U., Bourrain, X., Bérard, A., Leboulanger, C. 2004. Seasonal changes in the
sensitivity of river microalgae to atrazine and isoproturon along a contamination
gradient. Science of the Total Environment 318:101-114.
Dorigo, U., Leboulanger, C., Berard, A., Bouchez, A., Humbert, J.F., Montuelle, B.
2007. Lotic biofilm community structure and pesticide tolerance along a contamination
gradient in a vineyard area. Aquatic Microbial Ecology 50: 91-102.
Dubois, M., Gilles, K.A., Hamilton, J.K., Rebers, P.A., Smith, F. 1956. Colorimetric
method for determination of sugars and related substances. Analytical Chemistry
28:350–356.
Duong, T. T., Morin, S., Coste, M., Herlory, O., Feurtet-Mazel, A., Boudou, A. 2010.
Experimental toxicity and bio-accumulation of cadmium in freshwater periphytic
diatoms in relation with biofilm maturity. Science of the Total Environment 408: 552-
562.
References
204
Escher, B. I., Hermens, J. L. M. 2002. Modes of action in ecotoxicology: their role in
body burdens, species sensitivity, QSARs, and mixture effects. Environmental Science
and Technology 20: 4201-4217.
Falasco, E., Bona, F., Badino, G., Hoffmann, L., Ector, L. 2009. Diatom teratological
forms and environmental alterations: a review. Hydrobiologia 623: 1-35.
Paul G. Falkowski, P., G., John A. Raven, J. A. 2007. Aquatic Photosynthesis.
Princeton University Press, 484 pages.
Faller, P., Kienzler, K., Krieger-Liszkay, A. 2005. Mechanism of Cd2+? toxicity: Cd2+?
inhibits photoactivation of Photosystem II by competitive binding to the essential Ca2+?
site. Biochimica et Biophysica Acta 1706: 158-164.
Farag, A.M., Woodward, D.F., Goldstein, J.N., Brumbaugh, W.G., Meyer, J.S. 1998.
Concentrations of metals associated with mining waste in sediments, biofilm, benthic
macroinvertebrates, and fish from the Coeur Alene River Basin, Idaho. Archives of
Environmental Contamination and Toxicology 34:119-127.
Farag, A. M., Nimick, D. A., Kimball, B. A., Church, S. E., Harper, D. D., Brumbaugh,
W. G. 2007. Concentrations of metals in water, sediment, biofilm, benthic
macroinvertebrates, and fish in the Boulder River watershed, Montana, and the role of
colloids in metal uptake. Archives of Environmental Contamination and Toxicology 52:
397-409.
Ferreira da Silva, E., Amleida, S.F.P., Nunes, M.L., Luís, A.T., Borg, F., Hedlund, M.,
Marques de Sá, C., Patinha, C., Teixeira, P. 2009. Heavy metal pollution downstream
the abandoned Coval da Mó mine (Portugal) and associated effects on epilithic diatom
communities. Science of the Total Environment 407:5620-5636.
Fischer, H., Sachse, A., Steinberg, C. E. W., Pusch, M. 2002. Differential retention and
utilization of dissolved organic carbon by bacteria in river sediments. Limnology and
Oceanography 47: 1702-1711.

References
205
Foster, P.L. 1982 Metal resistances of Chlorophyta from rivers polluted by heavy
metals. Freshwater Biology 12: 41–-61.
Freeman, C., Lock, M.A. 1995. The biofilm polysaccharide matrix- a buffer against
changing organic substrate supply. Limnology and Oceanography 40: 273-278.
Furse, M.T., Hering, D., Brabec, K., Buffagui, A., Sandin, L., Verdonschot, P.F.M.
(eds). 2006. The Ecological status of European Rivers: Evaluating and Intercalibration
of Assessment Methods. Hydrobiologia 566: 3-29.
García-Meza, J.V., Barranguet, C., Admiraal,W. 2005. Biofilm formation by algae as a
mechanism for surviving on mine tailings. Environmental Toxicology and Chemistry
24:573–81.
Geiszinger, A., Bonnineau, C., Guasch, H ., López-Doval, J.C., Faggiano, L., Proia, L.,
Ricart, M., Ricciardi, F., Romaní, A.M., Muñoz, I., Schmitt-Jansen, M-, Sabater, S.
2009. Linking the chemical with the biological analyses: the integration at the scale of
the community web. TRAC-Trend Analytical Chemistry 28: 619-626.
Genter, R. B., Cherry, D. S., Smith, E. P., Cairns, J. J. 1987. Algal-periphyton
population and community changes from zinc stress in stream mesocosms.
Hydrobiologia 153: 261–275.
Genty, B., Briantais, J.M., Baker, N. R. 1989. The relationship between the quantum
yield of photosynthetic electron transport and quenching of chlorophyll fluorescence.
Biochimica et Biophysica Acta 990: 87-92.
Gold, C., Feurtet-Mazel, A., Coste, M., Boudou, A. 2003a. Impacts of Cd and Zn on the
development of periphytic diatom communities in artificial streams located along a river
pollution gradient. Archives of Environmental Contamination and Toxicology 44: 189-
197.
Gold, C., Feurtet-Mazel, A., Coste, M., Boudou, A. 2003b. Effects of cadmium stress
on periphytic diatom communities in indoor artificial streams. Freshwater Biology 48:
316–328.
References
206
Gouvêa, S. P., Boyer, G. L., Twiss, M. R. 2008. Influence of ultraviolet radiation,
copper, zinc on microcystin content in Microcystis aeruginosa (Cyanobacteria). Harmful
Algae 7: 194-205.
Gray, B.R., Hill, W.R. 1995. Nickel sorption by periphyton exposed to different light
intensities. North American Benthological Society 14: 29-305.
Guasch, H., Muñoz, I., Rosés, N., Sabater, S. 1997. Changes in atrazine toxicity
throughout succession of stream periphyton communities. Journal of Applied
Phycology 9: 137-146.
Guasch, H., Sabater, S. 1998. Light history influences the sensitivity to atrazine in
periphytic algae. Journal of Phycology 34: 233-241.
Guasch, H., Paulsson, M., Sabater, S. 2002. Effect of copper on algal communities
from oligotrophic calcareous streams. Journal of Phycology 38:241-48.
Guasch, H., Admiraal, W., Sabater, S. 2003. Contrasting effects of organic and
inorganic toxicants on freshwater periphyton. Aquatic Toxicology 64:165-175.
Guasch, H., Navarro, E., Serra, A., Sabater, S. 2004. Phosphate limitaion influences
the sensitivity to copper in periphytic algae. Freshwater Biology 49:463-473.
Guasch, H., Leira, M., Montuelle, B., Geiszinger, A., Roulier, J.L., Tornés, E., Serra, A.
2009. Use of mulivariate analysis to investigate the contribution of metal pollution to
diatom species composition: search for the most appropriate cases and explanatory
variables. Hydrobiologia 627:143-157.
Guasch, H., Serra, A., Corcoll, N., Bonet, B., Leira, M. 2010a. Metal ecotoxicology in
fluvial biofilms: potential influence of water scarcity. In Sabater, S. & Barceló D. [Eds].
Water Scarcity in the Metiterranean. Perspecives under Global Change. Springer,
Berlin, Germany. 709 pp. 41-54.
References
207
Guasch, H., Atli, G., Bonet, B., Corcoll, N., Leira, M., Serra, A. 2010b. Discharge and
the response of biofilms to metal exposure in Mediterranean rivers. Hydrobiologia 657:
143-157.
Guasch, H., Bonet, B., Bonnineau, C., Corcoll, N., López-Doval, J.C., Muñoz, I., Ricart,
M., Serra, A., Clements, W. How to link field observations with causality? Field and
experimental approaches linking chemical pollution with ecological alterations. In
Guasch, H., Ginebreda, A. & Geizinger, A. [Eds].The Handbook of Environmental
Chemistry. Spriner, (in press).
Hall, R. O. J., Meyer, J. L.1998. The trophic significance of bacteria in a detritus-based
stream food web. Ecology 79: 1995-2012.
Halling-Sørensen, B., Nors Nielsen, S., Lanzky, P.F., Ingerslev, F., Holten Lützhoff,
H.C., Jorgensen, S.E. 1998. Occurrence, fate, and effects of pharmaceutical
substances in the environment—A review. Chemosphere 36: 357-393.
Hassler, C. S., Wilkinson, K. J. 2003. Failure of the biotic ligand and free-ion activity
models to explain zinc bioaccumulation by Chlorella kesslerii. Environmental
Toxicology and Chemistry 22: 620-626.
Hassler, C. S., Behra, R., Wilkinson, K. J. 2005. Impact of zinc acclimation on
bioaccumulation and homeostasis in Chlorella kesslerii. Aquatic Toxicology 74: 139-
149.
Hawes, I. 1993. Photosynthesis in thick cyanobacterial films: a comparison of annual
and perennial antarctic mat communities. Hydrobiologia 252: 203-209.
Hill, B. H., Willingham, W. T., Parrish, L. P., McFarland, B. H. 2000. Periphyton
community responses to elevated metal concentration in a Rocky Mountain stream.
Hydrobiologia 428: 161–169.
Hill, W. R., Boston, H. L. 1991. Community development alters photosynthesis-
irradiance relations in stream periphyton. Limnology and Oceanography 36: 1375-
1389.

References
208
Hillebrand, H., Dürselen, C. D., Kirschtel, D., Pollingher, U., Zohary, T. 1999.
Biovolume calculation for pelagic and benthic microalgae. Journal of Phycology 35:
403-424.
Hiraki, M., van Rensen, J.J., Vredenberg, W.J., Wakabayashi, K. 2003.
Characterization of the alterations of the chlorophyll a fluorescence induction curve
after addition of Photosystem II inhibiting herbicides Font. Photosynthesis research 78:
35-46.
Holding, K. L., Gill, R. A., Carter, J. 2003. The relationship between epilithic periphyton
(biofilm) bound metals and metals bound to sediments in freshwater systems.
Environmental Geochemistry and Health 25: 87-93.
Huggett, R. J., Kimerle, R. A., Mehrle, P.M. Jr. , Bergman, H., L. 2002. Biomarkers:
Biochemical, Physiological, and Histological Markers of Anthropogenic Stress. Lewis,
Boca Raton, FL, USA.
Hurlbert, S. H. 1984. Pseudoreplication and the design of ecological field experiments.
Ecological Monographs 54: 187-211.
Hutchins, C.M., Simon, D.F., Zerges, W., Wilkinson, K.J. 2010. Transcriptomic
signatures in Chlamydomonas reinhardtii as Cd biomarkers in metal mixtures. Aquatic
Toxicology 100:120-127.
Ilangovan, K., Cañizares-Villanueva, R. O., González-Moreno, S., Voltolina, D. 1998.
Effect of cadmium and zinc on respiration and photosynthesis in suspended and
immobilized cultures of Chlorella vulgaris and Scenedesmus acutus. Bulletin of
Environmental Contamination and Toxicology 60: 936-943.
Ivorra, N., Hettelaar, J., Tubbing, G. M. J., Kraak, M. H. S., Admiraal, W. 1999.
Translocation of microbenthic algal assemblages used for in situ analysis of metal
pollution in rivers. Archives of Environmental Contamination and Toxicology 37: 19-28.

References
209
Ivorra, N., Bremer, S., Guasch, H., Kraak, M. H. S., Admiraal, W. 2000. Differences in
the sensitivity of benthic microalgae to Zn and Cd regarding biofilm development and
exposure history. Environmental Toxicology and Chemistry 19: 1332-1339.
Ivorra, N., Barranguet, C., Jonker, M., Kraak, M.H.S., Admiraal, W. 2002. Metal-
induced tolerance in the freshwater microbenthic diatom Gomphonema parvulum.
Environmental Pollution 16:147-157.
Jeffrey, S. W., Humphrey, G. F. 1975. New spectrophotometric equations for
determining chlorophylls a, b, c1 and c2 in higher plants, algae and natural
phytoplankton. Biochemical Physiology Pflanz 167: 191–194.
Jeffrey, S.W., Vesk, M. 1997. Introduction to marine phytoplankton and their pigment
signatures. In: Jeffrey, S.W., Mantoura, R.F.C., Wright, S.W. (Eds.), Phytoplankton
pigments in oceanography. UNESCO Publishing, Paris, pp. 37-84.
Jin, E., Polle, J.E.W., Lee, H.K., Hyun, S.M., Chang, M. 2003. Xanthophylls in
microalgae: From biosynthesis to biotechnological mass production and application.
Journal of Microbiology and Biotechnology 13:165-174.
Johnson, R. K., Hering, D., Furse, M .T., Verdouschot, P. F .M. 2006. Indicators of
ecological change: comparison of the early response of four organism groups to stress
gradients. Hydrobiologia. 566, 139-152.
Juneau, P., Popovic, R. 1999. Evidence for the Rapid Phytotoxicity and Environmental
Stress Evaluation Using the PAM Fluorometric Method: Importance and Future
Application. Ecotoxicology 8: 449-455.
Juneau, P., Dewez, E., Matsui, S., Kim, S. G., Popovic, R. 2001. Evaluation of different
algal species sensitivity to mercury and metolachlor by PAM-fluorometry.
Chemosphere 45: 589-598.
Juneau, F., El Berdey, A., Popovic, R. 2002. PAM Fluorometry in the determination of
the sensitivity of Chlorella vulgaris, Selenastrum capricornutum, and Chlamydomonas
reinhardtii to Copper. Archive of Environmental and Contamination Toxicology. 42:
155-164.

References
210
Juneau, P., Qiu, B., Deblois, C. 2007. Use of chlorophyll fluorescence as a tool for
determination of herbicide toxic effect: review. Toxicological and Environmental
Chemistry 89: 309-325.
Kana, T. M., Geider, R. J., Critchley, C. 1997. Regulation of photosynthetic pigments in
micro-algae by multiple environmental factors: dynamic balance hypothesis. New
Phytologist 137: 627-638.
Kautsky, H., Hirsch. A. 1931. Neuve Versuche zur Kohlensäureassimilation.
Naturwissenschaften 19, 964.
Kautsky, H., Appel, W., Amann, H. 1960. Die Fluoreszenzkurve und die Photochemie
der Pflanze. Biochemistry 332: 277-292.
Kelly, M.G., Cazaubon, A., Coring, E., Dell’ Uomo, A., Ector, L., Goldsmith, B., Guasch,
H., Hurlimann, J., Jarlman, A., Kawecka, B., Kwandrans, J., Laugaste, R., Lindstrom,
E.A., Leitao, M., Marvan, P., Padisak, J., Pipp, E., Prygiel, J., Rott, E., Sabater, S., van
Dam, H., Vizinet, J., 1998. Recommendations for the routine sampling of diatoms for
water quality assessments in Europe. Journal of Applied Phycology 10: 215–224.
Krammer, K., Lange-Bertalot, H. 1986 - 1991. Bacillariophyceae. In H. Ettl, J. Gerloff,
H. Heynig and D. Mollenhauer [Eds], Süßwasserflora von Mitteleuropa. Fischer-Verlag.
Vol 1-4.
Krause, G. H., Weis, E. 1991. Chlorophyll fluorescence and photosynthesis: the basics.
Annual Review Plant Physiology 42: 313-349.
Küpper, H., Küpper, F., Spiller, M. 1998. In situ detection of heavy metal substituted
chlorphylls in water plants. Photosynthesis Research 58:123-133.
Küpper, H., Setlík, I.,Spiller, M., Kïpper, F.C., Prásil,O. 2002. Heavy metal-induced
inhibition of photosynthesis: targets of in vivo heavy metal chlorophyll formation.
Journal of Phycology 38: 429 - 441.

References
211
Lane, T. W., Morel, F. M. M. 2000. Regulation of carbonic anhydrase expression by
zinc, cobalt, carbon dioxide in the marine diatom Thalassiosira weissflogii. Plant
Physiology 123: 345-352.
Lange, K., Liess, A., Piggott, J. J., Townsend, C. R., Matthaei, C. D. 2011. Light,
nutrients and grazing interact to determine stream diatom community composition and
functional group structure Freshwater Biology 56, 264–278.
Laviale, M., Prygiel, J., Lemoine, Y. 2009. Stream periphyton photoacclimatation
response in field conditions: effect of community development and seasonal changes.
Journal of Phycology 45 :1072-1082.
Laviale, M., Prygiel, J., Créach, A. 2010. Light modulated toxicity of isoproturon toward
natural stream periphyton photosynthesis: A comparison between constant and
dynamic light conditions. Aquatic Toxicology 97: 334–342.
Laviale, M., Morin, S., Créach, A. 2011. Short-term recovery of periphyton
photosynthesis after pulse exposition to the photosytem II inhibitors. Chemosphere 84:
731-734.
Lazar, D., 1999. Chlorophyll a fluorescence induction. Biochimica et Biophysica Acta
1412: 1-28.
Le Faucheur, S., Behra, R., Sigg, L. 2005. Thiol and metal contents in periphyton
exposed to elevated copper and zinc concentrations: a field and microcosm study.
Environmental Science and Technology 39: 8099-8107.
Leboulanger, C., Rimet, F., Hème de Lacotte, M., Bérard, A. 2001. Effects of atrazine
and nicosulfuron on freshwater microalgae. Environment International 26: 131-5.
Lecointe, C., Coste, M., Prygiel, J. 1993. “Omnidia”: Software for taxonomy, calculation
of diatom indices and inventories management. Hydrobiologia 269: 509-513.
Leira, M., Sabater, S. 2005. Diatom assemblages distribution in catalan rivers, NE
Spain, in relation to chemical and physiographical factors. Water Research 39: 73-82.

References
212
Li, X.P.,Björkman, O., Shih, C., Grossman, A.R., Rosenquist,M., Jansson,S., Niyogi,
K.K., 2000. A pigment-binding protein essential for regulation of photosynthetic light
harvesting. Nature 403: 391-395.
Liess, A., Kahlert, M. 2009. Gastropod grazers affect periphyton nutrient stoichiometry
by changing benthic algal taxonomy and through differential nutrient uptake. Journal of
the North American Benthological Society 28: 283-293.
Lindstrom, E.A., Rorslett, B. 1991. The effect of heavy metal pollution on periphyton in
a Norwegian soft-water river. Verhandlungen des Internationalen Verein Limnologie
24: 2215-9.
Loaec, M., Olier, R., Guezennec, J. 1997. Uptake of lead, cadmium and zinc by a novel
bacterial expolysaccharide. Water Research 31:1171.
Lock, M. A., Wallace, R. R., Costerton, J. W., Ventullo, R. M., Charlton, S.E. 1984.
River epilithon: toward a structuralfunctional model. Oikos 42: 10-22.
Lohr, M., Wilhelm, C. 1999. Algae displaying the diadinoxanthin cycle also possess the
violaxanthin cycle. Proceedings of the National Academy of Sciences of the United
States of America 96: 8784–8789.
López-Doval, J.C., Ricart, M., Guasch, H., Romaní, A.M., Sabater, S., Muñoz, I. 2010.
Does Grazing Pressure Modify Diuron Toxicity in a Biofilm Community? Archive of
Environmental Contamination and Toxicology 58: 955-962.
Ma, M., Zhu, W., Wang, Z., Witkamp, G. J. 2003. Accumulation, assimilation and
growth inhibition of copper on freshwater alga (Scenedesmus subspicatus 86.81 SAG)
in the presence of EDTA and fulvic acid. Aquatic Toxicology 63: 221-228.
Mallick, N., Mohn, F. H. 2003. Use of chlorophyll fluorescence in metal-stress research:
a case study with the green microalga Scenedesmus. Ecotoxicology and
Environmental Safety 55:64-9.

References
213
Mallick, N., Mohn, F.H. 2003. Use of chlorophyll fluorescence in metalstress research:
a case study with the green microalga Scenedesmus. Ecotoxicology and
Environmental Safety 55: 64-69.
Margalef, R., 1983. Limnologéa. Ediciones Omega, Barcelona:1010 pp.
Martínez-Abaigar, J., Núñez-Olivera, E. 1998. Ecophysiology of photosynthetic
pigments in aquatic bryophytes. In Bates, J. W., N. W. Ashton & J. G. Duckett (eds),
Bryology for the Twenty-First Century. Maney Publishing and the British Bryological
Society, Leeds, UK: 277-292.
Marwood, C.A., Solomon, K.R., Greenberg, B.M. 2001. Chlorophyll fluorescence as a
bioindicator of effects on growth in aquatic macrophytes from mixtures of polycyclic
aromatic hydrocarbons. Environmental Toxicology and Chemistry 20: 890-898.
Maxwell, K., Johnson, G. N. 2000. Chlorophyll fluorescence -a practical guide. Journal
of Experimental Botany 51:659-68.
McClellan, K., Altenburger, R., Schmitt-Jansen, M. 2008. Pollution-induced community
tolerance as a measure of species interaction in toxicity assessment. Journal of
Applied Ecology 45: 1514-1522.
Metcalfe, C.D., Koenig, B.G., Bennie, D.T., Servos, M., Ternes, T.A. 2003. Occurrence
of neutral and acidic drugs in the effluents of Canadian seawater treatment plants.
Environmental Toxicology and Chemistry 22: 2872-2880.
Meylan, S., Behra, R., Sigg, L. 2003. Accumulation of copper and zinc in periphyton in
response to dynamic variations of metal speciation in freshwater. Environmental
Sciences and Technology 37:5204-12.
Meylan, S., Behra, R., Sigg L. 2004. Influence of Metal Speciation in Natural
Freshwater on Bioaccumulation of Copper and Zinc in Periphyton: A Microcosm Study.
Environmental Sciences and Technology 38: 3104-3111.
Morel, F. M. M.; Hering, J. G. Principles and applications of aquatic chemistry; John
Wiley and Sons: New York, 1983.

References
214
Morin, S., Vivas-Nogues, M., Duong, T. T., Boudou, A., Coste, M., Delmas, F. 2007.
Dynamics of benthic diatom colonization in a cadmium/zinc-polluted river (Riou-Mort,
France). Fundamental and Applied Limnology 168: 179-187.
Morin, S., Duong, T.T., Dabrin, A., Coynel, A., Herlory, O., Baudrimont, M., Delmas, F.,
Durrieu, G., Schäfer, J., Winterton, P., Blanc, G., Coste, M. 2008. Long-term survey of
heavy-metal pollution, biofilm contamination and diatom community structure in the
Riou Mort watershed, South-West France. Environmental Pollution 151: 532-542.
Morin, S., Duong, T. T., Herloy, O., Feurtet-Mazel, A., Coste, M. 2008. Cadmium
toxicity and bioaccumulation in freshwater biofilms. Archives of Environmental
Contamination and Toxicology 54: 173-186.
Morin, S., Pesce, S., Tlili, A., Coste, A., Montuelle, B. 2010. Recovery potential of
periphytic communities in ariver impacted by a vineyard watershed. Ecological
Indicators 10: 419-426.
Morin, S., Cordonier, A., Lavoie, I., Arini, A. Blanco, S., Duong, T.T., Tornés, E., Bonet,
B., Corcoll, N., Faggiano, L., Laviale, M., Pérès, F., Becares, E., Coste, M., Feurtet-
Mazel, A., Fortin, C., Guasch, H., Sa-bater, S. Consistency in diatom response to
metal-contaminated environments. In Guasch, H., Ginebreda, A. & Geizinger, A.
[Eds].The Handbook of Environmental Chemistry. Spriner, (in press).
Moustakas, M., Lanaras, T., Symeonidi, L., Karataglis, S. 1994. Growth and some
photosynthetic characteristics of field grown Avena sativa under copper and lead
stress. Photosynthetica 30: 389-396.
Müller, P., Li, X.P., Niyogi, K.K. 2001. Non-Photochemical Quenching. A Response to
Excess Light Energy. Plant Physiology 125: 1558-1566.
Nalewajko, C., Olaveson, M.M. 1994. Differential responses of growth, photosynthesis,
respiration, and phosphate uptake to copper in copper-tolerant and copper-intolerant
strains of Scenedesmus acutus (Chlorophyceae). Canadian Journal of Botany 73:
1295-1303.

References
215
Navarro, E., Guasch, H., Sabater, S. 2002. Use of microbenthic algal communities in
ecotoxicological tests for the assessment of water quality: the Ter river case study.
Journal of Applied Phycology 14:41-48.
Newman, M.C., McIntosh, A.W. 1989. Appropriateness of aufwuchs as a monitor of
bioaccumulation. Environmental Pollution 60:83-100.
Nielsen, H. D., Nielsen, S. L. 2005. Photosynthetic responses to Cu2+ exposure are
independent of light acclimation and uncoupled from growth inhibition in Fucus serratus
(Phaeophyceae). Marine Pollution Bulletin 51: 715-721.
Nielsen, H. D., Nielsen, S. L. 2010. Adaptation to high light irradiances enhances the
photosynthetic Cu2+ resistance in Cu2+ tolerant and non-tolerant populations of the
brown macroalgae Fucus serratus. Marine Pollution Bulletin 60: 710-717.
Niyogi, K. K., 2000. Safety valves for photosynthesis. Current Opinion in Plant Biology
3: 455–460.
Pan, Y.D., Stevenson, R.J., Hill, B.H., Kaufmann, P.R., Herlihy, A.T. 1999. Spatial
patterns and ecological determinants of benthic algal assemblages in Mid-Atlantic
streams, USA. Journal of Phycology 35: 460-468.
Paul, B. J., Duthie, H.C. 1989. Nutrient cycling in the epilithon of running waters.
Canadian Journal of Botany 67: 2302-2309.
Paulsson, M., Nyström, B., Blanck, H. 2000. Long-term toxicity of zinc to bacteria and
algae in periphyton communities from the river Göta Älv, based on a microcosm study.
Aquatic Toxicology 47: 243-257.
Paulsson, M., Mansson, V., Blanck, H. 2002. Effects of zinc on the phosphorus
availability to periphyton communities from the river Göta Älv. Aquatic Toxicology 56:
103-113.
Perales-Vega, H. V., González-Moreno, S., Montes-Horcasitas, C., Cañizares-
Villanueva, R. O. 2007. Growth, photosynthetic and respiratory responses to sub-lethal

References
216
copper concentrations in Scenedesmus incrassatulus (Chlorophyceae). Chemosphere
67: 2274-2281.
Pesce, S., Fajon, C., Bardot, C., Bonnemoy, F., Portelli, C., Bohatier, J. 2006. Effect of
the phenylurea herbicide diuron on natural riverine microbial communities in an
experimental study. Aquatic Toxicology 78: 303-314.
Pesce, S., Lissalde, S., Lavieille, D., Margoum, C., Mazzella, N., Roubeix, V.,
Montuelle, B. 2010a. Evaluation of single and joint toxic effects of diuron and its main
metabolites on natural phototrophic biofilms using a pollution-induced community
tolerance (PICT) approach. Aquatic Toxicology 99: 492-499.
Pesce, S., Margoum, C., Montuelle, B. 2010b. In situ relationship between spatio-
temporal variations in diuron concentrations and phtotrophic biofilm tolerance in a
contaminated river. Water Research 44: 1941-1949.
Pinto, J., Sigaud-Kutner, T.C.S., Leitao, M.A.S., Okamoto, O.K., Morse, D., Colepicolo,
P. 2003. Heavy metal-induced oxidative stress in algae. Journal of Phycology 39:
1008-1018.
Pospísil, P. 1997. Mechanisms of non-photochemical chlorophyll fluorescence
quenching in higher plants. Photosynthetica 34:343-355.
Posthuma, L., Suter, G. W., Traas, T.P. 2001. Species Sensitivity Distributions in
Ecotoxicology. CRC Press, Boca Raton, FL.
Prasad, S. M., Singh, J. B., Rai, L. C., Kumar, H. D. 1991. Metal-induced inhibition of
photosynthetic electron-transport chain of the cyanobacterium Nostoc muscorum m.
FEMS Microbiology Letters 82:95-100.
Pusch, M., Fiebig, D., Brettar, I., Eisenmann, H., Ellis, B. K., Kaplan, L. A., Lock, M. A.,
Naegeli, M. W., Traunspurger, W. 1998. The role of micro-organisms in the ecological
connectivity of running waters. Freshwater Biology 40: 453-495.
Prygiel, J., Carpentier, P., Almeida, S., Coste, M., Druart, J.C., Ector, L., Guillard, D.,
Honore, M.A., Iserentant, R., Ledeganck, P., Lalanne-Cassou, C., Lesniak, C., Mercier,
I., Moncaut, P., Nazart, M., Nouchet, N., Peres, F., Peeters,V., Rimet, F., Rumeau, A.,
References
217
Sabater, S., Straub, F., Torrisi,M., Tudesque, M., Van de Vijver, B., Vidal, H., Vizinet,
J., Zydek, N., 2002. Determination of the biological diatom index (IBD NF T 90-354):
results of an intercomparison exercise. Journal of Applied Phycology 14 : 27-39.
Ralph, P. J., Burchett, M.D. 1998. Photosynthetic response of Halophila ovalis to heavy
metal stress. Environmental Pollution 103: 91-101.
Ralph, P. J., Smith, R. A., Macinnis-Ng, C. M. O., Seery, C.R. 2007. Use of
fluorescence-based ecotoxicological bioassays in monitoring toxicants and pollution in
aquatic systems: review. Toxicological and Environmental Chemistry 89: 589-607.
Rashid, A., Camm, E. L., Ekramoddoullah, A. K. M. 1994. Molecular mechanism of
action of Pb2+ and Zn2+ On water oxidizing complex of photosystem II. FEBS Letters
350: 296-298.
Rauch, S., Paulsson, M., Wilewska, M., Blanck, H., Morrison, G.M. 2004. Short-Term
Toxicity and Binding of Platinum to Freshwater Periphyton Communities. Archive of
Environmental Contamination and Toxicology 47:290–296.
Rhea, D. T., Harper, D. D., Farag, A. M., Brumbaugh, W.G. 2006. Biomonitoring in the
Boulder river watershed, Montana, USA: metal concentrations in biofilm and
macroinvertebrates, and relations with macroinvertebrate assemblage. Environmental
Monitoring and Assessment 115: 381-393.
Ricart, M., Guasch, H., Barceló, D., Geiszinger, A., López De Alda, M., Romaní, A.M.,
Vidal, G., Villagrasa, M., Sabater, S. 2009. Effects of low concentrations of the
phenylurea herbicide diuron on biofilm algae and bacteria. Chemosphere 76: 1392-
1401.
Ricart, M., Guasch, H., Alberch, M., Barceló, D., Bonnineau, C., Geiszinger, A., Farré,
M., Ferrer, J., Ricciardi, F., Romaní, A.M., Morin, S., Proia, L., Sala, Ll., Sureda, D.,
Sabater, S. 2010a. Triclosan persistence through wastewater treatment plants and its
potential toxic effects on river biofilms. Aquatic Toxicology 100: 346-353.
Ricart, M., Guasch, H., Barceló, D., Brix, R., Conceicao, M. H., Geiszinger, A., López
de Alda, M., López-Doval, J. C., Muñoz, I., Postigo, C., Romaní, A. M., Villagrasa, M.,
References
218
Sabater, S. 2010b. Primary and complex stressors in polluted mediterranean rivers:
pesticide effects on biological communities. Journal of Hydrology 383: 52-61.
Sans-Piché, F., Kluender, C., Altenburger, R., Schmitt-Jansen, M. 2010. Anchoring
metabolic changes to phenotypic effects in the chlorophyte Scenedesmus
vacuolatus under chemical exposure Marine Environmenatal.Research 69: 528-530.
Romaní, A. M., Sabater, S. 2001. Structure and activity of rock and sand biofilms in a
Mediterranean stream. Ecology 82: 3232-3245.
Romaní, A. M., Giorgi, A., Acuña, V., Sabater, S. 2004. The influence of substratum
type and nutrient supply on biofilm organic matter utilization in streams. Limnology and
Oceanography 49: 1713-1721.
Romaní, A.M., Fund, K., Artigas, J., Schwartz, T., Sabater, S., Obst, U. 2008.
Relevance of polymeric matrix enzymes during biofilm formation. Microbial Ecology 56:
427-436.
Romaní, A. M., 2010. Freshwater Biofilms. In Dürr, S. & J. C. Thomason (eds),
Biofouling. Wiley-Blackwell, Oxford, UK: 137-163.
Rosenqvist, E., Van Kooten, O. 2003. Chlorophyll fluorescence: a general description
and nomenclature. In DeEll, J. R. & P. M. A. Toivonen (eds), Practical Applications of
Chlorophyll Fluorescence in Plant Biology. Kluwer Academic Publishers, Dordrecht,
Netherlands.
Rotter, S., Sans-Piché, F., Streck, G., Altenburger, R., Schmitt-Jansen, M. 2011. Active
bio-monitoring of contamination in aquatic systems—An in situ translocation
experiment applying the PICT concept. Aquatic Toxicology 101: 228–236.
Rysgaard, S., Kuhl, M., Glud, R. N., Hansen, J. W. 2001. Biomass, production and
horizontal patchiness of sea ice algae in a high-arctic fjord (Young Sound, NE
Greenland). Marine ecology progress 223: 15-26.
Sabater, S., Admiraal, W. 2005. Periphyton as Biological Indicators in Managed
Aquatic Ecosystems. Dans Periphyton: Ecology, Exploitation and Management.

References
219
Cambridge, Massachusetts: Azim, M. E., Verdegem, M. C. J., A. A. van Dam, and M.
C. M. Beveridge (eds.), pp. 159-177.
Sabater, S., Guasch, H., Ricart, M., Romaní, A., Vidal, G., Klünder, C., Schmitt-Jansen,
M. 2007. Monitoring the effect of chemicals on biological communities. The biofilm as
an interface. Analytical and Bioanalytical Chemistry 387: 1425-1434.
Samson, G., Morissette, J. C., Popovic, R. 1988. Copper quenching of the variable
fluorescence in Dunaliella tertiolecta. New evidence for a copper inhibition effect on
PSII photoinhibitory. Photochemistry and Photobiology 48: 329-332.
Santos, A., Santos, J. L., Aparicio, I., Alonso, E. 2010. Fractionation and distribution of
metals in Guadiamar river sediments (SW Spain). Water, Air, and Soil Pollution 207:
103-113.
Schmitt, J., Nivens, D., White, D.C., Flemming, H.C. 1995. Changes of biofilm
properties in response to sorbed substances—an FTIR-ATR study. Water Science and
Technology 32: 149-155.
Schmitt-Jansen, M., Altenburger, R. 2005a. Toxic effects of isoproturon on periphyton
communities - a microcosm study. Estuarine Coastal and Shelf Science 62: 539-545.
Schmitt-Jansen, M., Altenburger, R. 2005b. Predicting and observing responses of
algal communities to photosystem II-herbicide exposure using pollution-induced
community tolerance and species-sensitivity distributions. Environmental Toxicology
Chemistry 24: 304-312.
Schmitt-Jansen, M., Altenburger, R. 2007. The use of pulse-amplitude modulated
(PAM) fluorescence-based methods to evaluate effectgs of herbicides in microalgal
systems of different complexity. Toxicological and Environmental Chemistry 89: 665-
681.
Schmitt-Jansen, M., Altenburger, R. 2008. Community-level microalgal toxicity
assessment by multiwavelength-excitation PAM fluorometry. Aquatic Toxicology 86:
49-58.

References
220
Schreiber U, Müller JF, Haugg A, Gademann R. 2002. New type of dual-channel PAM
chlorophyll fluorometer for highly sensitive water toxicity biotests. Photosynthesis
Research 74: 317-330.
Schreiber, U. 2004. Pulse-Amplitude-Modulation (PAM) Fluorometry and Saturation
Pulse Method: An Overview. In: Papageorgiou GC & Govindjee (eds). Chlorophyll
Fluorescence: A signature of Photosynthesis. Springer, The Netherlands, pp. 279-319.
Schreiber, U., Bilger, W., Neubaurer, C. 1994. Chlorophyll fluorescence as a non-
invasive indicator for rapid assessment of in vivo photosynthesis. In: Schulze, E.D.,
Calswell, M.M. (Eds.), Ecophysiology of Photosynthesis. Springer, Berlin, pp. 49-70.
Schreiber, U., Schliwa, U., Bilger, W. 1986. Continuous recording of photochemical and
non-photochemical chlorophyll fluorescence quenching with a new type of modulation
fluorometer. Photosynthesis Research 10: 51-62.
Schreiber, U., Quayle, P., Schmidt, S., Escher, I., Muelle, J.F. 2007. Methodology and
evaluation of a highly sensitive algae toxicity test based on multiwall chlorophyll
fluorescence imaging. Biosensors and Bioelectronics 22: 2554-2563.
Serôdio, J., Marques da Silva, J., Catarin, F. 1997. Nondestructive tracing of migratory
rhythms of intertidal benthic microalgae using in vivo chlorophyll a fluorescence.
Journal of Phycology 33: 542-553.
Serôdio, J., Cruz, S., Vieira, S., Brotas, V. 2005. Non-photochemical quenching of
chlorophyll fluorescence and operation of the xanthophyll cycle in estuarine
microphytobenthos. Journal of Experimental Marine Biology and Ecology 326: 157-169.
Serra, A., Corcoll, N., Guasch, H. 2009a. Copper accumulation and toxicity in fluvial
periphyton: The influence of exposure history. Chemosphere 74: 633-664.
Serra, A., Guasch, A. 2009b. Effects of chronic copper exposure on fluvial systems:
Linking structural and physiological changes of fluvial biofilms with the in-stream
copper retention. Science of the Total Environment 407: 5274-5282.

References
221
Sheoran, I. S., Sing, R. 1992. Effect of heavy metals on photosynthesis in higher
plants. In Arbol, Y. P., P. Mohanty & Govindjee [Eds]. Photosynthesis: Photoreaction to
Plant Productivity. Kluwer Academic Publishers, The Netherlands: 225-255.
Sheldon, F., Walker, K. F. 1997. Changes in biofilms induced by flow regulation could
explain extinctions of aquatic snails in the lower River Murray, Australia. Hydrobiologia
347: 97-108.
Silver, S. 1998. Genes for all metals—a bacterial view of the periodic table. The 1996
Thom Award Lecture. Journal of Industrial Microbiology & Biotechnology 20: 1-12.
Simon. D.F., Davis, T.A., Tercier-Waeber, M-L., England, R., Wilkinson, K.J. 2011, In
situ evaluation of cadmium biomarkers in green algae. Environmental Pollution
doi:10.1016/j.envpol.2011.05.028.
Singh, D. P., Sharma, S. K., Bisen, P. S. 1993. Differential action of Hg2+ and Cd2+ on
the phycobilisomes and chlorophyll-a fluorescence, and photosystem-II dependent
electron-transport in the cyanobacterium Anabaena flos-aquae. Biometals 6: 125-32.
Sunda, W. G., Huntsman, S. A. 1998. Processes regulating cellular metal accumulation
and physiological effects: Phytoplankton as model systems. The Science of the Total
Environment 219: 165-81.
Takamura, N., Kasai, F., Watanabe, M.M. 1989. Effect of Cu, Cd and Zn on
photosynthesis 925 of freshwater benthic algae. Journal of Applied Phycology 1: 39-52.
Teisseire, H., Guy, V. 2000. Copper-induced changes in antioxidant enzymes activities
in fronds of duckweed (Leman minor). Plant Science 153: 65-72.
Tessier, A., Turner, D. R. Metal speciation and bioavailability in aquatic systems; John
Wiley and Sons: Chichester, 1995.
Tlili, A., Dorigo, U., Montuelle, B., Margoum, C., Carluer, N., Gouy, V., Bouchez, A.,
Berard, A. 2008. Responses of chronically contaminated biofilms to short pulses of
diuron. An experimental study simulating flooding events in a small river. Aquatic
Toxicology 87: 252-263.
References
222
Tlili, A., Bérard, A., Roulier, J.L., Volat, B., Montuelle, B. 2010. PO43− dependence of
the tolerance of autotrophic and heterotrophic biofilm communities to copper and
diuron. Aquatic Toxicology 98:165-177.
Tlili, A., Corcoll, N., Bonet, B., Morin, S., Montuelle, B., Bérard, A., Guasch, H. (in
press). In situ spatio-temporal changes in pollution-induced community tolerance to
zinc in autotrophic and heterotrophic biofilm communities. Ecotoxicology DOI
10.1007/s10646-011-0721-2.
Vasconcelos, M. T. S. D., Leal, M. F., C. 2001. Adsorption and uptake of Cu by
Emiliania huxleyi in natural seawater. Environmental Science and Technology 35: 508-
515.
Wang, J., Zhang, M., Xu, J., Wang, Y. 1995. Reciprocal effect of Cu, Cd, Zn on a kind
of marine alga. Water Research 29: 209-214.
Waring, J., Baker, N. R., Underwood, G., J., C. 2007. Responses of estuarine intertidal
microphytobenthic algal assemblages to enhanced ultraviolet B radiation. Global
Change Biology 13:1398-413.
Wilhelm, C., Rudolph, I., Renner, W. 1991. A quantitative method based onHPLC-
aided pigment analysis to monitor structure and dynamics of the phytoplankton
assemblage-A study from Lake Meerfelder Maar (Eifel, Germany). Archive of
Hydrobiology 123: 21-35.
Zbigniew,T., Wojciech, P. 2006. Individual and combined effect of anthracene,
cadmium, and chloridazone on growth and activity of SOD izoformes in three
Scenedesmus species. Ecotoxicology and Environmental Safety 65: 323-331.
Zhou, W., Juneau, P., Qiu, B. 2006. Growth and photosynthetic responses of the
bloom-forming cyanobacterium Microcystis aeruginosa to elevated levels of cadmium.
Chemosphere 65: 1738-1746.
Zvezdanovic, J., Markovic, D. 2009. Copper, Iron, and Zinc Interactions with
Chlorophyll in Extracts of Photosynthetic Pigments Studied by VIS Spectroscopy.
Russian Journal of Physical Chemistry A 83: 1542-1546.