The use of morphokinetics as a predictor of embryo ... · ORIGINAL ARTICLE Embryology The use of...
14
ORIGINAL ARTICLE Embryology The use of morphokinetics as a predictor of embryo implantation † Marcos Meseguer 1, * , Javier Herrero 1 , Alberto Tejera 1 , Karen Marie Hilligsøe 2 , Niels Birger Ramsing 2 , and Jose Remohı ´ 1 1 Instituto Valenciano de Infertilidad, Universidad de Valencia, Plaza de la Policı ´a Local, 3, Valencia 46015, Spain 2 Unisense FertiliTech A/S, Aarhus, Denmark *Correspondence address. Tel: +34-96-305-0988; Fax: +34-96-305-0999; E-mail: [email protected] Submitted on March 25, 2011; resubmitted on June 27, 2011; accepted on July 4, 2011 background: Time-lapse observation presents an opportunity for optimizing embryo selection based on morphological grading as well as providing novel kinetic parameters, which may further improve accurate selection of viable embryos. The objective of this retrospective study was to identify the morphokinetic parameters specific to embryos that were capable of implanting. In order to compare a large number of embryos, with minimal variation in culture conditions, we have used an automatic embryo monitoring system. methods: Using a tri-gas IVF incubator with a built-in camera designed to automatically acquire images at defined time points, we have simultaneously monitored up to 72 individual embryos without removing the embryos from the controlled environment. Images were acquired every 15 min in five different focal planes for at least 64 h for each embryo. We have monitored the development of transferred embryos from 285 couples undergoing their first ICSI cycle. The total number of transferred embryos was 522, of which 247 either failed to implant or fully implanted, with full implantation meaning that all transferred embryos in a treatment implanted. results: A detailed retrospective analysis of cleavage times, blastomere size and multinucleation was made for the 247 transferred embryos with either failed or full implantation. We found that several parameters were significantly correlated with subsequent implantation (e.g. time of first and subsequent cleavages as well as the time between cleavages). The most predictive parameters were: (i) time of division to 5 cells, t5 (48.8 – 56.6 h after ICSI); (ii) time between division to 3 cells and subsequent division to 4 cells, s2 ( ≤0.76 h) and (iii) duration of cell cycle two, i.e. time between division to 2 cells and division to 3 cells, cc2 ( ≤11.9 h). We also observed aberrant behavior such as multi- nucleation at the 4 cell stage, uneven blastomere size at the 2 cell stage and abrupt cell division to three or more cells, which appeared to largely preclude implantation. conclusions: The image acquisition and time-lapse analysis system makes it possible to determine exact timing of embryo cleavages in a clinical setting. We propose a multivariable model based on our findings to classify embryos according to their probability of implantation. The efficacy of this classification will be evaluated in a prospective randomized study that ultimately will determine if implantation rates can be improved by time-lapse analysis. Key words: embryo / cell division / pregnancy / exact timing / time-lapse Introduction Evaluation of embryos in vitro has improved greatly over the past 20 years. Classical embryo assessment has been supplemented by the evaluation of several additional morphological characteristics that allow prediction of the developmental potential of an embryo and the probability of achieving pregnancy for an infertile couple e.g. review in Baczkowski et al. (2004). Several publications have proposed additional morphological evaluations to assess the timing of embryonic cell divisions that appear to be related to embryo viability (Shoukir et al., 1997; Sakkas et al., 1998; Lundin et al., 2001; Ciray et al., 2006; Lemmen et al., 2008; Mio and Maeda, 2008). Many of these studies have investigated the relationship between the timing of the first embryonic division and the embryo quality summarized in Table 5 in Hesters et al. (2008). The underlying reason for variation in the time of the first cell division is not clear; it could be related to culture conditions as well as intrinsic factors of the oocyte and sperm, maturity, genetic competence and metabolism (Lundin et al., 2001). Early cleavage in first embryonic division, operationally defined as an early cell division resulting in a 2-cell embryo at a time † Parts of this work were presented at the 26th Annual Meeting of the European Society of Human Reproduction and Embryology in Rome (Italy) and at the 66th meeting of the American Society of Reproductive Medicine in Denver (USA). & The Author 2011. Published by Oxford University Press on behalf of the European Society of Human Reproduction and Embryology. All rights reserved. For Permissions, please email: [email protected] Human Reproduction, Vol.0, No.0 pp. 1– 14, 2011 doi:10.1093/humrep/der256 Hum. Reprod. Advance Access published August 9, 2011 by Niels Birger Ramsing on August 17, 2011 humrep.oxfordjournals.org Downloaded from
Transcript of The use of morphokinetics as a predictor of embryo ... · ORIGINAL ARTICLE Embryology The use of...
ORIGINAL ARTICLE Embryology
The use of morphokinetics as apredictor of embryo implantation†
Marcos Meseguer1,*, Javier Herrero1, Alberto Tejera1,Karen Marie Hilligsøe2, Niels Birger Ramsing2, and Jose Remohı1
1Instituto Valenciano de Infertilidad, Universidad de Valencia, Plaza de la Policıa Local, 3, Valencia 46015, Spain 2Unisense FertiliTech A/S,Aarhus, Denmark
*Correspondence address. Tel: +34-96-305-0988; Fax: +34-96-305-0999; E-mail: [email protected]
Submitted on March 25, 2011; resubmitted on June 27, 2011; accepted on July 4, 2011
background: Time-lapse observation presents an opportunity for optimizing embryo selection based on morphological grading as wellas providing novel kinetic parameters, which may further improve accurate selection of viable embryos. The objective of this retrospectivestudy was to identify the morphokinetic parameters specific to embryos that were capable of implanting. In order to compare a large numberof embryos, with minimal variation in culture conditions, we have used an automatic embryo monitoring system.
methods: Using a tri-gas IVF incubator with a built-in camera designed to automatically acquire images at defined time points, we havesimultaneously monitored up to 72 individual embryos without removing the embryos from the controlled environment. Images wereacquired every 15 min in five different focal planes for at least 64 h for each embryo. We have monitored the development of transferredembryos from 285 couples undergoing their first ICSI cycle. The total number of transferred embryos was 522, of which 247 either failed toimplant or fully implanted, with full implantation meaning that all transferred embryos in a treatment implanted.
results: A detailed retrospective analysis of cleavage times, blastomere size and multinucleation was made for the 247 transferredembryos with either failed or full implantation. We found that several parameters were significantly correlated with subsequent implantation(e.g. time of first and subsequent cleavages as well as the time between cleavages). The most predictive parameters were: (i) time of divisionto 5 cells, t5 (48.8–56.6 h after ICSI); (ii) time between division to 3 cells and subsequent division to 4 cells, s2 (≤0.76 h) and (iii) duration ofcell cycle two, i.e. time between division to 2 cells and division to 3 cells, cc2 (≤11.9 h). We also observed aberrant behavior such as multi-nucleation at the 4 cell stage, uneven blastomere size at the 2 cell stage and abrupt cell division to three or more cells, which appeared tolargely preclude implantation.
conclusions: The image acquisition and time-lapse analysis system makes it possible to determine exact timing of embryo cleavages ina clinical setting. We propose a multivariable model based on our findings to classify embryos according to their probability of implantation.The efficacy of this classification will be evaluated in a prospective randomized study that ultimately will determine if implantation rates can beimproved by time-lapse analysis.
Key words: embryo / cell division / pregnancy / exact timing / time-lapse
IntroductionEvaluation of embryos in vitro has improved greatly over the past 20years. Classical embryo assessment has been supplemented by theevaluation of several additional morphological characteristics thatallow prediction of the developmental potential of an embryo andthe probability of achieving pregnancy for an infertile couple e.g.review in Baczkowski et al. (2004). Several publications have proposedadditional morphological evaluations to assess the timing of embryoniccell divisions that appear to be related to embryo viability (Shoukir
et al., 1997; Sakkas et al., 1998; Lundin et al., 2001; Ciray et al.,2006; Lemmen et al., 2008; Mio and Maeda, 2008). Many of thesestudies have investigated the relationship between the timing of thefirst embryonic division and the embryo quality summarized inTable 5 in Hesters et al. (2008). The underlying reason for variationin the time of the first cell division is not clear; it could be relatedto culture conditions as well as intrinsic factors of the oocyte andsperm, maturity, genetic competence and metabolism (Lundin et al.,2001). Early cleavage in first embryonic division, operationallydefined as an early cell division resulting in a 2-cell embryo at a time
† Parts of this work were presented at the 26th Annual Meeting of the European Society of Human Reproduction and Embryology in Rome (Italy) and at the 66th meeting of the AmericanSociety of Reproductive Medicine in Denver (USA).
& The Author 2011. Published by Oxford University Press on behalf of the European Society of Human Reproduction and Embryology. All rights reserved. For Permissions, please email:[email protected]
Human Reproduction, Vol.0, No.0 pp. 1–14, 2011
doi:10.1093/humrep/der256
Hum. Reprod. Advance Access published August 9, 2011 by N
iels Birger R
amsing on A
ugust 17, 2011hum
rep.oxfordjournals.orgD
ownloaded from
of inspection 25–27 h post ICSI, and its impact on pregnancy rate inhumans was first published by the Edwards group (Edwards et al.,1984). Subsequently, many studies have used this concept as thebasis for their publications (Shoukir et al., 1997; Sakkas et al., 1998,2001; Bos-Mikich et al., 2001; Lundin et al., 2001; Salumets et al.,2001; Fenwick et al., 2002; Tsai et al., 2002; Ciray et al., 2006) andall have found that the transfer of early cleavage embryos results inhigher implantation and pregnancy rates compared with embryo trans-fers with delayed division. However, many transfers in these studiesinvolved more than one embryo and many included a mix of earlyand late cleaving embryos; thus, it is difficult to obtain conclusive evi-dence that the implantation can be attributed to the early cleavage(Shoukir et al., 1997; Sakkas et al., 1998, 2001; Bos-Mikich et al.,2001; Salumets et al., 2001; Fenwick et al., 2002; Tsai et al., 2002;Ciray et al., 2006). In one fascinating study, Van Montfoort et al.(2004) investigated this, by comparing embryo transfers that com-posed entirely of early cleaving embryos with transfers that composedentirely of late cleaving embryos in 253 double transfers and 165 singletransfers. They found that there were significantly higher pregnancyrates in the early cleavage group in both single and double transfers.The blastocyst formation rate for early cleaving embryos alsoincreased, and the miscarriage rate decreased compared with thelate cleaving group (Van Montfoort et al., 2004).
It is important to highlight that it is unclear if early cleavage is anindependent predictor of pregnancy or if it is correlated with othervariables such as embryo morphology and cell number. Severalstudies have shown that early cleavage embryos have significantlyhigher numbers of cells and better viability compared with late-cleaving embryos (Shoukir et al., 1997; Sakkas et al., 1998, 2001;Lundin et al., 2001; Salumets et al., 2001; Fenwick et al., 2002).
A key consideration in many studies of timing of first cleavage is thelimited number of observations, which restricts temporal assessmentof a given phenomenon to a determination if an event occurredbefore or after a particular time point. Knowledge of the exact timea given event occurred cannot be obtained with a limited number ofdiscrete observations. Indeed, one of the fundamental problems ofembryo quality assessment is the static evaluation of a dynamic devel-oping entity. Current classification scores analyze the morphology at afew predefined time points during embryo development preimplanta-tion, with the consequent lack of information about what happenedbetween the analyzed time points. Thus, continual monitoring mightprovide one strategy to collect a complete picture of embryo develop-mental kinetics.
Using a time-lapse photography system, Lemmen et al. (2008)found that embryos that implant have an earlier disappearance of pro-nuclei and first division and an increased cell number on Day 2 ofembryonic development. They also found a correlation between ahigher pregnancy rate and synchronicity in re-appearance of nuclei inthe two blastomeres formed after the first division (Lemmen et al.,2008). In a more recent study, Wong et al. (2010) found that devel-opment of human embryos to the blastocyst stage was correlatedwith: (i) the duration of the first cytoplasmic cleavage from 1 cell to2 cells; (ii) time between division to 2 cells and subsequent divisionto 3 cells and (iii) time between division to 3 cells and subsequent div-ision to 4 cells. However, none of the embryos in that study weretransferred. It is thus unclear if embryos with the suggested morpho-kinetic cleavage pattern would have implanted (Wong et al., 2010).
Here, we present a clinical study with time-lapse imaging of embryodevelopment for 247 transferred embryos. The study presents—toour knowledge—the largest set of transferred embryos after time-lapse analysis and thus a novel opportunity to correlate morphokineticparameters to implantation and ongoing pregnancy. The purpose ofthis study is to generate and evaluate a tool for the selection ofviable embryos based on the exact timing of embryo developmentevents together with morphological patterns by using an automatictime-lapse system to monitor embryo development.
Materials and MethodsThis research project was conducted at the Instituto Valenciano de Infer-tilidad—IVI, Valencia. The procedure and protocol were approved by anInstitutional Review Board, (IRB), which regulates and approves databaseanalysis and clinical IVF procedures for research at IVI. The project com-plies with the Spanish Law governing Assisted Reproductive Technologies(14/2006). The present study sample was drawn from a total of 2903oocytes from which 2120 embryos were generated in 285 IVF treatmentcycles between September 2009 and September 2010. All embryos wereobtained after fertilization by ICSI and were part of our standard (n ¼ 188)and ovum donation program (n ¼ 97). Embryos were investigated bydetailed time-lapse analysis measuring the exact timing of the developmen-tal events in hours post insemination by ICSI.
Implantation of transferred embryos was confirmed at an ultrasoundscanning for gestational sacs with fetal heart beat after 7 weeks of preg-nancy. A single gestational sac after dual embryo transfer was frequentlyobserved. Treatments with partial implantation were excluded fromfurther analysis because it was not possible to ascertain which of thetwo transferred embryos implanted. Only 247 embryos from treatmentswhere the number of gestational sacs matched the number of transferredembryos (full implantation) and embryos from treatments where no bio-chemical pregnancy was achieved (no implantation) were included in theanalysis.
The exclusion criteria for standard patients and recipients with respectto this study were: low response (less than five metaphase II oocytes),endometriosis, polycystic ovary syndrome (PCOS), hydrosalpynx, BMI .
30 kg/m2, uterine pathology (myomas, adenomyiosis, endocrinopaties,trombophylia, chronic pathologies, acquired or congenital uterine abnorm-alities), recurrent pregnancy loss, maternal age over 39 years old for stan-dard patients and 45 for oocyte donation recipients (aging uterus), orsevere masculine factor (presenting less than 5 million motile spermcells in total in the ejaculate).
Ovarian stimulation in standard patients andoocyte donorsAll donors were from our egg donation program. Only patients who didnot meet the exclusion criteria were included in the study. The selectioncriteria for donors can be found in Garrido et al. (2002) as stated bySpanish law. The mean age of the male patients of our study populationwas 37.9 years (SD ¼ 5.2). The mean age of our female population (foroocyte donation treatments, we only considered the age of the acceptors)was 36.9 years (SD ¼ 4.9). All donors had normal menstrual cycles of 26–34 days duration, normal weight (BMI of 18–28 kg/m2), no endocrinetreatment (including gonadotrophins and oral contraception) in 3months preceding the study, normal uterus and ovaries at transvaginalultrasound (no signs of PCOS), and antral follicle count .20 on the firstday of gonadotrophin administration, after down-regulation with GnRHagonist (Meseguer et al., 2011).
2 Meseguer et al.
by Niels B
irger Ram
sing on August 17, 2011
humrep.oxfordjournals.org
Dow
nloaded from
Prior to controlled ovarian stimulation (COS), we used cycles withGnRH agonist protocols (Melo et al., 2010).
For COS, we proceeded as previously described (Melo et al., 2010).HCG (Ovitrelle, Serono Laboratories, Madrid, Spain) was administeredsubcutaneously when at least eight leading follicles reached a mean diam-eter of ≥18 mm. Transvaginal oocyte retrieval was scheduled 36 h later.
Protocol for endometrial preparation of recipients can be found inMeseguer et al. (2008) and Meseguer et al. (2011).
After embryo transfer for luteal phase support, standard patientsreceived a daily dose of 200 mg and oocyte recipients received a dailydose of 400 mg vaginal micronized progesterone (ProgeffikEffik, MadridSpain) every 12 h.
Ovum pick-up and ICSIFollicles were aspirated and the oocytes were washed in Quinn’s Advantagemedium (QAM) (SAGE, Rome, Italy). After washing, oocytes were culturedin Quinn’s Advantage Fertilization medium (QAFM; SAGE) at 5.2% CO2 and378C for 4 h before oocyte denudation. Oocyte denudation was carried outby mechanical pipetting in 40 IU/ml of hyaluronidase in the same medium(QAFM). Subsequently, ICSI was performed in a medium containingHEPES (QAM) (Garcia-Herrero et al., 2011). ICSI was performedat ×400 magnification using an Olympus IX7 microscope. Finally,the oocytes were placed in pre-equilibrated slides (EmbryoSlidew,Unisense FertiliTech, Aarhus, Denmark).
IncubationThe EmbryoSlidew is constructed with a central depression containing 12straight-sided cylindrical wells, each containing a culture media droplet of20 ml Quinn’s Advantage Cleavage medium. The depression containingthe 12 wells was filled with an overlay of 1.4 ml mineral oil to preventevaporation. The slides were prepared at least 4 h in advance and left inan incubator to pre-equilibrate at 378C in the 5.0% CO2 atmosphere.After pre-equilibration, all air bubbles are meticulously removed beforethe oocytes are placed individually in EmbryoSlidew microwells and incu-bated in the time-lapse monitoring system at 378C in 5.0% CO2 concen-tration and �20% O2 concentration until embryo transfer �72 h later.
The time-lapse instrument EmbryoScopeTM (ES) (Unisense FertiliTech,Aarhus, Denmark) is a tri-gas incubator with a built in microscope toautomatically acquire images of up to 72 individual embryos duringdevelopment.
Imaging systemThe imaging system in the ES uses low intensity red light (635 nm) from asingle light-emitting diode with short illumination times of 30 ms per imageto minimize embryo exposure to light and to avoid damaging short wave-length light (Oh et al., 2007; Ottosen et al., 2007; Takenaka et al., 2007).The optics comprise a modified Hoffmann contrast with a 20× specialtyobjective, NA 0.4, long working distance (LWD; Leica, Wetzlar, Germany)to provide optimal light sensitivity and resolution for the red wavelength.The digital images are acquired by a highly sensitive CCD camera(1280 × 1024 pixels per image). The CCD chip is a 1/2" sensor with asensitive cell size for each pixel of 4.65 mm × 4.65 mm. Combining theobjective magnification with ×0.8 tube optics gives an on chip resolutionof 3.5 pixels per mm. The ultimate magnification of the resulting digitalimage displayed on a computer screen will depend on the size of the dis-played image, which vary between representations. A highly magnifiedview of the observed area of 286 × 286 mm is measuring 27 × 27 cmon the computer screen when shown with the normal annotation soft-ware. The magnification in this representation is close to ×1000, yetthe effective resolution is limited by the pixel count in the camera andthe optical limitations of the 20× LWD objective used. Image stacks
were acquired at five equidistant focal planes every 15 min duringembryo development inside the ES (i.e. from about 1 h after inseminationto transfer on Day 3 about 72 h after insemination). Embryo exposure tolight during incubation was measured with a scalar irradiance microsensorwith a tip diameter of 100 mm placed within the ES at the position of theembryo in the EmbryoSlidew. Similar measurements were made on stan-dard microscopes used in fertility clinics. The total exposure time in thetime-lapse system during 3 day culture and acquisition of 1420 imageswas 57 s, which compares favourably with the 167 s microscope lightexposure time reported for a standard IVF treatment (Ottosen et al.,2007). As the light intensity measured within the ES with the scalar irradi-ance microsensor was much lower than the light intensity in microscopesused in IVF clinics, we found the total light dose during 3 day incubation inthe time-lapse system to be 20 J/m2 (i.e. 0.24 mJ/embryo) as opposed toan exposure of 394 J/m2 during microscopy in normal IVF treatments (i.e.4.8 mJ/embryo) based on average illumination times (Ottosen et al., 2007)and measured average intensities with the scalar irradiance microsensor.Furthermore, the spectral composition of the light in the ES was confinedto a narrow range centered around 635 nm, and thus devoid of low wave-length light ,550 nm, which has been shown to be inhibitory to embryodevelopment (Oh et al., 2007; Takenaka et al., 2007) and comprises�15% of the light encountered in a normal IVF microscope.
Embryo score and culture conditionsSuccessful fertilization was assessed at 16–19 h post ICSI based on digitalimages acquired with the time-lapse monitoring system. Embryo mor-phology was evaluated on Days 2 (44–48 h post ICSI) and 3 (64–72 hpost ICSI) based on the acquired digital images, taking into account thenumber, symmetry and granularity of the blastomeres, type and percen-tage of fragmentation, presence of multinucleated blastomeres anddegree of compaction as previously described (Alikani et al., 2000).Embryo selection was performed exclusively by morphology based on:(i) the absence of multinucleated cells; (ii) between 2 and 5 cells onDay 2; (iii) between 6 and 10 cells on Day 3; (iv) total fragment volume,15% of the embryo and (v) the embryo must appear symmetric withonly slightly asymmetric blastomeres (Meseguer et al., 2006, 2008;Muriel et al., 2006). A total of 522 embryos were transferred to 285patients.
Time-lapse evaluation of morphokineticparametersRetrospective analysis of the acquired images of each embryo was madewith an external computer, EmbryoViewerw workstation (EV) (UnisenseFertiliTech, Aarhus, Denmark), using an image analysis software in whichall the considered embryo developmental events were annotated togetherwith the corresponding timing of the events in hours after ICSI microinjec-tion. Subsequently, the EV was used to identify the precise timing of thefirst cell division. This division was the division to 2 cells and a shorthandnotation of t2 is used in the following. We likewise annotated the second(i.e. to 3 cells, t3), third (4 cells, t4) and fourth (5 cells, t5) cell division(Fig. 1). For the purpose of this study, we define time of cleavage as thefirst observed time point when the newly formed blastomeres are comple-tely separated by confluent cell membranes. The time of all events isexpressed as hours post ICSI microinjection.
We defined the duration of the second cell cycle (cc2), as the time fromdivision to a two blastomere embryo until division to a three blastomereembryo (cc2 ¼ t3-t2), i.e. the second cell cycle is the duration of theperiod as two blastomere embryo.
We defined the second synchrony s2, as the duration of the transitionfrom a two blastomere embryo to a four blastomere embryo (s2 ¼ t4-t3),
Human embryo morphokinetics and implantation 3
by Niels B
irger Ram
sing on August 17, 2011
humrep.oxfordjournals.org
Dow
nloaded from
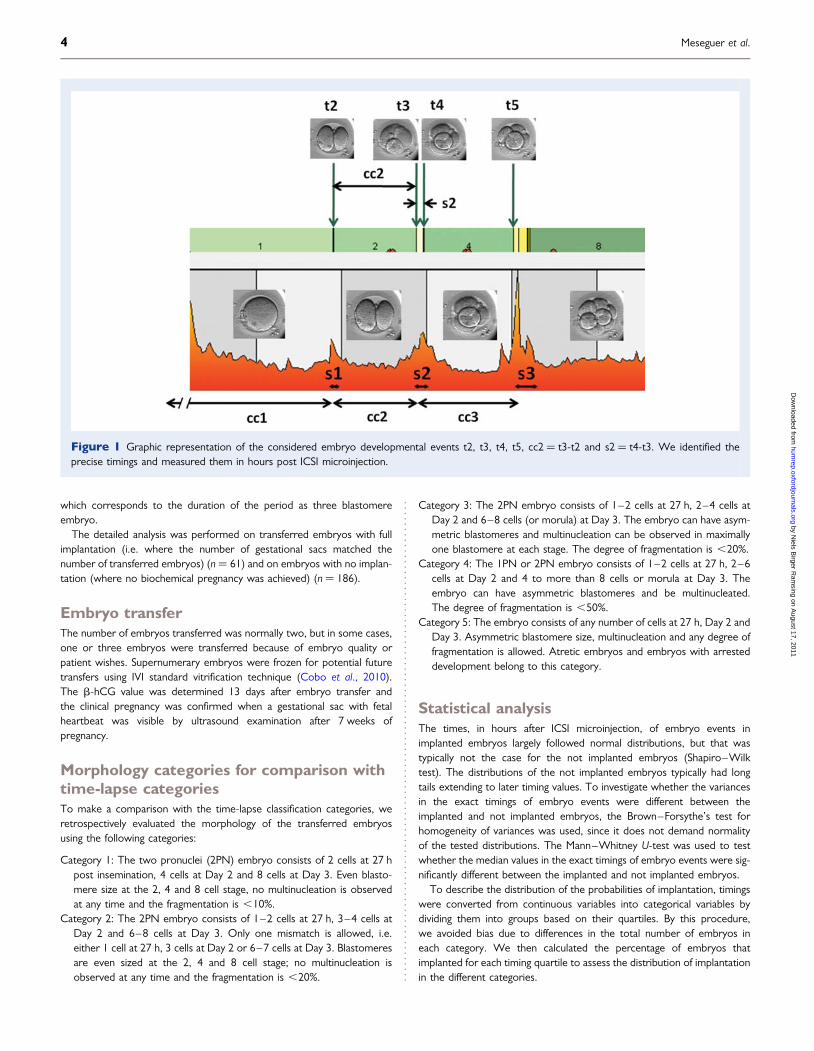
which corresponds to the duration of the period as three blastomereembryo.
The detailed analysis was performed on transferred embryos with fullimplantation (i.e. where the number of gestational sacs matched thenumber of transferred embryos) (n ¼ 61) and on embryos with no implan-tation (where no biochemical pregnancy was achieved) (n ¼ 186).
Embryo transferThe number of embryos transferred was normally two, but in some cases,one or three embryos were transferred because of embryo quality orpatient wishes. Supernumerary embryos were frozen for potential futuretransfers using IVI standard vitrification technique (Cobo et al., 2010).The b-hCG value was determined 13 days after embryo transfer andthe clinical pregnancy was confirmed when a gestational sac with fetalheartbeat was visible by ultrasound examination after 7 weeks ofpregnancy.
Morphology categories for comparison withtime-lapse categoriesTo make a comparison with the time-lapse classification categories, weretrospectively evaluated the morphology of the transferred embryosusing the following categories:
Category 1: The two pronuclei (2PN) embryo consists of 2 cells at 27 hpost insemination, 4 cells at Day 2 and 8 cells at Day 3. Even blasto-mere size at the 2, 4 and 8 cell stage, no multinucleation is observedat any time and the fragmentation is ,10%.
Category 2: The 2PN embryo consists of 1–2 cells at 27 h, 3–4 cells atDay 2 and 6–8 cells at Day 3. Only one mismatch is allowed, i.e.either 1 cell at 27 h, 3 cells at Day 2 or 6–7 cells at Day 3. Blastomeresare even sized at the 2, 4 and 8 cell stage; no multinucleation isobserved at any time and the fragmentation is ,20%.
Category 3: The 2PN embryo consists of 1–2 cells at 27 h, 2–4 cells atDay 2 and 6–8 cells (or morula) at Day 3. The embryo can have asym-metric blastomeres and multinucleation can be observed in maximallyone blastomere at each stage. The degree of fragmentation is ,20%.
Category 4: The 1PN or 2PN embryo consists of 1–2 cells at 27 h, 2–6cells at Day 2 and 4 to more than 8 cells or morula at Day 3. Theembryo can have asymmetric blastomeres and be multinucleated.The degree of fragmentation is ,50%.
Category 5: The embryo consists of any number of cells at 27 h, Day 2 andDay 3. Asymmetric blastomere size, multinucleation and any degree offragmentation is allowed. Atretic embryos and embryos with arresteddevelopment belong to this category.
Statistical analysisThe times, in hours after ICSI microinjection, of embryo events inimplanted embryos largely followed normal distributions, but that wastypically not the case for the not implanted embryos (Shapiro–Wilktest). The distributions of the not implanted embryos typically had longtails extending to later timing values. To investigate whether the variancesin the exact timings of embryo events were different between theimplanted and not implanted embryos, the Brown–Forsythe’s test forhomogeneity of variances was used, since it does not demand normalityof the tested distributions. The Mann–Whitney U-test was used to testwhether the median values in the exact timings of embryo events were sig-nificantly different between the implanted and not implanted embryos.
To describe the distribution of the probabilities of implantation, timingswere converted from continuous variables into categorical variables bydividing them into groups based on their quartiles. By this procedure,we avoided bias due to differences in the total number of embryos ineach category. We then calculated the percentage of embryos thatimplanted for each timing quartile to assess the distribution of implantationin the different categories.
Figure 1 Graphic representation of the considered embryo developmental events t2, t3, t4, t5, cc2 ¼ t3-t2 and s2 ¼ t4-t3. We identified theprecise timings and measured them in hours post ICSI microinjection.
4 Meseguer et al.
by Niels B
irger Ram
sing on August 17, 2011
humrep.oxfordjournals.org
Dow
nloaded from
Continuous data were analyzed using Student’s t-test when comparingtwo groups, and analysis of variance followed by Bonferroni’s and Scheffe’spost hoc analysis when multiple groups were considered. Chi-square testswere used to compare between categorical data. For each timing variable,an optimal range was defined as the combined range spanned by the twoquartiles with the highest implantation rates. Additionally, a binary variablewas defined with the value inside (outside) if the value of the timing vari-able was inside (outside) the optimal range.
The odds ratio (OR) of the effect of all binary variables generated onimplantation was expressed in terms of 95% confidence interval (95%CI) and significance. By conducting the logistic regression analysis, theeffect of optimal ranges and other binary variables on implantation werequantified. Significance was calculated using the omnibus test (likehoodratio), and the uncertainties uncovered by the model were evaluated byNegelkerke R2—a coefficient that is analogous to the R2 index of thelinear regression analysis. Receiver operating characteristic (ROC) curveswere employed to test the predictive value of all the variables includedin the model with respect to implantation. ROC curve analysis providesAUC values (area under the curve) that are comprised between 0.5 and1 and can be interpreted as a measurement of the global classificationability of the model.
The degree of sorting implantation rate (IRsort) of the embryos afterimplantation probability in both a time-lapse and a morphology classifi-cation system was evaluated. The evaluation was done by calculating themean absolute difference from the overall average IR experienced bythe n ¼ 247 transferred embryos in each of the categorization systems.In other terms, IRsort was calculated as IRsort¼
∑I ni Abs (IRi–IR)/n
where IRi is the implantation rate and ni is the number of embryos ineach category i. IR is the average implantation rate for all n embryos.
Statistical analysis was performed using the Statistical Package for theSocial Sciences 17 (SPSS Inc., Chicago, IL) and MedCalc Software(Ghent, Belgium).
ResultsThe primary etiology of female infertility was: poor oocyte quality:34.7% (n ¼ 99); advanced maternal age (.45): 24.6% (n ¼ 70); pre-mature ovary failure: 6.0% (n ¼ 17); Unknown: 23.8% (n ¼ 68), tubalobstruction: 2.5% (n ¼ 7); low ovary response: 8.4% (n ¼ 24).Average estradiol levels prior to hCG injection were 1701 (SD ¼991) pg/ml. A total of 201 embryos were implanted successfully(gestational sac with fetal heartbeat) out of the total 522 transferred,giving rise to a 38.5% implantation rate. The biochemical pregnancyrate per transfer was 55.1% (n ¼ 157) and ongoing pregnancy rateper transfer was 49.8% (n ¼ 142).
All treatment cycles with either full or no implantation wereselected for further retrospective analysis. This analysis considers247 embryos; 61 from cycles with full implantation (number of gesta-tional sacs matched the number of transferred embryos) and 186 fromcycles with no implantation (no biochemical pregnancy was achieved).
Morphokinetic and morphological events andimplantation rateOf the total 247 (19.4%) embryos, 48 exhibited one or more of thefollowing morphological events: (i) direct cleavage from zygote tothree blastomere embryo, defined as: cc2 ¼ t3-t2 , 5 h (n¼ 8).(ii) uneven blastomere size at the 2 cell stage during the interphasewhere the nuclei are visible (n ¼ 26). Blastomeres were considereduneven sized if the average diameter of the large blastomere was
.25% larger than the average diameter of the small blastomere.(iii) multinucleation at the 4 cell stage during the interphase where thenuclei are visible (n ¼ 23). The embryo was considered multinucleatedif more than one distinct nucleus was observed in one (or more) blas-tomeres. From those 48 embryos, only four implanted (8%) (two withuneven blastomere size and two that were multinucleated) and wesuggest using the listed observations as exclusion criteria for embryoselection. We found 29 transferred embryos that exhibited .20% offragmentation, out of which four implanted (14% IR); consequently,we did not consider ‘.20% fragmentation’ to be an exclusion criterion.
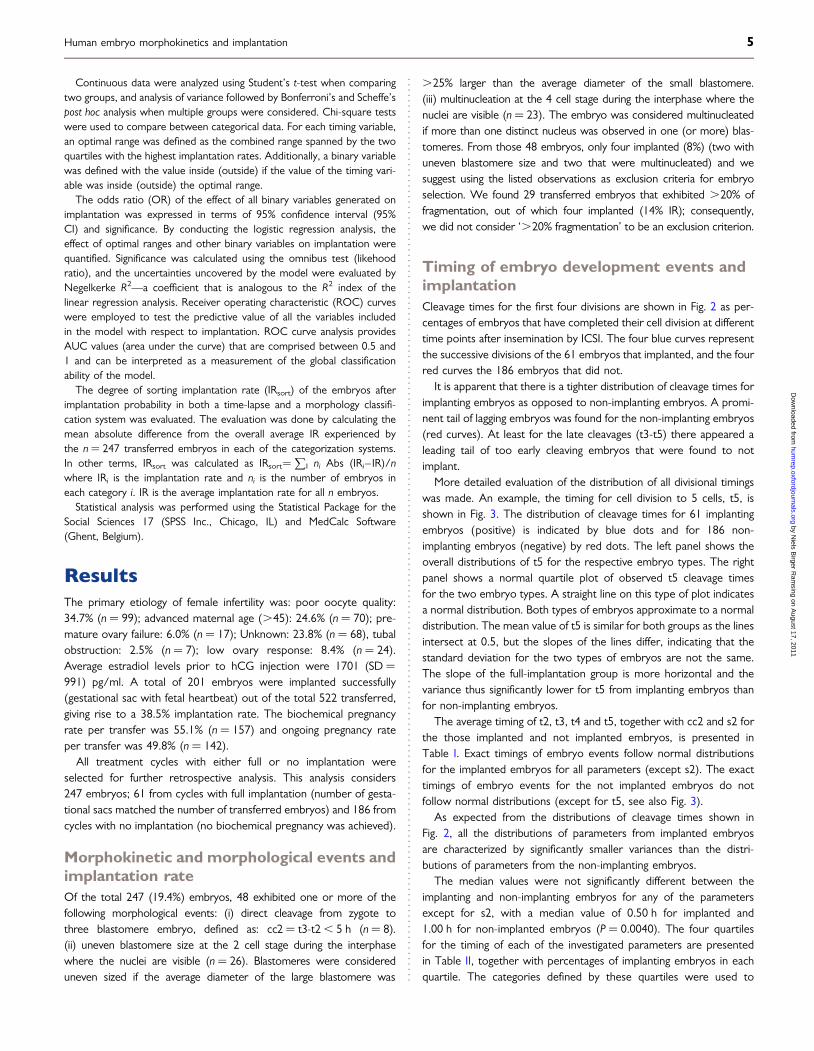
Timing of embryo development events andimplantationCleavage times for the first four divisions are shown in Fig. 2 as per-centages of embryos that have completed their cell division at differenttime points after insemination by ICSI. The four blue curves representthe successive divisions of the 61 embryos that implanted, and the fourred curves the 186 embryos that did not.
It is apparent that there is a tighter distribution of cleavage times forimplanting embryos as opposed to non-implanting embryos. A promi-nent tail of lagging embryos was found for the non-implanting embryos(red curves). At least for the late cleavages (t3-t5) there appeared aleading tail of too early cleaving embryos that were found to notimplant.
More detailed evaluation of the distribution of all divisional timingswas made. An example, the timing for cell division to 5 cells, t5, isshown in Fig. 3. The distribution of cleavage times for 61 implantingembryos (positive) is indicated by blue dots and for 186 non-implanting embryos (negative) by red dots. The left panel shows theoverall distributions of t5 for the respective embryo types. The rightpanel shows a normal quartile plot of observed t5 cleavage timesfor the two embryo types. A straight line on this type of plot indicatesa normal distribution. Both types of embryos approximate to a normaldistribution. The mean value of t5 is similar for both groups as the linesintersect at 0.5, but the slopes of the lines differ, indicating that thestandard deviation for the two types of embryos are not the same.The slope of the full-implantation group is more horizontal and thevariance thus significantly lower for t5 from implanting embryos thanfor non-implanting embryos.
The average timing of t2, t3, t4 and t5, together with cc2 and s2 forthe those implanted and not implanted embryos, is presented inTable I. Exact timings of embryo events follow normal distributionsfor the implanted embryos for all parameters (except s2). The exacttimings of embryo events for the not implanted embryos do notfollow normal distributions (except for t5, see also Fig. 3).
As expected from the distributions of cleavage times shown inFig. 2, all the distributions of parameters from implanted embryosare characterized by significantly smaller variances than the distri-butions of parameters from the non-implanting embryos.
The median values were not significantly different between theimplanting and non-implanting embryos for any of the parametersexcept for s2, with a median value of 0.50 h for implanted and1.00 h for non-implanted embryos (P ¼ 0.0040). The four quartilesfor the timing of each of the investigated parameters are presentedin Table II, together with percentages of implanting embryos in eachquartile. The categories defined by these quartiles were used to
Human embryo morphokinetics and implantation 5
by Niels B
irger Ram
sing on August 17, 2011
humrep.oxfordjournals.org
Dow
nloaded from
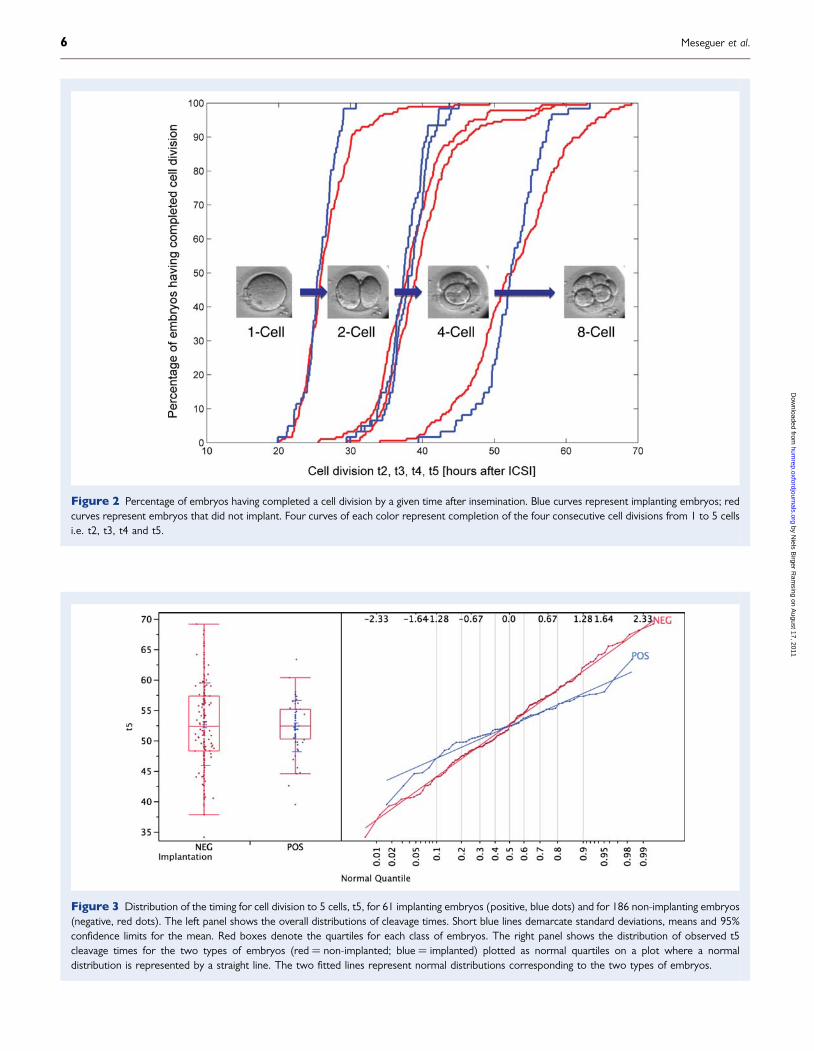
Figure 2 Percentage of embryos having completed a cell division by a given time after insemination. Blue curves represent implanting embryos; redcurves represent embryos that did not implant. Four curves of each color represent completion of the four consecutive cell divisions from 1 to 5 cellsi.e. t2, t3, t4 and t5.
Figure 3 Distribution of the timing for cell division to 5 cells, t5, for 61 implanting embryos (positive, blue dots) and for 186 non-implanting embryos(negative, red dots). The left panel shows the overall distributions of cleavage times. Short blue lines demarcate standard deviations, means and 95%confidence limits for the mean. Red boxes denote the quartiles for each class of embryos. The right panel shows the distribution of observed t5cleavage times for the two types of embryos (red ¼ non-implanted; blue ¼ implanted) plotted as normal quartiles on a plot where a normaldistribution is represented by a straight line. The two fitted lines represent normal distributions corresponding to the two types of embryos.
6 Meseguer et al.
by Niels B
irger Ram
sing on August 17, 2011
humrep.oxfordjournals.org
Dow
nloaded from
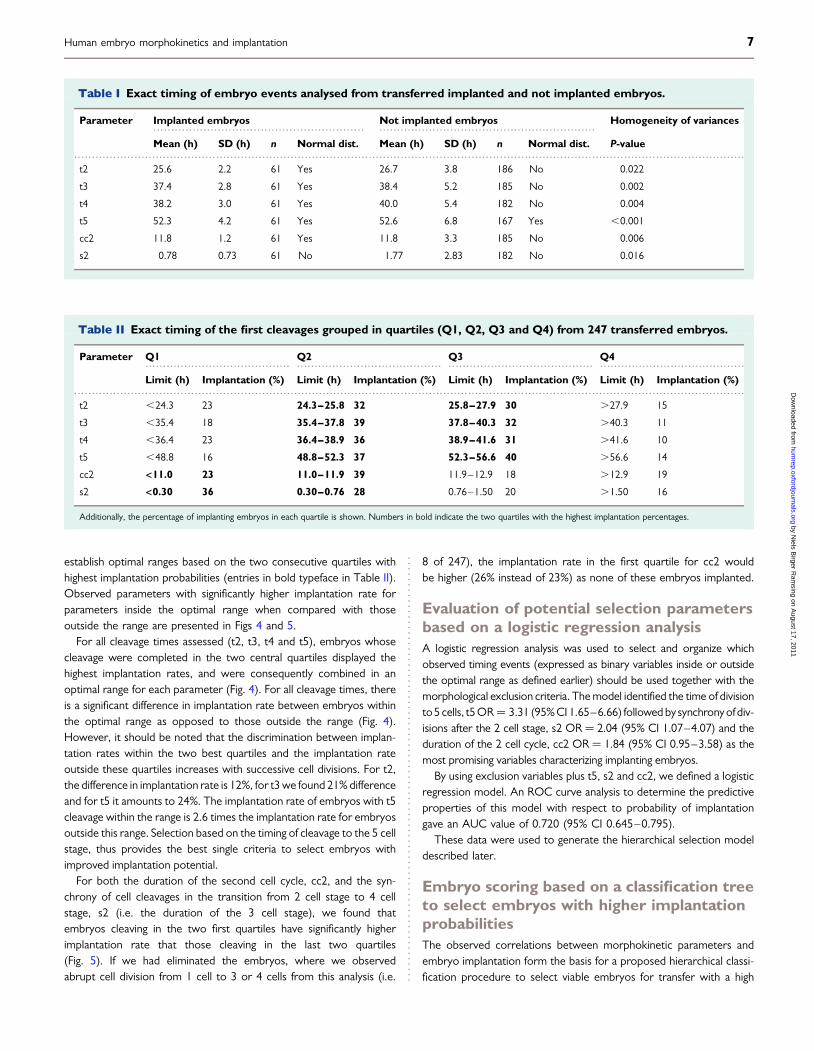
establish optimal ranges based on the two consecutive quartiles withhighest implantation probabilities (entries in bold typeface in Table II).Observed parameters with significantly higher implantation rate forparameters inside the optimal range when compared with thoseoutside the range are presented in Figs 4 and 5.
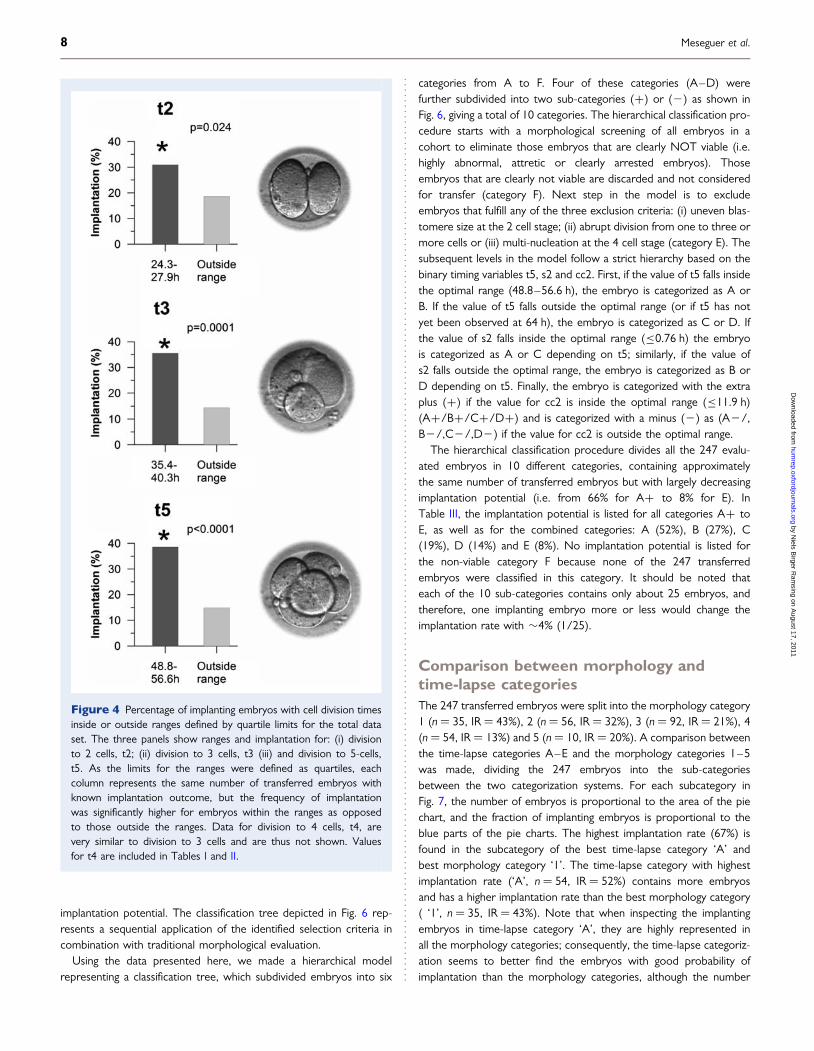
For all cleavage times assessed (t2, t3, t4 and t5), embryos whosecleavage were completed in the two central quartiles displayed thehighest implantation rates, and were consequently combined in anoptimal range for each parameter (Fig. 4). For all cleavage times, thereis a significant difference in implantation rate between embryos withinthe optimal range as opposed to those outside the range (Fig. 4).However, it should be noted that the discrimination between implan-tation rates within the two best quartiles and the implantation rateoutside these quartiles increases with successive cell divisions. For t2,the difference in implantation rate is 12%, for t3 we found 21% differenceand for t5 it amounts to 24%. The implantation rate of embryos with t5cleavage within the range is 2.6 times the implantation rate for embryosoutside this range. Selection based on the timing of cleavage to the 5 cellstage, thus provides the best single criteria to select embryos withimproved implantation potential.
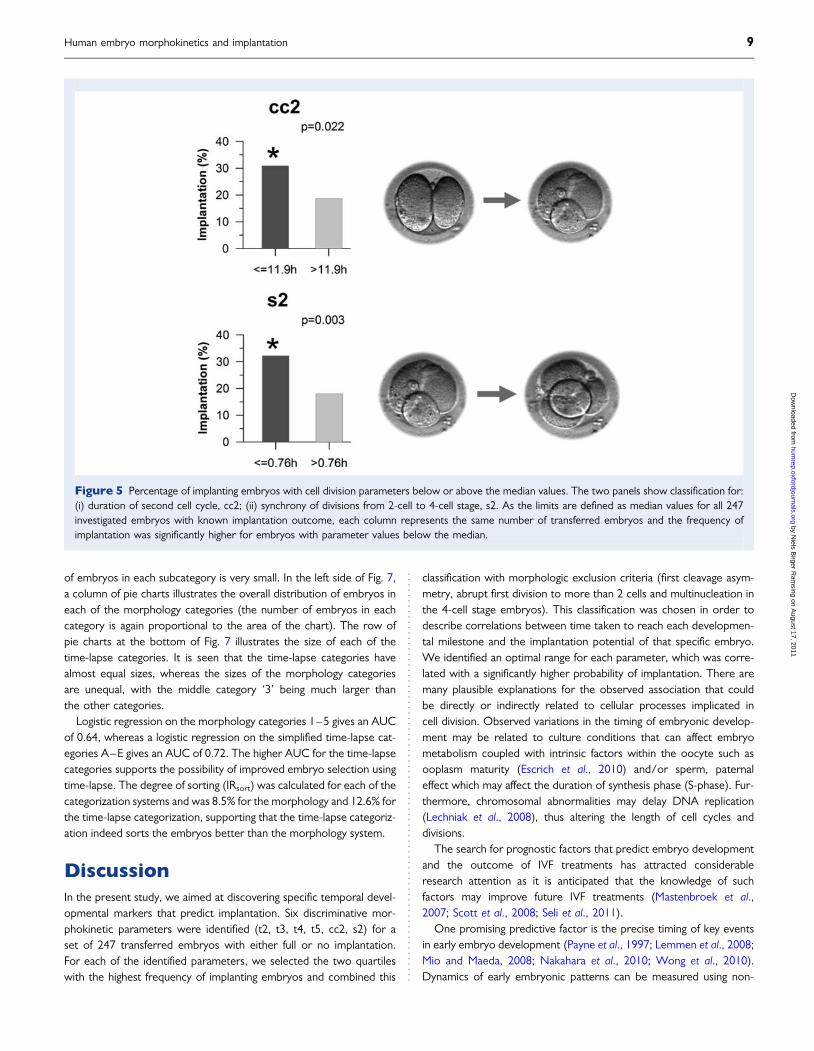
For both the duration of the second cell cycle, cc2, and the syn-chrony of cell cleavages in the transition from 2 cell stage to 4 cellstage, s2 (i.e. the duration of the 3 cell stage), we found thatembryos cleaving in the two first quartiles have significantly higherimplantation rate that those cleaving in the last two quartiles(Fig. 5). If we had eliminated the embryos, where we observedabrupt cell division from 1 cell to 3 or 4 cells from this analysis (i.e.
8 of 247), the implantation rate in the first quartile for cc2 wouldbe higher (26% instead of 23%) as none of these embryos implanted.
Evaluation of potential selection parametersbased on a logistic regression analysisA logistic regression analysis was used to select and organize whichobserved timing events (expressed as binary variables inside or outsidethe optimal range as defined earlier) should be used together with themorphological exclusion criteria. The model identified the time of divisionto 5 cells, t5 OR¼ 3.31 (95% CI 1.65–6.66) followed by synchrony of div-isions after the 2 cell stage, s2 OR¼ 2.04 (95% CI 1.07–4.07) and theduration of the 2 cell cycle, cc2 OR ¼ 1.84 (95% CI 0.95–3.58) as themost promising variables characterizing implanting embryos.
By using exclusion variables plus t5, s2 and cc2, we defined a logisticregression model. An ROC curve analysis to determine the predictiveproperties of this model with respect to probability of implantationgave an AUC value of 0.720 (95% CI 0.645–0.795).
These data were used to generate the hierarchical selection modeldescribed later.
Embryo scoring based on a classification treeto select embryos with higher implantationprobabilitiesThe observed correlations between morphokinetic parameters andembryo implantation form the basis for a proposed hierarchical classi-fication procedure to select viable embryos for transfer with a high
......................................... ......................................... ......................................... .........................................
.............................................................................................................................................................................................
Table II Exact timing of the first cleavages grouped in quartiles (Q1, Q2, Q3 and Q4) from 247 transferred embryos.
Parameter Q1 Q2 Q3 Q4
Limit (h) Implantation (%) Limit (h) Implantation (%) Limit (h) Implantation (%) Limit (h) Implantation (%)
t2 ,24.3 23 24.3–25.8 32 25.8–27.9 30 .27.9 15
t3 ,35.4 18 35.4–37.8 39 37.8–40.3 32 .40.3 11
t4 ,36.4 23 36.4–38.9 36 38.9–41.6 31 .41.6 10
t5 ,48.8 16 48.8–52.3 37 52.3–56.6 40 .56.6 14
cc2 <11.0 23 11.0–11.9 39 11.9–12.9 18 .12.9 19
s2 <0.30 36 0.30–0.76 28 0.76–1.50 20 .1.50 16
Additionally, the percentage of implanting embryos in each quartile is shown. Numbers in bold indicate the two quartiles with the highest implantation percentages.
........................................................... .............................................................
.............................................................................................................................................................................................
Table I Exact timing of embryo events analysed from transferred implanted and not implanted embryos.
Parameter Implanted embryos Not implanted embryos Homogeneity of variances
Mean (h) SD (h) n Normal dist. Mean (h) SD (h) n Normal dist. P-value
t2 25.6 2.2 61 Yes 26.7 3.8 186 No 0.022
t3 37.4 2.8 61 Yes 38.4 5.2 185 No 0.002
t4 38.2 3.0 61 Yes 40.0 5.4 182 No 0.004
t5 52.3 4.2 61 Yes 52.6 6.8 167 Yes ,0.001
cc2 11.8 1.2 61 Yes 11.8 3.3 185 No 0.006
s2 0.78 0.73 61 No 1.77 2.83 182 No 0.016
Human embryo morphokinetics and implantation 7
by Niels B
irger Ram
sing on August 17, 2011
humrep.oxfordjournals.org
Dow
nloaded from
implantation potential. The classification tree depicted in Fig. 6 rep-resents a sequential application of the identified selection criteria incombination with traditional morphological evaluation.
Using the data presented here, we made a hierarchical modelrepresenting a classification tree, which subdivided embryos into six
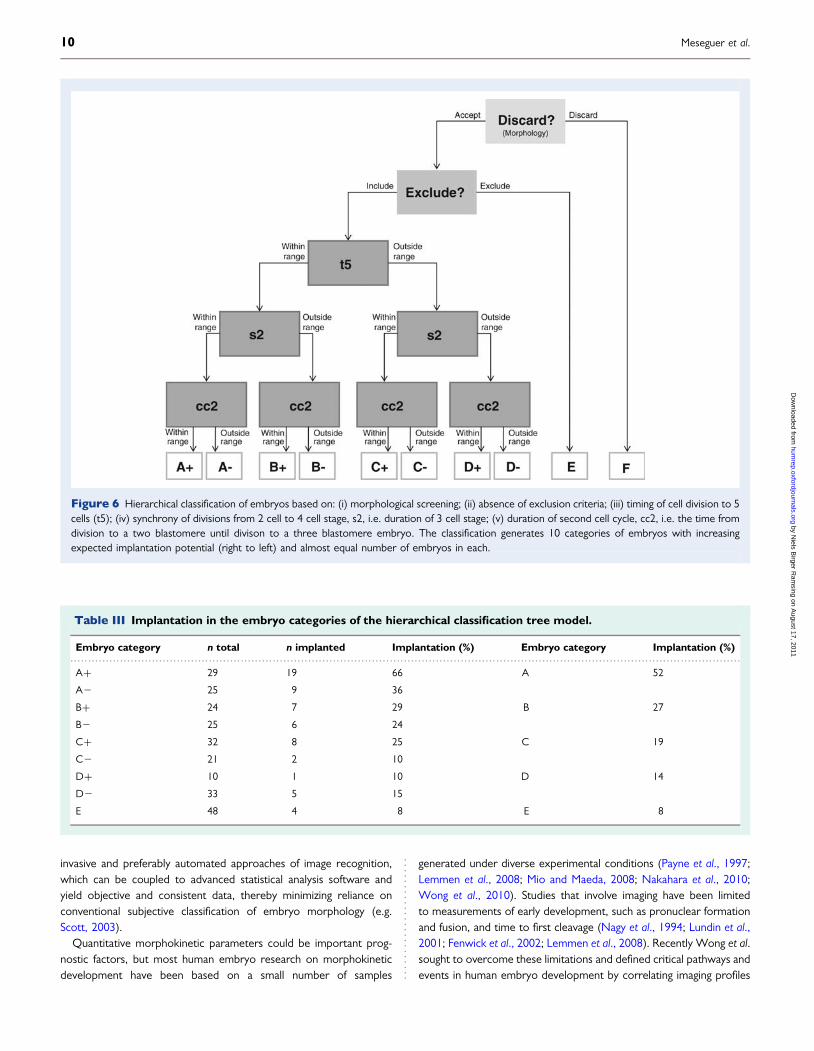
categories from A to F. Four of these categories (A–D) werefurther subdivided into two sub-categories (+) or (2) as shown inFig. 6, giving a total of 10 categories. The hierarchical classification pro-cedure starts with a morphological screening of all embryos in acohort to eliminate those embryos that are clearly NOT viable (i.e.highly abnormal, attretic or clearly arrested embryos). Thoseembryos that are clearly not viable are discarded and not consideredfor transfer (category F). Next step in the model is to excludeembryos that fulfill any of the three exclusion criteria: (i) uneven blas-tomere size at the 2 cell stage; (ii) abrupt division from one to three ormore cells or (iii) multi-nucleation at the 4 cell stage (category E). Thesubsequent levels in the model follow a strict hierarchy based on thebinary timing variables t5, s2 and cc2. First, if the value of t5 falls insidethe optimal range (48.8–56.6 h), the embryo is categorized as A orB. If the value of t5 falls outside the optimal range (or if t5 has notyet been observed at 64 h), the embryo is categorized as C or D. Ifthe value of s2 falls inside the optimal range (≤0.76 h) the embryois categorized as A or C depending on t5; similarly, if the value ofs2 falls outside the optimal range, the embryo is categorized as B orD depending on t5. Finally, the embryo is categorized with the extraplus (+) if the value for cc2 is inside the optimal range (≤11.9 h)(A+/B+/C+/D+) and is categorized with a minus (2) as (A2/,B2/,C2/,D2) if the value for cc2 is outside the optimal range.
The hierarchical classification procedure divides all the 247 evalu-ated embryos in 10 different categories, containing approximatelythe same number of transferred embryos but with largely decreasingimplantation potential (i.e. from 66% for A+ to 8% for E). InTable III, the implantation potential is listed for all categories A+ toE, as well as for the combined categories: A (52%), B (27%), C(19%), D (14%) and E (8%). No implantation potential is listed forthe non-viable category F because none of the 247 transferredembryos were classified in this category. It should be noted thateach of the 10 sub-categories contains only about 25 embryos, andtherefore, one implanting embryo more or less would change theimplantation rate with �4% (1/25).
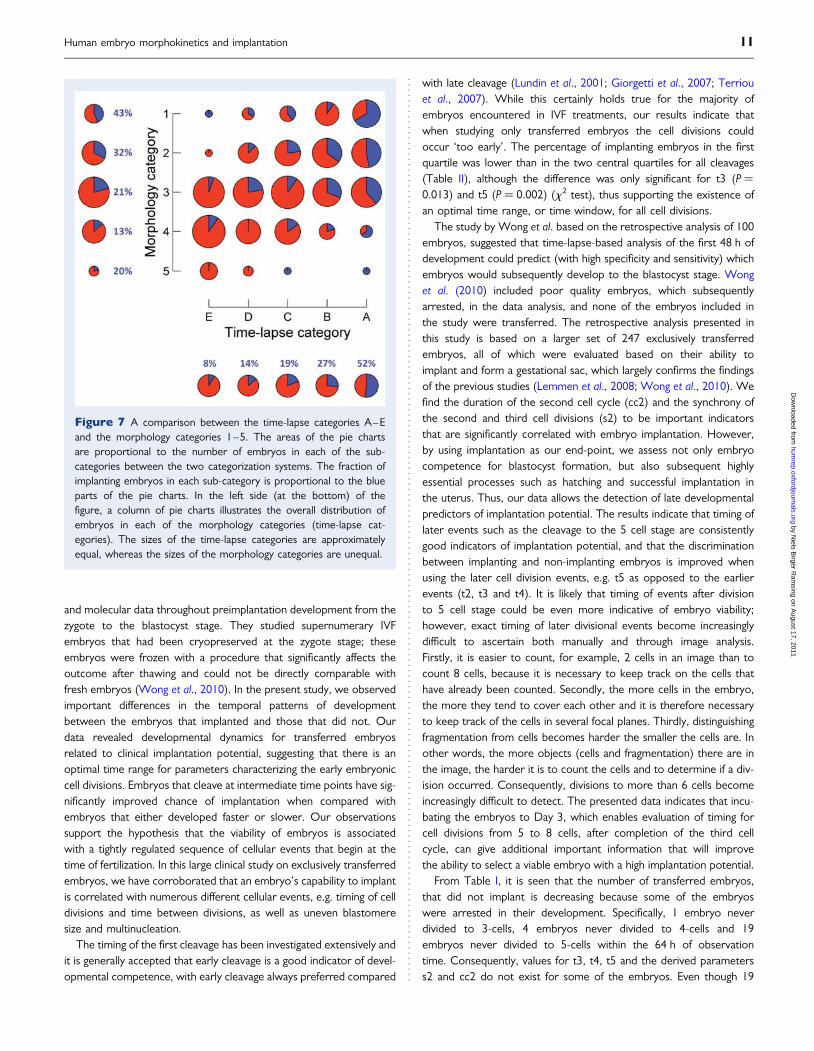
Comparison between morphology andtime-lapse categoriesThe 247 transferred embryos were split into the morphology category1 (n ¼ 35, IR ¼ 43%), 2 (n ¼ 56, IR ¼ 32%), 3 (n ¼ 92, IR ¼ 21%), 4(n ¼ 54, IR ¼ 13%) and 5 (n ¼ 10, IR ¼ 20%). A comparison betweenthe time-lapse categories A–E and the morphology categories 1–5was made, dividing the 247 embryos into the sub-categoriesbetween the two categorization systems. For each subcategory inFig. 7, the number of embryos is proportional to the area of the piechart, and the fraction of implanting embryos is proportional to theblue parts of the pie charts. The highest implantation rate (67%) isfound in the subcategory of the best time-lapse category ‘A’ andbest morphology category ‘1’. The time-lapse category with highestimplantation rate (‘A’, n ¼ 54, IR ¼ 52%) contains more embryosand has a higher implantation rate than the best morphology category( ‘1’, n ¼ 35, IR ¼ 43%). Note that when inspecting the implantingembryos in time-lapse category ‘A’, they are highly represented inall the morphology categories; consequently, the time-lapse categoriz-ation seems to better find the embryos with good probability ofimplantation than the morphology categories, although the number
Figure 4 Percentage of implanting embryos with cell division timesinside or outside ranges defined by quartile limits for the total dataset. The three panels show ranges and implantation for: (i) divisionto 2 cells, t2; (ii) division to 3 cells, t3 (iii) and division to 5-cells,t5. As the limits for the ranges were defined as quartiles, eachcolumn represents the same number of transferred embryos withknown implantation outcome, but the frequency of implantationwas significantly higher for embryos within the ranges as opposedto those outside the ranges. Data for division to 4 cells, t4, arevery similar to division to 3 cells and are thus not shown. Valuesfor t4 are included in Tables I and II.
8 Meseguer et al.
by Niels B
irger Ram
sing on August 17, 2011
humrep.oxfordjournals.org
Dow
nloaded from
of embryos in each subcategory is very small. In the left side of Fig. 7,a column of pie charts illustrates the overall distribution of embryos ineach of the morphology categories (the number of embryos in eachcategory is again proportional to the area of the chart). The row ofpie charts at the bottom of Fig. 7 illustrates the size of each of thetime-lapse categories. It is seen that the time-lapse categories havealmost equal sizes, whereas the sizes of the morphology categoriesare unequal, with the middle category ‘3’ being much larger thanthe other categories.
Logistic regression on the morphology categories 1–5 gives an AUCof 0.64, whereas a logistic regression on the simplified time-lapse cat-egories A–E gives an AUC of 0.72. The higher AUC for the time-lapsecategories supports the possibility of improved embryo selection usingtime-lapse. The degree of sorting (IRsort) was calculated for each of thecategorization systems and was 8.5% for the morphology and 12.6% forthe time-lapse categorization, supporting that the time-lapse categoriz-ation indeed sorts the embryos better than the morphology system.
DiscussionIn the present study, we aimed at discovering specific temporal devel-opmental markers that predict implantation. Six discriminative mor-phokinetic parameters were identified (t2, t3, t4, t5, cc2, s2) for aset of 247 transferred embryos with either full or no implantation.For each of the identified parameters, we selected the two quartileswith the highest frequency of implanting embryos and combined this
classification with morphologic exclusion criteria (first cleavage asym-metry, abrupt first division to more than 2 cells and multinucleation inthe 4-cell stage embryos). This classification was chosen in order todescribe correlations between time taken to reach each developmen-tal milestone and the implantation potential of that specific embryo.We identified an optimal range for each parameter, which was corre-lated with a significantly higher probability of implantation. There aremany plausible explanations for the observed association that couldbe directly or indirectly related to cellular processes implicated incell division. Observed variations in the timing of embryonic develop-ment may be related to culture conditions that can affect embryometabolism coupled with intrinsic factors within the oocyte such asooplasm maturity (Escrich et al., 2010) and/or sperm, paternaleffect which may affect the duration of synthesis phase (S-phase). Fur-thermore, chromosomal abnormalities may delay DNA replication(Lechniak et al., 2008), thus altering the length of cell cycles anddivisions.
The search for prognostic factors that predict embryo developmentand the outcome of IVF treatments has attracted considerableresearch attention as it is anticipated that the knowledge of suchfactors may improve future IVF treatments (Mastenbroek et al.,2007; Scott et al., 2008; Seli et al., 2011).
One promising predictive factor is the precise timing of key eventsin early embryo development (Payne et al., 1997; Lemmen et al., 2008;Mio and Maeda, 2008; Nakahara et al., 2010; Wong et al., 2010).Dynamics of early embryonic patterns can be measured using non-
Figure 5 Percentage of implanting embryos with cell division parameters below or above the median values. The two panels show classification for:(i) duration of second cell cycle, cc2; (ii) synchrony of divisions from 2-cell to 4-cell stage, s2. As the limits are defined as median values for all 247investigated embryos with known implantation outcome, each column represents the same number of transferred embryos and the frequency ofimplantation was significantly higher for embryos with parameter values below the median.
Human embryo morphokinetics and implantation 9
by Niels B
irger Ram
sing on August 17, 2011
humrep.oxfordjournals.org
Dow
nloaded from
invasive and preferably automated approaches of image recognition,which can be coupled to advanced statistical analysis software andyield objective and consistent data, thereby minimizing reliance onconventional subjective classification of embryo morphology (e.g.Scott, 2003).
Quantitative morphokinetic parameters could be important prog-nostic factors, but most human embryo research on morphokineticdevelopment have been based on a small number of samples
generated under diverse experimental conditions (Payne et al., 1997;Lemmen et al., 2008; Mio and Maeda, 2008; Nakahara et al., 2010;Wong et al., 2010). Studies that involve imaging have been limitedto measurements of early development, such as pronuclear formationand fusion, and time to first cleavage (Nagy et al., 1994; Lundin et al.,2001; Fenwick et al., 2002; Lemmen et al., 2008). Recently Wong et al.sought to overcome these limitations and defined critical pathways andevents in human embryo development by correlating imaging profiles
Figure 6 Hierarchical classification of embryos based on: (i) morphological screening; (ii) absence of exclusion criteria; (iii) timing of cell division to 5cells (t5); (iv) synchrony of divisions from 2 cell to 4 cell stage, s2, i.e. duration of 3 cell stage; (v) duration of second cell cycle, cc2, i.e. the time fromdivision to a two blastomere until divison to a three blastomere embryo. The classification generates 10 categories of embryos with increasingexpected implantation potential (right to left) and almost equal number of embryos in each.
.............................................................................................................................................................................................
Table III Implantation in the embryo categories of the hierarchical classification tree model.
Embryo category n total n implanted Implantation (%) Embryo category Implantation (%)
A+ 29 19 66 A 52
A2 25 9 36
B+ 24 7 29 B 27
B2 25 6 24
C+ 32 8 25 C 19
C2 21 2 10
D+ 10 1 10 D 14
D2 33 5 15
E 48 4 8 E 8
10 Meseguer et al.
by Niels B
irger Ram
sing on August 17, 2011
humrep.oxfordjournals.org
Dow
nloaded from
and molecular data throughout preimplantation development from thezygote to the blastocyst stage. They studied supernumerary IVFembryos that had been cryopreserved at the zygote stage; theseembryos were frozen with a procedure that significantly affects theoutcome after thawing and could not be directly comparable withfresh embryos (Wong et al., 2010). In the present study, we observedimportant differences in the temporal patterns of developmentbetween the embryos that implanted and those that did not. Ourdata revealed developmental dynamics for transferred embryosrelated to clinical implantation potential, suggesting that there is anoptimal time range for parameters characterizing the early embryoniccell divisions. Embryos that cleave at intermediate time points have sig-nificantly improved chance of implantation when compared withembryos that either developed faster or slower. Our observationssupport the hypothesis that the viability of embryos is associatedwith a tightly regulated sequence of cellular events that begin at thetime of fertilization. In this large clinical study on exclusively transferredembryos, we have corroborated that an embryo’s capability to implantis correlated with numerous different cellular events, e.g. timing of celldivisions and time between divisions, as well as uneven blastomeresize and multinucleation.
The timing of the first cleavage has been investigated extensively andit is generally accepted that early cleavage is a good indicator of devel-opmental competence, with early cleavage always preferred compared
with late cleavage (Lundin et al., 2001; Giorgetti et al., 2007; Terriouet al., 2007). While this certainly holds true for the majority ofembryos encountered in IVF treatments, our results indicate thatwhen studying only transferred embryos the cell divisions couldoccur ‘too early’. The percentage of implanting embryos in the firstquartile was lower than in the two central quartiles for all cleavages(Table II), although the difference was only significant for t3 (P ¼0.013) and t5 (P ¼ 0.002) (x2 test), thus supporting the existence ofan optimal time range, or time window, for all cell divisions.
The study by Wong et al. based on the retrospective analysis of 100embryos, suggested that time-lapse-based analysis of the first 48 h ofdevelopment could predict (with high specificity and sensitivity) whichembryos would subsequently develop to the blastocyst stage. Wonget al. (2010) included poor quality embryos, which subsequentlyarrested, in the data analysis, and none of the embryos included inthe study were transferred. The retrospective analysis presented inthis study is based on a larger set of 247 exclusively transferredembryos, all of which were evaluated based on their ability toimplant and form a gestational sac, which largely confirms the findingsof the previous studies (Lemmen et al., 2008; Wong et al., 2010). Wefind the duration of the second cell cycle (cc2) and the synchrony ofthe second and third cell divisions (s2) to be important indicatorsthat are significantly correlated with embryo implantation. However,by using implantation as our end-point, we assess not only embryocompetence for blastocyst formation, but also subsequent highlyessential processes such as hatching and successful implantation inthe uterus. Thus, our data allows the detection of late developmentalpredictors of implantation potential. The results indicate that timing oflater events such as the cleavage to the 5 cell stage are consistentlygood indicators of implantation potential, and that the discriminationbetween implanting and non-implanting embryos is improved whenusing the later cell division events, e.g. t5 as opposed to the earlierevents (t2, t3 and t4). It is likely that timing of events after divisionto 5 cell stage could be even more indicative of embryo viability;however, exact timing of later divisional events become increasinglydifficult to ascertain both manually and through image analysis.Firstly, it is easier to count, for example, 2 cells in an image than tocount 8 cells, because it is necessary to keep track on the cells thathave already been counted. Secondly, the more cells in the embryo,the more they tend to cover each other and it is therefore necessaryto keep track of the cells in several focal planes. Thirdly, distinguishingfragmentation from cells becomes harder the smaller the cells are. Inother words, the more objects (cells and fragmentation) there are inthe image, the harder it is to count the cells and to determine if a div-ision occurred. Consequently, divisions to more than 6 cells becomeincreasingly difficult to detect. The presented data indicates that incu-bating the embryos to Day 3, which enables evaluation of timing forcell divisions from 5 to 8 cells, after completion of the third cellcycle, can give additional important information that will improvethe ability to select a viable embryo with a high implantation potential.
From Table I, it is seen that the number of transferred embryos,that did not implant is decreasing because some of the embryoswere arrested in their development. Specifically, 1 embryo neverdivided to 3-cells, 4 embryos never divided to 4-cells and 19embryos never divided to 5-cells within the 64 h of observationtime. Consequently, values for t3, t4, t5 and the derived parameterss2 and cc2 do not exist for some of the embryos. Even though 19
Figure 7 A comparison between the time-lapse categories A–Eand the morphology categories 1–5. The areas of the pie chartsare proportional to the number of embryos in each of the sub-categories between the two categorization systems. The fraction ofimplanting embryos in each sub-category is proportional to the blueparts of the pie charts. In the left side (at the bottom) of thefigure, a column of pie charts illustrates the overall distribution ofembryos in each of the morphology categories (time-lapse cat-egories). The sizes of the time-lapse categories are approximatelyequal, whereas the sizes of the morphology categories are unequal.
Human embryo morphokinetics and implantation 11
by Niels B
irger Ram
sing on August 17, 2011
humrep.oxfordjournals.org
Dow
nloaded from
of the non-implanting embryos never divide to 5-cells, it is still possibleto discriminate the group of implanting and non-implanting based onthe SD of t5, emphasizing the power of the later divisional events.One of the main objectives for ART, which is a presently usedpolicy in several European IVF clinics, is to reduce the number of mul-tiple gestations by single embryo transfer. Current morphological-andgrowth-related criteria that are commonly used to assess embryo via-bility on Day 3 may both underestimate or overestimate embryopotential (Racowsky, 2002). Given the uncertainties associated withevaluation at Day 3, some clinics have turned to extended culture regi-mens to improve the assessment of embryo implantation potential(Milki et al., 2000; Gardner et al., 2004). Blastocyst culture brings anumber of potential advantages over traditional cleavage-stageembryo transfer, since prolonged embryo culture in which some pre-sumably non-viable embryos arrest their development may facilitatethe ultimate selection of the blastocyst for transfer. Extendedculture has been advocated as a way to increase implantation rateand improve reproductive outcomes (Mercader et al., 2003;Gardner et al., 2004).
However, prolonged in vitro culture increases the laboratory work-load. Moreover, with prolonged in vitro culture—even in greatlyimproved modern media—we increase the exposure of the develop-ing embryo to artificial culturing conditions. Legitimate concerns havebeen raised that this extended exposure could affect natural imprintingand lead to altered gene expression patterns or even higher risk ofpreterm birth or congenital malformations (Niemitz and Feinberg,2004; Horsthemke and Ludwig, 2005; Kallen et al., 2010) and thusresult in an increased frequency of epigenetic disorders (Manipalviratnet al., 2009). Thus, optimal duration of embryo cultivation may besomewhere intermediate, optimizing opportunities for selectionwithout affecting imprinting processes. In addition, in-depth under-standing of the effects of treatment parameters such as stimulationprotocols, media, incubation conditions and handling on embryo mor-phokinetics are still predominantly unknown (Sifer et al., 2009; Waleand Gardner, 2010).
A possible cause for embryos to deviate from the optimal cleavagepattern is aneuploidies and genetic disorders. While advanced mor-phokinetic selection is not a guarantee of chromosomal normality, ithas been reported that most embryos that fail to follow normaltimings for cell divisions may show multiple aneuploidies (Joneset al., 1998). Combining our results with Jones et al. (1998) suggeststhat morphokinetic parameters could improve selection of geneticallynormal and viable embryos and thus alleviate the need for invasiveprocedures but more research is needed to investigate the possiblerelationship.
In summary, our results demonstrate that routine time-lapse moni-toring of embryo development in a clinical setting, (i.e. automaticimage acquisition in an undisturbed controlled incubation environ-ment) provides novel information about developmental parametersthat differ between implanting and non-implanting embryos, in thesense that the variances for the parameters are larger for the non-implanting than for the implanting embryos. Retrospective analysis ofembryo morphokinetics indicated the correlations between develop-mental events and subsequent implantation after transfer. However,the median values of the morphokinetic parameters (except s2) fortransferred embryos do not differ between the implanting and non-implanting embryos—only the variance. It is well known that other
factors besides embryo viability play a vital role in embryo implan-tation. An embryo can belong to both the best morphology and thebest time-lapse category and still not implant, simply because theendometrium is not ready. It is therefore not unexpected that wefind non-implanting embryos with the exact same morphokineticdevelopment as implanting embryos. On the other hand, the morpho-kinetic parameters make rejection of embryos with lower chance ofimplantation possible, because the variances in the morphokinetic par-ameters are indeed larger for the non-implanting than for the implant-ing embryos. The use of morphokinetic parameters could hence behelpful in improving embryo selection in conjunction with currentlyused morphological parameters.
In clinical practice, our results may be used to improve embryoselection by measuring morphokinetic markers and selectingembryos for transfer that best follow the divisional timings and pat-terns identified for implanting embryos. We cannot exclude that themorphokinetics concepts presented here are affected by culturemedia. Consequently, until the influence of culture media on the mor-phokinetics has been investigated, it is still unclear whether the pro-posed selection criteria are universally applicable or culture- specific.
The time-lapse categorization system presented with the hierarchi-cal tree is a first attempt of making a model for embryo selection thatincorporates time-lapse information. When more data are available, itis desirable to develop a more sophisticated unified model betterincorporating and exploiting both the morphology and time-lapseinformation.
The comparison of the time-lapse hierarchical tree and the mor-phology categorizations showed that the degree of sorting of theembryos was better in the time-lapse categorization than in the mor-phology categorization. It suggests that it should be possible toimprove pregnancy rates by using the time-lapse information forembryo selection.
Nonetheless, the observed correlations and proposed selectionprocedures must be tested in randomized prospective trials to evalu-ate the efficacy of the novel hierarchical selection procedure. Theensuing knowledge building through extensive documentation ofembryo development may enable us to discover, test and improvemorphokinetic selection criteria for future IVF treatments.
Authors’ rolesM.M. played a role in conception and design, data analysis andinterpretation, drafting manuscript and final approval. J.H. was involvedin drafting the manuscript, acquisition of data and final approval. A.T.revised the article critically, acquired data and took part in finalapproval. K.M.H. was involved in data analysis and interpretation,drafting the manuscript and final approval. N.B.R. took part in con-ception and design, data analysis and interpretation, critical revisionof the article and final approval. J.R. played a role in critical revisingof article, interpretation of data and final approval.
AcknowledgementsThe authors thank Nicolas Garrido, Mª Jose de los Santos, NoeliaGrau and Laura Escrich from IVI Valencia and Kamilla Sofie Pedersen,from Unisense FertiliTech, for their clinical and technical support inthis study. The authors give special acknowledgement to
12 Meseguer et al.
by Niels B
irger Ram
sing on August 17, 2011
humrep.oxfordjournals.org
Dow
nloaded from
R.G. Sturmey (Hull York Medical School, UK) for his essential critical,scientific and grammatical contributions to this manuscript.
Conflict of interestN.B.R. and K.M.H. are employees and shareholders in the companyUnisense FertiliTech A/S, which develops, manufactures and sellstime-lapse incubators (e.g. the EmbryoScopeTM). Unisense FertiliTechhas produced the equipment used in the study.
FundingThis work has been supported by CDTI-EUREKA (Spanish Govern-ment and European Community), and by a grant from the DanishNational Advanced Technology Foundation (Project: 4D CellVision).
ReferencesAlikani M, Calderon G, Tomkin G, Garrisi J, Kokot M, Cohen J. Cleavage
anomalies in early human embryos and survival after prolonged culturein-vitro. Hum Reprod 2000;15:2634–2643.
Baczkowski T, Kurzawa R, Glabowski W. Methods of embryo scoring in invitro fertilization. Reprod Biol 2004;4:5–22.
Bos-Mikich A, Mattos AL, Ferrari AN. Early cleavage of human embryos:an effective method for predicting successful IVF/ICSI outcome. HumReprod 2001;16:2658–2661.
Ciray HN, Ulug U, Tosun S, Erden HF, Bahceci M. Outcome of 1114 ICSIand embryo transfer cycles of women 40 years of age and over. ReprodBiomed Online 2006;13:516–522.
Cobo A, Meseguer M, Remohi J, Pellicer A. Use of cryo-banked oocytes inan ovum donation programme: a prospective, randomized, controlled,clinical trial. Hum Reprod 2010;25:2239–2246.
Edwards RG, Fishel SB, Cohen J, Fehilly CB, Purdy JM, Slater JM,Steptoe PC, Webster JM. Factors influencing the success of in vitrofertilization for alleviating human infertility. J In Vitro Fertil EmbryoTransfer 1984;1:3–23.
Escrich L, Grau N, Meseguer M, Pellicer A, Escriba MJ. Morphologicindicators predict the stage of chromatin condensation of humangerminal vesicle oocytes recovered from stimulated cycles. Fertil Steril2010;93:2557–2564.
Fenwick J, Platteau P, Murdoch AP, Herbert M. Time from insemination tofirst cleavage predicts developmental competence of humanpreimplantation embryos in vitro. Hum Reprod 2002;17:407–412.
Garcia-Herrero S, Garrido N, Martinez-Conejero JA, Remohi J, Pellicer A,Meseguer M. Differential transcriptomic profile in spermatozoaachieving pregnancy or not via ICSI. Reprod Biomed Online 2011;22:25–36.
Gardner DK, Surrey E, Minjarez D, Leitz A, Stevens J, Schoolcraft WB.Single blastocyst transfer: a prospective randomized trial. Fertil Steril2004;81:551–555.
Garrido N, Zuzuarregui JL, Meseguer M, Simon C, Remohi J, Pellicer A.Sperm and oocyte donor selection and management: experience of a10 year follow-up of more than 2100 candidates. Hum Reprod 2002;17:3142–3148.
Giorgetti C, Hans E, Terriou P, Salzmann J, Barry B, Chabert-Orsini V,Chinchole JM, Franquebalme JP, Glowaczower E, Sitri MC et al. Earlycleavage: an additional predictor of high implantation rate followingelective single embryo transfer. Reprod Biomed Online 2007;14:85–91.
Hesters L, Prisant N, Fanchin R, Mendez Lozano DH, Feyereisen E,Frydman R, Tachdjian G, Frydman N. Impact of early cleaved zygote
morphology on embryo development and in vitro fertilization-embryotransfer outcome: a prospective study. Fertil Steril 2008;89:1677–1684.
Horsthemke B, Ludwig M. Assisted reproduction: the epigeneticperspective. Hum Reprod Update 2005;11:473–482.
Jones GM, Trounson AO, Lolatgis N, Wood C. Factors affectingthe success of human blastocyst development and pregnancyfollowing in vitro fertilization and embryo transfer. Fertil Steril 1998;70:1022–1029.
Kallen B, Finnstrom O, Lindam A, Nilsson E, Nygren KG, Olausson PO.Blastocyst versus cleavage stage transfer in in vitro fertilization:differences in neonatal outcome? Fertil Steril 2010;94:1680–1683.
Lechniak D, Pers-Kamczyc E, Pawlak P. Timing of the first zygotic cleavageas a marker of developmental potential of mammalian embryos. ReprodBiol 2008;8:23–42.
Lemmen JG, Agerholm I, Ziebe S. Kinetic markers of human embryoquality using time-lapse recordings of IVF/ICSI-fertilized oocytes.Reprod Biomed Online 2008a;17:385–391.
Lundin K, Bergh C, Hardarson T. Early embryo cleavage is a strongindicator of embryo quality in human IVF. Hum Reprod 2001;16:2652–2657.
Manipalviratn S, DeCherney A, Segars J. Imprinting disorders and assistedreproductive technology. Fertil Steril 2009;91:305–315.
Mastenbroek S, Twisk M, van Echten-Arends J, Sikkema-Raddatz B,Korevaar JC, Verhoeve HR, Vogel NE, Arts EG, de Vries JW,Bossuyt PM et al. In vitro fertilization with preimplantation geneticscreening. N Engl J Med 2007;357:9–17.
Melo M, Bellver J, Garrido N, Meseguer M, Pellicer A, Remohi J. Aprospective, randomized, controlled trial comparing three differentgonadotropin regimens in oocyte donors: ovarian response, in vitrofertilization outcome, and analysis of cost minimization. Fertil Steril2010;94:958–964.
Mercader A, Garcia-Velasco JA, Escudero E, Remohi J, Pellicer A,Simon C. Clinical experience and perinatal outcome of blastocysttransfer after coculture of human embryos with human endometrialepithelial cells: a 5-year follow-up study. Fertil Steril 2003;80:1162–1168.
Meseguer M, de los Santos MJ, Simon C, Pellicer A, Remohi J, Garrido N.Effect of sperm glutathione peroxidases 1 and 4 on embryo asymmetryand blastocyst quality in oocyte donation cycles. Fertil Steril 2006;86:1376–1385.
Meseguer M, Martinez-Conejero JA, O’Connor JE, Pellicer A, Remohi J,Garrido N. The significance of sperm DNA oxidation in embryodevelopment and reproductive outcome in an oocyte donationprogram: a new model to study a male infertility prognostic factor.Fertil Steril 2008;89:1191–1199.
Meseguer M, Santiso R, Garrido N, Garcia-Herrero S, Remohi J,Fernandez JL. Effect of sperm DNA fragmentation on pregnancyoutcome depends on oocyte quality. Fertil Steril 2011;95:124–128.
Milki AA, Hinckley MD, Fisch JD, Dasig D, Behr B. Comparison ofblastocyst transfer with day 3 embryo transfer in similar patientpopulations. Fertil Steril 2000;73:126–129.
Mio Y, Maeda K. Time-lapse cinematography of dynamic changesoccurring during in vitro development of human embryos. Am J ObstetGynecol 2008;199:660.e1–660.e5.
Muriel L, Garrido N, Fernandez JL, Remohi J, Pellicer A, de los Santos MJ,Meseguer M. Value of the sperm deoxyribonucleic acid fragmentationlevel, as measured by the sperm chromatin dispersion test, in theoutcome of in vitro fertilization and intracytoplasmic sperm injection.Fertil Steril 2006;85:371–383.
Nagy ZP, Liu J, Joris H, Devroey P, Van Steirteghem A. Time-course ofoocyte activation, pronucleus formation and cleavage in humanoocytes fertilized by intracytoplasmic sperm injection. Hum Reprod1994;9:1743–1748.
Human embryo morphokinetics and implantation 13
by Niels B
irger Ram
sing on August 17, 2011
humrep.oxfordjournals.org
Dow
nloaded from
Nakahara T, Iwase A, Goto M, Harata T, Suzuki M, Ienaga M,Kobayashi H, Takikawa S, Manabe S, Kikkawa F et al. Evaluation ofthe safety of time-lapse observations for human embryos. J AssistReprod Genet 2010;27:93–96.
Niemitz EL, Feinberg AP. Epigenetics and assisted reproductivetechnology: a call for investigation. Am J Hum Genet 2004;74:599–609.
Oh SJ, Gong SP, Lee ST, Lee EJ, Lim JM. Light intensity and wavelengthduring embryo manipulation are important factors for maintainingviability of preimplantation embryos in vitro. Fertil Steril 2007;88:1150–1157.
Ottosen LD, Hindkjaer J, Ingerslev J. Light exposure of the ovum andpreimplantation embryo during ART procedures. J Assist Reprod Genet2007;24:99–103.
Payne D, Flaherty SP, Barry MF, Matthews CD. Preliminary observationson polar body extrusion and pronuclear formation in human oocytesusing time-lapse video cinematography. Hum Reprod 1997;12:532–541.
Racowsky C. High rates of embryonic loss, yet high incidence of multiplebirths in human ART: is this paradoxical? Theriogenology 2002;57:87–96.
Sakkas D, Shoukir Y, Chardonnens D, Bianchi PG, Campana A. Earlycleavage of human embryos to the two-cell stage after intracytoplasmicsperm injection as an indicator of embryo viability. Hum Reprod 1998;13:182–187.
Sakkas D, Percival G, D’Arcy Y, Sharif K, Afnan M. Assessment of earlycleaving in vitro fertilized human embryos at the 2-cell stage beforetransfer improves embryo selection. Fertil Steril 2001;76:1150–1156.
Salumets A, Hyden-Granskog C, Suikkari AM, Tiitinen A, Tuuri T. Thepredictive value of pronuclear morphology of zygotes in theassessment of human embryo quality. Hum Reprod 2001;16:2177–2181.
Scott L. Pronuclear scoring as a predictor of embryo development. ReprodBiomed Online 2003;6:201–214.
Scott L, Berntsen J, Davies D, Gundersen J, Hill J, Ramsing N. Symposium:innovative techniques in human embryo viability assessment. Human
oocyte respiration-rate measurement—potential to improve oocyteand embryo selection? Reprod Biomed Online 2008;17:461–469.
Seli E, Bruce C, Botros L, Henson M, Roos P, Judge K, Hardarson T,Ahlstrom A, Harrison P, Henman M et al. Receiver operatingcharacteristic (ROC) analysis of day 5 morphology grading andmetabolomic viability score on predicting implantation outcome.J Assist Reprod Genet 2011;28:137–144.
Shoukir Y, Campana A, Farley T, Sakkas D. Early cleavage of in-vitrofertilized human embryos to the 2-cell stage: a novel indicator ofembryo quality and viability. Hum Reprod 1997;12:1531–1536.
Sifer C, Handelsman D, Grange E, Porcher R, Poncelet C, Martin-Pont B,Benzacken B, Wolf JP. An auto-controlled prospective comparison oftwo embryos culture media (G III series versus ISM) for IVF and ICSItreatments. J Assist Reprod Genet 2009;26:575–581.
Takenaka M, Horiuchi T, Yanagimachi R. Effects of light on developmentof mammalian zygotes. Proc Natl Acad Sci USA 2007;104:14289–14293.
Terriou P, Giorgetti C, Hans E, Salzmann J, Charles O, Cignetti L, Avon C,Roulier R. Relationship between even early cleavage and day 2 embryoscore and assessment of their predictive value for pregnancy. ReprodBiomed Online 2007;14:294–299.
Tsai YC, Chung MT, Sung YH, Tsai TF, Tsai YT, Lin LY. Clinical value ofearly cleavage embryo. Int J Gynaecol Obstet 2002;76:293–297.
Van Montfoort AP, Dumoulin JC, Kester AD, Evers JL. Early cleavage is avaluable addition to existing embryo selection parameters: a study usingsingle embryo transfers. Hum Reprod 2004;19:2103–2108.
Wale PL, Gardner DK. Time-lapse analysis of mouse embryodevelopment in oxygen gradients. Reprod Biomed Online 2010;21:402–410.
Wong CC, Loewke KE, Bossert NL, Behr B, De Jonge CJ, Baer TM, ReijoPera RA. Non-invasive imaging of human embryos before embryonicgenome activation predicts development to the blastocyst stage. NatBiotechnol 2010;28:1115–1121.
14 Meseguer et al.
by Niels B
irger Ram
sing on August 17, 2011
humrep.oxfordjournals.org
Dow
nloaded from