THE USE OF MOBILE POSITIONING DATA FOR OFFICIAL … 0/The Use of... · survey for domestic tourism...
27
THE USE OF MOBILE POSITIONING DATA FOR OFFICIAL STATISTICS: INDONESIA’S EXPERIENCE
Transcript of THE USE OF MOBILE POSITIONING DATA FOR OFFICIAL … 0/The Use of... · survey for domestic tourism...

THE USE OF MOBILE POSITIONING DATA FOR OFFICIAL STATISTICS: INDONESIA’S EXPERIENCE

2
1The Use of Mobile Positioning Data for Inbound Tourism
STATISTICS INDONESIA
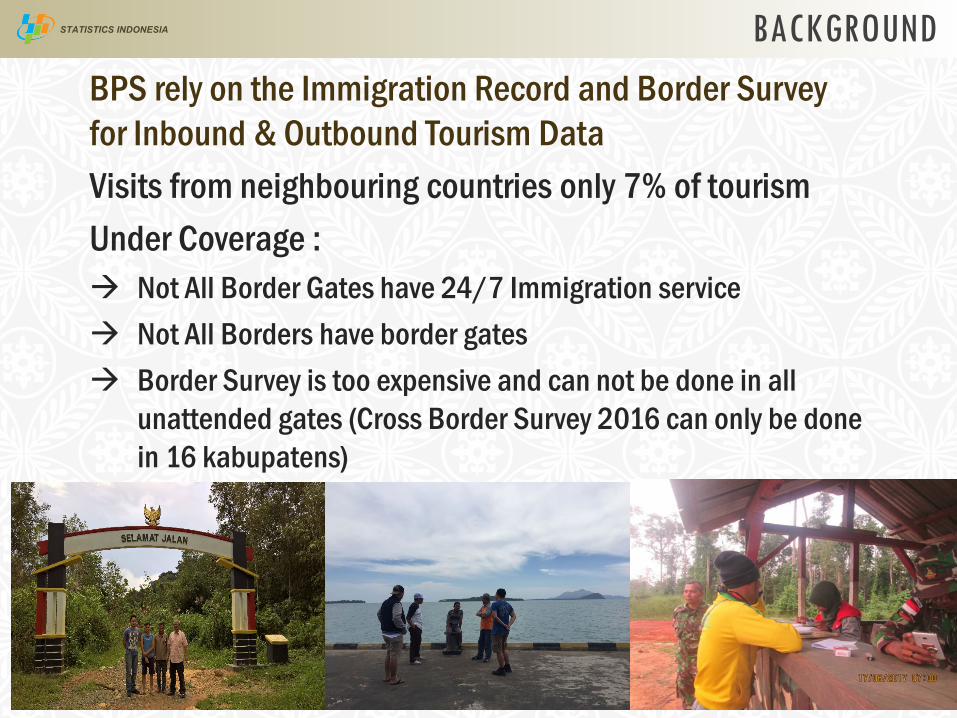
BPS rely on the Immigration Record and Border Survey for Inbound & Outbound Tourism DataVisits from neighbouring countries only 7% of tourismUnder Coverage : Not All Border Gates have 24/7 Immigration service Not All Borders have border gates Border Survey is too expensive and can not be done in all
unattended gates (Cross Border Survey 2016 can only be done in 16 kabupatens)
3
BACKGROUND

STATISTICS INDONESIA
4
ALIGNMENT WITH STRATEGY
Big Data- Can be compiled automatically- Real Time- Less Manual Labour
The integration of these new data with traditional data to produce high-quality information that is more detailed, timely, and relevant for many purposes and users, especially to foster and monitor sustainable development.
To measure the mobility of people, including mobility of tourists. The digital footprint left by the users is very sensitive, but also highly valuable, as it provides new possibilities to measure and monitor the spatio-temporal activities of the population.
In line with UN Recommendation “A World that Count”
Data Revolution For Sustainable Development
MPD as one of the Most Promising ICT Data Sources

STATISTICS INDONESIA
BPS implemented MPD since October 2016
The MPD used is signalling data
Data provided by MNO aggregate table (data quality?, QAF?)
Oct-Des 2016 : MPD was applied to 19 districts, since January 2017 became 25 districts.
Filtering and Calibrations is improved 3 times
Methodology is improved once
5
THE MPD USE IN INBOUND TOURISM
STATISTICS INDONESIA
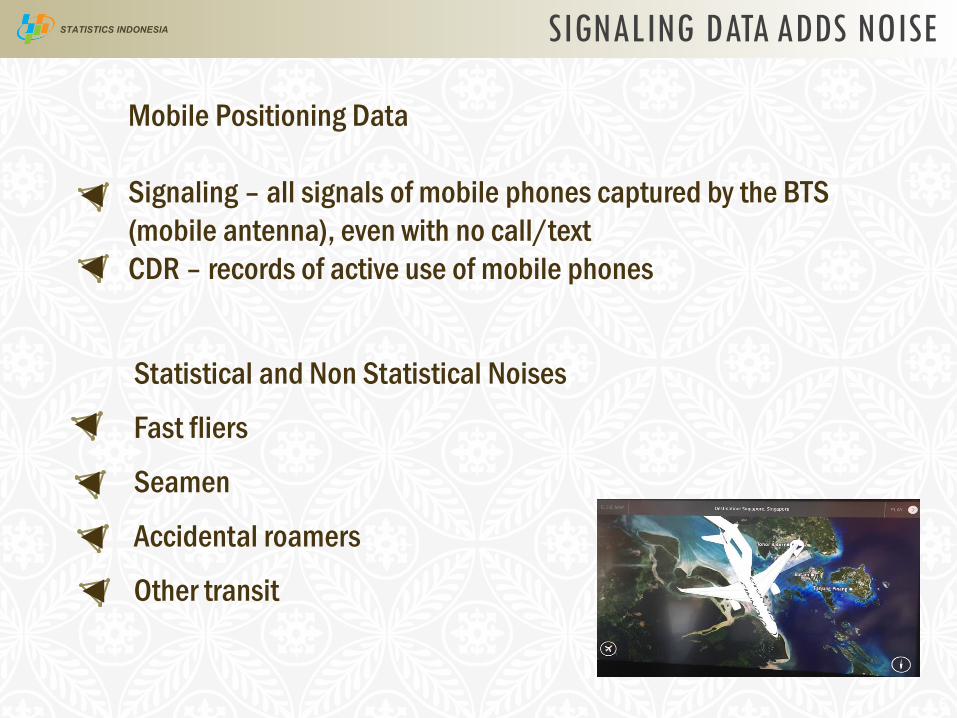
Statistical and Non Statistical Noises
Fast fliers
Seamen
Accidental roamers
Other transit
6
SIGNALING DATA ADDS NOISE
Mobile Positioning Data
Signaling – all signals of mobile phones captured by the BTS (mobile antenna), even with no call/textCDR – records of active use of mobile phones

MPD
IMMIGRATION
Overcoverage in MPD and should be excluded with algorithm

STATISTICS INDONESIA
FILTERING MPD AT BORDER GATES
AT : Additional Tourists based on MPD
MPD : Number of sim card foreigner detected by MNO
Xroam : Ratio sim card per mobile phone
Pnr : Ratio of foreigner Non-roaming (using local sim card or no mobile phone)
MS : Market share
WCI : Inbound Tourism recorded by Immigration
8
𝑨𝑨𝑨𝑨 =𝑴𝑴𝑴𝑴𝑴𝑴𝑿𝑿𝑿𝑿𝑿𝑿𝑿𝑿𝑿𝑿
×𝟏𝟏
𝟏𝟏 − 𝑴𝑴𝑷𝑷𝑿𝑿×
𝟏𝟏𝑴𝑴𝑴𝑴
− 𝑾𝑾𝑾𝑾𝑾𝑾

STATISTICS INDONESIA
Survey was conducted in 25 Kabupaten cover 76 gates, July & October 2017, samples= 36.000
Cross Border Survey to obtain:Mobile phone Usage During Crossing BorderPurpose of Travel
ExpenditureMain Occupation
9
CROSS-BORDER SURVEY

STATISTICS INDONESIA
10
HANDBOOKSMethodology and QAF Handbook
Indonesia currently already has Methodology and QAF handbook for the use MPD in Cross Border Inbound Tourism
Standard Framework
GSBPM
Data Collection
Data Processing
System Design
Data Analysis
Methodology Handbook
Standard Framework
GSBPM
Quality Gates
Input Quality
QAF Dimension
Output Quality
QAF

11
2The Use of Mobile Positioning Data for Domestic Tourism
STATISTICS INDONESIA
12
INTRODUCTION
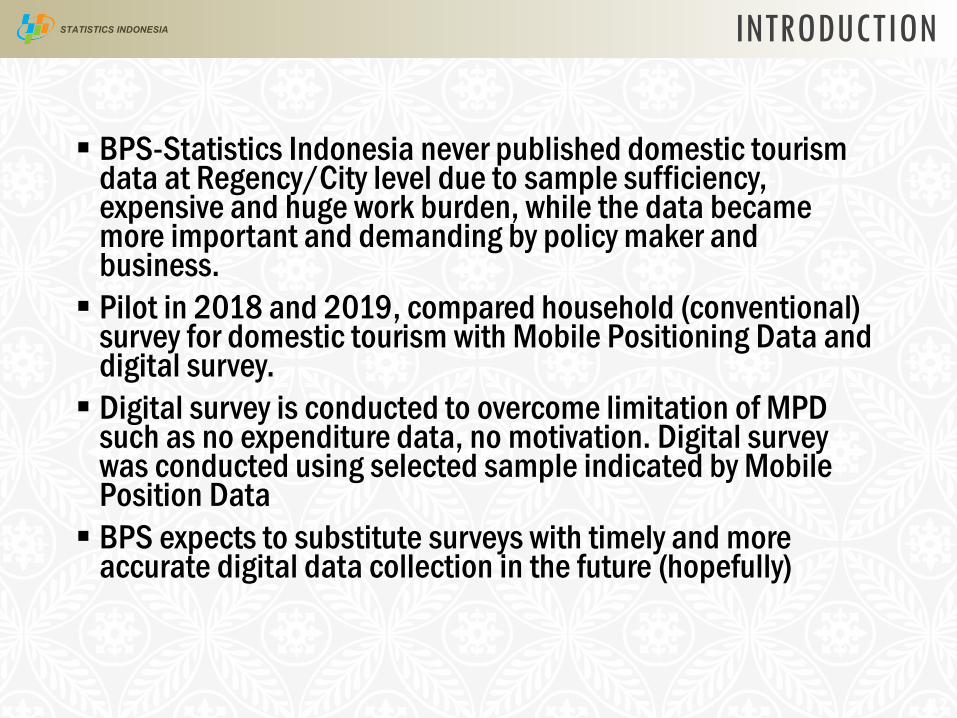
BPS-Statistics Indonesia never published domestic tourism data at Regency/City level due to sample sufficiency, expensive and huge work burden, while the data became more important and demanding by policy maker and business. Pilot in 2018 and 2019, compared household (conventional)
survey for domestic tourism with Mobile Positioning Data and digital survey. Digital survey is conducted to overcome limitation of MPD
such as no expenditure data, no motivation. Digital survey was conducted using selected sample indicated by Mobile Position Data BPS expects to substitute surveys with timely and more
accurate digital data collection in the future (hopefully)

13
DOMESTIC TOURISM WITH MOBILE POSITIONING DATA (MPD) AND DIGITAL
SURVEY (PILOT)Coverage : 190 million subscribers, all IndonesiaTime reference : MonthlyOutput : O-D Matrix of 514 kabupaten/cityExpenditure data : Digital survey 50.000 travellersEstimation : Other MNO subscribers & non cellular user from conventional household survey
14
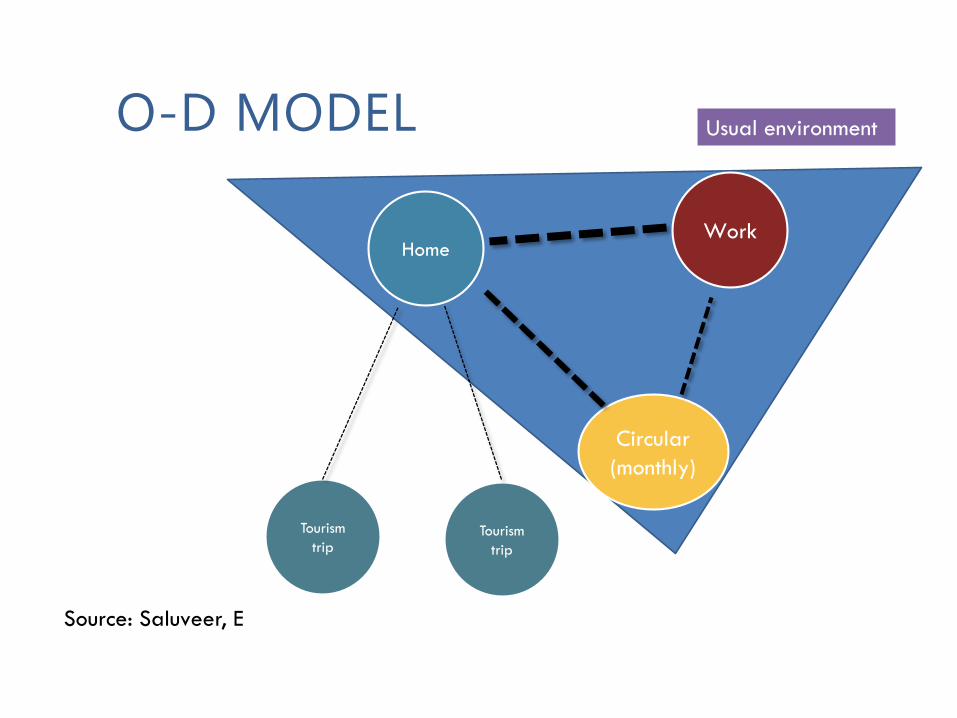
O-D MODEL
HomeWork
Circular (monthly)
Usual environment
Tourism trip
Tourism trip
Source: Saluveer, E 2018

MOBILE PHONE FOOTPRINT FOR BPS VOLUNTEER NO 4
15

MOBILE PHONE FOOTPRINT FOR BPS VOLUNTEER NO 4
16
Using latitude longitude data, we can measure distances of
origin and destination
Using local administrative units (LAU), we can know the movements between regions.
Using date and time, we can measure duration of the movements.

CONTOH PEMETAAN PERJALANAN 1 ORANG SUBSCRIBER
17

STATISTICS INDONESIA
18
HANDBOOKSMethodology Handbook
Indonesia currently already has draft of Methodology Handbookfor the use MPD in Domestic Tourism
Standard Framework
GSBPM
Data Collection
Data Processing
System Design
Data Analysis
Methodology Handbook
19
3The Use of Mobile Positioning Data for Commuting

STATISTICS INDONESIA
20
INTRODUCTION
Previously commuter data is obtained from survey (every two years at several cities) BPS-Statistics Indonesia plan to get commuter data more
frequent, cover all kabupatens, obtain data up to kecamatan level and near real time. Commuters and circular travellers were the by product of
domestic tourism MPD . MPD can gave data at small area even until venue (e.g
GBK, JSC, Nusa Dua).
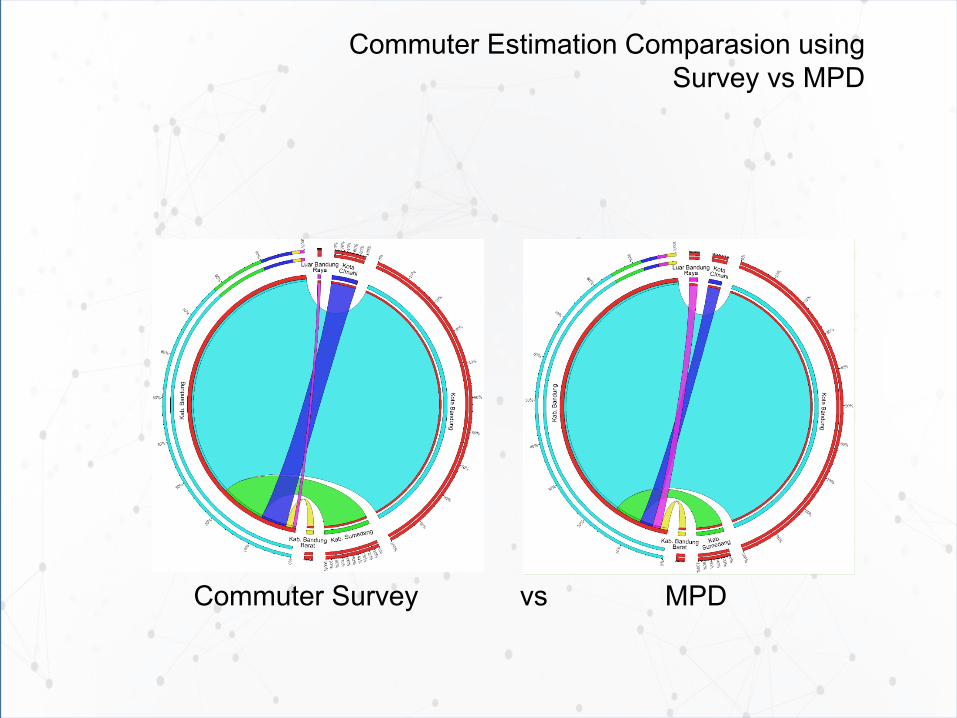
Commuter Estimation Comparasion using Survey vs MPD
Commuter Survey vs MPD
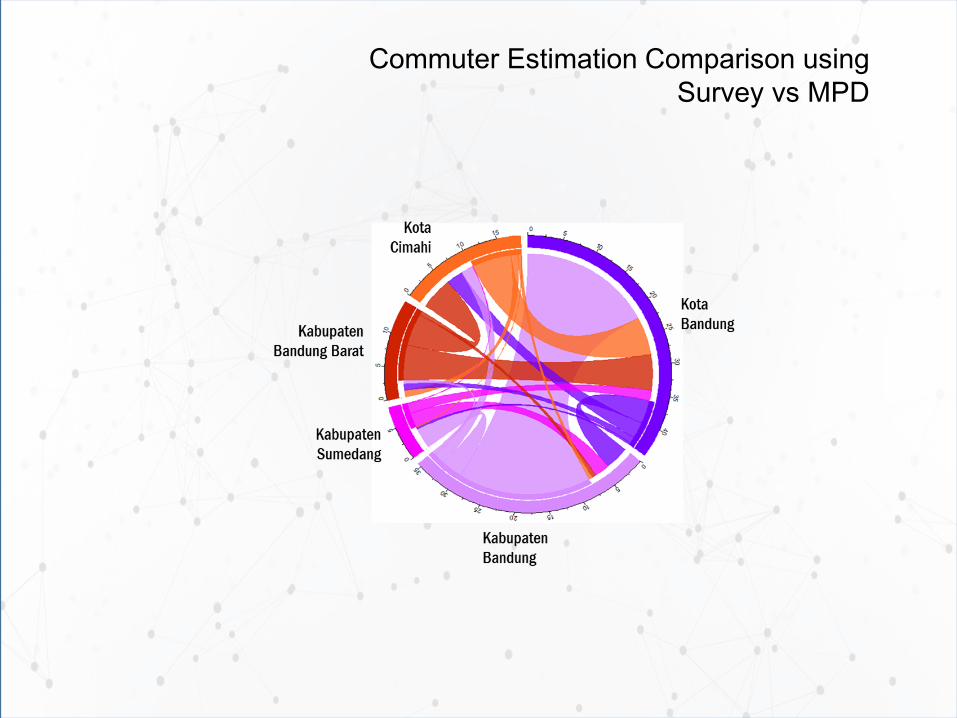
Commuter Estimation Comparison using Survey vs MPD

23
The Use of Mobile Positioning Data for Event Analysis (Asian Games 2018 and
AM WB-IMF)
4

STATISTICS INDONESIA
24
INTRODUCTION
The immigration data only gave inbound to Jakarta, Palembang and DenpasarMPD can gave data until venue (e.g GBK, JSC, Nusa
Dua) The data then used for economic impact analysis (using
Computable General Equilibrium/CGE model) and other analysis (destination analysis)
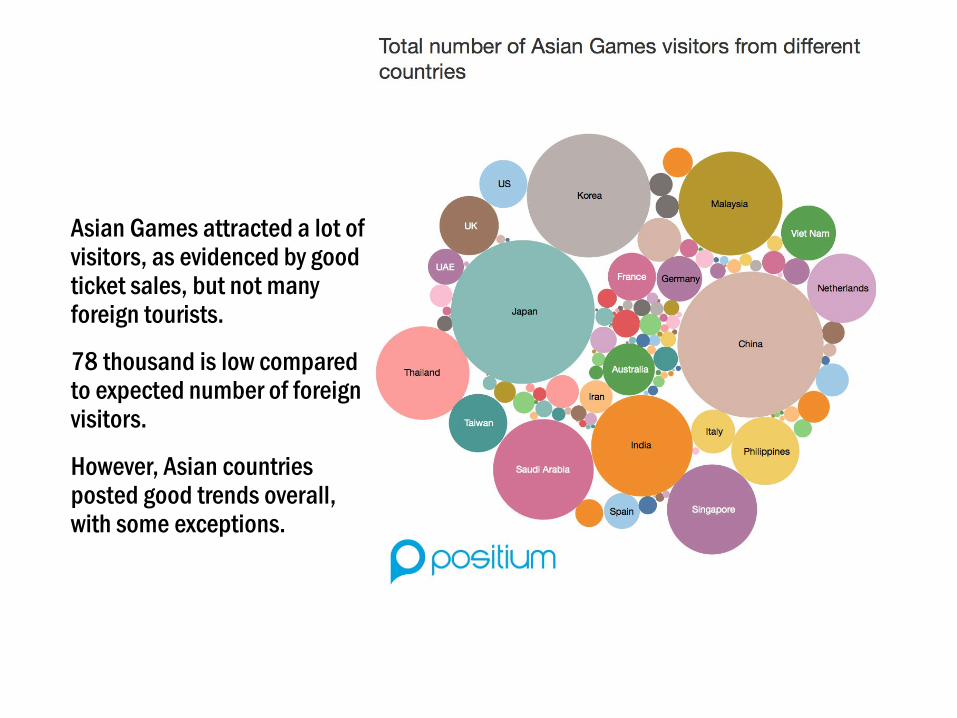
CHALLENGE 1Asian Games attracted a lot of visitors, as evidenced by good ticket sales, but not many foreign tourists.
78 thousand is low compared to expected number of foreign visitors.
However, Asian countries posted good trends overall, with some exceptions.

Other destinationsvisited25 Aug – 8 Sept

THANK YOU