The Use of GPS Radio Occultation Data for Tropical Cyclone ...
49
The Use of GPS Radio Occultation Data for Tropical Cyclone Prediction Bill Kuo and Hui Liu UCAR
Transcript of The Use of GPS Radio Occultation Data for Tropical Cyclone ...

The Use of GPS Radio Occultation Data for Tropical Cyclone Prediction
Bill Kuo and Hui Liu
UCAR

Current capability of the National Hurricane Center
Good track forecast improvements. Errors cut in half in 15 years. Skill of 48h forecast as good as 24-h forecast 10 years ago. No improvement in intensity forecast. Off by 2 categories 5-10% of the time.

2011 Preliminary NHC Verifications
ECMWF and GFS
did well (again).
ECMWF beat
consensus at longer
ranges.
TVCA beat FSSE.
AEMI not as good as
GFSI, even at 5
days.
GFDL and HWRF
middle of the pack.
NGPS, CMC,
UKMET trailed.

NOAA Hurricane Forecast Improvement Project (HFIP)
• 10-Year Goals: – Reduce average track error by 50% for day 1 through 5
– Reduce average intensity error by 50% for day 1 through 5
– Increase the probability of detection (POD) for rapid intensity change to 90% at Day 1 decreasing linearly to 60% at day 5, and decrease the false alarm ratio (FAR) for rapid intensity change to 10% for day 1 increasing linearly to 30% at day 5. The focus on rapid intensity change is the highest forecast challenge indentified by the National Hurricane Center.
– Extend the lead time for hurricane forecasts out to Day 7 (with accuracy of Day 5 forecasts in 2003).
• 5-Year Goals: – Reduce track and intensity forecast errors by 20%

Differences between ECMWF and GFS/EnKF for 200 mb wind, averaged from 7/26 – 9/27, 2010. From Hamill et al (2011). Larger difference over Western Pacific is noted.

GPS RO observations advantages for weather analysis and prediction
• There are considerable uncertainties in global analyses over data void regions (e.g., where there are few or no radiosondes), despite the fact that most global analyses now make use of satellite observations.
• GPS RO missions (such as COSMIC) can be designed to have globally uniform distribution (not limited by oceans, or high topography).
• The accuracy of GPS RO is compatible or better than radiosonde, and can be used to calibrate other observing systems.
• GPS RO observations are of high vertical resolution and high accuracy.
• GPS RO is an active sensor, and provides information that other satellite observing systems could not provide
• GSP RO provide valuable information on the 3D distribution of moisture over the tropics, which is important for typhoon prediction.

Challenges for Tropical Cyclone Prediction
• Some of the current GPS RO missions do not provide much data in the lower troposphere.
• There are still significant uncertainties and challenges for GPS RO to provide accurate measurement in the lowest 2 km of the tropical troposphere.
• How would this impact tropical cyclone prediction?

COSMIC and Metop/GRAS Comparisons
With ECMWF
Tropics
Jul-Dec 2009
Metop
COSMIC
- Tropics, Jul-Dec 2009
- Metop/GRAS processed down to
first data gap
- Metop/GRAS profiles have worse
penetration than COSMIC
- Metop/GRAS BA’s negatively
biased by several percent in lower
troposphere
Metop/COSMIC Bending Angles
Courtesy of Bill Schreiner

Hurrican Ernesto:
Formed: 25 August 2006
Reached Hurricane strength: 27 August
Dissipated: 1 September 2006
15:50 UTC 27 August 2006
Picture taken by MODIS, 250 m
resolution

WRF/DART ensemble assimilation of COSMIC GPSRO soundings
• WRF/DART ensemble Kalman filter data assimilation system
• 36-km, 32-members, 5-day assimilation
• Assimilation of 178 COSMIC GPSRO soundings (with nonlocal obs operator, Sokolovskiey et al) plus satellite cloud-drift winds
• Independent verification by ~100 dropsondes.
178 COSMIC GPSRO
soundings during 21-
26 August 2006
From Liu et al. (2011)
Experiment Design Name Conventional data GPS RO
NODA No No Continuous forecast
ONLY No Yes GPS only
ONLY6km No Yes above 6 km GPS only above 6 km
ONLY2km No Yes above 2 km GPS only above 2 km
CTRL Yes No Convectional
RO Yes Yes Conventional + GPS
RO6km Yes Yes above 6 km Convectional + GPS 6km
RO2km Yes Yes above 2 km Convectional + GPS 2km
> The first four experiments try to identify the impact of GPS data in a clean setting (without the use of any other data) > The second four experiments assess the impact of GPS RO data in a more realistic operational setting. > Conventional data includes radiosondes, surface, aircraft reports, satellite cloud track winds, no radiance.

Experiment Design
> The first four experiments try to identify the impact of GPS data in a clean setting (without the use of any other data) > The second four experiments assess the impact of GPS RO data in a more realistic operational setting. > Conventional data includes radiosondes, surface, aircraft reports, satellite cloud track winds, no radiance.
Name Conventional data GPS RO
NODA No No Continuous forecast
ONLY No Yes GPS only
ONLY6km No Yes above 6 km GPS only above 6 km
ONLY2km No Yes above 2 km GPS only above 2 km
CTRL Yes No Convectional
RO Yes Yes Conventional + GPS
RO6km Yes Yes above 6 km Convectional + GPS 6km
RO2km Yes Yes above 2 km Convectional + GPS 2km

Analysis of 850 hPa Wind and Total Column Cloud Water (06Z August 23, 36 hours before Ernesto’s genesis, GPSonly run)
Convergence and convection in Ernesto’s genesis area.
Where Ernesto formed at 0000 UTC 25 August

Analysis Increments of Q and T (GPSonly run) (850 hPa, August 23, 2 days before Ernesto’s genesis)
Temperature increment is small; Water vapor increment is large.

2-hour Forecast Difference of GPSonly-NODA (700 hPa)
00Z 24 August
Water vapor 06Z 23 August Wind
00Z 25 August Ernesto’s genesis time

Analysis Increments of Q (Only run) (850 hPa, 06Z August 23, 2 days before Ernesto’s genesis)
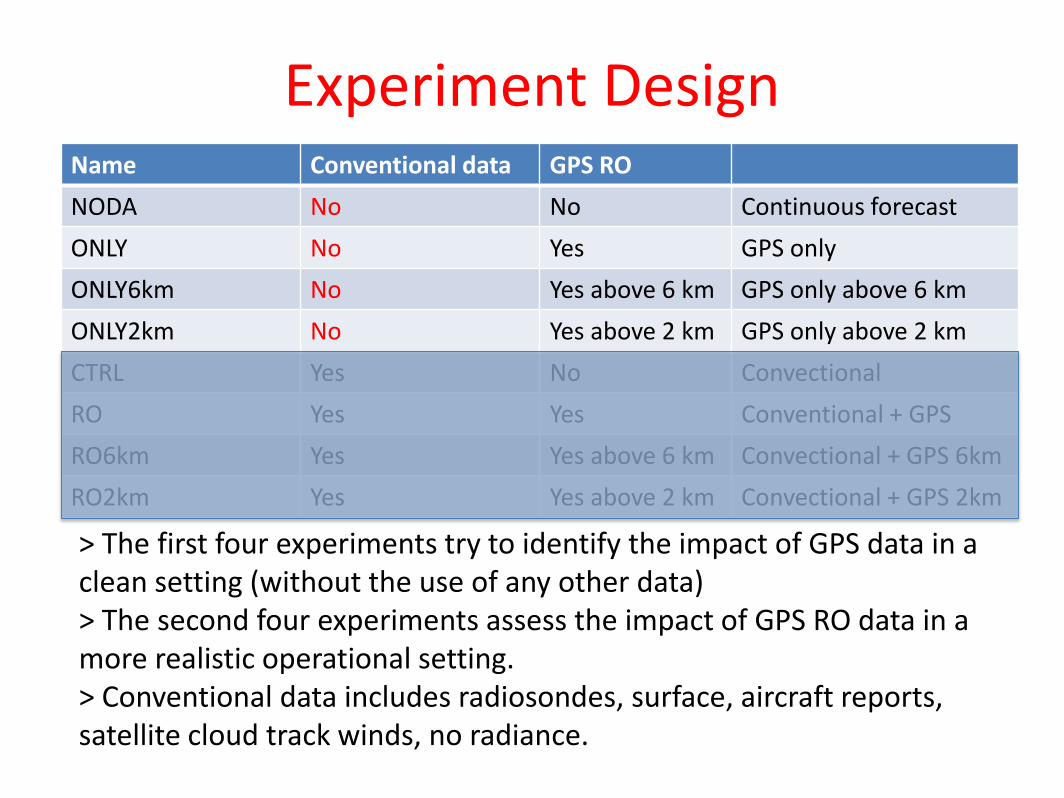
Analysis Increments of Q (Only2km run) (850 hPa, 06Z August 23, 2 days before Ernesto’s genesis)

2-hour Water Vapor Differences (700 hPa)
Only - NODA 06Z 23 August Only6km - NODA
00Z 24 August
00Z 25 August Ernesto’s genesis time

Analysis Increments of Wind (Only run) (August 23, 2 days before Ernesto’s genesis, m/s)
700 hPa
250 hPa
Strong correlation between GPS RO data in the lower troposphere and winds at all levels.
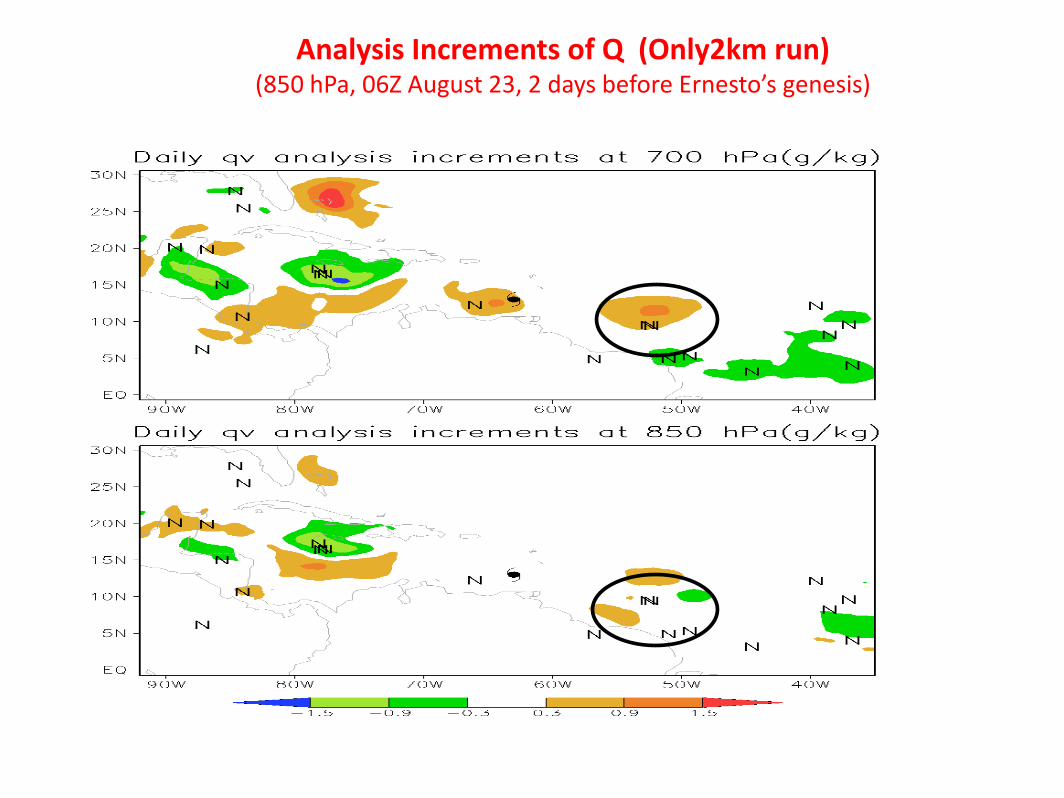
Analysis Increments of Wind (Only2km run) (August 23, 2 days before Ernesto’s genesis, m/s)
700 hPa
250 hPa

Analysis Increments of Wind (Only6km run) (August 23, 2 days before Ernesto’s genesis, m/s)
700 hPa
250 hPa
Strong correlation between GPS in the lower troposphere and winds at all levels.

Assimilation Experiments of RO and Conventional Data
• CTRL (NO GPS) run: Assimilate conventional data.
• RO6km run: Add RO refractivity data only higher than 6km
• RO2km run: Add RO refractivity data only higher than 2km 6km.
• RO run: Add RO refractivity data of all levels.
• Non-local RO refractivity operator is used.
• Radiance is not assimilated in these experiments.

Analyses of SLP and 1000 hPa Vorticity (00UTC 25 August)
CTRL
RO6km
RO

Analyses of SLP and 1000 hPa Vorticity (00UTC 25 August)
CTRL
RO2km
RO

Water vapor Analysis Difference at 700 mb (00UTC 25 August)
RO6km-CTRL
RO2km-
CTRL
RO-CTRL

48h-forecast of Track errors and SLP Intensity (00UTC 25 August)
CTRL
GPS>6k
m
GPS

Summary of Ernesto Study
• Assimilation of GPS RO data adds moisture in the lower troposphere, and produces noticeable wind increments, consistent with the convective environment.
• GPS RO data in the lower troposphere is crucial for creating a favorable environment for hurricane genesis. If we miss the bottom 6km, we will fail to capture hurricane genesis. The bottom 2km is also important.
• Assimilation of GPS RO data produced improved analysis and subsequent forecasts both in terms of track and intensity.

Verification of WRF/DART analysis by about 100 dropsondes during the
Ernesto genesis stage.
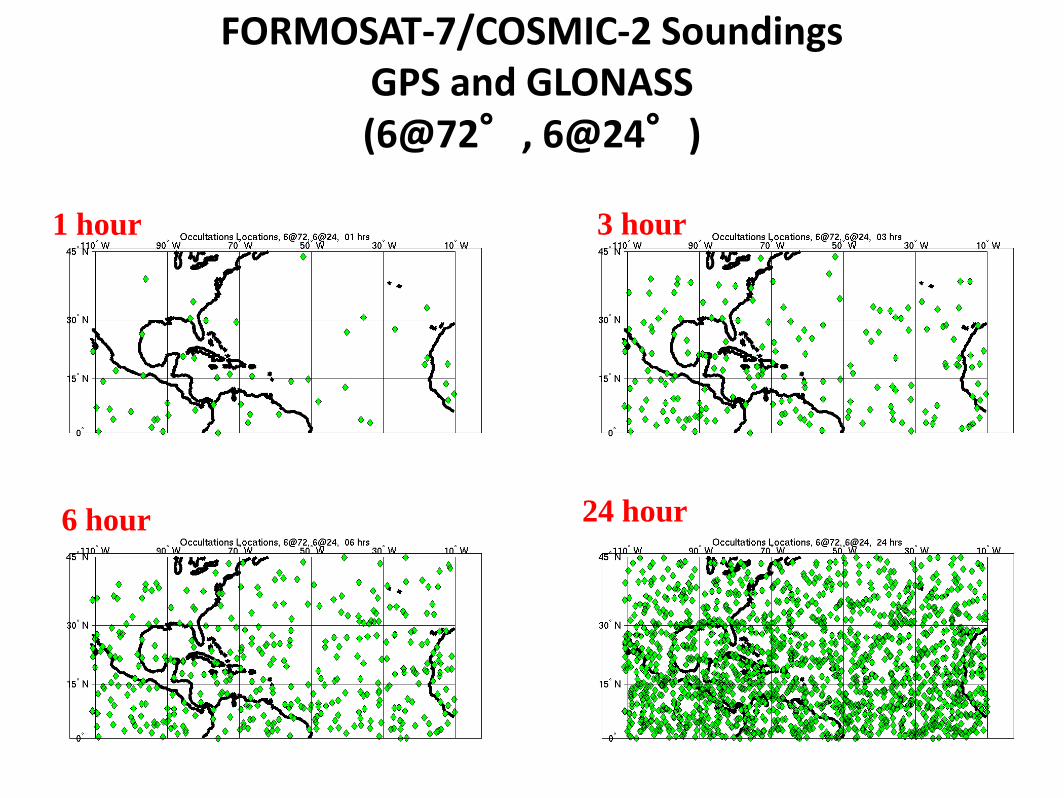
FORMOSAT-7/COSMIC-2 Soundings GPS and GLONASS (6@72°, 6@24°)
1 hour
6 hour
3 hour
24 hour

FORMOSAT-7/COSMIC-2 Soundings GPS and GLONASS
(6@24°)
1 hour
6 hour
3 hour
24 hour

END

Impact of GPS RO data on Typhoon Morakot (2009)
(a) (b)
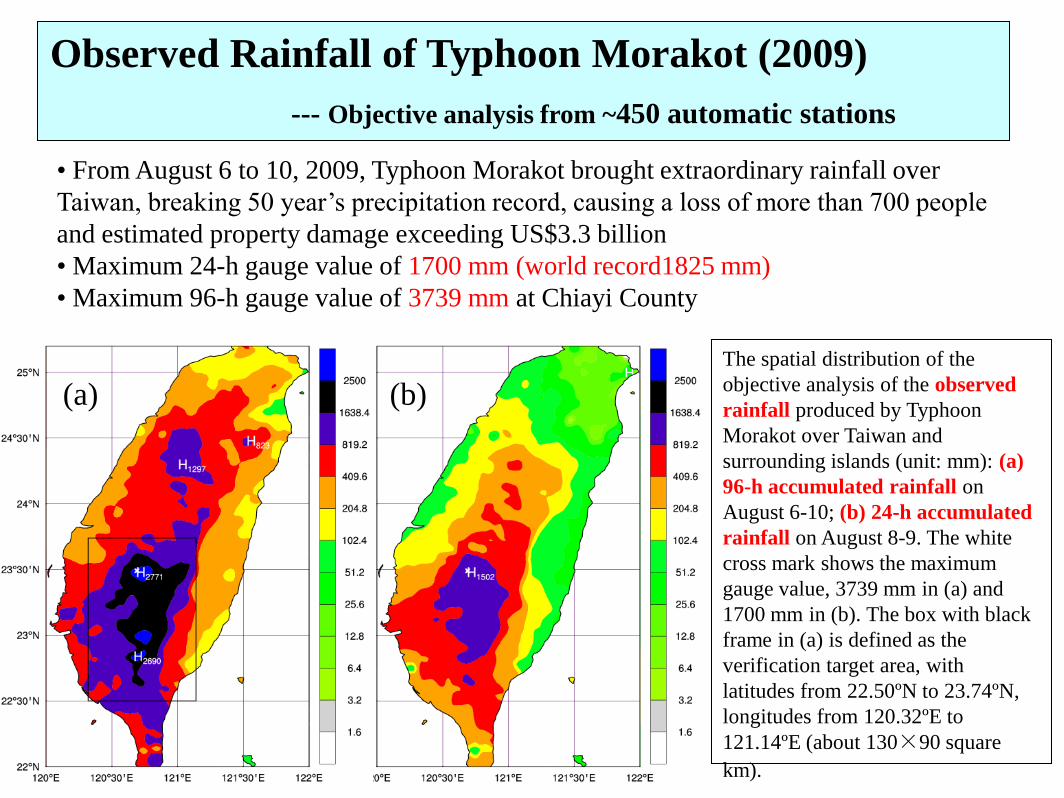
The spatial distribution of the
objective analysis of the observed
rainfall produced by Typhoon
Morakot over Taiwan and
surrounding islands (unit: mm): (a)
96-h accumulated rainfall on
August 6-10; (b) 24-h accumulated
rainfall on August 8-9. The white
cross mark shows the maximum
gauge value, 3739 mm in (a) and
1700 mm in (b). The box with black
frame in (a) is defined as the
verification target area, with
latitudes from 22.50ºN to 23.74ºN,
longitudes from 120.32ºE to
121.14ºE (about 130×90 square
km).
Observed Rainfall of Typhoon Morakot (2009)
--- Objective analysis from ~450 automatic stations
• From August 6 to 10, 2009, Typhoon Morakot brought extraordinary rainfall over
Taiwan, breaking 50 year’s precipitation record, causing a loss of more than 700 people
and estimated property damage exceeding US$3.3 billion
• Maximum 24-h gauge value of 1700 mm (world record1825 mm)
• Maximum 96-h gauge value of 3739 mm at Chiayi County
WRF/DART Analyses and Forecasts for Morakot (2009)
• Control (with GPS RO): CWB operational observations including TC BOGUS data, 6-hourly analysis cycle.
• NOGPS: remove the GPS RO data from the control run.
• Assimilations started 12UTC Aug. 3, 2009. 45km grid only for both assimilation and forecasts.
• CWB Typhoon WRF (TWRF) is also full cycled for the same period.
• Cost of the 16 ensemble forecasts is equivalent to one nested (45/15/3km) deterministic forecast.

Forecast initialized at 12 UTC 5 August No GPS With GPS

Assimilation experiments for Morakot
• Assimilation from 00Z August 3 to 18Z August 8, 2009 with 2-hourly cycling. • 36km analysis grid with 35 levels • 48h Forecast with nest grids 36km/12km/4km starting at August 7 00Z. • CWB observations are used • CTL run: Assimilate CWB conventional observations • GPS run: CTL run + COSMIC data.

SLP intensity analyses (August 3 06Z - 8 18Z)
NOGP
S
GPS
Ensemble
mean Observed

24h Rain forecast (August 7 - 8 00Z)
NOGP
S
GPS
Ensemble
mean Observed

48h Rain forecast (August 8 - 9 00Z)
NOGP
S
GPS
Ensemble
mean Observed

Rain Probability Forecast (August 7-8 00Z)
Ensemble
mean Observed

Rain Probability Forecast (August 8 - 9 00Z)
Ensemble
mean Observed

48-h of track forecast errors for Typhoon
Jangmi (2008) with and without COSMIC.
Typhoon Prediction During T-PARC
Assimilation of GPSRO
data from COSMIC
improved the quality of
regional analysis and
typhoon track errors.
For four storms in T-
PARC 2008, the
average improvement is
13%.
From H. Liu and Jeff
Anderson
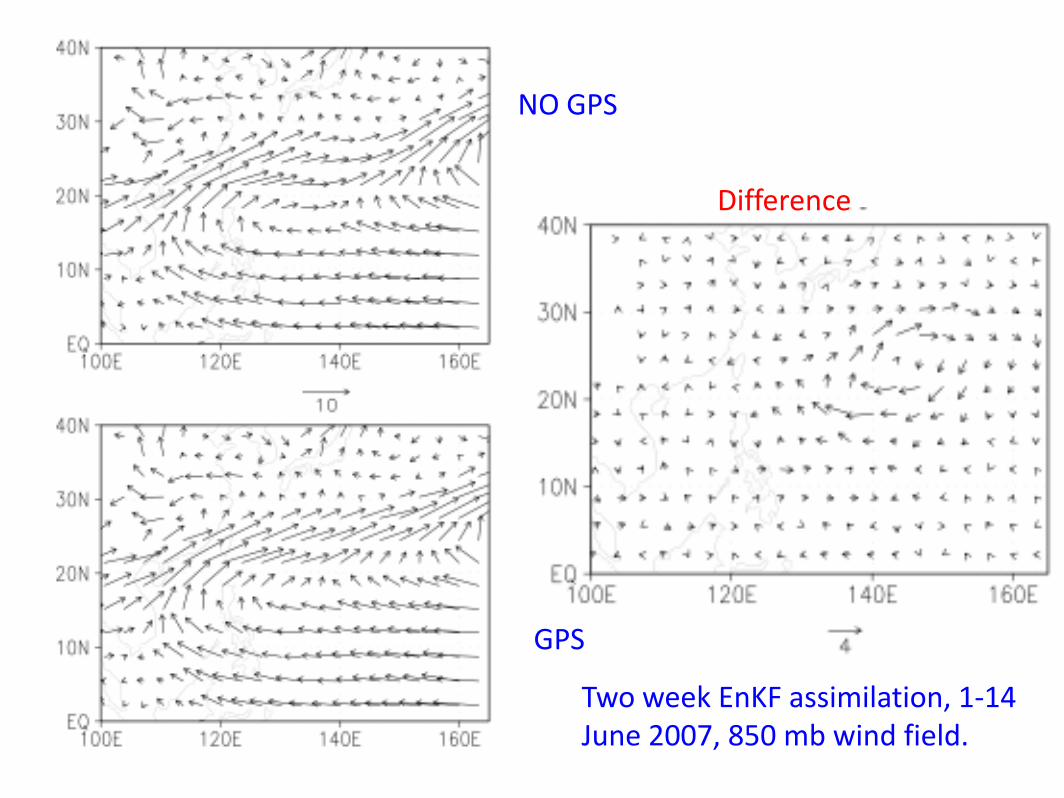
NO GPS
GPS
Difference
Two week EnKF assimilation, 1-14 June 2007, 850 mb wind field.

COSMIC-II Soundings Geographic Coverage (6@72°, 6@24°)
1 hour
6 hour
3 hour
24 hour

Summary
• GPSRO observations are not affected by clouds and precipitation • GPSRO observations provide three-dimensional water vapor
information over the tropics, which are crucial for: – Tropical cyclone genesis – Tropical cyclone intensity forecast – Tropical cyclone track forecast
• Current FORMOSAT-3/COSMIC sounding distribution is NOT optimal for tropical prediction. The data density is the lowest over the tropics (0.4 sounding over 500 km x 500 km in one day).
• FORMOSAT-7/COSMIC-2, with 10 times more soundings will significantly improve the skills of tropical cyclone prediction: – Improve track, intensity and rainfall forecast for typhoons – Directly contribute to all the goals of NOAA’s Hurricane Forecast
Improvement Project (HFIP)

Back-up Slides
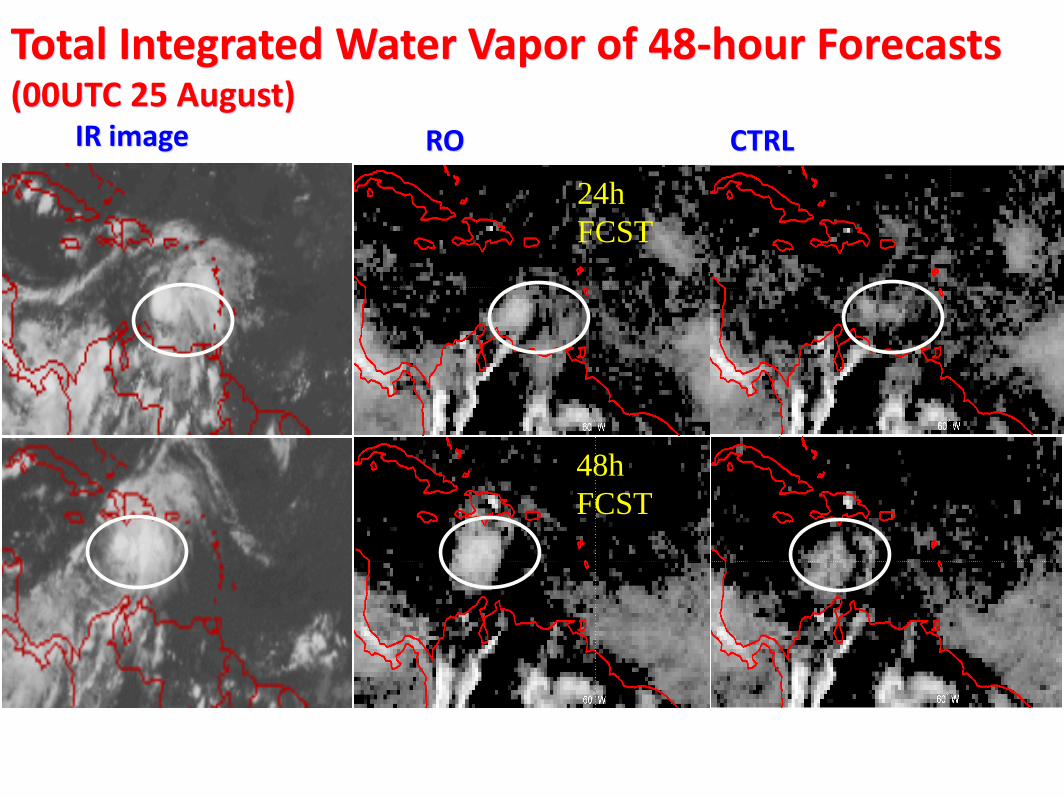
Total Integrated Water Vapor of 48-hour Forecasts (00UTC 25 August)
RO CTRL IR image
24h
FCST
48h
FCST
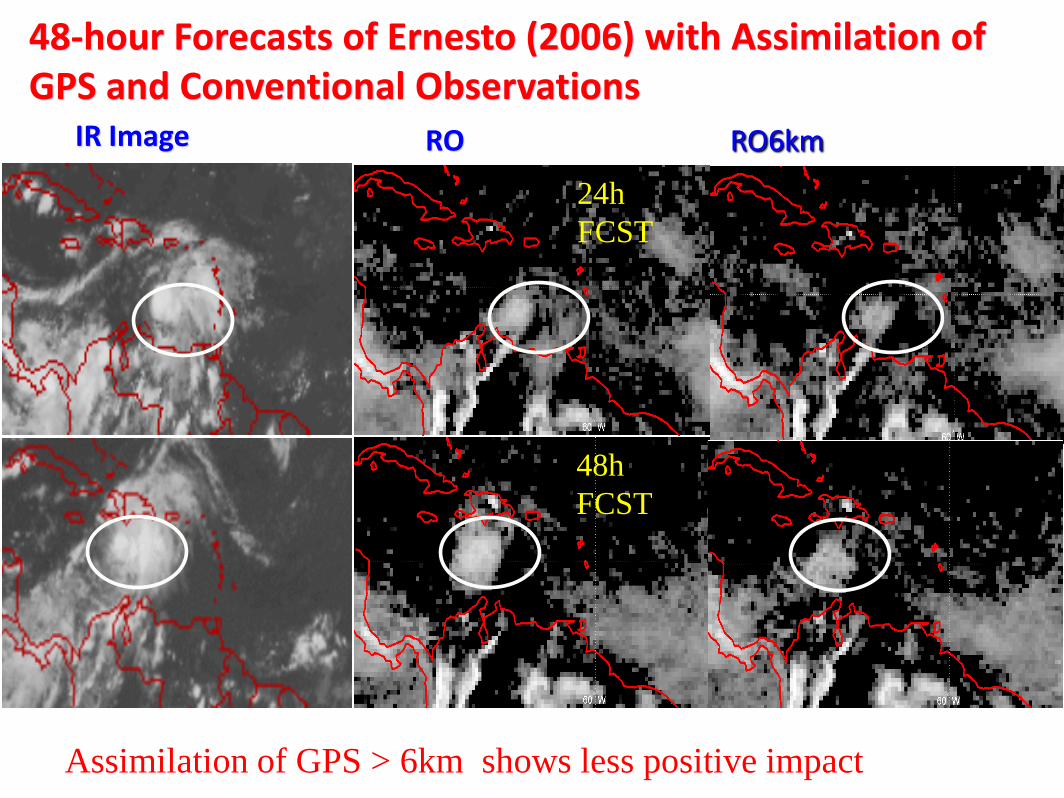
48-hour Forecasts of Ernesto (2006) with Assimilation of GPS and Conventional Observations
RO RO6km IR Image
24h
FCST
48h
FCST
Assimilation of GPS > 6km shows less positive impact

Summary of Morakot Study
• Assimilation of the GPS data: – Improve analysis and prediction of typhoon
track
– Improve rainfall prediction
• Performance of ensemble-based EnKF (WRF/DART) is superior to WRF-3DVAR system
• Positive impact of GPSRO is also seen in WRF-3DVAR system