THE USE OF GAMMA RAY DATA TO DEFINE THE … · Matolin of Charles University in Prague, ... Gamma...
49
IAEA-TECDOC-566 THE USE OF GAMMA RAY DATA TO DEFINE THE NATURAL RADIATION ENVIRONMENT A TECHNICAL DOCUMENT ISSUED BY THE INTERNATIONAL ATOMIC ENERGY AGENCY, VIENNA, 1990
Transcript of THE USE OF GAMMA RAY DATA TO DEFINE THE … · Matolin of Charles University in Prague, ... Gamma...

IAEA-TECDOC-566
THE USE OF GAMMA RAY DATATO DEFINE
THE NATURAL RADIATION ENVIRONMENT
A TECHNICAL DOCUMENT ISSUED BY THEINTERNATIONAL ATOMIC ENERGY AGENCY, VIENNA, 1990

The SAEA does not normally maintain stocks of reports in this series.However, microfiche copies of these reports can be obtained from
IN IS ClearinghouseInternationa! Atomic Energy AgencyWagramerstrasse 5P.O. Box 100A-1400 Vienna, Austria
Orders should be accompanied by prepayment of Austrian Schillings 100,in the form of a cheque or in the form of IAEA microfiche service couponswhich may be ordered separately from the INI S Clearinghouse.

THE USE OF GAMMA RAY DATA TO DEFINE THE NATURAL RADIATION ENVIRONMENTIAEA, VIENNA, 1990IAEA-TECDOC-566ISSN 1011-4289
Printed by the IAEA in AustriaSeptember 1990

FOREWORD
The accident at the nuclear reactor at Chernobyl in theUSSR in April 1986, and the confusion in the public mind overthe nature and extent of the resulting fallout pointed up theneed for more widespread awareness of the natural radiationbackground in which people live. An examination of thepossibilities for acquiring these data led to the recognitionof the work of the uranium exploration community over theyears as an important source of, as yet. unused, naturalradiation data. These data have been collected for the purposeof locating uranium deposits in many countries, frequentlythrough the use of public funds or development funds. The mostextensive effort was that carried out in the U.S.A. where thewhole of country was flown with airborne gamma rayspectrometer surveys during the National Uranium ResourcesEvaluation (NURE) project. These data have been compiled andissued as background radiation maps that have been of greatvalue in locating areas of potential radon hazard, in additionto their use in geological mapping and mineral exploration fora number of metals. They will be of fundamental importance inthe International Geological Correlation Programme(IGCP)/UNESCO project on International Geochemical Mappingwhich has the ultimate aim of producing Geochemical Maps ofthe World. The IAEA is playing a coordinating role in theproduction of the Radioelement Geochemical Maps. This manualis designed to encourage and assist in the use of preexistinggamma ray survey data to produce maps of the natural radiationenvironment.
The manual is the work of three consultants; Dr. J. S.Duval of the United States Geological Survey, Dr. AndersLinden of the Swedish Geological Company, and Dr. MilanMatolin of Charles University in Prague, Czechoslovakia. Thesethree combine a great many years of experierce in naturalradiation measurement and in the development of the methods totheir high level of sophistication. The Agency wishes to thankmost sincerely these three for contributing their time andexpertise to the task. The Agency staff member responsible forthe project was Arthur Y. Smith of the Division of NuclearFuel Cycle.

EDITORIAL NOTE
In preparing this material for the press, staff of the International Atomic Energy Agency havemounted and paginated the original manuscripts and given some attention to presentation.
The views expressed do not necessarily reflect those of the governments of the Member Statesor organizations under whose auspices the manuscripts were produced.
The use in this book of particular designations of countries or territories does not imply anyjudgement by the publisher, the IAEA, as to the legal status of such countries or territories, of theirauthorities and institutions or of the delimitation of their boundaries.
The mention of specific companies or of their products or brand names does not imply anyendorsement or recommendation on the part of the IAEA.

CONTENTS
1. INTRODUCTION ......................................................................................... 7
2. THE NATURAL RADIATION ENVIRONMENT ................................................. 8
2.1. Sources of natural radiation ....................................................................... 82.2. Radiation units and conversion factors .......................................................... 102.3. Occurrence of potassium, uranium, thorium and other radiation sources
in the environment .................................................................................. 112.3.1. K, U and Th in rock and soil ........................................................... 112.3.2. K, U and Th and their daughter products in the atmosphere,
hydrosphere and biosphere .............................................................. 142.3.3. Cosmic radiation ........................................................................... 152.3.4. Natural nuclei concentrated or relocated by man .. ................................ 152.3.5. Artificial nuclei in nature ................................................................ 15
2.4. Measuring the natural radiation environment .................................................. 162.5. Equivalent dose to man from natural radiation ................................................ 17
3. GAMMA RAY SURVEYS .............................................................................. 18
3.1. Instrumentation ...................................................................................... 183.2. Calibration and reporting units ................................................................... 193.3. Geological gamma ray surveys ................................................................... 203.4. Suitable data .......................................................................................... 20
4. STANDARDIZATION TECHNIQUES ............................................................... 22
4.1. General concept of standardization .............................................................. 224.1.1. General considerations .................................................................... 224.1.2. Conversion of radioélément concentrations to air dose rate ............. ........ 23
4.2. Levelling of data within a survey area .......................................................... 244.2.1. Factors causing level differences ....................................................... 244.2.2. A mathematical approach to levelling ................................................. 264.2.3. Levelling of data using image techniques ............................................ 28
4.3. Levelling of data between survey areas ......................................................... 324.4. Procedure for standardization of spectrometer surveys ...................................... 32
4.4.1. Gamma ray spectrometer surveys with calibrated equipment ..................... 324.4.2. Gamma ray spectrometer surveys with uncalibrated equipment .................. 32
4.5. Procedures for standardizing total count surveys ............................................. 344.5.1. General problems related to the use of total count surveys ....................... 344.5.2. Total count surveys with calibrated equipment ...................................... 374.5.3. Total count surveys with uncalibrated equipment ................................... 38

5. DATA PRESENTATION ................................................................................ 38
5.1. Graphical form ....................................................................................... 385.2. Map compilation ..................................................................................... 39
5.2.1. Manual compilation ....................................................................... 395.2.2. Digital compilation ........................................................................ 41
6. INTERPRETATION AND USE OF THE MAPS .................................................. 42
REFERENCES ................................................................................................... 45

l. INTRODUCTION
The natural radiation environment is the major source ofradiation exposure to man and consists of both internal andexternal sources. The most significant internal sources arethe radioactive elements 40K and 222Rn which are taken into thebody. The external sources are cosmic rays and naturallyoccurring radioactive isotopes of the 40K, 238U, and 232Th decayseries, some or all of which can be found in the ground, inconstruction materials, and in the air. Both internal andexternal radiation levels vary as a function of the geologicalmaterials, type of dwelling, and elevation above sea level.This report has been prepared to provide a guide for the useof existing gamma ray survey data to define the naturalradiation environment, but will only be concerned with thegamma ray exposure resulting from radiation originating ingeological materials. Chapter 2, below, discusses the naturalradiation environment in greater detail.
Because natural radiation levels represent the minimumexposure attainable, they are used for comparison when judgingthe significance of exposure from man-made sources such asmedical x-rays, nuclear weapons fall-out, and nuclear powerplants. The entire issue of man-made radioactivity becomesmore important as the number of nuclear power plants, researchreactors, medical and industrial isotope sources, etc.increases.
The study of the natural radiation environment has beenactively carried out since the discovery of radioactivity. Inrecent years a series of symposia [1], [2], [3], [4],dedicated to the subject have produced a significant volume ofinformation. However, currently available data providecoverage for a small fraction of the earth's land surface andmaps covering much larger areas are needed. Examples of suchmaps for parts of Canada were presented by A.G. Darnley et al.[5]. The type of data needed to produce similar maps areavailable as a result of airborne, carborne, and ground gammaray surveys in many parts of the world. Although most ofthese data were acquired for uranium and other mineralexploration and geological mapping purposes, they can be usedto provide background radioactivity information. The primarycriteria for the use of these data is that they must be ofgood quality and self consistent. Chapter 3 discusses thecharacteristics of gamma ray surveys.
Because the relationship between the quantities ofnatural gamma ray sources and air dose rate is known, existingdata can be standardized in terms of the gamma ray exposureresulting from the radioactivity of geological materials. Theprocess of standardization involves the use of conversionfactors and, where necessary, back calibration. Chapter 4discusses standardization procedures.
Standardized survey data can be compiled to produceregional maps of gamma ray air dose rates as well as singleradioélément maps. Compilation procedures may use eithermanual or computer techniques. Chapter 5 discusses thesecompilation techniques.
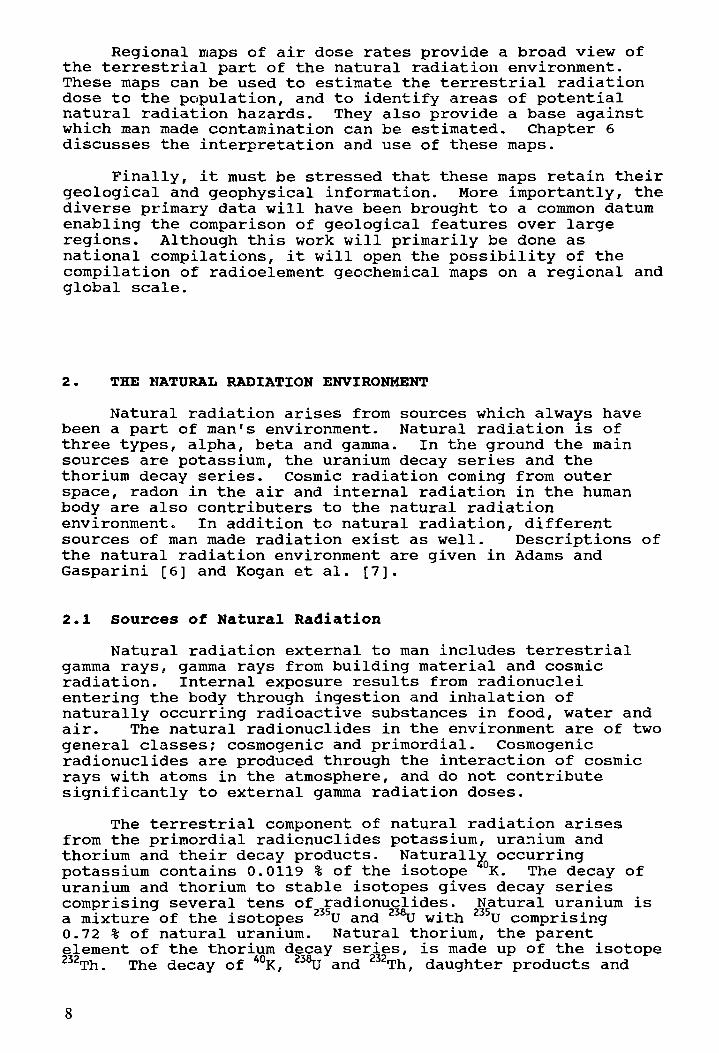
Regional maps of air dose rates provide a broad view ofthe terrestrial part of the natural radiation environment.These maps can be used to estimate the terrestrial radiationdose to the population, and to identify areas of potentialnatural radiation hazards. They also provide a base againstwhich man made contamination can be estimated. Chapter 6discusses the interpretation and use of these maps.
Finally, it must be stressed that these maps retain theirgeological and geophysical information. More importantly, thediverse primary data will have been brought to a common datumenabling the comparison of geological features over largeregions. Although this work will primarily be done asnational compilations, it will open the possibility of thecompilation of radioélément geochemical maps on a regional andglobal scale.
2. THE NATURAL RADIATION ENVIRONMENT
Natural radiation arises from sources which always havebeen a part of man's environment. Natural radiation is ofthree types, alpha, beta and gamma. In the ground the mainsources are potassium, the uranium decay series and thethorium decay series. Cosmic radiation coming from outerspace, radon in the air and internal radiation in the humanbody are also contributers to the natural radiationenvironment. In addition to natural radiation, differentsources of man made radiation exist as well. Descriptions ofthe natural radiation environment are given in Adams andGasparini [6] and Kogan et al. [7],
2.1 Sources of Natural RadiationNatural radiation external to man includes terrestrial
gamma rays, gamma rays from building material and cosmicradiation. Internal exposure results from radionucleientering the body through ingestion and inhalation ofnaturally occurring radioactive substances in food, water andair. The natural radionuclides in the environment are of twogeneral classes; cosmogenic and primordial. Cosmogenicradionuclides are produced through the interaction of cosmicrays with atoms in the atmosphere, and do not contributesignificantly to external gamma radiation doses.
The terrestrial component of natural radiation arisesfrom the primordial radionuclides potassium, uranium andthorium and their decay products. Naturally occurringpotassium contains 0.0119 % of the isotope K. The decay ofuranium and thorium to stable isotopes gives decay seriescomprising several tens of radionuclides. Natural uranium isa mixture of the isotopes 235U and 238U with 235U comprising0.72 % of natural uranium. Natural thorium, the parentelement of the thorium decay series, is made up of the isotope232Th. The decay of 40K, 238U and 232Th, daughter products and

half-lives are shown in figures 2.1 - 2.3 [11. There are two222 ??0gaseous isotopes, Rn and Rn, in the uranium and thoriumdecay series. These radionuclides and their decay productscontribute significantly to internal alpha exposure.
Figure 2.1: The decay of potassium-40.
""IT
Figure 2.2: The uranium-238 series. Radionuclides produced inquantities of less than 1% are not shown.
Figure 2.3: The thorium-232 series. Radionuclides produced inquantities of less than 1% are not shown.

The estimate of annual effective dose equivalents fromnatural radiation sources based on global averages is shown inTable 2.1 [46]. This indicates that radon in indoor air isthe largest contributor to the annual effective doseequivalent. Variations in the geological environment willchange the relative proportions of these factors. In somecountries the inhalation component has been reported to be ashigh as 80 % of the annual effective dose equivalent [9].
Table 2.1: The global average annual effective disequivalentsfrom natural radiation sources. Relativecontributrions in % are indicated in brackets.(After [46]).
Source ofIrradiation
Cosmic raysCosmogenic radionuclidesPrimordial radionuclides
*°K238U - series232Th - seriesTotal
ExternalmSv
0.410 (17)
0.150 (6)0.100 (4)0.160 (7)
0.820 (34)
InternalmSv
0.015 (1)
0.180 (7)0.0061.239 (51)0.176 (7)
1.616 (66)
TotalmSv
0.410 (17)0.015 (1)
0.330 (13)0.0061.339 (55)0.336 (14)
2.436 (100)
Indoor gamma ray radiation levels depend on the type ofbuilding materials used and on their composition. The ratioof indoor to outdoor gamma radiation has been reported mostlyas 1 - 2 [46] .
2.2 Radiation Units and Con ersion FactorsThe SI unit for activity is the becquerel (Bq) . Activity
of one Bq corresponds to a decay rate of one atom per second.The unit formerly used was the curie (Ci) , which correspondsto 3.7x10of 226Ra.
10 Bq. 1 Ci has approximately the activity of 1 gram
The definition of exposure to ionizing radiation is basedon the amount of ionization in air. The original unit was theroentgen (R) . The relationship of R to basic SI units is:l R = 2.58xlO~4 C kg'1. The exposure rate is the exposure perunit time. In geological work the unit is still common.
The absorbed dose in any substance is expressed in termsof energy transfer. The SI unit for absorbed dose is th« gray(Gy) . 1 Gy is equal to 1 joule (J) kg". Previously absorbed
10

dose was expressed in units of rads. The absorbed dose rate(Gy s"1) is the absorbed dose per unit time. The dose rate ofgamma radiation absorbed in air can be related to exposurerate and is used to specify the terrestrial source of gammaradiation.
A quantity that takes into account the characteristics ofthe particular type of radiation and its potential for causingdamage to body cells and tissues is the dose equivalent. TheSI unit of dose equivalent is the sievert (Sv) . Theconversion from Gy to Sv is possible by multiplying theabsorbed dose by the relative biological effectiveness (RBE)of the radiation concerned. For natural gamma rays the RBE,also known as the quality factor, has the value of 1.
The term "effective dose equivalent" expresses theeffects of man whole body irradiation. The estimatedconversion factor to convert dose equivalent due to isotropicgamma radiation to effective dose equivalent is 0.7 [46].
Exposure rate can be converted to absorbed dose rate inair (l /iR h"1 = 2.4139 pGy s"1) . Dose is calculated as theproduct of absorbed dose rate in air and time of exposure.Due to the quality factor for gamma radiation being equal to1, the dose and dose equivalent are numerically identical.Effective dose equivalent is calculated by multiplying thedose equivalent by the conversion factor 0.7.
Table 2.2: SI units and older units for radiation.Quantity SI unit Older unit Conversion factorActivity becquerel curie (Ci)
(Bq)Exposure coulomb/kg roentgen (R)
(C kg'1)
AbsorbeddoseAbsorbeddose rate
gray (Gy) rad
gray/sec.(Gy s"1)
Dose sievertequivalent (Sv)
rem
Ci1 Bq = 27 x 10'121 Ci = 37 x 109 Bq1 /iCi = 37 kBq1 C kg'1 = 3876 R
l R = 2.58 x 10"4 C kg"1l R = 8.69 x 10"3 Gy(standard air)1 Gy = 100 rad1 rad = 0.01 Gy1 /xR h"1 = 2.4139 pGy s"1
1 Sv = 100 rem1 rem = 0.01 Sv
2.3 Occurrence of Potassium, Uranium, Thorium and otherRadiation Sources in the Environment
2.3.1: K, U and Th in rock and soilThe content of potassium in rocks can have a range of 0
to 10 % K but is usually 1 to 5 % K with an average value ofabout 2 % K. The content of uranium and thorium in rocks
11

varies from near zero to several hundreds of parts per million(ppm) [10]» The content of K, U and Th depends on rock typeand the geological environment. Table 2.3 lists the contentsthat may be expected in some ordinary rock types. For aspecific rock or a specific locality the content of K, U andTh may differ significantly from these average values [7],[10], [11].
Table 2.3! Typical concentration of potassium, uranium andthorium in some common rocks and correspondingabsorbed dose rate in air and exposure rate(calculated at 1 in above the ground) .
Rock K U Th Absorbed dose% ppm ppm rate in air
pGy s"1
Granite 3-4 3-5 10-30Gabbro < 1 < 1 2-3Limestone < 1 1-2 1-2Sandstone 1-2 3-5 10-15Average 2.5 2.7 9.6
25-504-74-715-2520.0
ExposurerateHR h"1
10-202-32-3
5-108.3
In most areas of the world the bedrock is covered withsoil. Therefore the radiation from the soil is the mostimportant contributor to the terrestrial radiation. Thecontent of radioactive minerals in the soil depends upon thecontent in the original parent rocks. Sometimes theradioactive minerals are concentrated and sometimes spreadmore homogeneously in the soils. Because many uranium andthorium minerals are small and fragile it is common to findthem concentrated in the fine grained fraction, such as clay.In soils the content of K, U and Th is of the same order as inrocks but usually somewhat lower [12]. In most cases theuranium decay series is not in radioactive equilibrium insoils whereas thorium decay series often is. Uraniumdisequilibrium occurs when some of the radionuclides in thedecay series are moved by chemical or physical processes.Table 2.4 lists the average concentrations of K, 238U and 232Thin soils with corresponding absorbed dose rate in air andexposure rate [7], [8].
12

Table 2.4: Average concentration of K, U and Th in soil withcorresponding absorbed dose rate and exposure rate(calculated at l m above the Ground).
Soil
*D*2)
K%
1.21.4
eUppm
2.01.6
Thppm
6.36.0
Absorbed doserate in airpGy s"1
1212
ExposureratepR h"1
55
*1) adapted from UNSCEAR [8]*2) adapted from Kogan [7]
A model for the transport of uranium in rock and soil bymechanical and chemical processes in glaciated terrain isshown in Table 2.5 [13]. The uranium content in the examplerefers to an uranium rich granite.
Table 2.5: A model for the transport of uranium by chemical andmechanical processes [13].
GRANITIC ROCKcrushing andleaching bywater
MORAINE
sorting andleachingby water
15 ppm eU Transfer of uraniumprecipitation of U and Raon the surface of fracturesand fissures.High uranium and radoncontent in fracturegroundwater
8 ppm eU Transfer of uranium(5-15 ppm eU)
Precipitation of U and Raon the surface of fissures,pebbles and grains.
BOULDERSGRAVELSAND
15 ppm eU10 ppm eU
< 3 ppm eUTransfer of uranium
sortingby water
III
CLAY 4-8 ppm eU
Loss of the main part ofthe fine grained uraniumminerals
Deposition, transformationof primary uranium mineralsto clay minerals,precipitation and absorptionof U and Ra on clay particles
13

2.3.2: K, U and Th and their daughter products in theatmosphere, hydrosphere and biosphere
The concentrations of K, U, Th and their daughterproducts in water are much lower than in rocks and soils (seeTable 2.6). For obvious reasons the radioactive decay seriesin water are not in equilibrium.
Table 2.6: K, U and Th in water [7], [14], [15]Element Sea water Fresh waterK % 0.035 <0.001
Bq/kg 10 <1238U ppm 0.003 0.001
Bq/kg 0.04 0.01
Bq/kg
The main contributors to the radioactivity in air andwater are the radon isotopes and their decay products. Radonemanates from the ground via soil capillaries into theatmosphere or into the groundwater. Because 222Rn has a half-life of 3.825 days whereas 220Rn has a half-life of only 54.5seconds, 220Rn is generally less important to the equivalentdose but may play a minor role indoors. Therefore, in thefollowing discussion the term radon will refer to Rn.
In open lakes and rivers the radon content is low,usually less than 1 Bq/kg. In small creeks the radon contentmay rise to higher values due to the influx of radon bearinggroundwaters. The concentration of radon in groundwaterdepends on the radium concentration of the bedrock or soilthrough which the waters have passed, and may reach levels ofseveral thousand Bq/kg or higher.
The concentration of radon and its daughter products inoutdoor air varies with place, time, height above ground andmeteorological conditions. Over land, a reasonable estimateof the concentration of radon at ground level is 5 Bq/m3 [46].In special meterological conditions, for example under aninversion air layer, the concentration of radon may riseconsiderably. The concentration of other radioactive elementsin the atmosphere is negligibly low.
The most common radioisotope in the biosphere is 40K. Theaverage potassium content of plants is about 0.05 % K but ingrasses it may be 10 times as high as in woody plants. For amature forest, potassium gives about 1000 Bq/m2 [7]. Theconcentration of radioisotopes in animals averages about 0.2 %[7]. The average activity of 40K in the human body is about 60Bq/kg.
14

2.3.3: Cosmic radiationHigh energy cosmic radiation from the sun and other
sources in outer space irradiates the earth. At the earth'ssurface roost of the radiation dose arises from secondaryparticles. The cosmic ray intensity shows small fluctuationsdue to the 11 year solar cycle and the latitude. The cosmicray intensity increases with altitude, doubling about every2000 m [12]. The absorbed dose rate in air at sea level isgiven as 9 pGy s" [12]. The exposure rate at sea level isgiven as 3.6 p,R h"1 by Lemmela [16].2.3.4: Natural nuclei concentrated or relocated by man
There are a number of other sources of exposure toradiation which are a direct consequence of man'stechnological activities. Examples of these are coal and peatfired power plants, geothermal energy production, mining foruranium and phosphate and the use of phosphate fertilizers onfields. The use of stone and bricks as building materialsmay lead to elevated outdoor and indoor radiation levels.These activities may increase the gamma ray activity measuredon the ground or from the air. The use of fertilizers mayincrease the gamma ray activity over cultivated areas. Theaccumulated concentration of 22TRa from fertilizers in WestGermany gives a mean absorbed dose rate in air of about 0.2pGy s'1 [17].
2.3.5: Artificial nuclei in natureIn most regions aerial deposition of artificial
radionuclides has occurred. Nuclear bomb tests conducted inthe atmosphere since 1945 have resulted in the introduction ofartificial radionuclides into the environment. Manyradionuclides produced in nuclear weapons testing emit gammarays and so contribute to the external radiation. The mostimportant one from this point of view is 137Cs but other short-lived isotopes were important for a limited time. Therelative distribution of the fallout is a function of latitudeand is shown in Figure 2.4. The integrated mean depositiontoday of Cs in the north temperate zone (40 - 50 degreeslatitude) is estimated to be 2.9 kBq/m2 [8].
2.0 2.5 3.0kßq/sq .m
Figure 2.4: The integrated mean deposition of 137Cs in thenorthern and southern hemispheres.
15

Other causes of tire aerial distribution of man made gammaray emitters are accidents in the nuclear power industry, lossof medical or industrial applications sources, and the fall ofsatellites powered by nuclear reactors. Considerablecontributions to the terrestrial gamma ray component werecaused by the reactor accidents at Windscale, UK (1958) andChernobyl, USSR (1986), the loss of isotope sources Mexico(1985), Brazil (1987), and by the fall of a nuclear poweredsatelite in Canada, (1978). Shortlived isotopes will, ofcourse, change the absorbed dose rate in time. For examplethe absorbed dose rate in air measured in Sweden shortly afterthe Chernobyl accident in 1986 was, in some places, as high as2500 pGy s"1 but by 1988 had declined to about 150 pGy s"1 [18].
Fall-out nuclides are radioactive and emit gamma raysthat interfere with the detection of the gamma radiation ofnatural radioactive elements. The most prominent fall-outisotopes, detectable by their gamma radiation on the earth'ssurface in different stages of contamination are given inTable 2.7. Important fall-out radionuclides with long half-lives are 137Cs, 134Cs and 106Ru.
Table 2.7: Significant fall-out radionuclides - sources of gammarays
Isotope Half-life Energy of gamma rayskeV
95Nb95Zr
^°3Ru106RU131j132I134Cs137Csu°La
35.65.39.
368.8.2.
75030.40.
155520538
1227
dddddhdYh
284523, 630, 668
569
487, 816,
724,497,
, 364,, 773,, 605,
925,
766757610622637955796662
1596
2.4 Measuring the Natural Radiation EnvironmentThe disintegration of a natural radioactive element is
accompanied by the emission of a and ß particles. Thedaughter nuclei are often in a state of excitation. Theexcess energy is emitted as gamma rays that have no mass orcharge. Because gamma rays are more penetrating than a or ßparticles they are most often used to characterize theterrestrial component of the natural radiation environment.However, in certain cases, such as the detection of radon,alpha particles are measured.
The measurement of gamma rays for geological purposesstarted on a large scale in the 1950s when active uraniumprospecting began. Later, measurements of natural radiationwere made to identify geological boundaries, for theclassification of rocks and, indirectly, for prospecting for
16

minerals other than uranium. Natural radiation may bemeasured in many different ways but for geological purposesonly a few techniques have been used. Recently ground andairborne gamma ray surveys have been used to identify areaswith possible radon hazard as well as to calculate theequivalent dose from the natural environment and fall-out[12], [18], [19].
For normal rocks and soils 90 % of the g^mma raysmeasured by a spectrometer survey originate from the uppermost0.15 m. Thus the gamraa ray survey is a surface measurementtechnique. In most cases the bedrock is covered by soil sothat the gamma ray survey shows the activity of the soil andnot the bedrock.
Although radioactive elements are not usually present inplants or snow at levels detectable Ly geological fieldinstruments, planes and snow do have a shielding effect on themeasurements. For airborne surveys in Canada the shieldingeffects of trees was calculated to caure a 15 %underestimation of the exposure rate [12]. Variations in thevegetotio-t cover can also affect ground surveys. For example,the radioactivity of a soil covered by moss and humus will beless tha;i the radioactivity of the bare soil. A massequivalent: to 0.08 m of water will reduce the exposure rate byabout bO % [20]. Because soil moisture has a similar effectand because it varies as A function of time and rainfall,surveys carried out at different times of the year may notgive the same estimate of the exposure rate.
2.5 Equivalent Dose to Man from Natural RadiationCosmic radiation gives an annual effective dose
equivalent of 0.41 mSv[46]. The terrestrial component ofradiation varies considerably. World estimates of averageoutdoor absorbed dose rate in air of 55 nGy h"1 (15.28 pGy s"1)give an annual effective dose equivalent of 0.34 mSv. Thedata of table 2.4 corresponds to 0.27 mSv for a person whostays out-of-doors all year round. The absorbed dose rate inair of 45.3 pGy s"1 gives 1 mSv a"1.
Indoor radiation varies with building material.Estimates of average indoor absorbed dose rate in air is 70nGy h"1 (19.44 pGy s"1) [46], giving an am aal effective doseequivalent of 0.43 mSv to a person who stays indoors all yearround. Estimates of occupancy factors are 0.2 for outdoorsand 0.8 for indoors [46], corresponding to an annual effectivedose equivalent from terrestrial radiation of 0.41 mSv.
Inhalation of radon in the air is probably the mostimportant contributor to the radiation dose received by man.A radon daughter content of 1 Bq/m3 gives an annual equivalentdose of 0.081 mSv [22]. The total world population globalmean annual dose equivalent has been estimated at 1.2 mSv[46]. The regional variation is large. For example, inSweden, the estimated average dose equivalent from radon is3.7 mSv a"1.
17

3. GAMMA RAY SURVEYS
Gamma ray surveys for geological purposes have beendesigned in many different ways. To be of use in defining thenatural radiation environment it is necessary that themeasurements be self consistent and have a directcorrespondence to the terrestrial radiation. There areseveral conditions that must be satisfied. The followingsections discuss the instrumentation, measurement techniques,calibration and reporting units.
3.1 InstrumentationInstruments for measuring gamma rays convert photon
energy into an electrical current. The most commonly usedradiometric field instruments for geological work are Geiger-Müller (GM) counters and scintillation counters. Most recentgamma ray surveys use Nal(Tl) scintillation detectors. For ascintillation counter the most significant factors are thesize of the detector and the energy discrimination threshold.
A Nal(Tl) detector interacts with radiation mainly byCompton scattering and the photoelectric effect. The outputelectrical signal is proportional to the absorbed gamma rayenergy and thus the scintillation detector can be used in agamma ray spectrometer. Because the number of gamma raysabsorbed increases as the volume of the detector increases,larger detectors provide greater sensitivity. The energydiscrimination threshold controls the output count rate.Greater details on gamma survey instrumentation is given inIAEA [23] and IAEA [24].
In a total count gamma ray scintillometer instrument allgamma ray signals above an energy discrimination threshold arerecorded. Any change in the discrimination threshold willaffect the response of the instrument. For smallscintillation counters the discrimination threshold is usuallyset at between 30 and 150 keV, to give high sensitivity. Suchinstruments usually have no system to stabilize the gain andthus the discrimination threshold which means that theinstrument response may change with time. Instruments withstabilization systems eliminate this problem.
In a gamma ray spectrometer a gamma ray energy spectrumis measured which can be used to define the amounts of thedifferent radioéléments. This is done by measuring the countrate in distinct energy windows specific for the gamma rayenergy of particular element. Some systems use a multichannelanalyzer with as many as 256 channels, while simpler systemsuse 3 or 4 distinct energy windows. Typical energy windowsused for determining K, U and Th are shown in Table 3.1 [25].
The function of a gamma ray spectrometer requiresstabilization to avoid the effects of small energy drifts.These cause more severe errors in a spectrometer than in atotal count system. Stabilization can be done by controllingthe temperature of the detector, by energy stabilization usinga reference radioactive source or an LED, or by the use of
18

Table 3.1: Spectral energy windows commonly used for gamma rayspectrometres.
Element Isotope Gamma ray Energy windowsanalysed used energy (MeV) (MeV)
K 40K 1,46 1.37 - 1.57U 2KBi 1.76 1.66 - 1.86Th 208T1 2.62 2.40-2.80
measured natural radiation. In the latter case, with amultichannel analyzer, it is possible to correct for energydrifts at the end of the survey.
3.2 Calibration and Reporting UnitsMany of the early radiometric surveys carried out around
the world were reported in counts per unit time which applyonly to the instrument actually used. To provide consistentquantitative radiometric measurements it is necessary tocalibrate the instruments.
Gamma ray spectrometers can be calibrated using a sourcecontaining a known amount of the radioélément. These sourcesmust be large enough to be considered of infinite size.Calibration sources are constructed as large concrete pads,usually spiked with one of the three natural radioéléments. Afourth, unspiked pad is also constructed [26]. Themeasurements on the pads show the response of the instrumentto the three natural radioéléments in each of the spectrometerenergy windows. Portable gamma ray spectrometres arecalibrated on pads of 3 metres horizontal dimensions. Thecalibration of an airborne radiometric system is done bymaking measurements on larger calibration pads and on a teststrip. A test strip is a natural area with accurately knownground concentrations of the radioéléments. Sensitivities ofthe spectrometer and altitude dependence of response aredetermined on the test strip. Calibration facilities andprocedures are described by Lovborg [27], Grasty [28], [29]and IAEA [25 & 26].
Total count instruments can be calibrated usingcalibration pads. Point sources have been used but do notgive an adequate calibration for field measurements.
Spectrometric measurements have been reported either incounts per unit time for the three energy windows or asconcentrations of potassium, uranium and thorium. In somecases other reporting units have been used such as multiplesof 'background' radioactivity. Total count measurements havebeen reported as counts per unit time, as /xR h"1, ppmequivalent uranium (ppm eU), unit of radioélémentconcentration (Ur) or as multiples of "background".
19

3.3 Geological Gamma Ray SurveysRegional geological gamma ray surveys have most
frequently been airborne surveys and sometimes carbornesurveys. In exceptional cases ground survey methods have beenused. The design of a particular regional survey depends onmany factors; the area to be covered, available techniques andequipment, funds and personnel resources. Corrections for theinfluence of different effects must be applied to gamma raydata. These effects may include cosmic radiation, instrumentbackground, altitude variations, Compton scattering, andsource geometry. The effect of radon in the air has beenestimated using upward looking detectors in airborne surveys.
Airborne surveys are usually flown on a regular parallelgrid using flight line spacings from 0.1 to 10 km. Inmountainous terrain contour flying is often used and sometimesirregularly spaced flight lines. Nominal terrain clearancesvary from 30 to 150 metres. Navigation and flight pathrecovery commonly use a combination of visual techniques,electronic positioning and flight path cameras, either videoor photographic. Methods for the various corrections notedabove are discussed by Darnley [30], IAEA [24] and Grasty etal. [12].
Regional ground surveys include surveys that have coveredlarge areas with carborne or hand held gamma ray measurements.In general these will have been carborne total count or gammaray spectrometer surveys. Carborne surveys are restricted toexisting roads and tracks and are affected by road materialsand geometry.
For typical rocks or soils with an air dose rate of 10 -30 pGy s~1 (4 - 12 jitR h"1) total count measurements with handheld instruments will have an accuracy in the order of ± 5 pGys"1 (± 2 pR h"1) . For similar materials a spectrometer with a3" X 3" Nal(Tl) detector will give standard deviations in theorder of ± 0.1 % K, ± 0.3 ppm eU and ± 0.6 ppm eTh using ameasuring time of 4 minutes.
The results of gamma ray surveys are presented as maps orprofiles. Maps produced include contour maps, maps showingprofiles along flight lines, grey scale maps and so on. Mapsprepared for early surveys were usually hand drawn whichimplies interpretation by the cartographer.
3.4 Suitable DataMany of the regional gamma ray surveys made throughout
the world contain much valuable information on the naturalradiation environment. Because the techniques and instrumentsused for these surveys were different, any compilations ofthese data will require careful analysis of the originalspecifications of the surveys. If a gamma ray survey is to beused to define the natural radiation environment the datacollection and reduction techniques should result in valuesproportional to the air dose rate. No amount of subsequentanalysis or interpretation can compensate for improper data
20

collection or reduction. Minimum requirements are fulldocumentation and proper field procedures [30], [24], [12].It is also important to check the accuracy of the geographicalpositioning of the data. Airborne surveys are particularlysuitable for regional compilations because, typically, theycover large areas. Carborne and other regional ground surveysthat cover at least several hundred square kilometres are alsosuitable.
With the exception of detailed surveys of small areasgamma ray surveys cover only a few percent of the areasurveyed. In general it could be said that the objective of agamma ray survey should be to provide data for all of thelithological units within the survey area. In airborne orcarborne surveys the data are recorded continuously and thusthe density of sampling along the measured line is high.Regional ground surveys consist of point measurements atdensities such as 1 per 1 or 2 km2.
For airborne gamma ray surveys the flight line spacingshould be proportional to the final map scale. In the UnitedStates and Sweden a factor of 10"5 has been used successfully.For example, a map of scale 1:1 000 000 requires a linespacing of 10 km or less. Surveys with irregularly spacedflight lines should have a similar average sampling density.
Because the area measured by a carborne survey is muchsmaller than that of an airborne survey the sampling of thecarborne survey should be more dense. The sampling density ofa ground survey should similarly be more dense.
In addition to careful analysis of the technical qualityand the parameters of a survey the decision to include thesurvey in a regional compilation should consider other factorsthat might affect efforts to back calibrate the survey.
Sometimes the shielding effects of an area may havechanged since the survey was carried out. Examples arelogging activities and the draining of swamps which may changethe soil moisture. Another important factor is radioactivefall-out because the air dose rate due to fall-out will changewith time. If the contribution of the fall-out to the totalcount measurement is less that 2.5 pGy s"1 (approx. l ßR h" or1 kBq/m2 of 137Cs) this effect can be neglected (see Figure2.4) .
21

4. STANDARDIZATION TECHNIQUES
Regional measurements of ground radioactivity forgeological purposes were carried out by different methods,instruments, at different times and under differentenvironmental conditions. Early measurements used mostlyuncalibrated equipment and reported the data in units that area relative measure of the radioactivity. The results of morerecent gamma ray spectrometry surveys are reported asradioélément concentrations. Standardization procedures canunify disparate data and express them in air dose rate units(Gy s ). The general procedure to be used includes checkingthe original radiometric data and their levelling within thesurvey area and the conversion of the data to air dose ratedirectly or by means of recalibration (back calibration).
4.1 General Concept of StandardizationContemporary field gamma ray spectrometry techniques
enable us to determine the contents of the natural radioactiveelements in surface rock materials. These radioactive elementsare sources of ionizing radiation in the environment. Theoryand experiments verify that surface radioactivity measurementscan be expressed in terms of the air dose rate. If theoriginal data can not be directly converted, procedures usingstandard geophysical field radiometric equipment can beapplied to determine the necessary conversion factors.
4.1.1: General considerationsThe materials and information required for these
standardization procedures include the radioactivity map ofthe area, and the conversion constants for air dose rate. Ifthe data cannot be directly converted to the air dose rate,back calibration procedures will be necessary. It is clearthat any data to be included in a regional compilation must beof good quality. The radioactivity map should show either thedata as concentrations of K, U, Th, corrected count rates inthe K , U and Th energy windows, or the total gamma rayactivity expressed in specific (e.g. p.R h'1) or relative units.The data should be in digital form. If not they must bedigitized at some point. The map should be accompanied by adescription of the techniques used, the methods used to makethe corrections that have been applied to the data, and themethods used to make the map.
Regional radiometric surveys are carried out undervarying climatic conditions and with a variety of equipmentconditions. These varying conditions can cause levellingproblems within a single survey as well as between differentsurveys. Some of the factors that cause these effects areairborne radon, soil moisture, and errors in backgroundcorrection. Suitable procedures can often be used toeliminate these level differences.
22

A suitable instrument for the back calibration is aportable gamma ray spectrometer with gain stabilization and aNal(Tl) scintillation detector that is at least 76 x 76 mm (31x 3' inches) or 350 cm3 in volume. Calibration methods forportable gamma ray spectrometers have been described [24],[25]. Lovborg [27] gives a detailed discussion of thetechnical problems associated with instrument calibrationbased on theory and numerous experimental data gathered in anIAEA sponsored intercalibration project. Darnley [30]describes airborne gamma ray spectrometry, while Grasty [29]illustrates a practical approach to the establishment of acalibration facility. Recommendations for the construction anduse of calibration facilities for field gamma rayspectrometers have been prepared by the IAEA [26].
Back calibration is based upon comparisons of the mapdata to ground measurements obtained with the carefullycalibrated portable gamma ray spectrometer.
4.1.2: Conversion of radioélément concentrations to airdose rate
Potassium, uranium and thorium in rocks are sources ofgamma radiation. Their effect in the air can be expressed interms of the exposure rate or the absorbed dose rate in air.Conversion factors from radioélément concentrations in rocksand soils to ground level exposure rate have been estimatedfrom photon transport calculations applied to infinite soiland air media [31], [32]. The numerical solution of thiscomplex mathematical problem evaluates the effects of primaryand scattered gamma rays in the ground and in the air whichdepend on transport eguations and K, U, Th energy emissionspectra. Lovborg [27] published conversion factors calculatedfrom up-to-date data of the 1981 version of the EvaluatedNuclear Structure Data File [33]. The factors for convertingnatural radioélément concentration into radiation exposurerate are nearly identical for rocks and soils and are given inTable 4.1.
Table 4.1s Calculated factors for converting radioélémentconcentrations of an infinite homogeneous planeinto absorbed dose rate in air or exposure rate atan altitude of 1m above the soil plane [27].
Conversion toAir dose rate (pGy s'1)Exposure rate (/xR h"1)
1 % K3.6331.505
1 ppm eU1.5760.653
1 ppm eTh0.6930.287
The values given in Table 4.1 were verified byexperimental measurements of the exposure rate with acalibrated ionization chamber over various geologicalmaterials with known concentrations of the naturalradioéléments. Generally good agreement was achieved between
23

the experimental results and the calculated values [12]. Thecalculated air dose rate will be incorrect if the radiationsource is not infinite because the downward backscatteredradiation of an infinite plane contributes up to 13% to theair dose rate. If artificial radionuclides are present theywill also contribute to the total gamma ray dose rate. Suchcontributions may have occurred in existing gamma ray surveydata.
4.2 Levelling of Data Within a Survey AreaRaw radiometric data from airborne and ground surveys
often reflect the measurement conditions on individual days aswell as variations caused by such effects as gain drift andvariable background radiation. If not corrected during thedata processing, these effects can produce level differencesin the radioactivity maps.4.2.1: Factors causing level differences
Background radiation includes cosmic rays, internalradioactivity of the equipment and airborne radon. Thebackground, determined over water, may differ from valuesmeasured at altitudes greater than 800 m because ofdifferences in the amounts of airborne radon and cosmic rays.Also, the amounts of airborne radon over the sea or largelakes is generally less than the amounts over inlandterrestrial areas. Contamination of the airplane, car or ofthe instrument itself can also change the background.
Table 4.2: Background values detected by an airborne gamma rayspectrometer with installed Nal(Tl) detector29x102 mm, (4168 cm3) . Atomic Energy Establishment,Egypt [34].
Energy windows(MeV)TC K U Th
0.36-2.84 1.34-1.59 1.68-2.32 2.42-2.84
Area Altitudem
Lake Karon 60The Mediterranean 60Nile Delta 850
Count ratec/s91.766.368.3
c/s7.06.35.7
c/s6.65.86.0
C/S
2.21.82.4
The accumulation of airborne radon under a temperatureinversion layer causes a detectable variation of gamma raysemitted by radon disintegration products as a function oftime. Maximum gamma radiation has been observed between fourand nine A.M. [35]. Rainfall will cause a temporary increasein the measured radioactivity (Figure 4.1). However^ dailyand seasonal precipitation and the resulting higher soil
24

"re(mtn*)
TOO
fSO
/ \^0 ————— O-——"" ~li~~—-~-fL- I
^jyf^ "~~-^C s*
1 1 1 1 1 1 1 1 I I 1 1
to *3 hourt
Imin') J
/OO
X
ao?n
_
r //*NV— °-"~" ° — a~~~<3--^ ,/ >>i
o ——— o—- "1^ ^ °— — ,^^^
1 1 1 ! I 1 1 1 1 I 1 ! 1
"Th
}Q OG S3 hours
SO
SO
30
1
_ . . _ . A_°- —— — g, ^ - ^ -x>- -—
1 1 1 1 1 1 1 1 ] ! I ! 1'5 A> « /* O! O¥ OS OS 1O 1! «• IS ta /I
235
18,5
Jl
Q^ ^^J^~~-~^rfS'^ ^^X_ — — -°-«- jy*^~ ~~ ' — "- -No^ -o-__^-
1 1 1 1 ! 1 1 1 1 ! 1 1
ia it* ngntfantfarrj conditions
Figure 4.1: Diurnal change of gamma radiation and the effectof radon decay products accumulated by rain,after 16 hours. Measured count rates in the TC,K, U, and Th energy windows by portable gamma rayspectrometer over low activity sand. (AfterMatolin [35]).
moisture cause an increased attenuation of gamma rays. Snowcover has a similar attenuation effect, but the decreasedmobility of radon in frozen or wet soil generates an increasein the surface gamma ray activity.
Instability of radiometric equipment, especially gainchanges cause spectral energy shifts, which give rise tovariations in the recorded count rates. Illustrative figureswere presented by Lovborg [27]. The complex problem of short
25

and long term gamma emission instability of pads atcalibration facilities affects the equipment calibrationconstants used for survey data processing.
The results of airborne measurements are significantlyaffected by attenuation of gamma rays in wood biomass (seeChapter 2.4). However, seasonal changes in vegetationinfluence the surface gamma radiation less than 3% [36], [37],[38], [39]. Summary descriptions and analyses of error factorsin gamma ray spectrometry were presented by Filimonov [40] andIAEA [24].
4.2.2: A mathematical approach to levellingRadiometrie maps can be corrected for the effects of
variable conditions using a mathematical approach tolevelling. The procedures used to correct for inconsistenciesin the levels of groups of profiles from different days aredifferent from those used for single profiles. Theseprocedures assume the use of digital data.
The determination of a profile group correction is basedon the comparison of data from the survey lines to data fromtie-lines. Because the radioactivity field has significanthorizontal gradients, the location of the points of comparisonmust be accurate. Airborne surveys using electronic navigationmethods may have positioning error in the order of 5 - 20 mwhereas other methods of navigation have typically loweraccuracies. Profile group corrections of airborne survey aredetermined by applying the general condition
S wf [(n, - dki) e*<h-hr> - (n', - dk'-') e ' ]2 = min (4.1)i = 1where: n,-, n's are the values of the count rates in one of
the spectrometer energy windows for the surveylines, and tie-lines respectively at their ithintersection. These data are assumed to have beencorrected for background and stripping,i is the index of the intersection point of thesurvey line and tie-line, i = 1, 2 ... N in thegroup of profiles,
k, k' are the indices of the group of survey linesand tie lines, respectively,h, hr are the altitude and reference altitude,respectively.w- is a weighting factor for the data at the ithintersection,dk ,-, dk, j are the correction factors to becalculated.
26

The weighting factors are proportional to the countrates.An example of group profile correction is shown in Figure
4.2. Figure 4.2a shows a contour map of an airborne surveyprior to correction and Figure 4.2b shows the corrected data.
4.2a
Figure 4.2: Contour maps of the TC energy window from anairborne survey. Bounds of daily operation aremarked by dashed lines. 4.2a - compiled fromoriginal data. 4.2b - identical map levelled byprofile group correction. (After Zabadal [47]).
27

Level shifts of individual survey lines can be correctedby applying the concept of general continuity of theradioactivity field. This concept is applicable for closelyspaced flight lines. The distance between flight lines dependsupon the geology. In terrain with highly variable geology thespacing might have to be as small as 200 m but could be asmuch as 1000 m or more in areas of homogenous geology. Theaverage differences of observed values at neighbouring pointsof adjacent survey lines should be close to zero.
M. 5 wi.j <ni.j>i * ni,j ~ fj>2 = min <4'2>i — J.
where: i is the point of observation on the profile,j is the profile number,n is the fully corrected count rate,WT- j is a weighting factor,f- is the correction to be calculated.
An example of single profile correction is shown inFigure 4.3. Both of the above procedures are presented onlyto introduce the concepts. A detailed description is given in[47].
4.2.3: Levelling of data using image techniquesImage levelling techniques that utilize image processing
equipment and procedures can make the task of back calibrationeasier. These techniques present the data in an image formaton a display screen. The image format enables rapidrecognition of levelling errors and estimation of correctionfactors. In some cases the use of this approach can eliminatethe need to make ground spectrometer measurements. Inparticular, spectrometric data can frequently be standardizedconveniently by this method because level differences areoften a result of scaling differences caused by calibrationerrors, soil moisture, and/or snow cover. However, if thelevelling differences require the addition of a constantfollowed by a scaling factor, the imaging method is notappropriate and the mathematical methods described in section4.2.1 should be used. In the case of total count surveys, thelatter type of correction is likely to be required.
Figure 4.4 shows grey-tone images of the spectral datafrom an aerial gamma ray survey. As indicated on the figurethe images on the left show the data as delivered by thesurvey contractor. It is obvious that the data are notinternally consistent. The images on the right side of Figure4.4 show the data after levelling corrections have beenapplied. Each of the images shown in the figure was producedby first gridding the data with an appropriate grid interval
28

4.3a
4.3b
Figure 4.3: Map of an airborne gamma ray survey. 4.3a - mapcompiled from original data showing inconsistentvalues on one line. 4.3b - the same map afterindividual profile correction. (After Zabadal[47]).
29

110' 109*
48"3Q'
48° 0'
110' 109'
48'3Q'
POTflSSIUM DflTfl
48°50-
48° 0*
110'URflNIUM DflTfl
109-
48°30'
48° 0»
THORIUM DflTfl
48e 0*
1101 POTflSSlUM DflTfl109°
110*URflNIUM DftTfl
109°
48830'
48° 0'
THORIUM DflTfl
Figure 4.4: Spectral gamma ray datacorrections (left) andcorrections (right)
30

and then converting the data from the original data units tointeger values in the range from 1 to 254 as shown in Figure4.5. The images have also been contrast-enhanced to emphasizethe flight lines with levelling problems. Because the datafor this data set have been corrected by the contractor forbackground radiation, altitude variations, and airborne Bi,the assumption was made that the levelling problems are theresult of calibration errors or soil moisture content. Thecorrections were, therefore, made by multiplying the data forindividual flight lines by a constant. Each of theradioéléments (K, eU, eTh) were corrected separately andindependently. The criterion used to judge that the levellingproblems were corrected was that the individual flight linescan no longer be seen in the images. Experience with thiscorrection technique has shown that differences as small as 5percent can be seen in the images. Because the precision ofthe original measurements is, in certain cases, probably nobetter than about 20-30 percent, these corrections might beviewed as cosmetic, although the image format actuallyincreases the statistical validity of the data. The correctionprocedures frequently do not remove all linear trends parallelto the flight lines and, in addition, the gridding proceduressometimes produce linear trends perpendicular to the flightlines. Strike or trend filtering techniques may be appropriateto reduce those trends parallel and perpendicular to theflight lines. Such filters were applied to the correctedimages for potassium and uranium.
2 5_ o
u. oO i:cc "-öS l
PARAMETER VALUE"
100 200DENSITY NUMBER
Figure 4.5: Conversion of original data units to integervalues in the range 1 to 254.
31

4.3 Levelling of Data Between Survey AreasThe results of regional gamma ray surveys in adjoining or
widely separated areas can differ in their levels.Compilation of large scale radiometric maps from theresults of individual surveys stages of national programmeswill require levelling of the data from the differentareas. Levelling is based on regional airborne gamma raytie-lines, and on comparisons of the statisticalradiometric characteristics of ground and laboratory groupassays with field data, or on systems similar to backcalibration.
4.4 Procedure for Standardization of Spectrometer SurveysThe radioactivity of the ground has been measured by
various types of equipment, both calibrated anduncalibrated. Procedures for standardization will differfor the individual cases.4.4.1: Gamma ray spectrometer surveys with calibratedequipmentAirborne, carborne and portable gamma ray spectrometers
should be calibrated using calibration pads at acalibration facility. The results of gamma ray spectrometersurveys with calibrated equipment are reported inconcentrations of K, eU and eTh. If the radiation sourcecorresponds to an infinite plane source, the constantsgiven in Table 4.1 can be used to convert the data to airdose rate. The individual effects of contributions are thensummed and used for the compilation of the radioactivitymap. Assuming average errors in determining theradioélément concentrations, the air dose rate map can becontoured with a contour interval 4-5 pGy s"1.4.4.2: Gamma ray spectrometer surveys with uncalibratedequipmentThe results of gamma ray spectrometer surveys with
uncalibrated equipment can be reported as fully correctedcount rates (c/s) for each energy window. The correctionsapplied for airborne gamma spectrometer data includebackground corrections, stripping corrections and altitudecorrections. The corrections applied for portable gamma rayspectrometer include background corrections and strippingcorrections. Conversion of these corrected count rates toair dose rate requires back calibration. Depending on thegeological setting of the area of interest, backcalibration can be carried out in two ways.Large, radioactively homogeneous geological bodies of
differing radioactivity in the area of realized regionalradiometric survey can serve for back calibration. It isrecommended that a minimum of five extensive radioactivelydifferent level areas be measured. Twenty or more stationsare measured in each with a calibrated portable gamma rayspectrometer, with the detector positioned l m above theground surface to accumulate a statistical group of data.
32

Using a Nal(Tl) detector volume of 350 cm3, a minimummeasurement time of 4 minutes at each station isrecommended. The concentrations of K, U, Th are determinedand the mean value for each element, K, U, Th, iscalculated for the individual areas. This will result inseparate conversion equations for each of theradioéléments. The conversion factors can then becalculated using a linear regression fit to the meanradioélément values for the individual areas versus averagevalues of the fully corrected count rates in respectiveenergy windows. The resulting regression equation can beconsidered acceptable if the errors between the calculatedand measured concentration values are all less than 20%.The regression equation should ideally intersect the
origin of the axes of the variables. Any shift of theregression line in a vertical or horizontal directionindicates an incorrect background subtraction in theoriginal survey or back calibration data. The regressionis, none-the-less, valid.Once acceptable regression equations have been calculated
enabling conversion of fully corrected count rates toradioélément concentrations, the survey data can beconverted to air dose rate.The second method employs similar procedures using data
along selected line segments. Five or more segments withminimum lengths of 1000 m should be selected. Thesesegments should have relatively constant radioactivity andthe average radioactivity of the different segments shouldbe as different as possible. The ground data measured by acalibrated portable gamma ray spectrometer should beobtained at intervals of 25 m along the line segment withthe detector l m above the ground. Using a Nal(Tl) detectorvolume of 350 cm , a minimum measurement time of 4 minutesat each station is recommended. The average values of K, U,Th are then determined for each line segment. Thecalculation of the conversion factors uses a regressionanalysis as described above. The locations of the linesegments must be accurate. In order to consider the linesegments or areas as radioactively distinct, they shouldfulfil the following criterion:
- n2 > 1.3 (s1 + s2) (4.3)
where: n.|, n2 are the mean values of the fully correctedcount rates for two of the segments or areas,s1, s2 are the standard devic.tions of the countrates for two of the segments or areas.
If the results of gamma ray spectrometer surveys withuncalibrated equipment are reported as raw window countrates, the back calibration requires more complex dataprocessing. The raw window count rate rM in the ith window
33

is the sum of the background count rate b,- and threeproducts of sensitivities sconcentrations C- [24, 26].products of sensitivities s-- of the instrument and
ni = bi + Sj sijcj (4-4)
A minimum of four areas with different levels ofradioactivity must be measured with a calibrated gamma rayspectrometer in the region of the regional survey and themean concentrations CK/ Cy, CTh determined for each area.Using the original raw count rates ni and the calculatedconcentrations C- from the four investigated areas, thebackground rate b^ and sensitivities s-- for the originalinstrument can be determined from equation (4.4). Knowingand Sjj, the original raw window count rates can beconverted to radioélément concentrations which can also beused to evaluate the air dose rate (Table 4.1).
4.5 Procedures for Standardizing Total Count surveysThe single measured values of total count surveys, which
are dependent on instrument construction, make the task ofdefining the environmental radioactivity more difficult.4.5.1: General problems related to the use of total countsurveysThe response of total count instruments to the radiation
of K, U and Th in the ground is generally not proportionalto the contributions of these elements to the air doserate. The response of a total count instrument depends ontype of detector, its dimensions and on the energydiscrimination threshold used. For this reason it isimportant to understand the limitations of using totalcount surveys to estimate the air dose rate.The detection efficiency of detectors is dependent on
their properties and the energy of the detected gamma rays.The detection efficiency of a scintillation counterdecreases significantly with increasing gamma ray energy[25]. Total count instruments measure gamma rays ofenergies greater than the energy discrimination threshold,and the responses of total count instruments to K, U, Thradiation differ [24]. The relationship between thecorrected count rate and concentrations C of K, U, Th inthe ground is:
nTC = aKC< + aUCU + aThCTh (4-5)
where: nTC is the total count rate,
a<r au, aTh are the sensitivities of the instrument toK, U and Th radiation,CK, Cy, CTh are the radioéléments concentrations.
34

The sensitivities are expressed in terms of the countrate per unit concentration in an infinite plane source,and their values depend on the properties of the detectorand the energy discrimination threshold. Total countinstruments typically have energy discrimination thresholdsin the range 30 - 150 keV, The total count energy thresholdof gamma ray spectrometers is usually set in the range400 - 800 keV.
Equation (4.5) can be written in the form:
nTC = aU C ————— CK + CU + ———— CTh 1 <4'6)au au
where aK/ay is the uranium equivalent of potassium and aTh/auis the uranium equivalent of thorium. The term uraniumequivalent refers to the concentration of uranium thatgives an identical count rate in a total count measurementas 1% K or "• ppm Th. The ratio a^/a^ changes significantlywith detp cor volume and energy discrimination threshold,but aTh/" is nearly constant.
Table 4.3: Typical uranium equivalents of potassium andthorium for field total count instruments. Data based onNal(Tl) detector; infinite plane source; concentrationsexpressed as K %, U ppm, Th ppm [41].
Nal(Tl)volumecm
2982348348
Energy discr.threshold
keV
3050400500
aK/au
1.1.2.2.
57563767
aTh/au
0000
.37
.38
.41
.41
Table 4.1 shows the air dose rate caused by unitconcentration of K, U and Th. It is evident that the airdose rate from 2.30 ppm U and 0.44 ppm U are equivalent to1% K and 1 ppm Th. Table 4.3 shows the equivalentconcentration with respect to instrument response. Itfollows from Tables 4.1 and 4.3 that the response in thetotal count energy window is nearly proportional to airdose rate for an instrument with an Nal(Tl) detector 76 x76 mm (348 cm3) and an energy discrimination threshold inthe range of 400 KeV [42]. For instruments with differenttechnical parameters the measured count rates do notcorrespond linearly to air dose rate.
35

If total count instruments are calibrated over extensiveU containing plane sources or over infinite rock planesource in which radioéléments are expressed in uraniumequivalent, the sensitivity au can be then expressed in c/sper ppm eU. Equivalent uranium concentrations can bedetermined by dividing the corrected count rates by theconstant a(J. Equivalent uranium concentrations multiplied bythe conversion constant 1.576 (Table 4.1) give air doserate values, that are only correct for an instrument oftechnical parameters specified above. Response of otherinstruments to radiation of K, U and Th is not linearlyproportional to air dose rates of K, U and Th and theresults are determined with error increasing with K/U andTh/U ratios.Figures 4.6 and 4.7 illustrate the magnitude of the
relative error in the air dose rate determined by anarbitrary total count instrument calibrated over a uraniumpad. The relative error is calculated as the ratio of thedifference between the experimentally determined air doserate and the true air dose rate to true air dose rate (De -Dt)/Dt.An examination of the data in the figures shows the
importance of size of detector and discriminationthreshold. Instruments having values of a</au = 2.30 andaTh/au = 0.44 determine the air dose rate correctlyregardless of the K:U:Th ratios in the ground. For aninstrument of less than ideal parameters, with increasingCK/CU ratio relative to similar increases in the CTh/Curatio, error increases more rapidly for K than for Th .
-ItO
GK/CU
Figure 4.6: Dependence of the relative error E(%) of thedetermined air dose rate on the K/U ratio inrocks for a total count instrument calibratedover a U pad, and having uranium equivalent ofpotassium aK/au.
36

-1Q -
-<fO
0*3
mCTn/C(J (ppm eTh/ppm eU)
Figure 4.7: Dependence of the relative error E(%) of thedetermined air dose rate on the Th/U ratio inrocks for a total count instrument calibratedover a U pad and having uranium equivalent ofthorium aTh/au.
Total count instruments with a low discriminationthreshold (30 - 50 keV, aK/au = 1.6; a^/a^ = 0.37)underestimate the true air dose rate for C^C^ = 2 by aboutto 25% and for CTh/Cy = 10 by about 13% relatively. Aninstrument with a discrimination threshold of 400 keVestimates the air dose rate with an error less than 3% evenfor extreme K:U:Th ratios. An instrument with adiscrimination threshold greater than 400 keV (aK/au > 2.3;aTh/a(J > 0.44) will overestimate the air dose rate by up to25%. The curves of Figures 4.6 and 4.7 can be used toestimate the likely errors in the air dose rate if theenergy discrimination is known.Calibration procedures by means of a 226Ra point source
will result in an overestimation of air dose rates. Aninstrument with an energy discrimination threshold of 30keV gives nearly twice the correct air dose rate [43]. Forthis reason, such calibration procedures are notrecommended. If proper calibration facilities are notavailable a natural site that has been characterized bylaboratory or field gamma ray spectrometer measurement canbe used for calibration.4.5.2: Total count surveys with calibrated equipmentThe sensitivity of an instrument calibrated over
extensive uranium enriched plane source or over infiniterock plane source is expressed in c/s per ppm eU and,consequently, the results of survey are reported asequivalent concentrations of U (ppm eU). The conversion ofthese data to air dose rate can be performed by means ofthe constant given in Table 4.1. If the air dose rate orexposure rate over the U calibration source is known, theresults of the survey can be converted directly to air doserate or exposure rate.
37

4.5.3: Total count surveys with uncalibrated equipmentInstruments that have not been calibrated over an
infinite plane source are considered to be uncalibrated forthe purposes of this manual. The results of surveys withuncalibrated total count instruments, reported in countrate (c/s), provide only a relative measure of theenvironmental gamma radiation. Conversion to air dose rateunits requires back calibration. The back calibrationprocedures to be used are similar to those described insection 4.4.2. In the case of the total count backcalibration procedure the portable spectrometer data arefirst converted to the air dose rate contributions from thethree radioéléments. These contributions are then summed toobtain the total estimated air dose rate. The total airdose rate versus the total count survey data are used toobtain a regression equation, which is used to convert thesurvey data to air dose rate. As before (see section 4.4.2)the resulting regression equation can be consideredacceptable if the difference between the calculated andmeasured air dose rate values are all less than 20%. If thedifferences do exceed 20% then the back calibration dataare inadequate. This means that either th~ survey data areunacceptable for inclusion in a regional compilation oradditional back calibration data are required. Comparisonof available relative results with air dose rates acquiredby measurement with portable calibrated gamma rayspectrometer in the survey area determines conversionconstants.
5. DATA PRESENTATION
The presentation of the data from gamma ray surveys is asubject of some importance. The process of preparing thedata for presentation requires considerable effort and willdepend on the use to which the presentation material willbe put. Maps are a common form of data presentation forgamma ray surveys but the type and complexity of the mappresentation will depend on the audience. Generally,technical workers using the maps will require a lesspolished but more complete depiction of the data, whereasmaps prepared for public distribution will require a lessdetailed but more graphically forceful presentation.
5.1 Graphical FormThe data should be presented as contour maps using the
units of pico grays per second (pGy s"1) with a contourinterval of 5 pGy s (see section 4.5.1). If the maps areintended to be useful for geological applications, thecontour interval might have to be smaller. In general, thedata should be in digital form for greater ease of datahandling.
38

Standard gridding and contouring practices should befollowed. In particular, care should be taken to eliminateareas of invalid contours (e.g. over large lakes). A ruleof thumb to determine when to delete the contours would beto do so only for areas of 1 square centimetre or larger atthe final map scale.
5.2 Map CompilationThe process of compiling a variety of surveys that have
been standardized as described in Chapter 4, above, can beeither manual (analog) or automatic (digital). In general,digital compilation is to be preferred over manual methodsbecause the digital process will result in a data base thatcan be manipulated and augmented as new data becomeavailable. If, however, a large fraction of the availabledata aie not already in digital form, the effort requiredto digitize the data may be considered excessive andpreference given to manual compilation. The availabilityof suitable hardware and software for data processing anddigitizing will also be factors in determining thepreferred compilation method.5.2.1: Manual compilationThe first step in a manual compilation procedure is to
redraft an existing contour map using the conversionequation defined by the recalibration procedures describedin Chapter 4. For example, if 50 c/s are equivalent to 5pGy s" , the 50 c/s contour level would be redrafted andlabelled as 5 pGy s"1. In most cases, however, the existingcontours on the contour maps will not coincide exactly withthe contours needed for a 5 pGy s"1 contour interval. Inthis case, the correct position of the contour line willhave to be determined using linear interpolation betweenexisting contours. Figures 5.la and 5.1b show an exampleof a maps of exposure rate determined by linearinterpolation.After the map has been completely redrafted, it must be
changed to the final map scale. The scale change can bedone photographically or using any of a variety ofprojectors commonly used to change map scales (e.g. aSalzman projector). After the map is at the correct scale,it is physically placed in the correct location on theregional map. Ideally the recalibration process willeliminate all levelling differences between differentsurveys. In practice, level differences will still bepresent. However, if such differences exceed 20 percent,the back calibration should be considered suspect andshould be examined for possible errors. Even if the leveldifferences are saall, the contour lines are unlikely tomatch either in areas of overlap or at join lines. Inareas of overlap, a decision must be made regarding whichsurvey is considered the more reliable and the contoursfrom the other survey should be eliminated. At the joinlines the contour lines will need to be redrafted toproduce smooth contours. Figure 5.2 illustrates thisprocedure.
39

77 * CO- 76 ' 45-
3T 50' -
3T 45- •
77 ' DO- 76 ' 45'
77 ' CO- 76 ' 45'
37 45' -
77 ' Off 50- 76 * 45'
Figure 5.1: Maps showing the conversion by interpolation ofthe contours in counts per second (5.la above) to-icontours in pGy s" (5.1b below).
40

77 • 00"
37* 50- -
37" 45' •
77 ' Off 55' 76 ' 45'
Figure 5.2: Adjustment of contours in the area of overlapbetween two dilferent surveys.
5.2.2: Digital compilationIf the data are already in digital form, the regridding
and compilation procedures are straight forward. Figure5.3 illustrates the general procedure where the data wouldbe gridded in overlapping blocks and the resulting gridsinserted into the final grid. If the data are not indigital form, they will have to be digitized. If theoriginal flight line locations are known, the data shouldbe digitized only along the flight lines. Otherwise, aregular grid could be used or the actual contour linescould be digitized. If it is necessary to digitize maps,care must be taken to ensure that the digitized dataaccurately represent the original map. One way to verifythe accuracy of the digitizing is to make a new map at thesame scale and with the same contour intervals as theoriginal map and compare them. Prior to digitizing, themaps should first be back calibrated and redrafted. In thecase where spectral data are available, the element datashould also be compiled into separate maps because theywill be useful for geological applications. In all cases
41

any digital data should be carefully preserved in a digitaldata base.
6. INTERPRETATION AND USE OF THE MAPS
Geochemists have long recognized the significance ofgeochemical surveys to environmental studies. In manycountries this awareness is now spreading to scientificpolicy makers. More importantly, scientific concern aboutthe rate of global-change is beginning to attract mediaattention and is creating some popular pressure forgovernment action. Recognising that most existinggeochemical surveys were conducted for geological/mineralexploration purposes, there is now a need to maximise theenvironmental usefulness of existing data in order toprovide baseline geochemical information of use in globalchange environmental, agricultural and health studies aswell as geological research. The radioélément explorationdata are one part of this material that can be of greatvalue, put to proper use.A statistical relationship between strong irradiation and
health effects has been proved. The relation between lowlevel radiation and its effects on the human organism is asubject of controversy. Organizations such as the ICRP,WHO, UNSCEAR, BEIR accept the assumption that the number ofhealth effects, caused by radiation is proportional to theabsorbed radiation dose [44]. Figure 6.1 shows (A) proved,and (B) assumed proportions of the probability of healtheffects to the absorbed dose equivalent in the human body.Natural environmental radiation also contributes to theoverall irradiation of the human body.
Maps of the air dose rate can be used as a basis forcalculation of the annual effective dose equivalent. Sinceconversion of air dose rate data to whole body absorbeddose rate is calculated by means of the conversion factor0.7 [46] and the quality factor of gamma radiation is equalto 1, the annual effective dose equivalent caused byterrestrial gamma radiation is given by the relationship:
1 pGy s"1 = 2.21 10"2 mSv a"1 (6.1)The IRCP has recommended 1 mSv a"1 as the limit on the
annual effective dose equivalent from sources other thannatural radiation. A recent ICRP report recommended thelimitation of that component of the dose absorbed from thenatural radiation environment when it can be reduced [22].
Standardized radioactivity maps denoted in units of airdose rate can be used for the assessment of environmentalradioactivity and for the delineation of areas of greaterradiation risk in a country. For most rocks and soils thecontribution of natural terrestrial radioactivity to annualeffective dose equivalent is less than 0.5 mSv a"1 but
42

>0 !00
Avtiägt radiation doit equivalent (rem) per perjon
2 Sv200
Figure 6.1(A): Simplified graph showing the health effectsresulting from radiation. (After IAEA [44]).
Figure 6.1(B): Portion of Figure 6.1(A), enlarged.
levels up to 2 mSv a"1 are frequent. In exceptional casesterrestrial radioactivity causes effective dose equivalentsof 5 to 10 mSv a"1. Examples of the evaluation ofenvironmental radioactivity have been published in Canadaand Sweden [12], [45], Distinct regional radioactivity wasdetermined in the Variscan and Alpine Systems inCzechoslovakia [48] with values of air dose rate of 19.4and 13.9 pGy s"1 respectively with an average value of 17.0pGy s"1. Similar data on air dose rate have been publishedfor 24 countries [46]. Examination of air dose rate mapsalong with regional and local gamma ray spectrometry mapsshowing uranium concentration, enables the recognition ofareas of increased radiation and radon risks.
43

Maps of the natural radiation environment also serve asa basis for comparison in the event of a nuclear accident.Repeated measurements give information on the decrease ofradiation to original levels with time following such anaccident.
If the data are of a quality sufficient to permit theproduction of concentration maps of the individualradioéléments, either directly, or after back calibrationfollowing the procedures outlined in this manual, their usein the fields of the earth sciences are much increased.With this in view the International Geological CorrelationProgramme (IGCP)/UNESCO Project 259, "InternationalGeochemical Mapping" has recently been launched. Thepurpose of the project is to encourage and facilitate thecompilation of an international series of systematicsurficial geochemical maps by national/internationalorganizations based on the most appropriate types of samplematerial. It is expected that the project will provideevidence of the extent to which different portions of theearth's crust are characterised by distinctive geochemicalassemblages and patterns. In conjunction with othergeological/geophysical evidence the data will assist incorrelating areas separated through past plate tectonicdisplacements.The maps will show abundance levels, delineate regional
trends and geochemical provinces, and permit therecognition of large scale anomalous features. They willcompliment existing international geological andgeophysical map series, and will be published at scalessuitable for direct comparison. The International AtomicEnergy Agency has assumed special responsibility for theRadioelement Geochemical Mapping subprogramme.Radioelement maps contain a wealth of information of use
in mineral exploration for a number of commodities,including molybdenum, tungsten and gold. The potassiumalteration that frequently accompanies certain types ofcopper mineralization is often clearly demarcate onpotassium distribution maps obtained through airborne gammaray spectrometer surveys. Geologists carrying outgeological mapping have learned the value of combining theinformation contained on radioélément maps with themagnetic maps they have long used. As with othergeochemical element distribution maps the radioélément mapswhen prepared on a regional, continental or global scale,frequently depict major earth scale structural and tectonicfeatures not seen in any other way.
44

REFERENCES
[I] ADAMS, J.A.S., and LOWDER, W.M., editors, 1964: TheNatural Radiation Environment: University of ChicagoPress, Illinois, 1069 p.
[2] ADAMS, J.A.S., LOWDER, W.M., and GESELL, T.F.,editors, 1975: The Natural Radiation Environment II,International Symposium on the Natural RadiationEnvironment, 2nd, Houston, Tex., August 7-11, 1972,proc. v. 1: U.S. Energy Research and DevelopmentAdministration CONF-720805-P1, Springfield, VA,NTIS, 455 p.
[3] ADAMS, J.A.S., LOWDER, W.M., and GESELL, T.F.,editors, 1975: The Natural Radiation Environment II,International Symposium on the Natural RadiationEnvironment, 2nd, Houston, Tex., August 7-11, 1972,proc. v. 2: U.S. Energy Research and DevelopmentAdministration CONF-720805-P2, Springfield, VA,NTIS, 502 p.
[4] GESELL, T.F., and LOWDER, W.M., editors, 1980:Natural Radiation Environment III: U.S. Departmentof Energy CONF-780422, Volumes I and 2, Springfield,VA, NTIS.
[5] DARNLEY, A.G. et al., 1986: Radioactivity Map ofCanada, Map 1600A
[6] ADAMS, J.A.S., and GASPARINI, P., 1970: Gamma RaySpectrometry of Rocks, Elsevier, Holland.
[7] KOGAN, R.M., NAZAROV, I.M., and FRIDMAN, Sh.D, 1971:Gamma Spectrometry of Natural Environments andFormations. Israel Programme for ScientificTranslations.
[8] UNSCEAR United Nations Scientific Committee on theEffects of Atomic Radiation, 1982: IonizingRadiation: Sources and Biological Effects.
[9] SWEDJENARK, G., 1980: Radon in Dwellings in Sweden.In CONF 780422.
[10] KILLEEN, P.G., 1979: Gamma Ray Spectrometric MethodsIn Uranium Exploration - Application andInterpretation. Economic Geology Report 31,Geological Survey of Canada.
[II] WILSON, M.R., and AKERBLOM, G., 1980: UraniumEnriched Granites in Sweden. Rapporter ochMeddelanden 19, Geological Survey of Sweden.
[12] GRASTY, R.L., CARSON, J.M., CHARBONNEAU, B.W.,HOLMAN, P.B., 1984: Natural Background Radiation inCanada. Geol. Surv.Can. Bull. 360, 39 p.
45
[13] ANDERSSON, P., CLAVENSJOE, B. , and AKERBLOM, G,1983: The Effect of the Ground on the Concentrationof Radon and Gamma Radiation Indoors. Report R9:1983, BFR (in Swedish)
[14] GILLBERG-WIKMAN, M., 1983: The Geochemical Behaviourof Protaktinium-231 and Its Chosen GeochemicalAnalogue Thorium in the Biosphere. 8KB TechnicalReport 83-75.
[15] KAUFMAN, A., 1969: The 232Th Concentration ofSurface Ocean Water. Acta Geochem. 33.
[16] LEMMELAE, H., 1984: Ulkoisen Taustas/teilynKartoitus Suomessa. Raportti STUK-B-VALO 32,S/teilyturvakeskus (in Finnish).
[17] PFEISTER, H, and PAULY, H, 1980: External RadiationExposure due to Natural Radionuclides in PhosphateFertilizers in the Federal Republic of Germany,p-447-467 in Seminar on the Radiological Burden ofMan from Natural Radioactivity in the Countries ofthe European Communities. CEC Report V/2408/80.
[18] LINDEN, A., and MELANDER, H., 1986: AirborneMeasurement in Sweden of the Radioactive Falloutafter the Nuclear Reactor Accident in Chernobyl,USSR. Preliminary Report SCAB TFRAP 8606.
[19] AKERBLOM, G., 1987: Investigation and Mapping ofRadon Risk Areas, in Wolff F.C.: Proceedings of theInternational Symposium "Geological Mapping inService of Environmental Planning", 6-9 August1986.
[20] LOVBORG, L. and KIRKEGAARD, P., 1975: NumericalEvaluation of the Natural Gamma Radiation Field atAerial Survey Heights. Riso Report 317.
[21] UNSCEAR, United Nations Scientific Committee on theEffects of Atomic Radiation, 1977: Sources andEffects of Ionizing Radiation.
[22] ICRP, 1984: Principles for Limiting Exposure of thePublic to Natural Sources of Radiation. Annals ofthe ICRP, Vol.14, No.l, 8 p.
[23] International Atomic Energy Agency: RecommendedInstrumentation for Uranium and Thorium Exploration,Technical Report Series No.158, 1974:STI/DOC/10/158, IAEA Vienna.
[24] International Atomic Energy Agency: Gamma RaySurveys in Uranium Exploration, Technical ReportSeries No.186, 1979: STI/DOC/10/186, IAEA Vienna,90 p.
46

[25] International Atomic Energy Agency: RadiometrieReporting Methods and Calibration in uraniumExploration, Technical Report Series No.174, 1976:STI/DOC/10/174, IAEA Vienna, 57 p.
[26] International Atomic Energy Agency: Construction andUse of Calibration Facilities for Radiometrie FieldEquipment, Technical Report Series No.309, 1989:STI/DOC/10/309, IAEA Vienna, 86 p.
[27] LOVBORG, L., 1984: The Calibration of Portable andAirborne Gamma Ray Spectrometers - Theory, Problems,and Facilities. Riso-M-2456, 207 p.
[28] GRASTY R.L., 1976: A Calibration Procedure for anAirborne Gamma Ray Spectrometer. Geol. Surv. Canada,Paper 76-16.
[29] GRASTY, R.L., 1987: The Design, Construction andApplication of Airborne Gamma Ray SpectrometerCalibration Pads - Thailand. Geol. Surv. CanadaPaper 87-10, 34 p.
[30] DARNLEY, A.G., 1973: Airborne Gamma Ray SurveyTechniques - Present and Future, in UraniumExploration Methods, STI/PUB/334, IAEA Vienna,67-108
[31] BECK, H.L., DECAMPO, J., GOGOLAK,. C. , 1972: In-SituGe (Li) and Nal(Tl) Gamma Ray Spectrometry. US AECNew York, Health and Safety Laboratory Report,HASL-258
[32] LOVBORG, L., KIRKEGAARD, P., 1974: Response of 3"x3"Nal(Tl) Detectors to Terrestrial Gamma Radiation.Nuclear Instruments and Methods, 121, pp. 239 - 251
[33] EWBANK, W.B., 1980: Status of Transactinium NuclearData in the Evaluated Nuclear Structure Data File.IAEA - TECDOC-232, IAEA, Vienna, pp. 109-141
[34] International Atomic Energy Agency: 1975: AirborneGamma Ray Spectrometry Prospection of Nuclear RawMaterials. Technical Assistance Report No.1038,IAEA, Vienna, 22 p.
[35] MATOLIN, M., 1987: Determination of TechnicalParameters of CSUP Calibration Facility atBratkovice near Pribram Faculty of Science Report,Prague, 81 p. (in Czech).
[36] NORWINE, J.R., HANSEN, D.J., SAUNDERS, D.F.,GALBRAITH, J.H., 1979: Near Surface Moisture andBiomass Influences on the Reliability of AerialRadiometrie Surveys as a Measure of NaturalRadioelement Concentrations. TI Inc., ReportGJBX-136 80, Dallas, 304 p.
47

[37] RUBIN, R.M., PRICE, J., WELLS, M.B., 1979: Effectsof Vegetation on the Energy and Angular Distributionof Uranium Daughter Gamma Rays at an Altitude of121.9 meters. Radiation Res. Associates, ReportGJBX-55 80, Forth Worth, 132 p.
[38] RUBIN, R.M., LEGGET, D., WELLS, M.B., 1980: Effectsof Overburden, Biomass and Atmospheric Inversions onEnergy and Angular Distribution of Gamma Rays fromU, K, Th and Airborne Radon Sources. Radiation Res.Associates, Report GJBX-141 81, Fort Worth, 259 p.
[39] DEDACEK et al, 1984: Effect of Wood Biomass onNatural Gamma Radiation in Airborne GeophysicalMeasurements Geofyzika Brno - Uranium SurveyLibérée - Charles University Prague, Report, 40 p.(in Czech).
[40] FILIMONOV, V.V., 1975: Effect of Disturbing Factorson Results of Gamma Ray Spectrometry Prospection,Geofizitcheskaya Apparatura, 57, Nedra, 86 -93 (inRussian),
[41] LOVBORG, L., 1982: Monitoring of Pads in VariousCountries for the Calibration of Portable andAirborne Gamma Ray Spectrometers. Riso-N-02-82, 35P-
[42] LOVBORG, L., CHRISTIANSEN, E.M., BOTTER-JENSEN, L.,KIRKEGAARD, P., 1981: Pad Facility for theCalibration of Gamma Ray Measurements on Rocks.Riso-R-454, 43 p.
[43] MATOLIN, M., DEDACEK, K., 1974: The Causes ofDifferences in the Maps of Total Gamma Ray Activityof Rocks. Acta Universitatis Carolinae-Geologica 4,371 - 383
[44] International Atomic Energy Agency, 1981: Factsabout Low Level Radiation. IAEA, Vienna, 19 p.
[45] AKERBLOM, G., WILSON, C., 1982: Radon-GeologicalAspects of an Environmental Problem. SGU, Uppsala,47 p.
[46] UNSCEAR United Nations Scientific Committee on theEffects of Atomic Radiation, 1988: Exposure fromNatural Sources of Radiation.
[47] ZABADAL, S., 1986: Methodology of processing ofairborne geophysical measurements. Thesis, Facultyof Science, Charles University, Prague, 82 p. (inCzech).
[48] MATOLIN, M. , PLUSKAL, O., RENE, M., 1981: UraniumMineralization in the Bohemian Massif and itsExploration, in Uranium Exploration Case Histories,STI/PUB/584, IAEA Vienna, pp. 389 - 396.
48
in<onoàO)