
The Use of eConsults for Cardiology Referrals A Policy … introduction Overview of the University...
77
The Use of eConsults for Cardiology Referrals: A Policy Report for the University of Connecticut-Medicaid Partnership August 2014 Prepared by:
Transcript of The Use of eConsults for Cardiology Referrals A Policy … introduction Overview of the University...
The Use of eConsults for Cardiology Referrals: A Policy Report for the University of Connecticut-Medicaid Partnership
August 2014
Prepared by:

The Center for Public Health and Health Policy, a research and programmatic center founded in 2004, integrates public health knowledge across the University of Connecticut campuses and leads initiatives in public health research, health policy research, health data analysis, health information technology, community engagement, service learning, and houses several referral services.
© August 2014, UConn Health.
Recommended citation: UConn Health, Center for Public Health and Health Policy; 2014. The Use of eConsults for Cardiology Referrals: A Policy Report for the University of Connecticut-Medicaid Partnership. Farmington, CT

ExEcutivE Summary
Access to outpatient specialist medical care has long been a concern for the Connecticut Medicaid program. The limited number of specialty practitioners accepting new patients with Medicaid coverage and the long wait times when appointments are scheduled continue to be described in legislative reports, by health professionals, and mystery shopper surveys. In addition, lack of access to specialty care is viewed by some as a contributing factor to the high use of emergency department care by Medicaid participants. In its 2014 report on emergency department care, the Program Review and Investigation Committee of the Connecticut General Assembly recommended that the General Assembly require the Department of Social Services (DSS) to undertake a demonstration project in telehealth or telemedicine at a federally qualified health center (FQHC). Such a project had been authorized in 2012 by Public Act 12-109, but not implemented.
Cardiology eConsults is a telehealth system in which primary care providers (PCPs) consult with a specialist reviewer electronically via “eConsults” prior to referring an adult patient to a cardiologist for non-urgent care. The use of cardiology eConsults is intended to improve access to specialist care. In Connecticut, interest in this approach has grown due to promising results seen in an eConsults pilot program conducted by the Community Health Center, Inc. (CHC, Inc.) for cardiology referrals by PCPs in their group. Within the past year, the use of eConsults for specialty referrals, in general, has been proposed as part of health care delivery system reform under the State Innovation Models Initiative of the Centers for Medicare and Medicaid Services. DSS is now considering use of eConsults for PCP-to-specialist referrals within the Medicaid program.
Against this background, DSS entered into the first collaborative project agreement with the University of Connecticut Health Center under the recently established UConn-Medicaid Partnership. This report, done pursuant to this project agreement, presents the results of a study of the potential impact on access, cost, and quality of care of eConsults for cardiology care. The University of Connecticut Health Center’s Center for Public Health and Health Policy developed the Cardiology eConsults Simulation Model (CeSM), which is designed to predict the impact on health care utilization, quality of care, and cost of a telehealth system in which PCPs use eConsults prior to referring adult patients with Medicaid coverage to a cardiologist for a face-to-face (F2F) appointment. The CeSM model compares such an approach to the “usual care approach” in which PCPs refer patients to cardiologist specialists for F2F appointments and assessments without prior consultation. The model uses data from the recent CHC, Inc.’s cardiology eConsults pilot program and Medicaid data. An initial set of assumed values based on this data has been used to produce the “Test Scenario” results which are described in this report. CeSM can also be programmed to run different scenarios by selecting different values for the eleven model inputs. Medicaid data was also used to perform a second study related to the use of eConsults to reduce preventable hospitalizations for ambulatory sensitive cardiovascular conditions (hypertension, heart failure and angina without a procedure).
concluSionS
Results from our review of the available literature, our Test Scenario comparing cost and quality measures for Medicaid patients receiving traditional care versus eConsults for cardiology referrals, and analysis of Medicaid data on potentially preventable hospitalizations for three cardiac conditions

led to the following conclusions:
� Results from the Test Scenario suggest improvement in the timeliness of care under cardiology eConsults.
– 24 percent more patients with cardiology referrals would have their case reviewed within 48 hours by a cardiologist reviewer than would have had their case reviewed at a F2F appointment with a cardiologist under Usual Care.
� Based on the assumptions used in the CeSM Test Scenario, eConsults will increase Medicaid spending if used for both new and established cardiology patient referrals.
– There would be a total net increase in spending of $17.39 on average per referral, or $8,693 per 500 cardiology referrals.
� The potential cost savings associated with a reduction in preventable hospitalizations for cardiac conditions is much greater than the cost savings associated with reduced office visits and diagnostic testing. At this time, however, there are no data available to assess whether use of cardiology eConsults can reduce preventable cardiovascular hospitalizations among Medicaid patients.
� Limitations of this analysis include the lack of evidence regarding the clinical comparability of cardiology eConsults to traditional appointments and the long-term health outcomes for patients receiving cardiology eConsults. In addition, the results obtained at CHC, Inc. may not be generalizable to other care settings.
rEcommEndationS
We recommend that DSS explore additional scenarios using the CeSM to see how changes in assumptions related to cardiology eConsults result in different projected outcomes. In addition, DSS should pursue further research to assess whether the results from CHC, Inc. cardiology eConsults program are generalizable to other FQHCs. It should also to assess the potential for eConsults to improve care and reduce hospital costs among Connecticut Medicaid patients. Research efforts could capitalize on the New England eConsults Network Project, which entails a larger pilot program of eConsults among five specialties over the next two years under a grant from the Jesse B. Cox Charitable Trust Fund to CHC, Inc.

This report was prepared by the Center for Public Health and Health Policy, UConn Health
Contributors to the report included:
Ann Ferris, PhD, Director Center for Public Health and Health Policy, UConn Health; Professor of Medicine, Public Health and Nutritional Sciences, UConn Health and University of Connecticut
Robert Aseltine, Jr., PhD, Deputy Director Center for Public Health and Health Policy, UConn Health; Professor and Interim Chair, Division of Behavioral Sciences and Community Health, UConn Health
Erin Havens, MPA, MPH, Planning Specialist Center for Public Health and Health Policy, UConn Health
Eric Horan, JD, MPA, Research Assistant III Center for Public Health and Health Policy, UConn Health
Elizabeth Schilling, PhD, Research Associate II Center for Public Health and Health Policy, UConn Health
Dorothy Wakefield, MS, Research Associate II Center for Public Health and Health Policy, UConn Health
Laurel Buchanan, MS, Research Associate I Center for Public Health and Health Policy, UConn Health
Mary Eberle, JD, Senior Policy Analyst Center for Public Health and Health Policy UConn Health
Timothy Purtell, MPA, Health Policy Intern Center for Public Health and Health Policy, UConn Health
Marcos Quispe, BA, Health Policy Intern Center for Public Health and Health Policy, UConn Health
Kathy McDermott, University Director Center for Public Health and Health Policy, UConn Health
Connie Cantor, Publicity/Marketing Manager Center for Public Health and Health Policy, UConn
Mark Robbins, PhD Professor & Department Head, Department of Public Policy, UConn
Christopher Jones, Ph.D. Assistant Professor of Surgery and Economics Director, Global Health Economics Unit, University of Vermont College of Medicine; Member, European Centre for International Political Economy; Principal, ForMyOdds.COM
Luca Paolo Fernandez, MPA candidate, University of Vermont, Department of Community Development and Applied Economics
Christopher Pickett, MD, Co-Director of Electrophysiology, Medical Director Cardiac Stepdown Unit, Pat and Jim Calhoun Cardiology Center, UConn Health
Allison Patavino, BS, Coding Manager Health Information Management Department, UConn Health
Mary Ann Stemm, BS, Reimbursement Analyst 2, University Physician Patient Accounts, UConn Health
Robert W. Zavoski, MD, MPH, Medical Director, Connecticut Department of Social Services
For further information regarding this report, please contact Dr. Robert Aseltine. ([email protected])

tablE of contEntS
Introduction . . . . . . . . . . . . . . . . . . . . . . . . . . . . . . . . . . . . . . . . . . . . . . . . . . . . . . . . . . . . 1
Background . . . . . . . . . . . . . . . . . . . . . . . . . . . . . . . . . . . . . . . . . . . . . . . . . . . . . . . . . . . . 2
Policy Context . . . . . . . . . . . . . . . . . . . . . . . . . . . . . . . . . . . . . . . . . . . . . . . . . . . . . . . . . . 5
Clinical Guidelines and Effectiveness Review . . . . . . . . . . . . . . . . . . . . . . . . . . . . . . . . . .12
Study One: Cardiology eConsults Simulation Model . . . . . . . . . . . . . . . . . . . . . . . . . . . . 22 Methods . . . . . . . . . . . . . . . . . . . . . . . . . . . . . . . . . . . . . . . . . . . . . . . . . . . . . . . 22 Findings . . . . . . . . . . . . . . . . . . . . . . . . . . . . . . . . . . . . . . . . . . . . . . . . . . . . . . 29
Study Two: Cost of Potentially Preventable Cardiovascular Hospitalizations . . . . . . . . . . 40 Methods . . . . . . . . . . . . . . . . . . . . . . . . . . . . . . . . . . . . . . . . . . . . . . . . . . . . . . . 40 Findings . . . . . . . . . . . . . . . . . . . . . . . . . . . . . . . . . . . . . . . . . . . . . . . . . . . . . . 41
Conclusions and Recommendations . . . . . . . . . . . . . . . . . . . . . . . . . . . . . . . . . . . . . . . . 43
Technical Appendix for Study One . . . . . . . . . . . . . . . . . . . . . . . . . . . . . . . . . . . . . . . . . . T-1

1
introduction
Overview of the University of Connecticut-Medicaid PartnershipThe UConn-Medicaid Partnership seeks to conduct research related to the Medicaid program that maximizes well-being, health care quality and value for Connecticut residents served by Connecticut’s Department of Social Services (DSS) in a manner that optimizes public resources and supports community development and economic prosperity. DSS, which houses Connecticut’s Medicaid program, the University of Connecticut (UConn), and the University of Connecticut Health Center (UConn Health) entered into a global inter-agency memorandum of understanding establishing the UConn-Medicaid Partnership in 2013. The Partnership allows individual projects to be executed by DSS and the University as needed using collaborative project agreements. This report, prepared by UConn Health’s Center for Public Health and Health Policy, is pursuant to the first collaborative project agreement under the UConn-Medicaid Partnership.
Scope of Policy ReportThis policy report examines the potential impact on costs, utilization, and quality of care of a telehealth system in which primary care providers (PCPs) use electronic consultation, “eConsults,” when referring adult patients with Medicaid coverage to a cardiologist for non-urgent care. The use of eConsults, in general, is intended to improve access to specialists, and to improve the quality of care coordination between PCPs and specialists. In Connecticut, the use of eConsults for specialty referrals is being considered by DSS and has been proposed as part of multi-payer payment and health care delivery system reform for the Centers for Medicare and Medicaid Services’ State Innovation Models Initiative. Interest in the eConsults approach stems from promising results shown for a cardiology eConsults pilot project1 at Connecticut’s largest multi-site federally qualified health center (FQHC), Community Health Center, Inc.2 One of the recommendations of a 2014 report by the Legislative Program Review and Investigations Committee of the Connecticut General Assembly was for the Legislature to mandate that DSS undertake a demonstration project in telehealth or telemedicine at federally qualified health centers (FQHCs) in Connecticut.3
Components of the Policy ReportThis report consists of six sections: Background, Policy Context, Clinical Guidelines and Evidence Review, Study One Cardiology eConsults Simulation Model: Methods and Findings, Study Two Costs of Potentially Preventative Cardiovascular Hospitalizations: Methods and Findings, and Conclusions and Recommendations. The first three sections set a backdrop for understanding the use of eConsults and similar interventions, whereas the remaining sections focus on evaluating the potential impact of adopting eConsults for cardiology referrals. In addition to these six sections, a technical appendix, located at the end of the report, further describes how Connecticut Medicaid data was utilized to develop the simulation model. Results from the Medicaid data analysis are included in Section III of the technical appendix.
1 Anderson, D.R., Olaylwola, J.N, Aseltine, R., Zlateva, I, Jepeal, N. (2014, June). Implementation of an Electronic Consult Platform to Increase Specialty Care Access. Paper presented at the Academy Health Annual Research Meeting, Weitzman Institute, Middletown, Connecticut, USA.
2 According to the Bureau of Primary Care, HRSA, CHC, Inc., had 80120 patients in 2012, more than any other FQHC in Connecticut, available at: http://bphc.hrsa.gov/uds/datacenter.aspx?q=d&state=CT#glist (accessed August 13, 2014).
3 Office of Program Review and Investigations (2014). Hospital Emergency Department Use and Its Impact on the State Medicaid Budget. (Prepared for the Legislative Program Review and investigations Committee, Connecticut General Assembly): Hartford, CT.
2
background
Telehealth and TelemedicineTelehealth is the application of telecommunication technologies and electronic information to support long-distance clinical health care and other health care-related services such as education or training for patients and professionals.4 Telemedicine refers to a subset of telehealth applications and is limited to the provision of clinical care. Telehealth and telemedicine involve the same underlying technologies, and the terms are sometimes used interchangeably.5 Telehealth strategies integrate a heterogeneous collection of clinical practices, technologies and organizational arrangements. The primary technologies used for telehealth include the Internet, land and wireless communication, store-and-forward imaging, streaming media, and live video conferencing. The technologies used may be set up to allow “synchronous” two-way discussion in real time or “asynchronous” communication where information is sent and replies may be returned at a later time. This synchronous and asynchronous communication can occur between providers, patients and providers, or both.
Technologies used for telehealth facilitate delivery of health care even when distance separates health professionals from each other or their patients. This makes telehealth a highly discussed topic when considering strategies for improving health care system capacity and access to care, especially for at-risk populations and populations living in areas with a shortage of health professionals. In 2012, it was suggested that the decreasing cost of telecommunication technologies coupled with the increased ease of use make these technologies even more viable than they were five or ten years ago.6
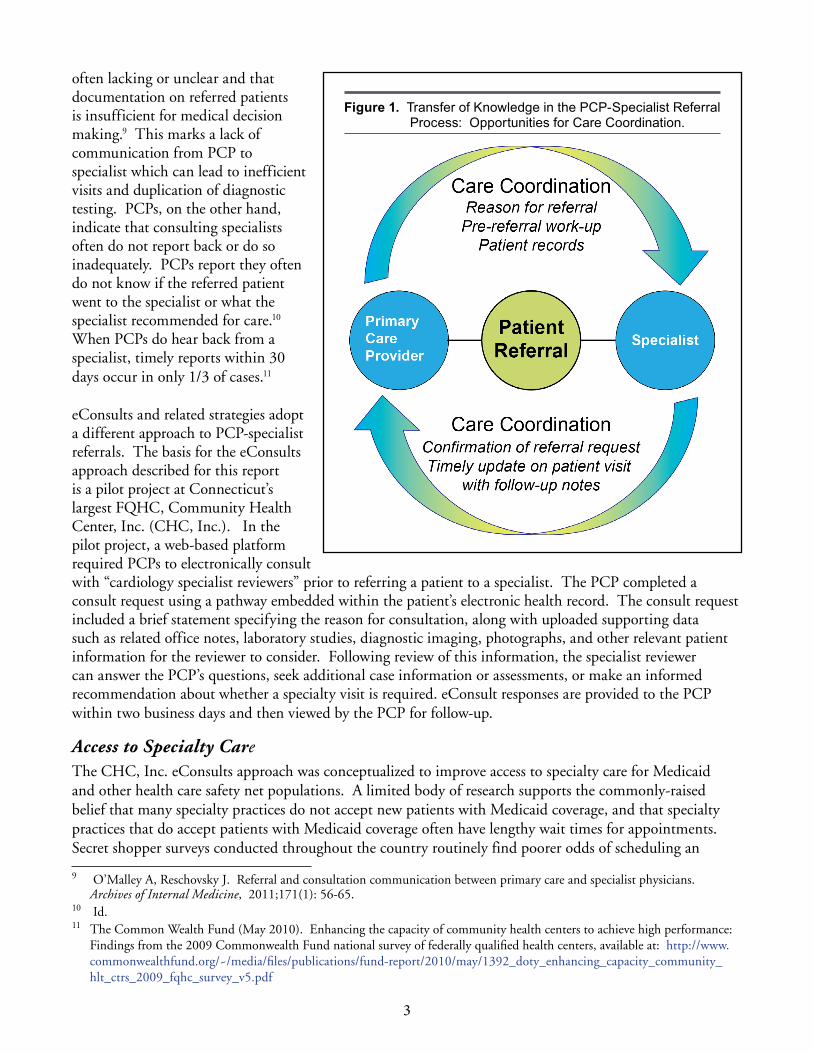
Electronic Consultations “eConsults”Telehealth strategies, including eConsults, have been developed in an attempt to resolve perceived shortcomings in the PCP-specialist referral process and to address specialist shortages, primarily for the Medicaid population. Currently, PCP-specialist referrals are usually sent from the PCP office to the specialist’s office, often by fax, which may be handwritten. If successfully received and the specialist accepts a patient’s payment method, the specialist’s office then schedules an in-office appointment. Commonly described shortcomings in the PCP-specialist referral process include: the challenges of successfully coordinating integrated patient care involving primary and specialty care settings, difficulty securing specialty care appointments for patients with Medicaid coverage, and patients not showing up for scheduled appointments. A recent literature review identified several inadequacies in the current specialty care referral process, including PCPs not knowing when to refer for specialty care and gaps in communication between the referring PCP and specialist.7 Based on available research, Figure 1 illustrates transfer of knowledge or communication gaps and care coordination opportunities within the PCP-specialist referral process.8
As shown in Figure 1, specialists report that the reason for the referral and other clinical question(s) are
4 “Telehealth.” Health Research and Services Administration (HRSA), Rural Health, available at: http://www.hrsa.gov/ruralhealth/about/telehealth/ (accessed August 13, 2014).
5 “What is telehealth? How is telehealth different from telemedicine?” available at: http://www.healthit.gov/providers-professionals/faqs/what-telehealth-how-telehealth-different-telemedicine (accessed April 1, 2014).
6 The Institute of Medicine. “The Role of Telehealth in an Evolving Health Care Environment: Workshop Summary.” Washington DC; 2012 The National Academies Press, p. 7.
7 Mehrota A, Forrest C, Lin C. Dropping the baton: specialty referrals in the United States. The Milbank Quarterly, 2011;89(1): 39-68.
8 O’Malley A, Reschovsky J. Referral and consultation communication between primary care and specialist physicians. Archives of Internal Medicine, 2011;171(1): 56-65.
3
often lacking or unclear and that documentation on referred patients is insufficient for medical decision making.9 This marks a lack of communication from PCP to specialist which can lead to inefficient visits and duplication of diagnostic testing. PCPs, on the other hand, indicate that consulting specialists often do not report back or do so inadequately. PCPs report they often do not know if the referred patient went to the specialist or what the specialist recommended for care.10 When PCPs do hear back from a specialist, timely reports within 30 days occur in only 1/3 of cases.11
eConsults and related strategies adopt a different approach to PCP-specialist referrals. The basis for the eConsults approach described for this report is a pilot project at Connecticut’s largest FQHC, Community Health Center, Inc. (CHC, Inc.). In the pilot project, a web-based platform required PCPs to electronically consult with “cardiology specialist reviewers” prior to referring a patient to a specialist. The PCP completed a consult request using a pathway embedded within the patient’s electronic health record. The consult request included a brief statement specifying the reason for consultation, along with uploaded supporting data such as related office notes, laboratory studies, diagnostic imaging, photographs, and other relevant patient information for the reviewer to consider. Following review of this information, the specialist reviewer can answer the PCP’s questions, seek additional case information or assessments, or make an informed recommendation about whether a specialty visit is required. eConsult responses are provided to the PCP within two business days and then viewed by the PCP for follow-up.
Access to Specialty Care The CHC, Inc. eConsults approach was conceptualized to improve access to specialty care for Medicaid and other health care safety net populations. A limited body of research supports the commonly-raised belief that many specialty practices do not accept new patients with Medicaid coverage, and that specialty practices that do accept patients with Medicaid coverage often have lengthy wait times for appointments. Secret shopper surveys conducted throughout the country routinely find poorer odds of scheduling an
9 O’Malley A, Reschovsky J. Referral and consultation communication between primary care and specialist physicians. Archives of Internal Medicine, 2011;171(1): 56-65.
10 Id. 11 The Common Wealth Fund (May 2010). Enhancing the capacity of community health centers to achieve high performance:
Findings from the 2009 Commonwealth Fund national survey of federally qualified health centers, available at: http://www.commonwealthfund.org/~/media/files/publications/fund-report/2010/may/1392_doty_enhancing_capacity_community_hlt_ctrs_2009_fqhc_survey_v5.pdf
Figure 1. Transfer of Knowledge in the PCP-Specialist Referral Process: Opportunities for Care Coordination .
4
appointment and greater wait times for scheduled Medicaid patients. Published survey results exist for orthopedic care of adults12,13 and children14, post emergency department ambulatory care follow-up visits, 15, 16, 17 dermatology for adults18, 19 and children20, urologic care for children with cryptorchidism21, and specialty care for children. 22 Other published research findings based on provider and patient surveys also suggest a problem with access to specialty care for patients with Medicaid coverage.23,24, 25
In Connecticut, these issues have been described in legislative reports, by health professionals, and previous mystery shopper surveys. According to a report issued by the Legislative Program Review and Investigations Committee of the Connecticut General Assembly in 2014, lack of access to specialists is considered one of the ongoing problems in Medicaid and there are questions about the capacity to provide Medicaid participants specialty health care in community settings.26 Related public hearing testimony from the Connecticut College of Emergency Physicians indicated that few options exist for outpatient specialty care for Medicaid patients, and that, often, the only possibility of care in the state is one of two medical school affiliated clinics, with “months-long wait times for appointments.”27
The search conducted for this report identified few examples that quantify specialty care access for Medicaid patients in Connecticut: a physician survey and secret shopper surveys. The physician survey, conducted in 2011, found that 36 percent of attending physicians at seventeen teaching clinics in Connecticut reported
12 Draeger RW, Patterson BM, Olsson EC, Schaffer A, Patterson JM. The influence of patient insurance status on access to outpatient orthopedic care for flexor tendon lacerations. J Hand Surg Am. 2014;39(3):527-33.
13 Patterson BM, Spang JT, Draeger RW, Olsson EC, Creighton RA, Kamath GV. Access to outpatient care for adult rotator cuff patients with private insurance versus Medicaid in North Carolina. J Shoulder Elbow Surg. 2013;22(12):1623-7.
14 Pierce TR, Mehlman CT, Talmai J, Skaggs D. Access to care for the adolescent anterior cruciate ligament with Medicaid versus private insurance. J Pediatr Orthop. 2012;32(3):245-8.
15 Asplin BR, Rhodes KV, Levy H, Lurie N, Crain AL, Carlin BP, Kellermann AL. Insurance status and access to urgent ambulatory care follow-up appointments. JAMA. 2005; 294(1):1248-54.
16 Blanchard J, Ogle K, Thomas O, Lung D, Asplin B, Lurie N. Access to appointments based on insurance status in Washington D.C. Journal of Health Care for the Poor and Underserved. 2008;19(3):687-96.
17 Rhodes KV, Vieth TL, Kushner H, Levy H, Asplin BR. Referral without access: for psychiatric services, wait for the beep. Annals of Emergency Medicine. 2009;54(2):272-278.
18 Alghothani L, Jacks SK, Horst AV, Zirwas MJ. Arch Dermatol. 2012;148(8):956-95719 Resneck J Jr, Pletcher MJ, Lozano N. Medicare, Medicaid, and access to dermatologists: the effect of patient insurance on
appointment and wait times. J Am Acad Dermatol. 2004;50(1):85-92.20 Chaudhry SB, Armbrecht ES, Shin Y, Matula S, Caffrey C, Varade R, Jones L, Siegfried E. Pediatric access to dermatologists:
Medicaid versus private insurance. J Am Acad Dermatol. 2013;68(5):38-748. 21 Hwang AH, Hwang MM, Xie HW, Hardy Be, Skaggs DL. Access to urologic care for children in California: Medicaid versus
private insurance. Urology. 2005;66(1): 170-3.22 Bisgaier J, Rhodes KV. Auditing access to specialty care for children with public insurance. N Engl J Med.
2011;364(24):2324-33.23 Commonwealth Fund National Survey of Federally Qualified Health Centers, 2009. http://www.commonwealthfund.org/~/
media/files/publications/fund-report/2010/may/1392_doty_enhancing_capacity_community_hlt_ctrs_2009_fqhc_survey_v5.pdf
24 Cook NL, Hicks LS, O’Malley AJ, Keegan T, Guadagnoli E, Landon BE. Access to specialty care and medical services in community health centers. Health Affairs. 2007;26(5):1459-1468.
25 Mortensen K. Access to primary and specialty care and emergency department utilization of Medicaid enrollees needing specialty care. Journal of Health Care for the Poor and Underserved. 2014;25(2):801-813.
26 Office of Program Review and Investigations (2014). Hospital Emergency Department Use and Its Impact on the State Medicaid Budget. (Prepared for the Legislative Program Review and investigations Committee, Connecticut General Assembly): Hartford, CT.
27 Testimony for the Program Review & Investigations Committee. Dr. Karen Jubanyik, President, Connecticut College of Emergency Physicians. http://www.cga.ct.gov/2013/PRIdata/Tmy/2013ZZ-00000-R000926-Karen%20Jubanyik,%20M.D.%20President%20CT%20College%20of%20Emergency%20Physicians-TMY.PDF
5
specialty care for Medicaid patients as “never, rarely, or sometimes” obtained.28, 29 The three types of specialty care most frequently reported as difficult to obtain included neurosurgery, orthopedics, and dermatology. A secret shopper survey of Connecticut gastroenterologists reported that only 46 percent of 93 gastroenterology practices reported Medicaid participation for colorectal screening.30 Older secret shopper studies on specialty care31 and behavioral health services32 for children in Connecticut also found access and service delivery deficiencies.
Policy contExt
CPHHP has not identified a Medicaid policy that explicitly reimburses for the services similar to those provided by a specialist reviewer in Cardiology eConsults. The federal government and various states have, however, begun adopting policies for other types of telehealth applications. The federal Centers for Medicare and Medicaid Services (CMS) has issued some guidance encouraging states to experiment with telehealth applications and has promulgated a few rules for Medicare coverage. A majority of the states have adopted rules, either through statutes or regulations, governing some telehealth applications. Seven of them explicitly reimburse for clinical services delivered through store-and-forward technology. Store-and-forward technology enables asynchronous communication; the message sender and receiver do not have to be communicating at the same time. Store-and-forward technologies allow, among other things, a PCP to send patient information, including written documents, and audio and visual information, to a specialist electronically; the specialist can retrieve that information when convenient. Store-and-forward technology has been used to conduct virtual examinations, that is, the patient information is sent to a distant specialist and the specialist conducts an examination similar in scope to a traditional in-person examination and makes a diagnosis and other care determinations.33 Most of the store-and-forward reimbursement schemes we identified appear to envision virtual examination types of services. Virtual examinations and eConsult reviews are much different in terms of the scope and thoroughness of the specialist assessment, but both rely on similar technologies, and, in some cases, may fit within similar reimbursement schemes. A few of the identified state programs provide reimbursement for physician-to-physician communication. These policies might conceivably cover a specialist reviewer-type service, though we did not locate an example of this. Therefore, the states with store-and-forward coverage policies are examined in some detail.
Federal Medicaid and Medicare Telehealth PoliciesThe Centers for Medicare and Medicaid Services (CMS) do not currently have a policy requiring or preventing reimbursement through Medicaid for the type of review conducted by the Cardiology eConsults specialist reviewer, or for telehealth applications generally. CMS does explicitly invite state Medicaid
28 Grewal, Y.A. et al. Medicaid patients’ access to subspecialty care in Connecticut: teaching clinics questionnaire. Conn Med. 2011;75(8):489-493.
29 Specialty care includes: OB-GYN, psychiatry, general surgery, orthopedics, ENT, CT surgery, vascular surgery, urology, neurosurgery, ophthalmology, cardiology, gastroenterology, pulmonary, rheumatology, nephrology, geriatrics, infectious disease, endocrinology, dermatology, and hematology-oncology.
30 Patel, V.B. et al. Exploring implications of Medicaid participation and wait times for colorectal screening on early detection efforts in Connecticut – a secret-shopper survey. Conn Med. 2013;77(4):197-203.
31 CT Department of Social Services. Mystery Shopper Project. Hartford, CT: DSS, November 2006. http://www.cga.ct.gov/med/council/2006/1117/20061117MINUTES_Council%20Meeting.htm
32 ValueOptions 2010 survey as described in the PRI report.33 Hersh W, Hickam D, Severance S, Dana T, Krages K, Helfand M. (2006) Telemedicine for the Medicare Population:
Update. Evidence Report/Technology Assessment No. 131 (Prepared by the Oregon Evidence-based Practice Center for the Agency for Healthcare Research and Quality, Rockville, MD).
6
programs to experiment with telehealth services.34 When states choose to provide a telehealth service, CMS requires that the relevant health care providers meet usual federal Medicaid standards and that the rate of reimbursement for their services does not exceed the Federal Upper Limits established for in-person delivery of similar services.35
Unlike with Medicaid, CMS has begun promulgating telehealth service delivery and reimbursement rules for Medicare. Medicare’s current telehealth policy focuses on communication directly between a provider and a patient, and does not appear to envision the type of provider-to-provider communication in Cardiology eConsults. Generally, the patient must be in an authorized location when receiving the service (referred to as an “originating site”), the service must be provided by one of six types of providers (collectively called “distant site practitioners”), the service must be approved by Medicare, and, in most instances, the communication between patient and distant site practitioner must be synchronous.36
Medicaid Telehealth Policies in the States. Some state Medicaid programs have begun experimenting with mechanisms to reimburse for various telehealth services. The Center for Telehealth & e-Health Law37 conducted what appears to be the first systematic examination of telehealth coverage policies among the various states, in 2011.38 This report largely consists of copies of relevant statutes, regulations and policy manuals. In 2013 the Center for Connected Health Policy, at the National Telehealth Policy Resource Center, conducted a review of state telehealth reimbursement policies and produced a summary of Medicaid and other coverage in the states.39 This more recent study found that:
� Forty-five states’ Medicaid programs reimburse for some form of live video conferencing;
� Thirteen states’ Medicaid programs offer reimbursement for remote patient monitoring;
� Seven states’ Medicaid programs offer some reimbursement for services delivered through store-and-forward technologies;
� Three states’ Medicaid programs reimburse for all three.
The American Telemedicine Association (ATA), a telemedicine advocacy group, maintains a website that, among other things, tracks state telemedicine policies. In a report released in July 2013, the ATA also stated
34 The different components of CMS are not consistent in their use of the terms “telehealth” and “telemedicine.” We use “telehealth” here because it is the more general term, though the guidance that we have identified from CMS appears to envision clinical care, only.
35 “Telemedicine,” Centers for Medicare and Medicaid (no date), available at: http://www.medicaid.gov/Medicaid-CHIP-Program-Information/By-Topics/Delivery-Systems/Telemedicine.html (accessed April 1, 2014).
36 “Telehealth Services,” Rural Health Fact Sheet Series. Centers for Medicare and Medicaid Services (December, 2012), available at: http://www.cms.gov/Outreach-and-Education/Medicare-Learning-Network-MLN/MLNProducts/downloads/telehealthsrvcsfctsht.pdf (accessed April 1, 2014); see also “Medicare and Medicaid Programs: Hospital outpatient prospective payment and ambulatory surgical center payment systems and quality reporting programs; hospital value-based purchasing program; organ procurement organizations; quality improvement organizations; electronic health records (EHR) incentive program; provider reimbursement determinations and appeals. 78 Federal Register 74826-75200 (December 10, 2013).
37 Robert J. Waters Center for Telehealth & e-Health Law, home page: http://ctel.org/ (accessed April 11, 2014). 38 CTeL 50 State Medicaid Statute Survey Part I (Alabama to Kansas)(2011): http://ctel.org/wp-content/uploads/2011/06/
CTeL-50-State-Medicaid-Statute-Survey-Part-I.pdf; Part II (Kentucky to North Dakota) http://ctel.org/wp-content/uploads/2011/06/CTeL-50-State-Medicaid-Statute-Survey-Part-II.pdf; and Part III (Oklahoma to Wyoming): http://ctel.org/library/research/ (accessed April 11, 2014).
39 Center for Connected Health Policy, The National Telehealth Policy Resource Center, “State Telehealth Laws and Reimbursement Policies: A comprehensive scan of the 50 states and the District of Columbia” http://cchpca.org/sites/default/files/50%20State%20Medicaid%20Update%20Nov.%202013%20-%20Rev.%2012-20.pdf (accessed April 11, 2014).
7
that seven state Medicaid programs reimbursed for store-and-forward telehealth communication either by statute, regulation, or policy.40 The seven states identified were Alaska, Arizona, California, Illinois, Minnesota, Oklahoma, and South Dakota. None of these states’ Medicaid programs explicitly reimburse for the type of patient reviews conducted by the Cardiology eConsults specialist reviewer.
Alaska Alaska’s Medicaid program is part of its Medical Assistance Program, housed within its Department of Health and Social Services.41 The rules governing telehealth services covered by the program are found primarily in Alaska Administrative Code (AAC) Title 7.42 Alaska Medicaid covers telemedicine services provided through store-and-forward systems when the service allows “a consulting provider to obtain information, analyze it, and report back to the referring provider.” Among other services, Medicaid will reimburse for initial visits, follow-up visits, consultations made to confirm a diagnosis, and diagnostic, therapeutic, or interpretive services. The program only reimburses for the professional services rendered through telemedicine, and will not reimburse for the expenses arising from operating the communication system itself.43 The regulations do not specify the types of specialties that are appropriate for telemedicine consultations, but they explicitly exclude services related to nine enumerated service types, such as vision care, personal care, and end stage renal disease care.44 Alaska’s scheme conceivably might cover specialist review-type services. Communication with personnel from Alaska’s Department of Health and Social Services confirmed, however, that no such system currently operates in Alaska.45
Arizona Arizona’s Medicaid program is a part of the Arizona Health Care Cost Containment System (AHCCCS), which is operated by the AHCCCS Administration.46 AHCCCS has a fee-for-service program and a managed care program.47 According to the fee-for-service provider manual, which was updated in April, 2014, the fee-for-service program covers store-and-forward services for seventeen enumerated specialties, including cardiology.48 AHCCCS’s Medical Policy for AHCCCS Covered Services, which indicates that it applies to both fee-for-services and managed care programs, limits coverage of most telehealth services to real time communication.49 This manual, however, was updated most recently in April, 2012, and its provisions, at least
40 American Telemedicine Association, “Store-and-forward Telemedicine” (July 2013), available at: http://www.americantelemed.org/docs/default-source/policy/state-medicaid-best-practice---store-and-forward-telemedicine.pdf?sfvrsn=6 (accessed April 11, 2014).
41 Medicaid, Division of Public Assistance, Alaska Department of Health and Social Services: http://dhss.alaska.gov/dpa/pages/medicaid/default.aspx (accessed April 11, 2014).
42 Telehealth Statutes, Regulations, and Policy: http://dhss.alaska.gov/dph/HealthPlanning/Pages/telehealth/regsandstatutes.aspx (accessed April 11, 2014).
43 Alaskan Administrative Code, vol. 7 section 110.635 (b). 44 Alaskan Administrative Code, vol. 7 section 110.635. (a). 45 Alaska Department of Human and Social Services (personal communication, April 14, 2014)46 AHCCCS, home page, available at: http://www.azahcccs.gov/ (accessed April 4, 2014). 47 “Arizona” in Center for Connected Health Policy, The National Telehealth Policy Resource Center, “State Telehealth Laws
and Reimbursement Policies: A comprehensive scan of the 50 states and the District of Columbia” http://cchpca.org/sites/default/files/50%20State%20Medicaid%20Update%20Nov.%202013%20-%20Rev.%2012-20.pdf (accessed April 11, 2014).
48 AHCCS, Fee-for-Service Provider Manual, Chapter 10; Professional and Technical Services, p. 41-42 (updated April 7, 2014) http://www.azahcccs.gov/commercial/Downloads/FFSProviderManual/FFS_Chap10.pdf ( accessed April 11, 2014).
49 Medical Policy for AHCCCS covered Services, Chapter 300 (updated April 1, 2012): http://www.azahcccs.gov/shared/Downloads/MedicalPolicyManual/Chap300.pdf (accessed April 11, 2014).
8
for fee-for-service, may be superseded by the more recent fee-for-service manual.50 Communication with personnel at AHCCCS confirmed that there currently are no referral systems like Cardiology eConsults that are reimbursed by the Arizona’s Medicaid program.51
California California’s Medicaid program is referred to as Medi-Cal, which is housed in the
California Department of Health Care Services.52 Medi-Cal reimburses for some telehealth services and has dedicated a section of its provider’s manual to the topic.53 Medi-Cal explicitly provides reimbursement for direct, synchronous, specialist-to-patient telemedicine examinations for many types of services. It also reimburses for asynchronous patient and specialist communication for dermatology and ophthalmology services.
Illinois The Medicaid program in Illinois is part of that state’s Medical Assistance Program, which is operated by the Division of Medical Programs, Department of Healthcare and Family Services.54
The Illinois practitioner’s handbook states that the Medical Assistance Program covers store-and-forward telehealth services.55 The handbook divides telehealth into telemedicine and telepsychiatry. The Upper Midwest Telehealth Resource Center produced a summary of Illinois Medicaid telehealth reimbursement policies in 2013. This summary lists a number of specific CPT codes that may be modified for the provision of telehealth services, including consultation codes 99241 through 99255.56
Minnesota Minnesota’s Medicaid program is called Medical Assistance, and is part of a larger collection of health-related public-funded programs collectively referred to as Minnesota Health Care Programs (MHCP).57 The Minnesota Medical Assistance program is authorized to cover some telehealth services by statute. Minnesota statutes section 256B.0625, subdivision 3b, provides, in relevant part:
“Medical assistance covers telemedicine consultations. Telemedicine consultations must be made via two-way, interactive video or store-and-forward technology. Store-and-forward technology includes telemedicine consultations that do not occur in real time via synchronous transmissions, and that do not require a face-to-face encounter with the patient for all or any part of any such telemedicine consultation…Telemedicine consultations
50 The Center for Connected Health Policy appears to make this assumption. 51 AHCCCS (personal communication, 4/29/2014) 52 Medi-Cal, Department of Health Care Services, http://www.medi-cal.ca.gov/ (accessed April 11, 2014). 53 The Medi-Cal provider’s manual is available in a word document through the Medi-Cal telehealth information page: http://
www.dhcs.ca.gov/provgovpart/Pages/Telehealth.aspx (accessed April 11, 2014).54 HFS Medical Programs, Illinois Department of Healthcare and Family Services, http://www2.illinois.gov/hfs/
MedicalPrograms/Pages/default.aspx (accessed April 11, 2014). 55 Handbook for Practitioners Rendering Medical Services (2010), Chapter A-200: Policy and Procedures for Medical services,
Section A-220.67, available at: http://www2.illinois.gov/hfs/sitecollectiondocuments/a200.pdf (accessed April 11, 2014).56 Upper Midwest Telehealth Resources Center, 2013 Illinois Telemedicine Reimbursement Summary, http://www.umtrc.org/
resources/payers-reimbursement/2013-illinois-telemedicine-reimbursement-summary/?back=Resources (accessed April 11, 2014).
57 MHCP Home page: http://www.dhs.state.mn.us/main/idcplg?IdcService=GET_DYNAMIC_CONVERSION&RevisionSelectionMethod=LatestReleased&dDocName=dhs16_136855# (accessed April 11, 2014).

9
shall be paid at the full allowable rate.”58
The MHCP Provider’s manual further defines “consultation” as: “A type of service provided by a physician whose opinion or advice is requested by another provider.”59 Providers may bill for this service by using the relevant CPT code and adding the modifier GQ.60
Oklahoma Oklahoma’s Medicaid services are provided through its SoonerCare program, administered by the Oklahoma Health Care Authority (OHCA). According to the OHCA’s Medical Providers fee for service handbook, “SoonerCare views telemedicine no differently than an office visit or outpatient consultation.”61 Telemedicine services are only covered when the originating site is located in a designated rural area or geographic areas where there are too few providers of the relevant medical specialty.62 SoonerCare does not enumerate a comprehensive list of reimbursable services for which store-and-forward technology may be used, but lists as examples teleradiology, telepathology, fetal monitor strips and physician interpretation of electrocardiograms and electroencephalogram readings.63
South Dakota South Dakota’s Medicaid program is operated by its Division of Medical Services.64 South Dakota’s Policy for Telemedicine Services states that coverage “of telemedicine physician consultations is treated like all other consultation services as defined in the Physician’s Current Procedural Terminology (CPT).” It also specifies that CPT codes appropriate for reimbursement include 99241 through 99275.65,66
58 “Covered Services” Minnesota Statutes section 256B.0625, available at: https://www.revisor.mn.gov/statutes/?id=256B.0625 (accessed April 4, 2014).
59 Coverage of PCP to specialist consultation confirmed by e-mail from MCHP Provider Services, received April 11, 2014. 60 Minnesota Health Care Programs (personal communication, 4/11/14). 61 Oklahoma Administrative Code section 317:30-3-27 “Telemedicine” (revised July 1, 2013) available at: http://www.okhca.
org/xPolicySection.aspx?id=7061&number=317:30-3-27.&title=Telemedicine (unofficial) (accessed April 11, 2014). 62 Id., 317:30-3-27 (c) (2). 63 Id., 317:30-3-27 (e). 64 Division of Medical Services, South Dakota Department of Social Services, https://dss.sd.gov/medicalservices/ (accessed
April 11, 2014). 65 Provider Information: Policy for Telemedicine Services, South Dakota Department of Social Services, available at: http://
dss.sd.gov/medicalservices/providerinfo/programs/telemedicine.asp (accessed April 11, 2014). 66 South Dakota Medicaid Professional Services Billing Manual “Telemedicine Consultation Services,” p 25 (revised February
2014): http://dss.sd.gov/sdmedx/includes/providers/billingmanuals/docs/Professional2.6.14.pdf (accessed April 11, 2014).

10
Table 1 lists the seven states that cover store-and-forward telehealth applications as of July 2013. Some of the states specifically limit telehealth coverage to specific specialties, while other states specifically exclude certain specialties.
Table 1. Specialty coverage by selected statesState Explicitly included specialties Explicitly excluded specialties Alaska none Home and community-based waiver services
Pharmacy services End-stage renal disease services Direct-entry midwife services Private-duty nursing services Personal care assistant services Visual care, dispensing, or optician services
Arizona Cardiology Dermatology Endocrinology Hematology / oncology Home Health Infectious Diseases Neurology Obstetrics / gynecology Oncology / radiation Ophthamology Orthopedics Pain clinic Pathology & Radiology Pediatrics and pediatric subspecialties Rheumatology Surgery follow-up and consultations Behavioral health services
None
California Teleopthalmology Teledermatology
None
Illinois None NoneMinnesota Specialty physician
Oral surgeonNone
Oklahoma None* Outpatient surgical services Home health services Well child checkups, and preventive visits Laboratory services Audiologist services Care coordination services Physical, speech, or occupational therapy services
South Dakota None None*SoonerCare lists that it will cover store-and-forward technology services such as teleradiology, telepathology, fetal monitor strips and physician interpretation of electrocardiogram and electroencephalogram readings, but notes that it does not consider these services to constitute telemedicine .

11
Connecticut Telehealth Policies The Connecticut Medicaid program does not appear to reimburse for any telehealth service, including specialist reviews conducted through an electronic consultation and referral system. The term “telehealth” is not defined by Connecticut statute. A statutory definition for the term “telemedicine” appears in §17b-245c of the Connecticut General Statutes, which authorizes the Department of Social Services (DSS) to implement a telemedicine pilot project. The provision states that telemedicine is “the use of interactive audio, interactive video or interactive data communication in the delivery of medical advice, diagnosis, care or treatment” for included services. It explicitly excludes services that use only facsimile machines or audio-only telephones.
The Connecticut General Assembly considered three telehealth-related bills in its 2014 session. One bill would have required private insurance companies to reimburse the provision of certain telehealth services.67 Another would have required Medicaid coverage for home telemonitoring services.68 The third bill, when first introduced, would have required DSS to conduct the pilot project that it is authorized to conduct pursuant to §17b-245c, by January 11, 2015.69 This bill also included a definition of “telehealth” to mean “the use of telecommunications and information technology to provide access to health assessment, diagnosis, intervention, consultation, supervision and information across distance. Telehealth or telemonitoring includes technologies such as (A) telephones, (B) facsimile machines, (C) electronic mail systems, and (D) remote patient monitoring devices used to collect and transmit patient data for monitoring and interpretation.”70 While the bill was ultimately enacted into law as PA 14-62, the provisions related to telehealth were not included in the final version.
67 Connecticut General Assembly, An Act Concerning Health Insurance Coverage for Telemedicine Services, raised Senate Bill 202, Session Year 2014.
68 Connecticut General Assembly, An Act Concerning Medicaid coverage of Telemonitoring Services, raised bill no. 5445, Session Year 2014.
69 Connecticut General Assembly, An Act implementing the recommendations of the legislative program review and investigations committee Medicaid-funded emergency department visits. Raised House Bill 5378, Session Year 2014, § 6.
70 Id., § 6 (2).
12
clinical guidElinES and EffEctivEnESS rEviEw
Clinical GuidelinesThere appear to be no nationally recognized guidelines recommending when a PCP should contact a cardiologist for consultation. Neither cardiology referral guidelines nor electronic consultation guidelines were listed on the National Guidelines Clearinghouse. A consulting UConn Health cardiologist confirmed the absence of any such guidelines. Specific conditions that fall within the field of cardiology sometimes include advice and guidelines for referring. The U.S. Department of Veterans Affairs has issued a limited number of clinical guidelines for chronic disease in primary care.71 Among these are four cardiac-related guidelines: “Pharmacologic Management of Chronic Heart Failure in Primary Care Practice” (2007), “Diagnosis and Management of Hypertension in the Primary Care Setting” (2005), “Management of Dyslipidemia” (2006), “Management of Ischemic Heart Disease (IHD)” (2003). These guidelines are aimed at PCPs and generally include a detailed list of recommendations for when referral to specialty care might be appropriate for the particular condition covered by the guideline.
Effectiveness and Cost Literature ReviewCPHHP searched relevant literature to investigate further the experience that health care systems have had with implementing electronic consultation and referral systems similar to the Cardiology eConsults pilot at CHC, Inc. Articles were reviewed to better understand the impact of such systems on clinical effectiveness and cost. The system that functions most similarly to Cardiology eConsults is eReferral at San Francisco General Hospital (SFGH), in San Francisco, California.72 Proponents of eReferral report that, when compared to a paper-based referral system, it has led to improvements in PCP – specialist communication; decreased wait-times between the initiation of a referral and a patient visit with a specialist; and increased capacity for PCPs to address patients’ concerns, thereby avoiding some patient visits to a specialist; while providing patient care that is largely comparable.73 While some of the articles reviewed provide supporting evidence for the assertions of telehealth proponents, others provide contrary evidence. Further, the literature reveals unintended negative consequences associated with the implementation of such a system in some areas, such as increased workload for PCPs; and it raises other potential issues for which there does not appear to be evidence at the moment, such as the effect on responsibility for patient care and patient privacy. The literature also shows that some health care professionals have faced obstacles when attempting to scale-up an electronic referral system from a small pilot study to a larger health care system. Systems using telehealth applications similar to Cardiology eConsults have had mixed cost results, with some increasing the cost and others decreasing the cost of service. Most reviewers seem to conclude that the costs associated with telehealth adoption, whether they increase or decrease, are insubstantial and should not be the primary consideration to determine whether to adopt telehealth or not.
A few articles have been identified that examine electronic consultation and referral systems that are almost exactly like Cardiology eConsults; the systems examined in these articles have been implemented by single hospitals or in small geographic areas only. Studies of similar programs deployed in Los Angeles County, California; Boston, Massachusetts; Denver, Colorado; Fife, Scotland; and at the San Francisco General Hospital and the Mayo Clinic were reviewed. The results from these studies are limited by the possibility that they may not be predictive of what might occur when such systems are adopted statewide.
71 TVA/DoD Clinical Practice Guidelines (updated May 8, 2014), http://www.healthquality.va.gov/ (accessed August 27, 2014).
72 Communication system similar to Cardiology eConsults have different names in different places. For example, the Mayo clinic refers to its system as “eConsults”; San Francisco General Hospital calls its system “eReferral”; England calls its system “Choose and Book.”
73 Chen A, Murphy E, Yee H. eReferral: A new model for integrated care. New Eng. J. Med. 2013;368(26):2450-2453.

13
Due to the paucity of articles focusing on systems exactly like Cardiology eConsults, articles focusing on other types of electronic communication systems have also been reviewed. These articles discuss virtual examination systems using store-and-forward technologies, and an electronic appointment scheduling system used in England called “Choose and Book.”
Store-and-forward virtual examinations differ somewhat depending on the specialties in which they are employed, but they typically involve the PCP sending extensive patient information, often including visual or auditory information, to a distant specialist so that the specialist may conduct a full examination and make a diagnosis. This is in contrast to a Cardiology eConsults-type system, wherein a specialist reviewer conducts a brief review of the patient’s record to determine whether a full specialist examination is appropriate. Both types of systems are intended to facilitate communication between the PCP and the specialist, rather than direct communication between the specialist and the patient; the communication is asynchronous, allowing each physician to review the communication when convenient; both rely on a similar technological infrastructure; and both allow for the possibility of referring the patient for an in-person visit with the specialist.
The National Health System (England) has implemented an electronic referral system throughout England called “Choose and Book.” “Choose and Book” differs from Cardiology eConsults in that it is limited to scheduling appointments and does not include a PCP-specialist consultation component or a component in which a specialist reviewer determines the appropriateness of referrals. It was first implemented as a small-scale, pilot study, and, after promising results, it was expanded to operate throughout England.74 NHS announced in the summer of 2013 that “Choose and Book” will be gradually replaced, starting in late 2014. Some of NHS’s experiences expanding the system might be useful to consider in the context of expanding Cardiology eConsults.75
A limitation of the existing literature involves the lack of independence of the researchers investigating the utility of telehealth platforms; most of the studies identified were produced by investigators who were either involved with the implementation of the examined telehealth system or affiliated with the institution operating it. McLean et al. (2013) found this to be the case with telehealth studies generally.76 The closeness between the researchers and the object of their study may undermine the objectivity of their investigations. All of the studies described above are also limited in that they compare electronic systems to older, largely paper-based systems, only. No study of which we are aware has compared the clinical results of different types of electronic systems.77
74 Dixon A, Robertson R, Bal R. The experience of implementing choice at point of referral: A comparison of the Netherlands and England. Health Economics, Policy and Law. 2010;5(3):295-317.
75 NHS (England) announced in 2013 that it intended to begin phasing out Choose and Book by the end of 2014. NHS England announces ‘roadmap’ for improved patient e-Referral system (June 12, 2013), available at: http://www.england.nhs.uk/2013/06/12/roadmap-imp-pat-e-referral-syst/ (accessed June 27, 2014).
76 McLean S, Sheikh A, Cresswell K, Nurmatov U, Mukherjee M, Hemmi A, Pagliari C. The impact of telehealthcare on the quality and safety of care: A systematic overview. PLoS ONE. 2013;8(8):e71238.
77 One article does compare user-friendliness of different types of electronic store-and-forward applications for dermatology. Armstrong A, Sanders C, Farbstein A, Wu G, Lin S, Liu F, Nesbitt T. Evaluation and comparison of store-and-forward teledermatolgy applications. Telemedicine and e-Health. 2010;16 (4): 424-438.
14
Part One: Clinical Effectiveness
Evidence regarding expected benefits. The available evidence suggests that conversion from a paper-based referral system to an electronic system may increase the quality of communication between PCPs and specialists in some respects, particularly referral question clarity, while introducing new barriers in others; decrease patients’ wait-times to visit with a specialist or otherwise have their issue addressed; and reduce the number of patient visits to a specialist. There is little evidence regarding any potential change in long-term health outcomes for patients arising from the introduction of an electronic consultation and referral system.
Communication between PCP and specialist. Kim-Hwang et al. (2010) examined the results from SFGH’s eReferrals.78 They found that specialists reported that before implementation of eReferrals, nearly 20 percent of new patients arrived with no clear reason given for the referral. After implementation of eReferrals, which provides referring PCPs a mix of standard-form text options and space for free text, the number of referrals for unknown reasons decreased to a little more than 10 percent. As one specialist commented “one of the big issues that used to come up…it would be very difficult to figure out what exactly the primary provider wanted to have answered…”79 Specialists in this system also believed that the number of avoidable requests for follow-up reduced from 30.8 percent in the paper-based system to 21.9 percent in the electronic system.80 A follow-up request was considered avoidable if the information could have been secured before the specialist examination, and a fuller workup completed before the specialist visit. In Boston, Gandhi et al. (2008) found that specialists were far more likely to receive information about a patient before examining the patient when the referral came through an electronic system, rather than a paper-based system.81 Similarly, specialists were more likely to send information back to the PCP following an examination after the implementation of an electronic system.
There was also some evidence that the implementation of an electronic system may create a barrier to in-person discussions between the PCP and specialist, despite the high value some PCPs and specialists place on such communication.82 Esquivel et al. (2012) noted that in some cases specialists prefer to contact PCPs directly when there is doubt over whether a patient visit is appropriate.83 Physicians in England expressed frustration with the fact that they sometimes did not even know to which specialists their patients were referred.84 Strauss et al. (2011) also noted that the lack of direct communication between PCPs and specialists, or at least the specialists’ offices, has led to scheduling problems with some patients, particularly
78 Kim-Hwang J, Chen A, Bell D, Guzman D, Yee H, Kushel M (2010). Evaluating Electronic Referrals for Specialty Care at a Public Hospital. Journal of Internal Medicine. 2010;25(10):1123-1128.
79 Bell D, Straus S, Wu S, Chen A, Kushel M. Use of an electronic referral system to improve the outpatient primary care – specialty care interface: Final Report. (Prepared by RAND Corporation). AHRQ 2012;Publication no. 11(12):0096-EF. Rockville, MD: Agency for Healthcare Research and Quality.
80 Id.81 Gandhi T, Keating N, Ditmore M, Kiernan D, Johnson R, Burdick E, Hamann C (2008). “Improving referral
communication using a referral tool within an electronic medical record.” In: Advances in Patient Safety: New Directions and Alternative Approaches, vol. 3: Performance and Tools.
82 Horner K, Wagner E, Tufano J. Electronic consultations between primary and specialty care clinicians: Early insights. 2011; Issue Brief, The Commonwealth Fund, vol. 23, available at: http://www.commonwealthfund.org/~/media/files/publications/issue-brief/2011/oct/1554_horner_econsultations_primary_specialty_care_clinicians_ib.pdf (accessed August 11, 2014).
83 Esquivel A, Sittig D, Murphy D, Singh. Improving the effectiveness of electronic health record-based referral processes. BMC Medical Informatics and Decisions Making, 2012;12:107.
84 Dixon A, Robertson R, Bal R (2010). The experience of implementing choice at point of referral: A comparison of the Netherlands and England. Health Economics, Policy and Law. 2010;5(3):295-317.

15
with those who are homeless, have limited English proficiency, or who are otherwise difficult to contact.85 86,
87, 88, 89, 90
Table 2. Reported changes in wait times
Specialty / location / source Paper SystemElectronic System Change in wait times
PCP referral for Surgical and Medical Subspecialty Care / (SFGH)86 112 days 49 days 63 day reduction
PCP referral for cardiology care*/ (SFGH)87 Under 40 days 40-60 days 34 percent increase PCP referral to Urology for hematuria / (Los Angeles County)88 404 days 192 days 212 day reduction
Optometrist referral to Ophthalmologist / (Fife, Scotland)89
14 weeks (98 days)
4 weeks (28 days)
10 week reduction (70 day reduction)
Warshaw et al. (2011) review of referral to dermatologist** 90 48 - 88 .6 days 4 - 13 days 44 - 76 .3 day reduction * The articles reviewed by Warshaw et al. (2011) examine store-and-forward virtual examinations . The difference in wait times compared in these articles, then, is the difference between receiving a virtual examination and an in-person examination, rather than the difference between using a paper-based system and an electronic system to make a specialist referral . **Bell et al. (2012) report median, rather than average, wait times .
Wait times. Electronic consultation and referral systems have been associated with a reduction in wait-time between the PCP’s referral initiation and the patient’s ultimate visit with a specialist. Changes in wait times reported in the articles are summarized in Table 2. Chen et al. (2013) reported that SFGH saw a reduction in patient wait-times from 112 days to 49 days after implementing eReferral.91 Bell et al. (2012) note, however, that the median wait time to see a cardiology specialist increased after the implementation of eReferrals, but suggest that this may have been due to staff changes in the department, rather than the new mode of communication.92 Bergman et al. (2013) focused on wait times from urology referral to workup for hematuria in the Los Angeles County health system and found that average wait time was 404 days for a sample of patients when referrals went through the paper system, and reduced to 192 days for a sample of
85 Straus S, Chen A, Yee H, Kushel M, Bell D (2011). Implementation of an electronic referral system for outpatient specialty care. AMIA Annual Symposium Proceedings Archive. 2011:1337-1346.
86 Chen A, Murphy E, Yee H. eReferral: A new model for integrated care. New Eng. J. Med. 2013;368(26):2450-2453. 87 Bell D, Straus S, Wu S, Chen A, Kushel M. Use of an electronic referral system to improve the outpatient primary care –
specialty care interface: Final Report. (Prepared by RAND Corporation). AHRQ 2012;Publication no. 11(12):0096-EF. Rockville, MD: Agency for Healthcare Research and Quality.
88 Bergman J, Neuhausen K, Chamie K, Scales C, Carter S, Kwan L, Kerman S, Aronson W, Litwin M. Building a medical neighborhood in the safety net: An innovative technology improves hematuria workups. Urology. 2013;82:1277-1282.
89 Borooah S, Grant B, Blaikie A, Styles C, Sutherland S, Forrest G, Curry P, Legg J, Walker A, Sanders R. Using electronic referral with digital imaging between primary and secondary ophthalmic services: A long term prospective analysis of regional service redesign. Eye. 2013;27:392-397.
90 Warshaw E, Hillman Y, Greer N, Hagel E, MacDonald R, Tutks I, Wilt (2011). J. Am. Acad. Dermatology. 2011;64:759-772.
91 Chen A, Murphy E, Yee H. eReferral: A new model for integrated care. New Eng. J. Med. 2013;368(26): 2450-2453.92 Bell D, Straus S, Wu S, Chen A, Kushel M. Use of an electronic referral system to improve the outpatient primary care –
specialty care interface: Final Report. (Prepared by RAND Corporation). AHRQ 2012;Publication no. 11(12):0096-EF. Rockville, MD: Agency for Healthcare Research and Quality.

16
patients who were referred through the electronic system that replaced it.93 An electronic referral system implemented in Fife, Scotland, to manage referrals from optometrists to ophthalmologists, led to a reduction of referral time from 14 weeks to 4 weeks on average.94
The implementation of similar store-and-forward systems have also been shown to reduce wait times. In a recent review by Warshaw et al. (2011), the time from the PCP consult to the dermatology clinic visit or opinion among store-and-forward teledermatology was 44 to 76.3 days shorter than for in-person dermatology examinations.95 A study of patients receiving store-and-forward electrocardiography care in the Brazilian state of Santa Catarina reported lower waiting times for exam administration and delivery of exam.96
Avoided In-person examinations. In addition to shorter wait times to see a specialist, some PCPs found that, with the support provided through an electronic consultation and referral system, they were able to treat the patient themselves, thereby removing the need for the patient to travel to see a specialist. When interviewing PCPs and specialists participating with SFGH’s eReferral program, Straus et al. (2011) found that most specialists believed that some visits were avoided because of clearer questions, fuller PCP-managed workups and specialist advice provided to the PCP.97 Chen et al. (2013) reported that 20 percent of the specialty referrals routed through its eReferral system ultimately did not result in an in-person examination by the specialist.98 The rate of avoided in-person visits, or “never scheduleds” varied considerably from specialty to specialty.99 The group of referred patients who were never scheduled to meet with a specialist ranged from 4.4 percent of neurology referrals, to 53.1 percent of referrals to a liver specialist. The results for the nine medical specialties that were part of SFGH’s eReferral program at the time of Bell et al. (2012)’s study are shown in Table 3. Kim et al. (2010), also studying SFGH, found that before the implementation of eReferral, specialists considered 6.4 percent of new patient referrals to be inappropriate compared to 2.6
93 Bergman J, Neuhausen K, Chamie K, Scales C, Carter S, Kwan L, Kerman S, Aronson W, Litwin M. Building a medical neighborhood in the safety net: An innovative technology improves hematuria workups. Urology. 2013;82:1277-1282.
94 Borooah S, Grant B, Blaikie A, Styles C, Sutherland S, Forrest G, Curry P, Legg J, Walker A, Sanders R. Using electronic referral with digital imaging between primary and secondary ophthalmic services: A long term prospective analysis of regional service redesign. Eye, 2013;(27):392-397.
95 Warshaw E, Hillman Y, Greer N, Hagel E, MacDonald R, Tutks I, Wilt (2011). J. Am. Acad. Dermatology. 2011;64:759-772.
96 Von Wangenheim A, De Souze Nobre L, Tognoli H, Nassar S, Ho K (2012). User satisfaction with asynchronous telemedicine: A study of users of Santa Catarina’s system of telemedicine and telehealth. Telemedicine and e-Health. 2012; 18(5): 339-346.
97 Straus S, Chen A, Yee H, Kushel M, Bell D. Implementation of an electronic referral system for outpatient specialty care. AMIA Annual Symposium Proceedings Archive. 2011;1337-1346.
98 Chen A, Murphy E, Yee H. eReferral: A new model for integrated care. New Eng. J. Med. 2013;368(26):2450-2453.99 Bell D, Straus S, Wu S, Chen A, Kushel M. Use of an electronic referral system to improve the outpatient primary care –
specialty care interface: Final Report. (Prepared by RAND Corporation). AHRQ. 2012; Publication no. 11(12):0096-EF. Rockville, MD: Agency for Healthcare Research and Quality.
Table 3. Percent of avoided face-to-face specialist examinations at SFGH, by specialty .
Medical SpecialtyAverage
monthly referralsPercent
never scheduledCardiology 88 16 .1Chest 43 17 .8Endocrinology 47 40 .8Gastroenterology 229 25 .3Hematology 34 31 .4Liver 53 53 .1Neurology 120 4 .4Renal 40 31 .4Rheumatology 46 17 .9

17
percent after eReferral implementation.100
Participation in eReferral program is mandatory for all physicians referring their patients to a specialist through SFGH. Palen et al. (2012) examined a system in which the physicians were not compelled to submit referral requests to a specialist reviewer-managed system, but had the option to request a referral or an “advice-only” consultation from a specialist at their discretion.101 During the study period, PCPs who practice internal or family medicine sent 22,391 messages to specialists related to the care of 19,441 patients. The vast majority of these were referrals.102 Palen et al. (2012) randomly selected 270103 patients for further study for whom an advice only request was sent to a specialist. They found that, among this sample, 59.2 percent of them ultimately were referred for a face-to-face visit with the specialist and 40.8 percent were not. It is unclear, however, whether the questions raised in the advice-only consultations would otherwise have led to a specialist referral.
Many studies of store-and-forward technology have reported that implementation of the electronic system has reduced face-to-face visits. Albouaini et al. (2009) found that, among 29 primary care practices in England utilizing telecardiology to obtain ECG interpretations from cardiologists, face-to-face visits with cardiologists were avoided in 65.8 percent of cases.104 In a recent review of store-and-forward teledermatology, Warshaw et al. (2011) found that 20.7 percent of visits were avoided in one study and 28 percent in another.105 Another recent review of evaluations of store-and-forward technology in dermatology care presented the numbers of face-to-face visits avoided in 27 studies: the range was 8 percent to 88 percent with a median of 51 percent.106
Patient outcomes. There is little evidence of the long-term impact of electronic communication systems on patient outcomes. Unlike related store-and-forward telehealth applications such as teledermatology, eReferrals and other electronic consultation and referral systems do not include a virtual specialist examination; therefore, the patients who do not receive a specialist face-to-face examination do not receive a full examination by a specialist. Further, specialists at SFGH reported that, before eReferrals, they found 6.4 percent of referrals to be inappropriate.107 The adoption of eReferrals has, however, led to more than 20 percent of referrals resulting in no schedule with a specialist, a far larger proportion of patients than identified by the specialists as potentially inappropriate.108 This raises at least the possibility that some health issues may go unnoticed. As some measure of health outcomes, Angstman et al. (2009) investigated whether, after implementation of such a system, patients who were deemed inappropriate for a specialist
100 Kim-Hwang J, Chen A, Bell D, Guzman D, Yee H, Kushel M. Evaluating Electronic Referrals for Specialty Care at a Public Hospital. Journal of Internal Medicine. 2010;25(10):1123-1128.
101 Palen T, Price D, Shetterly S, Wallace K (2012). Comparing virtual consults to traditional consults using an electronic health record: An observational case-control study. BMC Medicaid Informatics and Decision Making. 2012;12:65.
102 Palen et al. reports that of the 22,391 messages, 20,925 were traditional referrals, which suggests that 1,466 were advice-only requests. The authors do not state, however, the number of patients involved in either group.
103 In the results section of this paper, the sample is given as 240; this appears to have been a typographical error. 104 Albouaini K, Jones A, Rowe M, Shtrosberg S, Egred S (2009). The use of telemedicine for ECG interpretation in primary
care. Heart. 2009;95: 55.105 Warshaw E, Hillman Y, Greer N, Hagel E, MacDonald R, Tutks I, Wilt. J. Am. Acad. Dermatology. 2011;64: 759-772.106 Landow S, Mateus A, Korgavkar K, Nightingale D, Weinstock M. Teledermatology: Key factors associated with reducing
face-to-face dermatology visits. J. Am. Acad. Dermatology. (in press, available online April 3, 2014), DOI: 10.1016/j.jaad.2014.02.021
107 Kim-Hwang J, Chen A, Bell D, Guzman D, Yee H, Kushel M (2010). Evaluating Electronic Referrals for Specialty Care at a Public Hospital. Journal of Internal Medicine. 2010;25(10):1123-1128.
108 Bell D, Straus S, Wu S, Chen A, Kushel M (2012). Use of an electronic referral system to improve the outpatient primary care – specialty care interface: Final Report. (Prepared by RAND Corporation). AHRQ 2012;Publication no. 11(12):0096-EF. Rockville, MD: Agency for Healthcare Research and Quality.
18
visit increased their visits to a PCP, which might indicate that their issues remain unresolved. The results were somewhat ambiguous. While there was not an increase in revisits for the same issue, suggesting the issue had been appropriately resolved, there was an increase in visits for other issues.109 Singh et al. (2010) examined the electronic consultation and referral system implemented by the Veterans Administration. They found that in more than 15 percent of instances when the specialist reviewer recommended against a referral, that there was no further action to address the patient’s issue, and this inactivity was either wholly unexplained or supported by illegitimate reasons.110
Unintended negative results and other issues. The literature presents some evidence of unintended negative consequences associated with electronic consultation and referral systems, particularly increased workloads for PCPs. It also raises a number of issues for which there appears to be little to no evidence at the moment. These issues involve the division of responsibility between the PCP and specialist reviewer, physician participation with the system, and patient privacy and autonomy concerns.
Studies from both the United States and the United Kingdom reveal that the implementation of an electronic communication system often results in a higher workload for PCPs. This added workload takes away time the PCP might otherwise spend with patients and is largely uncompensated.111 This increased work comes both from extra clinical duties related to interpreting the specialist reviewer’s response and delivering the advice, when the response includes advice, and also increased administrative work associated with preparing the referral.112 Rescheduling appointments also may be more cumbersome under eReferrals. Under the previous system, PCP would typically reschedule a patient’s appointment with a brief phone call. Under eReferral, the entire referral process must be repeated.113 Additionally, Dixon et al. (2010) reported that because the PCP participation with Choose and Book was only at approximately 50 percent, English hospitals had increased administrative work arising from the need to operate two different referral systems, one electronic and one paper-based.114
In eReferral, established at SFGH, the PCP sends all referrals to a designated specialist reviewer who then determines whether a patient visit with a specialist is appropriate.115 It is unclear whether a PCP may continue to refer a patient for a specialist examination if a specialist reviewer determines that this is inappropriate and, if so, whether insurance would cover such a visit.116 Relatedly, it is unclear whether the
109 Angstman K, Rohrer J, Adamson S, Chaudhry R. Impact of e-consults on return visits of primary care patients. The Health Care Manager. 2009;28(3):253-257.
110 Singh H, Esquivel A, Sittig D, Murphy D, Kadiyala H, Schiesser R, Espadas D, Petersen L (2010). Follow-up actions on electronic referral communication in a multispecialty outpatient setting. Journal of General Internal Medicine. 2012;26(1): 54-69.
111 Straus S, Chen A, Yee H, Kushel M, Bell D. Implementation of an electronic referral system for outpatient specialty care. AMIA Annual Symposium Proceedings Archive, 2011:1337-1346.
112 Rabiei R, Bath P, Hutchinson A, Burke D. The national programme for IT in England: Clinicians’ views on the impact of the Choose and Book service. Health Informatics Journal. 2009;15(3):167-178.
113 Bell D, Straus S, Wu S, Chen A, Kushel M (2012). Use of an electronic referral system to improve the outpatient primary care – specialty care interface: Final Report. (Prepared by RAND Corporation). AHRQ. 2012;Publication no. 11(12:0096-EF. Rockville, MD: Agency for Healthcare Research and Quality.
114 Dixon A, Robertson R, Bal R (2010). The experience of implementing choice at point of referral: A comparison of the Netherlands and England. Health Economics, Policy and Law. 2010;5(3): 295-317.
115 Chen A, Murphy E, Yee H. eReferral: A new model for integrated care. New Eng. J. Med. 2013;368(26): 2450-2453.116 Warren J, White S, Day K, Gu Y, Pollock M (2011). More timely review by secondary services. Applied Clinical
Informatics. 2011;2:546-564
19
responsibility for the patient’s health transfers to the specialist reviewer at any point, and, if so, when.117 Electronic communication systems also raise patient privacy issues.118
Because all referrals go through a centralized specialist reviewer, it appears that the patient has little choice but to allow the specialist reviewer to access their medical record. Opportunity for direct communication between the specialist reviewer and the patient appear to be limited, and, therefore, no establishment of a traditional physician-patient relationship occurs. Implementation of Cardiology eConsults might also cause patients to essentially lose any ability to “opt-out” of any electronic health information exchange system through which the Cardiology eConsults system might operate. This may have a detrimental effect on the amount and quality of personal information the patient is willing to disclose to the PCP.
Roll our from pilot project to health care system. After a successful pilot application of the electronic referral system “Choose and Book,” NHS (England) implemented the system nationally. The NHS predicted that most physicians would be using “Choose and Book” within a few years, but, several years after its initiation, the majority of physicians did not.119
While the physicians’ reasons were not extensively examined by Dixon (2010), the overwhelming majority of them stated that they did not believe their concerns were adequately considered when the program was implemented country-wide, which may be related to their low participation.120 As one physician interviewed by Murray et al. (2011) complained, the telehealth application appeared to the PCP to act as a “disenfranchisement of clinicians…”121 The “nonparticipating” doctors in that case simply continued with a paper referral system; in Connecticut, there is the possibility that dissatisfied PCPs and specialists might exit the Medicaid program.
In contrast, researchers from SFGH report a high level of acceptance among physicians for eReferrals. The researchers attribute this, in part, to the gradual roll out of the system, starting in one clinic and expanding to others, while continually collecting feedback and adjusting the system.122
Part Two: CostThe Agency for Healthcare Research and Quality sponsored a study of SFGH’s eReferrals system. The resulting report was published in 2012 and included a cost estimate of the new system and a comparison to the prior paper-based referral system that preceded it. Other than this report, we have not located any cost estimation study related to the implementation of an electronic consultation and referral system similar to Cardiology eConsults. There have been, however, many articles published attempting to estimate the costs of various other telehealth applications. A small subset of these studies focus on store-and-forward virtual specialist examinations, mostly in the area of teledermatology.
While the cost elements reviewed by researchers when assessing the costs of telehealth applications are not
117 Bell D, Straus S, Wu S, Chen A, Kushel M (2012). Use of an electronic referral system to improve the outpatient primary care – specialty care interface: Final Report. (Prepared by RAND Corporation). AHRQ. 2012;Publication no. 11(12)-0096-EF. Rockville, MD: Agency for Healthcare Research and Quality.
118 Liddy C, Rowan M, Afkham A, Maranger J, Keely E (2013). Building access to specialist care through e-consultation. Open Medicine. 2013; 7(1):e1-e8.
119 Dixon A, Robertson R, Bal R. The experience of implementing choice at point of referral: A comparison of the Netherlands and England. Health Economics, Policy and Law. 2010;(3): 295-317.
120 Id.121 Murray E, Burns J, May C, Finch T, O’Donnell C, Wallace P, Mair F (2011). Why is it difficult to implement e-health
initiatives? A qualitative study. Implementation Science. 2011;6(6).122 Bell D, Straus S, Wu S, Chen A, Kushel M (2012). Use of an electronic referral system to improve the outpatient
primary care – specialty care interface: Final Report. (Prepared by RAND Corporation). AHRQ. 2012;Publication no. 11(12):0096-EF. Rockville, MD: Agency for Healthcare Research and Quality.
20
standardized, studies often consider items such as technology acquisition, installation, and maintenance; training to appropriately use the technology; labor costs of the primary care physician, the specialist, and any assistants; and other health care cost, such as lab work, diagnostic and other medical procedures, and medication.123 These costs are all from the perspective of the health care payer. Some studies also consider costs from the patient’s perspective and include travel times and missed days of work.124
The results of the cost analyses are highly variable, even as to whether the telehealth application is more or less costly than the traditional alternative. In part, this is likely the result of the highly localized nature of cost considerations. Also important, however, is the variation in what elements are included in the cost model from study to study. Further, as one research group noted after reviewing telehealth cost estimates generally, many “studies took place with enthusiastic supporters using home-grown technologies and the observed benefits may not therefore be replicable in other contexts, or when scaled-up for use in routine settings.”125
The cost estimate of eReferrals focused on the costs associated with changes in labor costs. The report divided the 19 specialties that participate in eReferrals into two groups, medical specialties and surgical specialists. Cost estimates were provided for each of these groups, but not for the individual specialties. The researchers found that the time investment for both PCPs and specialists (which includes specialists reviewers and, for some patients, the examining specialists) increased after the adoption of eReferral. For PCPs some of this increase in time resulted from new requirements arising from eReferral, and some from a shift in referral administrative responsibilities from office staff to PCPs. Based on 854 referrals, Bell et al. (2012) predicted that the average costs of specialist labor to SFGH using paper referrals was $30,436 and after eReferral, increased to $33,221, while the estimated cost of PCP labor was $11,965 under the paper system and $14,644 under eReferral.126 This calculates to, approximately, an average cost for a referral in the paper-based system of $49.65 per patient and an average cost of a referral through eReferral of $55.37 per patient.
At the time of Bell et al. (2012)’s report, specialist reviewers were compensated at a rate of $105 per hour. Based on the specialist reviewers’ estimate that they spend, on average, 429.2 hours annually on e-referral, this means that each specialist review costs approximately $16.46.127 Most of the store-and-forward, virtual examination studies found that when considering only direct costs, the telehealth examination was slightly more costly per patient than the traditional in-personal alternative. Butler et al. (2011) report the teledermatology application in their study to have a lower marginal cost, but their cost was per visit and does not appear to include the extra costs to the health system of patients who receive a virtual specialist examination and then are referred for an in-person specialist examination.128 A summary of the reported costs associated with these studies is included in Table 4. The main cost driver in these telehealth applications may be physician compensation.129 The studies that considered costs from a “societal” perspective, which typically included patient travel time and missed time from work, concluded that, overall,
123 Bergmo T. Can economic evaluation in telemedicine be trusted? A systematic review of the literature. Cost Effectiveness and Resource Allocation. 2009; 7:18.
124 Whited J, Datta S, Hall R, Foy M, Marbrey L, Grambow S, Dudley T, Simel D, Oddone E. An economic analysis of a store and forward teledermatology consult system. Telemedicine Journal and e-Health. 2003; 9(4); 351-360.
125 McLean S, Sheikh A, Cresswell K, Nurmatov U, Mukherjee M, Hemmi A, Pagliari C. The impact of telehealthcare on the quality and safety of care: A systematic overview. PLoS ONE, 2013; 8(8): e71238.
126 Bell D, Straus S, Wu S, Chen A, Kushel M (2012). Use of an electronic referral system to improve the outpatient primary care – specialty care interface: Final Report. (Prepared by RAND Corporation). AHRQ. 2012;Publication no. 11(12):0096-EF. Rockville, MD: Agency for Healthcare Research and Quality.
127 Id.128 Butler T, Yellowlees P. Cost analysis of store-and-forward telepsychiatry as a consultation model for primary care.
Telemedicine and e-Health. 2012;18(1); 74-77.129 Id.
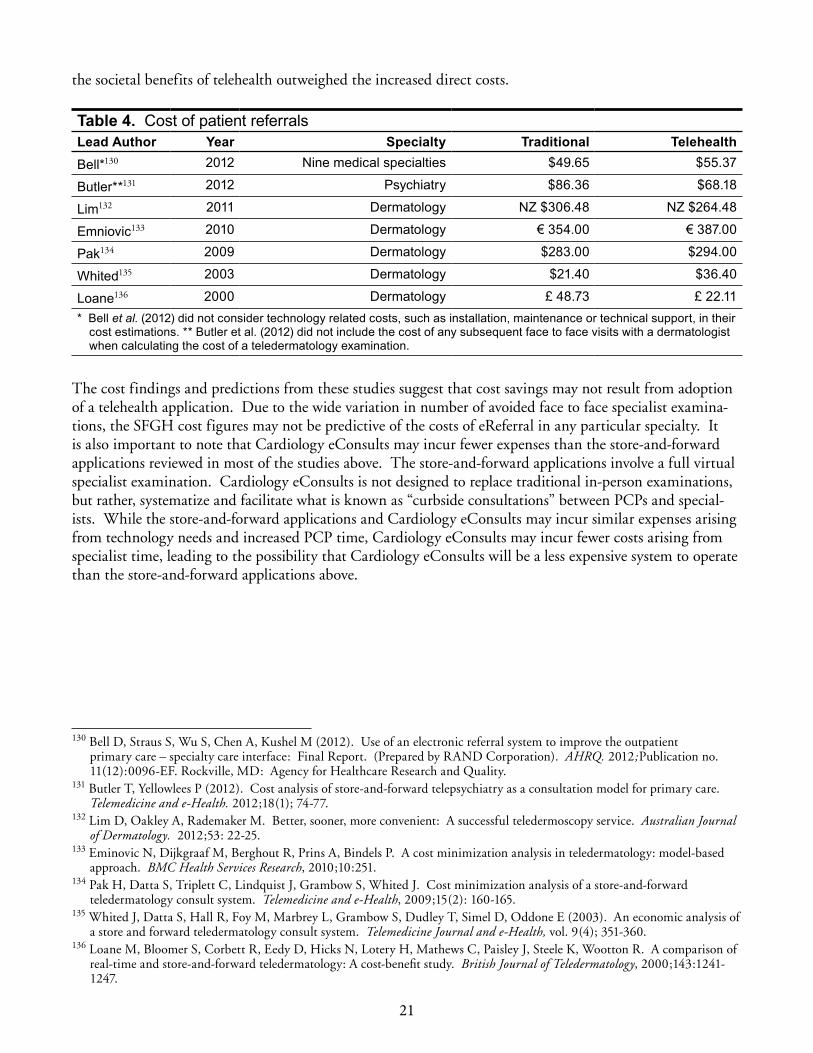
21
the societal benefits of telehealth outweighed the increased direct costs.
Table 4. Cost of patient referralsLead Author Year Specialty Traditional TelehealthBell*130 2012 Nine medical specialties $49 .65 $55 .37
Butler**131 2012 Psychiatry $86 .36 $68 .18
Lim132 2011 Dermatology NZ $306 .48 NZ $264 .48
Emniovic133 2010 Dermatology € 354 .00 € 387 .00
Pak134 2009 Dermatology $283 .00 $294 .00
Whited135 2003 Dermatology $21 .40 $36 .40
Loane136 2000 Dermatology £ 48 .73 £ 22 .11* Bell et al . (2012) did not consider technology related costs, such as installation, maintenance or technical support, in their
cost estimations . ** Butler et al . (2012) did not include the cost of any subsequent face to face visits with a dermatologist when calculating the cost of a teledermatology examination .
130131132133134135136 The cost findings and predictions from these studies suggest that cost savings may not result from adoption of a telehealth application. Due to the wide variation in number of avoided face to face specialist examina-tions, the SFGH cost figures may not be predictive of the costs of eReferral in any particular specialty. It is also important to note that Cardiology eConsults may incur fewer expenses than the store-and-forward applications reviewed in most of the studies above. The store-and-forward applications involve a full virtual specialist examination. Cardiology eConsults is not designed to replace traditional in-person examinations, but rather, systematize and facilitate what is known as “curbside consultations” between PCPs and special-ists. While the store-and-forward applications and Cardiology eConsults may incur similar expenses arising from technology needs and increased PCP time, Cardiology eConsults may incur fewer costs arising from specialist time, leading to the possibility that Cardiology eConsults will be a less expensive system to operate than the store-and-forward applications above.
130 Bell D, Straus S, Wu S, Chen A, Kushel M (2012). Use of an electronic referral system to improve the outpatient primary care – specialty care interface: Final Report. (Prepared by RAND Corporation). AHRQ. 2012;Publication no. 11(12):0096-EF. Rockville, MD: Agency for Healthcare Research and Quality.
131 Butler T, Yellowlees P (2012). Cost analysis of store-and-forward telepsychiatry as a consultation model for primary care. Telemedicine and e-Health. 2012;18(1); 74-77.
132 Lim D, Oakley A, Rademaker M. Better, sooner, more convenient: A successful teledermoscopy service. Australian Journal of Dermatology. 2012;53: 22-25.
133 Eminovic N, Dijkgraaf M, Berghout R, Prins A, Bindels P. A cost minimization analysis in teledermatology: model-based approach. BMC Health Services Research, 2010;10:251.
134 Pak H, Datta S, Triplett C, Lindquist J, Grambow S, Whited J. Cost minimization analysis of a store-and-forward teledermatology consult system. Telemedicine and e-Health, 2009;15(2): 160-165.
135 Whited J, Datta S, Hall R, Foy M, Marbrey L, Grambow S, Dudley T, Simel D, Oddone E (2003). An economic analysis of a store and forward teledermatology consult system. Telemedicine Journal and e-Health, vol. 9(4); 351-360.
136 Loane M, Bloomer S, Corbett R, Eedy D, Hicks N, Lotery H, Mathews C, Paisley J, Steele K, Wootton R. A comparison of real-time and store-and-forward teledermatology: A cost-benefit study. British Journal of Teledermatology, 2000;143:1241-1247.
22
Study onE: The Cardiology eConsulTs simulaTion model
mEthodS
The Cardiology eConsults Simulation Model (CeSM) was designed to predict the impact on health care utilization, quality of care, and cost were DSS to implement a telehealth system where PCPs use eConsults when referring adult patients with Medicaid coverage to a cardiologist for non-urgent care. The CeSM provides simultaneous projections for how patient’s move through the referral process under the “Usual Care Approach,” which refers to traditional referrals for face-to-face (F2F) appointments, and under the “eConsults Approach” of referral-to-eConsult. Projections also include three measures for quality of care and the cost of care paid by DSS. Quality-of-care measures include: 1) Cases reviewed by cardiologist(s) for referred patients; 2) F2F visits with a cardiologist; and 3) missed appointments with the cardiologist. All projections are generated by the CeSM for new cardiology referrals (“new patients”), referrals for patients with an existing relationship with a cardiologist (“established patients”), and overall (both new and established patients). This distinction of referral type is included in the CeSM because evidence from similar interventions are for new referrals only and the cost of care differs for new and established patients. Budget impact estimates from the CeSM do not include the upfront and ongoing costs associated with the technology needed to support eConsults referrals.
The CeSM includes a series of interactive equations programmed into Microsoft Excel. The structure of the CeSM, shown in Figure 2, maps how patients flow through the referral process, including the type, timing and cost of health care received. Each stage of the flow diagram in Figure 2 has a proportionate probability that the given event will occur relative to the other values in the model. The CeSM is designed with a user interface, shown in Figure 3, to allow different scenarios to be run by selecting values for eleven model inputs. Model inputs include variables such as the rate paid for eConsults or proportion of patients recommended for a F2F appointment. Based on existing evidence, the model includes a range of possible values programmed for each input variable. The assumptions underlying the equations that drive CeSM and the range of possible input values were informed by a cardiology eConsults pilot study at Connecticut’s largest FQHC, Connecticut Medicaid data, and other telehealth interventions similar to eConsults. For the purposes of describing the potential health care and budget impact of the eConsults Approach for Connecticut Medicaid, CPHHP defined a set of assumed values for the eleven variable model inputs, referred to as the “Test Scenario.” The Findings section of this paper describes CeSM results for the Test Scenario and sensitivity test results show how projected outcomes would differ from the Test Scenario results if variable model input assumptions change.

23
Model Framework
The CeSM model user can vary the assumptions for the highlighted boxes through the CeSM User Interface.
The CeSM framework (Figure 2) maps the flow of patients following a cardiology referral and the related cost of care. It was based on the following:
� Patient flow was informed by the cardiology eConsults pilot project implemented at CHC, Inc.
� Per patient cost for transportation, a PCP follow-up visit, and visits with the cardiology specialist was based on analysis of Connecticut Medicaid data.
� For patients seen by a cardiologist at an office visit, per patient cost was estimated using 12 care pattern groups for new and established patient referrals, each with a different cost and likelihood that a F2F visit could be averted through eConsults. Patients were assigned to care pattern groups based on their medical history related to certain diagnoses, cardiac-related emergency department visits or hospitalizations, and whether the patient had at least one procedure at the cardiology appointment and/or a follow-up visit within 6 weeks of the referred visit. The cost for patients seen by a cardiologist included any follow-up visits within 6 weeks; however, the probably that patients with multiple cardiology visits within 6 weeks would avoid a F2F cardiology visit was assumed to be low.
� The eConsults rate, which is the amount paid for each eConsult, was based on the recommendation of Dr. Daren Anderson (CHC, Inc.) per his estimation of rates paid for similar
Figure 2. Cardiology eConsults Simulation Model Framework
24
programs throughout the country. The eConsults rate primarily compensates the cardiologist reviewer, though some is used to cover the additional time spent by the PCP on each referral.
The methods used to estimate patient flow and cost of care is described further below. Readers interested in only the Test Scenario can continue reading on page 27, “The CeSM Test Scenario.”
As illustrated in Figure 2, the patient flow for both the Usual Care Approach and eConsults Approach be-gins with referrals categorized by type, new patient referrals or established patient referrals. Based on results from the CHC, Inc. pilot project, both approaches assume that 52.4 percent of referrals are for new patients and 47.6 percent are for established patients.137 After this point, patient flow under the eConsults Approach becomes more complex than that of the Usual Care Approach.
� Usual Care Approach. For the Usual Care Approach, referrals go directly to the cardiologist office for appointment scheduling, not to a cardiology specialist reviewer as under the eConsults Approach. The new and established patients are classified into one of 3 groups: (1) patients who are seen by a cardiologist at an office visit, (2) who are not seen by a cardiologist due to a missed appointment or (3) other reasons (for example, the patient canceled the appointment and didn’t reschedule). The assumed proportion of patients seen by a cardiologist can be varied through the CeSM User Interface.
� eConsults Approach. For the eConsults Approach, the new and established patients are divided into those who received the requested eConsults review and those few (3.3 percent) whose case was not reviewed with an eConsult.138 Those patients with a reviewed eConsult are then divided into those for whom the eConsults reviewer recommended a F2F office appointment with a cardiologist, and those whom the reviewer identified as not needing an appointment with a cardiologist. The proportion of referrals recommended for a F2F appointment is a variable in the CeSM User Interface (Figure 3).
– Patients not recommended for a F2F appointment may then be identified as recommended for and receiving follow-up tests or visits with the PCP based on the eConsults cardiologist reviewer’s recommendations. The proportion of patients sent back to the PCP after the review is a variable input in the CeSM User Interface. Patients with the PCP follow-up recommendation are assigned a fixed cost which is estimated to be the average reimbursed cost of a PCP visit without any procedures ($65 for new referrals and $60 for established patient referrals). Patients without a PCP follow-up recommendation are not assigned any additional costs.
– Patients recommended for a F2F appointment are grouped, like the Usual Care patients, into those who are seen by a cardiologist at an office visit and those who are not seen due to a missed appointment or other reasons.
137 Anderson, D.R., Olaylwola, J.N, Aseltine, R., Zlateva, I, Jepeal, N. (2014, June). Implementation of an Electronic Consult Platform to Increase Specialty Care Access. Paper presented at the Academy Health Annual Research Meeting, Weitzman Institute, Middletown, Connecticut, USA.
138 Ibid.
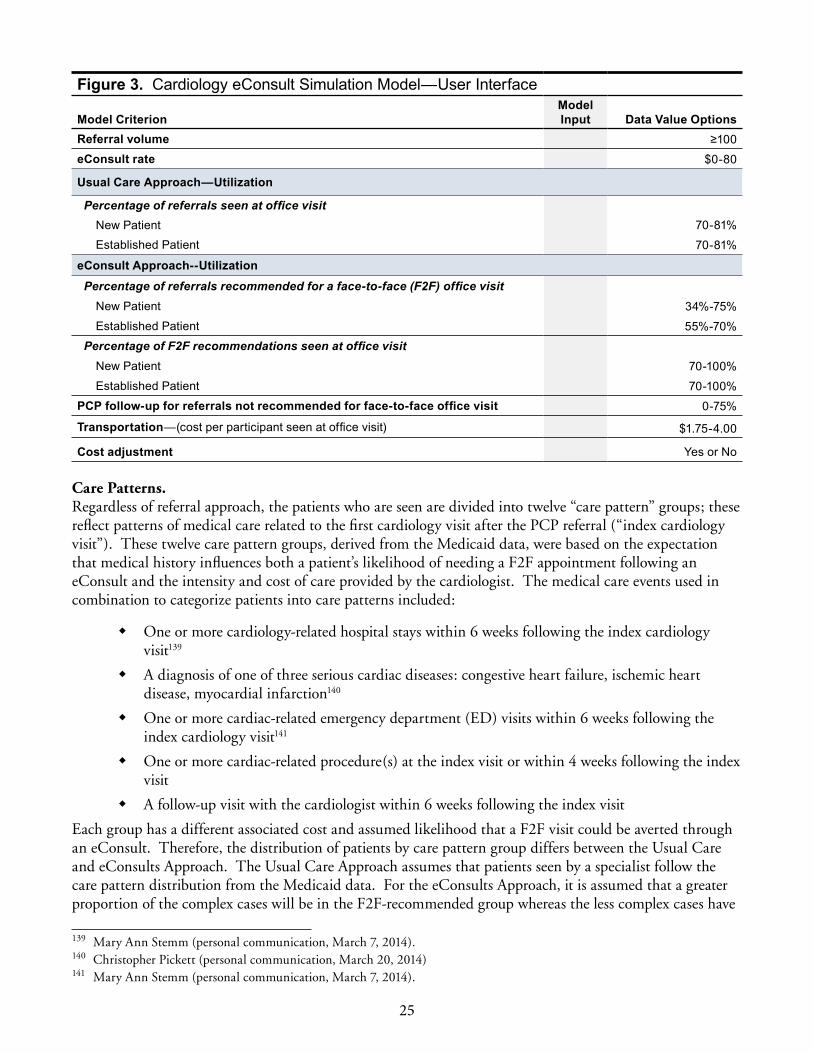
25
Figure 3. Cardiology eConsult Simulation Model—User Interface
Model CriterionModel Input Data Value Options
Referral volume ≥100eConsult rate $0-80
Usual Care Approach—Utilization
Percentage of referrals seen at office visit New Patient 70-81%Established Patient 70-81%
eConsult Approach--UtilizationPercentage of referrals recommended for a face-to-face (F2F) office visit
New Patient 34%-75%Established Patient 55%-70%
Percentage of F2F recommendations seen at office visit New Patient 70-100%Established Patient 70-100%
PCP follow-up for referrals not recommended for face-to-face office visit 0-75%
Transportation—(cost per participant seen at office visit) $1 .75-4 .00
Cost adjustment Yes or No
Care Patterns. Regardless of referral approach, the patients who are seen are divided into twelve “care pattern” groups; these reflect patterns of medical care related to the first cardiology visit after the PCP referral (“index cardiology visit”). These twelve care pattern groups, derived from the Medicaid data, were based on the expectation that medical history influences both a patient’s likelihood of needing a F2F appointment following an eConsult and the intensity and cost of care provided by the cardiologist. The medical care events used in combination to categorize patients into care patterns included:
� One or more cardiology-related hospital stays within 6 weeks following the index cardiology visit139
� A diagnosis of one of three serious cardiac diseases: congestive heart failure, ischemic heart disease, myocardial infarction140
� One or more cardiac-related emergency department (ED) visits within 6 weeks following the index cardiology visit141
� One or more cardiac-related procedure(s) at the index visit or within 4 weeks following the index visit
� A follow-up visit with the cardiologist within 6 weeks following the index visit
Each group has a different associated cost and assumed likelihood that a F2F visit could be averted through an eConsult. Therefore, the distribution of patients by care pattern group differs between the Usual Care and eConsults Approach. The Usual Care Approach assumes that patients seen by a specialist follow the care pattern distribution from the Medicaid data. For the eConsults Approach, it is assumed that a greater proportion of the complex cases will be in the F2F-recommended group whereas the less complex cases have
139 Mary Ann Stemm (personal communication, March 7, 2014). 140 Christopher Pickett (personal communication, March 20, 2014)141 Mary Ann Stemm (personal communication, March 7, 2014).
26
a higher likelihood of being resolved through an eConsult alone or an eConsult with PCP management. Cases are considered more complex if the patient had a cardiac-related hospital visit or certain cardiac conditions or had an emergency department visit. The least complex cases were defined as those without a hospital or ED visit, no follow-up cardiology visits and no cardiac procedures. Additional detail on the definition of the 12 care pattern groups is presented in Section III of the Technical Appendix, pages T-18- through T-20.
Cost of Care Delivered by Cardiologist. Taking into account the relative proportions of care pattern groups, the CeSM calculates the related cost of care delivered by the cardiologist for each care pattern group. For the eConsults Approach, the cost of care delivered by the cardiologist includes the rate paid for the eConsult review and DSS’s reimbursed costs for the cardiology appointment and any related follow-up visits that occur within six weeks. The cost of an eConsult review is a variable input, selected by the CeSM user. This enables the user to explore the impact of the rate paid for an eConsult review on the overall cost and budget impact projected for the eConsults Approach.
The cost of a F2F cardiology appointment depends on the care pattern group to which a patient belongs. Thus, the CeSM calculates the cost of each care pattern group by multiplying a per patient cost for each of the 12 new patient care pattern groups and the 12 established patient care pattern groups by the estimated number of patients seen by a cardiologist in each group. The per patient costs of each care pattern group were determined from analyses of Connecticut Medicaid data, described in the Section III of the Technical Appendix, page T-20. The costs of the following three types of service utilization were included as potentially related to care delivered by the cardiologist as a result of the PCP referral. Additional detail on the Current Procedural Terminology (CPT) codes used to identify the three types of service utilization is available on page T-18 in Section III of the Technical Appendix.
� Office appointment (visit/consult code only)
� Follow-up visit(s) with a cardiologist within six weeks (visit/consult code, any outpatient cardiology provider)
� Procedures, such as an echocardiogram, rendered at the visit/consultation (any procedure codes other than the visit/consult code)
To summarize, the projected costs of care derived from the model are based on average costs calculated for the new and established patients by care pattern group. Thus, for both the Usual Care Approach and eConsults Approach, a total of 24 potential per patient cost figures are multiplied by the projected population size for the respective care pattern group to arrive at the cost of the cardiology appointment and related follow-up care.
Shifting from the Usual Care Approach to the eConsults Approach, fewer patients are expected to need F2F office visits and procedures delivered by the cardiologist. However, any projected reduction in referral-related care provided by a cardiologist and its cost should be balanced with the expectation that some of this care and the costs associated with it will shift to the PCP. Under the eConsults Approach, when a cardiology appointment is not recommended, the cardiology specialty reviewer may or may not ask the PCP to order additional procedures. If the cardiology specialist reviewer recommends additional procedures that are then ordered by the PCP for the patient, the costs of these procedures would not be avoided under the eConsults Approach. Because the amount paid for the F2F visit with the cardiologist might be the only avoided cost for these patients, the CeSM may underestimate the actual cost of treating them.
27
Cardiology Appointment Cost Adjustment. The CeSM includes an additional cost adjustment to DSS’s reimbursed cost for patients under the eConsults Approach who have a F2F cardiology appointment. Using average costs to estimate what DSS will pay for patients requiring F2F care from a cardiologist under the eConsults Approach could underestimate actual spending. This is because the least expensive patients may be the ones most likely not to need a F2F cardiology appointment under the eConsults Approach. The adjustment is a modified average cost for select care pattern groups. Calculated using the Medicaid data, the modified average cost removes patients with the lowest costs of care, those below the 5-10th percentile, and calculates an adjusted average cost. The adjusted average cost is larger than the unadjusted average cost; therefore, expenditures projected using the adjusted value are more conservative than those using the unadjusted value.
Potential Savings. At the request of DSS, the CeSM also includes estimates of potential savings from transportation and efficiency improvements. The transportation estimates are based on utilization rates and average costs in the Medicaid data for non-emergency medical transportation related to all medical visits and visits with a cardiologist. These estimates were derived using only two months of data (which is all that was available); consequently, confidence in these estimates is low. Additional details related to this analysis are found in Section III of the Technical Appendix, page T-21.
The CeSM Test Scenario The CeSM is designed for the user to run a variety of scenarios by varying model inputs, such as referral volume and the amount paid for an eConsult review, through the user interface. CPHHP created the “Test Scenario” to compare projected outcomes under the Usual Care Approach with those under the eConsults Approach using inputs in Table 5. The CeSM Test Scenario assumed 500 Medicaid participant referrals as being eligible for cardiology eConsults. The proportion of patients recommended for a F2F office visit by the cardiologist reviewer was set to 34 percent for new patients and 59 percent for established patients. Patients for whom a F2F appointment is recommended following the eConsult are assumed to see the cardiologist at the same rate as occurred under the Usual Care Approach in the cardiology eConsults pilot study; the “seen at office visit” rate selected was 81 percent for new patient referrals and 75 percent for established patient referrals. It is assumed that the PCP will provide follow-up care for 75 percent of the patients not recommended for a F2F appointment. The cost assumptions include $55 as the amount paid for each eConsult review, transportation costs of $2.40 per participant seen at an office visit, and the cardiology appointment “cost adjustment.” A brief explanation of Test Scenario assumptions follows.
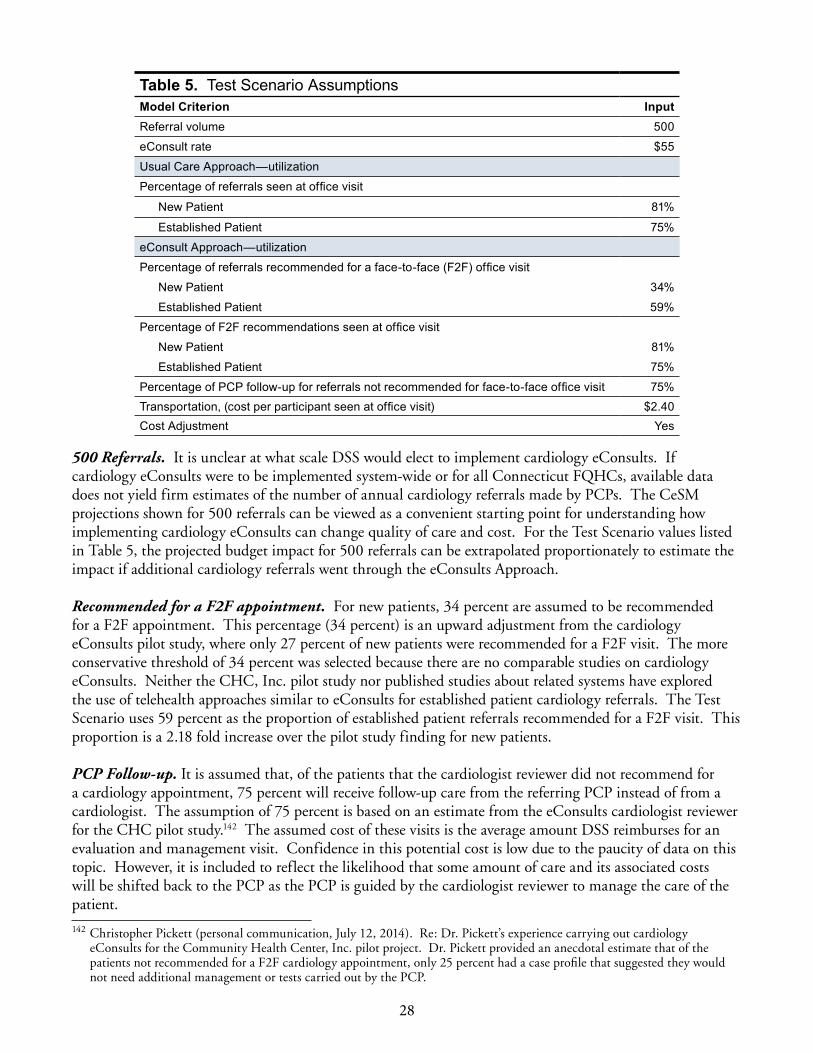
28
Table 5. Test Scenario AssumptionsModel Criterion InputReferral volume 500
eConsult rate $55
Usual Care Approach—utilization
Percentage of referrals seen at office visit
New Patient 81%
Established Patient 75%
eConsult Approach—utilization
Percentage of referrals recommended for a face-to-face (F2F) office visit
New Patient 34%
Established Patient 59%
Percentage of F2F recommendations seen at office visit
New Patient 81%
Established Patient 75%
Percentage of PCP follow-up for referrals not recommended for face-to-face office visit 75%Transportation, (cost per participant seen at office visit) $2 .40Cost Adjustment Yes
500 Referrals. It is unclear at what scale DSS would elect to implement cardiology eConsults. If cardiology eConsults were to be implemented system-wide or for all Connecticut FQHCs, available data does not yield firm estimates of the number of annual cardiology referrals made by PCPs. The CeSM projections shown for 500 referrals can be viewed as a convenient starting point for understanding how implementing cardiology eConsults can change quality of care and cost. For the Test Scenario values listed in Table 5, the projected budget impact for 500 referrals can be extrapolated proportionately to estimate the impact if additional cardiology referrals went through the eConsults Approach.
Recommended for a F2F appointment. For new patients, 34 percent are assumed to be recommended for a F2F appointment. This percentage (34 percent) is an upward adjustment from the cardiology eConsults pilot study, where only 27 percent of new patients were recommended for a F2F visit. The more conservative threshold of 34 percent was selected because there are no comparable studies on cardiology eConsults. Neither the CHC, Inc. pilot study nor published studies about related systems have explored the use of telehealth approaches similar to eConsults for established patient cardiology referrals. The Test Scenario uses 59 percent as the proportion of established patient referrals recommended for a F2F visit. This proportion is a 2.18 fold increase over the pilot study finding for new patients.
PCP Follow-up. It is assumed that, of the patients that the cardiologist reviewer did not recommend for a cardiology appointment, 75 percent will receive follow-up care from the referring PCP instead of from a cardiologist. The assumption of 75 percent is based on an estimate from the eConsults cardiologist reviewer for the CHC pilot study.142 The assumed cost of these visits is the average amount DSS reimburses for an evaluation and management visit. Confidence in this potential cost is low due to the paucity of data on this topic. However, it is included to reflect the likelihood that some amount of care and its associated costs will be shifted back to the PCP as the PCP is guided by the cardiologist reviewer to manage the care of the patient.
142 Christopher Pickett (personal communication, July 12, 2014). Re: Dr. Pickett’s experience carrying out cardiology eConsults for the Community Health Center, Inc. pilot project. Dr. Pickett provided an anecdotal estimate that of the patients not recommended for a F2F cardiology appointment, only 25 percent had a case profile that suggested they would not need additional management or tests carried out by the PCP.

29
eConsult rate. The rate of $55 is within the range used by the FQHC currently piloting eConsults and elsewhere in the country for similar programs.143 The rate is intended to pay the cardiologist reviewer and compensate for some of the additional time spent by the PCP. Note that the rate paid for eConsults is not expected to cover the cost of technology infrastructure that PCPs may need to adopt and maintain.
Transportation. The average transportation cost per patient seen at an office visit (which includes patients with and without transportation costs) ranged from $1.91 to $2.40 according to the Medicaid data analysis conducted for this study. (For further details, refer to the Technical Appendix, Section III, page T-20). The value of $2.40 was used in the Test Scenario. There is not a high level in confidence in this figure due to the limited data available to generate this estimate. Therefore, budget impact estimates show this value separately or clearly indicate when it is included.
findingS
This section describes results from the test scenario and related sensitivity analyses. Test Scenario results include the projected patient flow and expenditures followed by analyses of the impact on quality of care, the DSS’s budget, and cost effectiveness. Findings from a series of sensitivity analyses assessing the impact of changing model assumptions are also presented. Included in these analyses is a budget impact analysis which shows how changes in the following assumptions influence the projected impact on the DSS budget: number of referrals, inclusion or exclusion of cost adjustments, and inclusion or exclusion of the potential additional savings from transportation and additional efficiency.
Results of Test Scenario The Test Scenario for the Cardiology eConsults Simulation Model (CeSM) assumed 500 Medicaid participants as being eligible for cardiology eConsults, with the proportion of participants with cardiologist reviewer recommendations for a F2F office visit as 34 percent for new referrals and 59 percent for established patient referrals. The amount paid for each eConsults review was set at $55. Appointment cost projections used the cost adjustment.
Patient flow and expenditures for 500 referrals. Figure 4 shows the patient flow and expenditures for both the Usual Care Approach and the eConsults Approach using the test scenario assumptions. Under the Usual Care Approach, shown on the left side of the chart, 78.2 percent (391 of 500) of referrals resulted in an office visit with a cardiologist. The remaining 109 referrals (21.8 percent) were not seen by a cardiologist. Of the 500 referrals, 55 (11 percent) were not seen because they did not show up for a scheduled appointment. The reimbursed cost of the appointments and related tests and follow-up appointments for these referrals was $57,849 plus an additional $938 for transportation.144
Patient flow and expenditures for the eConsults Approach are displayed on the right side of Figure 4. Almost all referrals (96.6 percent) were reviewed by a cardiologist reviewer with a total review cost of $26,583. Only 3.4 percent of referrals were not reviewed. Roughly half of the reviewed cardiology referrals (253 of 500) were resolved without a recommendation for a F2F appointment with a cardiologist. However, 75 percent of these patients are assumed to receive cardiology reviewer recommended care or procedures under the supervision of their PCP. Assuming an average PCP visit cost of $65 and $60 per new and established patient, respectively, PCP care would add $11,976 in costs plus an additional $457 for transportation. Although confidence in this estimate is low due to the lack of research on this topic, it is
143 Daren Anderson (personal communication, April 8, 2014).144 Footnote explaining low estimate and high estimate and reference to methods for description.

30
assumed that some cost, which may be greater or less than the $11,976 estimated, will be shifted back to the PCP as they are guided by the specialty reviewer to manage the care of the patient. Of the 483 referrals reviewed by eConsult, 47.6 percent (230) resulted in a F2F cardiology appointment recommendation of which 178 went on to have a F2F appointment with a cardiologist and 52 were not seen at a F2F appointment. Thus, only 35.6 percent of the 500 original referrals resulted in a projected F2F office visit with 4.8 percent projected as not seen due to missed appointments. For patients referred under the eConsults Approach, the projected cost of appointments and related tests and follow-up appointments was $27,982 plus an additional $426 for transportation.
Table 6 provides a more detailed look at the projections for referrals ending in F2F appointments with a cardiologist and the cost of office-based care by care pattern group.145 Under the Usual Care Approach, the majority of referred patients seen at an office visit came from three care pattern groups (6, 10, and 12). The CeSM projects 213 fewer patients seen at a F2F cardiology appointment under eConsults. Nearly 90 percent of this change comes from reductions in F2F appointments for patients in Group 9,146 Group 10,147 and Group 12148 when comparing projections for Usual Care and eConsults. Group 10 utilization changes from 197 to 59 with costs reduced from $26,715 to $6,522. Group 10 accounts for 64.8 percent of the reduction in F2F appointments and 67.6 percent of the reduction in appointment cost.
145 Refer to technical appendix pages for further description of care pattern groups.146 Patients in Group 9 did not have any relevant follow-up medical procedures or follow-up visits with a physician after the
eConsult, and did not have any factor that would place them in Groups 1-8. 147 Patients in Group 10 had no follow-up visit to a physician after the eConsult, but did have some follow-up medical
procedures. They also did not have any factor that would place them in Groups 1-8. 148 Patients in Group 12 had a follow-up visit with a physician and follow-up medical procedures after the eConsult, but did not
have a factor that would place them in Groups 1-8.
Figure 4. Cardiology eConsults Simulation Model Test Scenario Patient Flow Results
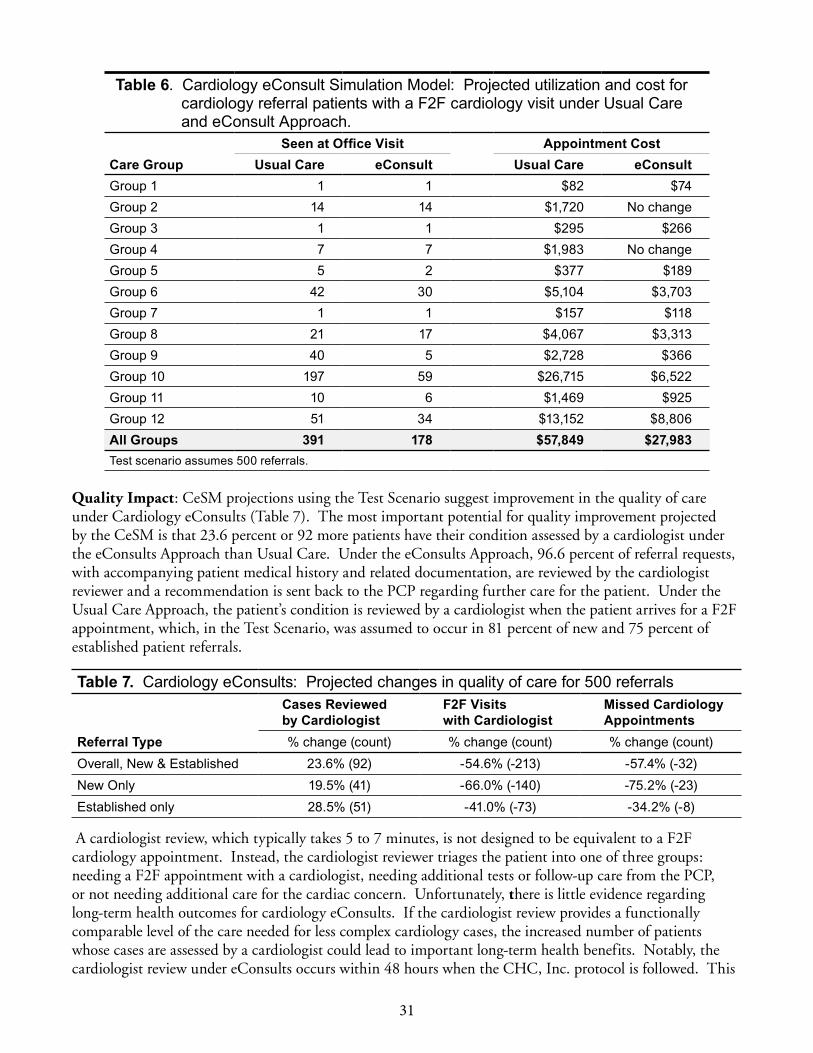
31
Table 6 . Cardiology eConsult Simulation Model: Projected utilization and cost for cardiology referral patients with a F2F cardiology visit under Usual Care and eConsult Approach .
Seen at Office Visit Appointment CostCare Group Usual Care eConsult Usual Care eConsultGroup 1 1 1 $82 $74Group 2 14 14 $1,720 No changeGroup 3 1 1 $295 $266Group 4 7 7 $1,983 No changeGroup 5 5 2 $377 $189Group 6 42 30 $5,104 $3,703Group 7 1 1 $157 $118Group 8 21 17 $4,067 $3,313Group 9 40 5 $2,728 $366Group 10 197 59 $26,715 $6,522Group 11 10 6 $1,469 $925Group 12 51 34 $13,152 $8,806All Groups 391 178 $57,849 $27,983Test scenario assumes 500 referrals .
Quality Impact: CeSM projections using the Test Scenario suggest improvement in the quality of care under Cardiology eConsults (Table 7). The most important potential for quality improvement projected by the CeSM is that 23.6 percent or 92 more patients have their condition assessed by a cardiologist under the eConsults Approach than Usual Care. Under the eConsults Approach, 96.6 percent of referral requests, with accompanying patient medical history and related documentation, are reviewed by the cardiologist reviewer and a recommendation is sent back to the PCP regarding further care for the patient. Under the Usual Care Approach, the patient’s condition is reviewed by a cardiologist when the patient arrives for a F2F appointment, which, in the Test Scenario, was assumed to occur in 81 percent of new and 75 percent of established patient referrals.
Table 7. Cardiology eConsults: Projected changes in quality of care for 500 referralsCases Reviewed by Cardiologist
F2F Visits with Cardiologist
Missed Cardiology Appointments
Referral Type % change (count) % change (count) % change (count)Overall, New & Established 23 .6% (92) -54 .6% (-213) -57 .4% (-32)New Only 19 .5% (41) -66 .0% (-140) -75 .2% (-23)Established only 28 .5% (51) -41 .0% (-73) -34 .2% (-8)
A cardiologist review, which typically takes 5 to 7 minutes, is not designed to be equivalent to a F2F cardiology appointment. Instead, the cardiologist reviewer triages the patient into one of three groups: needing a F2F appointment with a cardiologist, needing additional tests or follow-up care from the PCP, or not needing additional care for the cardiac concern. Unfortunately, there is little evidence regarding long-term health outcomes for cardiology eConsults. If the cardiologist review provides a functionally comparable level of the care needed for less complex cardiology cases, the increased number of patients whose cases are assessed by a cardiologist could lead to important long-term health benefits. Notably, the cardiologist review under eConsults occurs within 48 hours when the CHC, Inc. protocol is followed. This
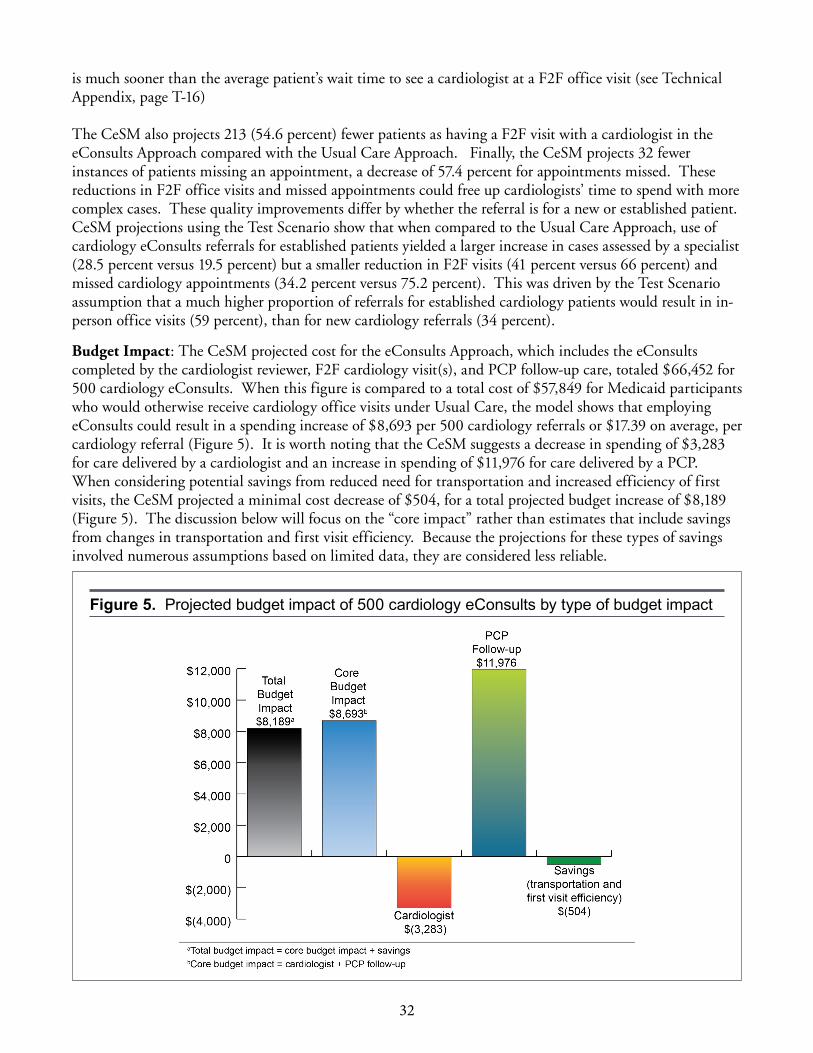
32
is much sooner than the average patient’s wait time to see a cardiologist at a F2F office visit (see Technical Appendix, page T-16)
The CeSM also projects 213 (54.6 percent) fewer patients as having a F2F visit with a cardiologist in the eConsults Approach compared with the Usual Care Approach. Finally, the CeSM projects 32 fewer instances of patients missing an appointment, a decrease of 57.4 percent for appointments missed. These reductions in F2F office visits and missed appointments could free up cardiologists’ time to spend with more complex cases. These quality improvements differ by whether the referral is for a new or established patient. CeSM projections using the Test Scenario show that when compared to the Usual Care Approach, use of cardiology eConsults referrals for established patients yielded a larger increase in cases assessed by a specialist (28.5 percent versus 19.5 percent) but a smaller reduction in F2F visits (41 percent versus 66 percent) and missed cardiology appointments (34.2 percent versus 75.2 percent). This was driven by the Test Scenario assumption that a much higher proportion of referrals for established cardiology patients would result in in-person office visits (59 percent), than for new cardiology referrals (34 percent).
Budget Impact: The CeSM projected cost for the eConsults Approach, which includes the eConsults completed by the cardiologist reviewer, F2F cardiology visit(s), and PCP follow-up care, totaled $66,452 for 500 cardiology eConsults. When this figure is compared to a total cost of $57,849 for Medicaid participants who would otherwise receive cardiology office visits under Usual Care, the model shows that employing eConsults could result in a spending increase of $8,693 per 500 cardiology referrals or $17.39 on average, per cardiology referral (Figure 5). It is worth noting that the CeSM suggests a decrease in spending of $3,283 for care delivered by a cardiologist and an increase in spending of $11,976 for care delivered by a PCP. When considering potential savings from reduced need for transportation and increased efficiency of first visits, the CeSM projected a minimal cost decrease of $504, for a total projected budget increase of $8,189 (Figure 5). The discussion below will focus on the “core impact” rather than estimates that include savings from changes in transportation and first visit efficiency. Because the projections for these types of savings involved numerous assumptions based on limited data, they are considered less reliable.
Figure 5. Projected budget impact of 500 cardiology eConsults by type of budget impact
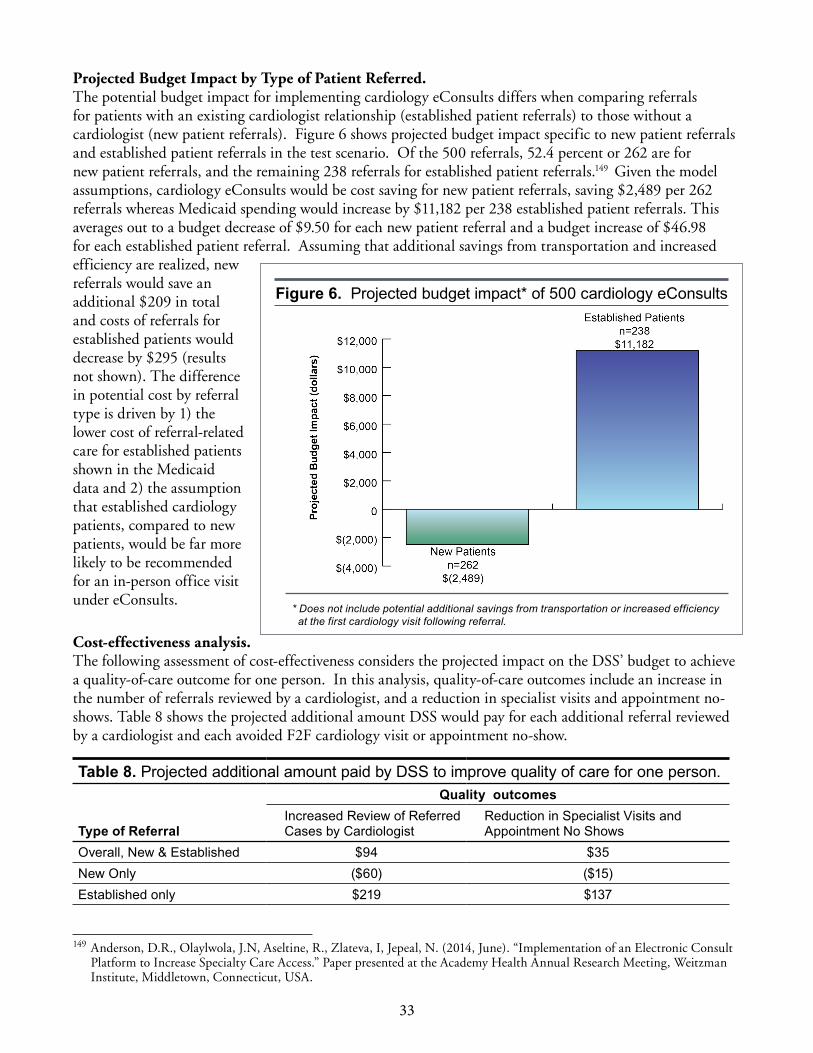
33
Projected Budget Impact by Type of Patient Referred. The potential budget impact for implementing cardiology eConsults differs when comparing referrals for patients with an existing cardiologist relationship (established patient referrals) to those without a cardiologist (new patient referrals). Figure 6 shows projected budget impact specific to new patient referrals and established patient referrals in the test scenario. Of the 500 referrals, 52.4 percent or 262 are for new patient referrals, and the remaining 238 referrals for established patient referrals.149 Given the model assumptions, cardiology eConsults would be cost saving for new patient referrals, saving $2,489 per 262 referrals whereas Medicaid spending would increase by $11,182 per 238 established patient referrals. This averages out to a budget decrease of $9.50 for each new patient referral and a budget increase of $46.98 for each established patient referral. Assuming that additional savings from transportation and increased efficiency are realized, new referrals would save an additional $209 in total and costs of referrals for established patients would decrease by $295 (results not shown). The difference in potential cost by referral type is driven by 1) the lower cost of referral-related care for established patients shown in the Medicaid data and 2) the assumption that established cardiology patients, compared to new patients, would be far more likely to be recommended for an in-person office visit under eConsults.
Cost-effectiveness analysis. The following assessment of cost-effectiveness considers the projected impact on the DSS’ budget to achieve a quality-of-care outcome for one person. In this analysis, quality-of-care outcomes include an increase in the number of referrals reviewed by a cardiologist, and a reduction in specialist visits and appointment no-shows. Table 8 shows the projected additional amount DSS would pay for each additional referral reviewed by a cardiologist and each avoided F2F cardiology visit or appointment no-show.
Table 8. Projected additional amount paid by DSS to improve quality of care for one person .Quality outcomes
Type of ReferralIncreased Review of Referred Cases by Cardiologist
Reduction in Specialist Visits and Appointment No Shows
Overall, New & Established $94 $35New Only ($60) ($15)Established only $219 $137
149 Anderson, D.R., Olaylwola, J.N, Aseltine, R., Zlateva, I, Jepeal, N. (2014, June). “Implementation of an Electronic Consult Platform to Increase Specialty Care Access.” Paper presented at the Academy Health Annual Research Meeting, Weitzman Institute, Middletown, Connecticut, USA.
Figure 6. Projected budget impact* of 500 cardiology eConsults
* Does not include potential additional savings from transportation or increased efficiency at the first cardiology visit following referral.
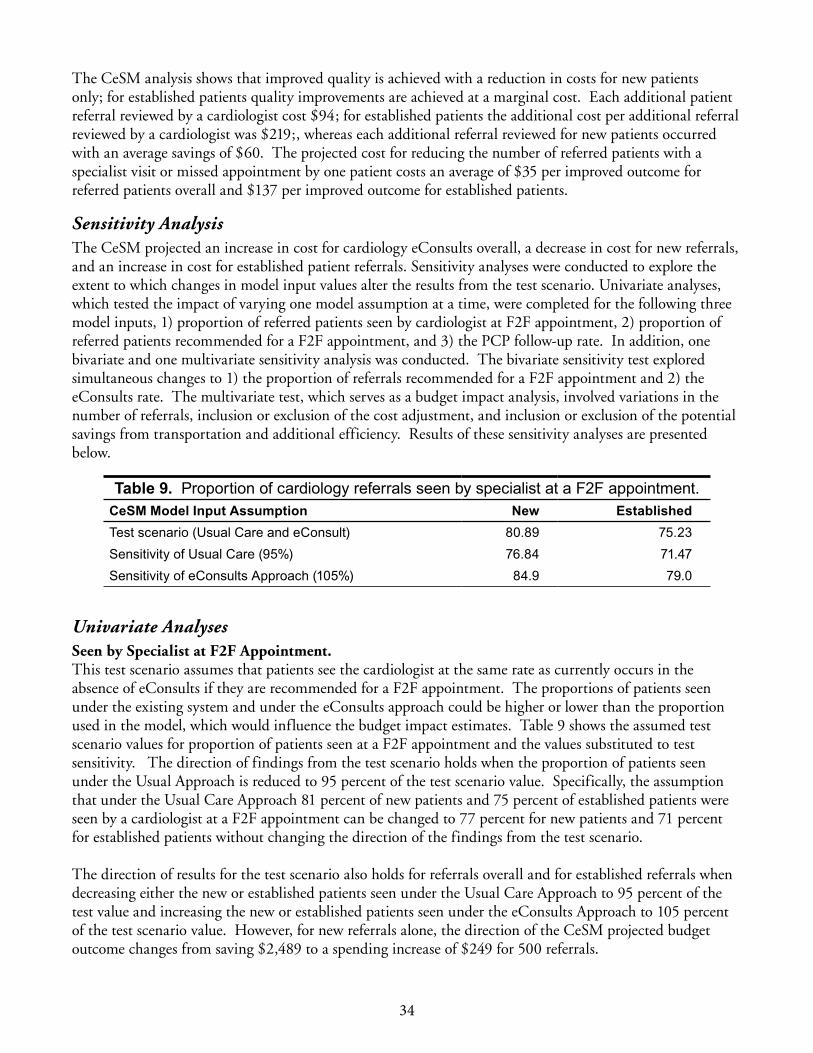
34
The CeSM analysis shows that improved quality is achieved with a reduction in costs for new patients only; for established patients quality improvements are achieved at a marginal cost. Each additional patient referral reviewed by a cardiologist cost $94; for established patients the additional cost per additional referral reviewed by a cardiologist was $219;, whereas each additional referral reviewed for new patients occurred with an average savings of $60. The projected cost for reducing the number of referred patients with a specialist visit or missed appointment by one patient costs an average of $35 per improved outcome for referred patients overall and $137 per improved outcome for established patients.
Sensitivity Analysis The CeSM projected an increase in cost for cardiology eConsults overall, a decrease in cost for new referrals, and an increase in cost for established patient referrals. Sensitivity analyses were conducted to explore the extent to which changes in model input values alter the results from the test scenario. Univariate analyses, which tested the impact of varying one model assumption at a time, were completed for the following three model inputs, 1) proportion of referred patients seen by cardiologist at F2F appointment, 2) proportion of referred patients recommended for a F2F appointment, and 3) the PCP follow-up rate. In addition, one bivariate and one multivariate sensitivity analysis was conducted. The bivariate sensitivity test explored simultaneous changes to 1) the proportion of referrals recommended for a F2F appointment and 2) the eConsults rate. The multivariate test, which serves as a budget impact analysis, involved variations in the number of referrals, inclusion or exclusion of the cost adjustment, and inclusion or exclusion of the potential savings from transportation and additional efficiency. Results of these sensitivity analyses are presented below.
Table 9. Proportion of cardiology referrals seen by specialist at a F2F appointment .CeSM Model Input Assumption New EstablishedTest scenario (Usual Care and eConsult) 80 .89 75 .23Sensitivity of Usual Care (95%) 76 .84 71 .47Sensitivity of eConsults Approach (105%) 84 .9 79 .0
Univariate AnalysesSeen by Specialist at F2F Appointment. This test scenario assumes that patients see the cardiologist at the same rate as currently occurs in the absence of eConsults if they are recommended for a F2F appointment. The proportions of patients seen under the existing system and under the eConsults approach could be higher or lower than the proportion used in the model, which would influence the budget impact estimates. Table 9 shows the assumed test scenario values for proportion of patients seen at a F2F appointment and the values substituted to test sensitivity. The direction of findings from the test scenario holds when the proportion of patients seen under the Usual Approach is reduced to 95 percent of the test scenario value. Specifically, the assumption that under the Usual Care Approach 81 percent of new patients and 75 percent of established patients were seen by a cardiologist at a F2F appointment can be changed to 77 percent for new patients and 71 percent for established patients without changing the direction of the findings from the test scenario.
The direction of results for the test scenario also holds for referrals overall and for established referrals when decreasing either the new or established patients seen under the Usual Care Approach to 95 percent of the test value and increasing the new or established patients seen under the eConsults Approach to 105 percent of the test scenario value. However, for new referrals alone, the direction of the CeSM projected budget outcome changes from saving $2,489 to a spending increase of $249 for 500 referrals.

35
Recommendation for a F2F Appointment. The CeSM projected budget impact conclusions for the test scenario hold when the proportion of patients recommended for a F2F appointment (34 percent for new patient referrals and 59 percent for established patient referrals) increases to 110 percent of the test scenario value for new and established patient referrals simultaneously. The budget impact is still cost-increasing for referrals overall and for established patient referrals and is still cost decreasing for new patient referrals when assuming 37.4 percent of new patients and 64.9 percent of established patients are recommended for a F2F appointment.
PCP Follow-up. The test scenario assumes that the cardiology reviewer will recommend that 75 percent of the patients not recommended for a cardiologist visit will require additional care management and/or tests from their PCPs. The sensitivity test explored the projected budget impact by varying this assumption from 0-75 percent. Results are shown in Figure 7. The potential budget impact of using an eConsult for any non-urgent cardiology referral was projected to be cost-neutral or cost-saving at low levels of PCP follow-up. Holding the rest of the test scenario constant, using eConsults would still be cost-saving for new cardiology referrals and cost-increasing for established patient referrals regardless of the 0-75 percent threshold assumed for patients needing PCP follow-up.
($15,000)
($10,000)
($5,000)
$0
$5,000
$10,000
$15,000
0% 10% 20% 30% 40% 50% 60% 70%
Proj
ecte
d B
udge
t Im
pact
Proportion of Avoided Cardiologist Visits Newly Managed by PCP
Referrals Overall New Referrals Established Patient
Figure 7. Cardiology eConsult budget impact projections for 500 referrals a varying levels of increased demand for PCP case management
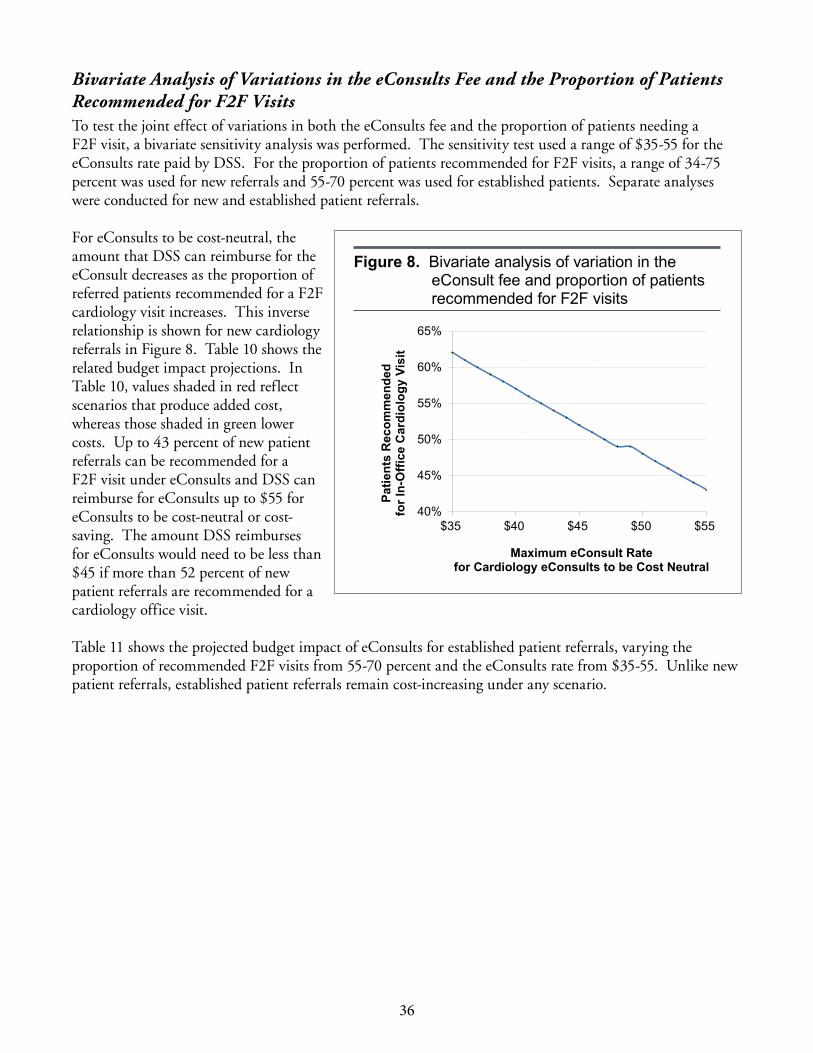
36
Bivariate Analysis of Variations in the eConsults Fee and the Proportion of Patients Recommended for F2F VisitsTo test the joint effect of variations in both the eConsults fee and the proportion of patients needing a F2F visit, a bivariate sensitivity analysis was performed. The sensitivity test used a range of $35-55 for the eConsults rate paid by DSS. For the proportion of patients recommended for F2F visits, a range of 34-75 percent was used for new referrals and 55-70 percent was used for established patients. Separate analyses were conducted for new and established patient referrals.
For eConsults to be cost-neutral, the amount that DSS can reimburse for the eConsult decreases as the proportion of referred patients recommended for a F2F cardiology visit increases. This inverse relationship is shown for new cardiology referrals in Figure 8. Table 10 shows the related budget impact projections. In Table 10, values shaded in red reflect scenarios that produce added cost, whereas those shaded in green lower costs. Up to 43 percent of new patient referrals can be recommended for a F2F visit under eConsults and DSS can reimburse for eConsults up to $55 for eConsults to be cost-neutral or cost-saving. The amount DSS reimburses for eConsults would need to be less than $45 if more than 52 percent of new patient referrals are recommended for a cardiology office visit.
Table 11 shows the projected budget impact of eConsults for established patient referrals, varying the proportion of recommended F2F visits from 55-70 percent and the eConsults rate from $35-55. Unlike new patient referrals, established patient referrals remain cost-increasing under any scenario.
40%
45%
50%
55%
60%
65%
$35 $40 $45 $50 $55
Patie
nts
Rec
omm
ende
d fo
r In-
Offi
ce C
ardi
olog
y Vi
sit
Maximum eConsult Rate for Cardiology eConsults to be Cost Neutral
Figure 8. Bivariate analysis of variation in the eConsult fee and proportion of patients recommended for F2F visits

37
Tabl
e 10
. Sen
sitiv
ity A
naly
sis:
Pro
ject
ed b
udge
t im
pact
of c
ardi
olog
y eC
onsu
lt fo
r new
car
diol
ogy
refe
rral
s--v
aryi
ng fa
ce-to
-face
vis
it re
com
men
datio
ns a
nd ra
te p
aid
per e
Con
sult .
Rat
e of
pay
men
t per
eC
onsu
lt .$5
5 $5
4 $5
3 $5
2 $5
1 $5
0 $4
9 $4
8 $4
7 $4
6 $4
5 $4
4 $4
3 $4
2 $4
1 $4
0 $3
9 $3
8 $3
7 $3
6 $3
5
Ref
erre
d pa
tient
s re
com
men
ded
for a
face
-to-fa
ce v
isit
34.0
% $
(2,4
89)
$(2
,742
) $
(2,9
95)
$(3
,249
) $
(3,5
02)
$(3
,755
) $
(4,0
09)
$(4
,262
) $
(4,5
15)
$(4
,768
) $
(5,0
22)
$(5
,275
) $
(5,5
28)
$(5
,782
) $
(6,0
35)
$(6
,288
) $
(6,5
41)
$(6
,795
) $
(7,0
48)
$(7
,301
) $
(7,5
54)
35.0
% $
(2,2
22)
$(2
,476
) $
(2,7
29)
$(2
,982
) $
(3,2
35)
$(3
,489
) $
(3,7
42)
$(3
,995
) $
(4,2
48)
$(4
,502
) $
(4,7
55)
$(5
,008
) $
(5,2
62)
$(5
,515
) $
(5,7
68)
$(6
,021
) $
(6,2
75)
$(6
,528
) $
(6,7
81)
$(7
,035
) $
(7,2
88)
36.0
% $
(1,9
56)
$(2
,209
) $
(2,4
62)
$(2
,715
) $
(2,9
69)
$(3
,222
) $
(3,4
75)
$(3
,729
) $
(3,9
82)
$(4
,235
) $
(4,4
88)
$(4
,742
) $
(4,9
95)
$(5
,248
) $
(5,5
01)
$(5
,755
) $
(6,0
08)
$(6
,261
) $
(6,5
15)
$(6
,768
) $
(7,0
21)
37.0
% $
(1,6
89)
$(1
,942
) $
(2,1
96)
$(2
,449
) $
(2,7
02)
$(2
,955
) $
(3,2
09)
$(3
,462
) $
(3,7
15)
$(3
,968
) $
(4,2
22)
$(4
,475
) $
(4,7
28)
$(4
,982
) $
(5,2
35)
$(5
,488
) $
(5,7
41)
$(5
,995
) $
(6,2
48)
$(6
,501
) $
(6,7
54)
38.0
% $
(1,4
22)
$(1
,676
) $
(1,9
29)
$(2
,182
) $
(2,4
35)
$(2
,689
) $
(2,9
42)
$(3
,195
) $
(3,4
49)
$(3
,702
) $
(3,9
55)
$(4
,208
) $
(4,4
62)
$(4
,715
) $
(4,9
68)
$(5
,221
) $
(5,4
75)
$(5
,728
) $
(5,9
81)
$(6
,235
) $
(6,4
88)
39.0
% $
(1,1
56)
$(1
,409
) $
(1,6
62)
$(1
,915
) $
(2,1
69)
$(2
,422
) $
(2,6
75)
$(2
,929
) $
(3,1
82)
$(3
,435
) $
(3,6
88)
$(3
,942
) $
(4,1
95)
$(4
,448
) $
(4,7
02)
$(4
,955
) $
(5,2
08)
$(5
,461
) $
(5,7
15)
$(5
,968
) $
(6,2
21)
40.0
% $
(889
) $
(1,1
42)
$(1
,396
) $
(1,6
49)
$(1
,902
) $
(2,1
55)
$(2
,409
) $
(2,6
62)
$(2
,915
) $
(3,1
68)
$(3
,422
) $
(3,6
75)
$(3
,928
) $
(4,1
82)
$(4
,435
) $
(4,6
88)
$(4
,941
) $
(5,1
95)
$(5
,448
) $
(5,7
01)
$(5
,955
)
41.0
% $
(622
) $
(876
) $
(1,1
29)
$(1
,382
) $
(1,6
35)
$(1
,889
) $
(2,1
42)
$(2
,395
) $
(2,6
49)
$(2
,902
) $
(3,1
55)
$(3
,408
) $
(3,6
62)
$(3
,915
) $
(4,1
68)
$(4
,421
) $
(4,6
75)
$(4
,928
) $
(5,1
81)
$(5
,435
) $
(5,6
88)
42.0
% $
(356
) $
(609
) $
(862
) $
(1,1
16)
$(1
,369
) $
(1,6
22)
$(1
,875
) $
(2,1
29)
$(2
,382
) $
(2,6
35)
$(2
,888
) $
(3,1
42)
$(3
,395
) $
(3,6
48)
$(3
,902
) $
(4,1
55)
$(4
,408
) $
(4,6
61)
$(4
,915
) $
(5,1
68)
$(5
,421
)
43.0
% $
(89)
$(3
42)
$(5
96)
$(8
49)
$(1
,102
) $
(1,3
55)
$(1
,609
) $
(1,8
62)
$(2
,115
) $
(2,3
69)
$(2
,622
) $
(2,8
75)
$(3
,128
) $
(3,3
82)
$(3
,635
) $
(3,8
88)
$(4
,141
) $
(4,3
95)
$(4
,648
) $
(4,9
01)
$(5
,155
)
44.0
% $
178
$(7
6) $
(329
) $
(582
) $
(835
) $
(1,0
89)
$(1
,342
) $
(1,5
95)
$(1
,849
) $
(2,1
02)
$(2
,355
) $
(2,6
08)
$(2
,862
) $
(3,1
15)
$(3
,368
) $
(3,6
22)
$(3
,875
) $
(4,1
28)
$(4
,381
) $
(4,6
35)
$(4
,888
)
45.0
% $
444
$19
1 $
(62)
$(3
16)
$(5
69)
$(8
22)
$(1
,075
) $
(1,3
29)
$(1
,582
) $
(1,8
35)
$(2
,088
) $
(2,3
42)
$(2
,595
) $
(2,8
48)
$(3
,102
) $
(3,3
55)
$(3
,608
) $
(3,8
61)
$(4
,115
) $
(4,3
68)
$(4
,621
)
46.0
% $
711
$45
8 $
204
$(4
9) $
(302
) $
(555
) $
(809
) $
(1,0
62)
$(1
,315
) $
(1,5
69)
$(1
,822
) $
(2,0
75)
$(2
,328
) $
(2,5
82)
$(2
,835
) $
(3,0
88)
$(3
,341
) $
(3,5
95)
$(3
,848
) $
(4,1
01)
$(4
,355
)
47.0
% $
978
$72
4 $
471
$21
8 $
(36)
$(2
89)
$(5
42)
$(7
95)
$(1
,049
) $
(1,3
02)
$(1
,555
) $
(1,8
08)
$(2
,062
) $
(2,3
15)
$(2
,568
) $
(2,8
22)
$(3
,075
) $
(3,3
28)
$(3
,581
) $
(3,8
35)
$(4
,088
)
48.0
% $
1,24
4 $
991
$73
8 $
484
$23
1 $
(22)
$(2
75)
$(5
29)
$(7
82)
$(1
,035
) $
(1,2
89)
$(1
,542
) $
(1,7
95)
$(2
,048
) $
(2,3
02)
$(2
,555
) $
(2,8
08)
$(3
,061
) $
(3,3
15)
$(3
,568
) $
(3,8
21)
49.0
% $
1,51
1 $
1,25
8 $
1,00
4 $
751
$49
8 $
245
$(9
) $
(262
) $
(515
) $
(769
) $
(1,0
22)
$(1
,275
) $
(1,5
28)
$(1
,782
) $
(2,0
35)
$(2
,288
) $
(2,5
42)
$(2
,795
) $
(3,0
48)
$(3
,301
) $
(3,5
55)
50.0
% $
1,77
8 $
1,52
4 $
1,27
1 $
1,01
8 $
764
$51
1 $
258
$5
$(2
49)
$(5
02)
$(7
55)
$(1
,008
) $
(1,2
62)
$(1
,515
) $
(1,7
68)
$(2
,022
) $
(2,2
75)
$(2
,528
) $
(2,7
81)
$(3
,035
) $
(3,2
88)
51.0
% $
2,04
4 $
1,79
1 $
1,53
8 $
1,28
4 $
1,03
1 $
778
$52
5 $
271
$18
$
(235
) $
(489
) $
(742
) $
(995
) $
(1,2
48)
$(1
,502
) $
(1,7
55)
$(2
,008
) $
(2,2
61)
$(2
,515
) $
(2,7
68)
$(3
,021
)
52.0
% $
2,31
1 $
2,05
8 $
1,80
4 $
1,55
1 $
1,29
8 $
1,04
4 $
791
$53
8 $
285
$31
$
(222
) $
(475
) $
(728
) $
(982
) $
(1,2
35)
$(1
,488
) $
(1,7
42)
$(1
,995
) $
(2,2
48)
$(2
,501
) $
(2,7
55)
53.0
% $
2,57
8 $
2,32
4 $
2,07
1 $
1,81
8 $
1,56
4 $
1,31
1 $
1,05
8 $
805
$55
1 $
298
$45
$
(209
) $
(462
) $
(715
) $
(968
) $
(1,2
22)
$(1
,475
) $
(1,7
28)
$(1
,981
) $
(2,2
35)
$(2
,488
)
54.0
% $
2,84
4 $
2,59
1 $
2,33
8 $
2,08
4 $
1,83
1 $
1,57
8 $
1,32
5 $
1,07
1 $
818
$56
5 $
311
$58
$
(195
) $
(448
) $
(702
) $
(955
) $
(1,2
08)
$(1
,462
) $
(1,7
15)
$(1
,968
) $
(2,2
21)
55.0
% $
3,11
1 $
2,85
8 $
2,60
4 $
2,35
1 $
2,09
8 $
1,84
4 $
1,59
1 $
1,33
8 $
1,08
5 $
831
$57
8 $
325
$72
$
(182
) $
(435
) $
(688
) $
(942
) $
(1,1
95)
$(1
,448
) $
(1,7
01)
$(1
,955
)
56.0
% $
3,37
7 $
3,12
4 $
2,87
1 $
2,61
8 $
2,36
4 $
2,11
1 $
1,85
8 $
1,60
5 $
1,35
1 $
1,09
8 $
845
$59
1 $
338
$85
$
(168
) $
(422
) $
(675
) $
(928
) $
(1,1
81)
$(1
,435
) $
(1,6
88)
57.0
% $
3,64
4 $
3,39
1 $
3,13
8 $
2,88
4 $
2,63
1 $
2,37
8 $
2,12
4 $
1,87
1 $
1,61
8 $
1,36
5 $
1,11
1 $
858
$60
5 $
352
$98
$
(155
) $
(408
) $
(662
) $
(915
) $
(1,1
68)
$(1
,421
)
58.0
% $
3,91
1 $
3,65
7 $
3,40
4 $
3,15
1 $
2,89
8 $
2,64
4 $
2,39
1 $
2,13
8 $
1,88
5 $
1,63
1 $
1,37
8 $
1,12
5 $
871
$61
8 $
365
$11
2 $
(142
) $
(395
) $
(648
) $
(901
) $
(1,1
55)
59.0
% $
4,17
7 $
3,92
4 $
3,67
1 $
3,41
8 $
3,16
4 $
2,91
1 $
2,65
8 $
2,40
5 $
2,15
1 $
1,89
8 $
1,64
5 $
1,39
1 $
1,13
8 $
885
$63
2 $
378
$12
5 $
(128
) $
(382
) $
(635
) $
(888
)
60.0
% $
4,44
4 $
4,19
1 $
3,93
8 $
3,68
4 $
3,43
1 $
3,17
8 $
2,92
4 $
2,67
1 $
2,41
8 $
2,16
5 $
1,91
1 $
1,65
8 $
1,40
5 $
1,15
2 $
898
$64
5 $
392
$13
8 $
(115
) $
(368
) $
(621
)
61.0
% $
4,71
1 $
4,45
7 $
4,20
4 $
3,95
1 $
3,69
8 $
3,44
4 $
3,19
1 $
2,93
8 $
2,68
5 $
2,43
1 $
2,17
8 $
1,92
5 $
1,67
1 $
1,41
8 $
1,16
5 $
912
$65
8 $
405
$15
2 $
(101
) $
(355
)
62.0
% $
4,97
7 $
4,72
4 $
4,47
1 $
4,21
8 $
3,96
4 $
3,71
1 $
3,45
8 $
3,20
4 $
2,95
1 $
2,69
8 $
2,44
5 $
2,19
1 $
1,93
8 $
1,68
5 $
1,43
2 $
1,17
8 $
925
$67
2 $
418
$16
5 $
(88)
63.0
% $
5,24
4 $
4,99
1 $
4,73
7 $
4,48
4 $
4,23
1 $
3,97
8 $
3,72
4 $
3,47
1 $
3,21
8 $
2,96
5 $
2,71
1 $
2,45
8 $
2,20
5 $
1,95
1 $
1,69
8 $
1,44
5 $
1,19
2 $
938
$68
5 $
432
$17
9
64.0
% $
5,51
1 $
5,25
7 $
5,00
4 $
4,75
1 $
4,49
8 $
4,24
4 $
3,99
1 $
3,73
8 $
3,48
5 $
3,23
1 $
2,97
8 $
2,72
5 $
2,47
1 $
2,21
8 $
1,96
5 $
1,71
2 $
1,45
8 $
1,20
5 $
952
$69
8 $
445
65.0
% $
5,77
7 $
5,52
4 $
5,27
1 $
5,01
8 $
4,76
4 $
4,51
1 $
4,25
8 $
4,00
4 $
3,75
1 $
3,49
8 $
3,24
5 $
2,99
1 $
2,73
8 $
2,48
5 $
2,23
2 $
1,97
8 $
1,72
5 $
1,47
2 $
1,21
8 $
965
$71
2
66.0
% $
6,06
6 $
5,81
3 $
5,55
9 $
5,30
6 $
5,05
3 $
4,79
9 $
4,54
6 $
4,29
3 $
4,04
0 $
3,78
6 $
3,53
3 $
3,28
0 $
3,02
6 $
2,77
3 $
2,52
0 $
2,26
7 $
2,01
3 $
1,76
0 $
1,50
7 $
1,25
4 $
1,00
0
67.0
% $
6,33
2 $
6,07
9 $
5,82
6 $
5,57
3 $
5,31
9 $
5,06
6 $
4,81
3 $
4,56
0 $
4,30
6 $
4,05
3 $
3,80
0 $
3,54
6 $
3,29
3 $
3,04
0 $
2,78
7 $
2,53
3 $
2,28
0 $
2,02
7 $
1,77
3 $
1,52
0 $
1,26
7
68.0
% $
6,59
9 $
6,34
6 $
6,09
3 $
5,83
9 $
5,58
6 $
5,33
3 $
5,07
9 $
4,82
6 $
4,57
3 $
4,32
0 $
4,06
6 $
3,81
3 $
3,56
0 $
3,30
7 $
3,05
3 $
2,80
0 $
2,54
7 $
2,29
3 $
2,04
0 $
1,78
7 $
1,53
4
69.0
% $
6,86
6 $
6,61
2 $
6,35
9 $
6,10
6 $
5,85
3 $
5,59
9 $
5,34
6 $
5,09
3 $
4,84
0 $
4,58
6 $
4,33
3 $
4,08
0 $
3,82
6 $
3,57
3 $
3,32
0 $
3,06
7 $
2,81
3 $
2,56
0 $
2,30
7 $
2,05
4 $
1,80
0
70.0
% $
7,13
2 $
6,87
9 $
6,62
6 $
6,37
3 $
6,11
9 $
5,86
6 $
5,61
3 $
5,35
9 $
5,10
6 $
4,85
3 $
4,60
0 $
4,34
6 $
4,09
3 $
3,84
0 $
3,58
7 $
3,33
3 $
3,08
0 $
2,82
7 $
2,57
3 $
2,32
0 $
2,06
7
71.0
% $
6,87
1 $
6,61
8 $
6,36
4 $
6,11
1 $
5,85
8 $
5,60
5 $
5,35
1 $
5,09
8 $
4,84
5 $
4,59
2 $
4,33
8 $
4,08
5 $
3,83
2 $
3,57
8 $
3,32
5 $
3,07
2 $
2,81
9 $
2,56
5 $
2,31
2 $
2,05
9 $
1,80
6
72.0
% $
7,13
8 $
6,88
4 $
6,63
1 $
6,37
8 $
6,12
5 $
5,87
1 $
5,61
8 $
5,36
5 $
5,11
1 $
4,85
8 $
4,60
5 $
4,35
2 $
4,09
8 $
3,84
5 $
3,59
2 $
3,33
9 $
3,08
5 $
2,83
2 $
2,57
9 $
2,32
5 $
2,07
2
73.0
% $
7,40
4 $
7,15
1 $
6,89
8 $
6,64
4 $
6,39
1 $
6,13
8 $
5,88
5 $
5,63
1 $
5,37
8 $
5,12
5 $
4,87
2 $
4,61
8 $
4,36
5 $
4,11
2 $
3,85
8 $
3,60
5 $
3,35
2 $
3,09
9 $
2,84
5 $
2,59
2 $
2,33
9
74.0
% $
7,67
1 $
7,41
8 $
7,16
4 $
6,91
1 $
6,65
8 $
6,40
5 $
6,15
1 $
5,89
8 $
5,64
5 $
5,39
1 $
5,13
8 $
4,88
5 $
4,63
2 $
4,37
8 $
4,12
5 $
3,87
2 $
3,61
9 $
3,36
5 $
3,11
2 $
2,85
9 $
2,60
5
75.0
% $
7,93
8 $
7,68
4 $
7,43
1 $
7,17
8 $
6,92
5 $
6,67
1 $
6,41
8 $
6,16
5 $
5,91
1 $
5,65
8 $
5,40
5 $
5,15
2 $
4,89
8 $
4,64
5 $
4,39
2 $
4,13
9 $
3,88
5 $
3,63
2 $
3,37
9 $
3,12
5 $
2,87
2
Doe
s no
t inc
lude
pot
entia
l sav
ings
from
tran
spor
tatio
n an
d im
prov
ed e
ffici
ency
at t
he fi
rst v
isit .
The
re is
mor
e un
certa
inty
in e
stim
ates
incl
udin
g th
ese
savi
ngs .

38
Tabl
e 1
1. S
ensi
tivity
Ana
lysi
s: P
roje
cted
bud
get i
mpa
ct o
f car
diol
ogy
eCon
sult
for e
stab
lishe
d ca
rdio
logy
refe
rral
s--v
aryi
ng fa
ce-to
-face
vis
it re
com
men
datio
ns a
nd ra
te p
aid
per e
Con
sult .
Rat
e of
pay
men
t per
eC
onsu
lt .
$55
$54
$53
$52
$51
$50
$49
$48
$47
$46
$45
$44
$43
$42
$41
$40
$39
$38
$37
$36
$35
Ref
erre
d P
atie
nts
Rec
omm
ende
d fo
r a F
ace
to F
ace
visi
t55
.0%
10,8
91
10,6
61
10,4
31
10,2
01
9,97
1 9,
741
9,51
1 9,
281
9,05
1 8,
821
8,59
1 8,
361
8,13
1 7,
901
7,67
0 7,
440
7,21
0 6,
980
6,75
0 6,
520
6,29
0
56.0
%10
,964
10
,734
10
,504
10
,274
10
,044
9,
814
9,58
4 9,
354
9,12
4 8,
893
8,66
3 8,
433
8,20
3 7,
973
7,74
3 7,
513
7,28
3 7,
053
6,82
3 6,
593
6,36
3
57.0
%11
,037
10
,807
10
,577
10
,347
10
,116
9,
886
9,65
6 9,
426
9,19
6 8,
966
8,73
6 8,
506
8,27
6 8,
046
7,81
6 7,
586
7,35
6 7,
126
6,89
6 6,
666
6,43
6
58.0
%11
,109
10
,879
10
,649
10
,419
10
,189
9,
959
9,72
9 9,
499
9,26
9 9,
039
8,80
9 8,
579
8,34
9 8,
119
7,88
9 7,
659
7,42
9 7,
198
6,96
8 6,
738
6,50
8
59.0
%11
,182
10
,952
10
,722
10
,492
10
,262
10
,032
9,
802
9,57
2 9,
342
9,11
2 8,
882
8,65
2 8,
421
8,19
1 7,
961
7,73
1 7,
501
7,27
1 7,
041
6,81
1 6,
581
60.0
%11
,255
11
,025
10
,795
10
,565
10
,335
10
,105
9,
875
9,64
4 9,
414
9,18
4 8,
954
8,72
4 8,
494
8,26
4 8,
034
7,80
4 7,
574
7,34
4 7,
114
6,88
4 6,
654
61.0
%11
,328
11
,098
10
,867
10
,637
10
,407
10
,177
9,
947
9,71
7 9,
487
9,25
7 9,
027
8,79
7 8,
567
8,33
7 8,
107
7,87
7 7,
647
7,41
7 7,
187
6,95
6 6,
726
62.0
%11
,400
11
,170
10
,940
10
,710
10
,480
10
,250
10
,020
9,
790
9,56
0 9,
330
9,10
0 8,
870
8,64
0 8,
410
8,17
9 7,
949
7,71
9 7,
489
7,25
9 7,
029
6,79
9
63.0
%11
,473
11
,243
11
,013
10
,783
10
,553
10
,323
10
,093
9,
863
9,63
3 9,
402
9,17
2 8,
942
8,71
2 8,
482
8,25
2 8,
022
7,79
2 7,
562
7,33
2 7,
102
6,87
2
64.0
%11
,546
11
,316
11
,086
10
,856
10
,626
10
,395
10
,165
9,
935
9,70
5 9,
475
9,24
5 9,
015
8,78
5 8,
555
8,32
5 8,
095
7,86
5 7,
635
7,40
5 7,
175
6,94
5
65.0
%11
,618
11
,388
11
,158
10
,928
10
,698
10
,468
10
,238
10
,008
9,
778
9,54
8 9,
318
9,08
8 8,
858
8,62
8 8,
398
8,16
8 7,
938
7,70
7 7,
477
7,24
7 7,
017
66.0
%11
,691
11
,461
11
,231
11
,001
10
,771
10
,541
10
,311
10
,081
9,
851
9,62
1 9,
391
9,16
1 8,
930
8,70
0 8,
470
8,24
0 8,
010
7,78
0 7,
550
7,32
0 7,
090
67.0
%11
,764
11
,534
11
,304
11
,074
10
,844
10
,614
10
,384
10
,153
9,
923
9,69
3 9,
463
9,23
3 9,
003
8,77
3 8,
543
8,31
3 8,
083
7,85
3 7,
623
7,39
3 7,
163
68.0
%11
,837
11
,607
11
,376
11
,146
10
,916
10
,686
10
,456
10
,226
9,
996
9,76
6 9,
536
9,30
6 9,
076
8,84
6 8,
616
8,38
6 8,
156
7,92
6 7,
696
7,46
5 7,
235
69.0
%11
,909
11
,679
11
,449
11
,219
10
,989
10
,759
10
,529
10
,299
10
,069
9,
839
9,60
9 9,
379
9,14
9 8,
919
8,68
9 8,
458
8,22
8 7,
998
7,76
8 7,
538
7,30
8
70.0
%11
,982
11
,752
11
,522
11
,292
11
,062
10
,832
10
,602
10
,372
10
,142
9,
912
9,68
1 9,
451
9,22
1 8,
991
8,76
1 8,
531
8,30
1 8,
071
7,84
1 7,
611
7,38
1
Doe
s no
t inc
lude
pot
entia
l sav
ings
from
tran
spor
tatio
n an
d im
prov
ed e
ffici
ency
at t
he fi
rst v
isit .
The
re is
mor
e un
certa
inty
in e
stim
ates
incl
udin
g th
ese
savi
ngs .
-

39
Budget Impact Analysis. This sensitivity test varies the number of referrals and two cost assumptions: the inclusion or exclusion of the cost adjustment and the inclusion or exclusion of the potential savings from transportation and additional efficiency. Four simulations, results shown in Table 12 and Figure 9, are used to show the potential budget outcomes when varying these assumptions. The projected budget impact is shown for 500 to 3,000 referrals, at increments of 500.
Table 12. Potential budget impact for cardiology eConsults, varying number of referralsModel Criteria Number of Referrals
Simulation AdjustedAdditional Savings 500 1,000 1,500 2,000 2,500 3,000
A* Yes No $8,693 $17,386 $26,080 $34,773 $43,466 $52,159 B Yes Yes $8,189 $16,379 $24,568 $32,758 $40,947 $49,137 C No No $7,542 $15,084 $22,627 $30,169 $37,711 $45,253 D No Yes $7,038 $14,077 $21,115 $28,154 $35,192 $42,231
*Simulation A with 500 referrals is the “Test Scenario .”
The range of the projected budget impact depends on the use of the cost adjustment and the potential additional savings. The most conservative cost simulations include the cost adjustment and exclude additional potential savings (Simulation A), whereas the least conservative scenario include additional potential savings and exclude the cost adjustment (Simulation D). All scenarios are cost-increasing. For 500 referrals, the net increase in DSS spending ranges between $7,038 and $8,693. The projected net increase ranges from $42,231 to $52,159 for 3,000 referrals.
$0 $20,000 $40,000 $60,000
500
1000
2000
3000
Projected Budget Impact
Num
ber o
f Car
diol
ogy
Ref
erra
ls
Scenario 1 Scenario 2 Scenario 3 Scenario 4
Figure 9. Projected budget impact from cardiology eConsults: Sensitivity of referral and cost assumptions
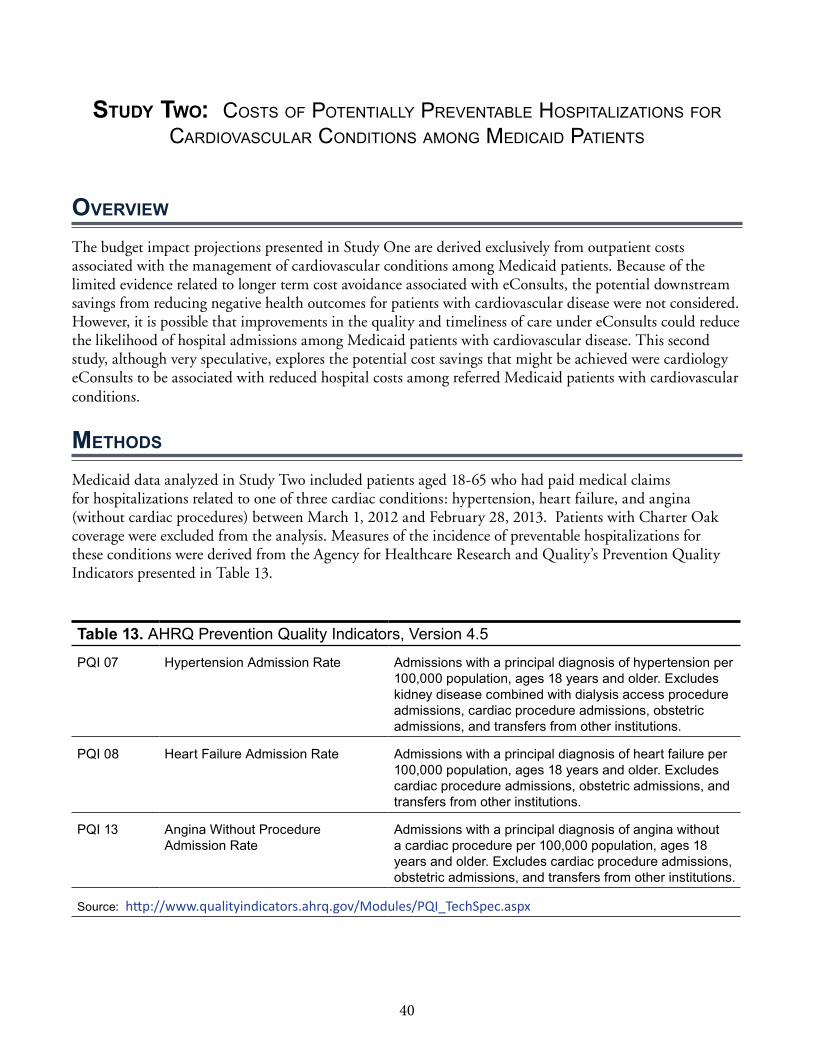
40
Study two: CosTs of PoTenTially PrevenTable hosPiTalizaTions for CardiovasCular CondiTions among mediCaid PaTienTs
ovErviEw
The budget impact projections presented in Study One are derived exclusively from outpatient costs associated with the management of cardiovascular conditions among Medicaid patients. Because of the limited evidence related to longer term cost avoidance associated with eConsults, the potential downstream savings from reducing negative health outcomes for patients with cardiovascular disease were not considered. However, it is possible that improvements in the quality and timeliness of care under eConsults could reduce the likelihood of hospital admissions among Medicaid patients with cardiovascular disease. This second study, although very speculative, explores the potential cost savings that might be achieved were cardiology eConsults to be associated with reduced hospital costs among referred Medicaid patients with cardiovascular conditions.
mEthodS
Medicaid data analyzed in Study Two included patients aged 18-65 who had paid medical claims for hospitalizations related to one of three cardiac conditions: hypertension, heart failure, and angina (without cardiac procedures) between March 1, 2012 and February 28, 2013. Patients with Charter Oak coverage were excluded from the analysis. Measures of the incidence of preventable hospitalizations for these conditions were derived from the Agency for Healthcare Research and Quality’s Prevention Quality Indicators presented in Table 13.
Table 13. AHRQ Prevention Quality Indicators, Version 4 .5
PQI 07 Hypertension Admission Rate Admissions with a principal diagnosis of hypertension per 100,000 population, ages 18 years and older . Excludes kidney disease combined with dialysis access procedure admissions, cardiac procedure admissions, obstetric admissions, and transfers from other institutions .
PQI 08 Heart Failure Admission Rate Admissions with a principal diagnosis of heart failure per 100,000 population, ages 18 years and older . Excludes cardiac procedure admissions, obstetric admissions, and transfers from other institutions .
PQI 13 Angina Without Procedure Admission Rate
Admissions with a principal diagnosis of angina without a cardiac procedure per 100,000 population, ages 18 years and older . Excludes cardiac procedure admissions, obstetric admissions, and transfers from other institutions .
Source: http://www.qualityindicators.ahrq.gov/Modules/PQI_TechSpec.aspx

41
findingS
Table 14 presents the cost of hospital care associated with potentially preventable hospitalizations for hypertension, heart failure, and angina (without cardiac procedures) among Connecticut Medicaid beneficiaries during the period of observation for this study.150 The total number and the mean and median annual costs, and percent of admissions occurring through the emergency department for each of the three cardiac-related PQI are presented in Table 14. The largest number of admissions and highest average costs were associated with heart failure. Hospital admissions for heart failure were approximately 3 times more common than admissions for hypertension, with an average cost per hospitalization of almost $10,000. Roughly 40-50 percent of admissions for these 3 conditions occurred through the ED. The total paid costs associated with hospitalization for these conditions exceeded $7.5 million over this period. Note that rates of hospitalization for these conditions among Medicaid beneficiaries are much higher than rates among the privately insured in Connecticut.151
Table 14. Annual hospitalization costs for patients with serious cardiac conditions
PQI
Number of Medicaid
Admissions 2012-13
Admissions through the Emergency
Department (%)
Mean Cost per
Admission
Median Cost per
Admission
Total Hospital Costs
2012
Hypertension 237 50 .6% $4,400 $3,160 $1,042,836
Heart Failure 682 42 .8% $9,550 $6,186 $6,513,378 Angina (without procedure) 53 41 .5% $2,689 $2,308 $142,539
Total $7,698,753
One critical question that emerges from this analysis concerns the extent to which patients hospitalized for these conditions had received care from either their PCP or a cardiologist in an outpatient setting prior to their hospitalization. Table 15 presents the distribution of Medicaid beneficiaries hospitalized for hypertension, heart failure, and angina based on their contact with a PCP and/or cardiologist in the six months prior to their hospitalization (March 1, 2012 to August 31, 2012). Results shown are based on an analysis of actual Medicaid claims for the 6 months between September 1, 2012 and February 28, 2013. Patients who saw both a PCP and cardiologist represent only 11 percent of patients hospitalized for these conditions, accounting for $767,143 in annual spending for potentially preventable hospitalizations. However, the average cost per patient with these visits is a stunning $8,161. Preventing just one hospitalization among these patients through an eConsult would almost completely offset the Study One projected cost of $8,693 per 500 cardiology referrals.
By contrast, two-thirds of patients saw neither a cardiologist nor a PCP in the six months prior to their hospitalization. Because eConsults are requested by a PCP, these patients would not have been eligible for an eConsult. However, these data indicate that interventions designed to reach patients who are hospitalized without seeing a PCP or cardiologist have a much greater potential for substantial savings to the Medicaid budget, as annual spending for hospitalizations among these patients exceeded $5.1 million dollars.
150 http://www.qualityindicators.ahrq.gov/modules/pqi_overview.aspx151 AHRQ PQI Report for SIM
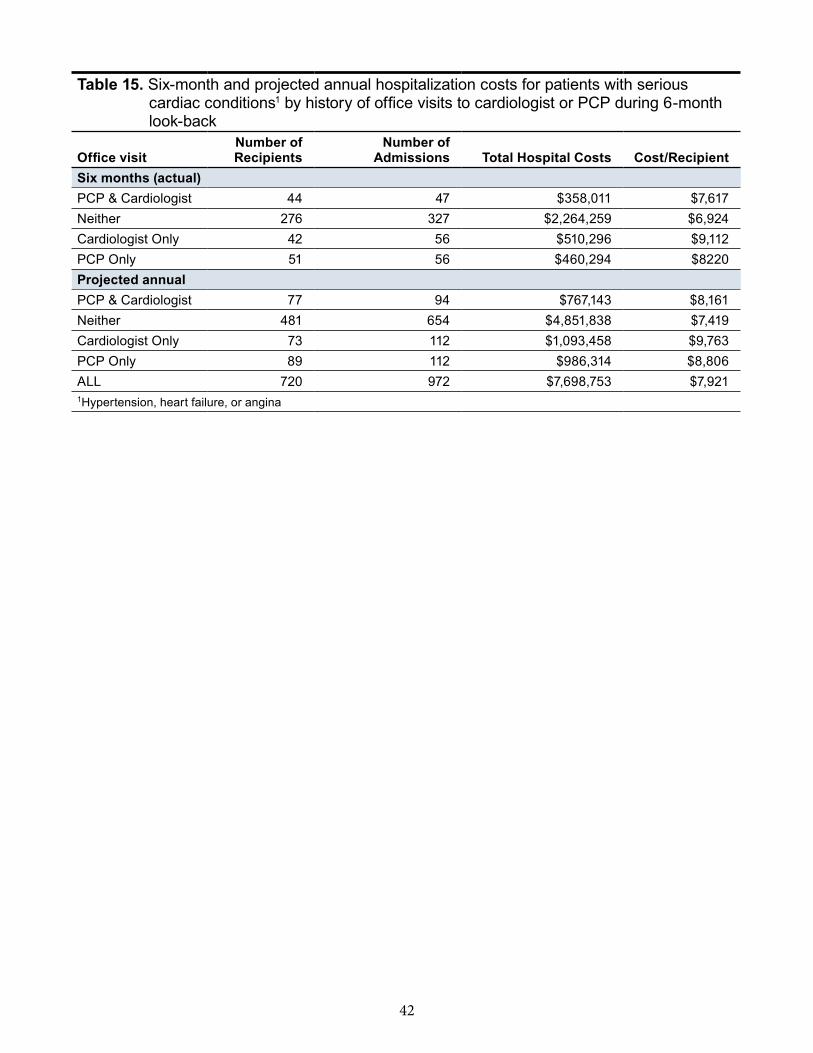
42
Table 15. Six-month and projected annual hospitalization costs for patients with serious cardiac conditions1 by history of office visits to cardiologist or PCP during 6-month look-back
Office visitNumber of Recipients
Number of Admissions Total Hospital Costs Cost/Recipient
Six months (actual)PCP & Cardiologist 44 47 $358,011 $7,617Neither 276 327 $2,264,259 $6,924Cardiologist Only 42 56 $510,296 $9,112PCP Only 51 56 $460,294 $8220Projected annualPCP & Cardiologist 77 94 $767,143 $8,161Neither 481 654 $4,851,838 $7,419Cardiologist Only 73 112 $1,093,458 $9,763PCP Only 89 112 $986,314 $8,806ALL 720 972 $7,698,753 $7,9211Hypertension, heart failure, or angina
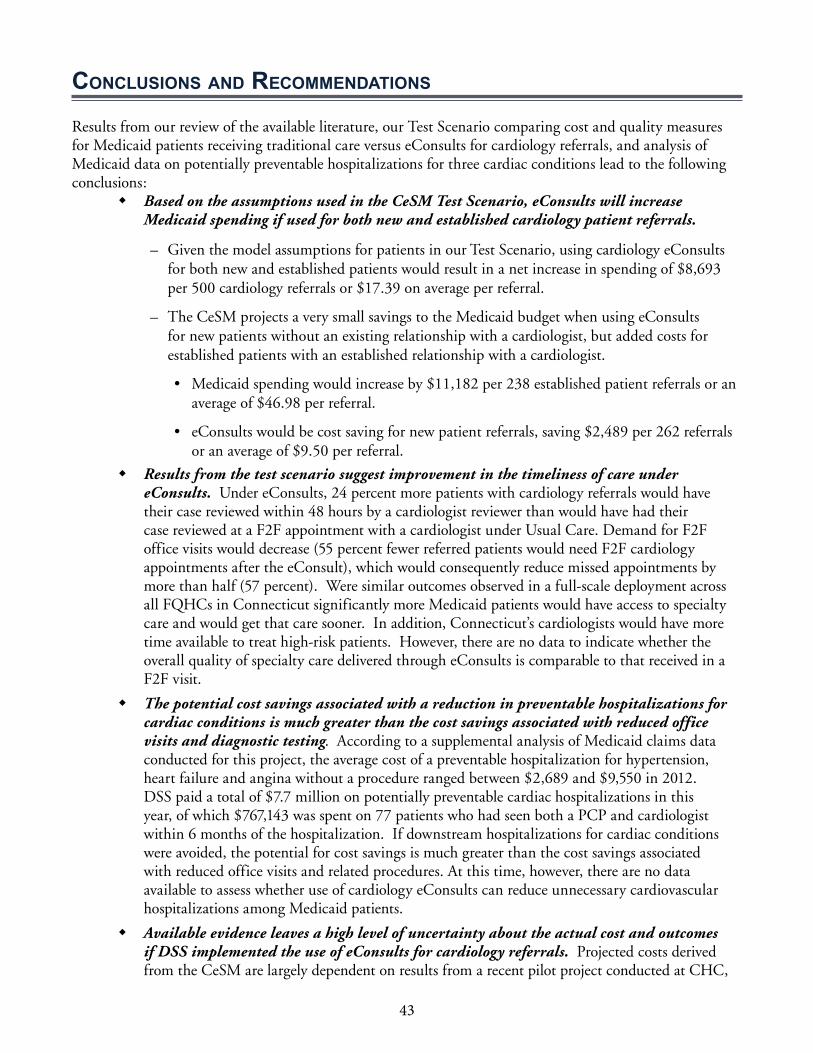
43
concluSionS and rEcommEndationS
Results from our review of the available literature, our Test Scenario comparing cost and quality measures for Medicaid patients receiving traditional care versus eConsults for cardiology referrals, and analysis of Medicaid data on potentially preventable hospitalizations for three cardiac conditions lead to the following conclusions:
� Based on the assumptions used in the CeSM Test Scenario, eConsults will increase Medicaid spending if used for both new and established cardiology patient referrals.
– Given the model assumptions for patients in our Test Scenario, using cardiology eConsults for both new and established patients would result in a net increase in spending of $8,693 per 500 cardiology referrals or $17.39 on average per referral.
– The CeSM projects a very small savings to the Medicaid budget when using eConsults for new patients without an existing relationship with a cardiologist, but added costs for established patients with an established relationship with a cardiologist.
• Medicaid spending would increase by $11,182 per 238 established patient referrals or an average of $46.98 per referral.
• eConsults would be cost saving for new patient referrals, saving $2,489 per 262 referrals or an average of $9.50 per referral.
� Results from the test scenario suggest improvement in the timeliness of care under eConsults. Under eConsults, 24 percent more patients with cardiology referrals would have their case reviewed within 48 hours by a cardiologist reviewer than would have had their case reviewed at a F2F appointment with a cardiologist under Usual Care. Demand for F2F office visits would decrease (55 percent fewer referred patients would need F2F cardiology appointments after the eConsult), which would consequently reduce missed appointments by more than half (57 percent). Were similar outcomes observed in a full-scale deployment across all FQHCs in Connecticut significantly more Medicaid patients would have access to specialty care and would get that care sooner. In addition, Connecticut’s cardiologists would have more time available to treat high-risk patients. However, there are no data to indicate whether the overall quality of specialty care delivered through eConsults is comparable to that received in a F2F visit.
� The potential cost savings associated with a reduction in preventable hospitalizations for cardiac conditions is much greater than the cost savings associated with reduced office visits and diagnostic testing. According to a supplemental analysis of Medicaid claims data conducted for this project, the average cost of a preventable hospitalization for hypertension, heart failure and angina without a procedure ranged between $2,689 and $9,550 in 2012. DSS paid a total of $7.7 million on potentially preventable cardiac hospitalizations in this year, of which $767,143 was spent on 77 patients who had seen both a PCP and cardiologist within 6 months of the hospitalization. If downstream hospitalizations for cardiac conditions were avoided, the potential for cost savings is much greater than the cost savings associated with reduced office visits and related procedures. At this time, however, there are no data available to assess whether use of cardiology eConsults can reduce unnecessary cardiovascular hospitalizations among Medicaid patients.
� Available evidence leaves a high level of uncertainty about the actual cost and outcomes if DSS implemented the use of eConsults for cardiology referrals. Projected costs derived from the CeSM are largely dependent on results from a recent pilot project conducted at CHC,

44
Inc., the largest FQHC in Connecticut. There are several limitations associated with these projections:
– Costs and outcomes comparing eConsults to Usual Care obtained by CHC, Inc. may not be generalizable to other FQHCs.
– Only new patient referrals were sent for an eConsult in the pilot project. For established patients, our models incorporated an upward adjustment of the costs observed for new patient referrals. It is unknown if these assumptions would hold if eConsults were implemented for established patients.
– The sensitivity analysis shows that conclusions from the Test Scenario simulation are highly sensitive to the assumptions used for the proportion of referred patients who need follow-up care from their PCP or a cardiologist after the eConsult occurs.
rEcommEndationS
� We recommend that DSS explore additional scenarios using CeSM to see how changes in assumptions related to cardiology eConsults result in different projected outcomes. The projections presented in this report are highly sensitive to assumptions regarding the cost of eConsults, the proportion of eConsults requiring F2F visits, and other inputs in the CeSM.
� We recommend that DSS pursue further research to assess the potential for cardiology eConsults to improve care and reduce hospital costs among Connecticut Medicaid patients. Rates of hospitalization for ambulatory sensitive cardiovascular conditions are higher among Connecticut Medicaid patients than for residents with private insurance. The potential for eConsults to reduce unnecessary hospital care for these conditions should be investigated.
� We recommend additional pilot studies involving multiple FQHCs that would be designed to:
– Establish if the utilization patterns and outcomes observed for new patient referrals in the CHC, Inc. pilot are realized by other FQHCs;
– Track actual DSS paid cost at referral-related care delivery points using Medicaid claims data for patients in the pilot;
– Examine DSS claims data for cardiology-referred patients treated with and without eConsults to examine whether eConsults reduces hospitalizations for ambulatory sensitive cardiovascular conditions;
– Include formal assessments of both patient and provider satisfaction with eConsults.
� We recommend DSS conduct more research on eConsults, particularly by capitalizing on the New England eConsults Network Project. This project entails a larger pilot of eConsults among five specialties (cardiology, dermatology, orthopedics, nephrology, and neurology are expected to be included) over the next 2 years under a grant from the Jesse B. Cox Charitable Trust Fund to CHC, Inc. Replication of this study in other Connecticut FQHCs would provide greater clarity regarding the impact of eConsults on the Connecticut Medicaid population and the DSS budget.
tEchnical aPPEndix for Study One
Cardiology eConsults Simulation Model

T-1
tEchnical aPPEndixThis technical appendix for the report “The Use of eConsults for Cardiology Referrals: A Policy Report for the University of Connecticut-Medicaid Partnership” provides detailed information on the design of the Cardiology eConsults Simulation Model (CeSM) and describes in detail how Connecticut Medicaid data were analyzed and integrated into the model. It is intended as a standalone expansion of the Methods for Study One and the underlying data used in the CeSM. Section I explains the CeSM, repeating the Methods section from the report; Section II describes the data sources used in the CeSM; Section III explains how the Medicaid data were analyzed and shows descriptive results from those analyses.
I. Cardiology eConsults Simulation Model Design. The Cardiology eConsults Simulation Model (CeSM) was designed to predict the impact on health care utilization, quality of care, and cost were DSS to implement a telehealth system where PCPs use eConsults when referring adult patients with Medicaid coverage to a cardiologist for non-urgent care. The CeSM provides simultaneous projections for how patient’s move through the referral process under the “Usual Care Approach,” which refers to traditional referrals for face-to-face (F2F) appointments, and under the “eConsults Approach” of referral-to-eConsult. Projections also include three measures for quality of care and the cost of care paid by DSS. Quality-of-care measures include: 1) Cases reviewed by cardiologist(s) for referred patients; 2) F2F visits with a cardiologist; and 3) missed appointments with the cardiologist. All projections are generated by the CeSM for new cardiology referrals (“new patients”), referrals for patients with an existing relationship with a cardiologist (“established patients”), and overall (both new and established patients). This distinction of referral type is included in the CeSM because evidence from similar interventions are for new referrals only and the cost of care differs for new and established patients. Budget impact estimates from the CeSM do not include the upfront and ongoing costs associated with the technology needed to support eConsults referrals.
The CeSM includes a series of interactive equations programmed into Microsoft Excel. The structure of the CeSM, shown in Figure T1, maps how patients flow through the referral process, including the type, timing and cost of health care received. Each stage of the flow diagram in Figure 1 has a proportionate probability that the given event will occur relative to the other values in the model. The CeSM is designed with a user interface, shown in Figure T2, to allow different scenarios to be run by selecting values for eleven model inputs. Model inputs include variables such as the rate paid for eConsults or proportion of patients recommended for a F2F appointment. Based on existing evidence, the model includes a range of possible values programmed for each input variable. The assumptions underlying the equations that drive CeSM and the range of possible input values were informed by a cardiology eConsults pilot study at Connecticut’s largest FQHC, Connecticut Medicaid data, and other telehealth interventions similar to eConsults. For the purposes of describing the potential health care and budget impact of the eConsults Approach for Connecticut Medicaid, CPHHP defined a set of assumed values for the eleven variable model inputs, referred to as the “Test Scenario.” The Findings section of this paper describes CeSM results for the Test Scenario and sensitivity test results show how projected outcomes would differ from the Test Scenario results if variable model input assumptions change.
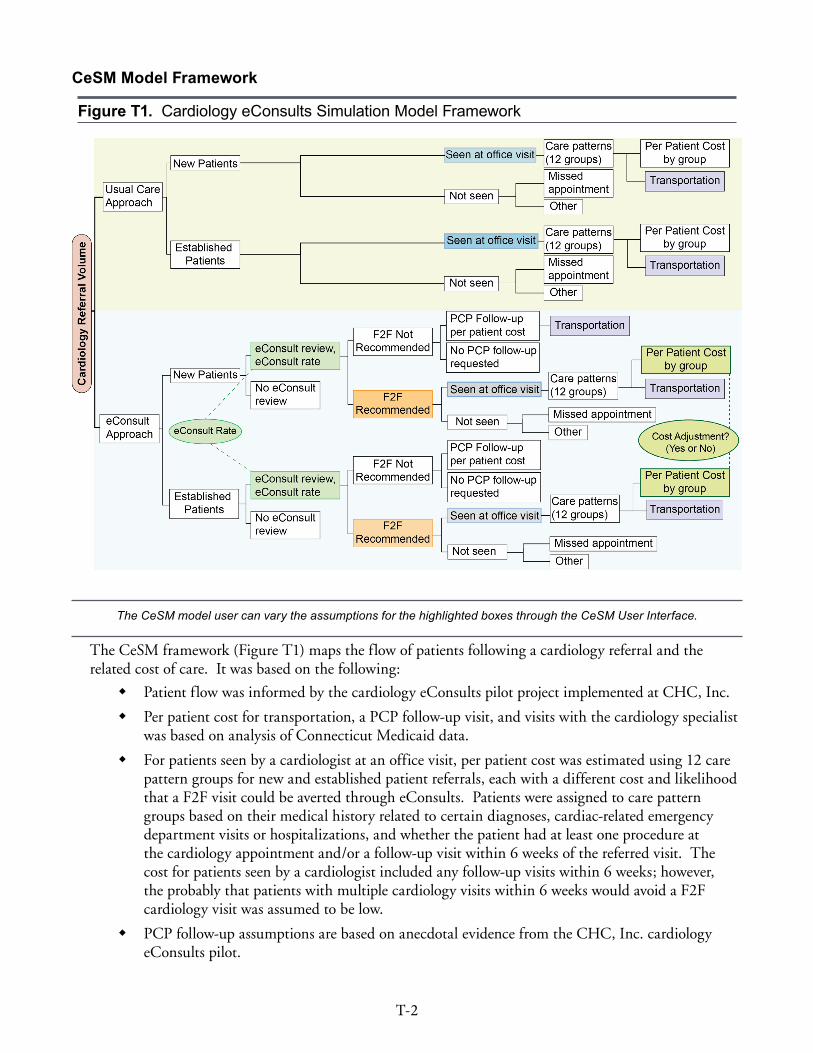
T-2
CeSM Model Framework
Figure T1. Cardiology eConsults Simulation Model Framework
The CeSM model user can vary the assumptions for the highlighted boxes through the CeSM User Interface.
The CeSM framework (Figure T1) maps the flow of patients following a cardiology referral and the related cost of care. It was based on the following:
� Patient flow was informed by the cardiology eConsults pilot project implemented at CHC, Inc.
� Per patient cost for transportation, a PCP follow-up visit, and visits with the cardiology specialist was based on analysis of Connecticut Medicaid data.
� For patients seen by a cardiologist at an office visit, per patient cost was estimated using 12 care pattern groups for new and established patient referrals, each with a different cost and likelihood that a F2F visit could be averted through eConsults. Patients were assigned to care pattern groups based on their medical history related to certain diagnoses, cardiac-related emergency department visits or hospitalizations, and whether the patient had at least one procedure at the cardiology appointment and/or a follow-up visit within 6 weeks of the referred visit. The cost for patients seen by a cardiologist included any follow-up visits within 6 weeks; however, the probably that patients with multiple cardiology visits within 6 weeks would avoid a F2F cardiology visit was assumed to be low.
� PCP follow-up assumptions are based on anecdotal evidence from the CHC, Inc. cardiology eConsults pilot.
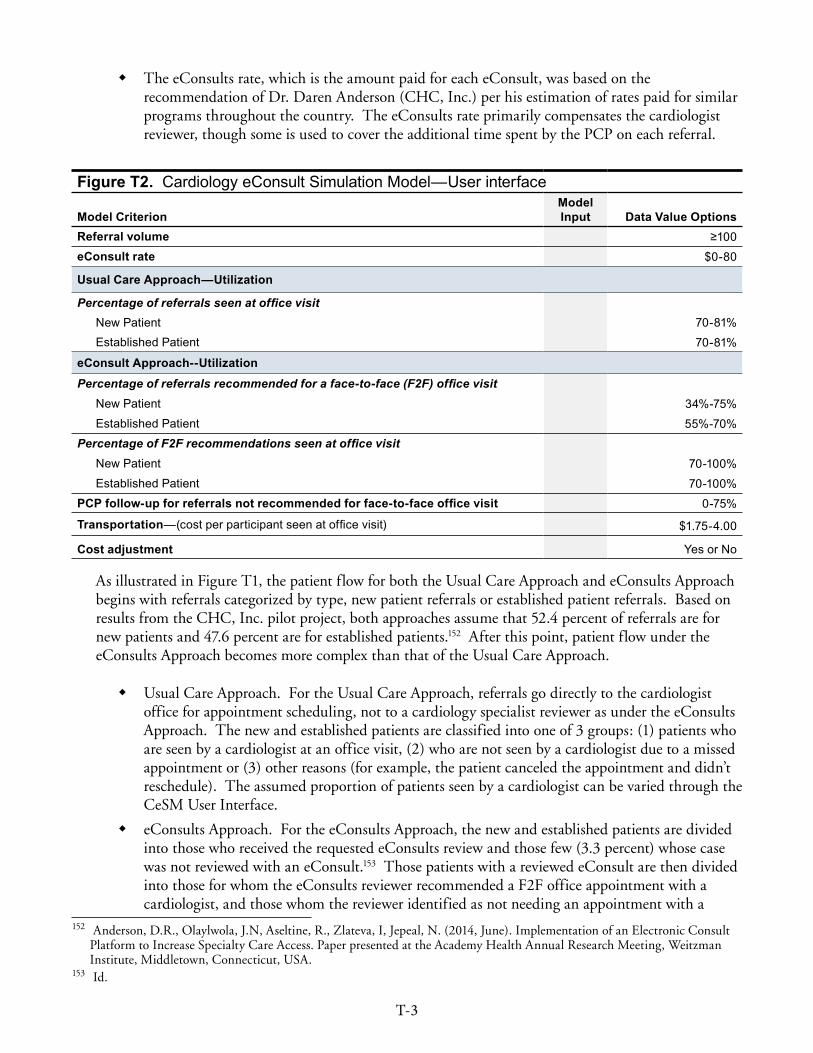
T-3
� The eConsults rate, which is the amount paid for each eConsult, was based on the recommendation of Dr. Daren Anderson (CHC, Inc.) per his estimation of rates paid for similar programs throughout the country. The eConsults rate primarily compensates the cardiologist reviewer, though some is used to cover the additional time spent by the PCP on each referral.
Figure T2. Cardiology eConsult Simulation Model—User interface
Model CriterionModel Input Data Value Options
Referral volume ≥100eConsult rate $0-80
Usual Care Approach—Utilization
Percentage of referrals seen at office visit New Patient 70-81%Established Patient 70-81%
eConsult Approach--UtilizationPercentage of referrals recommended for a face-to-face (F2F) office visit
New Patient 34%-75%Established Patient 55%-70%
Percentage of F2F recommendations seen at office visit New Patient 70-100%Established Patient 70-100%
PCP follow-up for referrals not recommended for face-to-face office visit 0-75%
Transportation—(cost per participant seen at office visit) $1 .75-4 .00
Cost adjustment Yes or No
As illustrated in Figure T1, the patient flow for both the Usual Care Approach and eConsults Approach begins with referrals categorized by type, new patient referrals or established patient referrals. Based on results from the CHC, Inc. pilot project, both approaches assume that 52.4 percent of referrals are for new patients and 47.6 percent are for established patients.152 After this point, patient flow under the eConsults Approach becomes more complex than that of the Usual Care Approach.
� Usual Care Approach. For the Usual Care Approach, referrals go directly to the cardiologist office for appointment scheduling, not to a cardiology specialist reviewer as under the eConsults Approach. The new and established patients are classified into one of 3 groups: (1) patients who are seen by a cardiologist at an office visit, (2) who are not seen by a cardiologist due to a missed appointment or (3) other reasons (for example, the patient canceled the appointment and didn’t reschedule). The assumed proportion of patients seen by a cardiologist can be varied through the CeSM User Interface.
� eConsults Approach. For the eConsults Approach, the new and established patients are divided into those who received the requested eConsults review and those few (3.3 percent) whose case was not reviewed with an eConsult.153 Those patients with a reviewed eConsult are then divided into those for whom the eConsults reviewer recommended a F2F office appointment with a cardiologist, and those whom the reviewer identified as not needing an appointment with a
152 Anderson, D.R., Olaylwola, J.N, Aseltine, R., Zlateva, I, Jepeal, N. (2014, June). Implementation of an Electronic Consult Platform to Increase Specialty Care Access. Paper presented at the Academy Health Annual Research Meeting, Weitzman Institute, Middletown, Connecticut, USA.
153 Id.
T-4
cardiologist. The proportion of referrals recommended for a F2F appointment is a variable in the CeSM User Interface.
– Patients not recommended for a F2F appointment may then be identified as recommended for and receiving follow-up tests or visits with the PCP based on the eConsults cardiologist reviewer’s recommendations. The proportion of patients sent back to the PCP after the review is a variable input in the CeSM User Interface. Patients with the PCP follow-up recommendation are assigned a fixed cost which is estimated to be the average reimbursed cost of a PCP visit without any procedures ($65 for new referrals and $60 for established patient referrals). Patients without a PCP follow-up recommendation are not assigned any additional costs.
– Patients recommended for a F2F appointment are grouped, like the Usual Care patients, into those who are seen by a cardiologist at an office visit and those who are not seen due to a missed appointment or other reasons.
Care Patterns. Regardless of referral approach, the patients who are seen are divided into twelve “care pattern” groups; these reflect patterns of medical care related to the first cardiology visit after the PCP referral (“index cardiology visit”). These twelve care pattern groups, derived from the Medicaid data, were based on the expectation that medical history influences both a patient’s likelihood of needing a F2F appointment following an eConsult and the intensity and cost of care provided by the cardiologist. The medical care events used in combination to categorize patients into care patterns included:
� One or more cardiology-related hospital stays within 6 weeks following the index cardiology visit154
� A diagnosis of one of three serious cardiac diseases: congestive heart failure, ischemic heart disease, myocardial infarction155
� One or more cardiac-related emergency department (ED) visits within 6 weeks following the index cardiology visit156
� One or more cardiac-related procedure(s) at the index visit or within 4 weeks following the index visit
� A follow-up visit with the cardiologist within 6 weeks following the index visit
Each group has a different associated cost and assumed likelihood that a F2F visit could be averted through an eConsult. Therefore, the distribution of patients by care pattern group differs between the Usual Care and eConsults Approach. The Usual Care Approach assumes that patients seen by a specialist follow the care pattern distribution from the Medicaid data. For the eConsults Approach, it is assumed that a greater proportion of the complex cases will be in the F2F-recommended group whereas the less complex cases have a higher likelihood of being resolved through an eConsult alone or an eConsult with PCP management. Cases are considered more complex if the patient had a cardiac-related hospital visit or certain cardiac conditions or had an emergency department visit. The least complex cases were defined as those without a hospital or ED visit, no follow-up cardiology visits and no cardiac procedures. Additional detail on the definition of the 12 care pattern groups is presented in Section III, pages T-18 through T-20.
154 Mary Ann Stemm (personal communication, March 7, 2014). 155 Christopher Pickett (personal communication, March 20, 2014)156 Mary Ann Stemm (personal communication, March 7, 2014).

T-5
Cost of Care Delivered by Cardiologist. Taking into account the relative proportions of care pattern groups, the CeSM calculates the related cost of care delivered by the cardiologist for each care pattern group. For the eConsults Approach, the cost of care delivered by the cardiologist includes the rate paid for the eConsult review and DSS’s reimbursed costs for the cardiology appointment and any related follow-up visits that occur within six weeks. The cost of an eConsult review is a variable input, selected by the CeSM user. This enables the user to explore the impact of the rate paid for an eConsult review on the overall cost and budget impact projected for the eConsults Approach.
The cost of a F2F cardiology appointment depends on the care pattern group to which a patient belongs. Thus, the CeSM calculates the cost of each care pattern group by multiplying a per patient cost for each of the 12 new patient care pattern groups and the 12 established patient care pattern groups by the estimated number of patients seen by a cardiologist in each group. The per patient costs of each care pattern group were determined from analyses of Connecticut Medicaid data, described in the Section III, page T-20. The costs of the following three types of service utilization were included as potentially related to care delivered by the cardiologist as a result of the PCP referral. Additional detail on the Current Procedural Terminology (CPT) codes used to identify the three types of service utilization is available on page T-18 in Section III.
� Office appointment (visit/consult code only)
� Follow-up visit(s) with a cardiologist within six weeks (visit/consult code, any outpatient cardiology provider)
� Procedures, such as an echocardiogram, rendered at the visit/consultation (any procedure codes other than the visit/consult code)
To summarize, the projected costs of care derived from the model are based on average costs calculated for the new and established patients by care pattern group. Thus, for both the Usual Care Approach and eConsults Approach, a total of 24 potential per patient cost figures are multiplied by the projected population size for the respective care pattern group to arrive at the cost of the cardiology appointment and related follow-up care.
Shifting from the Usual Care Approach to the eConsults Approach, fewer patients are expected to need F2F office visits and procedures delivered by the cardiologist. However, any projected reduction in referral-related care provided by a cardiologist and its cost should be balanced with the expectation that some of this care and the costs associated with it will shift to the PCP. Under the eConsults Approach, when a cardiology appointment is not recommended, the cardiology specialty reviewer may or may not ask the PCP to order additional procedures. If the cardiology specialist reviewer recommends additional procedures that are then ordered by the PCP for the patient, the costs of these procedures would not be avoided under the eConsults Approach. Because the amount paid for the F2F visit with the cardiologist might be the only avoided cost for these patients, the CeSM may underestimate the actual cost of treating them.
Cardiology Appointment Cost Adjustment. The CeSM includes an additional cost adjustment to DSS’s reimbursed cost for patients under the eConsults Approach who have a F2F cardiology appointment. Using average costs to estimate what DSS will pay for patients requiring F2F care from a cardiologist under the eConsults Approach could underestimate actual spending. This is because the least expensive patients may be the ones most likely not to need a F2F cardiology appointment under the eConsults Approach. The adjustment is a modified average cost for select care pattern groups. Calculated using the Medicaid data, the modified average
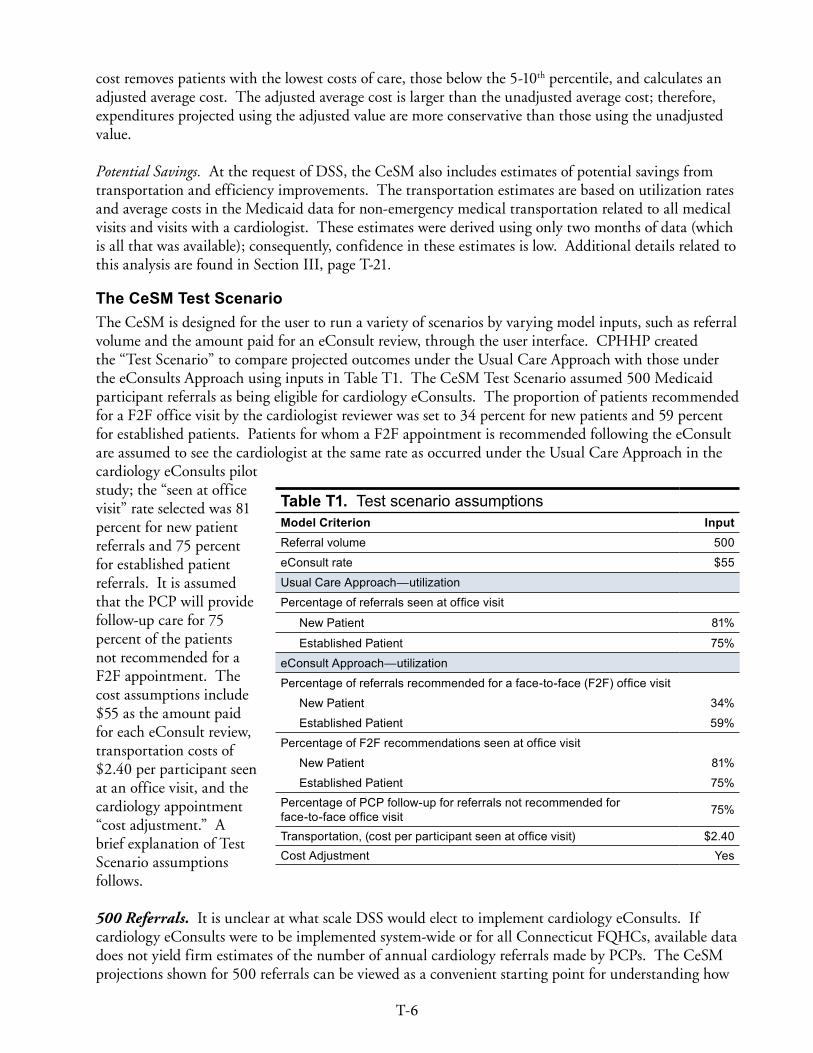
T-6
cost removes patients with the lowest costs of care, those below the 5-10th percentile, and calculates an adjusted average cost. The adjusted average cost is larger than the unadjusted average cost; therefore, expenditures projected using the adjusted value are more conservative than those using the unadjusted value.
Potential Savings. At the request of DSS, the CeSM also includes estimates of potential savings from transportation and efficiency improvements. The transportation estimates are based on utilization rates and average costs in the Medicaid data for non-emergency medical transportation related to all medical visits and visits with a cardiologist. These estimates were derived using only two months of data (which is all that was available); consequently, confidence in these estimates is low. Additional details related to this analysis are found in Section III, page T-21.
The CeSM Test Scenario The CeSM is designed for the user to run a variety of scenarios by varying model inputs, such as referral volume and the amount paid for an eConsult review, through the user interface. CPHHP created the “Test Scenario” to compare projected outcomes under the Usual Care Approach with those under the eConsults Approach using inputs in Table T1. The CeSM Test Scenario assumed 500 Medicaid participant referrals as being eligible for cardiology eConsults. The proportion of patients recommended for a F2F office visit by the cardiologist reviewer was set to 34 percent for new patients and 59 percent for established patients. Patients for whom a F2F appointment is recommended following the eConsult are assumed to see the cardiologist at the same rate as occurred under the Usual Care Approach in the cardiology eConsults pilot study; the “seen at office visit” rate selected was 81 percent for new patient referrals and 75 percent for established patient referrals. It is assumed that the PCP will provide follow-up care for 75 percent of the patients not recommended for a F2F appointment. The cost assumptions include $55 as the amount paid for each eConsult review, transportation costs of $2.40 per participant seen at an office visit, and the cardiology appointment “cost adjustment.” A brief explanation of Test Scenario assumptions follows.
500 Referrals. It is unclear at what scale DSS would elect to implement cardiology eConsults. If cardiology eConsults were to be implemented system-wide or for all Connecticut FQHCs, available data does not yield firm estimates of the number of annual cardiology referrals made by PCPs. The CeSM projections shown for 500 referrals can be viewed as a convenient starting point for understanding how
Table T1. Test scenario assumptionsModel Criterion InputReferral volume 500
eConsult rate $55
Usual Care Approach—utilization
Percentage of referrals seen at office visit
New Patient 81%
Established Patient 75%
eConsult Approach—utilization
Percentage of referrals recommended for a face-to-face (F2F) office visit
New Patient 34%
Established Patient 59%
Percentage of F2F recommendations seen at office visit
New Patient 81%
Established Patient 75%Percentage of PCP follow-up for referrals not recommended for face-to-face office visit 75%
Transportation, (cost per participant seen at office visit) $2 .40Cost Adjustment Yes
T-7
implementing cardiology eConsults can change quality of care and cost. For the Test Scenario values listed in Table T1, the projected budget impact for 500 referrals can be extrapolated proportionately to estimate the impact if additional cardiology referrals went through the eConsults Approach.
Recommended for a F2F appointment. For new patients, 34 percent are assumed to be recommended for a F2F appointment. This percentage (34 percent) is an upward adjustment from the cardiology eConsults pilot study, where only 27 percent of new patients were recommended for a F2F visit. The more conservative threshold of 34 percent was selected because there are no comparable studies on cardiology eConsults. Neither the CHC, Inc. pilot study nor published studies about related systems have explored the use of telehealth approaches similar to eConsults for established patient cardiology referrals. The Test Scenario uses 59 percent as the proportion of established patient referrals recommended for a F2F visit. This proportion is a 2.18 fold increase over the pilot study finding for new patients.
PCP Follow-up. It is assumed that, of the patients that the cardiologist reviewer did not recommend for a cardiology appointment, 75 percent will receive follow-up care from the referring PCP instead of from a cardiologist. The assumption of 75 percent is based on an estimate from the eConsults cardiologist reviewer for the CHC pilot study.157 The assumed cost of these visits is the average amount DSS reimburses for an evaluation and management visit. Confidence in this potential cost is low due to the paucity of data on this topic. However, it is included to reflect the likelihood that some amount of care and its associated costs will be shifted back to the PCP as the PCP is guided by the cardiologist reviewer to manage the care of the patient.
eConsult rate. The rate of $55 is within the range used by the FQHC currently piloting eConsults and elsewhere in the country for similar programs.158 The rate is intended to pay the cardiologist reviewer and compensate for some of the additional time spent by the PCP. Note that the rate paid for eConsults is not expected to cover the cost of technology infrastructure that PCPs may need to adopt and maintain.
Transportation. The average transportation cost per patient seen at an office visit (which includes patients with and without transportation costs) ranged from $1.91 to $2.40 according to the Medicaid data analysis conducted for this study. (For further details, refer to Section III, page T-20). The value of $2.40 was used in the Test Scenario. There is not a high level in confidence in this figure due to the limited data available to generate this estimate. Therefore, budget impact estimates show this value separately or clearly indicate when it is included.
II. Data sources used for input into CeSM.Numerical inputs into the Cardiology eConsults Simulation Model (CeSM) were supplied by a number of data sources. Each model input has a default value or range of values. The data sources are explained in detail below, and Table T2 summarizes the types of data extracted from each source.
157 Christopher Pickett (personal communication, July 12, 2014). Re: Dr. Pickett’s experience carrying out cardiology eConsults for the Community Health Center, Inc. pilot project. Dr. Pickett provided an anecdotal estimate that of the patients not recommended for a F2F cardiology appointment, only 25 percent had a case profile that suggested they would not need additional management or tests carried out by the PCP.
158 Daren Anderson (personal communication, April 8, 2014).
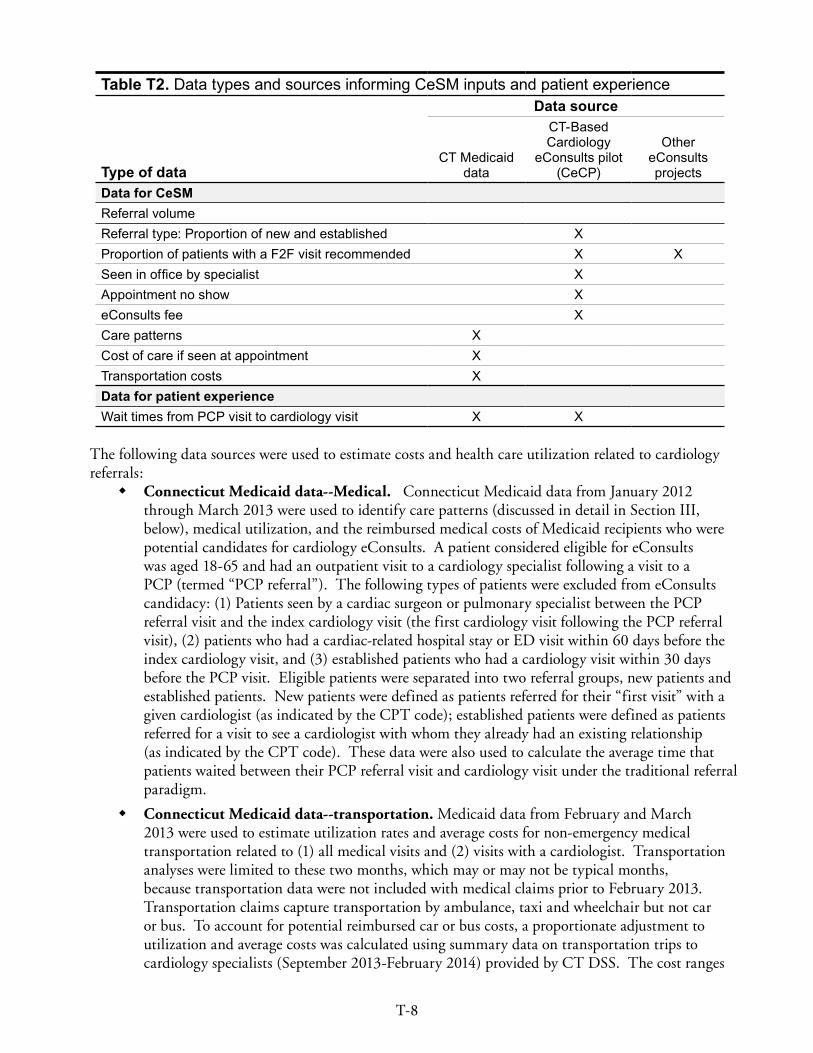
T-8
Table T2. Data types and sources informing CeSM inputs and patient experience Data source
Type of data CT Medicaid
data
CT-Based Cardiology
eConsults pilot (CeCP)
Other eConsults projects
Data for CeSMReferral volumeReferral type: Proportion of new and established XProportion of patients with a F2F visit recommended X X Seen in office by specialist XAppointment no show XeConsults fee XCare patterns XCost of care if seen at appointment XTransportation costs XData for patient experienceWait times from PCP visit to cardiology visit X X
The following data sources were used to estimate costs and health care utilization related to cardiology referrals:
� Connecticut Medicaid data--Medical. Connecticut Medicaid data from January 2012 through March 2013 were used to identify care patterns (discussed in detail in Section III, below), medical utilization, and the reimbursed medical costs of Medicaid recipients who were potential candidates for cardiology eConsults. A patient considered eligible for eConsults was aged 18-65 and had an outpatient visit to a cardiology specialist following a visit to a PCP (termed “PCP referral”). The following types of patients were excluded from eConsults candidacy: (1) Patients seen by a cardiac surgeon or pulmonary specialist between the PCP referral visit and the index cardiology visit (the first cardiology visit following the PCP referral visit), (2) patients who had a cardiac-related hospital stay or ED visit within 60 days before the index cardiology visit, and (3) established patients who had a cardiology visit within 30 days before the PCP visit. Eligible patients were separated into two referral groups, new patients and established patients. New patients were defined as patients referred for their “first visit” with a given cardiologist (as indicated by the CPT code); established patients were defined as patients referred for a visit to see a cardiologist with whom they already had an existing relationship (as indicated by the CPT code). These data were also used to calculate the average time that patients waited between their PCP referral visit and cardiology visit under the traditional referral paradigm.
� Connecticut Medicaid data--transportation. Medicaid data from February and March 2013 were used to estimate utilization rates and average costs for non-emergency medical transportation related to (1) all medical visits and (2) visits with a cardiologist. Transportation analyses were limited to these two months, which may or may not be typical months, because transportation data were not included with medical claims prior to February 2013. Transportation claims capture transportation by ambulance, taxi and wheelchair but not car or bus. To account for potential reimbursed car or bus costs, a proportionate adjustment to utilization and average costs was calculated using summary data on transportation trips to cardiology specialists (September 2013-February 2014) provided by CT DSS. The cost ranges
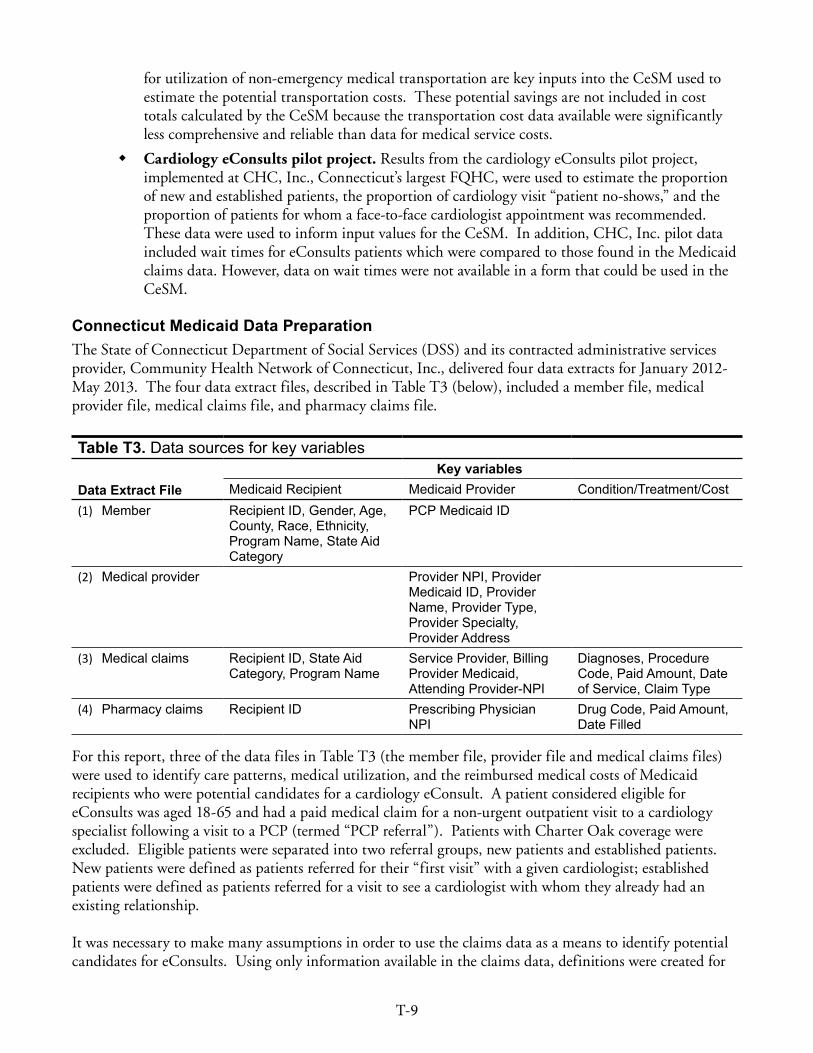
T-9
for utilization of non-emergency medical transportation are key inputs into the CeSM used to estimate the potential transportation costs. These potential savings are not included in cost totals calculated by the CeSM because the transportation cost data available were significantly less comprehensive and reliable than data for medical service costs.
� Cardiology eConsults pilot project. Results from the cardiology eConsults pilot project, implemented at CHC, Inc., Connecticut’s largest FQHC, were used to estimate the proportion of new and established patients, the proportion of cardiology visit “patient no-shows,” and the proportion of patients for whom a face-to-face cardiologist appointment was recommended. These data were used to inform input values for the CeSM. In addition, CHC, Inc. pilot data included wait times for eConsults patients which were compared to those found in the Medicaid claims data. However, data on wait times were not available in a form that could be used in the CeSM.
Connecticut Medicaid Data PreparationThe State of Connecticut Department of Social Services (DSS) and its contracted administrative services provider, Community Health Network of Connecticut, Inc., delivered four data extracts for January 2012-May 2013. The four data extract files, described in Table T3 (below), included a member file, medical provider file, medical claims file, and pharmacy claims file.
Table T3. Data sources for key variables
Data Extract FileKey variables
Medicaid Recipient Medicaid Provider Condition/Treatment/Cost(1) Member Recipient ID, Gender, Age,
County, Race, Ethnicity, Program Name, State Aid Category
PCP Medicaid ID
(2) Medical provider Provider NPI, Provider Medicaid ID, Provider Name, Provider Type, Provider Specialty, Provider Address
(3) Medical claims Recipient ID, State Aid Category, Program Name
Service Provider, Billing Provider Medicaid, Attending Provider-NPI
Diagnoses, Procedure Code, Paid Amount, Date of Service, Claim Type
(4) Pharmacy claims Recipient ID Prescribing Physician NPI
Drug Code, Paid Amount, Date Filled
For this report, three of the data files in Table T3 (the member file, provider file and medical claims files) were used to identify care patterns, medical utilization, and the reimbursed medical costs of Medicaid recipients who were potential candidates for a cardiology eConsult. A patient considered eligible for eConsults was aged 18-65 and had a paid medical claim for a non-urgent outpatient visit to a cardiology specialist following a visit to a PCP (termed “PCP referral”). Patients with Charter Oak coverage were excluded. Eligible patients were separated into two referral groups, new patients and established patients. New patients were defined as patients referred for their “first visit” with a given cardiologist; established patients were defined as patients referred for a visit to see a cardiologist with whom they already had an existing relationship.
It was necessary to make many assumptions in order to use the claims data as a means to identify potential candidates for eConsults. Using only information available in the claims data, definitions were created for

T-10
the following:
1. Cardiology consult or evaluation visit (cardiology visit):
A cardiology visit was defined using Current Procedure Terminology (CPT) codes and the provider specialty for dates of service from March 1, 2012-February 1, 2013. The CPT codes used to label paid medical claims as new patient visits and established patient visits were as follows.
– New patient visit: CPT code of 99201-99205 (An office or other outpatient visit with the purpose of evaluation and management of a new patient) or 99241-99245 (outpatient consultation)
– Established patient visit: CPT code of 99211-99215. (An office or other outpatient visit with the purpose of evaluation and management of an established patient. The visits were then designated as a cardiology visit if the specialty listed for the provider on the visit claim was a cardiologist (ProviderSpecialty=312).
2. Primary care provider (PCP) visit:
PCP visits included paid claims for which the provider met the PCP definition and a new or established patient office or outpatient CPT code of 99201-99215 was present. A PCP was defined as a provider who was a Medicaid-designated primary care physician to any Medicaid patient (in the member file) or had the same billing number as a designated Medicaid primary care physician and who was not a cardiologist. See Table T4 (page T-12) for the detailed definition of a PCP visit.
3. Cardiology visit with PCP referral:
There was no direct way to identify whether a cardiology visit claim occurred as a result of a PCP referral in the claims data. Thus, as a proxy, a cardiology visit with PCP referral was defined as the first (“index”) cardiology visit following a PCP visit. For established patients, the PCP visit needed to be within 60 days before the cardiology appointment.
4. eConsults candidacy:
Patients were considered candidates for eConsults if they had a new or established office visit with a cardiologist following a PCP referral and did not meet any exclusion criteria that suggested complicated cardiac histories. The following types of patients were excluded from eConsults candidacy based on the timing of other cardiology-related care:
a) The patient had an appointment with a cardiac surgery specialist (specialty code=313) or a pulmonary specialist (specialty code=340) between the index cardiology visit and preceding PCP visit.
b) The patient had a paid claim for an inpatient or outpatient visit that involved a cardiology-related diagnosis for the admitting, principle or secondary diagnosis between the PCP referral visit and the index cardiology visit. Inpatient and outpatient visits are defined in Table T5 (page T-13).
c) Established patient who had a cardiology visit within the 30 days before the PCP visit.
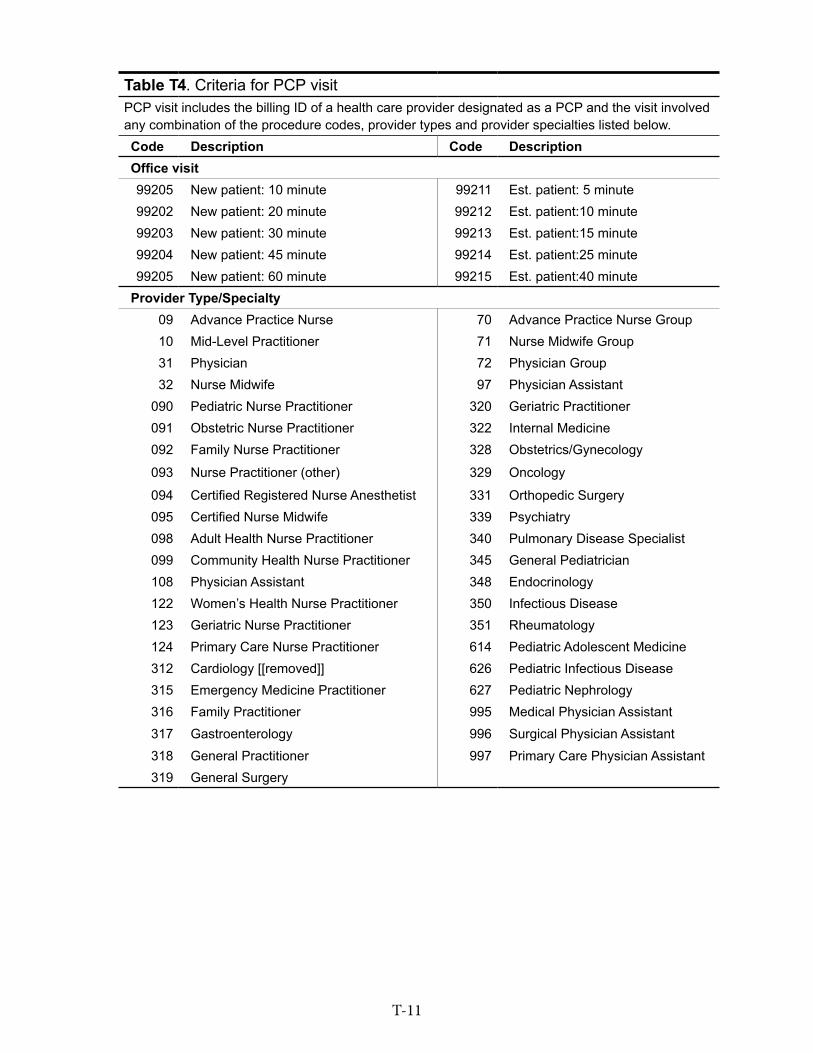
T-11
Table T4 . Criteria for PCP visitPCP visit includes the billing ID of a health care provider designated as a PCP and the visit involved any combination of the procedure codes, provider types and provider specialties listed below .Code Description Code DescriptionOffice visit99205 New patient: 10 minute 99211 Est . patient: 5 minute99202 New patient: 20 minute 99212 Est . patient:10 minute99203 New patient: 30 minute 99213 Est . patient:15 minute99204 New patient: 45 minute 99214 Est . patient:25 minute99205 New patient: 60 minute 99215 Est . patient:40 minute
Provider Type/Specialty09 Advance Practice Nurse 70 Advance Practice Nurse Group10 Mid-Level Practitioner 71 Nurse Midwife Group31 Physician 72 Physician Group32 Nurse Midwife 97 Physician Assistant
090 Pediatric Nurse Practitioner 320 Geriatric Practitioner091 Obstetric Nurse Practitioner 322 Internal Medicine092 Family Nurse Practitioner 328 Obstetrics/Gynecology
093 Nurse Practitioner (other) 329 Oncology
094 Certified Registered Nurse Anesthetist 331 Orthopedic Surgery095 Certified Nurse Midwife 339 Psychiatry098 Adult Health Nurse Practitioner 340 Pulmonary Disease Specialist099 Community Health Nurse Practitioner 345 General Pediatrician108 Physician Assistant 348 Endocrinology122 Women’s Health Nurse Practitioner 350 Infectious Disease123 Geriatric Nurse Practitioner 351 Rheumatology124 Primary Care Nurse Practitioner 614 Pediatric Adolescent Medicine312 Cardiology [[removed]] 626 Pediatric Infectious Disease315 Emergency Medicine Practitioner 627 Pediatric Nephrology316 Family Practitioner 995 Medical Physician Assistant317 Gastroenterology 996 Surgical Physician Assistant318 General Practitioner 997 Primary Care Physician Assistant319 General Surgery
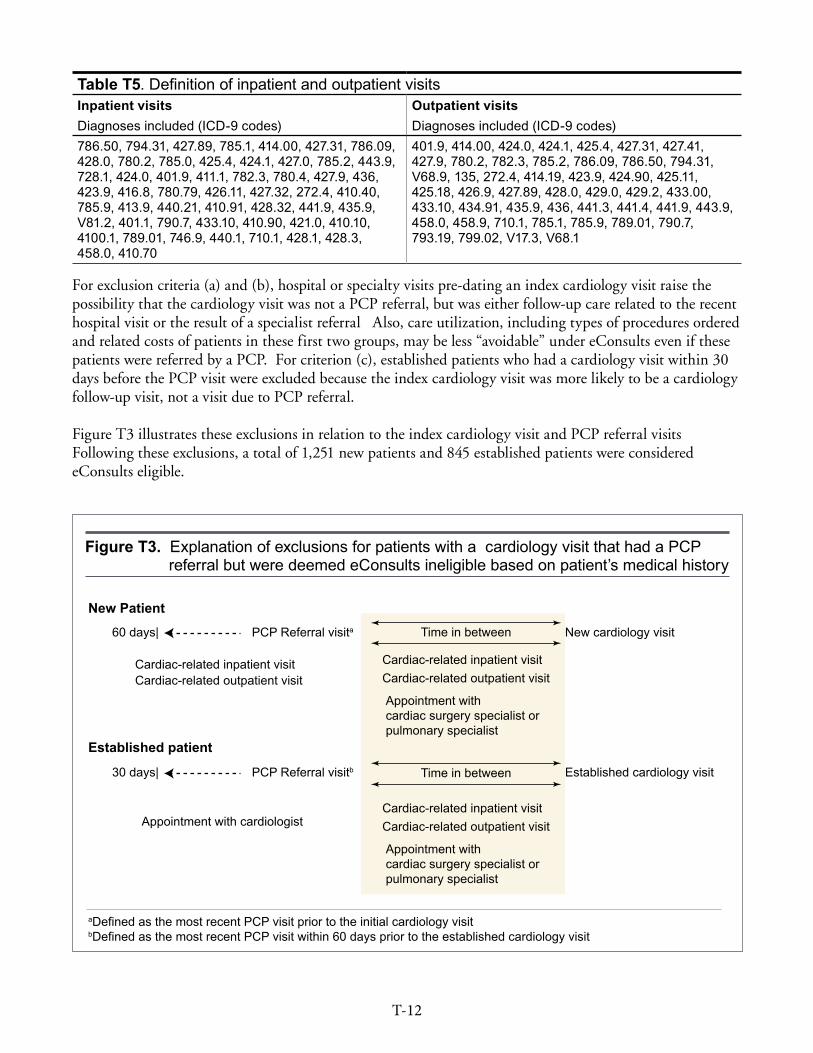
T-12
Table T5. Definition of inpatient and outpatient visitsInpatient visits Outpatient visitsDiagnoses included (ICD-9 codes) Diagnoses included (ICD-9 codes)786 .50, 794 .31, 427 .89, 785 .1, 414 .00, 427 .31, 786 .09, 428 .0, 780 .2, 785 .0, 425 .4, 424 .1, 427 .0, 785 .2, 443 .9, 728 .1, 424 .0, 401 .9, 411 .1, 782 .3, 780 .4, 427 .9, 436, 423 .9, 416 .8, 780 .79, 426 .11, 427 .32, 272 .4, 410 .40, 785 .9, 413 .9, 440 .21, 410 .91, 428 .32, 441 .9, 435 .9, V81 .2, 401 .1, 790 .7, 433 .10, 410 .90, 421 .0, 410 .10, 4100 .1, 789 .01, 746 .9, 440 .1, 710 .1, 428 .1, 428 .3, 458 .0, 410 .70
401 .9, 414 .00, 424 .0, 424 .1, 425 .4, 427 .31, 427 .41, 427 .9, 780 .2, 782 .3, 785 .2, 786 .09, 786 .50, 794 .31, V68 .9, 135, 272 .4, 414 .19, 423 .9, 424 .90, 425 .11, 425 .18, 426 .9, 427 .89, 428 .0, 429 .0, 429 .2, 433 .00, 433 .10, 434 .91, 435 .9, 436, 441 .3, 441 .4, 441 .9, 443 .9, 458 .0, 458 .9, 710 .1, 785 .1, 785 .9, 789 .01, 790 .7, 793 .19, 799 .02, V17 .3, V68 .1
For exclusion criteria (a) and (b), hospital or specialty visits pre-dating an index cardiology visit raise the possibility that the cardiology visit was not a PCP referral, but was either follow-up care related to the recent hospital visit or the result of a specialist referral Also, care utilization, including types of procedures ordered and related costs of patients in these first two groups, may be less “avoidable” under eConsults even if these patients were referred by a PCP. For criterion (c), established patients who had a cardiology visit within 30 days before the PCP visit were excluded because the index cardiology visit was more likely to be a cardiology follow-up visit, not a visit due to PCP referral.
Figure T3 illustrates these exclusions in relation to the index cardiology visit and PCP referral visits Following these exclusions, a total of 1,251 new patients and 845 established patients were considered eConsults eligible.
60 days| PCP Referral visita
Cardiac-related inpatient visit
Cardiac-related inpatient visit
Appointment with cardiac surgery specialist or pulmonary specialist
Cardiac-related outpatient visitAppointment with cardiologist
Cardiac-related outpatient visit
New Patient
Established patient
30 days| PCP Referral visitb
New cardiology visit
Established cardiology visit
Time in between
Time in between
Cardiac-related inpatient visit
Appointment with cardiac surgery specialist or pulmonary specialist
Cardiac-related outpatient visit
aDefined as the most recent PCP visit prior to the initial cardiology visitbDefined as the most recent PCP visit within 60 days prior to the established cardiology visit
Figure T3. Explanation of exclusions for patients with a cardiology visit that had a PCP referral but were deemed eConsults ineligible based on patient’s medical history
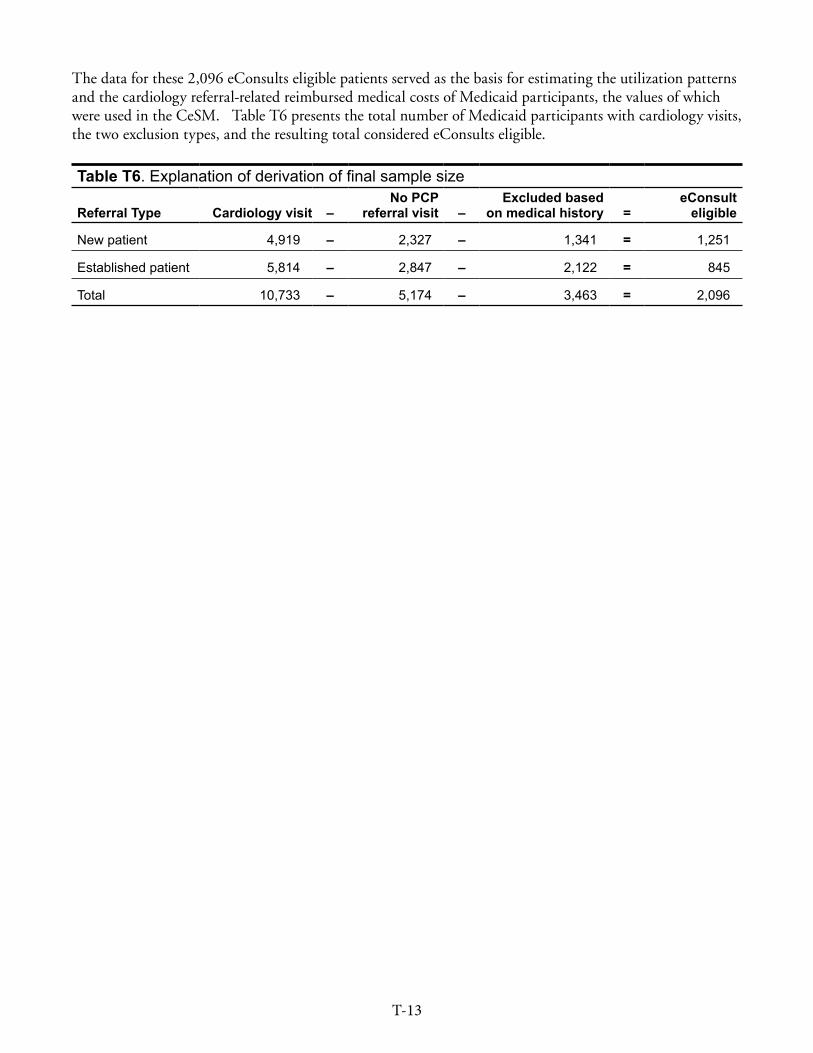
T-13
The data for these 2,096 eConsults eligible patients served as the basis for estimating the utilization patterns and the cardiology referral-related reimbursed medical costs of Medicaid participants, the values of which were used in the CeSM. Table T6 presents the total number of Medicaid participants with cardiology visits, the two exclusion types, and the resulting total considered eConsults eligible.
Table T6. Explanation of derivation of final sample size
Referral Type Cardiology visit –No PCP
referral visit –Excluded based
on medical history =eConsult
eligible
New patient 4,919 – 2,327 – 1,341 = 1,251
Established patient 5,814 – 2,847 – 2,122 = 845
Total 10,733 – 5,174 – 3,463 = 2,096
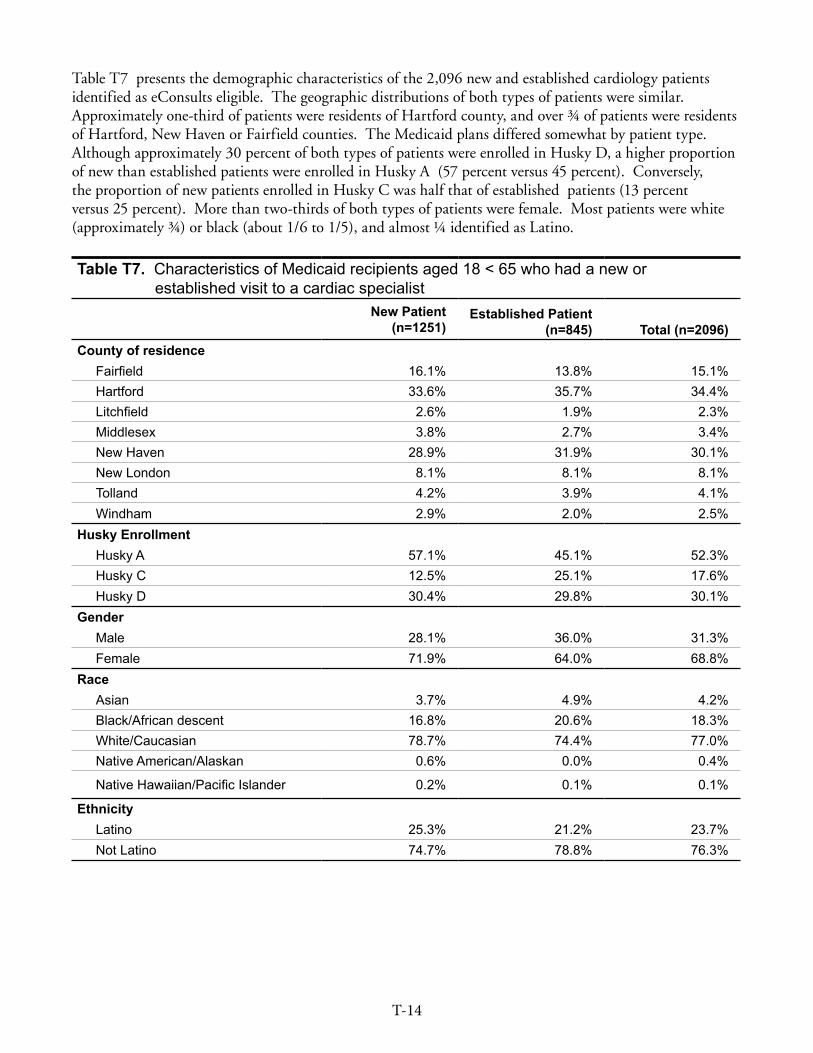
T-14
Table T7 presents the demographic characteristics of the 2,096 new and established cardiology patients identified as eConsults eligible. The geographic distributions of both types of patients were similar. Approximately one-third of patients were residents of Hartford county, and over ¾ of patients were residents of Hartford, New Haven or Fairfield counties. The Medicaid plans differed somewhat by patient type. Although approximately 30 percent of both types of patients were enrolled in Husky D, a higher proportion of new than established patients were enrolled in Husky A (57 percent versus 45 percent). Conversely, the proportion of new patients enrolled in Husky C was half that of established patients (13 percent versus 25 percent). More than two-thirds of both types of patients were female. Most patients were white (approximately ¾) or black (about 1/6 to 1/5), and almost ¼ identified as Latino.
Table T7. Characteristics of Medicaid recipients aged 18 < 65 who had a new or established visit to a cardiac specialist
New Patient(n=1251)
Established Patient(n=845) Total (n=2096)
County of residence Fairfield 16 .1% 13 .8% 15 .1%Hartford 33 .6% 35 .7% 34 .4%Litchfield 2 .6% 1 .9% 2 .3%Middlesex 3 .8% 2 .7% 3 .4%New Haven 28 .9% 31 .9% 30 .1%New London 8 .1% 8 .1% 8 .1%Tolland 4 .2% 3 .9% 4 .1%Windham 2 .9% 2 .0% 2 .5%
Husky Enrollment Husky A 57 .1% 45 .1% 52 .3%Husky C 12 .5% 25 .1% 17 .6%Husky D 30 .4% 29 .8% 30 .1%
Gender Male 28 .1% 36 .0% 31 .3%Female 71 .9% 64 .0% 68 .8%
Race Asian 3 .7% 4 .9% 4 .2%Black/African descent 16 .8% 20 .6% 18 .3%White/Caucasian 78 .7% 74 .4% 77 .0%Native American/Alaskan 0 .6% 0 .0% 0 .4%
Native Hawaiian/Pacific Islander 0 .2% 0 .1% 0 .1%
Ethnicity Latino 25 .3% 21 .2% 23 .7%Not Latino 74 .7% 78 .8% 76 .3%
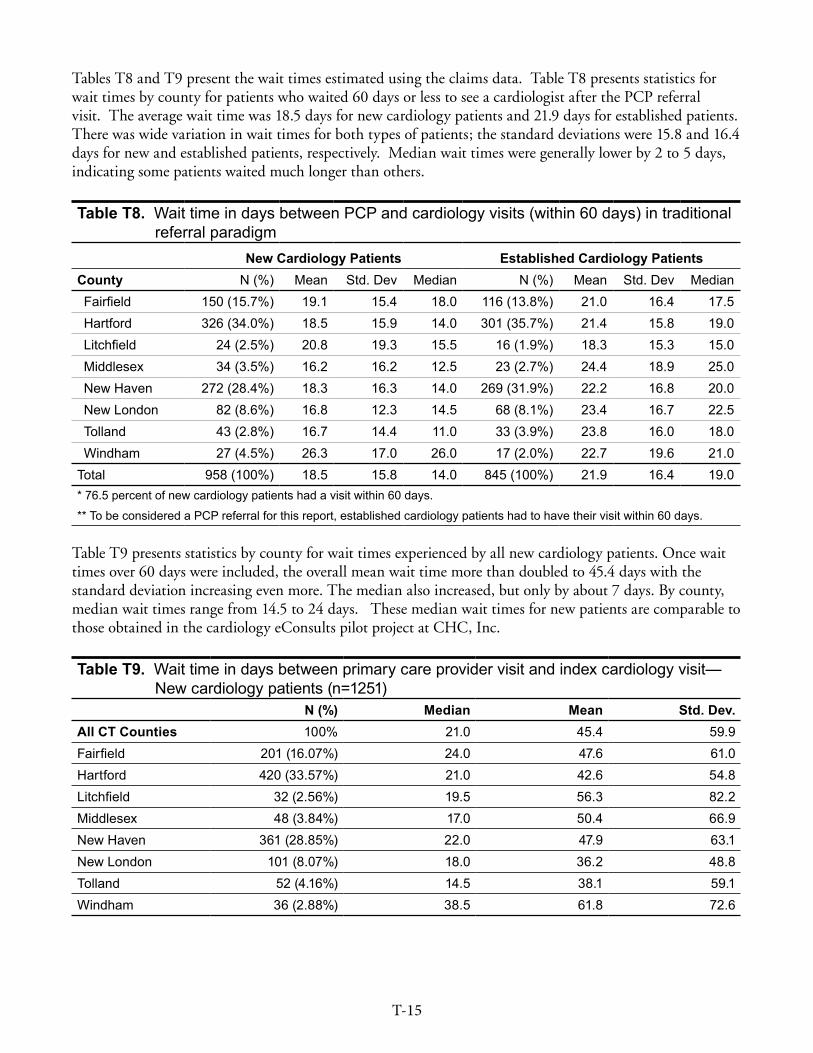
T-15
Tables T8 and T9 present the wait times estimated using the claims data. Table T8 presents statistics for wait times by county for patients who waited 60 days or less to see a cardiologist after the PCP referral visit. The average wait time was 18.5 days for new cardiology patients and 21.9 days for established patients. There was wide variation in wait times for both types of patients; the standard deviations were 15.8 and 16.4 days for new and established patients, respectively. Median wait times were generally lower by 2 to 5 days, indicating some patients waited much longer than others.
Table T8. Wait time in days between PCP and cardiology visits (within 60 days) in traditional referral paradigm
New Cardiology Patients Established Cardiology Patients County N (%) Mean Std . Dev Median N (%) Mean Std . Dev MedianFairfield 150 (15 .7%) 19 .1 15 .4 18 .0 116 (13 .8%) 21 .0 16 .4 17 .5Hartford 326 (34 .0%) 18 .5 15 .9 14 .0 301 (35 .7%) 21 .4 15 .8 19 .0Litchfield 24 (2 .5%) 20 .8 19 .3 15 .5 16 (1 .9%) 18 .3 15 .3 15 .0Middlesex 34 (3 .5%) 16 .2 16 .2 12 .5 23 (2 .7%) 24 .4 18 .9 25 .0New Haven 272 (28 .4%) 18 .3 16 .3 14 .0 269 (31 .9%) 22 .2 16 .8 20 .0New London 82 (8 .6%) 16 .8 12 .3 14 .5 68 (8 .1%) 23 .4 16 .7 22 .5Tolland 43 (2 .8%) 16 .7 14 .4 11 .0 33 (3 .9%) 23 .8 16 .0 18 .0Windham 27 (4 .5%) 26 .3 17 .0 26 .0 17 (2 .0%) 22 .7 19 .6 21 .0
Total 958 (100%) 18 .5 15 .8 14 .0 845 (100%) 21 .9 16 .4 19 .0* 76 .5 percent of new cardiology patients had a visit within 60 days .
** To be considered a PCP referral for this report, established cardiology patients had to have their visit within 60 days .
Table T9 presents statistics by county for wait times experienced by all new cardiology patients. Once wait times over 60 days were included, the overall mean wait time more than doubled to 45.4 days with the standard deviation increasing even more. The median also increased, but only by about 7 days. By county, median wait times range from 14.5 to 24 days. These median wait times for new patients are comparable to those obtained in the cardiology eConsults pilot project at CHC, Inc.
Table T9. Wait time in days between primary care provider visit and index cardiology visit—New cardiology patients (n=1251)
N (%) Median Mean Std. Dev.All CT Counties 100% 21 .0 45 .4 59 .9Fairfield 201 (16 .07%) 24 .0 47 .6 61 .0Hartford 420 (33 .57%) 21 .0 42 .6 54 .8Litchfield 32 (2 .56%) 19 .5 56 .3 82 .2Middlesex 48 (3 .84%) 17 .0 50 .4 66 .9New Haven 361 (28 .85%) 22 .0 47 .9 63 .1New London 101 (8 .07%) 18 .0 36 .2 48 .8Tolland 52 (4 .16%) 14 .5 38 .1 59 .1Windham 36 (2 .88%) 38 .5 61 .8 72 .6
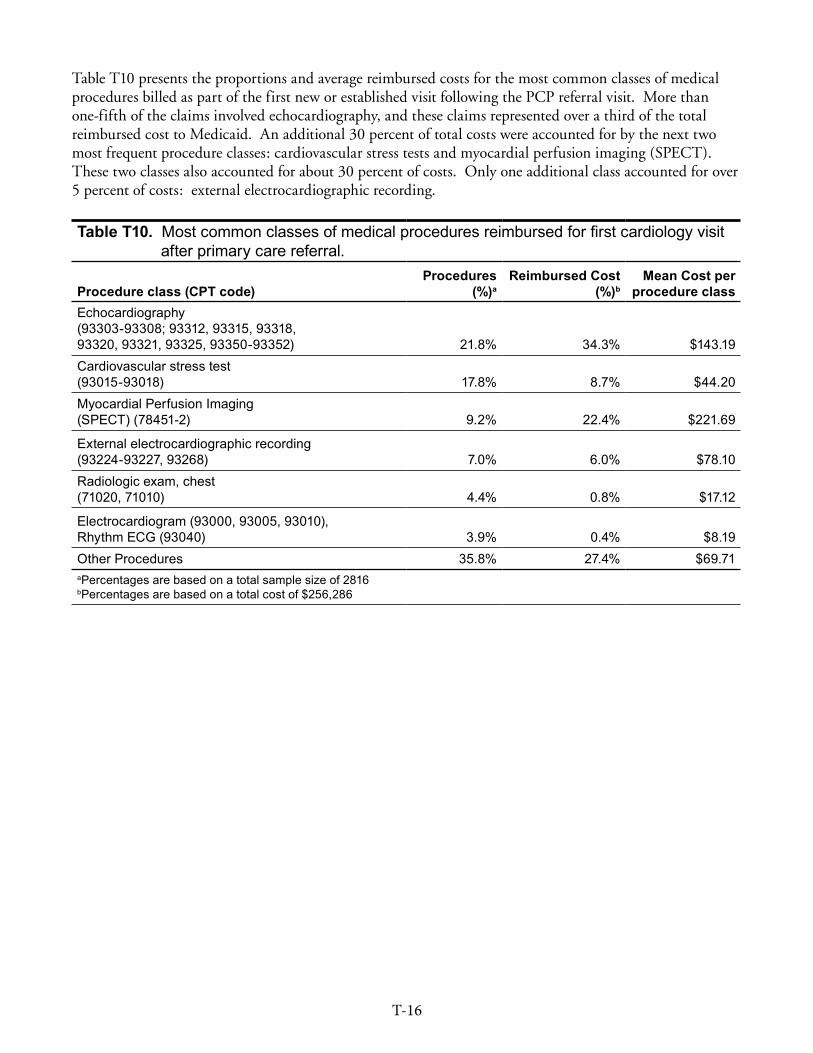
T-16
Table T10 presents the proportions and average reimbursed costs for the most common classes of medical procedures billed as part of the first new or established visit following the PCP referral visit. More than one-fifth of the claims involved echocardiography, and these claims represented over a third of the total reimbursed cost to Medicaid. An additional 30 percent of total costs were accounted for by the next two most frequent procedure classes: cardiovascular stress tests and myocardial perfusion imaging (SPECT). These two classes also accounted for about 30 percent of costs. Only one additional class accounted for over 5 percent of costs: external electrocardiographic recording.
Table T10. Most common classes of medical procedures reimbursed for first cardiology visit after primary care referral .
Procedure class (CPT code)Procedures
(%)aReimbursed Cost
(%)bMean Cost per
procedure classEchocardiography (93303-93308; 93312, 93315, 93318, 93320, 93321, 93325, 93350-93352) 21 .8% 34 .3% $143 .19 Cardiovascular stress test (93015-93018) 17 .8% 8 .7% $44 .20 Myocardial Perfusion Imaging (SPECT) (78451-2) 9 .2% 22 .4% $221 .69
External electrocardiographic recording (93224-93227, 93268) 7 .0% 6 .0% $78 .10 Radiologic exam, chest (71020, 71010) 4 .4% 0 .8% $17 .12
Electrocardiogram (93000, 93005, 93010), Rhythm ECG (93040) 3 .9% 0 .4% $8 .19 Other Procedures 35 .8% 27 .4% $69 .71aPercentages are based on a total sample size of 2816 bPercentages are based on a total cost of $256,286
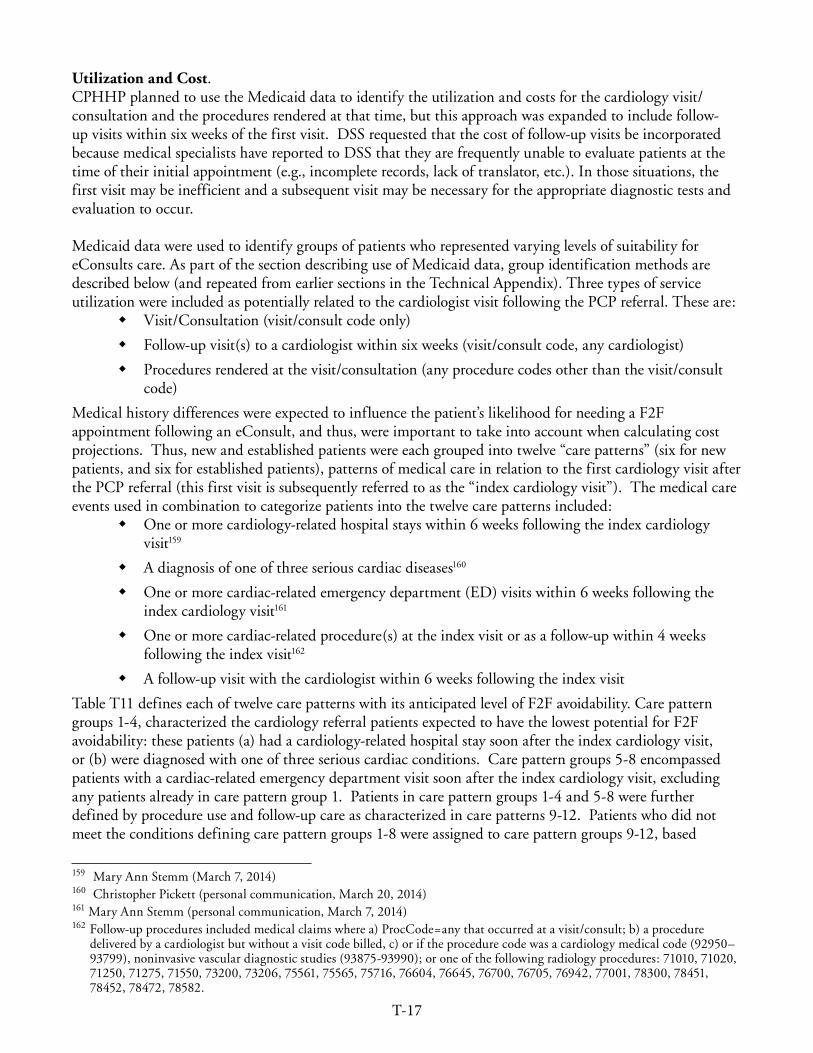
T-17
Utilization and Cost. CPHHP planned to use the Medicaid data to identify the utilization and costs for the cardiology visit/consultation and the procedures rendered at that time, but this approach was expanded to include follow-up visits within six weeks of the first visit. DSS requested that the cost of follow-up visits be incorporated because medical specialists have reported to DSS that they are frequently unable to evaluate patients at the time of their initial appointment (e.g., incomplete records, lack of translator, etc.). In those situations, the first visit may be inefficient and a subsequent visit may be necessary for the appropriate diagnostic tests and evaluation to occur. Medicaid data were used to identify groups of patients who represented varying levels of suitability for eConsults care. As part of the section describing use of Medicaid data, group identification methods are described below (and repeated from earlier sections in the Technical Appendix). Three types of service utilization were included as potentially related to the cardiologist visit following the PCP referral. These are:
� Visit/Consultation (visit/consult code only)
� Follow-up visit(s) to a cardiologist within six weeks (visit/consult code, any cardiologist)
� Procedures rendered at the visit/consultation (any procedure codes other than the visit/consult code)
Medical history differences were expected to influence the patient’s likelihood for needing a F2F appointment following an eConsult, and thus, were important to take into account when calculating cost projections. Thus, new and established patients were each grouped into twelve “care patterns” (six for new patients, and six for established patients), patterns of medical care in relation to the first cardiology visit after the PCP referral (this first visit is subsequently referred to as the “index cardiology visit”). The medical care events used in combination to categorize patients into the twelve care patterns included:
� One or more cardiology-related hospital stays within 6 weeks following the index cardiology visit159
� A diagnosis of one of three serious cardiac diseases160
� One or more cardiac-related emergency department (ED) visits within 6 weeks following the index cardiology visit161
� One or more cardiac-related procedure(s) at the index visit or as a follow-up within 4 weeks following the index visit162
� A follow-up visit with the cardiologist within 6 weeks following the index visit
Table T11 defines each of twelve care patterns with its anticipated level of F2F avoidability. Care pattern groups 1-4, characterized the cardiology referral patients expected to have the lowest potential for F2F avoidability: these patients (a) had a cardiology-related hospital stay soon after the index cardiology visit, or (b) were diagnosed with one of three serious cardiac conditions. Care pattern groups 5-8 encompassed patients with a cardiac-related emergency department visit soon after the index cardiology visit, excluding any patients already in care pattern group 1. Patients in care pattern groups 1-4 and 5-8 were further defined by procedure use and follow-up care as characterized in care patterns 9-12. Patients who did not meet the conditions defining care pattern groups 1-8 were assigned to care pattern groups 9-12, based
159 Mary Ann Stemm (March 7, 2014)160 Christopher Pickett (personal communication, March 20, 2014)161 Mary Ann Stemm (personal communication, March 7, 2014)162 Follow-up procedures included medical claims where a) ProcCode=any that occurred at a visit/consult; b) a procedure
delivered by a cardiologist but without a visit code billed, c) or if the procedure code was a cardiology medical code (92950–93799), noninvasive vascular diagnostic studies (93875-93990); or one of the following radiology procedures: 71010, 71020, 71250, 71275, 71550, 73200, 73206, 75561, 75565, 75716, 76604, 76645, 76700, 76705, 76942, 77001, 78300, 78451, 78452, 78472, 78582.
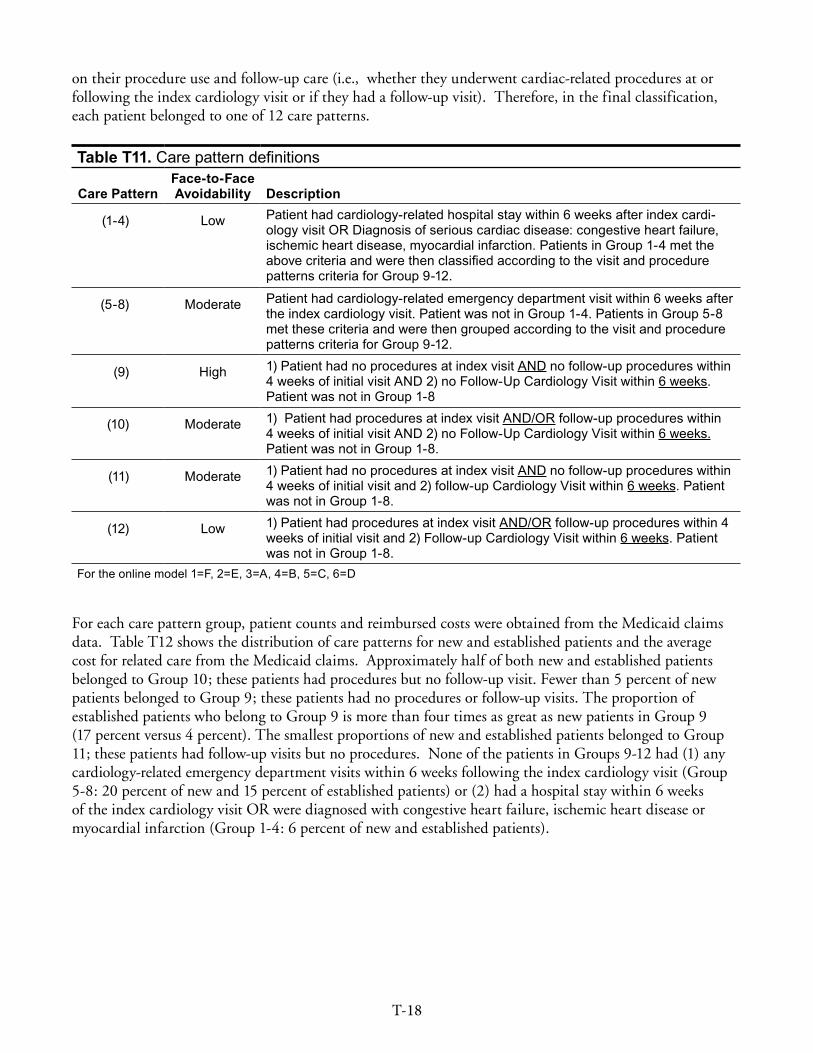
T-18
on their procedure use and follow-up care (i.e., whether they underwent cardiac-related procedures at or following the index cardiology visit or if they had a follow-up visit). Therefore, in the final classification, each patient belonged to one of 12 care patterns.
Table T11. Care pattern definitions
Care PatternFace-to-Face Avoidability Description
(1-4) Low Patient had cardiology-related hospital stay within 6 weeks after index cardi-ology visit OR Diagnosis of serious cardiac disease: congestive heart failure, ischemic heart disease, myocardial infarction . Patients in Group 1-4 met the above criteria and were then classified according to the visit and procedure patterns criteria for Group 9-12 .
(5-8) Moderate Patient had cardiology-related emergency department visit within 6 weeks after the index cardiology visit . Patient was not in Group 1-4 . Patients in Group 5-8 met these criteria and were then grouped according to the visit and procedure patterns criteria for Group 9-12 .
(9) High 1) Patient had no procedures at index visit AND no follow-up procedures within 4 weeks of initial visit AND 2) no Follow-Up Cardiology Visit within 6 weeks . Patient was not in Group 1-8
(10) Moderate 1) Patient had procedures at index visit AND/OR follow-up procedures within 4 weeks of initial visit AND 2) no Follow-Up Cardiology Visit within 6 weeks . Patient was not in Group 1-8 .
(11) Moderate 1) Patient had no procedures at index visit AND no follow-up procedures within 4 weeks of initial visit and 2) follow-up Cardiology Visit within 6 weeks . Patient was not in Group 1-8 .
(12) Low 1) Patient had procedures at index visit AND/OR follow-up procedures within 4 weeks of initial visit and 2) Follow-up Cardiology Visit within 6 weeks . Patient was not in Group 1-8 .
For the online model 1=F, 2=E, 3=A, 4=B, 5=C, 6=D
For each care pattern group, patient counts and reimbursed costs were obtained from the Medicaid claims data. Table T12 shows the distribution of care patterns for new and established patients and the average cost for related care from the Medicaid claims. Approximately half of both new and established patients belonged to Group 10; these patients had procedures but no follow-up visit. Fewer than 5 percent of new patients belonged to Group 9; these patients had no procedures or follow-up visits. The proportion of established patients who belong to Group 9 is more than four times as great as new patients in Group 9 (17 percent versus 4 percent). The smallest proportions of new and established patients belonged to Group 11; these patients had follow-up visits but no procedures. None of the patients in Groups 9-12 had (1) any cardiology-related emergency department visits within 6 weeks following the index cardiology visit (Group 5-8: 20 percent of new and 15 percent of established patients) or (2) had a hospital stay within 6 weeks of the index cardiology visit OR were diagnosed with congestive heart failure, ischemic heart disease or myocardial infarction (Group 1-4: 6 percent of new and established patients).

T-19
Table T12. Care patterns of eligible patients with visit to a cardiologist following a visit to a PCP and average costs for related care .
Care PatternNew Cardiology Patients Established Cardiology Patients
Distribution Cost Distribution Cost
Group 1-4 . Cardiology related hospital stay within 6 weeks after index cardiology visit OR Diagnosis of congestive heart failure, ischemic heart disease, and/or myocardial infarction. Additional group-specific criterion related to follow-up procedures and follow-up visits listed by group .Group 1 no follow-up procedures* and no follow-up visit** 0% n/a 0 .8% $56Group 2 follow-up procedures* and no follow-up visit** 3 .4% $154 3 .8% $92Group 3 follow-up visit(s)** and no follow-up procedures* 0 .6% $223 0 .1% $145Group 4 follow-up visit(s)** and follow-up procedures* 2 .1% $276 1 .7% $258Group 5-8 . Cardiology related emergency department visit within 6 weeks after index cardio visit . Not in Group 1-4. Additional group-specific criterion related to follow-up procedures and follow-up visits listed by group.Group 5 no follow-up procedures* and no follow-up visit** 1 .0% $113 1 .4% $58Group 6 follow-up procedures* and no follow-up visit** 12 .0% $141 9 .3% $91Group 7 follow-up visit(s)** and no follow-up procedures* 0 .2% $150 0 .5% $95Group 8 follow-up visit(s)** and follow-up procedures* 6 .4% $216 4 .0% $158Group 9-12 . Not in Group 1-8 .Group 9 no follow-up procedures* and no follow-up visit** Not in Group 1-8 4 .2% $110 17 .3% $56Group 10 follow-up procedures* and no follow-up visit** Not in Group 1-8 . 51 .6% $171 49 .1% $92Group 11 follow-up visit(s)** and no follow-up procedures* Not in Group 1-8 1 .4% $169 3 .8% $141Group 12 follow-up visit(s)** and follow-up procedures* Not in Group 1-8 17 .2% $276 8 .2% $213Overall 100% $187 100% $102*Follow-up procedures include procedures at first cardiology visit after PCP referral, prior to a follow-up cardiology visit within four weeks or within four weeks if patient did not have a follow-up cardiology visit .
**Follow-up visit occurred if additional cardiology visit occurs within six weeks of index appointment .

T-20
Potential Additional Costs of CareTransportation. The cost ranges for utilization of non-emergency medical transportation are the key inputs used in the CeSM to estimate the potential transportation costs. Medicaid data from February and March 2013 were used to calculate utilization rates and average costs for non-emergency medical transportation related to (1) all medical visits and (2) visits with a cardiologist. These estimates are shown in Table T13. Available transportation claims included transportation by ambulance, taxi and wheelchair but not car or bus. To account for potential reimbursed car or bus costs, a proportionate adjustment to utilization and average costs was calculated using summary data on transportation trips to cardiology specialists (September 2013-February 2014) provided by CT DSS. This is referred to as the “expanded estimate” in Table T13.
Table T13 . Connecticut Medicaid non-emergency transportation for medical visitsAll Cardiology only
Participants* (count) 67,290 2,962Percent with transportation 3 .7% 3 .9%Expanded estimate** 5 .1% 5 .6%
Total visits 113,504 3651Percent with transportation 3 .2% 4 .4%Expanded estimate** 3 .9% 5 .6%
Total paid cost for transportation $217,085 $7,907Expanded estimate** $232,920 8,766
Average cost per visit with transportation $59 .77 $49 .11Expanded estimate** $53 .03 $43 .15
Average cost per visit $1 .91 $2 .17Expanded estimate** $2 .05 $2 .40
*With paid medical claims .
**Projected by proportionate increase of care and bus over ambulance and wheelchair utilization, from DSS correspondence which included summary data for any cardiologist trip from Sept . 2013-Feb 2014 .
It is worth noting, that it was not possible to directly estimate the cost or utilization rates for transportation to cardiology visits following a PCP referral. For use in the CeSM, the average transportation cost per visit was calculated so that estimated transportation costs for the first cardiology visit following a referral can be projected. Based on the claims data and expanded estimate, the potential range in average transportation cost per patient seen at an office visit ranged from $1.91 to $2.40. The value of $2.40 was used in the test scenario. However, there is not a high level of confidence based on the limited data available to generate this estimate. This is why budget impact estimates show this value separately or indicate when it is included.
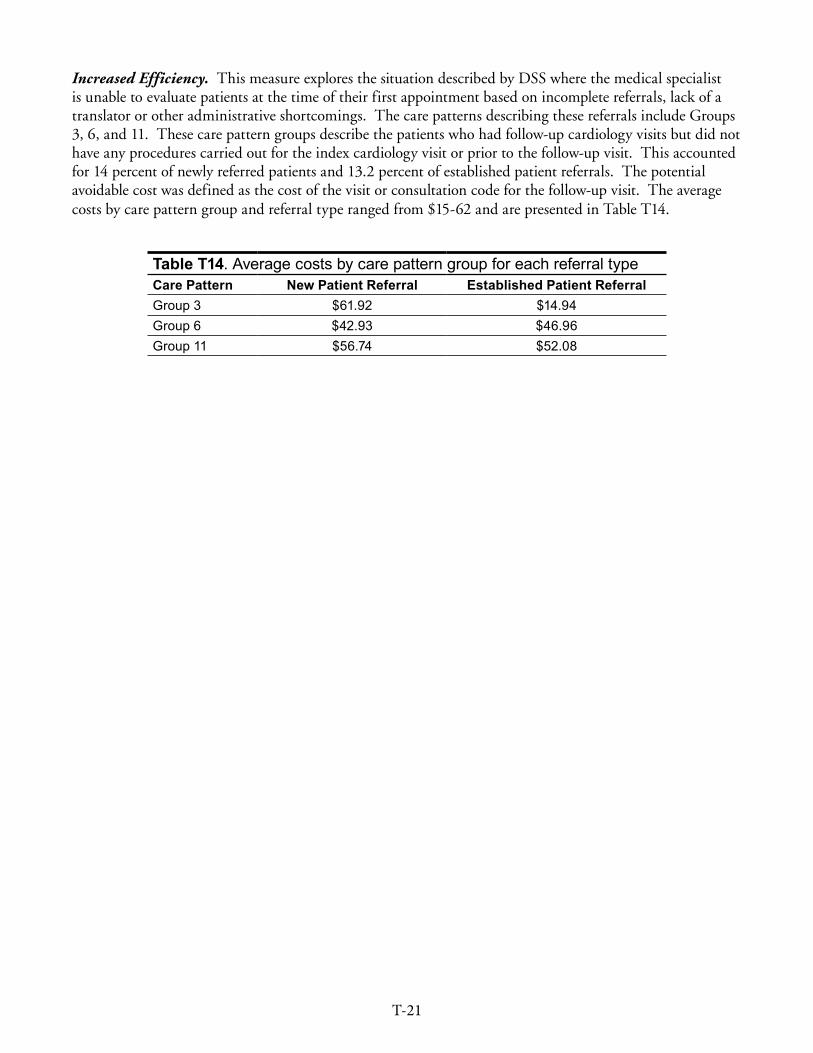
T-21
Increased Efficiency. This measure explores the situation described by DSS where the medical specialist is unable to evaluate patients at the time of their first appointment based on incomplete referrals, lack of a translator or other administrative shortcomings. The care patterns describing these referrals include Groups 3, 6, and 11. These care pattern groups describe the patients who had follow-up cardiology visits but did not have any procedures carried out for the index cardiology visit or prior to the follow-up visit. This accounted for 14 percent of newly referred patients and 13.2 percent of established patient referrals. The potential avoidable cost was defined as the cost of the visit or consultation code for the follow-up visit. The average costs by care pattern group and referral type ranged from $15-62 and are presented in Table T14.
Table T14 . Average costs by care pattern group for each referral typeCare Pattern New Patient Referral Established Patient ReferralGroup 3 $61 .92 $14 .94Group 6 $42 .93 $46 .96Group 11 $56 .74 $52 .08