Theoretical and Experimental Modal Analysis of Nonlinear Vibrating ...
U.P.B. Sci. Bull., Series D, Vol. 78, Iss. 2, 2016 ISSN 1454-2358
THE USE OF COMPLEX POWER METHOD IN EXPERIMENTAL MODAL ANALYSIS
Lică FLORE1
The area of experimental modal analysis is quite extensive and it involves different fields: vibration measurements, signal processing, post-processing, mathematical background, issues of vibrating multi degree-of-freedom systems with different models of damping, etc. This paper does not aim to discuss in detail all aspects of modal testing. Instead, it focuses on showing a reliable method for system identification. The computational model with the use of complex power method is highly advisable in some branches (e.g. aircraft), and even mandatory. The article presents the theoretical support, experimental procedure and some results based on complex power method, used for aircraft structure identification.
Keywords: vibration, frequency, excitation, damping, spectrum.
1. Introduction
There are at least four reasons to know the modal parameters of a structure [1]: structure modification, assessment of the structural integrity and reliability, structural health monitoring and model updating. The experimental modal analysis uses the system response to calculate the modal parameters by different identification techniques of modal analysis. The theoretical support of these techniques and practical aspects of vibration measurement techniques are discussed by Ewins [2]. Some of the more advanced methods available for the modal parameters calculation in experimental modal analysis can be summarized below. In the excitation domain, the multi-point excitation [3] is used to compute the FRFs from a complex extraction procedure that requires different exciters to be driving with excitation forces which are uncorrelated with their neighbors. A very important advantage of this method is that the resulting FRF (Frequency Response Function) data are free of any kind of inconsistency errors. The disadvantage comes when applying for large structures, because it is difficult to supply sufficient power to obtain significantly vibration levels. In the measurements domain, the laser measurements with a non-intrusive nature of their operation (they are all non-contact transducers) has been more and
1 Eng., Dept. Testing Laboratory, Institute for Theoretical and Experimental Analysis of Aero-Astronautical Structures STRAERO S.A., Romania, e-mail: [email protected]
32 Lică Flore
more applied and used lately [6]. The laser based response measurement techniques include holography and laser-Doppler velocimetry. The latest evolution in modal acquisition and computing equipment allows an easy test set-up, as well as a quick and simple calculation of different modal parameters. There are specialized digital boards to calculate two magnitudes (real and imaginary parts of the response) in real time [4], reducing computation time and increasing the accuracy of the results. There are several methods [5] for modal parameters calculation that exploit the same basic assumption: that in the vicinity of resonance frequency, the entire response of the system is dominated by the nearest mode. Quadrature forces method is a very simple way to evaluate the generalized masses and generalized damping parameters for one mode of vibration. This is based on simultaneous excitation with two harmonic forces out of phase by 90°, to deduce formulas to obtain the modal parameters. This method is a more unstable method because depends on the viscosity of the system and the test conditions (temperature, forces levels ...). Peak-picking method is a method that works adequately for structures whose FRFs display well separated modes which have a moderate damping. The applicability of this method is limited, because it is difficult to obtain accurate measurements at resonances. Circle-fit method exploits the fact that the behavior of most systems is dominated by a single mode in the vicinity of a resonance. By this method, the accurate value of natural frequency could be identified without any problem, but the damping estimate would not be reliable. The complex power is the most important method in experimental modal analysis because can be obtained a lot of modal parameters with a good accuracy. To develop this method, it is necessary to excite the structure with appropriated forces at the resonance frequency and after this to make a micro frequency sweep around this frequency.
2. Application of Power Complex Method
Any kind of structure, upon an external excitation, will deform and vibrate in a characteristic manner that should be known in advance. The vibration resulted can be a combination of different modes of vibration defined by frequency, shape, damping and stiffness. When a structure is excited by a force whose frequency corresponds to one of its vibration modes, the amplitude of movement can increase up to destroying the structure. It is important to isolate the parameters corresponding to each mode when they highly influence each other due to the proximity modes. There are two ways for this: a theoretical one and an experimental one, Fig. 1.

The use of complex power method in experimental modal analysis 33
Fig.1. Numerical and experimental approaches to identify the vibration modes.
Therefore, the experimentation is the only way to eliminate the approximations and suppositions from numerical calculation by evaluating the real modes from the measured data. This is based on the measurement of the response of the structure as a result of applied forces. The complex power of a structure with harmonic excitation is the product between the velocities of the measurements points and the applied forces upon the structure.
{ } { }12
P F V= ⋅ ⋅ (1)
where: { }F = excitation force vector [kg*m*s-2];
{ }V = velocities vector [m/s] We need just to draw the real and imaginary parts of the complex power graphics and make some mathematical calculus.
3. Summary of Modal Analysis Theory Several mathematical expressions will allow the evaluation of the modal parameters. To the general equation of motion for an MDOF (multi degree of freedom) system, following equation applies:
[ ] { } [ ]{ } [ ]{ } { }.. .
( )M x C x K x f t⋅ + + = (2)
where: [ ]M , [ ]C , [ ]K are: mass matrix [kg], damping matrix [kg*s-1], respectively stiffness matrix [kg*s-2]. With a stabilized harmonic excitation we have:
{ } { }( ) j tf t F e ω= ⋅ = harmonic excitation force vector
{ } { }( ) j tx t X e ω= ⋅ = displacement vector

34 Lică Flore
{ } [ ]{ }( ) j tx t j X e ωω= ⋅i
= speed vector
( ){ } [ ] { }2 j tx t X e ωω= − ⋅ii
= acceleration vector
And by replacing the parameters above in eq.2 and simplifying by j te ω we obtain: [ ] [ ] [ ][ ] [ ]( ) { } { }2M j C K X Fω ω− ⋅ + + ⋅ =
Or by multiplying with the negative complex unit: [ ] [ ] [ ] [ ] [ ]( ) { } { }2j M C j K X j Fω ω⋅ ⋅ + ⋅ − ⋅ ⋅ = − ⋅
The displacement of each point is a spatial displacement and it is ideal to use the minimum number of coordinates needed to define the configuration of the entire system. These quantities are known as generalized coordinates. Changing the coordinates { }X to generalized coordinates{ }q and the mass[ ]M ,
damping [ ]C and stiffness[ ]K to generalized parameters[ ]μ ,[ ]β and [ ]γ based on formulas: { } [ ] { }X qα= ⋅ ; [ ] [ ] [ ] [ ]T Mμ = Φ ⋅ ⋅ Φ ; [ ] [ ] [ ] [ ]Tk K= Φ ⋅ ⋅ Φ we can write the modal equation:
[ ] [ ] [ ] [ ] [ ]{ } { } [ ] { }2j j q Fβ ω μ ω γ α⋅ + ⋅ − ⋅ = ⋅ (3)
Where:[ ]α = response frequency function (complex conjugate receptance matrix of system) [5], 1j = − , [ ]Φ = eigenvector matrix,
[ ]ω = diagonal matrix of frequencies,
{ }q = generalized coordinates vector, And:
[ ]β = generalized damping matrix,
[ ]μ = generalized mass matrix,
[ ]γ = generalized stiffness matrix. These parameters are the global characterizing parameters for each individual vibration mode. They show the energy of the excited mode and the share of the mass for each mode. With the notation:
The use of complex power method in experimental modal analysis 35
[ ] [ ] [ ] [ ] [ ] [ ]{ }2( )Z j jω β ω μ ω γ= ⋅ + ⋅ − (4)
where: [ ]( )Z ω called complex impedance matrix [4], the equation (3) can be written:
[ ] { } [ ] { }( )Z q Fω α⋅ = ⋅ (5)
or: { } [ ] [ ] { }1( )q Z Fω α−= ⋅ ⋅ (6) Each mode i can be isolated by applying an excitation at its natural frequencies ( iω ω= ) where iω = resonance frequency. At this frequency, the imaginary parts are zero and the generalized coordinates vector { }q has all of terms zero, except the line i because only this mode contributes to the structure response. After normalization, considering unitary the maximum amplitude for each mode, the equation (3) becomes:
{ } [ ] { }iiFβ ω α⋅ = ⋅ (7)
where: { }iβ =column i of the generalized damping matrix.
Considering the velocities vector: { } [ ] { }V qω α= ⋅ ⋅ (8)
then from (1) and (4) we obtain:
{ } [ ] { }2
P F qω α= ⋅ ⋅ (9)
or: { } { }2
iiP qω ω β⋅= ⋅ ⋅ (10)
where: { }iβ =line i of the generalized damping matrix. From (6), (7) and due to the properties of matrix [ ]β the relation (10) becomes:
[ ] [ ] [ ]2
1( )2
iii
P Zω ω β ω β−⋅= ⋅ ⋅ ⋅ (11)
One mode of MDOF system is described by means of 2 parameters:
natural frequency: iii
ii
γωμ
= (12)
damping ratio: 2
iiii
ii ii
βζγ μ
=⋅
(13)
where: iiζ = damping ratio corresponding to vibration mode i ;
36 Lică Flore
By replacing the parameters from (4), (12) and (13) relation to (11) relation and making its Taylor series expansion, around the resonance frequency iω , one can obtain a good evaluation, just considering one order of this expansion:
2( ) ( ) (4 .........
1! 2!i i
ii ii i ii iP j ω ω ω ωγ ζ ω μ ω⎧ ⎫− −
= ⋅ ⋅ − − ⋅ ⋅⎨ ⎬⎩ ⎭
(14)
Because the power is a complex parameter one can write: ( ) ( ) ( )P R jSω ω ω= + where, R(ω) = active power [W] and S(ω) = reactive power [W] and then, we can deduce that at the resonance ( iω ω= ):
( )i ii ii iR ω γ ζ ω= ⋅ ⋅ (15) ( ) 0iS ω = (16)
0i
dRd ω ωω =
⎛ ⎞ =⎜ ⎟⎝ ⎠
and i
iidSd ω ω
γω =
⎛ ⎞ = −⎜ ⎟⎝ ⎠
(17)
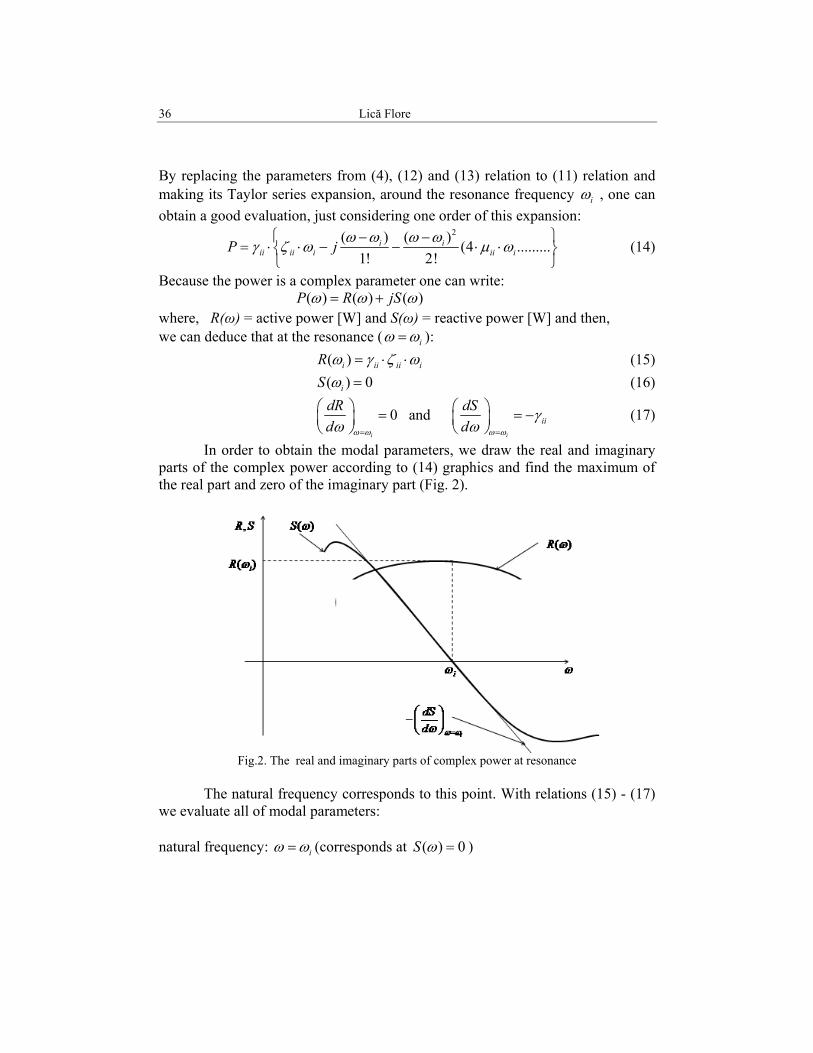
In order to obtain the modal parameters, we draw the real and imaginary parts of the complex power according to (14) graphics and find the maximum of the real part and zero of the imaginary part (Fig. 2).
Fig.2. The real and imaginary parts of complex power at resonance
The natural frequency corresponds to this point. With relations (15) - (17) we evaluate all of modal parameters: natural frequency: iω ω= (corresponds at ( ) 0S ω = )

The use of complex power method in experimental modal analysis 37
generalized stiffness:i
dSd ω ω
γω =
⎛ ⎞= −⎜ ⎟⎝ ⎠
;
2
23
21
kg mWatts kg ms
Hz ss
⎡ ⎤⋅⎢ ⎥ ⎡ ⎤⋅⎡ ⎤ = =⎢ ⎥ ⎢ ⎥⎢ ⎥⎣ ⎦ ⎣ ⎦⎢ ⎥⎢ ⎥⎣ ⎦
(18)
generalized mass: 2i
γμω
= ;
2
22
21
kg ms kg m
s
⎡ ⎤⋅⎢ ⎥
⎡ ⎤= ⋅⎢ ⎥ ⎣ ⎦⎢ ⎥⎢ ⎥⎣ ⎦
(19)
damping factor: ( )
i
R ωζω γ
=⋅
;
2
3
2 2
2 3
adimensional1
kg mWatts sKg m kg m
s s s
⎡ ⎤ ⎡ ⎤⋅⎢ ⎥ ⎢ ⎥
= =⎢ ⎥ ⎢ ⎥⋅ ⋅⎢ ⎥ ⎢ ⎥⋅
⎢ ⎥ ⎢ ⎥⎣ ⎦ ⎣ ⎦
(20)
4. Experimental Modal Analysis with Complex Power Method -
Modal Parameters Identification The test results shown in this chapter have been developed by the author to demonstrate the advantages obtained by using the complex power method applied to Ground Vibration Testing of aircraft structure. The experimental procedure can be described by the next steps: - The excitation of the structure with harmonic forces around the supposed
natural frequency, Fig.2; - The evaluation of the complex power as a product of forces and velocities,
around the supposed natural frequency of the structure, using (14) formula; - The extraction of the real and imaginary parts of the complex power; - Plotting the real and the imaginary parts, Fig.3; - Finding the maximum of the real part and zero of the imaginary part, Fig.4; - Calculation of the generalized stiffness, using (18) formula; - Calculation of the other modal parameters, using (12), (13) and (15) formulas.
A typical experimental setup for harmonic excitation using a specially developed hardware with a dynamic exciter is shown in Fig. 3. In this case, the exciter is fixed in the reference point and the response is measured at all the points. Thus, it provides one column of the FRF matrix. This setup was used in modal testing for a small aircraft wing.

38 Lică Flore
Fig.3. Experimental setup to identify the natural frequencies of aircraft small wing The extraction of the real and imaginary parts of signals is performed by
hardware using a multiplier. The response of a transducer will be a sine signal: ( ) sin( )S t A tω ϕ= + (22)
with the same frequency as excitation forces, but with different amplitude and phase [4]. The real and imaginary parts are proportional to the sine and/or the cosine of this phase. The signal generator provides two signals out of phase 90o:
( ) sin( )( ) cos( )
SC t F tSQ t F t
ωω
= ⋅= ⋅
(23)
By multiplying point by point the transducers response to these signals, we obtain two magnitudes: one composed of harmonic component and one composed of continuous component proportional to the real and imaginary parts:
Re( ) ( ) ( ) sin( ) sin( ) cos( ) cos(2 )2 2
Im( ) ( ) ( ) sin( ) cos( ) sin( ) sin(2 )2 2
AF AFt S t SC t A t F t t
AF AFt S t SQ t A t F t t
ω ϕ ω ϕ ω ϕ
ω ϕ ω ϕ ω ϕ
= ⋅ = + ⋅ ⋅ = − +
= ⋅ = + ⋅ ⋅ = + +
Both magnitude signals are computed in real time by multiplying the temporal signal with the excitation force (0o phase) and by the quadrature of the excitation force (90o phase).
In order to obtain one column of the FRF matrix we perform measurements and acquire all data for one mode of the structure. After that, the

The use of complex power method in experimental modal analysis 39
modal analysis software is to be used to post-process this data. This part of modal test is called experimental modal analysis corresponding to the stage called theoretical modal analysis. In both cases, modal analysis leads to identification of modal parameters of the system. The similarity between these approaches can be noticed in Fig.4 where there are shown the mode shapes for the first mode of vibration of an aircraft wing.
Fig.4. Theoretical Mode Shapes [9] and Experimental Mode Shapes of aircraft small wing obtaind by Complex Power Method
The results may be obtained in table form (as in Table 1), but much more illustrative is to use an animated display of the obtained the modal shape, Fig.4 right.
Table 1 The calculated modal parameters from aircraft wing harmonic excitation by
Complex Power Method
Frequency [Hz]
Active power [W]
Reactive power [W]
Generalized mass
[kg*m2]
Generalized stiffness
[kg*m2/s2]
Damping ratio
10.30 3.60E-01 4.92E-01
2988.736
1.275E+07
0.01207
10.32 5.10E-01 5.29E-01 10.34 6.98E-01 4.53E-01 10.36 9.04E-01 2.64E-01 10.38 0.95857 5.64E-02 10.40 0.937967 -5.63E-02 10.42 0.973613 -1.69E-01 10.44 0.934373 -2.62E-01 10.46 0.820676 -3.36E-01 10.48 0.800494 -3.72E-01 10.50 0.761808 -4.27E-01

40 Lică Flore
Fig.5. The frequency identification from real and imaginary parts graphical representation of complex power
A better solution to increase the resolution of resonance frequency (Fig.5) is to use the polynomial interpolation (Fig.6). By this interpolation we can avoid uncertainty provided by measurements devices and acquisition systems (close to zero value the imaginary part of complex power can have multiple sign changes).
Fig.6. The interpolation of real and imaginary parts graphical representation
The use of complex power method in experimental modal analysis 41
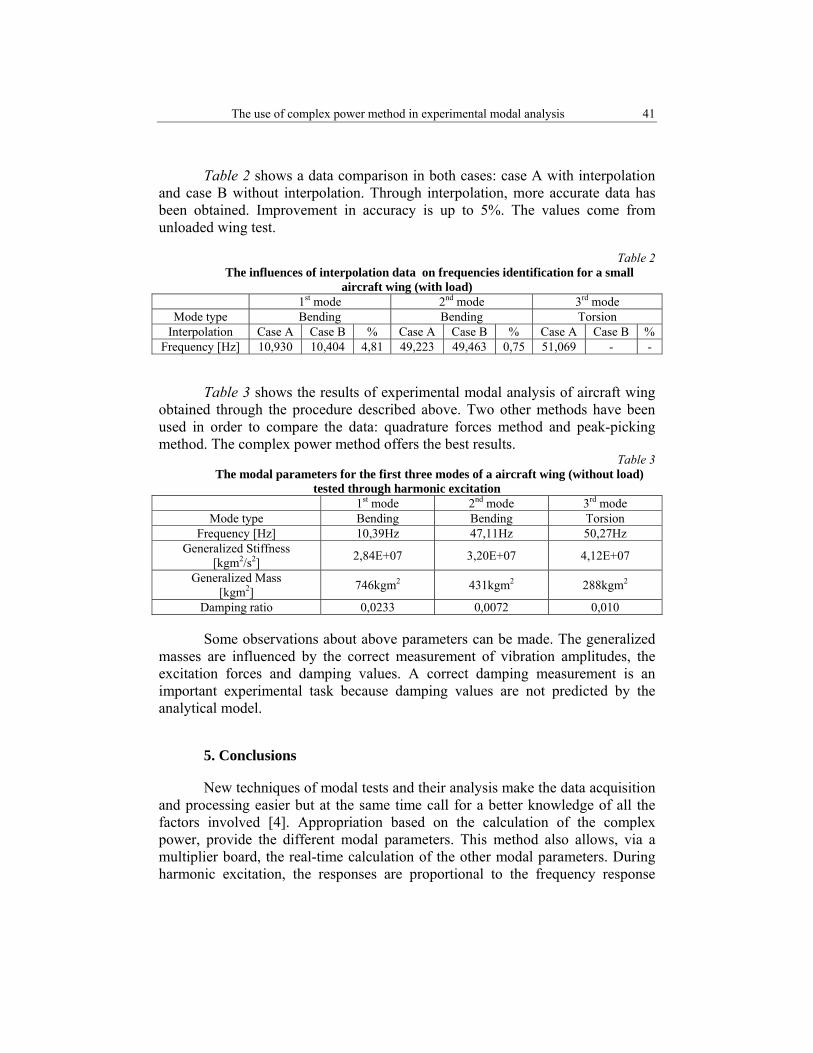
Table 2 shows a data comparison in both cases: case A with interpolation and case B without interpolation. Through interpolation, more accurate data has been obtained. Improvement in accuracy is up to 5%. The values come from unloaded wing test.
Table 2 The influences of interpolation data on frequencies identification for a small
aircraft wing (with load) 1st mode 2nd mode 3rd mode
Mode type Bending Bending Torsion Interpolation Case A Case B % Case A Case B % Case A Case B %
Frequency [Hz] 10,930 10,404 4,81 49,223 49,463 0,75 51,069 - -
Table 3 shows the results of experimental modal analysis of aircraft wing obtained through the procedure described above. Two other methods have been used in order to compare the data: quadrature forces method and peak-picking method. The complex power method offers the best results.
Table 3 The modal parameters for the first three modes of a aircraft wing (without load)
tested through harmonic excitation 1st mode 2nd mode 3rd mode
Mode type Bending Bending Torsion Frequency [Hz] 10,39Hz 47,11Hz 50,27Hz
Generalized Stiffness [kgm2/s2] 2,84E+07 3,20E+07 4,12E+07
Generalized Mass [kgm2] 746kgm2 431kgm2 288kgm2
Damping ratio 0,0233 0,0072 0,010
Some observations about above parameters can be made. The generalized masses are influenced by the correct measurement of vibration amplitudes, the excitation forces and damping values. A correct damping measurement is an important experimental task because damping values are not predicted by the analytical model.
5. Conclusions
New techniques of modal tests and their analysis make the data acquisition and processing easier but at the same time call for a better knowledge of all the factors involved [4]. Appropriation based on the calculation of the complex power, provide the different modal parameters. This method also allows, via a multiplier board, the real-time calculation of the other modal parameters. During harmonic excitation, the responses are proportional to the frequency response
42 Lică Flore
functions and therefore to the vibration modes. A better resolution, obtained during above displayed tests, represents a own contribution at the use of complex power method in experimental modal analysis.
The reliability of complex power method in experimental modal analysis was verified by author through other methods of excitation, measurement, acquisition and data processing. Finally, in aircraft structure domain this method remains the first choice [8].
The results of tests shown in this article were carried out during several months upon an aircraft wing in order to evaluate the influences of load in the modal parameters identification. Various tests and identification methods were applied. A critical review of the different tests and analysis methods, more than the selection in this paper, will be performed.
R E F E R E N C E S
[1] Gaetan Kerschen - Jean-Claude Golinval, Experimental Modal Analysis, [2] Ewins, David J.. Modal Testing - Theory, Practice and Application, England: Research Studies
Press Ltd., 2000, ISBN 0-86380-218-4 [3] Zaveri, K.., Modal Analysis of Large Structures - Multiple Exciter Systems, Denmark:
Brüel&Kjær, 1985, ISBN 87-87355-03-5 [4] K. Dijkstra, B. Marinez Vasquez, Modal Analysis Methods, Prodera Manual, 2002; [5] Alena Bilošová, Modal Testing, Ostrava 2011. [6] Ewins D J, Basics and state-of-the-art of modal testing, Sidhana, India, Vol. 25, Part 3, June
2000, pp. 207-220. [7] Randall, R.B.. Frequency Analysis, Denmark: Brüel&Kjær, ISBN 87-87355-07-8, 1987 [8] A. Gravelle, Garteur Report SM_AG-19_TP-115_OPEN, Group For Research and Technology
in Europe, ONERA 1995 [9] Arnau Cubillo Albert, Calculation and testing of the horizontal empennage of an IAR-330H
SOCAT Puma helicopter, Universitat Politècnica de Catalunya, Master Dissertation, 2014