The U.S. Solar Energy Industry: Powering America Resch SEIA... · The U.S. Solar Energy Industry:...
24
Rhone Resch Solar Energy Industries Association President & CEO January 21 st , 2015 The U.S. Solar Energy Industry: Powering America
Transcript of The U.S. Solar Energy Industry: Powering America Resch SEIA... · The U.S. Solar Energy Industry:...

Rhone Resch
Solar Energy Industries Association
President & CEO
January 21st, 2015
The U.S. Solar Energy Industry:
Powering America

About SEIA
• Founded in 1974
• U.S. National Trade Association for Solar Energy
• 1,000 member companies from around the world
• Members from across 50 states
• Largest companies in the world as well as small
installers
• Our Mission: Build a strong solar industry to power
America
• Our Goal: 10 gigawatts (GW) of annual installed solar
capacity in the U.S. by 2015
January 26, 2015 © 2014 Solar Energy Industries Association® 2

Residential Solar Photovoltaic (PV)
• Typically rooftop installations on single or multi family
residential properties
• Capacity: 1-15 kW (average 6 kW)
– Sized to account for majority of yearly household electricity use (but not
more than)
• Normally grid-connected
– Uses net energy metering (NEM)
• Average cost: $3.60/watt
– Average system cost: $20,000
• Finance Options
– Third Party Ownership (Lease)
– Debt Financing through installer
– Self-financed
• 19% Market Share in 2014
January 26, 2015 © 2014 Solar Energy Industries Association® 3

Non-Residential Solar Photovoltaic
January 26, 2015 © 2014 Solar Energy Industries Association® 4
• Roof or ground-mounted installations on commercial,
industrial, government or non-profit properties
• Capacity: 1-5000+ kW (average 100 kW)
– Sizes vary widely depending on project objectives
• Normally grid-connected
– Uses net energy metering (NEM)
– Commercial entity is electricity off-taker
• Average cost: $2.27/watt
– Average system cost: ranges widely
• Finance Options
– Third Party Ownership (PPA)
– Debt Financing through installer
– Self-financed
• 17% Market Share in 2014

Utility-Scale Solar Photovoltaic
January 26, 2015 © 2014 Solar Energy Industries Association® 5
• Typically ground-mounted installations in a variety of open
spaces (desert, brownfield, grassland, other reclaimed land)
• Capacity: 1+ MW (average 12 MW)
– Can be as large as 500 MW
• Sells electricity on wholesale market
– Utility or Independent Power Producer-owned
– Utility is electricity off-taker
• Average cost: $1.71/watt
– Average system cost: ranges widely
• Finance Options
– Multi-party arrangements
– Debt, Equity, Tax Equity, Loan
Guarantee
• 64% Market Share in 2014

Concentrating Solar Power
January 26, 2015 © 2014 Solar Energy Industries Association® 6
• Generates electricity using heat from the sun
• Systems located in areas with exceptional solar resources
• Capacity: 75 MW+
– Experimental systems can be smaller
• Sells electricity on wholesale market
– Utility or Independent Power Producer-owned
– Utility is electricity off-taker
• 767 MW installed in 2014
– 1,685 MW installed cumulatively
• Finance Options
– Multi-party arrangements
– Debt, Equity, Tax Equity, Loan
Guarantee

Solar in America: Strong and Getting Stronger
January 26, 2015 © 2014 Solar Energy Industries Association® 7
0
1,000
2,000
3,000
4,000
5,000
6,000
7,000
8,000
2000 2001 2002 2003 2004 2005 2006 2007 2008 2009 2010 2011 2012 2013 2014E
Yearl
y I
nsta
lled
So
lar
Cap
acit
y (
MW
)
Yearly U.S. Solar Installations
Residential (PV) Non-residential (PV) Utility (PV) Concentrating Solar Power (CSP)
Source: SEIA/GTM Research U.S. Solar Market Insight Q3 2014
greentechmedia.com/research/ussmi

Solar as an Economic Engine
• Nearly 174,000 American workers in solar – more than
double the number in 2009 – at 6,100 companies across
the country
January 26, 2015 © 2014 Solar Energy Industries Association® 8

Investment in Solar has increased 10x since 2006
January 26, 2015 © 2014 Solar Energy Industries Association® 9
$0.00
$2.00
$4.00
$6.00
$8.00
$10.00
$12.00
$14.00
$16.00
2006 2007 2008 2009 2010 2011 2012 2013 2014E
Mil
lio
ns
Yearly U.S. Solar Investment Source: SEIA/GTM Research U.S. Solar Market Insight Q3 2014
greentechmedia.com/research/ussmi

Growth in Solar led by Falling Prices
January 26, 2015 © 2014 Solar Energy Industries Association® 10
0
1,000
2,000
3,000
4,000
5,000
6,000
7,000
$-
$2.00
$4.00
$6.00
$8.00
$10.00
$12.00
2001 2002 2003 2004 2005 2006 2007 2008 2009 2010 2011 2012 2013 2014E
So
lar
PV
In
sta
lla
tio
ns
(M
Wd
c)
Ble
nd
ed
Ave
rag
e S
ola
r P
V P
ric
e (
$/w
att
)
Solar PV Installations Solar PV PricesSource: SEIA/GTM Research U.S. Solar Market Insight Q3 2014
greentechmedia.com/research/ussmi
Lawrence Berkeley National Laboratory, Tracking the Sun

Prices in all market segments near Sunshot Goals
January 26, 2015 © 2014 Solar Energy Industries Association® 11
$0.00
$1.00
$2.00
$3.00
$4.00
$5.00
$6.00
$7.00
2010 2011 2012 2013 2014
Insta
lled C
ost ($
/wa
tt)
Residential Commercial Utility
SunShot Goal: Residential SunShot Goal: Commercial SunShot Goal: Utility
Source: SEIA/GTM Research U.S. Solar Market Insight Q3 2014
greentechmedia.com/research/ussmi

Residential PV: Near Retail Rate Parity in Some States…
January 26, 2015 © 2014 Solar Energy Industries Association® 12
90% 77% 84% 78%
51% 37% 42%
28% 13%
10% 23% 16% 22%
49% 63% 58%
72% 87%
0%
10%
20%
30%
40%
50%
60%
70%
80%
90%
100%
Q3 2012 Q4 2012 Q1 2013 Q2 2013 Q3 2013 Q4 2013 Q1 2014 Q2 2014 Q3 2014
% o
f R
esid
en
tial
Insta
lls
California Residential Installations
With State Incentives Without State Incentives
100% 100% 99% 99% 99% 86%
48% 34%
48%
0% 0% 10% 10% 10% 14%
52% 66%
52%
0%
10%
20%
30%
40%
50%
60%
70%
80%
90%
100%
Q3 2012 Q4 2012 Q1 2013 Q2 2013 Q3 2013 Q4 2013 Q1 2014 Q2 2014 Q3 2014
% o
f R
esid
en
tial
Insta
lls
Arizona Residential Installations
With State Incentives Without State Incentives
Source: SEIA/GTM Research U.S. Solar Market Insight Q3 2014
greentechmedia.com/research/ussmi

…Still Work to do in Others
January 26, 2015 © 2014 Solar Energy Industries Association® 13
39% 41% 42% 38%
47% 50% 54% 55% 55% 55% 53%
45% 46% 46%
50%
43% 42% 35%
38% 38% 39% 40%
16% 13% 12% 12% 10% 8% 11% 7% 7% 6% 7%
0%
10%
20%
30%
40%
50%
60%
70%
80%
90%
100%
Q1 2012 Q2 2012 Q3 2012 Q4 2012 Q1 2013 Q2 2013 Q3 2013 Q4 2013 Q1 2014 Q2 2014 Q3 2014
Market Share of Residential Installations
California Remaining Top 10 States Rest of the U.S.
Source: SEIA/GTM Research U.S. Solar Market Insight Q3 2014
greentechmedia.com/research/ussmi

Third-Party Ownership plateaus, but with large market share
January 26, 2015 © 2014 Solar Energy Industries Association® 14
0%
10%
20%
30%
40%
50%
60%
70%
80%
90%
100%
Q1-2011 Q2 2011 Q3 2011 Q4 2011 Q1 2012 Q2 2012 Q3 2012 Q4 2012 Q1 2013 Q2 2013 Q3 2013 Q4 2013 Q1 2014 Q2 2014 Q3 2014
Percentage of New Residential Installations Third-Party Owned
California Arizona Colorado Massachusetts New Jersey New York
Source: SEIA/GTM Research U.S. Solar Market Insight Q3 2014
greentechmedia.com/research/ussmi

Non-Residential Market: Crossing the Financing Gap
January 26, 2015 © 2014 Solar Energy Industries Association® 15
0
50
100
150
200
250
300
350
400
450
Q12010
Q22010
Q32010
Q42010
Q12011
Q22011
Q32011
Q42011
Q12012
Q22012
Q32012
Q42012
Q12013
Q22013
Q32013
Q42013
Q12014
Q22014
Q32014
Insta
lla
tio
ns
(M
Wd
c)
U.S. PV Installations by Market Segment, Q1 2010 – Q3 2014
Residential Non-Residential
Source: SEIA/GTM Research U.S. Solar Market Insight Q3 2014
greentechmedia.com/research/ussmi

Utility PV Market: Pipeline Replenishing
January 26, 2015 © 2014 Solar Energy Industries Association® 16
8,137 9,967
27,503
4,526
0
5,000
10,000
15,000
20,000
25,000
30,000
Operating Contracted (PPA Signed) Announced (Pre Contract
So
lar
PV
Ca
pa
cit
y (
MW
dc)
Utility PV Pipeline
In Construction
Source: SEIA/GTM Research U.S. Solar Market Insight Q3 2014
greentechmedia.com/research/ussmi

Concentrating Solar Power: Recent Surge
January 26, 2015 © 2014 Solar Energy Industries Association® 17
Source: SEIA/GTM Research U.S. Solar Market Insight Q3 2014
greentechmedia.com/research/ussmi

Another Strong Year Expected in 2015
• Over 8.5 GW of solar installations in 2015
– 8.4 GW Photovoltaics
– 112 MW Concentrating Solar Power
– 18% growth over last year (30% growth in PV market)
– A new installation every 2.5 minutes
• By years end, over 28 GW of solar in U.S.
– Nearing 1 million cumulative solar installations
– Enough solar in U.S. to power 5.5 million+ homes
– Displace CO2 equivalent to 8 coal power plants,
emissions from 6.3 million vehicles
January 26, 2015 © 2014 Solar Energy Industries Association® 18
Source: SEIA/GTM Research U.S. Solar Market Insight Q3 2014
greentechmedia.com/research/ussmi
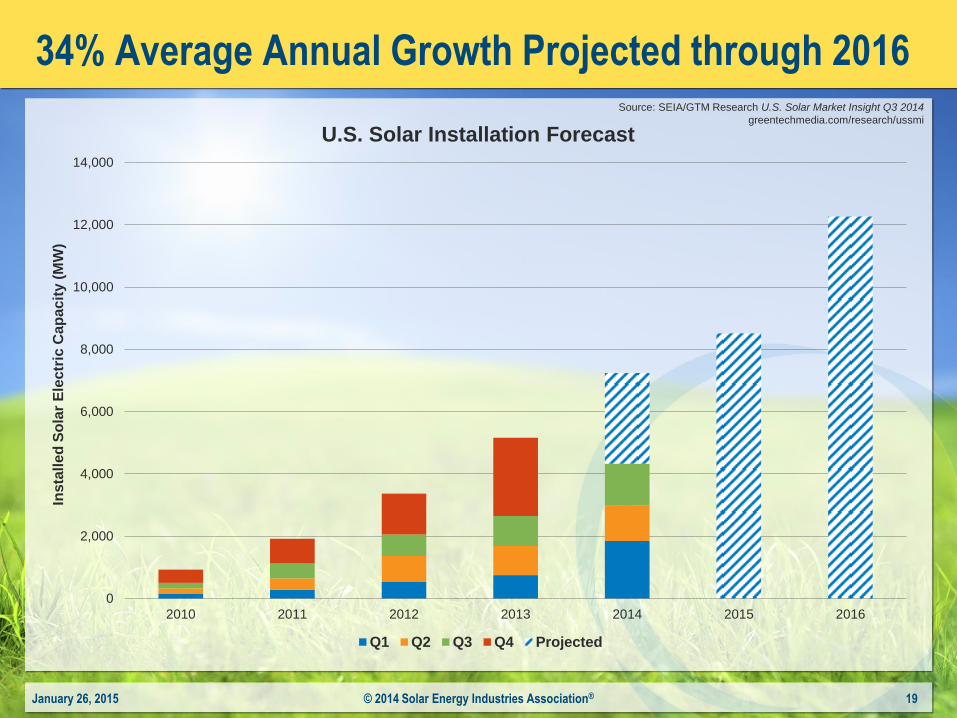
34% Average Annual Growth Projected through 2016
January 26, 2015 © 2014 Solar Energy Industries Association® 19
0
2,000
4,000
6,000
8,000
10,000
12,000
14,000
2010 2011 2012 2013 2014 2015 2016
Insta
lle
d S
ola
r E
lectr
ic C
ap
acit
y (
MW
)
U.S. Solar Installation Forecast
Q1 Q2 Q3 Q4 Projected
Source: SEIA/GTM Research U.S. Solar Market Insight Q3 2014
greentechmedia.com/research/ussmi

Continued Growth Across All Market Segments
January 26, 2015 © 2014 Solar Energy Industries Association® 20
0
1,000
2,000
3,000
4,000
5,000
6,000
7,000
2010 2011 2012 2013 2014E 2015E 2016E
Insta
lle
d P
ho
tovo
lta
ic C
ap
acit
y (
MW
dc)
Installed PV Capacity by Market Segment
Residential Non-Residential Utility
Source: SEIA/GTM Research U.S. Solar Market Insight Q3 2014
greentechmedia.com/research/ussmi

36% of Electric Capacity Installed in 2014 through Q3 from Solar
January 26, 2015 © 2014 Solar Energy Industries Association® 21
10%
29% 36%
31%
46%
47%
16%
10% 0%
41%
7% 15%
4% 8%
2%
0%
10%
20%
30%
40%
50%
60%
70%
80%
90%
100%
2012 2013 Q1-Q3 2014
New U.S. Generating Capacity by Fuel Type
Solar Natural Gas Coal Wind Other
Source: SEIA/GTM Research U.S. Solar Market Insight Q3 2014
greentechmedia.com/research/ussmi

Solar Increasingly Important Part of Generation Mix
January 26, 2015 © 2014 Solar Energy Industries Association® 22
0.0%
0.2%
0.4%
0.6%
0.8%
1.0%
1.2%
1.4%
1.6%
1.8%
0
5,000
10,000
15,000
20,000
25,000
30,000
35,000
40,000
45,000
2010 2011 2012 2013 2014E 2015E 2016E
Perc
en
tag
e o
f T
ota
l G
en
era
tio
n
Insta
lled
Cap
acit
y (
MW
)
Cumulative Solar Electric Installations Solar as % of Total Electric Generation
Source: SEIA/GTM Research U.S. Solar Market Insight Q3 2014
greentechmedia.com/research/ussmi
SEIA estimate from EIA data

SEIA Policy Priorities: Federal & Trade
• Investment Tax Credit
– Preserve and Extend at 30% Beyond 2016
– Modify to include Commence Construction
• Preserve MACRS
• Project Finance
– Increase tax equity pool through PWI authority and CRA
– Expand MLPs to include renewable energy
• Lead effort to resolve U.S.-China trade conflict
• Solar codes and safety standards
• EPA 111d
January 26, 2015 © 2013 Solar Energy Industries Association® 23

SEIA Policy Priorities: State
• Renewable Portfolio Standards
– Defend and Expand; advocate for SHC
• NEM, rate design and incentives in key states:
– CA, AZ, CO, NY, NV, MA, NJ & mid-Atlantic, TX, GA &
southeast
• Expand policies to support DG
• Grid Integration
– Outreach & education to key policymakers
– Research and address key issues
January 26, 2015 © 2013 Solar Energy Industries Association® 24