The US Oil Market. World Suppliers US Crude Oil Production is rising.
25
The US Oil Market
-
Upload
mariah-henry -
Category
Documents
-
view
215 -
download
0
Transcript of The US Oil Market. World Suppliers US Crude Oil Production is rising.
The US Oil Market
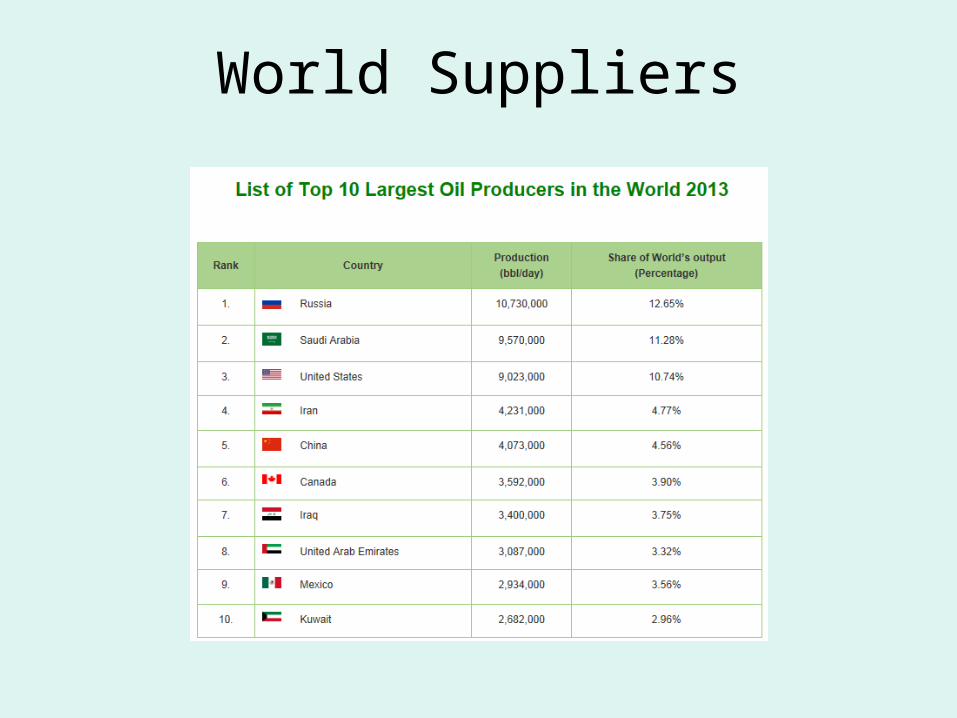
World Suppliers

US Crude Oil Production is rising
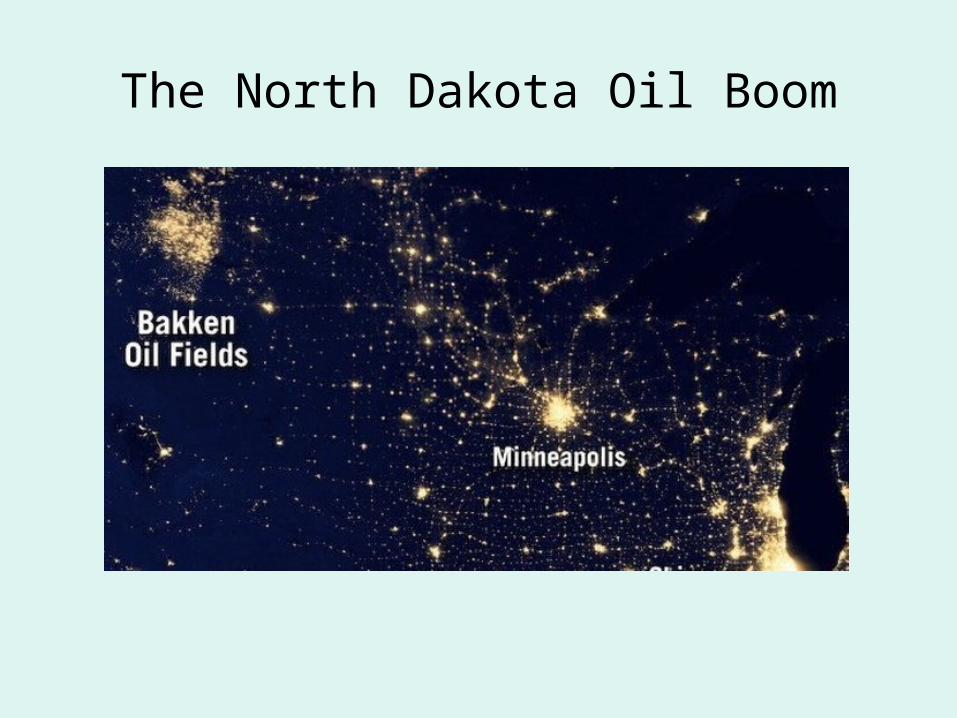
The North Dakota Oil Boom
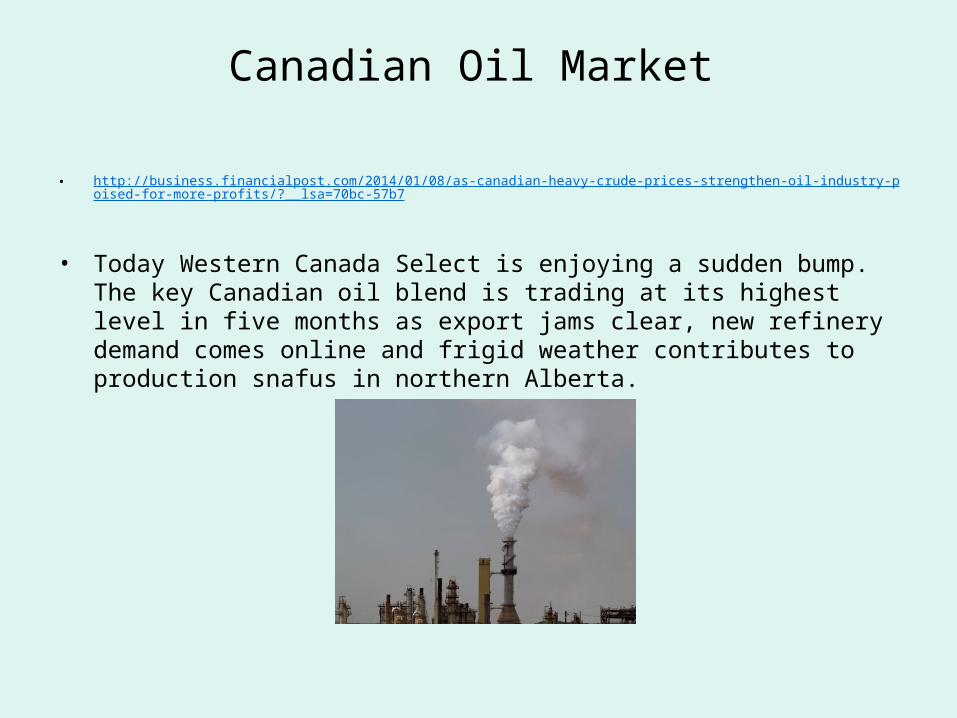
Canadian Oil Market
• http://business.financialpost.com/2014/01/08/as-canadian-heavy-crude-prices-strengthen-oil-industry-poised-for-more-profits/?__lsa=70bc-57b7
• Today Western Canada Select is enjoying a sudden bump. The key Canadian oil blend is trading at its highest level in five months as export jams clear, new refinery demand comes online and frigid weather contributes to production snafus in northern Alberta.
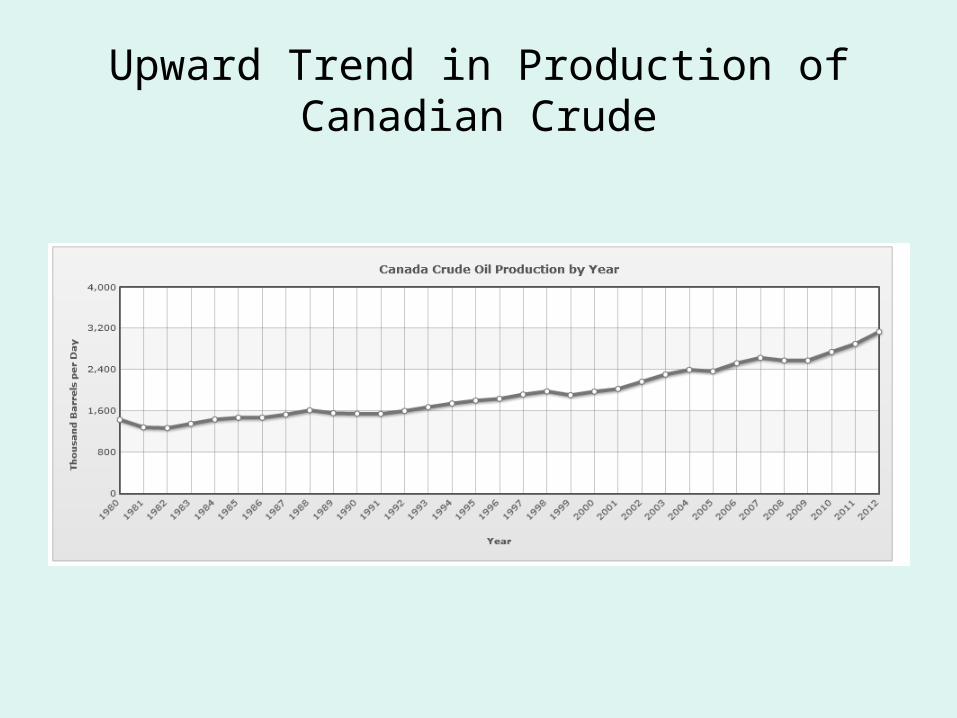
Upward Trend in Production of Canadian Crude
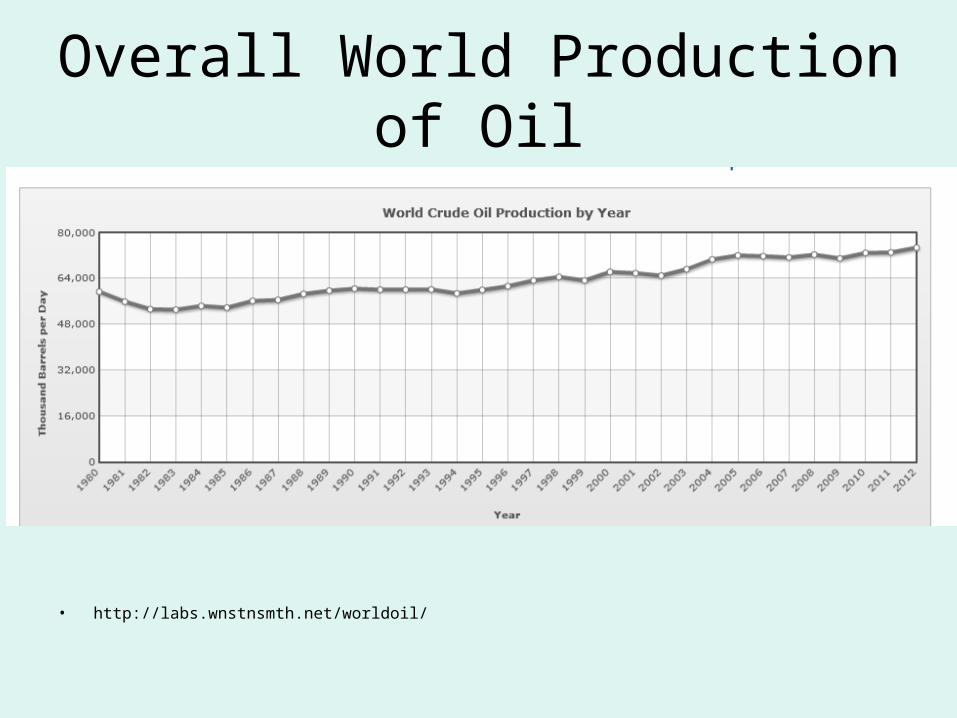
Overall World Production of Oil
• http://labs.wnstnsmth.net/worldoil/
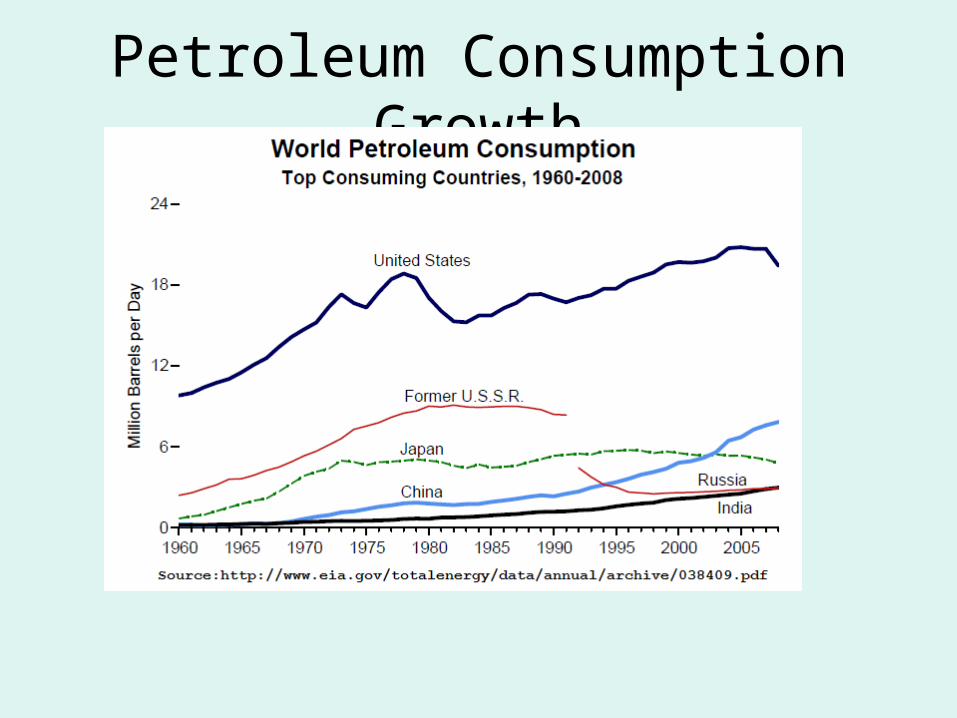
Petroleum Consumption Growth
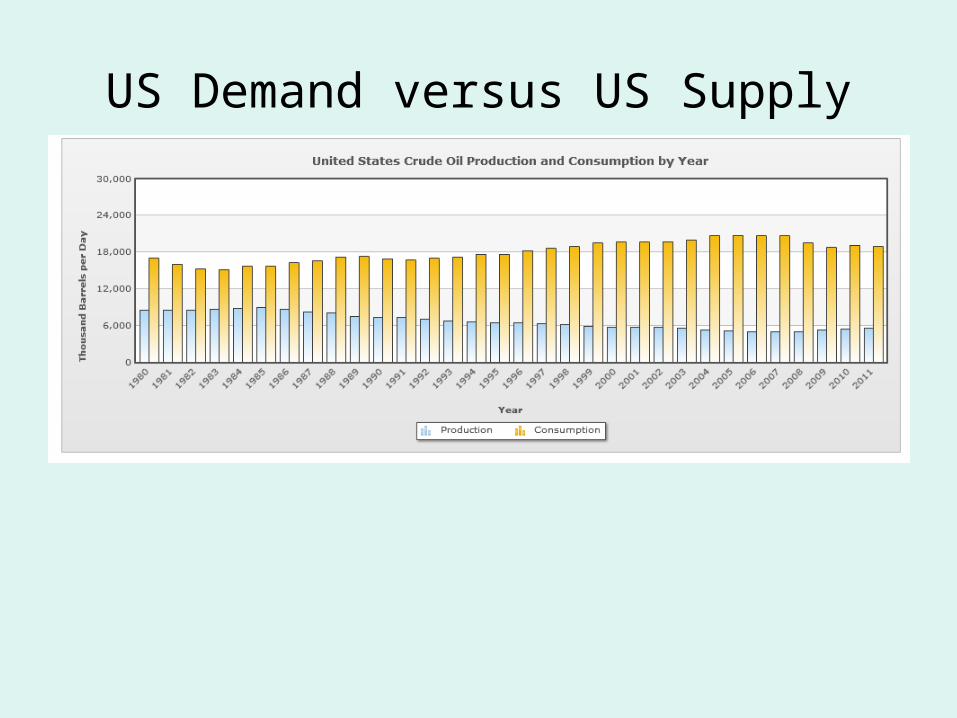
US Demand versus US Supply
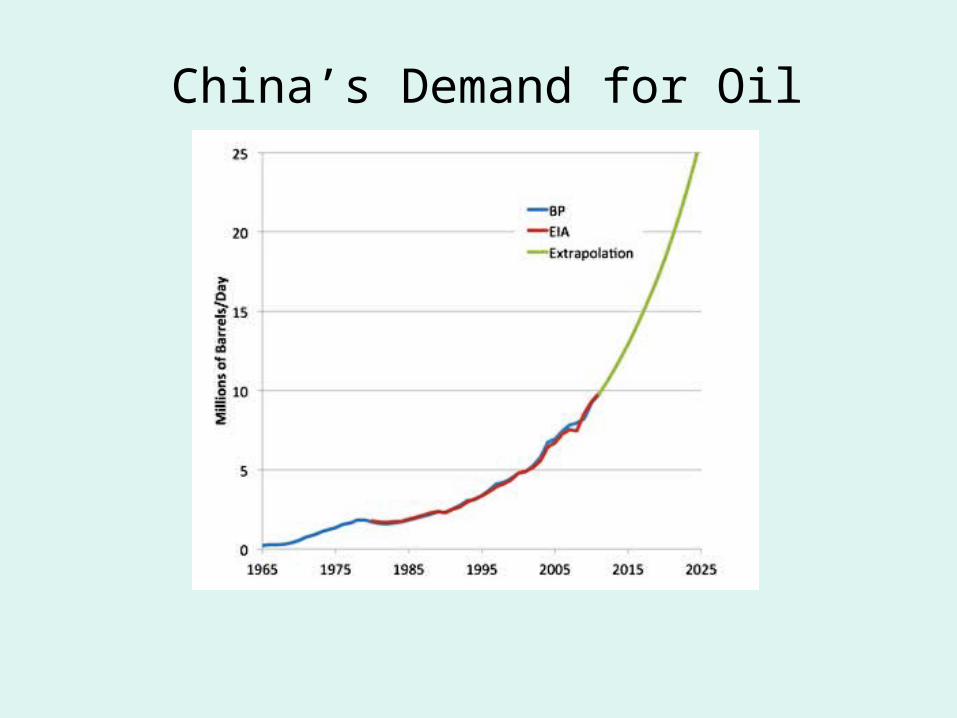
China’s Demand for Oil
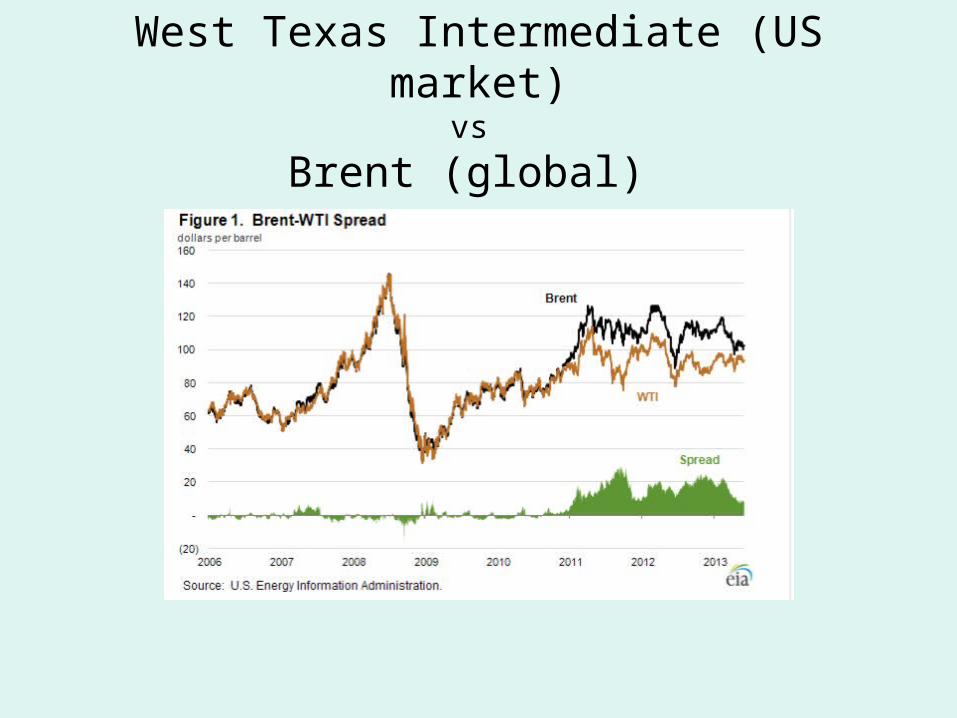
West Texas Intermediate (US market)vs
Brent (global)
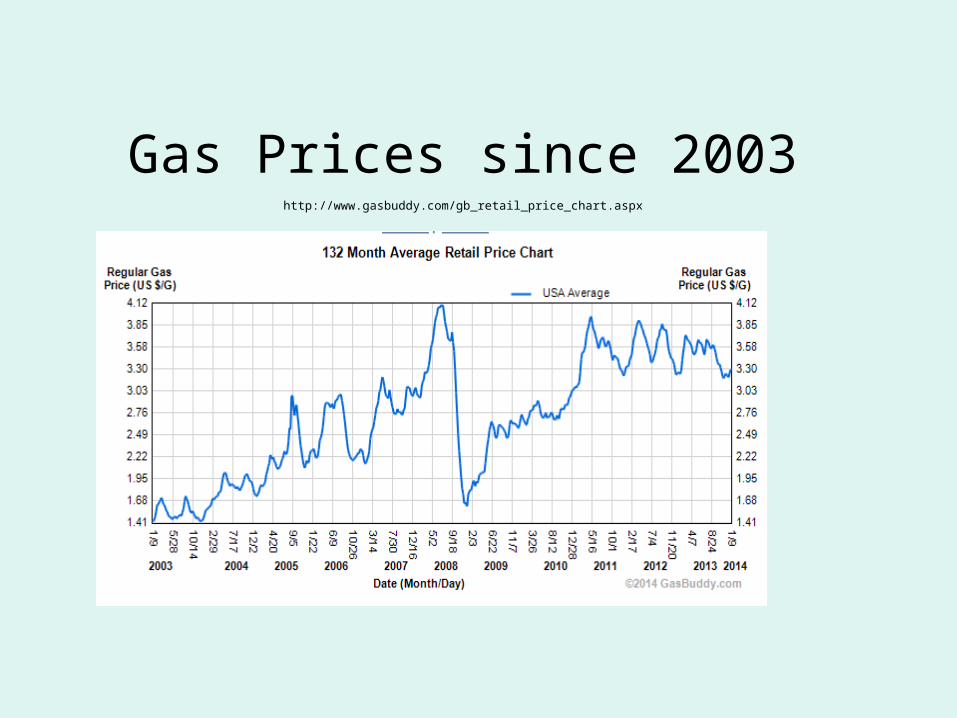
Gas Prices since 2003http://www.gasbuddy.com/gb_retail_price_chart.aspx
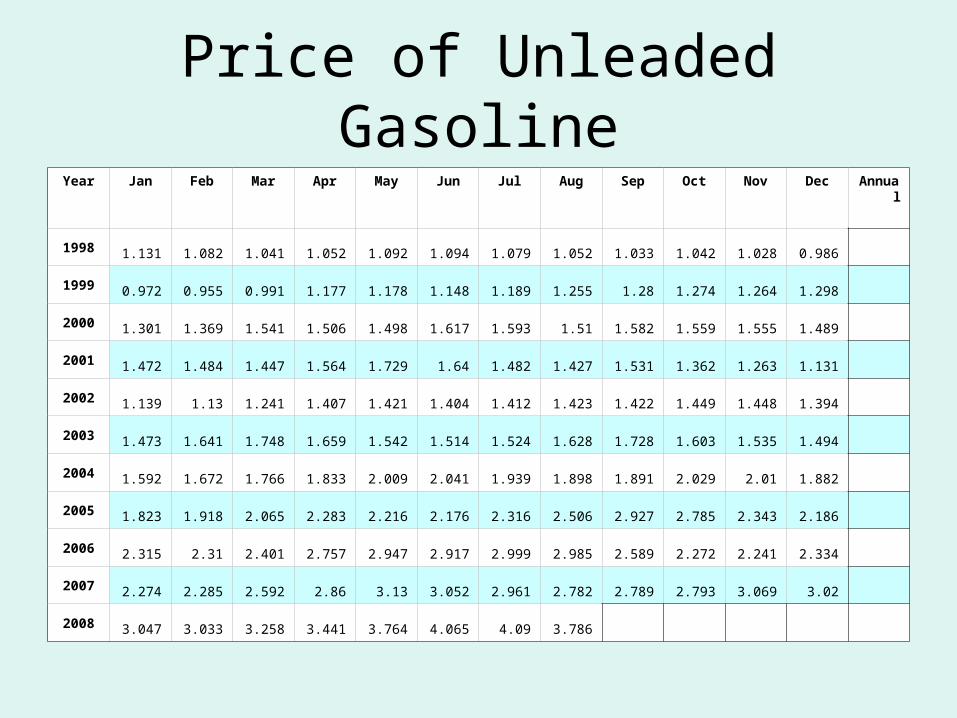
Price of Unleaded GasolineYear Jan Feb Mar Apr May Jun Jul Aug Sep Oct Nov Dec Annu
al
1998 1.131 1.082 1.041 1.052 1.092 1.094 1.079 1.052 1.033 1.042 1.028 0.986
1999 0.972 0.955 0.991 1.177 1.178 1.148 1.189 1.255 1.28 1.274 1.264 1.298
2000 1.301 1.369 1.541 1.506 1.498 1.617 1.593 1.51 1.582 1.559 1.555 1.489
2001 1.472 1.484 1.447 1.564 1.729 1.64 1.482 1.427 1.531 1.362 1.263 1.131
2002 1.139 1.13 1.241 1.407 1.421 1.404 1.412 1.423 1.422 1.449 1.448 1.394
2003 1.473 1.641 1.748 1.659 1.542 1.514 1.524 1.628 1.728 1.603 1.535 1.494
2004 1.592 1.672 1.766 1.833 2.009 2.041 1.939 1.898 1.891 2.029 2.01 1.882
2005 1.823 1.918 2.065 2.283 2.216 2.176 2.316 2.506 2.927 2.785 2.343 2.186
2006 2.315 2.31 2.401 2.757 2.947 2.917 2.999 2.985 2.589 2.272 2.241 2.334
2007 2.274 2.285 2.592 2.86 3.13 3.052 2.961 2.782 2.789 2.793 3.069 3.02
2008 3.047 3.033 3.258 3.441 3.764 4.065 4.09 3.786
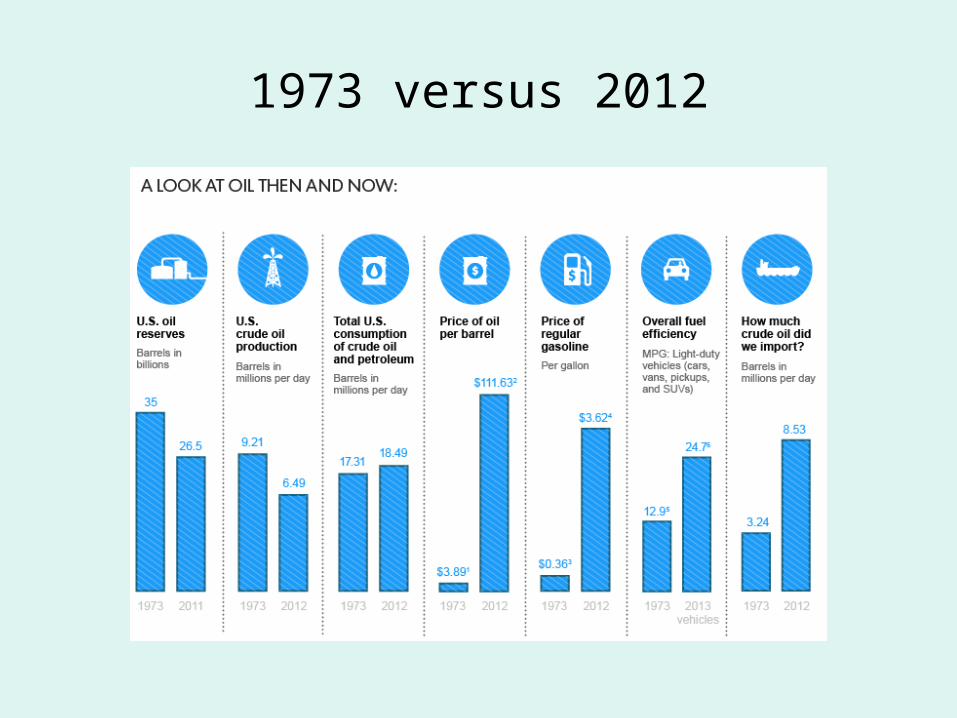
1973 versus 2012
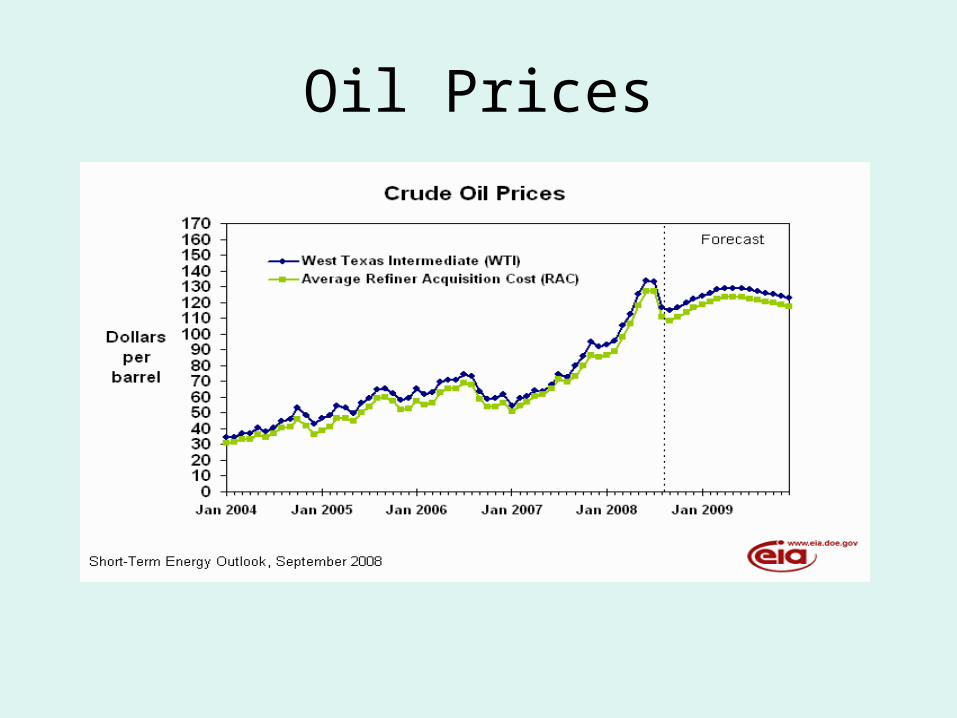
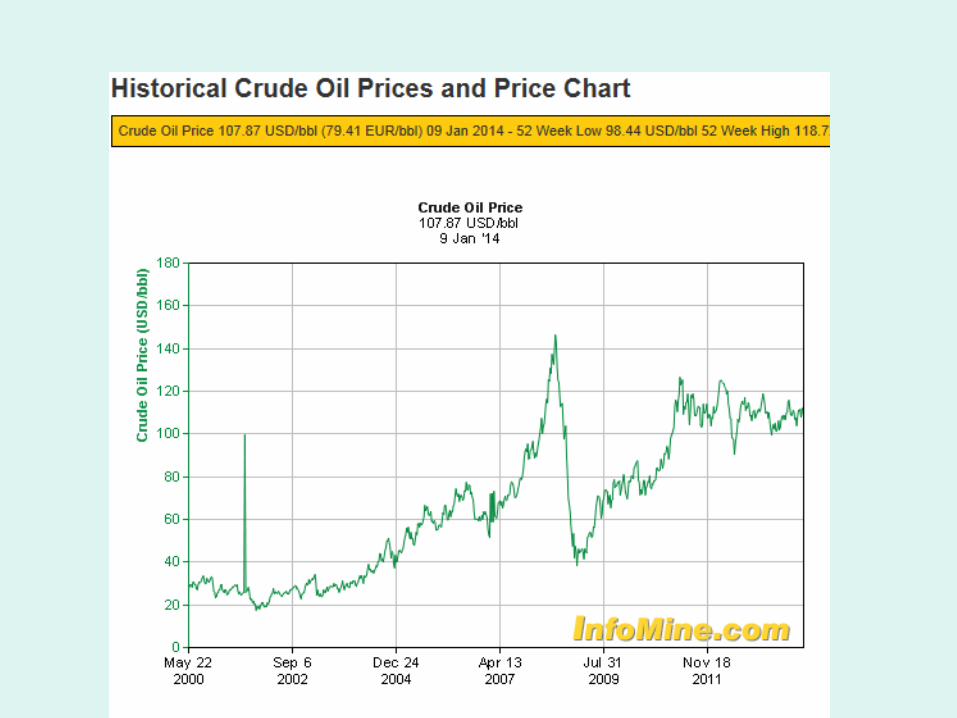
Oil Prices
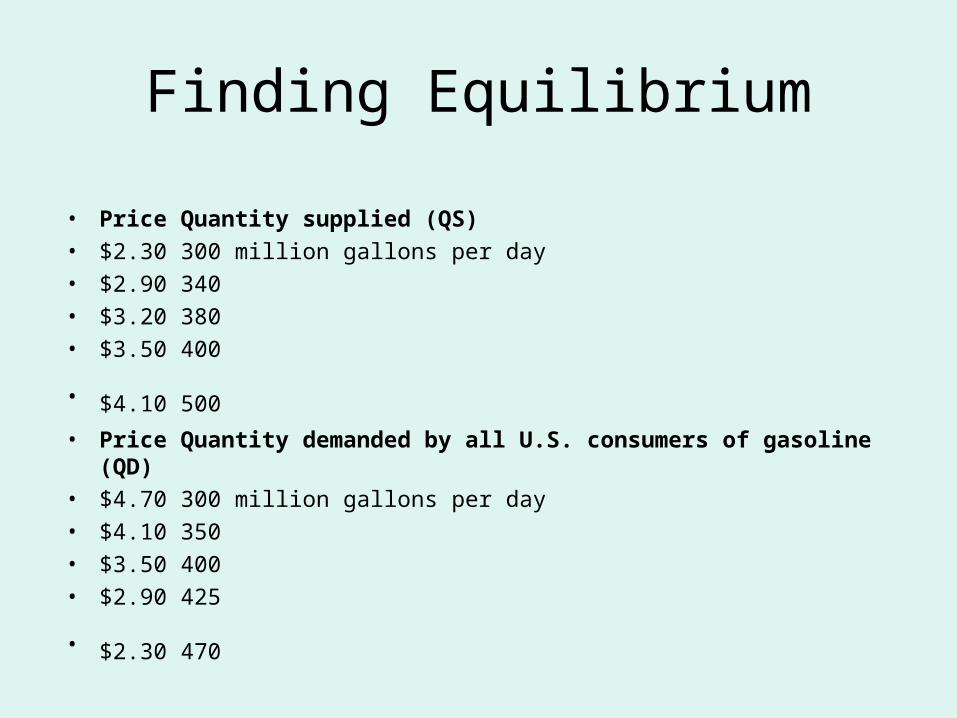
Finding Equilibrium
• Price Quantity supplied (QS)
• $2.30 300 million gallons per day
• $2.90 340
• $3.20 380
• $3.50 400
• $4.10 500 • Price Quantity demanded by all U.S. consumers of gasoline (QD)
• $4.70 300 million gallons per day
• $4.10 350
• $3.50 400
• $2.90 425
• $2.30 470
Politics and Economics
• Where will prices go from here?
• What are the factors that influence the price?
• How will the supply factors change?
• How will the demand factors change?
• http://www.washingtonpost.com/blogs/wonkblog/wp/2014/01/08/u-s-oil-exports-have-been-banned-for-40-years-is-it-time-for-that-to-change/

Additional Slides
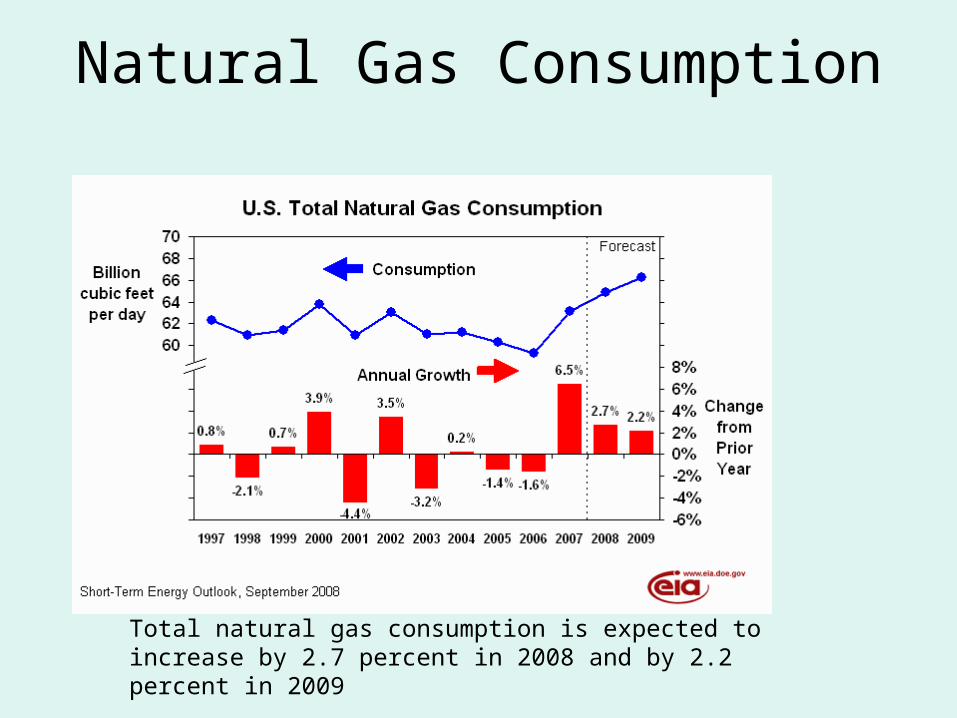
Natural Gas Consumption
Total natural gas consumption is expected to increase by 2.7 percent in 2008 and by 2.2 percent in 2009

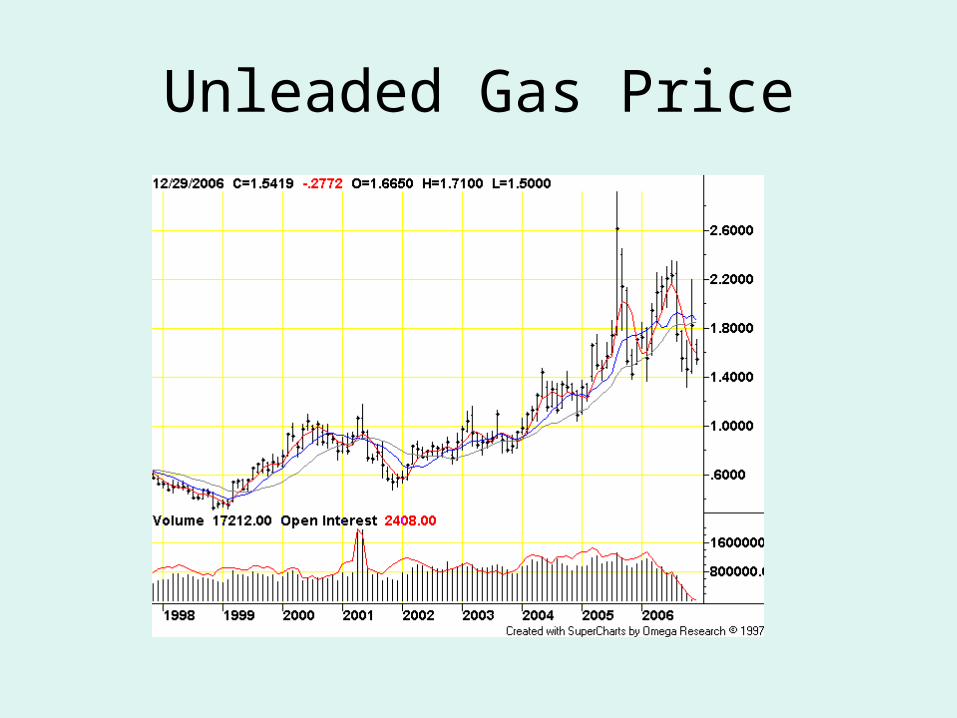
Unleaded Gas Price
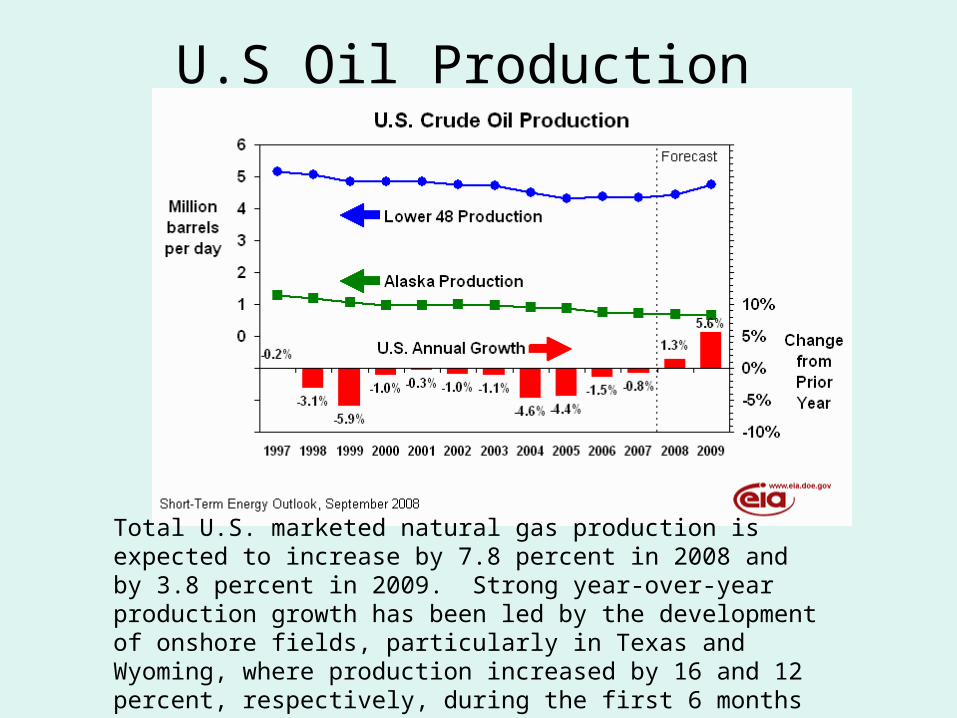
U.S Oil Production
Total U.S. marketed natural gas production is expected to increase by 7.8 percent in 2008 and by 3.8 percent in 2009. Strong year-over-year production growth has been led by the development of onshore fields, particularly in Texas and Wyoming, where production increased by 16 and 12 percent, respectively, during the first 6 months of 2008 relative to year-ago levels.