The US Healthcare System The Meat of the U.S. Health Care System: Doctors, Nurses and Hospitals.
32
The US Healthcare System The Meat of the U.S. Health Care System: Doctors, Nurses and Hospitals
-
Upload
michelle-roos -
Category
Documents
-
view
219 -
download
2
Transcript of The US Healthcare System The Meat of the U.S. Health Care System: Doctors, Nurses and Hospitals.

The US Healthcare System
The Meat of the U.S. Health Care System: Doctors, Nurses and
Hospitals

Healthcare Professionals
Healthcare is a major employer It has a rapidly growing labor sector
Professionals Non-professionals and technicians Non-institutional workers
Rapid growth due to: Technology growth and specialization Health insurance coverage Aging population Emergence of hospitals
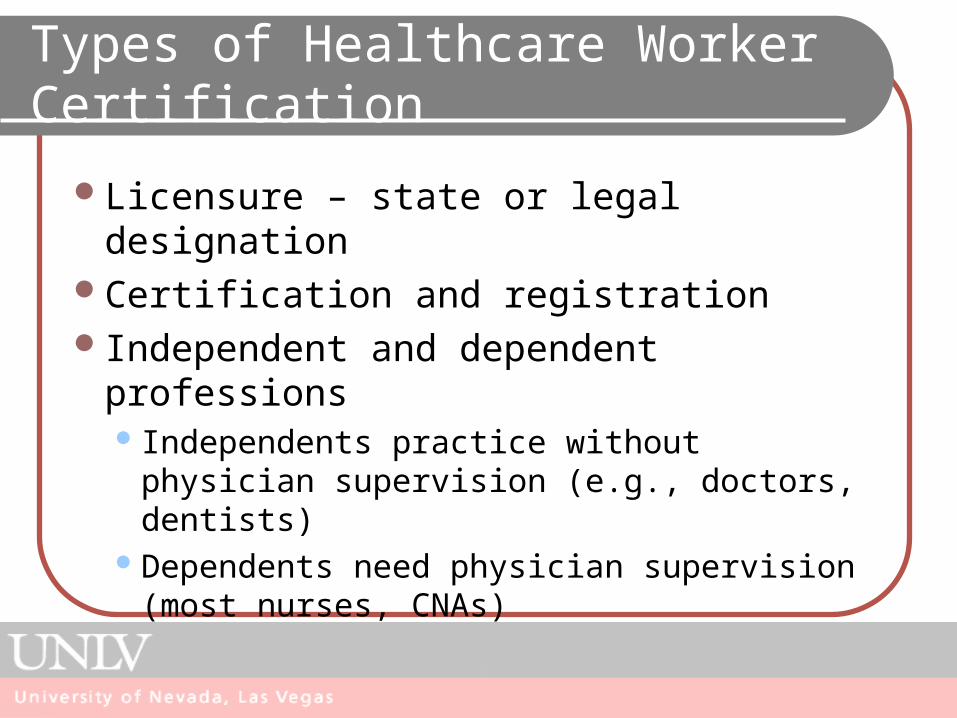
Types of Healthcare Worker Certification
Licensure – state or legal designationCertification and registrationIndependent and dependent professions
Independents practice without physician supervision (e.g., doctors, dentists)
Dependents need physician supervision (most nurses, CNAs)

Physicians
Comprised of two types by practicePrimary care physicians – short supply in
U.S.Family Practice, Internal medicine, OB/GYN,
PediatriciansSpecialists – Surplus in U.S.
Specialize in specific areas

Physician Surplus or Shortage?
Rapid growth of physicians, esp. specialists, during 1980-95 due to: Massive federal outlays Influx of International Medical Graduates (IMGs)
Maldistribution of physicians can give appearance of shortage Not enough primary care providers Medical underserved areas in rural communities
and inner cities Malpractice and the impact on physicians
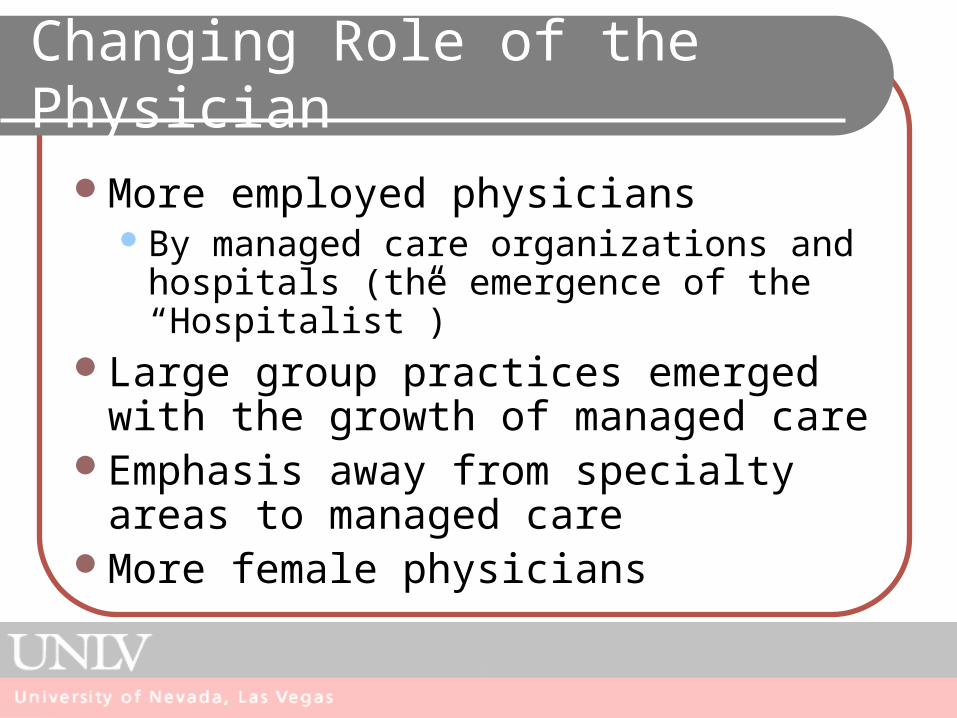
Changing Role of the Physician
More employed physiciansBy managed care organizations and
hospitals (the emergence of the “Hospitalist”)
Large group practices emerged with the growth of managed care
Emphasis away from specialty areas to managed care
More female physicians

Distribution of Physicians by Specialty: 1980, 1986, 1995, 2000 (In thousands
1980 1986 1995 2000 Pct. Change
Specialty No./% No./% No./% No./% 1986-2000
All specialties414/100 521/100 630/100 684/100 31.4
Primary Care 159/38.5 179/34.4 205/32.5 219/32.0 22.2
Other Medical
Specialties 25/6.2 62/12.0 83/13.2 94/13.7 50.2
Surgical Specialties 110/26.7 134/25.7 158/25.2 170/24.9 27.0
All other specialties 118/28.5 144/27.8 183/29.1 201/29.4 38.9

Physician Authority
Based on modern science and scientific knowledge. Physicians become the intermediaries between
science and private experience Authority signifies the presence of status and quality Requires legitimacy and dependence.
Legitimacy – acceptance by subordinates Dependence – bad things can happen if we don’t obey
Types of Physician Authority Social Authority Cultural Authority Professional Authority
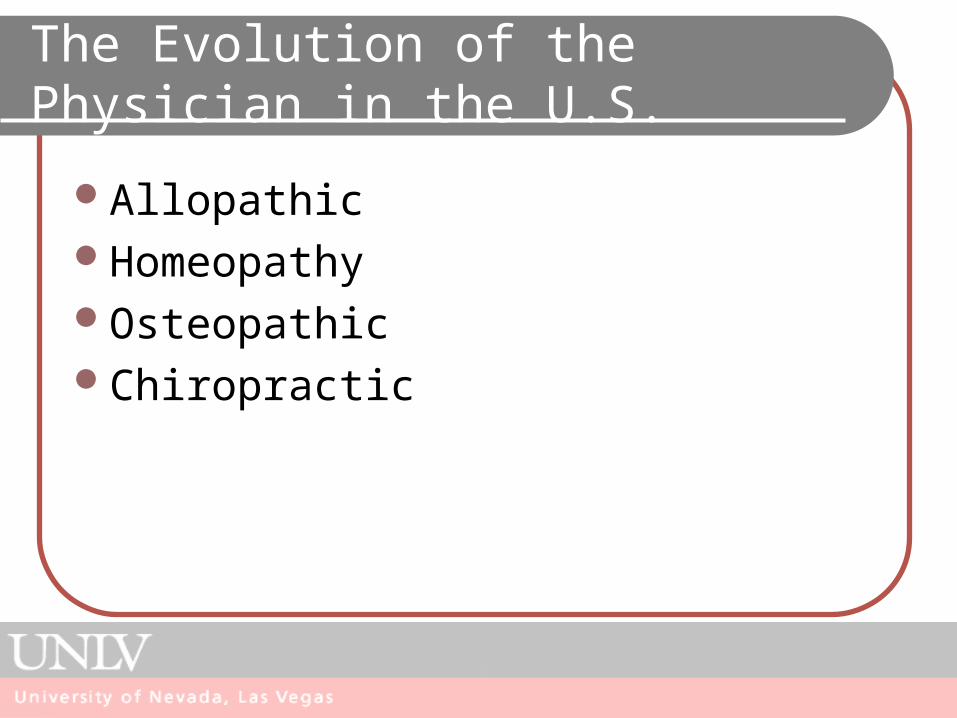
The Evolution of the Physician in the U.S.
AllopathicHomeopathyOsteopathicChiropractic

Physicians
Comprised of two types by practicePrimary care physicians – short supply in
U.S.Family Practice, Internal medicine, OB/GYN,
PediatriciansSpecialists – Surplus in U.S.
Specialize in specific areas

Physician Surplus or Shortage?
Rapid growth of physicians, esp. specialists, during 1980-95 due to: Massive federal outlays Influx of International Medical Graduates (IMGs)
Distribution of physicians gives appearance of shortage Not enough primary care providers Medical underserved areas in rural communities
and inner cities Malpractice and the impact on physicians
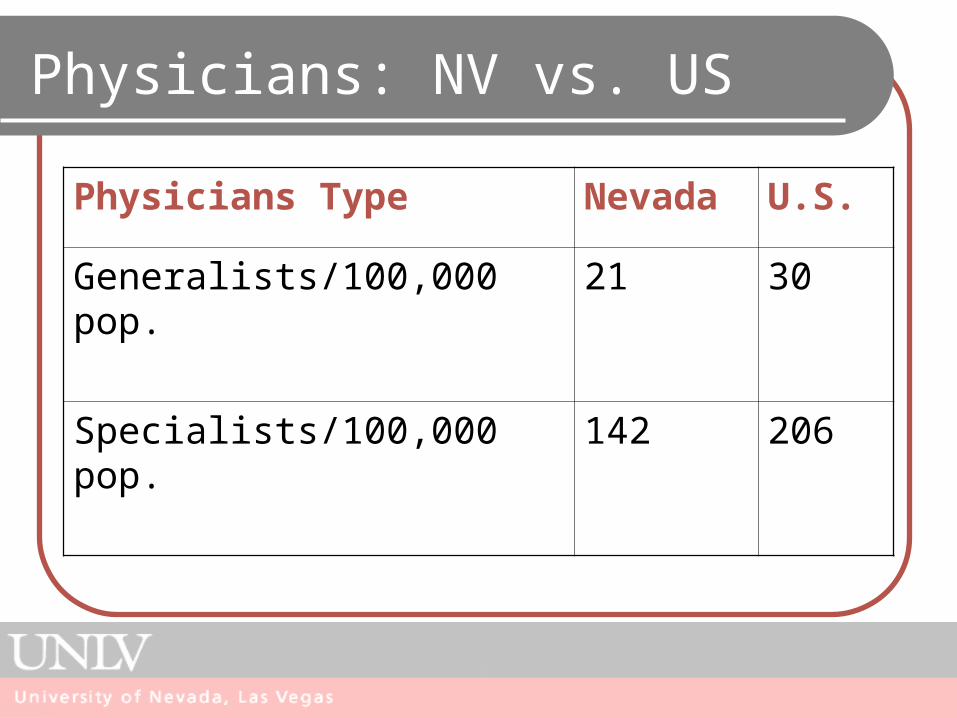
Physicians: NV vs. US
Physicians Type Nevada U.S.
Generalists/100,000 pop. 21 30
Specialists/100,000 pop. 142 206

Changing Role of the Physician
More employed physiciansBy managed care organizations and
hospitals (the emergence of the “Hospitalist”)
Large group practices emerged with the growth of managed care
Emphasis away from specialty areas to managed care
More female physicians
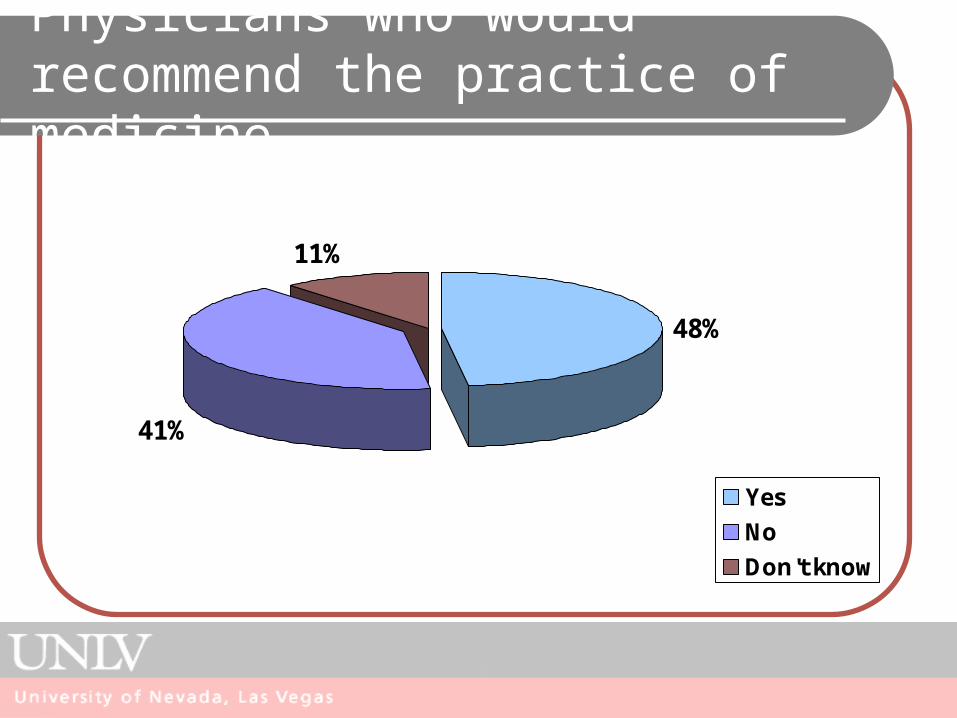
Physicians who would recommend the practice of medicine
48%
41%
11%
Yes
No
Don't know
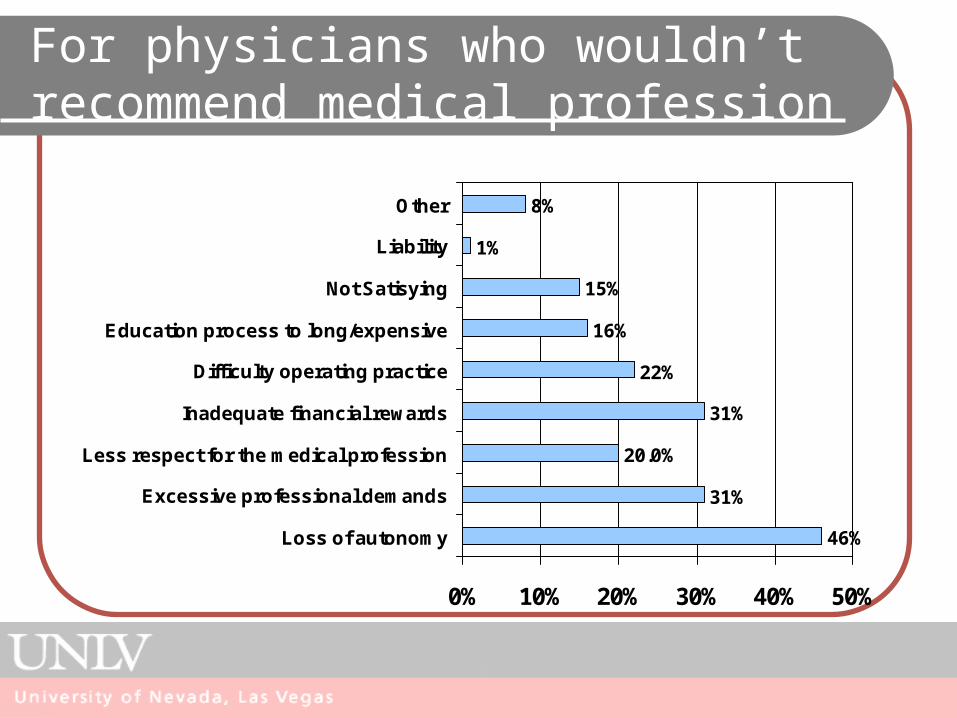
46%
31%
20.0%
31%
22%
16%
15%
1%
8%
0% 10% 20% 30% 40% 50%
Loss of autonomy
Excessive professional demands
Less respect for the medical profession
Inadequate financial rewards
Difficulty operating practice
Education process to long/expensive
Not Satisying
Liability
Other
For physicians who wouldn’t recommend medical profession

Distribution of Physicians by Specialty: 1980, 1986, 1995, 2000 (In thousands
1980 1986 1995 2000 Pct. Change
Specialty No./% No./% No./% No./% 1986-2000
All specialties414/100 521/100 630/100 684/100 31.4
Primary Care 159/38.5 179/34.4 205/32.5 219/32.0 22.2
Other Medical
Specialties 25/6.2 62/12.0 83/13.2 94/13.7 50.2
Surgical Specialties 110/26.7 134/25.7 158/25.2 170/24.9 27.0
All other specialties 118/28.5 144/27.8 183/29.1 201/29.4 38.9

Physician Medical Education
Undergraduate medical curriculum Most emphasize the acute care setting Increase in women and minorities
Graduate medical education Major increases in residencies Shifts in the organization of medical schools
Must compete for patients Shift to managed care by med school hospitals Trends medical education in for-profit hospitals
Flexnor Report

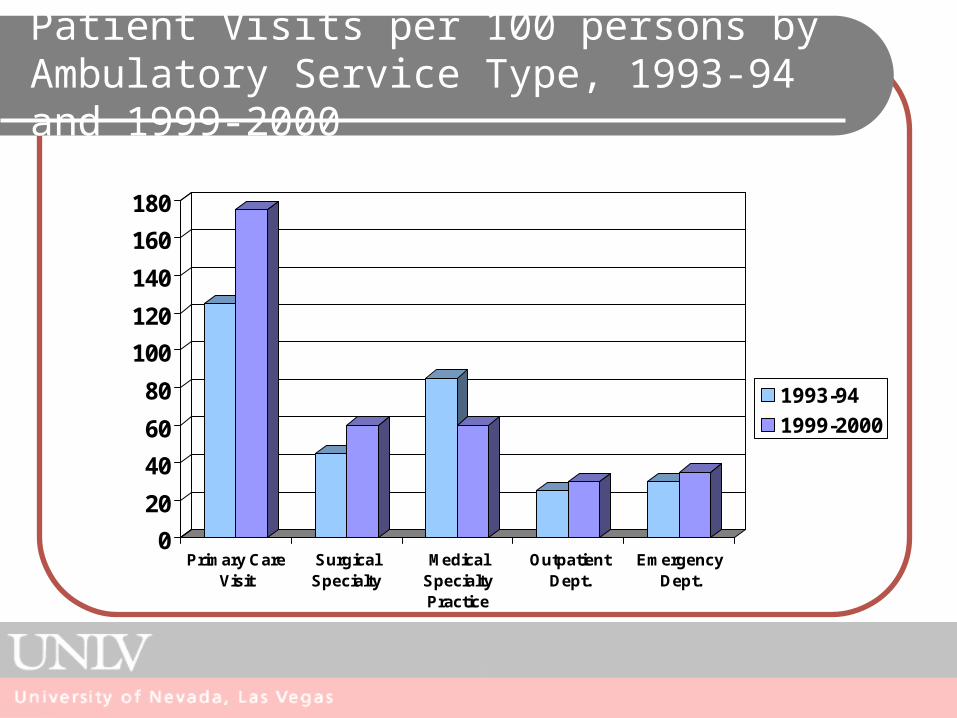
Patient Visits per 100 persons by Ambulatory Service Type, 1993-94 and 1999-2000
0
20
40
60
80
100
120
140
160
180
Primary CareVisit
SurgicalSpecialty
MedicalSpecialtyPractice
OutpatientDept.
EmergencyDept.
1993-94
1999-2000
Nurses
Typifies the concern of healthcare: “nursing is concerned with human response to health problems”
Historic factors that shaped nursing as a career: Occupation to support physicians Emergence of hospitals as community institutions Acceptable female occupations, primarily white
females Linked to religious orders

Understanding the Nursing Shortage
Changes in occupational opportunities for women since 1970s
Majority of RNs are 50+ years of age or married with children at home
Low salaries – pay compression Burnout Lack of clinical career ladder Active vs. Inactive – about 1/3 of nurses not
working fulltime

The Nursing Shortage Snapshot Estimated shortfall of 1.1 million RNs in U.S. by 2012 Demand requires at least 110,000 more nursing
graduates/year. Shortage of nurse faculty: enrollment up by 13% in 2005, but
more than 36,000 qualified applicants turned away. Some Solutions?
Improve work environment conducive to recruiting new nursing faculty and retaining nurse educators
Increase amount of public and private funding for nursing programs
Implement new methods of instruction. Improve partnerships between nursing schools and clinical
sites Is importing nurses a solution?
Hospitals
The growth of Hospitals in the U.S. is a fairly recent history: Hill-Burton Hospital Insurance Advances in medical science Professional nursing Improved medical school training for physicians
Cost containment practices have lowered hospital utilization Decreased inpatient utilization through DRGs and managed
care Shift to outpatient services System and specialty hospital growth

Hospital Classification
For-profits – fastest growing type of hospitals For-profit and non-profit systems (e.g., Kaiser
Permanente, Catholic Hospitals West) Public Hospitals
Numbers are in decline Serve disproportionate number of Medicaid and
uninsured Account for nearly 25% of uncompensated care Includes federally funded facilities such as VA and
Armed Services facilities (McCallahan Federal Hospital)

Hospitals (types cont.)
Academic teaching hospitals Tripartite mission Face shaky future
Rural Hospitals Small, non-profit Many with nursing home swing beds Endangered Quality of care in question Types of services available being lost to cities
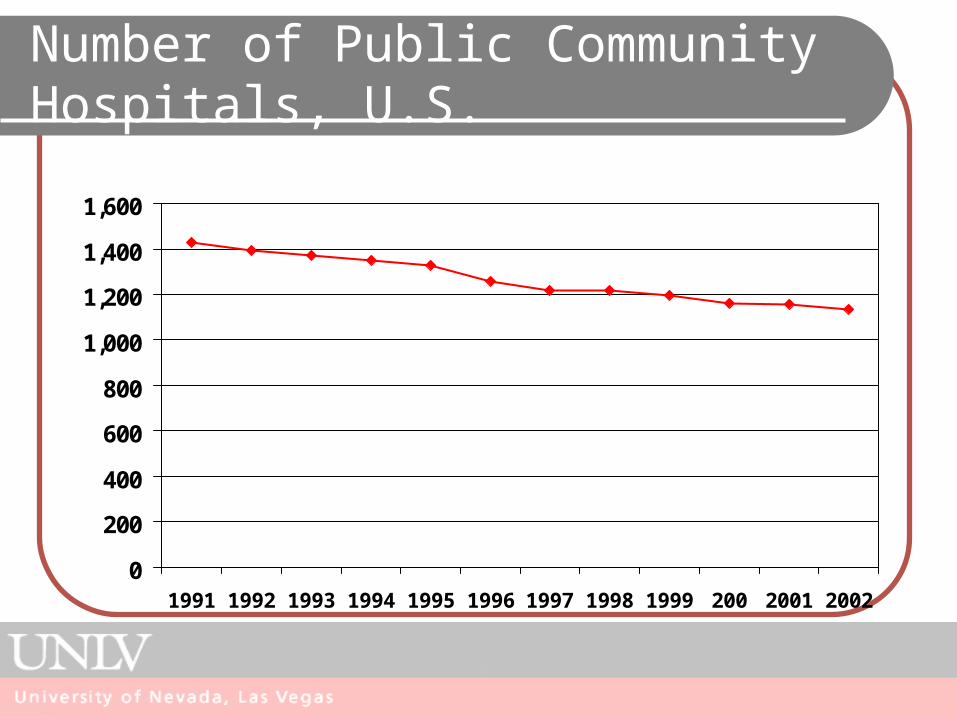
Number of Public Community Hospitals, U.S.
0
200
400
600
800
1,000
1,200
1,400
1,600
1991 1992 1993 1994 1995 1996 1997 1998 1999 200 2001 2002

Constraining and Propelling Forces Affecting Hospital
Constraining Governmental and third party
purchaser pressure for cost containment
Competition from multi-hospital systems and local physicians
Conservatism of some traditionally oriented practicing physicians
Cost of continuing technological advances
Slower growth of the economy Changing governmental
philosophy toward health care
Propelling New health markets other than
inpatient care Weakening power of physicians
in the hospital New organizational structures Increasing power of a more
business-oriented management team
Aging of the population Changing customer expectations
for service

Hospital Beds per 1,000 population by Ownership, 2002
Nevada U.S.
State/Local Government Hospital Beds
17% 16%
Non-Profit Hospital Beds
32% 71%
For Profit Hospital Beds
51% 13%

Background: Las Vegas Hospitals September, 2001
Total Govt. (n=2)
Private, For-Profit
(n=6)
Private, Non-Profit
(n=3)
Number of Hospital Beds
2972 639 1963 370
Number of ER Beds 272 61 161 50
Isolation Beds 166 46 58 62
ER Clinicians 379 95 240 44
Security Staff 136 49 67 20
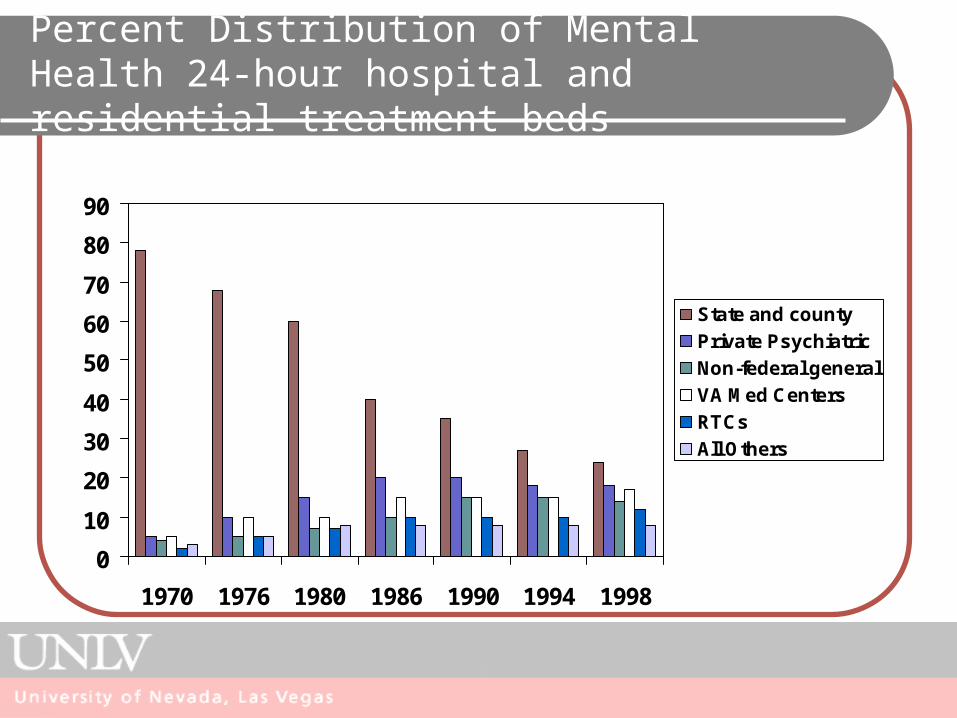
Percent Distribution of Mental Health 24-hour hospital and residential treatment beds
0
10
20
30
40
50
60
70
80
90
1970 1976 1980 1986 1990 1994 1998
State and county
Private Psychiatric
Non-federal general
VA Med Centers
RTCs
All Others

Who Gets Treatment for Mental Illness?
8%7%20%
65%
Mental or Addictive illnessreceiving treatment
No defined illness,received treatment
Mental or addictiveillness, not treatment
No defined illness, notreatment

Ambulatory Care
Personal health care given to the patient in an non-hospital or institutional setting
Types of settings: Physician owned private practice Managed care clinic settings Community health care settings “Urgent care” facilities
Shift to ambulatory care due to several factors: Medicare PPS Managed care Improved technology
Patient Visits per 100 persons by Ambulatory Service Type, 1993-94 and 1999-2000
0
20
40
60
80
100
120
140
160
180
Primary CareVisit
SurgicalSpecialty
MedicalSpecialtyPractice
OutpatientDept.
EmergencyDept.
1993-94
1999-2000