The Upgraded Dutch Design Method for Concrete …sept.org/techpapers/1067.pdfA universal design...
21
Proceedings of the 7 th International Conference on Concrete Block Paving (PAVE AFRICA 2003) 12 th 15 th October 2003 ISBN Number: 0-958-46091-4 Sun City, South Africa Proceedings produced by: Document Transformation Technologies Conference Organised by: Conference Planners THE UPGRADED DUTCH DESIGN METHOD FOR CONCRETE BLOCK ROAD PAVEMENTS Huurman, M. 1 , Houben, L.J.M., Geense, C.W.A 2 . and van der Vring, J.J.M. 3 1 Delft University of Technology, Faculty of Civil Engineering and Geosciences, PO Box 5048, 2600 GA Delft, The Netherlands. Tel: (31) 15 27 81525. Fax: (31) 15 27 83443. E-mail: [email protected] 2 Municipality of Rotterdam, Rotterdam, The Netherlands. ABSTRACT Small concrete elements are widely used in the Netherlands, mainly concrete blocks 80 mm thick and horizontal dimensions of 211 mm x 105 mm. In industrial areas the thickness of the blocks is increased to 100 mm or 120 mm. When only minor traffic loads are expected blocks with a thickness of 70 mm are occasionally applied. Due to the fact that the quality of the subgrades in the Netherlands is poor, sand is regarded as a structural material for roads. Higher-quality natural materials are simply not available. As a result, sand is often used as a sub-base in concrete block pavements. If a base is needed, it is usually a mixture of crushed masonry and crushed concrete. Of these recycled materials at least 50% (m/m) should be crushed concrete. It is known from both practice and laboratory testing that the behaviour of sands is heavily dependent on their source. The degree of compaction is also a very determining factor. A universal design method for Dutch concrete block pavements should thus take into consideration the type of sand that is to be used in the sub-base and its degree of compaction. Similar information about the base should also be taken into account. In this paper, the development of a universal design method for concrete block pavements in The Netherlands is discussed and major findings presented. The method is largely based on a mechanistic determination of rut development. This mechanistic approach requires the mechanical properties of all the materials used in the substructure. For this reason, equations describing the mechanical properties of the materials involved as a function of material composition, grading, grain shape and compaction are derived by regression analysis. Their development results in an improved understanding of the behaviour of unbound materials used in the Netherlands. As such, and combined with the mechanistic approach of rutting, they enable the development of a new design method. This paper only describes the behaviour of concrete block pavements without a base, so with a sand sub-base only. For this type of structure the design method is explained and design examples illustrate the relative effect of various design parameters. 1. INTRODUCTION Small concrete elements are widely used in the Netherlands, mainly concrete blocks 80 mm thick and horizontal dimensions of 211 mm x 105 mm.
Transcript of The Upgraded Dutch Design Method for Concrete …sept.org/techpapers/1067.pdfA universal design...
Proceedings of the 7th International Conference on Concrete Block Paving (PAVE AFRICA 2003) 12th � 15th October 2003ISBN Number: 0-958-46091-4 Sun City, South AfricaProceedings produced by: Document Transformation Technologies Conference Organised by: Conference Planners
THE UPGRADED DUTCH DESIGN METHOD FOR CONCRETEBLOCK ROAD PAVEMENTS
Huurman, M.1, Houben, L.J.M., Geense, C.W.A2. and van der Vring, J.J.M.3
1Delft University of Technology, Faculty of Civil Engineering and Geosciences,PO Box 5048, 2600 GA Delft, The Netherlands.
Tel: (31) 15 27 81525. Fax: (31) 15 27 83443. E-mail: [email protected] of Rotterdam, Rotterdam, The Netherlands.
ABSTRACT
Small concrete elements are widely used in the Netherlands, mainly concrete blocks 80 mm thickand horizontal dimensions of 211 mm x 105 mm. In industrial areas the thickness of the blocks isincreased to 100 mm or 120 mm. When only minor traffic loads are expected blocks with athickness of 70 mm are occasionally applied.
Due to the fact that the quality of the subgrades in the Netherlands is poor, sand is regarded as astructural material for roads. Higher-quality natural materials are simply not available. As a result,sand is often used as a sub-base in concrete block pavements. If a base is needed, it is usually amixture of crushed masonry and crushed concrete. Of these recycled materials at least 50% (m/m)should be crushed concrete.
It is known from both practice and laboratory testing that the behaviour of sands is heavilydependent on their source. The degree of compaction is also a very determining factor.A universal design method for Dutch concrete block pavements should thus take into considerationthe type of sand that is to be used in the sub-base and its degree of compaction. Similar informationabout the base should also be taken into account.
In this paper, the development of a universal design method for concrete block pavements in TheNetherlands is discussed and major findings presented. The method is largely based on amechanistic determination of rut development. This mechanistic approach requires the mechanicalproperties of all the materials used in the substructure. For this reason, equations describing themechanical properties of the materials involved as a function of material composition, grading,grain shape and compaction are derived by regression analysis. Their development results in animproved understanding of the behaviour of unbound materials used in the Netherlands. As such,and combined with the mechanistic approach of rutting, they enable the development of a newdesign method.
This paper only describes the behaviour of concrete block pavements without a base, so with a sandsub-base only. For this type of structure the design method is explained and design examplesillustrate the relative effect of various design parameters.
1. INTRODUCTION
Small concrete elements are widely used in the Netherlands, mainly concrete blocks 80 mm thickand horizontal dimensions of 211 mm x 105 mm.

In industrial areas the thickness of the blocks is increased to 100 mm or 120 mm. When only minortraffic loads are expected blocks with a thickness of 70 mm are occasionally applied.
The recent trend in the Netherlands towards also using blocks in architectural applications has led tothe use of concrete elements with a shape and thickness that differs from the above standards. Theseelements are also available in a large variety of colours.
Clearly, then, any design procedure for concrete block pavements in the Netherlands must considerthe dimensions of the block itself.
Due to the fact that the quality of the subgrades in the Netherlands is poor, sand is regarded as astructural material for roads. Higher-quality natural materials are simply not available. As a result,sand is often used as a sub-base in concrete block pavements. If a base is needed, it is usually amixture of crushed masonry and crushed concrete. Of these recycled materials at least 50% (m/m)should be crushed concrete.
It is known from both practice and laboratory testing that the behaviour of sands is heavilydependent on their source. The degree of compaction is also a very determining factor.
A universal design method for concrete block pavements should thus take into consideration thetype of sand that is to be used in the sub-base and its degree of compaction. Similar informationabout the base should also be taken into account.
In the Netherlands the official failure criterion for concrete block pavements is a 15 mm rut depth.However this criterion is hardly ever respected and larger rut depths, dependent on the situation, areaccepted. This implies that there is a need for a design tool in which the failure criterion may bevaried.
Apart from information about the materials used in the sub-base and base, the type of blocks and theneed for a flexible failure criterion, a universal design method should also take into account thestiffness of the subgrade and the design load (magnitude and lateral wander). In this paper thedevelopment of a universal design method for concrete block pavements in The Netherlands isdiscussed. This work is the result of an ongoing tradition in research into concrete block pavementbehaviour by the Delft University of Technology.
2. APPROACH
In 1988 the first Dutch design method for concrete block pavements (cbp) was presented in Rome atthe Third International Conference on Concrete Block Paving (Houben, 1988) This method wasbased on test section behaviour combined with structural calculations.
In order to verify the method a research program was started in 1990 which ran until 1997. Itresulted in a finite element model for cbps in which the behaviour of the unbound materials in thebase and sub-base was addressed. The finite element code that was developed as part of the researchis discussed extensively elsewhere (Huurman, 1996a; 1996b; 1997).
During the research program, the mechanical properties of eight sands and four base materials werealso investigated. The material models that were applied are now briefly discussed.
This paper only describes the behaviour of cbps with a sand sub-base, which is the most widelyused cbp structure in the Netherlands. A similar approach for cbps with an unbound base and a sandsub-base, although not discussed in this paper, has just been completed.
2.1 StrengthThe strength of unbound materials is evaluated in terms of the Mohr-Coulomb criterion from whichexpression (1) was derived.
( )φ
φσφσ
sin1cos2sin1
,1 −
⋅+⋅+=
cconff (1)
wherec: cohesion [kPa]Φ: angle of internal friction [degr]σconf: confining pressure [kPa]σ1,f: first principal stress at failure [kPa]
On the basis of (1) the stress ratio σ1/σ1,f can be determined. This stress ratio increases withincreasing material loading and reaches the value of 1 at failure.
2.2 Resilient BehaviourFor sands the following equation was found to give a proper description of the measured resilientmodulus as a function of stress.
−
=
4
,1
1
2
0
311k
f
kconf kkMr
σσ
σσ (2)
whereMr: resilient modulus [MPa]σ1/σ1,f: stress ratio [-]σconf: confining pressure [kPa]σ0: reference stress of 1 [kPa]k1: model parameter [MPa]k2, k3, k4: model parameters [-]
2.3 Permanent DeformationThe development of permanent deformation in sands was described by the following equation.
B
permNA
=1000
ε with 2
,1
11a
f
aA
=
σσ and
2
,1
11b
f
bB
=
σσ (3)
whereεperm: permanent strain [%]a1: model parameter [%]a2, b1, b2: model parameters [-]
The research showed that the rutting behaviour of cbps heavily depends on the mechanicalbehaviour of the materials used in the substructure (i.e. bedding layer, base and sub-base).
Unfortunately, the mechanical behaviour of the materials used in the test sections that formed thebasis of the Dutch design method for cbps (Houben, 1988) was not known. This, combined with thefact that the behaviour of cbps is heavily dependent on mechanical material behaviour, meant that itwas not possible to completely validate the Dutch design method for cbps.
Given the importance of the mechanical behaviour of the unbound materials used in thesubstructure another research project commenced in 1997 and ran until 2002.
The main emphasis of this project was on the mechanical behaviour of sands and base materials.During this investigation the mechanical properties of sands were determined by triaxial testing.The degree of compaction, the grading and the grain shape of sands varied strongly. For basematerials the degree of compaction, the grading and the ratio between crushed concrete and crushedmasonry was varied. Also for base materials the mechanical properties were determined byextensive triaxial testing. The results of this research are extensively discussed in (Niekerk van,2002) and not further discussed here.
In the development of a universal Dutch design method for concrete block pavements the results ofthe three research projects discussed above were combined.
The approach was as follows:! Establish relationships between the mechanical behaviour of unbound materials and simple
properties such as grading and grain shape.! Create a data set of computations using the 1997 FEM model. In this data set the properties of
the cb-layer, the materials in the substructure, the thickness of the various structural layers, thestiffness of the subgrade and the traffic loading should vary.
! Analyse the data set using regression, and so describe cbp behaviour for the purpose of a newdesign tool.
In the sections hereafter the outcome of the above process is briefly discussed for structures with asand sub-base only.
3. MECHANICAL BEHAVIOUR OF SANDS
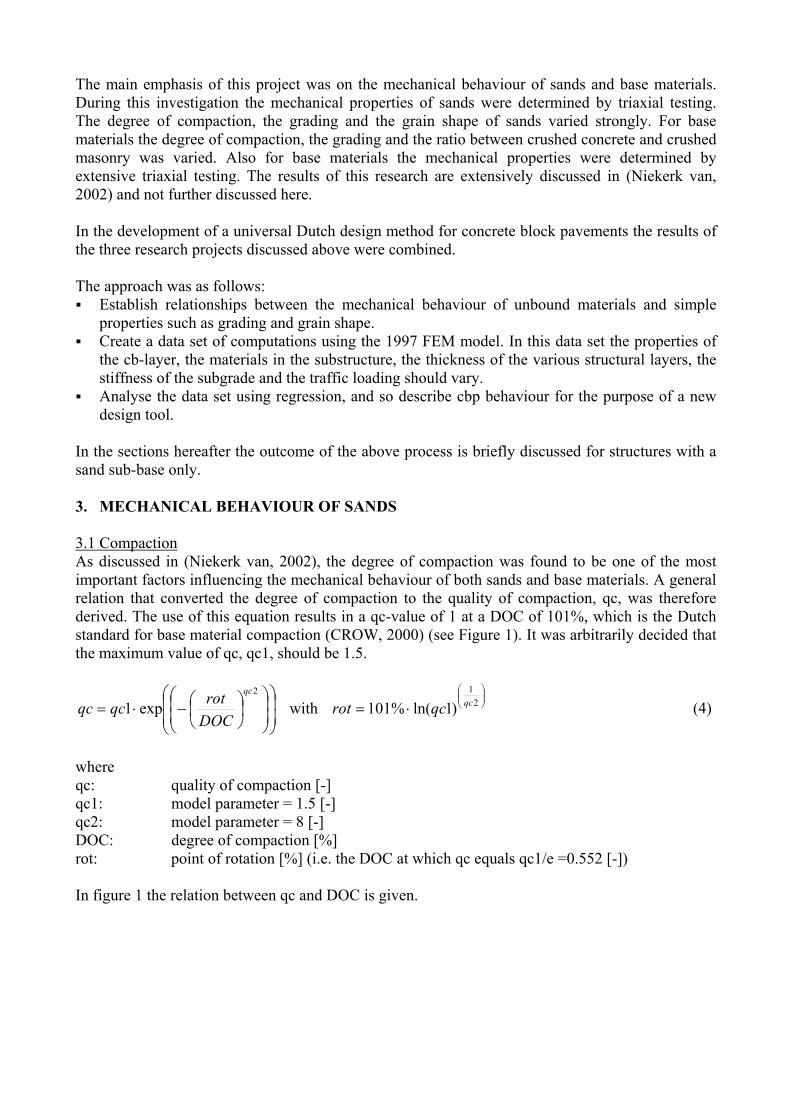
3.1 CompactionAs discussed in (Niekerk van, 2002), the degree of compaction was found to be one of the mostimportant factors influencing the mechanical behaviour of both sands and base materials. A generalrelation that converted the degree of compaction to the quality of compaction, qc, was thereforederived. The use of this equation results in a qc-value of 1 at a DOC of 101%, which is the Dutchstandard for base material compaction (CROW, 2000) (see Figure 1). It was arbitrarily decided thatthe maximum value of qc, qc1, should be 1.5.
−⋅=
2
exp1qc
DOCrotqcqc with
⋅= 21
)1ln(%101 qcqcrot (4)
whereqc: quality of compaction [-]qc1: model parameter = 1.5 [-]qc2: model parameter = 8 [-]DOC: degree of compaction [%]rot: point of rotation [%] (i.e. the DOC at which qc equals qc1/e =0.552 [-])
In figure 1 the relation between qc and DOC is given.
quality of compaction [-]
00.20.40.60.8
11.21.41.6
85 90 95 100 105 110 115DOC [%]
qc [-
]
Figure 1. Quality of compaction as a function of the degree of compaction.
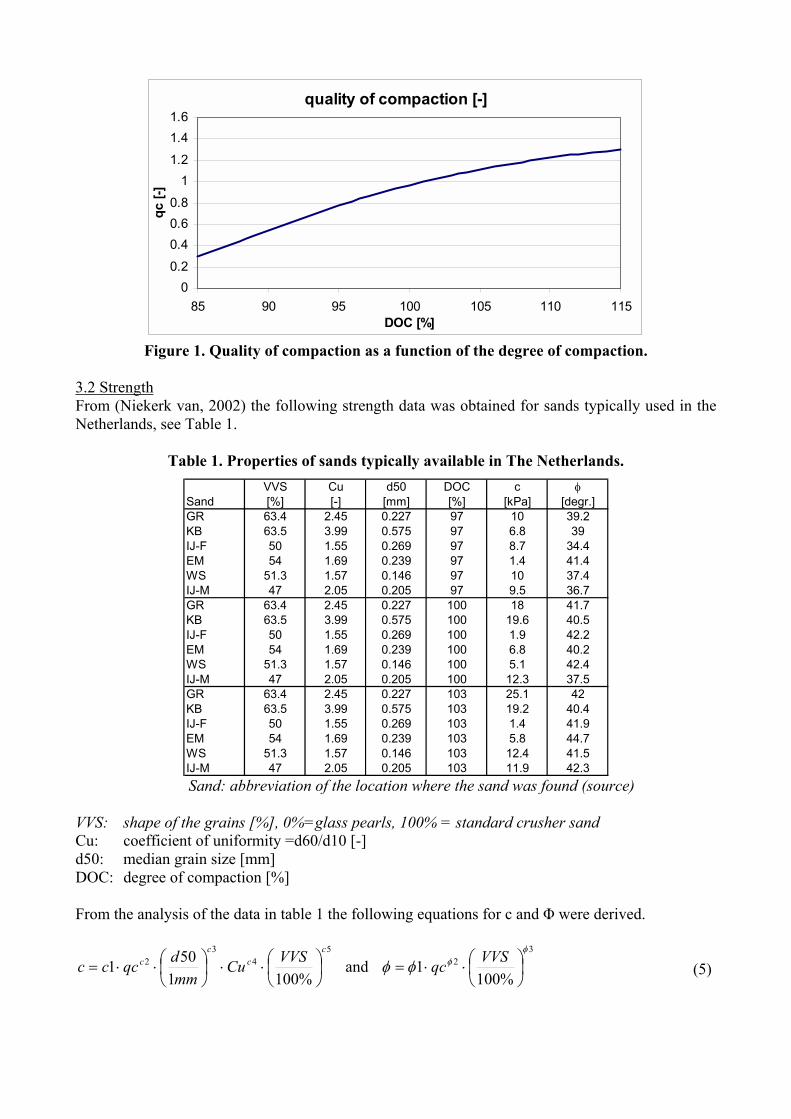
3.2 StrengthFrom (Niekerk van, 2002) the following strength data was obtained for sands typically used in theNetherlands, see Table 1.
Table 1. Properties of sands typically available in The Netherlands.VVS Cu d50 DOC c φ
Sand [%] [-] [mm] [%] [kPa] [degr.]GR 63.4 2.45 0.227 97 10 39.2KB 63.5 3.99 0.575 97 6.8 39IJ-F 50 1.55 0.269 97 8.7 34.4EM 54 1.69 0.239 97 1.4 41.4WS 51.3 1.57 0.146 97 10 37.4IJ-M 47 2.05 0.205 97 9.5 36.7GR 63.4 2.45 0.227 100 18 41.7KB 63.5 3.99 0.575 100 19.6 40.5IJ-F 50 1.55 0.269 100 1.9 42.2EM 54 1.69 0.239 100 6.8 40.2WS 51.3 1.57 0.146 100 5.1 42.4IJ-M 47 2.05 0.205 100 12.3 37.5GR 63.4 2.45 0.227 103 25.1 42KB 63.5 3.99 0.575 103 19.2 40.4IJ-F 50 1.55 0.269 103 1.4 41.9EM 54 1.69 0.239 103 5.8 44.7WS 51.3 1.57 0.146 103 12.4 41.5IJ-M 47 2.05 0.205 103 11.9 42.3Sand: abbreviation of the location where the sand was found (source)
VVS: shape of the grains [%], 0%=glass pearls, 100% = standard crusher sandCu: coefficient of uniformity =d60/d10 [-]d50: median grain size [mm]DOC: degree of compaction [%]
From the analysis of the data in table 1 the following equations for c and Φ were derived.
54
32
%1001501
cc
cc VVSCu
mmdqccc
⋅⋅
⋅⋅= and
32
%1001
φφφφ
⋅⋅=
VVSqc (5)
wherec1: model parameter = 0.1375 [kPa]c2: model parameter = 2.553 [-]c3: model parameter = -1.698 [-]c4: model parameter = 2.959 [-]c5: model parameter = 0.384 [-]Φ1: model parameter = 45.71 [degr]Φ2: model parameter = 0.833 [-]Φ3: model parameter = 0.091 [-]
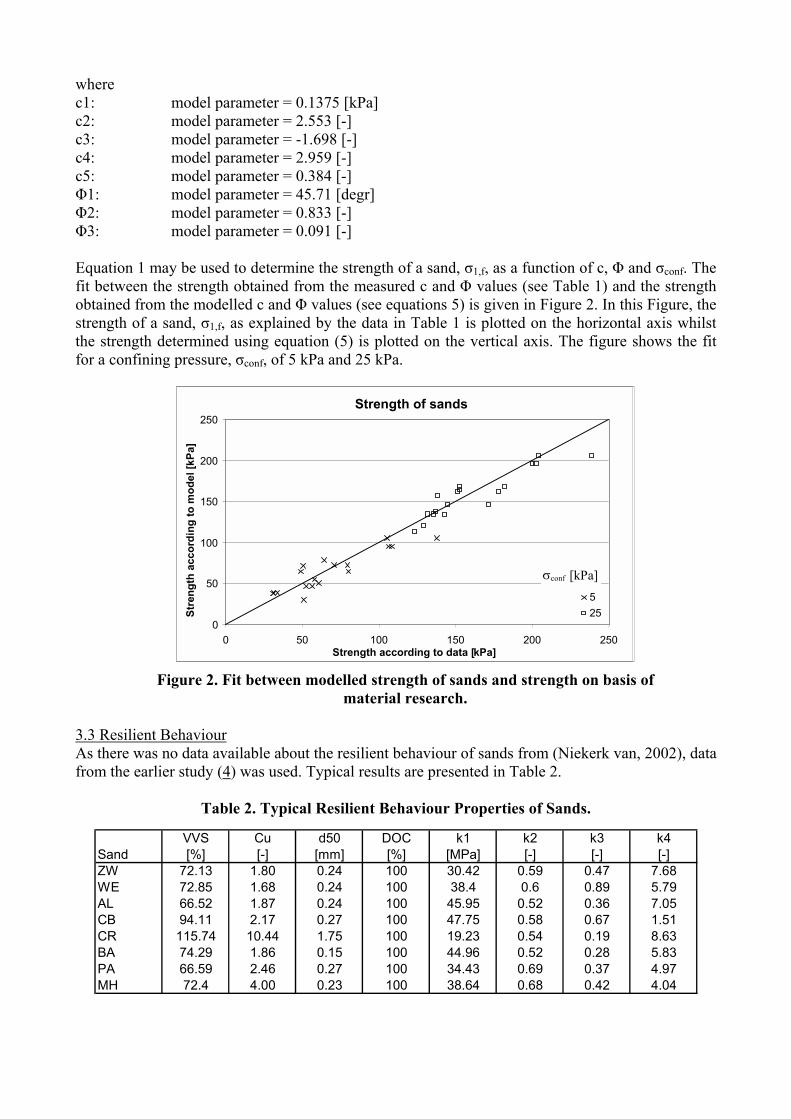
Equation 1 may be used to determine the strength of a sand, σ1,f, as a function of c, Φ and σconf. Thefit between the strength obtained from the measured c and Φ values (see Table 1) and the strengthobtained from the modelled c and Φ values (see equations 5) is given in Figure 2. In this Figure, thestrength of a sand, σ1,f, as explained by the data in Table 1 is plotted on the horizontal axis whilstthe strength determined using equation (5) is plotted on the vertical axis. The figure shows the fitfor a confining pressure, σconf, of 5 kPa and 25 kPa.
Strength of sands
0
50
100
150
200
250
0 50 100 150 200 250Strength according to data [kPa]
Str
engt
h ac
cord
ing
to m
odel
[kPa
]
525
σconf [kPa]
Figure 2. Fit between modelled strength of sands and strength on basis ofmaterial research.
3.3 Resilient BehaviourAs there was no data available about the resilient behaviour of sands from (Niekerk van, 2002), datafrom the earlier study (4) was used. Typical results are presented in Table 2.
Table 2. Typical Resilient Behaviour Properties of Sands.
VVS Cu d50 DOC k1 k2 k3 k4Sand [%] [-] [mm] [%] [MPa] [-] [-] [-]ZW 72.13 1.80 0.24 100 30.42 0.59 0.47 7.68WE 72.85 1.68 0.24 100 38.4 0.6 0.89 5.79AL 66.52 1.87 0.24 100 45.95 0.52 0.36 7.05CB 94.11 2.17 0.27 100 47.75 0.58 0.67 1.51CR 115.74 10.44 1.75 100 19.23 0.54 0.19 8.63BA 74.29 1.86 0.15 100 44.96 0.52 0.28 5.83PA 66.59 2.46 0.27 100 34.43 0.69 0.37 4.97MH 72.4 4.00 0.23 100 38.64 0.68 0.42 4.04
Equations to determine the values of the parameters k1, k2, k3 and k4 were derived and these arepresented in Appendix A.
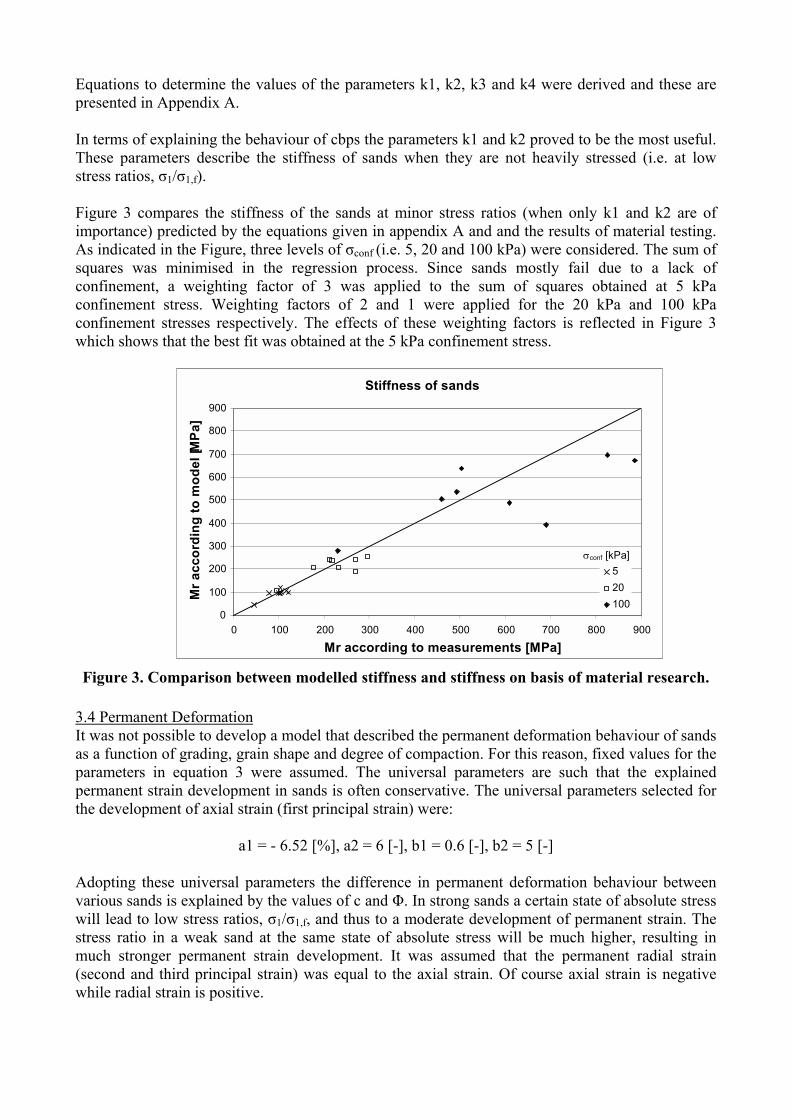
In terms of explaining the behaviour of cbps the parameters k1 and k2 proved to be the most useful.These parameters describe the stiffness of sands when they are not heavily stressed (i.e. at lowstress ratios, σ1/σ1,f).
Figure 3 compares the stiffness of the sands at minor stress ratios (when only k1 and k2 are ofimportance) predicted by the equations given in appendix A and and the results of material testing.As indicated in the Figure, three levels of σconf (i.e. 5, 20 and 100 kPa) were considered. The sum ofsquares was minimised in the regression process. Since sands mostly fail due to a lack ofconfinement, a weighting factor of 3 was applied to the sum of squares obtained at 5 kPaconfinement stress. Weighting factors of 2 and 1 were applied for the 20 kPa and 100 kPaconfinement stresses respectively. The effects of these weighting factors is reflected in Figure 3which shows that the best fit was obtained at the 5 kPa confinement stress.
Stiffness of sands
0
100
200
300
400
500
600
700
800
900
0 100 200 300 400 500 600 700 800 900
Mr according to measurements [MPa]
Mr a
ccor
ding
to m
odel
[MPa
]
σconf [kPa]
20100
5
Figure 3. Comparison between modelled stiffness and stiffness on basis of material research.
3.4 Permanent DeformationIt was not possible to develop a model that described the permanent deformation behaviour of sandsas a function of grading, grain shape and degree of compaction. For this reason, fixed values for theparameters in equation 3 were assumed. The universal parameters are such that the explainedpermanent strain development in sands is often conservative. The universal parameters selected forthe development of axial strain (first principal strain) were:
a1 = - 6.52 [%], a2 = 6 [-], b1 = 0.6 [-], b2 = 5 [-]
Adopting these universal parameters the difference in permanent deformation behaviour betweenvarious sands is explained by the values of c and Φ. In strong sands a certain state of absolute stresswill lead to low stress ratios, σ1/σ1,f, and thus to a moderate development of permanent strain. Thestress ratio in a weak sand at the same state of absolute stress will be much higher, resulting inmuch stronger permanent strain development. It was assumed that the permanent radial strain(second and third principal strain) was equal to the axial strain. Of course axial strain is negativewhile radial strain is positive.
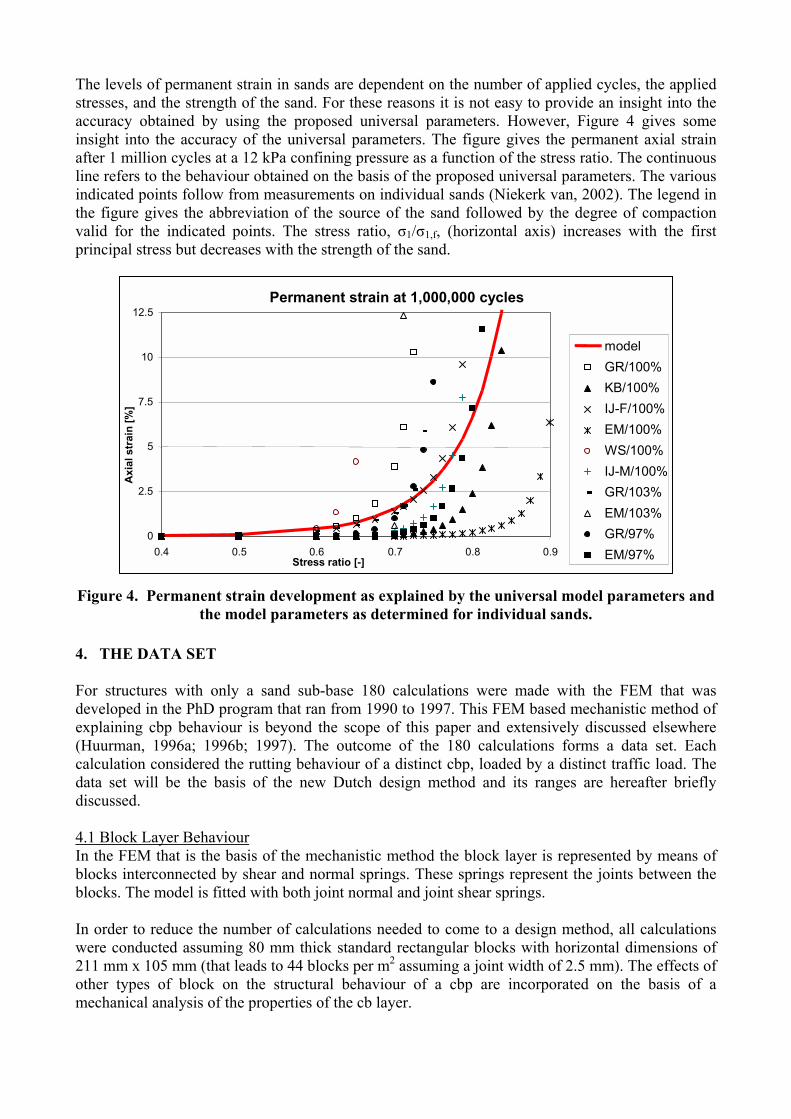
The levels of permanent strain in sands are dependent on the number of applied cycles, the appliedstresses, and the strength of the sand. For these reasons it is not easy to provide an insight into theaccuracy obtained by using the proposed universal parameters. However, Figure 4 gives someinsight into the accuracy of the universal parameters. The figure gives the permanent axial strainafter 1 million cycles at a 12 kPa confining pressure as a function of the stress ratio. The continuousline refers to the behaviour obtained on the basis of the proposed universal parameters. The variousindicated points follow from measurements on individual sands (Niekerk van, 2002). The legend inthe figure gives the abbreviation of the source of the sand followed by the degree of compactionvalid for the indicated points. The stress ratio, σ1/σ1,f, (horizontal axis) increases with the firstprincipal stress but decreases with the strength of the sand.
Permanent strain at 1,000,000 cycles
0
2.5
5
7.5
10
12.5
0.4 0.5 0.6 0.7 0.8 0.9Stress ratio [-]
Axi
al s
trai
n [%
]
modelGR/100%KB/100%IJ-F/100%EM/100%WS/100%IJ-M/100%GR/103%EM/103%GR/97%EM/97%
Figure 4. Permanent strain development as explained by the universal model parameters andthe model parameters as determined for individual sands.
4. THE DATA SET
For structures with only a sand sub-base 180 calculations were made with the FEM that wasdeveloped in the PhD program that ran from 1990 to 1997. This FEM based mechanistic method ofexplaining cbp behaviour is beyond the scope of this paper and extensively discussed elsewhere(Huurman, 1996a; 1996b; 1997). The outcome of the 180 calculations forms a data set. Eachcalculation considered the rutting behaviour of a distinct cbp, loaded by a distinct traffic load. Thedata set will be the basis of the new Dutch design method and its ranges are hereafter brieflydiscussed.
4.1 Block Layer BehaviourIn the FEM that is the basis of the mechanistic method the block layer is represented by means ofblocks interconnected by shear and normal springs. These springs represent the joints between theblocks. The model is fitted with both joint normal and joint shear springs.
In order to reduce the number of calculations needed to come to a design method, all calculationswere conducted assuming 80 mm thick standard rectangular blocks with horizontal dimensions of211 mm x 105 mm (that leads to 44 blocks per m2 assuming a joint width of 2.5 mm). The effects ofother types of block on the structural behaviour of a cbp are incorporated on the basis of amechanical analysis of the properties of the cb layer.
On the basis of this analysis the mechanical properties of any cb layer of rectangular blocks can betransformed into equivalent joint properties for a cb layer with 80 mm standard blocks. Thisanalysis resulted in the following equation for equivalent joint normal stiffness (a similar equationis derived for the equivalent joint shear stiffness).
2
, 802)21)(1()1(44
−+−
=h
whE
nk eqn υυ
υ(6)
wherekn,eq: equivalent joint normal spring stiffness for the structural model per mm modelled
joint length [N/mm2]n: number of blocks per square meter [-]ν: Poisson's ratio of joint material [-]E: Young's modulus of joint material [MPa]h: thickness of the block [mm]w: joint width [mm]
The value of kn,eq varied from 400 to 40,500 N/mm2. Low values are a result of a large joint width, asmall size block, thin blocks, poor joint material or combinations thereof.
4.2 Strength of SandIn the calculations the value of c varied from 0.52 to 45.5 kPa, and the value of Φ varied from 38.1to 46.4 degrees.
4.3 Stiffness of SandThe value of k1 varied from 3.4 to 127.9 MPa, while the value of k2 varied from 0.53 to 1.33 [-].The value of k2 may increase to more than 1 in those cases when the sand is poorly compacted (seeAppendix A).
4.4 Thickness of Sand Sub-BaseThe thickness of the sand sub-base varied from 500 to 1500 mm.
4.5 Stiffness of SubgradeThe stiffness of the subgrade varied from 30 MPa (peat) to 120 MPa (sand).
4.6 Axle LoadThe axle loads varied from 60 to 140 kN.
4.7 Traffic WanderLateral traffic wander was taken into account by assuming a standard distribution of the loadposition. The standard deviation of this distribution varied from 100 to 300 mm.
5. REGRESSION OF DATA SET
The data set briefly discussed in section 4 contains the outcome of the 180 FEM based mechanisticrutting calculations. The output of each individual calculation gives the transversal rut profile as afunction of the number of load repetitions. Each calculation gives the transversal rut profile for N =100, 250, 400, 550, 700, 850, 1000, 2500 � 4000000. From this output the rut depth in the middleof the wheel path is described by means of equation 7. This equation fits almost perfect through thecomputational data and thus only acts as an accurate data reducer.
cb
cNaRD
⋅=1000 (7)
whereac: rut depth after 1000 axle load repetitions [mm]bc: rate of increase of rut depth on a log-log scale [-]
In order to come to a design method that incorporates a flexible rut depth standard both the valuesof ac and bc should be explained. For this reason equations are developed and presented inAppendix B.
The equations describe the value of ac and bc as a function of:! block layer properties, i.e. the joint normal stiffness kn,eq! sub-base thickness! strength of the sub-base sand, i.e. c and Φ! stiffness of the sub-base sand, i.e. k1 and k2! stiffness of the subgrade! pavement loading, i.e. axle load and traffic wander
As discussed in section 3, equations giving c and Φ and also k1 and k2 for sands as a function ofgrain shape (VVS), grading (Cu and d50) and degree of compaction (qc) have been developed. Thisimplies that all information required for the development of a universal design method for blockpavements with a sand sub-base only is available.
A computer program for easy design is under development. The code, as it exists now, is based onthe above and briefly discussed hereafter.
6. THE DESIGN METHOD
The design method for Dutch ELement PAVEments, DELPAVE, is hereafter discussed on the basisof an example.
DELPAVE consists of three main parts, i.e. access to the road building materials libraries, access tothe traffic related libraries and the design procedure itself. The library structure enables an easy touse design procedure based on selecting items from the various libraries as will be explainedherafter.
6.1 MaterialsThere are four road building materials libraries; the small elements libraries, the base materialslibrary (not discussed here), the sands library and the subgrades library.
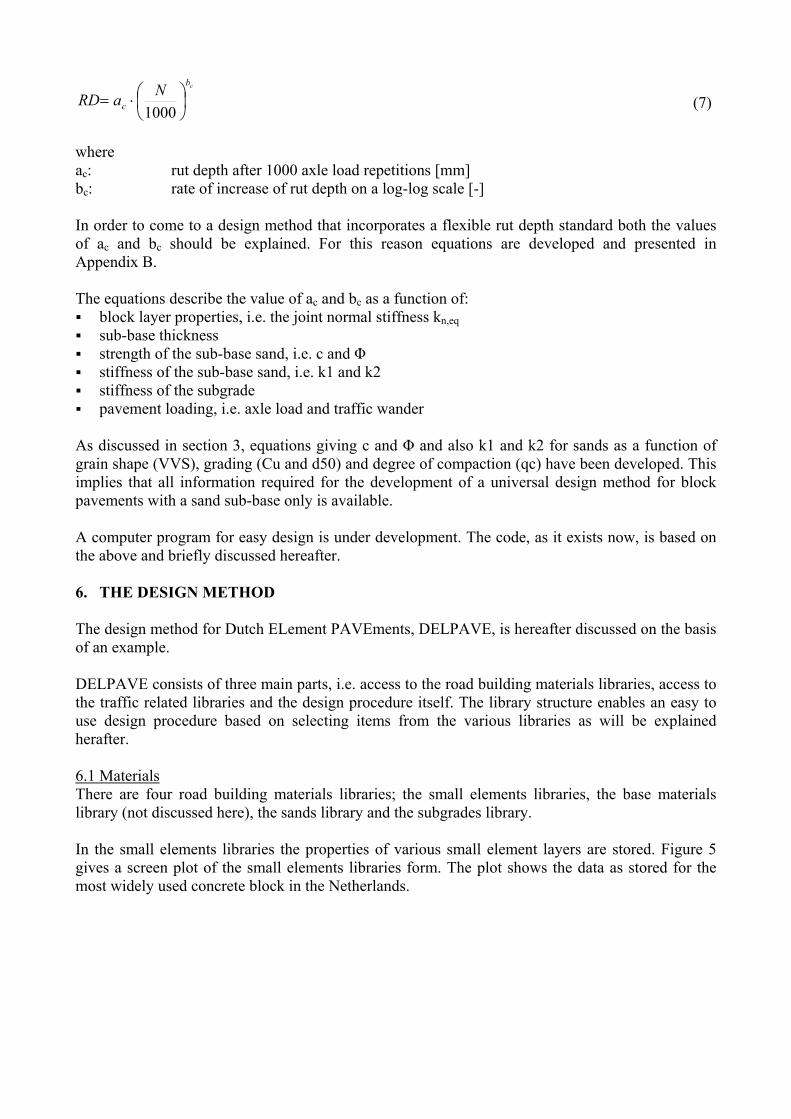
In the small elements libraries the properties of various small element layers are stored. Figure 5gives a screen plot of the small elements libraries form. The plot shows the data as stored for themost widely used concrete block in the Netherlands.
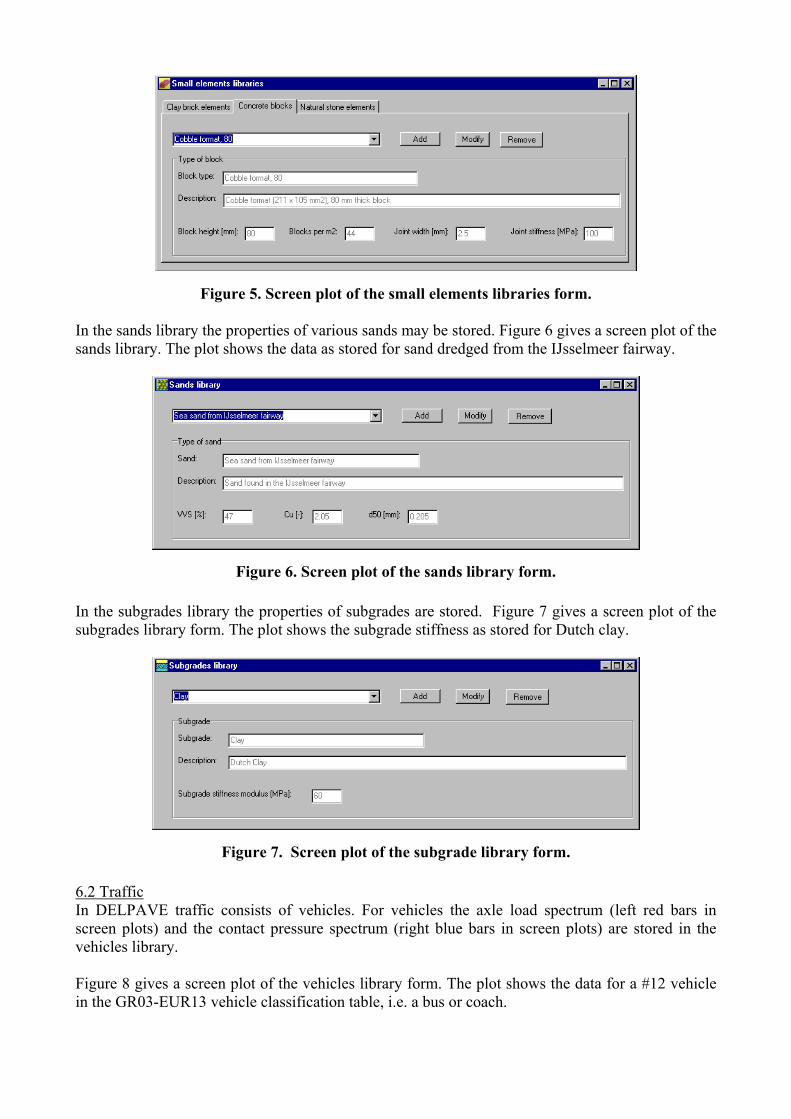
Figure 5. Screen plot of the small elements libraries form.
In the sands library the properties of various sands may be stored. Figure 6 gives a screen plot of thesands library. The plot shows the data as stored for sand dredged from the IJsselmeer fairway.
Figure 6. Screen plot of the sands library form.
In the subgrades library the properties of subgrades are stored. Figure 7 gives a screen plot of thesubgrades library form. The plot shows the subgrade stiffness as stored for Dutch clay.
Figure 7. Screen plot of the subgrade library form.
6.2 TrafficIn DELPAVE traffic consists of vehicles. For vehicles the axle load spectrum (left red bars inscreen plots) and the contact pressure spectrum (right blue bars in screen plots) are stored in thevehicles library.
Figure 8 gives a screen plot of the vehicles library form. The plot shows the data for a #12 vehiclein the GR03-EUR13 vehicle classification table, i.e. a bus or coach.
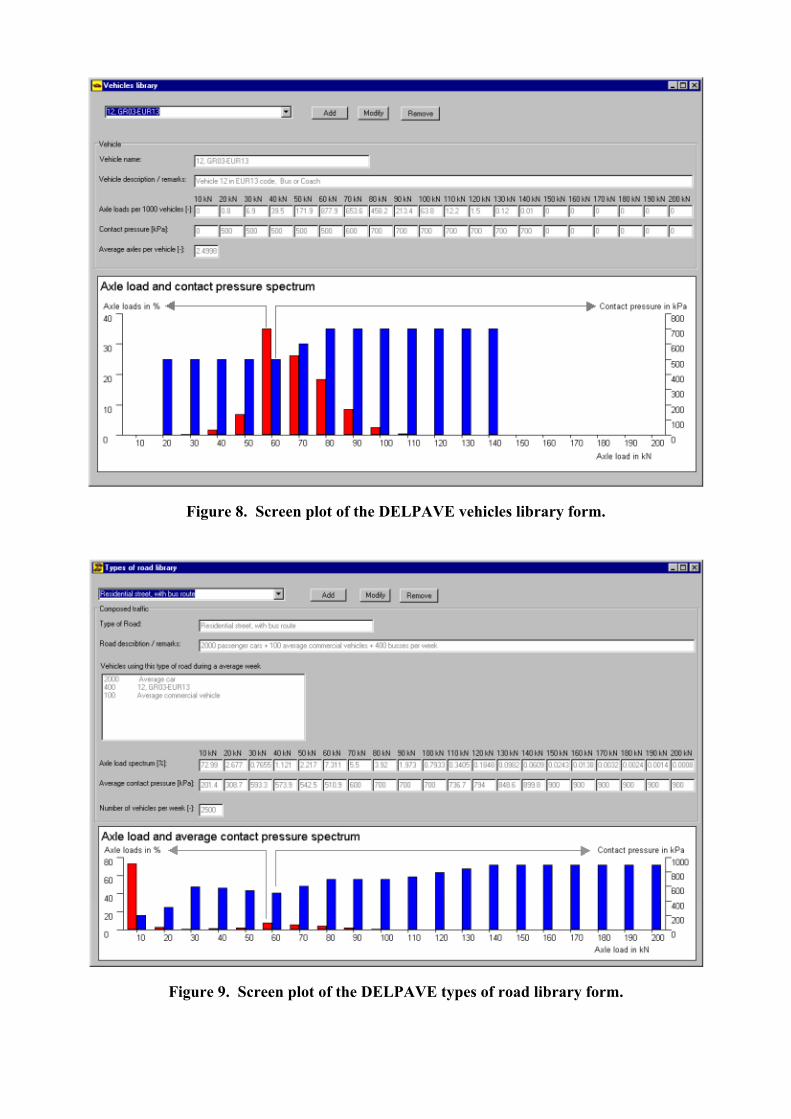
Figure 8. Screen plot of the DELPAVE vehicles library form.
Figure 9. Screen plot of the DELPAVE types of road library form.
6.3 DesignDesigning a concrete block pavement with DELPAVE for a large part comes down to selectingitems from the various libraries with respect to the type of road, the small element layer, the baselayer, the sub-base layer and the subgrade. In some cases additional, design specific, information isrequired.
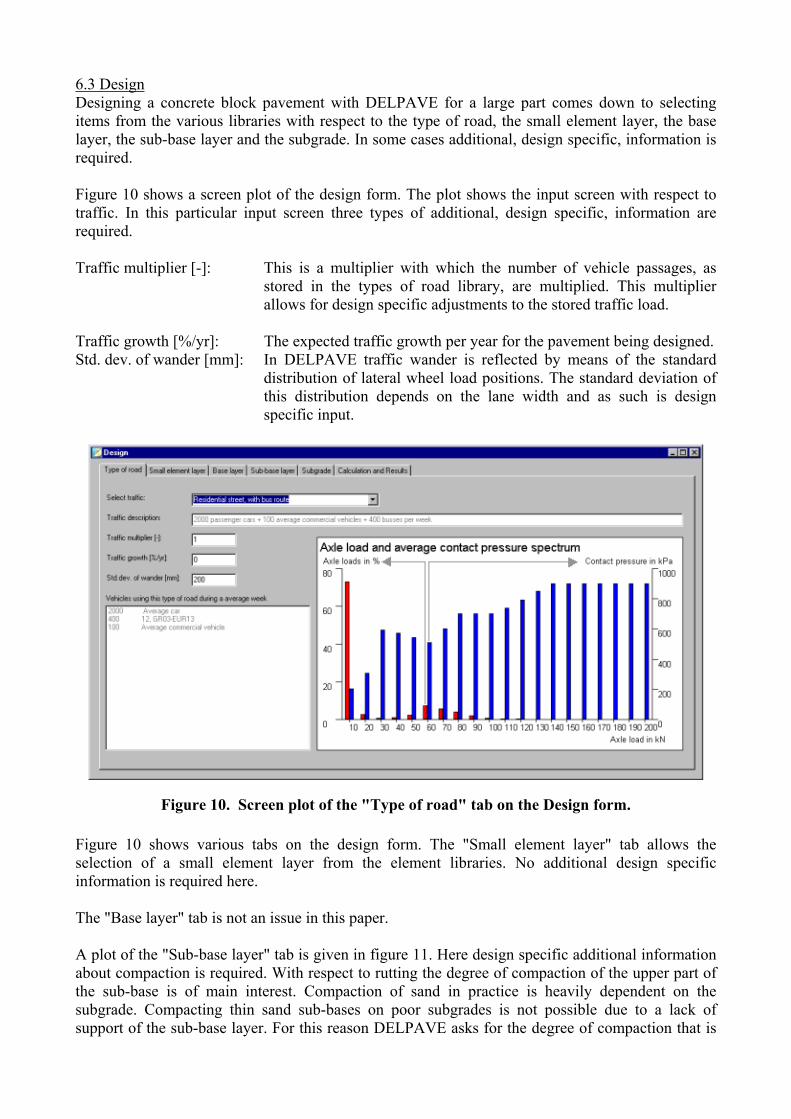
Figure 10 shows a screen plot of the design form. The plot shows the input screen with respect totraffic. In this particular input screen three types of additional, design specific, information arerequired.
Traffic multiplier [-]: This is a multiplier with which the number of vehicle passages, asstored in the types of road library, are multiplied. This multiplierallows for design specific adjustments to the stored traffic load.
Traffic growth [%/yr]: The expected traffic growth per year for the pavement being designed.Std. dev. of wander [mm]: In DELPAVE traffic wander is reflected by means of the standard
distribution of lateral wheel load positions. The standard deviation ofthis distribution depends on the lane width and as such is designspecific input.
Figure 10. Screen plot of the "Type of road" tab on the Design form.
Figure 10 shows various tabs on the design form. The "Small element layer" tab allows theselection of a small element layer from the element libraries. No additional design specificinformation is required here.
The "Base layer" tab is not an issue in this paper.
A plot of the "Sub-base layer" tab is given in figure 11. Here design specific additional informationabout compaction is required. With respect to rutting the degree of compaction of the upper part ofthe sub-base is of main interest. Compaction of sand in practice is heavily dependent on thesubgrade. Compacting thin sand sub-bases on poor subgrades is not possible due to a lack ofsupport of the sub-base layer. For this reason DELPAVE asks for the degree of compaction that is
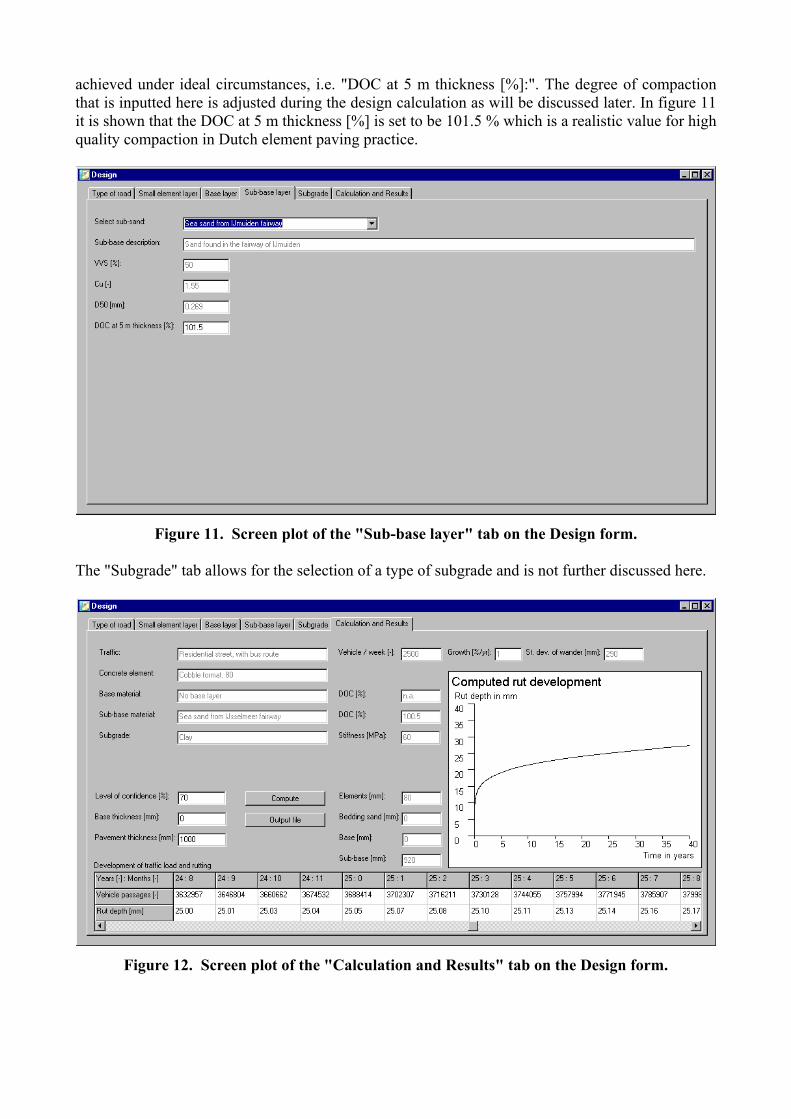
achieved under ideal circumstances, i.e. "DOC at 5 m thickness [%]:". The degree of compactionthat is inputted here is adjusted during the design calculation as will be discussed later. In figure 11it is shown that the DOC at 5 m thickness [%] is set to be 101.5 % which is a realistic value for highquality compaction in Dutch element paving practice.
Figure 11. Screen plot of the "Sub-base layer" tab on the Design form.
The "Subgrade" tab allows for the selection of a type of subgrade and is not further discussed here.
Figure 12. Screen plot of the "Calculation and Results" tab on the Design form.
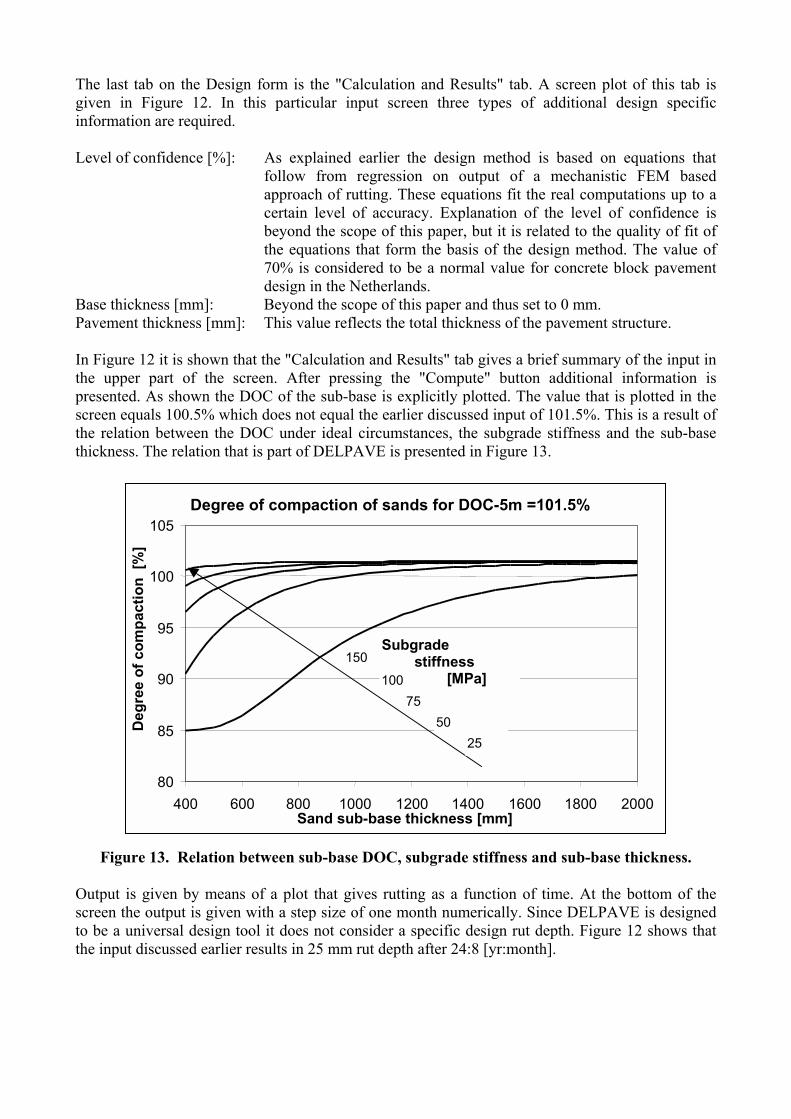
The last tab on the Design form is the "Calculation and Results" tab. A screen plot of this tab isgiven in Figure 12. In this particular input screen three types of additional design specificinformation are required.
Level of confidence [%]: As explained earlier the design method is based on equations thatfollow from regression on output of a mechanistic FEM basedapproach of rutting. These equations fit the real computations up to acertain level of accuracy. Explanation of the level of confidence isbeyond the scope of this paper, but it is related to the quality of fit ofthe equations that form the basis of the design method. The value of70% is considered to be a normal value for concrete block pavementdesign in the Netherlands.
Base thickness [mm]: Beyond the scope of this paper and thus set to 0 mm.Pavement thickness [mm]: This value reflects the total thickness of the pavement structure.
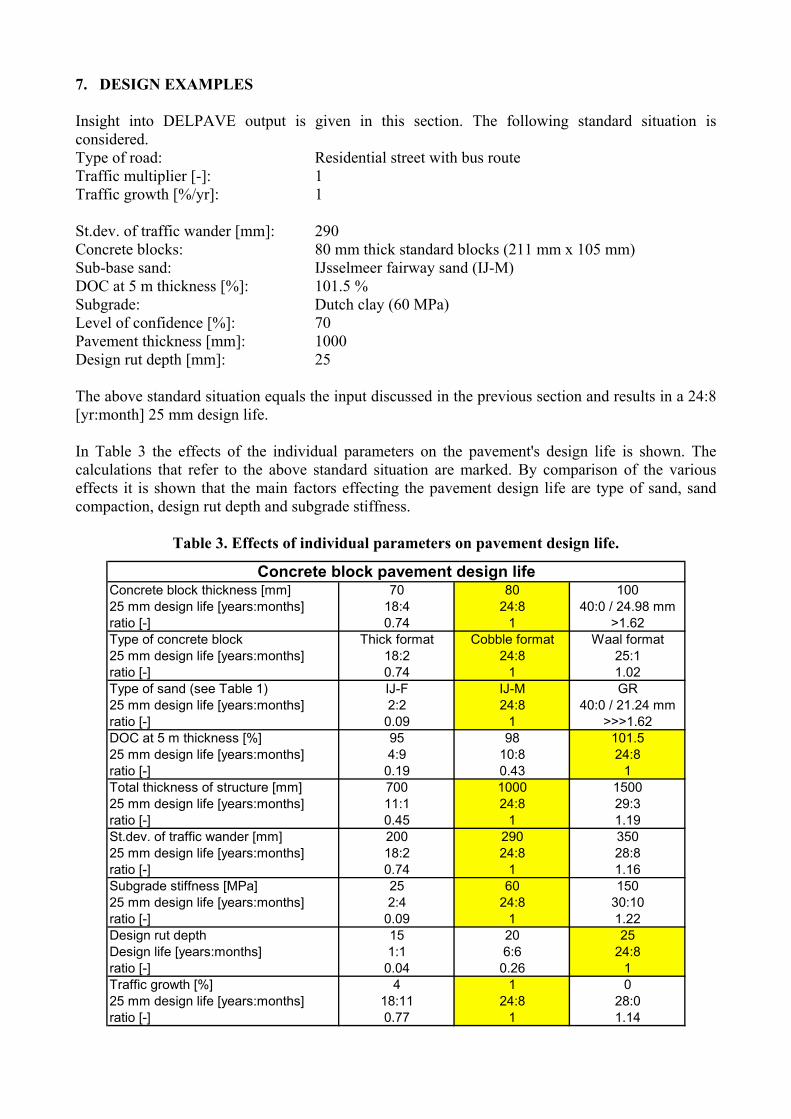
In Figure 12 it is shown that the "Calculation and Results" tab gives a brief summary of the input inthe upper part of the screen. After pressing the "Compute" button additional information ispresented. As shown the DOC of the sub-base is explicitly plotted. The value that is plotted in thescreen equals 100.5% which does not equal the earlier discussed input of 101.5%. This is a result ofthe relation between the DOC under ideal circumstances, the subgrade stiffness and the sub-basethickness. The relation that is part of DELPAVE is presented in Figure 13.
Degree of compaction of sands for DOC-5m =101.5%
80
85
90
95
100
105
400 600 800 1000 1200 1400 1600 1800 2000Sand sub-base thickness [mm]
Deg
ree
of c
ompa
ctio
n [%
]
5075
150
100
25
Subgrade stiffness [MPa]
Figure 13. Relation between sub-base DOC, subgrade stiffness and sub-base thickness.
Output is given by means of a plot that gives rutting as a function of time. At the bottom of thescreen the output is given with a step size of one month numerically. Since DELPAVE is designedto be a universal design tool it does not consider a specific design rut depth. Figure 12 shows thatthe input discussed earlier results in 25 mm rut depth after 24:8 [yr:month].
7. DESIGN EXAMPLES
Insight into DELPAVE output is given in this section. The following standard situation isconsidered.Type of road: Residential street with bus routeTraffic multiplier [-]: 1Traffic growth [%/yr]: 1
St.dev. of traffic wander [mm]: 290Concrete blocks: 80 mm thick standard blocks (211 mm x 105 mm)Sub-base sand: IJsselmeer fairway sand (IJ-M)DOC at 5 m thickness [%]: 101.5 %Subgrade: Dutch clay (60 MPa)Level of confidence [%]: 70Pavement thickness [mm]: 1000Design rut depth [mm]: 25
The above standard situation equals the input discussed in the previous section and results in a 24:8[yr:month] 25 mm design life.
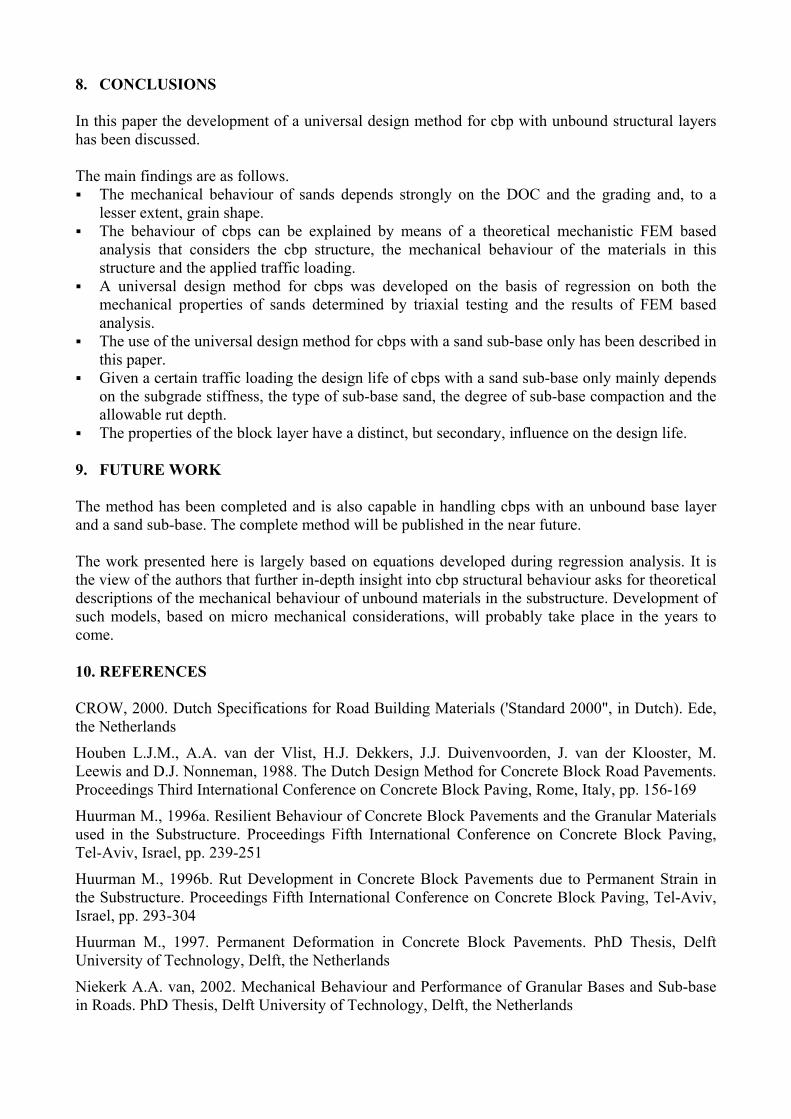
In Table 3 the effects of the individual parameters on the pavement's design life is shown. Thecalculations that refer to the above standard situation are marked. By comparison of the variouseffects it is shown that the main factors effecting the pavement design life are type of sand, sandcompaction, design rut depth and subgrade stiffness.
Table 3. Effects of individual parameters on pavement design life.
Concrete block pavement design lifeConcrete block thickness [mm] 70 80 10025 mm design life [years:months] 18:4 24:8 40:0 / 24.98 mmratio [-] 0.74 1 >1.62Type of concrete block Thick format Cobble format Waal format25 mm design life [years:months] 18:2 24:8 25:1ratio [-] 0.74 1 1.02Type of sand (see Table 1) IJ-F IJ-M GR25 mm design life [years:months] 2:2 24:8 40:0 / 21.24 mmratio [-] 0.09 1 >>>1.62DOC at 5 m thickness [%] 95 98 101.525 mm design life [years:months] 4:9 10:8 24:8ratio [-] 0.19 0.43 1Total thickness of structure [mm] 700 1000 150025 mm design life [years:months] 11:1 24:8 29:3ratio [-] 0.45 1 1.19St.dev. of traffic wander [mm] 200 290 35025 mm design life [years:months] 18:2 24:8 28:8ratio [-] 0.74 1 1.16Subgrade stiffness [MPa] 25 60 15025 mm design life [years:months] 2:4 24:8 30:10ratio [-] 0.09 1 1.22Design rut depth 15 20 25Design life [years:months] 1:1 6:6 24:8ratio [-] 0.04 0.26 1Traffic growth [%] 4 1 025 mm design life [years:months] 18:11 24:8 28:0ratio [-] 0.77 1 1.14
8. CONCLUSIONS
In this paper the development of a universal design method for cbp with unbound structural layershas been discussed.
The main findings are as follows.! The mechanical behaviour of sands depends strongly on the DOC and the grading and, to a
lesser extent, grain shape.! The behaviour of cbps can be explained by means of a theoretical mechanistic FEM based
analysis that considers the cbp structure, the mechanical behaviour of the materials in thisstructure and the applied traffic loading.
! A universal design method for cbps was developed on the basis of regression on both themechanical properties of sands determined by triaxial testing and the results of FEM basedanalysis.
! The use of the universal design method for cbps with a sand sub-base only has been described inthis paper.
! Given a certain traffic loading the design life of cbps with a sand sub-base only mainly dependson the subgrade stiffness, the type of sub-base sand, the degree of sub-base compaction and theallowable rut depth.
! The properties of the block layer have a distinct, but secondary, influence on the design life.
9. FUTURE WORK
The method has been completed and is also capable in handling cbps with an unbound base layerand a sand sub-base. The complete method will be published in the near future.
The work presented here is largely based on equations developed during regression analysis. It isthe view of the authors that further in-depth insight into cbp structural behaviour asks for theoreticaldescriptions of the mechanical behaviour of unbound materials in the substructure. Development ofsuch models, based on micro mechanical considerations, will probably take place in the years tocome.
10. REFERENCES
CROW, 2000. Dutch Specifications for Road Building Materials ('Standard 2000", in Dutch). Ede,the Netherlands
Houben L.J.M., A.A. van der Vlist, H.J. Dekkers, J.J. Duivenvoorden, J. van der Klooster, M.Leewis and D.J. Nonneman, 1988. The Dutch Design Method for Concrete Block Road Pavements.Proceedings Third International Conference on Concrete Block Paving, Rome, Italy, pp. 156-169
Huurman M., 1996a. Resilient Behaviour of Concrete Block Pavements and the Granular Materialsused in the Substructure. Proceedings Fifth International Conference on Concrete Block Paving,Tel-Aviv, Israel, pp. 239-251
Huurman M., 1996b. Rut Development in Concrete Block Pavements due to Permanent Strain inthe Substructure. Proceedings Fifth International Conference on Concrete Block Paving, Tel-Aviv,Israel, pp. 293-304
Huurman M., 1997. Permanent Deformation in Concrete Block Pavements. PhD Thesis, DelftUniversity of Technology, Delft, the Netherlands
Niekerk A.A. van, 2002. Mechanical Behaviour and Performance of Granular Bases and Sub-basein Roads. PhD Thesis, Delft University of Technology, Delft, the Netherlands
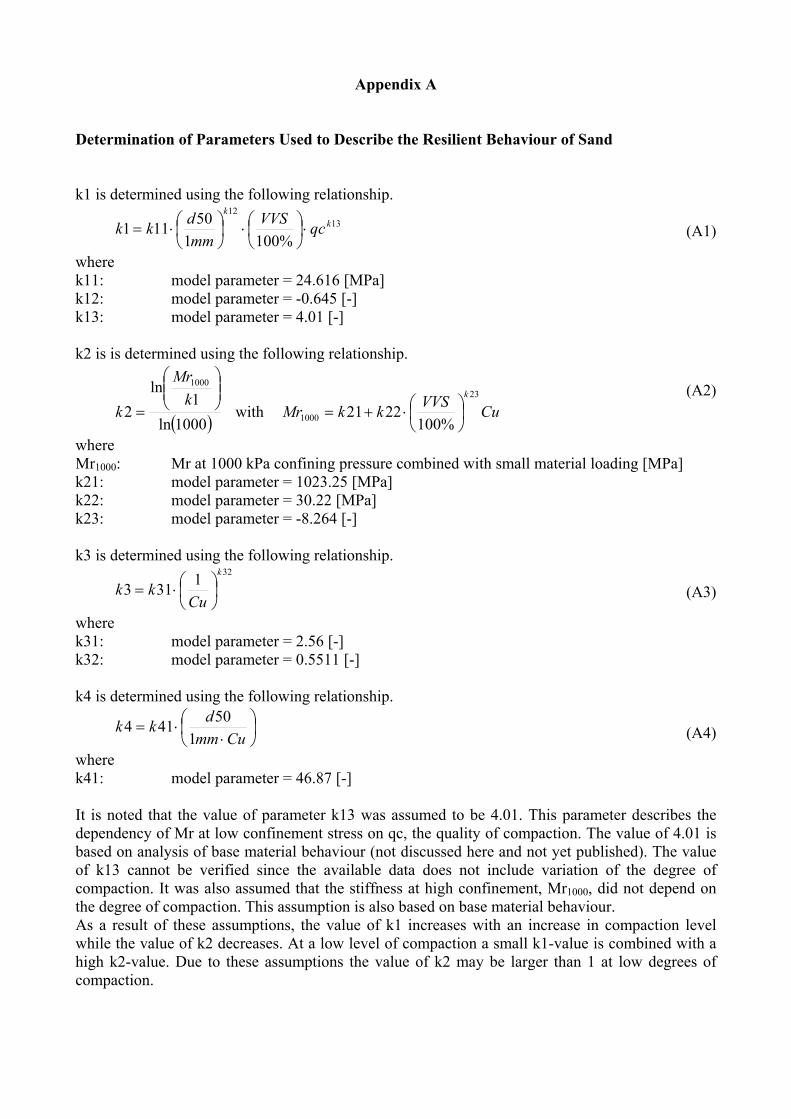
Appendix A
Determination of Parameters Used to Describe the Resilient Behaviour of Sand
k1 is determined using the following relationship.
1312
%100150111 k
k
qcVVSmmdkk ⋅
⋅
⋅= (A1)
wherek11: model parameter = 24.616 [MPa]k12: model parameter = -0.645 [-]k13: model parameter = 4.01 [-]
k2 is is determined using the following relationship.
( )1000ln1
ln2
1000
=k
Mr
k with CuVVSkkMrk 23
1000 %1002221
⋅+=
(A2)
whereMr1000: Mr at 1000 kPa confining pressure combined with small material loading [MPa]k21: model parameter = 1023.25 [MPa]k22: model parameter = 30.22 [MPa]k23: model parameter = -8.264 [-]
k3 is determined using the following relationship.321313
k
Cukk
⋅= (A3)
wherek31: model parameter = 2.56 [-]k32: model parameter = 0.5511 [-]
k4 is determined using the following relationship.
⋅⋅=
Cummdkk
150414 (A4)
wherek41: model parameter = 46.87 [-]
It is noted that the value of parameter k13 was assumed to be 4.01. This parameter describes thedependency of Mr at low confinement stress on qc, the quality of compaction. The value of 4.01 isbased on analysis of base material behaviour (not discussed here and not yet published). The valueof k13 cannot be verified since the available data does not include variation of the degree ofcompaction. It was also assumed that the stiffness at high confinement, Mr1000, did not depend onthe degree of compaction. This assumption is also based on base material behaviour.As a result of these assumptions, the value of k1 increases with an increase in compaction levelwhile the value of k2 decreases. At a low level of compaction a small k1-value is combined with ahigh k2-value. Due to these assumptions the value of k2 may be larger than 1 at low degrees ofcompaction.
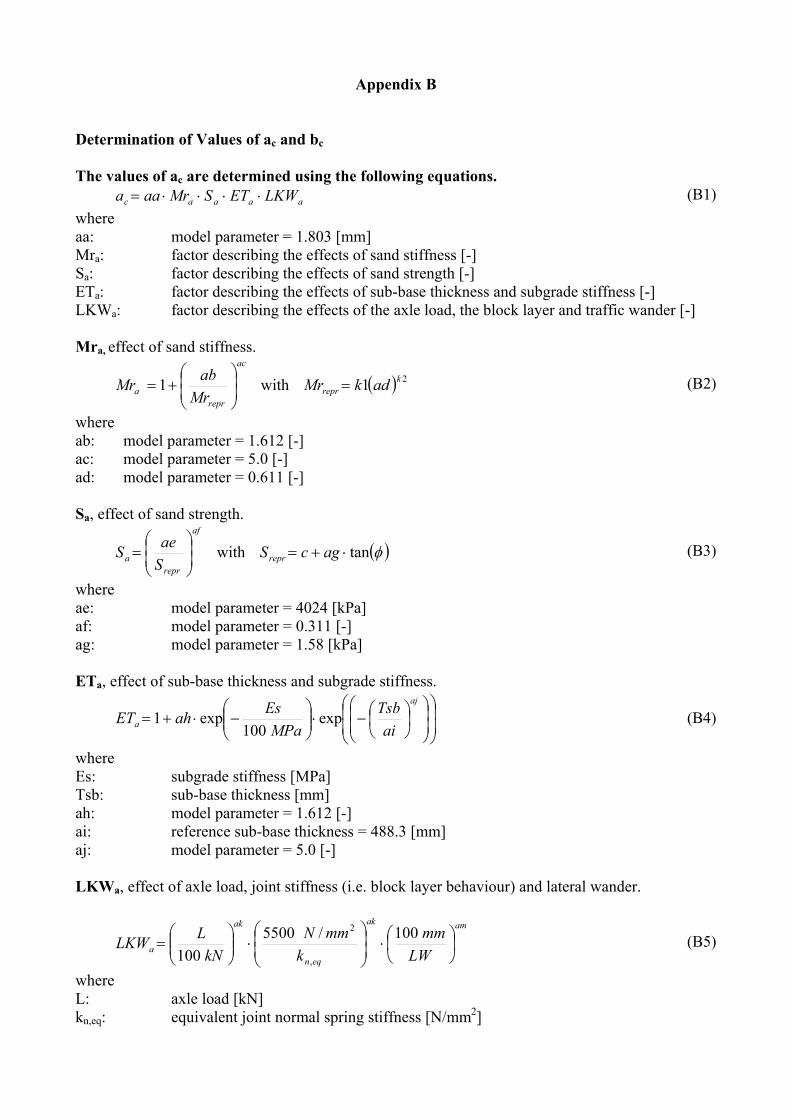
Appendix B
Determination of Values of ac and bc
The values of ac are determined using the following equations.aaaac LKWETSMraaa ⋅⋅⋅⋅= (B1)
whereaa: model parameter = 1.803 [mm]Mra: factor describing the effects of sand stiffness [-]Sa: factor describing the effects of sand strength [-]ETa: factor describing the effects of sub-base thickness and subgrade stiffness [-]LKWa: factor describing the effects of the axle load, the block layer and traffic wander [-]
Mra, effect of sand stiffness.ac
repra Mr
abMr
+= 1 with ( ) 21 k
repr adkMr = (B2)
whereab: model parameter = 1.612 [-]ac: model parameter = 5.0 [-]ad: model parameter = 0.611 [-]
Sa, effect of sand strength.af
repra S
aeS
= with ( )φtan⋅+= agcSrepr (B3)
whereae: model parameter = 4024 [kPa]af: model parameter = 0.311 [-]ag: model parameter = 1.58 [kPa]
ETa, effect of sub-base thickness and subgrade stiffness.
−⋅
−⋅+=
aj
a aiTsb
MPaEsahET exp
100exp1 (B4)
whereEs: subgrade stiffness [MPa]Tsb: sub-base thickness [mm]ah: model parameter = 1.612 [-]ai: reference sub-base thickness = 488.3 [mm]aj: model parameter = 5.0 [-]
LKWa, effect of axle load, joint stiffness (i.e. block layer behaviour) and lateral wander.
amak
eqn
ak
a LWmm
kmmN
kNLLKW
⋅
⋅
=
100/5500100 ,
2
(B5)
whereL: axle load [kN]kn,eq: equivalent joint normal spring stiffness [N/mm2]
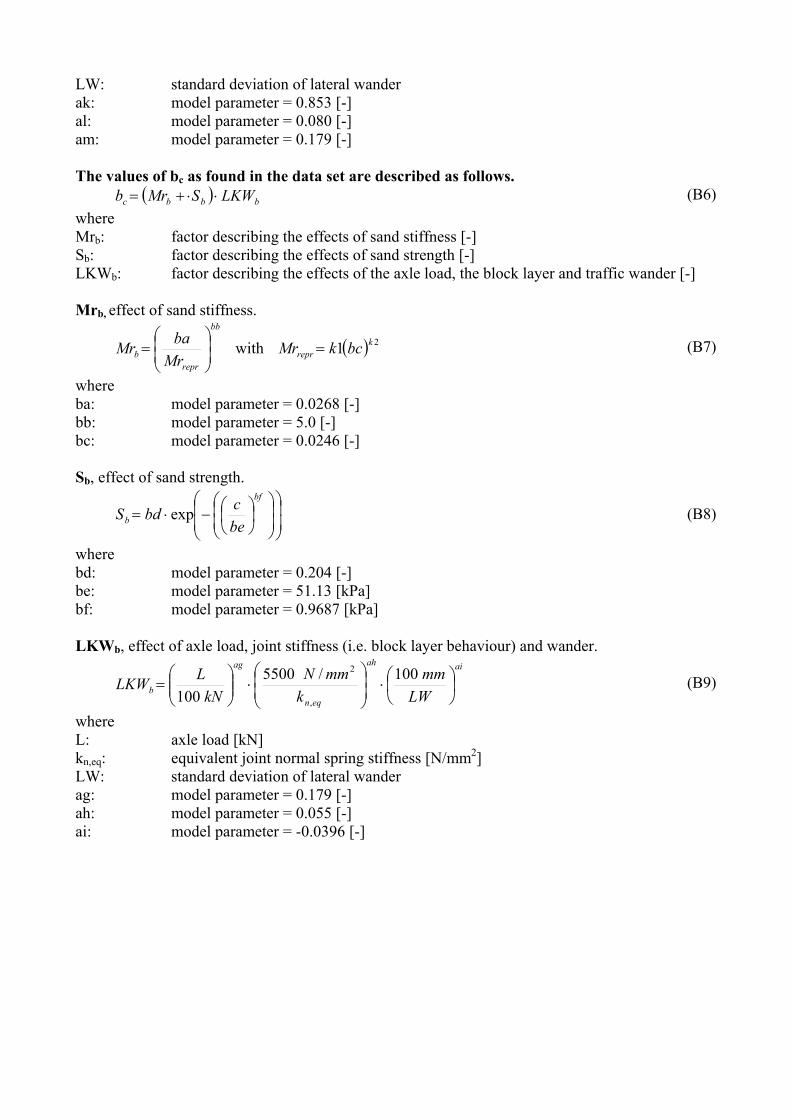
LW: standard deviation of lateral wanderak: model parameter = 0.853 [-]al: model parameter = 0.080 [-]am: model parameter = 0.179 [-]
The values of bc as found in the data set are described as follows.( ) bbbc LKWSMrb ⋅⋅+= (B6)
whereMrb: factor describing the effects of sand stiffness [-]Sb: factor describing the effects of sand strength [-]LKWb: factor describing the effects of the axle load, the block layer and traffic wander [-]
Mrb, effect of sand stiffness.bb
reprb Mr
baMr
= with ( ) 21 k
repr bckMr = (B7)
whereba: model parameter = 0.0268 [-]bb: model parameter = 5.0 [-]bc: model parameter = 0.0246 [-]
Sb, effect of sand strength.
−⋅=
bf
b becbdS exp (B8)
wherebd: model parameter = 0.204 [-]be: model parameter = 51.13 [kPa]bf: model parameter = 0.9687 [kPa]
LKWb, effect of axle load, joint stiffness (i.e. block layer behaviour) and wander.aiah
eqn
ag
b LWmm
kmmN
kNLLKW
⋅
⋅
=
100/5500100 ,
2
(B9)
whereL: axle load [kN]kn,eq: equivalent joint normal spring stiffness [N/mm2]LW: standard deviation of lateral wanderag: model parameter = 0.179 [-]ah: model parameter = 0.055 [-]ai: model parameter = -0.0396 [-]
THE UPGRADED DUTCH DESIGN METHOD FOR CONCRETE BLOCK ROAD PAVEMENTS
Huurman, M.1, Houben, L.J.M., Geense, C.W.A2. and van der Vring, J.J.M.3
1Delft University of Technology, Faculty of Civil Engineering and Geosciences, PO Box 5048, 2600 GA Delft, The Netherlands.
Tel: (31) 15 27 81525. Fax: (31) 15 27 83443. E-mail: [email protected] 2Municipality of Rotterdam, Rotterdam, The Netherlands.
CURRICULLUM VIIAE
dr.ir. M. Huurman Family name: Huurman First name: Marinus (Rien) Date of birth: October 15, 1963 Place of birth: Rotterdam, the Netherlands
Rien has a 15-year history in developing mechanistic models and tools for CBP design purposes. In 1989 he graduated as an engineer at the Delft University of Technology on the development of a full 3D-FEM for CBPs. After completion of military cervices he returned to Delft to further work on modelling CBP behaviour as a PhD candidate. He developed a FEM-code that allowed the calculation of rutting -in CBPs with unbound materials only- as a function of CBP structural design, traffic loading and material properties obtained from triaxial testing. Material stiffness, strength and permanent deformation behaviour proved to be important and all showed stress dependency. By means of repeated vehicle simulation he also investigated the development of longitudinal unevenness due to traffic-CBP interaction. In 1997 he completed this work. Hereafter he left Delft for a 5-year period. He returned to the university in 2001 as an assistant Professor. It was soon hereafter that he started his work on the development of a universal design method for small element pavements. In his paper and presentation he gives us more information about this new method that is available as a Windows application in the Netherlands.