The Update to L-Band Geophysical Model Function for SSS ...
34
The Update to L-Band Geophysical Model Function for SSS Retrieval Using SMAP Data with Improved Radiometric Calibration Estimation of SMAP Mesh Antenna Emissivity or Loss Simon Yueh 1 , Wenqing Tang 1 , Alexander Fore 1 , Akiko Hayashi 1 , Sidarth Misra 1 , and Jinzheng Peng 2 1 Jet Propulsion Laboratory, California Institute of Technology, CA 2 Goddard Space Flight Center, MD October 2018
Transcript of The Update to L-Band Geophysical Model Function for SSS ...

The Update to L-Band Geophysical Model Function for SSS Retrieval Using SMAP Data
with Improved Radiometric CalibrationEstimation of SMAP Mesh Antenna
Emissivity or LossSimon Yueh1, Wenqing Tang1, Alexander Fore1, Akiko Hayashi1,
Sidarth Misra1, and Jinzheng Peng2
1Jet Propulsion Laboratory, California Institute of Technology, CA2Goddard Space Flight Center, MD
October 2018

How much radiation from the SMAP mesh antenna?
Emissivity 0.002 ~0.6K ~1 psuPre-launch measurement and modeling (V3)
Emissivity 0.01 ~3K ~5 psuPost-launch analysis using ocean radiative transfer model (V4)
Or ?

Vicarious Antenna Emissivity Calibration Method
• Errors in the GMF and ancillary data can cause systematic errors (spatial and time varying)• Potential Circular loop: Calibrated data will be used
to build Geophysical Model Function
Geophysical Model Function of ocean
Ancillary data:WindSSTWave height
Ocean Model TB
DTBTB
SMAP TB
Linear regression
Antenna Temperature from thermal model
Delta Reflector Loss ∆"

Daily average of dTA Observations from V3 calibration
• DTA reduced by about 0.3 K from non-eclipse to eclipse• Asc-Dec bias was -0.2 K bias in June
0.3K
0.3KAsc
Dec

Large orbital SMAP Reflector Temperature Changes During Eclipse (thermal model)
Descending Ascending
Near North Pole Near South Pole Near North Pole
Non-eclipse• Tant was
near 380 K
Eclipse
EclipseDaily average

Regression of daily dTA against antenna temperature (Misra)
SMAP Radiometer Brightness Temperature Calibration for L1B_TB and L1C_TB Version 3
∆"#"=∆&& "# − "()*
Regression slope is about 0.01

Estimated SMAP Reflector Loss
Pol JPL GSFC RSSReflector H 1.014 1.016 1.01
V 1.012 1.012 1.01Radome H NA 1.0023 NA
V NA 1.0017 NA
• Regression analyses in 2017
Significantly larger than 0.002, pre-launch data/model value, by a factor of 5 to 8
• 1.0025 used for V3 processing and prior
• JPL: Daily average of dTA (ocean model) vs daily average of antenna temperature
• GSFC: Minimization of peak-to-peak daily dTA during May-July
• RSS: Hovmueller diagram (doy, lat) of daily dTA with respect to ocean model

V3 and V4 dTBV Map on Doy 181V3 shows ~ • Negative bias for ascending • Positive bias for descending
V4 shows ~ • Positive bias for ascending• Negative bias for descending
0.0025 for reflector emissivity 0.012-0.016 for reflector emissivity
Ascending
Descending
Ascending
Descending
Antenna azimuth Antenna azimuth

JPL’s analysis for V3 dTB on June 22, 2016

JPL’s analysis for V4 dTB on June 22, 2016
Bias near the Antarctic for ascending pass has significantly increased
Negative bias for descending pass showed up

Critical V4 Calibration Impact on soil moisture retrieval• V4 calibration raised the TB by ~3K.• Impact on L2 soil moisture retrieval: effective land
surface temperature, Teff, was raised by a factor of 1.02 (~5 deg C)), to reduce soil moisture bias (dry bias). • Can land surface model underestimate surface
temperature by 5 deg C? This is unlikely.
• V4 calibration not preferred for SMAP L2 soil moisture retrieval

Additional fixes are needed
• Should the dynamic range of reflector temperature be adjusted?• RSS implemented reflector temperature adjustment to
address this
Make the antenna colder for descending and warmer for ascendingIs this physical?
Other solutions?Revisit the regression analyses
∆"#"=∆&& "# − "()*

Influence of Sun Glint

V3 and V4 DTB Comparison for DOY 1, 2016
V3 V4
Some large dTB caused by sea iceSun glint could be much more diffused than the 25 degree keep-out angular cone
Halo (diffused scattering by sun?)

Revisit the Regression Estimation
Perform regression using every data point (not daily average) to account for ascending and descending differences

SMAP V3 dTB vs. Antenna Temperature on June 22, 2016
∆"#"=∆&& "# −
"()*+,

SMAP V4 dTB vs. Antenna Temperature on June 22, 2016
∆"#"=∆&& "# −
"()*+,
Estimated Delta Emissivity from SMAP V3 Data
Date Range Threshold of antenna azimuth angle from 90 degrees
Threshold of sun incidence
dTBV/d(Tant-TB)
dTBH/d(Tant-TB)
6/22/16 30 25 0.0022 0.00216/22/16 90 25 0.0029 0.00196/22/16 360 25 0.0027 0.0030xx/22/16 30 25 0.0020 0.0016xx/22/16 90 25 0.0024 0.0016xx/22/16 360 25 0.0028 0.0033xx/22/16 360 50 0.0026 0.0019xx/22/16 360 0 0.0039 0.0047xx/22/16 30 0 0.0020 0.0016
Residual sun glint can affect the estimate by about 0.001 ~50% of correction
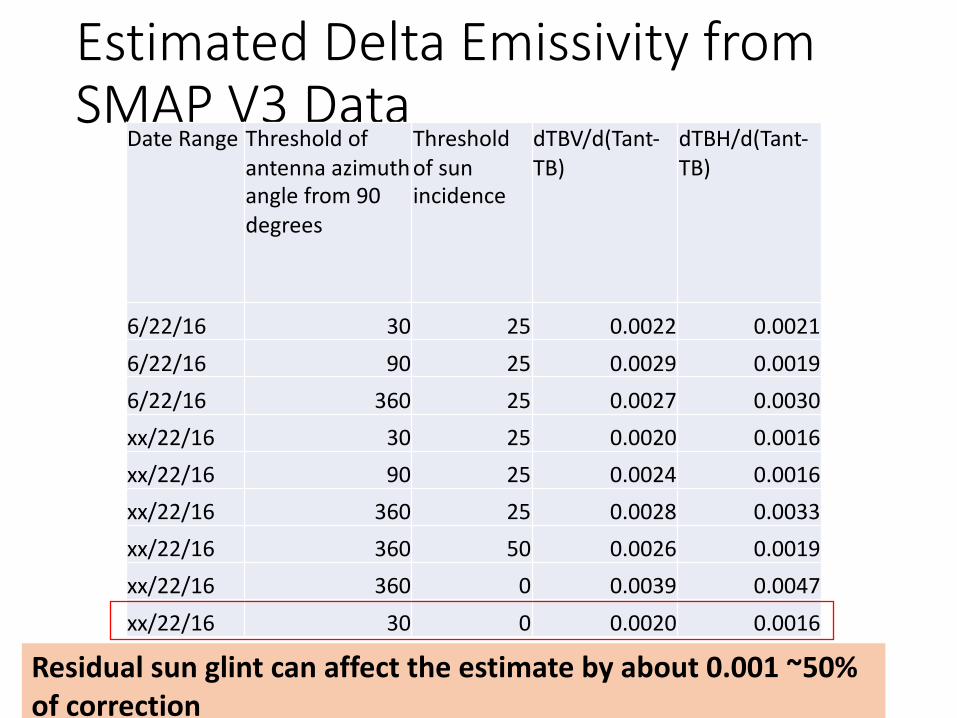
Estimated Delta Emissivity from SMAP V4 Data
Date Range Threshold of antenna azimuth angle from 90 degrees
Threshold of sun incidence
dTBV/d(Tant-TB)
dTBH/d(Tant-TB)
6/22/16 30 25 -0.0109 -0.0158
6/22/16 90 25 -0.0104 -0.01626/22/16 360 25 -0.0108 -0.0152
xx/22/16 30 25 -0.0097 -0.0142
xx/22/16 90 25 -0.0093 -0.0141
xx/22/16 360 25 -0.0089 -0.0123
xx/22/16 360 50 -0.0091 -0.0137xx/22/16 360 0 -0.0079 -0.0110
xx/22/16 30 0 -0.0097 -0.0142

Delta Antenna Loss Estimated from dTB vs. Antenna Temperature
V H
V4* 0.0137 0.0183dL (dTB-Tant) -0.0097 -0.0142
Total loss 0.0040 0.0041
V H
V3 0.0025 0.0025dL (dTB-Tant) 0.0020 0.0016
Total loss 0.0045 0.0041
*Include reflector and radome lossess
Re-analyses of V3 and V4 reach essentially the same estimates ~0.004 (JPL V4.2). Probably within the uncertainties of pre-launch estimates

V3 and V4 dTBV Map on Doy 181V3 shows ~ • Negative bias for ascending • Positive bias for descending
V4 shows ~ • Positive bias for ascending• Negative bias for descending
0.0025 for reflector emissivity 0.012-0.016 for reflector emissivity
ü V4.2V3 V4

V3 and V4 dTBV Map on Doy 151V3 shows ~ • Negative bias for ascending • Positive bias for descending
V4 shows ~ • Positive bias for ascending• Negative bias for descending
0.0025 for reflector emissivity 0.012-0.016 for reflector emissivity
ü V4.2V3 V4

V3 and V4 dTBV Map on Doy 1V3 shows ~ • About neutral
V4 shows ~ • Negative bias for descending
0.0025 for reflector emissivity 0.012-0.016 for reflector emissivity0.0045 for reflector emissivity
ü V4.2V3 V4

Small loss adjustment can reduce ascending-descending biasThen •How about the seasonal drift during eclipse?•DTQ Analysis (Double difference)•Polarization difference and temporal
changes

Using Double Difference (Second Stokes= TBV-TBH)
!"" = !" +∆'' !" −
!)*+,-
− (' − 1 + ∆') ∆!)*+,-!"1" = !"2" − !"3" = (1 + ∆'' )!"1
4!1 =< !"1" − !"1678-9 > +4!1;<)= =∆'' < !"1678-9 >
∆'' = 4!1
< !"1678-9 >+ 4!1;<)=< !"1678-9 >
• There could be a polarized bias in the model and data, resulting in the second term.• This technique is a way to examine change of DL if the bias is fixed.
Assume L does not depend on polarization

Estimated delta loss from V3 dTQ
The pre-launch loss estimate is 0.0025.The delta loss changed from 0.002 to 0.004, except during eclipse
Did the loss of reflector loss change with the average temperature of reflector?
Because of the possibility of a polarized bias between model and data, the delta loss estimated may have a bias.
Lower loss during eclipse when the reflector was on average colder
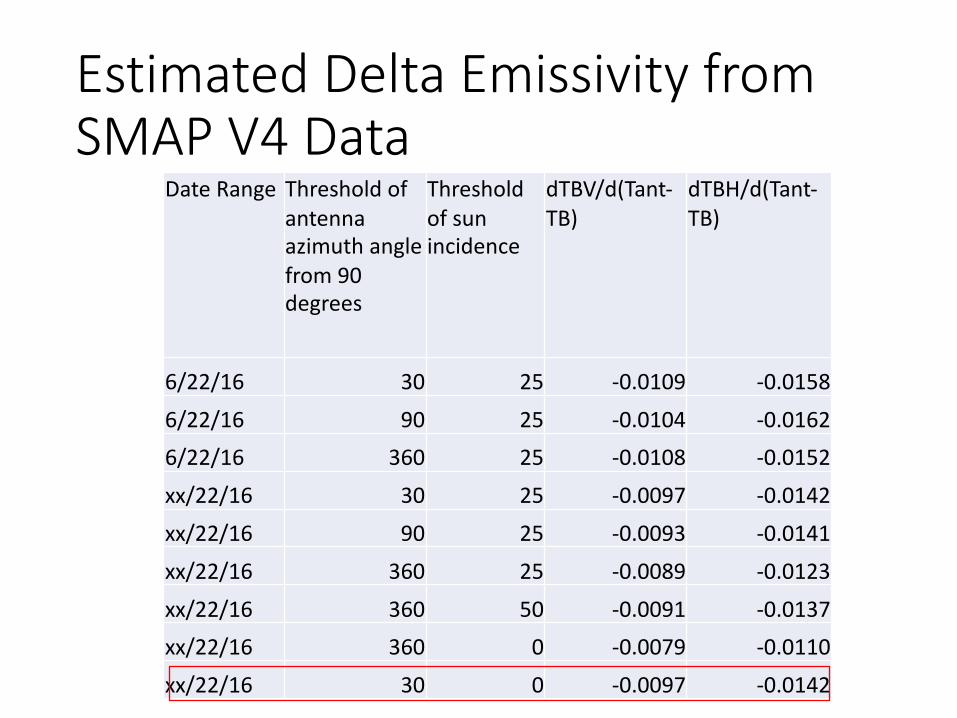
dTA for Version 3Both ascending and descending dTA were lower than non-eclipse by 0.3 K in June.
!"" = !" +∆'' !" − !)*+ − (' − 1 + ∆')∆!)*+
If we change the loss by 0.0012, we can approximately re-produce the changes of dTA during eclipse.
0.3K
V HAsc Dec Asc Dec
Tant 355 390 355 390TA 120 120 70 70L 1.005 1.005 1.005 1.005DL 0.00120.00120.00120.0012DTA -0.28 -0.32 -0.34 -0.38

Caution on the use of the DTA analysis
• We can zero out dTA (dSSS) vs time and latitude if both parameters (L and Tant) can be freely adjusted.• RSS Hovmueller• JPL dTB• SMOS Ocean Target Transformation
dSSS~d"#(%&' () *+', -%., *(/) = ∆33 "# − "567

Summary• Re-analyses of V3 and v4 data using JPL GMF led to
small change (~0.002) of reflector loss from pre-launch measurements and model• This is the basis of JPL SMAP V4.2 SSS
• DTQ analysis suggested a small change of reflector loss (~0.001) over eclipse seasons – exact sources unknown.• Be cautious in using dTB for radiometric calibration• We can over-calibrate the data to fit the model
• Absolute radiometric calibration requires constant attention

Plan - Community Based • Collaboration with LOcean to develop consistent SMOS-SMAP-CCI
products• JPL SMAP open source codes installed at LOcean
• Collaboration with NOAA (Bayler, Garrett), GSFC (Dinnat, Eric), Observatoire de Paris (Prigent) on Community Radiative Transfer Model (CRTM) and Community Surface Emissivity Model (CSEM)
• Initial discussions – Form the CRTM-L working group (open for volunteers) • Start from CRTM as the baseline and improve L-band CSEM• Coordinated inter-comparison effort among group members to select
the best modules for regular updates
• Can leverage the JPL SMAP open source codes for SSS/wind processing to test the sensitivity to
• ancillary data (ECMWF, NCEP)• dielectric model• Roughness model
• Leverage PI-MEP

SMAP orbit and sun geometry
June
March
Dec

Average SMAP Reflector Temperature on the 1st of each Month between 50S and 50N

Antenna Model for Calibration
!"" = !" +∆'' !" − !)*+ − (' − 1 + ∆')∆!)*+
TA: True antenna brightness temperatureTA”: Calibrated TA with errorL: true loss∆L: delta loss; L+ ∆ L is the loss used for calibrationTant: physical temperature of antenna∆Tant: knowledge error of Tant; Tant+ ∆ Tant is used for calibration
Loss correction is a slope correction
Tant correction is a bias correction

Alternate Expression for Antenna Model for Calibration
!"" = !" +∆'' !" −
!)*+,-
− (' − 1 + ∆') ∆!)*+,-TB: True brightness temperatureTB”: Calibrated TB with error =TA”/BeBe: beam efficiencyTA”: Calibrated TA with errorL: true loss∆L: delta loss; L+ ∆ L is the loss used for calibrationTant: physical temperature of antenna∆Tant: knowledge error of Tant; Tant+ ∆ Tant is used for calibration
Loss correction is a slope correction
Tant correction is a bias correction