THE UNIVERSITY OF TEXAS AT AUSTIN - CTR Library · The University of Texas at Austin 1616 Guadalupe...
70
PEAK PERIOD BUS USE OF FREEWAY SHOULDERS Jennifer Zuehlke Fanta Kaba Kelsey McElduff Lisa Smith Ho Randy Machemehl Technical Services to the Capital Metropolitan Transportation Authority JUNE 2015 Performing Organization: Center for Transportation Research The University of Texas at Austin 1616 Guadalupe Street, Suite 4.202 Austin, Texas 78701 Sponsoring Organization: Capital Metropolitan Transportation Authority Strategic Planning and Development 2910 East 5 th Street Austin, Texas 78702 THE UNIVERSITY OF TEXAS AT AUSTIN CENTER FOR TRANSPORTATION RESEARCH
Transcript of THE UNIVERSITY OF TEXAS AT AUSTIN - CTR Library · The University of Texas at Austin 1616 Guadalupe...

PEAK PERIOD BUS USE OF FREEWAY SHOULDERS
Jennifer Zuehlke
Fanta Kaba
Kelsey McElduff
Lisa Smith Ho
Randy Machemehl
Technical Services to the Capital Metropolitan Transportation Authority
JUNE 2015
Performing Organization:
Center for Transportation Research
The University of Texas at Austin
1616 Guadalupe Street, Suite 4.202
Austin, Texas 78701
Sponsoring Organization: Capital Metropolitan Transportation
Authority
Strategic Planning and Development
2910 East 5th Street
Austin, Texas 78702
THE UNIVERSITY OF TEXAS AT AUSTIN CENTER FOR TRANSPORTATION RESEARCH
ii
ABSTRACT
With an objective of improved bus reliability and reduced travel times, many cities are allowing
transit buses to use freeway shoulders to bypass slow or stopped freeway traffic. Safety based
protocols are an important part of all buses on shoulders operations. The bus-on-shoulder system
in the Twin Cities of Minneapolis and St. Paul, Minnesota is currently the most extensive.
Besides the Twin Cities’ system, others examined in this study include those in: San Diego,
California; Columbus, Cincinnati, and Cleveland, Ohio; Miami, Florida; and Fairfax County,
Virginia. Descriptions of technical, financial, and legal characteristics of these systems are
followed by an analysis of implications for bus-on-shoulder implementation in Austin, TX.
iii
TABLE OF CONTENTS
Chapter 1 Experiences with Buses on Shoulders Systems ...................................................... 1 1.1 Bus-Only-Shoulder or Bus-On-Shoulder (BOS) Systems .......................................................... 1 1.2 Geometric and Physical Constraints ............................................................................................... 3
Minneapolis / St. Paul, MN ........................................................................................................................................................ 3 San Diego, CA ................................................................................................................................................................................... 4 Ohio ...................................................................................................................................................................................................... 5 Miami, FL ........................................................................................................................................................................................... 5
1.3 Operational Regulations and Safety Considerations ................................................................ 5 Minneapolis / St. Paul, MN ........................................................................................................................................................ 5 San Diego, CA ................................................................................................................................................................................... 7 Ohio ...................................................................................................................................................................................................... 7 Miami, FL ........................................................................................................................................................................................... 8 Fairfax County, Virginia .............................................................................................................................................................. 8
1.4 Costs and Funding .................................................................................................................................. 8 Minneapolis / St. Paul, MN ........................................................................................................................................................ 8 San Diego, CA ................................................................................................................................................................................... 9
1.5 Stakeholders and Legal/Legislative Requirements .................................................................. 9 Minneapolis / St. Paul, MN ........................................................................................................................................................ 9 San Diego, CA ................................................................................................................................................................................... 9 Ohio .................................................................................................................................................................................................... 10 Miami, FL ......................................................................................................................................................................................... 10 Fairfax County, VA ....................................................................................................................................................................... 10
1.6 Results of BOS Systems ..................................................................................................................... 10 Minneapolis / St. Paul, MN ...................................................................................................................................................... 10 San Diego, CA ................................................................................................................................................................................. 11 Ohio .................................................................................................................................................................................................... 11 Miami, FL ......................................................................................................................................................................................... 11 Fairfax County, VA ....................................................................................................................................................................... 11
1.7 Choosing Corridors for BOS ............................................................................................................ 12 1.8 Implications for Austin, TX .............................................................................................................. 13 1.9 BOS System Recommendations for Austin, TX ......................................................................... 14 1.10 Bus Driver Training ......................................................................................................................... 15
Chapter 2 Central Texas Case Study ............................................................................................. 16 2.1 Data Collection ..................................................................................................................................... 16
2.1.1 Roadway Geometry ..................................................................................................................................... 16 Bus Volumes................................................................................................................................................................................... 17 Average Vehicle Speeds ............................................................................................................................................................ 17
2.2 Corridor Selection .............................................................................................................................. 18 2.2.1 IH-35 Northbound ....................................................................................................................................... 18 2.2.2 IH-35 Southbound ....................................................................................................................................... 18 2.2.3 US-183 Northbound .................................................................................................................................... 20 2.2.4 US-183 Southbound .................................................................................................................................... 21
2.3 Chosen Candidates for BOS and Corridor Modeling ............................................................... 21 2.3.1 US-183 Northbound from Burnet Road Exit to Duval Exit ......................................................... 21 2.3.2 IH-35 Southbound from US-183 exit to the start of the IH-35 elevated section ............... 22
2.4 Final Recommendations ................................................................................................................... 22
Chapter 3 Benefit and Cost Evaluation ........................................................................................ 23 3.1 Capital Costs for BOS Implementation ........................................................................................... 23 3.2 Benefits....................................................................................................................................................... 24
iv
3.2.1 Computing the Dollar Value of Time for Austin Bus Riders (V) ............................................... 24 3.2.2 Determining the Critical Traffic Period and Bus Time Savings (S) ........................................ 25 3.2.3 Determining Ridership during the Critical Traffic Period (Rt) ................................................ 26
3.3 Test Corridor Costs and Benefits Summary .................................................................................. 28 3.4 Final Recommendations ...................................................................................................................... 28
Chapter 4 Predicting incremental transit patronage for BOS operations ...................... 29 4.2 Ridership Changes in Minneapolis-Saint Paul ............................................................................. 29
4.2.1 Data Collection ................................................................................................................................................. 29 4.2.2 BOS Segment Data Collection ..................................................................................................................... 29 4.2.3 Speed Data Collection .................................................................................................................................... 29 4.2.4 Ridership Data Collection ............................................................................................................................ 30 4.2.5 Data Analysis .................................................................................................................................................... 30 4.2.6 Removing Seasonality .................................................................................................................................... 30 4.2.7 Appling 12 point Moving Average .......................................................................................................... 32 4.2.8 Independent variables .................................................................................................................................. 33
4.3 Stated Preference Survey ..................................................................................................................... 36 4.3.1 Typical Commute Time................................................................................................................................. 37 4.3.3 Percent of Commute in Congestion ......................................................................................................... 39 4.3.4 Significance of Reliability............................................................................................................................. 40 4.3.5 Desired Time Savings .................................................................................................................................... 40 4.3.6 Conclusions ....................................................................................................................................................... 41
4.5 Conclusions .............................................................................................................................................. 44
Chapter 5 Conclusions ....................................................................................................................... 45
References ............................................................................................................................................. 46
APPENDICES .......................................................................................................................................... 48 APPENDIX A: ACTIVE BOS PROJECTS ................................................................................................................ 49
APPENDIX B: Potential Characteristics for Austin BOS ................................................................... 52 Data for IH-35 SB......................................................................................................................................................... 52 Data for IH-35 SB, Test Corridor ........................................................................................................................... 53 Data for IH-35 SB, All Days ...................................................................................................................................... 54 Data for IH-35 SB, Wednesday 12/03/2014 ................................................................................................... 55 Data for IH-35 SB, Thursday 12/11/14 ............................................................................................................. 56 Data for IH-35 SB, Wednesday 12/17/14 ......................................................................................................... 57 Data for US-183 NB .................................................................................................................................................... 58 Data for US-183 NB, Test Corridor ...................................................................................................................... 59 Data for US-183 NB, Wednesday 12/3/14 ....................................................................................................... 60 Data for US-183 NB, Wednesday 12/10/14 .................................................................................................... 61 US-183 NB, Wednesday 12/17/14 ...................................................................................................................... 62
APPENDIX C: Freeway Restriping and Repaving Cost Estimates (Murphy, 2009) ................ 63 APPENDIX D: Survey of Austinites .......................................................................................................... 64
Bus on Shoulder Survey ........................................................................................................................................... 64

v
LIST OF TABLES TABLE 1.1 Structural Components of MN BOS System (Douma, 2007). ................................... 4
TABLE 1.2 Minnesota/ Twin Cities Cost Break-Down (Douma, 2007). ................................... 12
TABLE 2.1 Geometry, Speeds and Bus Data for IH-35 SB. ....................................................... 19
TABLE 2.2 Geometry, Speeds and Bus Data for US-183 NB. ................................................... 20
TABLE 2.3 US-183 NB Test Corridor Geometry, Speeds and Bus Data. .................................. 21
TABLE 2.4 IH-35 SB Test Corridor Geometry, Speeds and Bus Data. ...................................... 22
TABLE 3.1 Cost Estimates for Re-striping and Re-paving. ........................................................ 23
TABLE 3.2 Cost Estimates for Implementation. ........................................................................ 24
TABLE 3.3 Average per Capita Income for Region. .................................................................. 25
TABLE 3.4 IH-35 SB Calculations of Peak Period Length and Min/Mile Time Savings .......... 26
TABLE 3.5 US-183 NB Calculations of Peak Period Length and Min/Mile Time Savings
(December 2014). ................................................................................................................. 26
TABLE 3.6 IH-35 SB Ridership and Projected Daily Time Savings. ......................................... 27
TABLE 3.7 US-183 NB Ridership and Projected Daily Time Savings. ..................................... 27
TABLE 3.8 Comparison of Costs and Benefits. .......................................................................... 28
TABLE 4.1 Seasonal Adjustment Factors for Metro Transit. ..................................................... 31
TABLE 4.2 Correlation Coefficient and T-Stats for Each X Value Compared to Percent.
Difference. ............................................................................................................................ 34
TABLE 4.3 Stated Preference Survey Questions. ....................................................................... 37
TABLE 4.4 Route Summary........................................................................................................ 43
TABLE 4.5 Changes to Ridership due to BOS for Austin BOS Pilot Corridors. ........................ 43
TABLE 4.6 Possible Revenue Generation due to BOS on Austin Pilot Corridors. .................... 44
LIST OF FIGURES FIGURE 1.1 BOS in Action in the Twin Cities (Conover, 2008). ................................................ 3
FIGURE 1.2 MN BOS Signage (Martin, 2006). ........................................................................... 6
FIGURE 2.1 Sections were measured between ramps designated by the tip of the gore area .... 17
FIGURE 4.1 MVTA Route 464 Ridership from Jan 1991 to Oct 2008 ...................................... 32
FIGURE 4.2 MVTA Route 464 Ridership from 1994 to 1998. ................................................... 33
FIGURE 4.3 Scatter Plot of Average Time Savings vs. Percent Change in Ridership. .............. 35
FIGURE 4.4 Scatter Plot of Average Speed vs. Percent Change in Ridership. .......................... 35
FIGURE 4.5 Probability of a driver trying the bus for a range of commute times. .................... 38
FIGURE 4.6 Probability of a driver trying the bus for a range of percent time spent on major
Austin freeways. ................................................................................................................... 39
FIGURE 4.7 Probability of a driver trying BOS Transit with respect to congestion. ................. 40
FIGURE 4.8 Probability of Switching to Transit for a Range of Desired Time Savings. ........... 41
FIGURE 4.9 Cross Classification of Question 2 and 9 for Drivers Willing to Try Transit. ....... 41

1
CHAPTER 1 EXPERIENCES WITH BUSES ON SHOULDERS SYSTEMS
With an objective of improved bus reliability and reduced travel times, many cities are
allowing transit buses to use freeway shoulders to bypass slow or stopped freeway traffic. Safety
based protocols are an important part of all buses on shoulders operations. The bus-on-shoulder
system in the Twin Cities of Minneapolis and St. Paul, Minnesota is currently the most
extensive. Besides the Twin Cities’ system, others examined in this study include those in: San
Diego, California; Columbus, Cincinnati, and Cleveland, Ohio; Miami, Florida; and Fairfax
County, Virginia. Descriptions of technical, financial, and legal characteristics of these systems
are followed by an analysis of implications for BOS implementation in Austin, TX.
The purpose of this effort is to explore the feasibility of implementing Buses on Shoulders
(BOS) in Austin, TX. Part 1 provides a review of experiences with BOS in other cities and
countries.
1.1 BUS-ONLY-SHOULDER OR BUS-ON-SHOULDER (BOS) SYSTEMS
“A BOS [Bus-Only-Shoulder] is a street or highway shoulder constructed, modified, or enhanced
to support bus traffic” (Douma, 2007). Generally, buses are permitted to use shoulders during
peak traffic periods to bypass congested sections of freeways or arterial roadways. The first
known instance of buses utilizing shoulders to bypass congestion was in Seattle, Washington in
the 1970s. Seattle’s BOS system, however, does not greatly resemble more recently
implemented, well-known, and successful BOS systems from an operational standpoint. The
nearly 5 miles of shoulder used for buses and carpools in Seattle have no speed or time-of-day
restrictions, which in other cities are seen as important safety regulations (Martin, 2007). In
1991, the Twin Cities of Minneapolis and St. Paul, Minnesota renewed the concept of bus-only-
shoulders, starting a trend that now extends to over a dozen cities around the world.
MetroTransit’s goal was to create a “transit advantage” that would encourage more people to ride
the bus due to shorter travel times. BOS systems are also a solution for decreasing congestion
with a constrained budget. They initiated a pilot project in 1991 on Highway 252, an arterial
roadway, where buses were allowed to by-pass traffic by using the right shoulder. The first
instance of buses on shoulders on a Minneapolis area freeway was on MN 77 in 1993. Today the
BOS system in the Twin Cities includes over 300 miles (Conover, 2008 and
www.metrotransit.org).
In December 2005, San Diego, CA instituted a bus-on-shoulder pilot project to stand as
an interim measure until managed lanes or other costly long-term transit improvements could be
made. The BOS project was a part of SANDAG’s Transit First strategy to relieve congestion on
freeways and arterials. The two year pilot program allowed exclusive use of about 4 miles of
shoulders on SR-52 and I-805 by express bus Route 960 (Martin, 2007). The successful pilot
program resulted in an announcement in August 2008 that 20 more miles of bus-only-shoulder
lanes along I-805 would be added to San Diego’s system (Schmidt, 2008).
Columbus, Ohio opened a BOS system in November 2006 along 10 miles of I-70. The
project team, called Transit Advantage Group Partners, implemented the bus-only-shoulders as a
one-year pilot project. Three bus routes use the BOS roadway section daily (Martin, 2007). In

2
July of 2007, another Ohio city, Cincinnati, entered the bus-on-shoulder market with a one-year
pilot project. The project is intended to reduce traffic by encouraging transit usage and make full
use of the highway’s capacity. The BOS section is 11.7 miles along I-71 northbound and
southbound and is used by bus Rt. 71X and Rt. 72 (Metro’s I-71…, 2008). Cincinnati’s pilot
project was made permanent in August 2008 (O.D.O.T. Agrees…, 2008). The successful
Columbus and Cincinnati BOS experiences prompted a third Ohio City to explore the use of
buses on shoulders. Cleveland, Ohio transit stakeholders including Greater Cleveland Regional
Transit Authority and Laketran began testing BOS on stretches of Interstate 90 in June 2008
(Hollander).
Bus-only-shoulders in Miami, Florida appeared in March 2007 along SR 874 (Don Shula
Expressway) and SR 878 (Snapper Creek Expressway), about 9 miles of BOS total. The three
year pilot program was supported by the People’s Transportation Plan (PTP) of 2002, and
intended as an interim measure until permanent transit lanes could be built. Two bus routes
currently operate on SR 874 and three on SR 878. Smaller than average buses 30 ft. long operate
on the shoulders called Kendall Area Transit (KAT) (Martin, 2007).
In the early 2000s, Fairfax County, Virginia widened a 1.3 mile long shoulder along VA-
267 that feeds to West Falls Church Metro Rail Station. This project is unique because it acts
more as a queue jumper for a small congestion area resulting from vehicles merging onto
congested I-66 rather than a bypass for miles of heavy congestion along the BOS corridor.
Fairfax County added a BOS expansion to I-66 (Martin, 2006).
In the United Kingdom, usage of the shoulder is known as hard shoulder running. In
September 2006 a pilot project on an 11-mile stretch of the M42 motorway, near Birmingham
began. The project proved very successful, with bus travel times decreasing by 26% northbound
and 9% southbound and travel time variability decreasing by 27%. Safety improved with average
accident rates dropping from 5.2 to 1.5 per month. The system has been expanded to the M6, M1
and M25, with plans to include parts of M60 and M62 by 2015.
Though many other BOS systems exist, their basic function is either not very similar to
that proposed for Austin, TX or there is not a lot of readily available information about them. A
table of the basic information that is known about each system is included in the Appendix.
Cities that allow bus use of shoulders on freeways include:
Seattle, Washington, US (since 1970s, 4.9 miles)
Minneapolis/St. Paul, Minnesota, US (since 1991, over 270 miles)
Auckland, New Zealand (since 1991, length of corridors unknown)
Ottawa, Ontario, Canada (since 1992, 14 miles)
Dublin, Ireland (since 1998, 50 to 70 miles)
Vancouver, British Columbia, Canada (year started unknown)
Maryland, Washington, US (year started unknown, 3 miles)
Fairfax County, Virginia, US (since at least 2000, 1.3 miles)
Toronto, Ontario, Canada (since 2003, 3 miles)
Atlanta, Georgia, US (since November 2005, 12 miles)
San Diego, California (since December 2005, 4 miles)
Columbus, Ohio (since November 2006,
Old Bridge, New Jersey, US (since December 2006, 3 miles)
Miami, Florida, US (since March 2007)
Cincinnati, Ohio (since July 2007)

3
Cleveland, Ohio (since June 2008)
Birmingham, UK (since 2006)
Durham County, NC (since 2013)
Calgary, Canada (since 20120
Kansas City, Kansas (since 2011)
1.2 GEOMETRIC AND PHYSICAL CONSTRAINTS
Minneapolis / St. Paul, MN
In Minnesota, bus-only-shoulders are located exclusively on the right shoulder of the freeway
(see Figure 1.1). Though this creates conflict points with entering and exiting traffic, it allows
the buses to exit and enter the freeway without having to fight through lanes of traffic to reach
the left shoulder. Bus drivers in Minnesota helped determine standard widths for bus-only
shoulders. This width is 10 ft., except on bridges where it is 11.5 ft. On bridges, drivers did not
feel safe driving very close to bridge barriers. Since the 10 ft. shoulder only leaves 9 inches of
space on either side of the bus, the preference in the Twin Cities, however, is for a 12 ft.
shoulder. Most new construction accommodates this preference (Douma, 2007).
FIGURE 1.1 BOS in Action in the Twin Cities (Conover, 2008).
In Minnesota, the standard thickness for bus-only shoulder surface layer pavement is 7
inches, like main lanes. Before the 1980s, shoulder pavements were often made only 2 inches
thick. Since then, most new roads use the standard 7 inches for their shoulders. During pilot
4
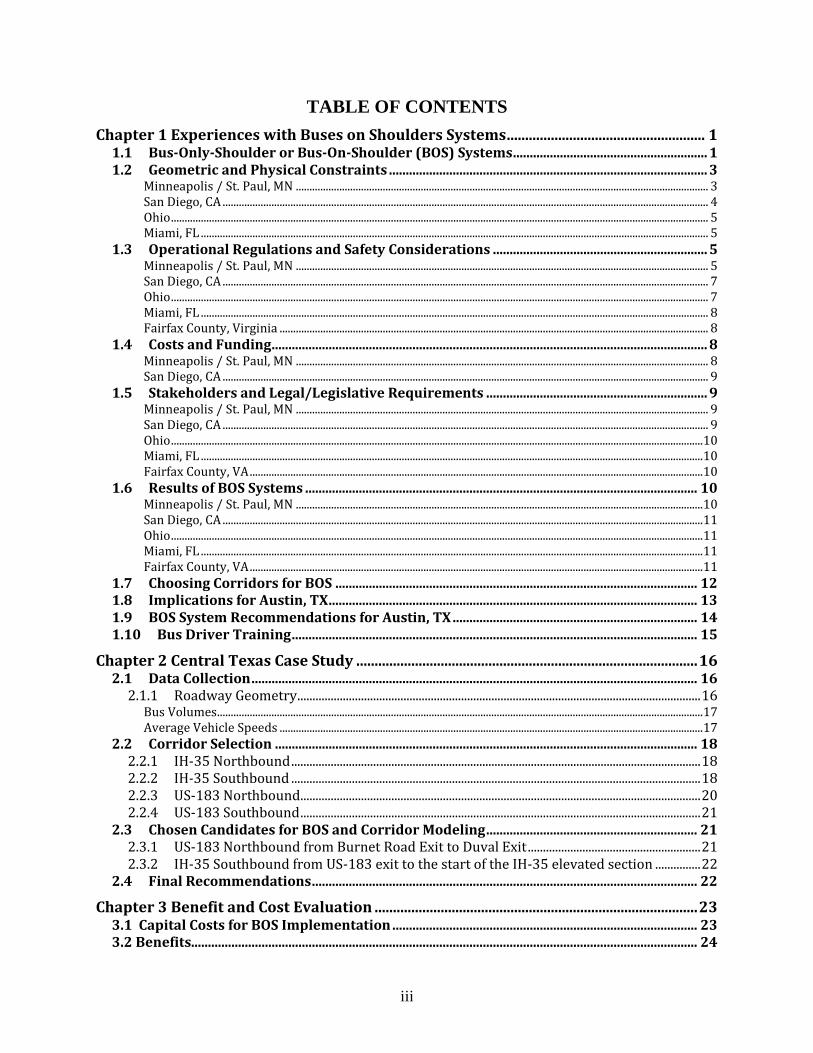
BOS projects in Minnesota few buses used the shoulders so little wear and tear could be seen in
the structural integrity of the roadway. As the number of buses on the shoulders increased, the
pavement and structure of older shoulders began to wear down, and 2-inch thick shoulder
pavements had to be reinforced to 7 inches thick (Douma, 2007). Table 1.1 lists all structural
requirements of bus-only-shoulders in Minnesota.
Problems with rain water catch basins also arose on bus-only-shoulders in the Twin
Cities. Catch basins were typically raised over the surface of the road so that buses driving over
them caused damage to the basin and discomfort to riders. A new design was created with a
reinforced concrete pad around the basin to bring it level with the road surface. The new design
solved the problem, but reduced the efficiency of the basins slightly. An additional physical
constraint encountered in the Twin Cities was the presence of rumble strips in the shoulder to
alert drivers that they have veered from the main road. The rumble strips were moved outward
so that the bus wheels would straddle them (Douma, 2007).
Shoulder Width
10 ft. (11.5 on bridges)
minimum & 12 ft.
desired
Bridge Structural
Capacity
HS-25 Minimum Design
Load (New Bridges)
Pavement Thickness 7in minimum for long
term
Normal Cross Slope 2 - 5 %
Horizontal Clearance to
Obstructions 0 ft.
Vertical Clearance Under
Bridge 14 ft.
Stopping Sight Distance 250 ft. min
Horizontal Alignment
(Radius) Match Existing Roadway
Grades Match Existing Roadway
Inslopes 1:06
Vertical Alignment (K
Value) Match Existing Roadway
Superelevation .06 maximum
TABLE 1.1 Structural Components of MN BOS System (Douma, 2007).
San Diego, CA
Like the Twin Cities, San Diego’s bus-only-shoulders are located on the right freeway shoulder.
Before the project began, an optimal 10 ft. shoulder width was decided upon. In many places, the
right-most main lane would have had to be narrowed in order to widen the shoulder to 10 ft.
Once the project began, however, it was determined that buses could still safely operate on
shoulders narrower than 10 ft., so the re-striping never occurred. For the 2-year pilot project,
little damage was expected to shoulder pavements, so they were not strengthened (Leiter, 2006).

5
San Diego’s 20 new miles of bus-only-shoulder lanes, opened in the fall of 2009, are
located on the left freeway shoulder. Cincinnati was the first city to use this unique design for
their pilot BOS project in 2007 (see below). The shoulders are designed to be 11 ft. wide. In
order to accommodate the new width of the existing 8 ft. shoulders, at least three of the freeway
main lanes were re-striped at 11 ft. (Schmidt, 2008).
Ohio
Bus-only shoulders in Columbus, Ohio are located on the right shoulder. The I-70 corridor was
chosen in Columbus, Ohio because the key structural and geometrical components already met
regulation. Shoulders are 10 ft. wide and pavements are full depth. Cincinnati’s pilot BOS
project, which opened in 2007, was the first to utilize the left shoulder of the freeway for bus
transit usage. Shoulders are 12 ft. wide (Metro’s I-71…, 2008). Bus-only-shoulders in
Cleveland are all at least 10 ft. wide (Hollander, 2008).
Miami, FL
Located on the right shoulder, BOS lanes in Miami are a minimum of 10 ft. wide. This
minimum is raised to 12 ft. where truck volumes exceed 250 vph. Cross slopes are between 2
and 6%. In considering corridors for BOS, Miami set a minimum usable segment length of
2,500 ft. Often there are obstructions along shoulders that force buses to remerge into traffic
such as a bridge, a narrowing of the shoulder, or conflict with an intersection. In Miami,
segments between merge points that are less than 2,500 ft. are not considered for BOS (Guerra,
2008).
1.3 OPERATIONAL REGULATIONS AND SAFETY CONSIDERATIONS
Minneapolis / St. Paul, MN
Minnesota state law outlines the operational regulations for Bus-Only-Shoulders in the Twin
Cities metro area. Buses are not allowed to exceed 35 mph in the shoulder. Feedback from bus
drivers helped set speed regulations. Bus drivers did not feel safe going more than 35 mph in the
shoulder. Therefore, buses do not use the shoulder unless traffic in the main lanes has slowed to
less than 35 mph. Buses are allowed to use the shoulder when they have passengers or when
they are “deadheading” (driving to or from a parking lot with no passengers). To avoid costly
accidents, buses are not allowed to drive more than 15 mph greater than the traffic in the main
lanes (Douma, 2007). Buses must always have their four-way flashers on when in the shoulder
(Martin, 2007).
No road markings are used on the bus-only shoulders. Signs reading “Shoulder –
Authorized Buses Only” are placed along BOS corridors every quarter to half mile (See Figure
1.2). Signs at the beginning and end of a BOS corridor are marked as such. Signs are also
placed at on-ramps that read “Watch for Buses on Shoulders” about 200 ft. before the ramp
meets the freeway (Martin, 2007). Small yellow warning signs are placed along the corridor
where conflicts exist such as a weaving point, a narrowing lane, or an intersection (Martin,
2006). Of course, the original purpose of a shoulder was to allow for the passage of emergency
vehicles, a safe spot to pull over in the event of car trouble, or a temporary storage location for
large debris. If such an obstruction should appear on the shoulder, buses can easily merge back
into slow-moving traffic, and typically do this approximately 1,000 ft. before the obstacle.

6
Debris is typically removed from shoulders less frequently than on mainlines, however, BOS
implementation requires more attention to shoulder debris removal (Douma, 2007).
The signalized intersection of an arterial roadway facilitates safe operations of buses on
shoulders on such roads. Signals control intersections and maintain speed limits. Conflict points
on freeways, however, are not controlled by signals. Before bus-only shoulders were
implemented on freeways, there were concerns about buses crossing auxiliary lanes. To address
these concerns, buses are required to yield to entering and exiting vehicles. In the Twin Cities,
ramp metering helps create gaps in entering queues for buses (Douma, 2007). Some auxiliary
lanes, however, can be accompanied by high amounts of traffic weaving. When ramp volumes
exceed about 1500 vph, buses may be instructed to merge back into mainline traffic. Buses are
not allowed to use the shoulder at locations that have double-width entrance or exit ramps
(Martin, 2007).
(1) Install near midpoint when zone exceeds 3 mi and continues at approximately 1.5 mi spacing
(2) Install as needed to warn bus drivers where shoulder is less than 10 ft.
FIGURE 1.2 MN BOS Signage (Martin, 2006).
Many safety considerations formed the operational procedures in the Twin Cities for use
of bus-only shoulders. Bus drivers must be trained to drive on the shoulder by their respective
transit service providers. Charter bus services can use the shoulder if they have registered with
the Minnesota’s MetroTransit. In the Twin Cities, however, charter buses seldom use the
shoulders. They do not have as much experience as transit bus drivers. Bus drivers are never
required to drive on the shoulder. They only use bus-only shoulders if and when they feel
comfortable doing so. This ensures that a driver never enters a situation he or she feels is unsafe.
The state patrol is responsible for ensuring proper use of the shoulders. They are kept aware of
who has authorization to use them. An early fear in Minnesota that other vehicles would follow
the buses and drive on the shoulder never materialized (Douma, 2007).

7
San Diego, CA
Buses can only use the shoulder when mainline speeds fall below 35 mph and cannot exceed
other traffic by more than 10 mph. BOS signage in San Diego consists of signs along the
shoulder reading “Transit Lane – Authorized Buses Only.” San Diego also uses pavement
markings that read “Only Bus Transit.” Only express bus route 960 was allowed to initially use
the shoulder. The section of shoulder used in the San Diego BOS pilot project consists of the I-
805 and the SR-52 roadways surrounding the intersection of the two freeways. The result is that
there is one complex freeway to freeway interchange in the middle of the project. Buses use
auxiliary lanes to help them make this weave. Many of the ramps along the section have ramp-
metering to help break up entering traffic. During or after rainstorms, when there is a chance of
ponding, buses are not supposed to use shoulders (Martin, 2007).
The 20 new miles of bus-only-shoulders in San Diego can be used by buses only during
rush hour when speeds fall below 30 mph and may not exceed 35 mph on the shoulder. Disabled
vehicles and emergency vehicles are still encouraged to use the shoulder when necessary; buses
have to merge back into traffic to go around such vehicles. In the event that a bus breaks down
in the shoulder, another bus would pick up the stranded passengers. The BOS lanes are planned
to run alongside the median (or left shoulder) of I-805 southbound and northbound. Use of the
left shoulder is significant because in order to execute the one scheduled stop on the express
route, the bus has to maneuver through several lanes of congested traffic to exit and re-enter the
freeway. Enforcement is by the California Highway Patrol (Schmidt, 2008).
Ohio
Buses are allowed to use the shoulders in Columbus when traffic speeds drop below 35 mph and
buses cannot exceed 35 mph on the shoulder. They also cannot go more than 15 mph faster than
general-purpose lane traffic. Signage for the Columbus BOS system is identical to the Twin
Cities’ except that a more traditional yellow warning sign is used at on-ramps. No pavement
markings are used. The Columbus BOS system has several tricky interchanges along its route
that cause a great deal of weaving. Some of the interchanges have double on and off ramps. The
buses are allowed to travel through these interchanges at their own discretion. They do not have
to merge back into general traffic, though they must yield to entering and exiting vehicles. There
are no metered on-ramps. As usual, four-way flashers are required for buses on shoulders.
Debris is cleared from the shoulder every week instead of the previous every three weeks.
Incident response is conducted by a team called FIRST (Martin, 2007).
In Cincinnati, buses are restricted from using BOS shoulders until traffic speeds fall
below 30 mph. They cannot exceed 35 mph on the shoulder and cannot go more than 15 mph
faster than general traffic. Use of the shoulder is permitted to buses and emergency vehicles
only, and buses must yield to emergency vehicles. Since Cincinnati’s buses use the left shoulder
instead of the right, there are no conflicts between the bus and other vehicles entering and exiting
the freeway. Any concerns that buses would have problems maneuvering through traffic to
reach the left lane did not come to fruition. To ensure safety, a company called ARTIMIS
provides real-time camera footage to Metro so they can monitor traffic (Metro’s I-71…, 2008).
The Ohio State Highway Patrol and local law enforcement agencies are charged with ensuring
proper use of BOS lanes (O.D.O.T. Agrees…, 2008).
In Cleveland, BOS buses are permitted to use shoulders when traffic falls below 35 mph
and cannot exceed 35 mph on the shoulder. Appropriate warning signs are located at on-ramps

8
and along the BOS corridor. Buses must yield to emergency vehicles and are required to merge
back into general traffic at exit and entrance ramps (Hollander, 2008).
Miami, FL
The BOS system in Miami utilizes the right shoulder to allow buses to bypass congested traffic.
Buses are not allowed to use the shoulders until speeds drop below 25 mph and cannot operate
more than 15 mph faster than other traffic and cannot exceed 35 mph. BOS signage in Miami is
unique. Signs along the shoulder read “Emergency Stopping Only on Shoulder – Authorized
Bus Lane.” On-ramp signs read “Buses Traveling on Shoulder.” While most BOS corridors
place signs 10 ft. from the edge of the shoulder, Miami places signs 30 ft. away to avoid sign
congestion. Buses are required to yield to all types of traffic that might be occupying the
shoulder including merging and exiting traffic, emergency vehicles, and law enforcement
vehicles. This is especially important when congestion occurs due to incidents in which
emergency vehicles often need to use the shoulder. Buses on the shoulder are also required to
have their 4-way flashers on at all times. The fine for misusing the shoulder including failure to
yield or following a bus is $133.50 and points on the driver’s record (Martin, 2007). The Florida
Highway Patrol is responsible for enforcement of BOS lanes (Guerra, 2008).
Fairfax County, Virginia
Bus use of shoulders is limited to periods of traffic congestion when mainline speeds are less
than 25 mph Monday through Friday between 4pm and 8pm. Buses cannot exceed 25 mph on
the shoulder. A double solid white line separates the BOS shoulder from mainline lanes. Only
public transit buses going to WFC metro station are allowed to use the shoulder. The legal
agreement between Fairfax County and VDOT to use the shoulders for buses emphasizes that
buses must yield the shoulder to emergency vehicles. If there is an incident that causes
emergency vehicles to use the shoulder, the bus driver is required to merge back into mainline
traffic (Martin, 2006).
1.4 COSTS AND FUNDING
Minneapolis / St. Paul, MN
The first bus-only shoulders in Minnesota required minimal capital. Since shoulders needing
reconstruction were avoided, money was only needed for signing and re-striping. Initial capital
funding for BOS projects in Minnesota came from Mn/DOT and Metro Transit. As the system
expanded, Mn/DOT funded the construction of the early bus-only shoulders when reinforcement
was required, while Metro Transit paid for the necessary park-and-ride facilities. Often, the
reinforcement of the shoulder could be incorporated into other highway projects to save money.
Bus-only shoulders along county roads were paid for with county funds. In 1997 the Mn/DOT
and MetroTransit began to set aside $2 million per year for BOS construction. This amount was
reduced to $1 million per year in 2006. In 2003, a bonding package was passed that granted $46
million to the capital costs of bus-only shoulders. This money was in addition to the $2 million
per year. Capital costs for conversion to a BOS corridor range from $1,500 per mile to $100,000
per mile depending upon the condition of the shoulder (Douma, 2007).

9
Operating costs of the bus-only shoulders are paid by the individual transit providers. In
2002 the Twin Cities received $14.7 million from the FTA for their bus-only shoulders since
they fit TEA-21’s requirements of a transit service that uses an exclusive right-of-way or fixed
guideway. This money distributed first to the Met Council, and then to MetroTransit and other
transit service providers, was used almost exclusively for bus operating costs. Federal dollars
were also received from the Congestion Mitigation Air Quality Improvement Program (CMAQ),
jointly administered by the FHWA and the FTA (Douma, 2007).
San Diego, CA
Total cost of implementing San Diego’s pilot project in 2005 was about $100,000. The U.S.
Department of Transportation donated $18 million toward San Diego’s new 20-mile BOS
extension. The U.S. DOT views this project as a trial for lane-guidance technology. The other
$22.5 million needed for the project comes from local sales tax (Schmidt, 2008).
1.5 STAKEHOLDERS AND LEGAL/LEGISLATIVE REQUIREMENTS
Minneapolis / St. Paul, MN
The primary players in the creation of the Twin Cities BOS system were the Minnesota
Department of Transportation and Metro Transit. Other stakeholders included bus drivers and
supervisors, members of the Minnesota State Patrol, suburban transit providers, the FHWA, and
the Federal Transit Administration (FTA) (Douma, 2007).
Initial BOS projects did not require a formal process to establish legality. However, as
more projects were successfully implemented, pressure increased to codify operating regulations
and standards. The FHWA realized that the National Uniform Vehicle Code (UVC) does not
allow driving on shoulders or passing on the right. In 1992, MN adopted an alternative standard
to the UVC which allowed buses to run on shoulders. State law was passed in 2001 describing
the conditions under which BOS routes could be operated and who was authorized to use them.
According to statues BOS can be implemented only on freeways or expressways, though arterials
can have bus-only shoulders with the approval of the transportation commissioner. The law also
authorized police officers to issue tickets to any vehicle misusing the shoulder. Recent
legislation authorized the commissioner to permit transit buses and Metro Mobility buses use of
shoulders in the seven-county metro area. These statutes are very important because the
National Uniform Vehicle Code, which aims to unify transportation infrastructure and
regulations among states, prohibits driving on shoulders. States that allow buses to use shoulders
without the proper statues face greater liability (Douma, 2007).
San Diego, CA
The California State Streets and Highway Code prohibits use of shoulder lanes as travel lanes,
including by transit. The creation of transit-only lanes requires an engineering study. The BOS
corridor in San Diego was officiated by a formal agreement between Caltrans and SANDAG for
a two year pilot project. Shoulders were re-designated as transit lanes instead of shoulders,
however, disabled cars may use them if necessary (Martin, 2007).

10
Ohio
The Ohio Revised Code contains a section legalizing bus use of shoulders in Ohio. Section
4511.25 allows COTA buses to use the shoulder during the trial BOS project in Columbus
(Martin, 2007). The project partners in Cincinnati’s BOS system include the transit operator
Metro, the Ohio Department of Transportation, the Federal Highway Administration, and
ARTIMIS (see Operational and Safety Considerations). ODOT and the FHWA granted
permission for Cincinnati to conduct the pilot BOS project (Metro’s I-71…, 2008).
Miami, FL
The primary players involved in BOS implementation in Miami include: Miami–Dade Transit,
the Miami– Dade Expressway Authority, and the Florida DOT. Legislation to legalize bus-use
of shoulders passed in Miami in 2005 before their pilot project began. The pilot project could of
course have been implemented without this legislation, but the statutes would be necessary for
long-term usage. An Interlocal Agreement between Miami-Dade transit and District 6 of the
Florida DOT was created to authorize the three-year pilot program (Martin, 2007).
Fairfax County, VA
An agreement between VDOT and Fairfax County outlines the legal function of the bus shoulder
lane. VDOT in turn gained approval for the project from the FHWA (Martin, 2006).
1.6 RESULTS OF BOS SYSTEMS
Minneapolis / St. Paul, MN
Over the 23 years of BOS existence in the Twin Cities, very few accidents have occurred.
Between 1992 and 2001 only 20 accidents occurred on the shoulder involving a bus, all-resulting
only in property damage. These accidents were characterized by minor scrapes or mirror
damage. After 2001, one accident occurred on a shoulder that resulted in a fatality. The bus
driver was ruled not to be at fault as an auto drove into the bus (Douma, 2007). Drivers have
reported no conflicts with stalled vehicles in the shoulders or with emergency vehicles (Douma,
2006).
The implementation of BOS corridors in the Twin Cities is vastly regarded as a huge
success and has resulted in many economic benefits. Transit ridership has increased while transit
operational costs have decreased. More predictable bus scheduling is attractive to riders and
results in less over-time for drivers. Often, the time saved by a bus using a shoulder during
congestion is minimal, but the perception of time saved by the rider is substantial. Rider time
savings has benefited transit providers. For example, Maple Grove Transit was able to eliminate
90% of their marketing budget once they were allowed to use shoulders. Apparently, a bus being
able to speed past congested traffic is advertising enough to fill buses already in service and new
ones. Part of the success of the BOS system is the availability of park-and-rides. Today,
Minnesota will not fund a park-and-ride of less than 200 parking stalls. The larger park-and-
rides appeal to more people as they generally offer more and better services (Douma, 2007).
Responses to BOS have been overwhelmingly positive from both bus drivers and bus
riders. Cases have been reported in which “jealous” drivers straddle the right lane and the right

11
shoulder so that bus drivers cannot pass. Though annoying to bus drivers, this occurrence does
not pose much of a safety threat (Douma, 2007).
San Diego, CA
One of the goals of San Diego’s BOS pilot project was to assess safety, bus travel time and
reliability, bus and auto driver and bus passenger perceptions of bus-only-shoulders,
maintenance, and necessary physical improvements to shoulders for long-term use. Six months
into the two-year pilot project, no accidents had occurred. There were also no issues related to
enforcement or Caltrans maintenance of the shoulders. Buses on Route 960 boasted that they
were on-time 99% of the time, saving up to five minutes of travel time when congestion was
heavy. Other traffic on the freeway seemed not to be affected by buses on shoulders. The
project led to the conclusion that 10 ft. shoulders were optimal for buses; narrower shoulders
resulted in slower service. Finally, Bus drivers and passengers exhibited positive responses to
buses on shoulders and drivers felt that operations were safe and a good idea. Passengers, too,
felt safe and that time savings were significant (Martin, 2007).
Ohio
The Columbus BOS system is supported by bus riders who like the feeling of beating traffic.
Instances of vehicles other than buses using the shoulders have been rare (Hollander, 2008). In
Cincinnati, at the end of the BOS pilot project’s year long duration, no BOS-related accidents
had occurred. Additionally, no problems were reported with buses merging back into traffic.
This is highly significant for the first usage of the left shoulder for a BOS project. Bus routes
71X and 72 were reported to use the bus-only-shoulder on about 21% of trips made along the
BOS corridor. An overwhelming positive response to BOS has come from surveyed bus riders.
About 99% of the surveyed felt safe on the shoulder and that their travel time had been reduced.
Nearly the same percentage would recommend bus usage to others as a result of using the BOS
system (Metro’s I-71…, 2008). Due to the successes of the pilot project, ODOT approved
Cincinnati’s decision to make their BOS system permanent in August 2008 (O.D.O.T. Agrees…,
2008).
Miami, FL
In Miami, after just a few months of operation, late buses were reduced by 50%. In addition, no
accidents had been reported since the program began. A study determined that the weight of the
buses did not have a negative impact on pavement and after six months, there was no adverse
impact to shoulder, drainage culverts, or pavement. The drivers and riders in Miami are largely
satisfied with buses on shoulders, though drivers would like wider lanes. Their largest problem
thus far has been with drivers not allowing buses to merge back into traffic (Guerra, 2008).
Fairfax County, VA
Initial problems with enforcement caused very stringent regulations to be written on shoulder
usage. Riders are thrilled with bus schedule reliability (Martin, 2006).

12
1.7 CHOOSING CORRIDORS FOR BOS
The concept of bus usage of shoulders is a low-cost solution for relieving buses from the
pressures of traffic congestion. Because cost is a constraint, BOS cannot be implemented just
anywhere. Only corridors with high levels of bus usage and significant peak period congestion
would result in enough benefits to bus riders to warrant costs. Minor improvements to shoulders
can be made to accommodate buses, but most of the elements required for bus usage must be in
place at the start to make projects non cost-prohibitive. Table 1.2 shows a cost break-down for
Minnesota roadway conversion to BOS. In the ideal case, a corridor would only need
appropriate signage to implement BOS.
Many cities that have implemented BOS developed a list of criteria for choosing potential
BOS corridors. In Minnesota this list is as follows [Mn/DOT]:
o There must be predictable congestion delays, meaning the traffic running speed
must be less than 35 mph during the peak period and/or approaches to
intersections have continuous backups.
o Congestion delays must occur one or more days per week.
o A minimum of six transit buses per day must use the proposed bus shoulder.
o The expected time savings of using the shoulder must be greater than eight
minutes per mile per week.
o The proposed shoulder must have a continuous shoulder width of at least 10 feet.
TABLE 1.2 Minnesota/ Twin Cities Cost Break-Down (Douma, 2007).
Miami is more likely to choose a corridor for BOS that is already planned for corridor
improvements in hopes that any upgrades to the shoulder can be combined with other
construction to reduce overall costs. Ideal corridors should also have potential for park and ride
locations and continuous shoulder segments of at least 2,500 ft. between merge locations
(Guerra, 2008).

13
Sometimes no viable corridors are identified in a city. In 2007, Marin County, California
completed a potential BOS corridor study. The California Highway Patrol expressed concern
about the legality of BOS and the cost of the physical upgrades necessary for implementation.
Though these concerns may not be prohibitive, they have certainly caused delay for beginning
BOS operations in Marin County (Martin, 2007).
1.8 IMPLICATIONS FOR AUSTIN, TX
Those considering implementing BOS corridors in Austin, TX must have concerns about the
effectiveness of BOS, safety for buses and other vehicles, loss of intended shoulder function,
legal basis, and costs. These concerns have been addressed by successful examples of BOS in
other cities. The proposed bus usage of shoulders in Austin is intended as an interim measure to
bypass freeway congestion until managed lanes can be built according to the CAMPO 2030 plan.
Several BOS systems have this purpose including those in San Diego, Miami, and Ohio. After
ten years of operation, the Twin Cities’ system is more of a permanent fixture, but its long-term
success is still a great example for Austin from a physical and operational standpoint. The queue
jumper BOS in Fairfax County, Virginia is an example of how BOS can be used to bypass
congestion at interchanges. This may be a technique worth exploring for congested interchanges
in Austin. From a bus rider’s perspective, bus usage of shoulders has certainly been successful
in these cities in terms of time savings and trip reliability; both ridership and schedule reliability
have increased. Though rider perceived time savings is generally much greater than their actual
time savings, perception is what counts in mode choice.
Safety was a prime concern for parties involved in the implementation of BOS in other
cities, as well. Low accident histories indicate that the safety precautions used in Minnesota,
California, Ohio, Florida, and Virginia were adequate to ensure the safety of buses and other
vehicles. Speed limits of 25 to 35 mph combined with a maximum differential speed with
mainline traffic of 10 to 15 mph are comfortable for both bus and vehicle drivers. Low speeds
allow all drivers adequate time to respond to any conflicts. A key component of safety for bus
usage of shoulders is that if the driver is not comfortable driving on the shoulder, he or she never
has to. Training and experience help drivers to become more confident driving on the shoulder.
Adequate signage and pavement markings are also important elements to ensure safety on BOS
corridors. Signage and pavement markings help alert mainline traffic to the presence of buses,
especially on ramps as they enter freeways where buses may be on the shoulder. Signs should be
placed well in advance of remerge points so buses have enough time to maneuver back into
traffic. Law enforcement is important to ensure that buses obey speed limits and that un-
authorized vehicles do not use bus lanes.
Reducing the number of conflicts for bus drivers on shoulders can be handled by
choosing the correct shoulder to implement BOS. The right shoulder, most commonly used,
allows buses greater freedom to exit and enter the freeway but creates more conflict points at
ramps and intersections in terms of weaving. When the right shoulder is used, bus drivers are
instructed to use caution and yield to other vehicles. In some cases when weaving volume is
particularly high, buses can be required to merge back into mainline traffic. At low speeds
merging back into traffic does not seem to be an issue. Vehicles in main lanes are required to
yield to buses attempting to merge. If buses are not required to exit the freeway very often over
the course of a BOS corridor, use of the left shoulder can greatly reduce conflict points.

14
Reaching the left shoulder, however, can be somewhat more difficult for bus drivers. The left
shoulder was used for BOS in Cincinnati in 2007 and for San Diego’s BOS extension on I-805 in
2009. There is very little quantitative data on the success of using the left shoulder, but
Cincinnati has not reported any hardships with buses merging through mainline traffic.
Adequate structural components can help to alleviate safety issues, as well. Shoulder
widths of 10 ft. are generally sufficient for buses to maintain speeds of 35 mph on shoulders; less
than 10 ft. causes a speed reduction. Shoulders greater than 10 ft. in width are more desirable,
especially on bridges where drivers can become nervous driving very close to railings. Wider
shoulders reduce the impact that buses have on adjacent lane motorists. Shoulder slopes of no
more than 2% are important for rider comfort. A reduction in slope, however, must be
accompanied with adequate drainage and debris removal so that ponding and other obstructions
do not hinder bus usage of shoulders. Short term bus use of shoulders should not result in
damage to shoulder pavements, but over time, pavement should be updated to full depth.
The intended use of shoulders along freeways is to provide shelter for disabled vehicles
and access for emergency vehicles. Bus usage of shoulders should not inhibit the shoulder’s
intended use. Disabled vehicles can be encouraged to exit the freeway, but buses should merge
back into traffic to maneuver around those that cannot. Buses should always yield the shoulder
to emergency vehicles. In general, bus usage of shoulders operates the same way whether
congestion arises from peak period traffic or incidents. However, if emergency vehicles need to
occupy the shoulder in the case of an incident, buses merge back into the main lanes.
To implement BOS, cooperation between involved parties including transit agencies,
DOTs, MPOs, and law enforcement is essential. Instituting BOS as a pilot project or an interim
measure is an easier task legally, requiring only permission and approval from state DOTs and
the FHWA. For long-term implementation, state vehicle codes and statutes need to be amended
for bus use of shoulders.
1.9 BOS SYSTEM RECOMMENDATIONS FOR AUSTIN, TX
Based upon the significant BOS experience documented in the previous sections,
recommendations for an Austin pilot test are listed below:
1. All BOS shoulders be at least 10 ft. in width and have adequate pavement depth to
support bus usage,
2. Buses use the right shoulder and continuous shoulder segments be at least 2,500 ft. (buses
will utilize auxiliary lanes when present instead of shoulders),
3. Buses not exceed 35 mph on the shoulder or 15 mph faster than traffic in the main lanes,
4. BOS signs be placed on ramps and along BOS corridors,
5. Bus operators be trained properly for BOS and only use the shoulder if comfortable doing
so,
6. Buses yield to emergency vehicles or stalled vehicles stopped on the shoulder,
7. At least six buses travel along the corridor per day,
8. A BOS corridor needs no structural improvements to the shoulder and minimal restriping,
9. Texas Transportation Code should be updated to allow a BOS Pilot Program.

15
1.10 BUS DRIVER TRAINING
The pioneers of BOS systems are the Minnesota Department of Transportation and MetroTransit.
Their system has been used as an example by many other cities. MetroTransit supplies a training
manual, route pamphlets, and safety pamphlets to the bus drivers. Drivers participate in class-
room instruction including a training video as well as on-board training. The major point that is
stressed through all the resources is slow equals safe. The training is the responsibility of the
transit authority. There is no mandate that dictates the specifics of a driver training program.
The extensiveness of a training program is determined by the authority and the bus drivers.
There is no enforcement program in Minnesota specifically focusing on BOS drivers. If there
are any general problems associated with a driver, they are handled by a garage supervisor. The
bus drivers understand that their job depends on operating a bus safely and efficiently.
Safety based evaluations of the Minnesota bus driver training program indicate that it has
been successful since accident reports from Minnesota show an excellent safety record. For
example, in the first 9 years of operation, the State Patrol only reported 20 crashes involving a
bus traveling along a shoulder. All 20 crashes were property damage only. Today there are over
300 miles of BOS guide way in Minnesota, and there has been only one injury crash.

16
CHAPTER 2 CENTRAL TEXAS CASE STUDY
The review of experiences with Bus-on-Shoulder systems revealed key best practices in design
and operations. For a section of freeway to be viable for BOS it must have a shoulder at least 10
ft. in width, experience peak hour speeds of less than 35 mph, serve at least six buses per day,
and be at least 2500 ft. in length. Using these constraints, in 2008, a Central Texas Case study
was done on six freeway corridors in Austin, TX including:
IH-35 NB and SB between Slaughter Ln and Howard Ln
Loop 1 (MoPac Expressway) NB and SB between Loop 360 (south of the CBD) and
Braker Ln
US-183 (Research Blvd) EB and WB between IH-35 and SH-45
Seven years later, in 2015, sections of IH-35 and US-183 are likely still viable for BOS
operations, however, Loop 1 is currently undergoing modifications to provide toll lanes and
other cross-sectional changes. Therefore, in this update to the 2008 examination, Loop 1 has
been removed from consideration for BOS operations.
This 2015 analysis indicates several sections of both IH-35 and US-183 could be appropriate for
BOS implementation at low cost with minimal or no lane re-striping. Each of the sections were
subsequently modeled in CORSIM to demonstrate the benefits of a BOS system in terms of bus
time savings and the impact of BOS on regular traffic.
2.1 DATA COLLECTION
In order to assess the viability of IH-35 and US 183 for BOS implementation, roadway
geometry, bus volumes, and average vehicle speeds were collected. Operating speed data were
collected during late November and early December 2014 by driving the study sections multiple
times during AM and PM peak periods. Data were collected per section of roadway divided by
ramps, thus the point of the gore area for each entrance and exit ramp was denoted as section
beginning or ending points. The Appendix contains synthesized tables of all the data collected
for each corridor.
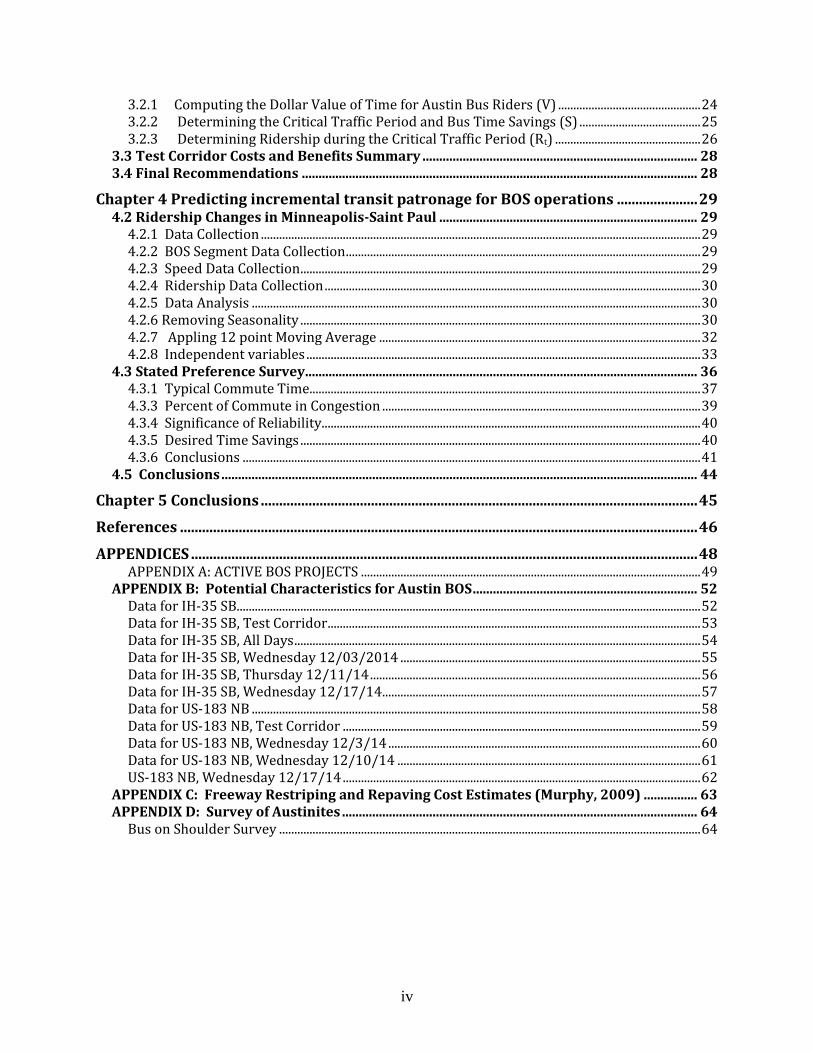
2.1.1 Roadway Geometry
For each section several pieces of geometric data were gathered. This includes the number of
thru lanes, lane width, presence of an auxiliary lane, auxiliary lane width, left shoulder width,
right shoulder width, and section length. The data was gathered using aerial images from Google
Earth in conjunction with Google Earth’s measuring tool (see Figure 2.1). Though CAPCOG’s
Aerial photos were not of a resolution high enough to measure distances on the order of a few
feet, the photos were used to verify field observed characteristics gathered with windshield
surveys. The error for lane widths is on the order of +/- 1 ft. and for section lengths on the order
of +/- 5 ft.
17
Bus Volumes
To find the bus volumes in each section, the different routes that travel in each of the three
corridors were evaluated. The route map and route schedule, obtained from the Capital Metro
website, were used to find the number of buses that travel on each segment of each corridor.
Only weekday routes were evaluated. The number of buses that travel each route all day and
during the AM and PM peak periods was calculated. The AM peak period used was roughly
from 7:00 am to 9:00 am. The PM peak period used was roughly from 4:30 pm to 6:30 pm. It is
important to note that the University of Texas Shuttle Routes does not follow a set schedule.
Their frequency is an estimated time interval. Therefore, the minimum number of buses for
these routes was used in the calculations for total number of buses in each section.
Average Vehicle Speeds
Average vehicle speeds were determined for each section by timing how long it took to drive the
section during both AM and PM peak hours. Using the drive time and section length, average
speeds were calculated. Each corridor was driven multiple times in order to verify consistency
of speeds.
FIGURE 2.1 Sections were measured between ramps designated by the tip of the gore area
(Google Earth, 2003).

18
2.2 CORRIDOR SELECTION
Each corridor was analyzed to determine which sections met the criteria needed for BOS.
These criteria include bus volumes of at least six vehicles per day, average peak hour speeds less
than 35 mph, and continuous shoulder width 10 ft. or more for sections of no less than 2500 ft. in
length. Tables for each corridor with all the collected data are located in the APPENDIX.
2.2.1 IH-35 Northbound
Forty-two sections of IH-35 NB were analyzed as part of the 2008 initial BOS study. These
sections included the path from Slaughter Ln north to the exit for Howard Ln, a total of about 20
miles. Based upon that analysis, the shoulder widths and pavement quality for the IH-35 NB
sections were found to be very inconsistent along the 20 mile length. Therefore IH-35 NB was
not chosen as a recommended pilot test section and since 2008, no significant geometric changes
were made to these sections. Updated travel speed and other data were not collected for the IH-
35 NB sections.
2.2.2 IH-35 Southbound
Forty sections of IH-35 SB were analyzed, from the exit for Howard Ln to the exit for Slaughter
Ln (see Table 2.1). These sections also comprise about 20 miles of the corridor. The Bus
Routes columns of Table 2.1 show that from the Howard Ln on-ramp to the Riverside Dr exit
there are enough buses per day to meet the six bus minimum. Like the IH-35 NB corridor, the
heaviest traveled section is from 15th/MLK to Riverside Drive due to the University of Texas
shuttle bus routes.

19
TABLE 2.1 Geometry, Speeds and Bus Data for IH-35 SB.
In the AM peak, speeds drop below 35 mph after traffic from US-183 merges onto IH-35.
Low speeds are maintained until the exit for MLK/15th St. In the PM peak, speeds fall below 35
mph at about 51st St and stay low until the exit for Woodward St.
Many sections have right shoulders of 10 ft. or greater, but just as many do not. Again, in
most cases redistributing space on the left shoulder to the right shoulder by restriping could
result in a 12 ft. shoulder, except for three sections. These include a portion of the elevated
section, a portion of the section after the exit for Cesar Chavez, and a portion of the section after

20
the exit for Riverside Dr. In all of these cases it would be extremely difficult to obtain a 12 ft.
right shoulder, even by reducing main lane width.
2.2.3 US-183 Northbound
Twenty-two sections composing about 11.5 miles of US-183 NB were analyzed from the on-
ramp from IH-35 to the exit for SH-45 (see Table 2.2). US-183 is highly traveled by Capital
Metro buses, most of which are flyer and express buses. The entire stretch of the study area
meets the minimum six buses per day. The total number of buses per day on US-183 NB ranges
from 2 to 23.
TABLE 2.2 Geometry, Speeds and Bus Data for US-183 NB.
In the AM peak, there is little to no congestion on the corridor and speeds never fall
below 35 mph. In the PM peak, bottlenecks develop due to reductions in the number of thru
lanes and speeds of less than 35 mph are typical from the exit for Burnet Rd to the exit for Duval
Rd.
The geometry on US-183 is excellent. All right shoulders and most left shoulders are
between 8 and 10 ft. Re-striping could result in 10 ft. right shoulders through the entire length of
the corridor.

21
2.2.4 US-183 Southbound
Twenty-five sections (about 13 miles) of US-183 SB were analyzed from the on-ramp from SH-
45 to the exit for IH-35 as part of the 2008 BOS study. In the AM peak, speeds below 35 mph
were sporadic and inconsistent. In the PM peak, speeds rarely fall below 35 mph on US-183 SB.
Geometry on US-183 SB is excellent. Almost all the right shoulders have widths of 10 ft. or
more and the few with 8 or 9 ft. could be increased by re-striping. Like US-183 NB, the SB
corridor meets the six buses per day minimum. The total number of buses on US-183 NB range
from 2 to 27. Based on the observed speeds SB US-183 was not chosen as an ideal location for
pilot BOS testing.
2.3 CHOSEN CANDIDATES FOR BOS AND CORRIDOR MODELING
Two sections were considered exemplary candidates for BOS pilot testing. These include IH-35
SB from the US 183 exit to the start of the elevated IH 35 section and US-183 NB from the
Burnet Rd exit to the Duval exit. These sections were chosen primarily based on ease of
implementation.
2.3.1 US-183 Northbound from Burnet Road Exit to Duval Exit
A 4.94-mi section of US-183 NB was modeled consisting of 9 sections (see Table 2.3). Speeds
drop below 35 mph on these sections during the PM peak and all but one section has 9 or 10 ft.
right shoulder widths making implementation economical.
TABLE 2.3 US-183 NB Test Corridor Geometry, Speeds and Bus Data.

22
2.3.2 IH-35 Southbound from US-183 exit to the start of the IH-35 elevated section
This 3.78 mile section of IH-35 typically has speeds less than 35 mph during AM peak times and
six of the ten segments have right shoulder widths equal to or greater than 10 ft. Due to the
variability in shoulder widths it is somewhat less desirable as a pilot test section compared to the
chosen US-183 section. However, since BOS lanes can begin or end at any chosen entry or exit
ramp, the sections with right shoulder widths less than 10 ft. could be excluded from the pilot
test if desired.
TABLE 2.4 IH-35 SB Test Corridor Geometry, Speeds and Bus Data.
2.4 FINAL RECOMMENDATIONS
The two chosen BOS pilot testing candidates can be ranked in order of preference based on ease
of implementation and impact on bus speeds. The rankings are as follows:
1. US-183 NB: On-Ramp before Ohlen Road Exit to Spicewood Sp. Exit (7.17 mi)
2. IH-35 SB: On-Ramp before Braker Lane Exit to 15th St, MLK Exit (9.00 mi)

23
CHAPTER 3 BENEFIT AND COST EVALUATION
An ideal corridor for a BOS pilot study is a corridor that requires minimal capital cost and
will provide high time savings benefits. A benefit-cost analysis evaluation was performed for
the two recommended pilot test sites:
1. US-183 NB: On-Ramp before Ohlen Road Exit to Spicewood Sp. Exit (7.17 mi)
2. IH-35 SB: On-Ramp before Braker Lane Exit to 15th St, MLK Exit (9.00 mi)
3.1 CAPITAL COSTS FOR BOS IMPLEMENTATION
Implementation of a BOS system can involve costs that could include roadway structural
improvements, signage, re-striping, enforcement, advertising, and driver training. An ideal test
corridor will have minimal implementation costs so cost is a criterion for pilot test sites.
For the evaluation of these corridors, costs associated with enforcement, advertising, and
driver training were considered negligible. The cost of signing was set equal to the signage costs
reported by Minneapolis, $1,500 per mile. The cost of structural improvements and re-stripping
were evaluated by Dr. Mike Murphy, Research Engineer at The University of Texas Center for
Transportation Research (CTR) and retired TxDOT pavement engineer. The cost of lane re-
striping in Austin depends on pavement type, therefore IH-35 and US-183 will have varying
costs associated with re-striping and re-paving. The pavements on IH-35 are primarily hot mix
asphalt concrete over crushed granular base, however, since US-183 is much newer than IH-35,
all pavement is Continuously Reinforced Concrete Pavement (CRCP). When freeways are re-
striped, in order to leave clean new lines and remove the shadows of the old lines, they are often
overlaid as well. It is unlikely that IH-35 would be re-striped without being re-paved. Because
US-183 is a new freeway with concrete pavement, re-striping would be considered without re-
paving (Murphy, 2009).
Table 3.1 shows cost estimates for restriping and repaving IH-35, and US-183. A
detailed description of how these costs were determined is included in Appendix C. Cost
estimates are in terms of dollars per lane mile for a typical cross-section of each freeway.
Because the cross-section of a freeway can change, a multiplying factor was applied in the cost
calculations to account for any deviations. Also, because these freeways experience high traffic
volumes, restriping and repaving would have to be accomplished at night. A multiplier factor for
night construction was also applied to the cost estimates (Murphy, 2009).
TABLE 3.1 Cost Estimates for Re-striping and Re-paving.
Corridor
Re-Striping
Costs ($ per lane
mile)
Re-Paving Costs
($ per lane mile)
IH-35 $12,620.00 $401,166.67
US-183 $12,624.25 N/A
The costs of re-striping and especially re-paving a freeway section are extremely high compared
to the costs of BOS signage. For this reason, no test corridors were chosen for a pilot study that
would require physical alterations. The test corridors and the required implementation costs are

24
shown in Table 3.2. Bus access to shoulder lanes can be interrupted along the length of any
section as buses leave and re-enter main lanes as they cross entry or exit traffic streams.
Therefore, particularly along the IH-35 section, the BOS lanes could be provided only on those
sections with currently adequate shoulder widths. The most economical way to widen a shoulder
less than 10 ft. in width would be to move the edge of pavement line inward and decrease the
width of the right-most lane. This method should only be considered if one can show that
narrowing the right-most lane would not interfere with freeway performance.
TABLE 3.2 Cost Estimates for Implementation.
Test Corridor Miles Signage
Costs
IH-35 SB: Braker Exit to IH-35 split 9.00 $5,670
US-183 NB: Ohlen Exit to Duval Exit 7.17 $5,775
3.2 BENEFITS
The economic benefits of a BOS corridor are derived from the monetary value of the time
saved due to BOS. Time savings can be quantified by using the following equation:
𝑅𝑖𝑑𝑒𝑟 𝑆𝑎𝑣𝑖𝑛𝑔𝑠 ($/𝐷𝑎𝑦) = 𝑅𝑡 × 𝐷 × 𝑆 × 𝑉
Where: Rt = Daily bus ridership during the critical traffic period, t
D =Distance traveled by each bus route on each corridor
S = Bus time savings in minutes/mile
V =Dollar value of time
The critical traffic period is the time for which speeds on a corridor are less than 35 mph and
these times were identified by driving the paths and measuring travel speeds and travel times
during November and December 2014.
3.2.1 Computing the Dollar Value of Time for Austin Bus Riders (V)
There are several widely used methods for determining the dollar value of time. The two used in
this report divide the median per capita income by a time value. Two different time values were
used. The first conservative method is to divide median personal income by the total number of
hours in the year (8,760). The second, a more non-conservative method, is to divide median
personal income by the number of working hours in a year (2,080 hrs.).
Transit riders in Austin primarily live in three counties: Travis, Williamson, and Hays Counties.
The United States Census Bureau provides the 2013 per capita income for each of these counties
(Census, 2013). A weighted average was calculated of these three incomes based on their 2013
populations (see Table 3.3)

25
TABLE 3.3 Average per Capita Income for Region.
County
Per Capita income in
past 12 months (2013
dollars)
Population, 2013
Estimate
% of Total
Population
Weighted
Average Income
Travis $33,206 1,122,748 63.42% $21,057.83
Williamson $31,070 471,225 26.62% $8,269.60
Hays $26,873 176,483 9.97% $2,678.76
Sum 1,770,456 $32,006.19
The dollar per hour value when dividing per capita income by the total number of hours in a year
is:
hrhrshr
/65.3$8760
006,32$$
The dollar per hour value when dividing per capita income by the total number of working hours
in a year is:
hrhrshr
/39.15$2080
006,32$$
Both of these dollar values of time were used to calculate benefits. A great deal of Austin bus
users are students without an income. The more conservative value ($3.65/hr.) would be a more
accurate assessment of corridors with high student ridership.
A third value of time is also used in the following calculations. The Texas Transportation
Institute (TTI) recommends a value of time $16.79 per hour in their 2012 Urban Mobility
Report. While the above values of time will be used in calculations, the standard $16.79 will be
used to rank the test corridors.
3.2.2 Determining the Critical Traffic Period and Bus Time Savings (S)
Assuming the pilot BOS sections would use a protocol that permits bus use of BOS lanes
only when main lane speeds are less than 35 mph, one must estimate how many hours per day
speeds will be less than 35 mph to determine how many hours buses could use the lanes. Based
upon the driving test runs performed during November and December 2014, a best case estimate
of daily two hour duration of speeds less than 35 mph is estimated for both pilot test sections.
This estimated two hour duration, during the AM peak for southbound IH-35, and during the PM
peak for Northbound US 183, is conservative because it does not include longer durations
induced by traffic crashes or more general traffic incidents. Crashes, or incidents of some type,
are rather routine occurrences for both test sections and effects of these events are often long
lasting but the estimated typical two hours of speeds less than 35 mph does not include these
effects.
Tables 3.4 and 3.5 describe the average speeds used to determine the critical traffic period. The
potential min/mile time savings on IH-35 SB and US-183 NB is given for buses.

26
TABLE 3.4 IH-35 SB Calculations of Peak Period Length and Min/Mile Time Savings
(December 2014).
For IH-35 SB, speeds of less than 35 mph were experienced by drivers for 31 minutes. The
average time savings along this corridor that a bus on a bus-only-shoulder would experience is
1.98 minutes/mile.
TABLE 3.5 US-183 NB Calculations of Peak Period Length and Min/Mile Time Savings
(December 2014).
US-183 NB shows drivers experiencing speeds of less than 35 mph for 20 minutes. The critical
traffic period of US-183 NB is from 4:00 PM to 6:30 PM, and the average time savings is 1.65
minutes per mile. The critical traffic period of IH 35 SB is from 6:00 AM to 8:30 AM, and due
to slower congestion speeds than US-183, the average time savings could be as much as 5
minutes per mile.
3.2.3 Determining Ridership during the Critical Traffic Period (Rt)
Vehicle ridership data was obtained from Capital Metro to calculate the daily bus ridership
during the critical traffic period. The data included the boarding, alighting, and maximum loads
for major stops along each route (Capital Metro, 2015). The maximum load between two major
stops was assumed to occur while the bus traveled along a test corridor. The time at which the

27
bus travels along a test corridor is needed to find the ridership during the critical traffic period.
Since times associated with the data only state the point at which a bus is at a major stop, the
information was used to find when each bus was actually on the test corridor. The ridership for
each trip was averaged to find the mean of the ridership for each trip on each route. The
ridership of the trips that occurred during the critical traffic period was summed to find the daily
bus ridership during the critical traffic period (see Table 3.6).
TABLE 3.6 IH-35 SB Ridership and Projected Daily Time Savings.
Route
# Riders
During
Critical
Traffic
Period
Miles
Traveled
on Test
Corridor
Time
Savings
(min/mile)
Time
Savings
(min per
rider)
Total
Time
Savings
(min/day)
142 40 6.7 1.98 13.27 530.64
935 185 9 1.98 17.82 3296.70
985 47 5.27 1.98 10.43 490.43
Sum 272 4,317.77
There are three bus routes (one flyer shuttle and two express routes) that travel along the IH-35
SB test corridor during the assumed critical traffic period, 6:00 AM to 8:30 AM. Table 3.6
shows routes, ridership, and distance traveled on the IH-35 SB corridor. It also shows the
calculated time savings for each route and the total corridor. For example, the flyer shuttle route
142 travels about 6.7 miles on the test corridor and saves nearly 1.98 minutes a mile. The time
savings acquired through this route was approximately 13.27 minutes per rider. The number of
riders during the critical period on average is 40 giving a total time savings for the flyer shuttle
route 142 of 530.64 minutes a day.
Considering the frequency of the shuttle headways in the morning, it is likely that shuttle
ridership would dramatically increase the total number of bus riders on the test corridor. A bus-
on-shoulder system along this corridor could provide nearly 4,317.77 minutes of time savings to
bus riders each day.
TABLE 3.7 US-183 NB Ridership and Projected Daily Time Savings.
Route
# Riders
During
Critical
Traffic
Period
Miles
Traveled
on Test
Corridor
Time
Savings
(min/mile)
Time
Savings
(min per
rider)
Total
Time
Savings
(min/day)
982 226 0.78 1.65 1.29 290.86
983 33 2.25 1.65 3.71 122.51
985 49 7.17 1.65 11.83 579.69
987 104 4.34 1.65 7.16 744.74
Sum 412 1,737.81
Four express bus routes travel along the US-183 NB test corridor each afternoon during
the critical traffic period, 4:00 PM to 6:30 PM: 982, 983, 985, 987. Table 3.7 shows the average

28
number of riders per route during the critical traffic period each afternoon. The express route
982 travels about 0.78 miles on the test corridor saving nearly 1.65 minutes a mile. The time
savings along this path is approximately 1.29 minutes per rider. With an average of 226 riders
during the critical period, this active express route provides a total time savings of 290.86
minutes a day. A bus-on-shoulder system could provide a total of 1,737.81 minutes of time
savings to bus riders each day.
3.3 TEST CORRIDOR COSTS AND BENEFITS SUMMARY
With all the information provided, BOS costs and benefits can finally be compared. Table 3.8
shows both costs and economic benefits in terms of time savings for both the conservative and
non-conservative values of time that were previously described. The last column displays the
number of days it would take for BOS costs to equal benefits.
TABLE 3.8 Comparison of Costs and Benefits.
Test
Corridor
Capital
Costs
(Signage
Only)
Benefits
Value of
Time
$/hr
(per rider)
Daily Time
Savings
(min/day)
Rider
Benefits $/
Day
$/Year (255
Days/Year)
Costs =
Benefits
(# Week
Days)
1. IH-35 SB $5,670 Cons 3.65 4317.8 $262.66 $66,979.35 21.59
Non-Cons 15.36 4317.8 $1,105.35 $281,863.78 5.13
3. US-183 NB $5,775 Cons 3.65 1737.8 $105.72 $26,957.82 54.63
Non-Cons 15.36 1737.8 $444.88 $113,444.43 12.98
3.4 FINAL RECOMMENDATIONS
When costs were compared to benefits the IH-35 SB pilot test section seems to be slightly less
costly and only slightly more beneficial than US-183 NB. The corridors therefore are ranked for
recommendation for a BOS pilot program in the following order:
1. US-183 NB: On-Ramp before Ohlen Road Exit to Spicewood Sp. Exit (7.17 mi)
2. IH-35 SB: On-Ramp before Braker Lane Exit to 15th St, MLK Exit (9.00 mi)

29
CHAPTER 4 PREDICTING INCREMENTAL TRANSIT PATRONAGE
FOR BOS OPERATIONS
4.1 INTRODUCTION
One of the objectives of BOS implementation in other cities has included attracting
additional riders to the transit routes demonstrating reduced travel times. This section will look at
how BOS can affect transit ridership and includes 5 sub-sections. Sub-section 4.2 looks at
ridership data from the Minneapolis-Saint Paul Metropolitan area. The long history of BOS in
the Twin Cities allows a clear depiction of the effect BOS on ridership. Before and after
ridership data was used to determine the incremental effect of BOS and what factors determine
this change. Ridership data contains inherent time-wise patterns that were removed to help
isolate and separate the effect of BOS from other influences.
To determine how Austinites would receive BOS, a stated preference survey was
administered in Austin, Texas. The survey was administration via the WEB and targeted groups
that would provide cross-sections of the potential rider population. The conclusions from the
survey are discussed in Sub-section 4.4. The survey was able to gage the reaction Austinites
would have to a BOS system and what benefits they would expect. Conclusions from Sub-
Section 4.2 were applied to known ridership data from Austin, Texas to determine possible
ridership changes if BOS was implemented in Austin.
4.2 RIDERSHIP CHANGES IN MINNEAPOLIS-SAINT PAUL
4.2.1 Data Collection
The analysis of the Minneapolis-Saint Paul ridership data was route based. The routes that were
used were determined from the assessment of three main data sets. First, information describing
the characteristics and location of each BOS section and when it opened was obtained from
MetroTransit. Second, speed data for all major corridors in the region was obtained from The
Minnesota Department of Transportation (MnDOT). Third, route specific ridership data was
obtained from two separate transit agencies in the Minneapolis-Saint Paul region.
4.2.2 BOS Segment Data Collection
Team Transit is an organization within the MnDOT, which is behind the success of BOS in the
Minneapolis-Saint Paul metropolitan region. A list of all BOS sections was obtained from Team
Transit along with the section lengths, when opened and, in the case of a few sections, when
closed. The BOS system in the Twin Cities is extremely extensive with over 300 miles. More
recently, the addition of BOS lanes has been a result of area freeway expansion. If possible
whenever a new freeway is being developed or reconditioned in the area it is built with the
intention of the shoulder being BOS accessible. Therefore many of the new sections are put in
areas that may not currently warrant BOS but will most likely in the future (Jensen, 2009).
4.2.3 Speed Data Collection
MnDOT has an extensive and advanced ITS system. MnDOT provides a program that can be
downloaded (via the WEB) which allows extraction of historical speed data from any sensor
installed on any of the Twin Cities freeways. The earliest available data for a majority of the
sensors is January 1994. The program allowed for data to be extract for any day and any time

30
bracket. For all BOS sections, data was extracted for extended morning (6:30-9:30am) and
evening (4:30-7:30pm) peak periods for every Tuesday, Wednesday and Thursday except for
Holidays. Holidays that fell in the middle of the week were New Year’s Day, July 4th,
Thanksgiving and Christmas. The entire week of Thanksgiving and the entire week between
Christmas and New Years were excluded from the analysis (Minnesota Department of
Transportation, 2009).
4.2.4 Ridership Data Collection
The locations of sensors as well as the years for which data was available were cross-referenced
with the location of BOS lanes from the supplied Team Transit BOS history. From the
combination of the locations of sensors and the locations of BOS lanes, specific corridors were
identified. From these corridors, historical route based data was requested from two transit
agencies in the Minneapolis-Saint Paul region. Metro Transit is the primary transit agency in the
area and operates the majority of routes through the area. There are a few minor agencies that
focus on commuter routes from the suburbs into the Twin Cities. One of these smaller agencies
is the Minnesota Valley Transit Authority (MVTA). The MVTA is based among five cities
south of the Minneapolis-Saint Paul metropolitan region and operates 22 routes (Abegg, 2009).
From these two transit agencies; route data was obtained for a majority of routes along North and
South I-35W, South I-35E, Highway 62 and Truck Highway 77.
For analysis, routes were required to have monthly ridership data starting at least two
years prior to the year BOS was implemented along the route. The two-year prior data
requirement limited usable routes; also, usable routes were limited because of problems
associated with the supplied data. In 2004, Metro Transit did major route restructuring on its
southern routes, as a result very few routes had ridership data prior to 2004. For the few routes
that did extend prior to 2004, the oldest data was from April 1996. The Metro Transit data was
also limited because monthly ridership numbers were not recorded for every month; monthly
ridership totals were only recorded for 2 or 4 months out of every year (Carlson, 2009). For the
Metro Transit ridership data to be usable, a 12-point moving average was applied to fill in the
missing monthly data. Fortunately, the data supplied by MVTA contained the monthly ridership
numbers for every month for every route. The earliest available data is from January 1991
(Abegg, 2009). Due to the higher quality of MVTA data, the majority of routes assessed were
MVTA commuter routes. A total of eighteen routes fit the criteria dictated by the constraints of
the three data sources.
4.2.5 Data Analysis
From the 18 routes identified by the process described in section 4.2, 42 data sets were created,
and each route was treated as a separate data point for each year of BOS lane implementation.
Therefore if a route had BOS lanes added in 1994 and 1996, then there would be two different
data sets, one for each initiation year. From these 42 data sets, 10 were removed due to data
irregularities discussed in this section.
4.2.6 Removing Seasonality
The primary goal of this effort was to find the incremental effect that incorporating a BOS lane
onto a corridor has on route ridership. It was determined that the best predictor for this would be
percent change in ridership. The data provided by Team Transit regarding when each BOS
section opened only stated the opening year, therefore the percent difference calculated was for
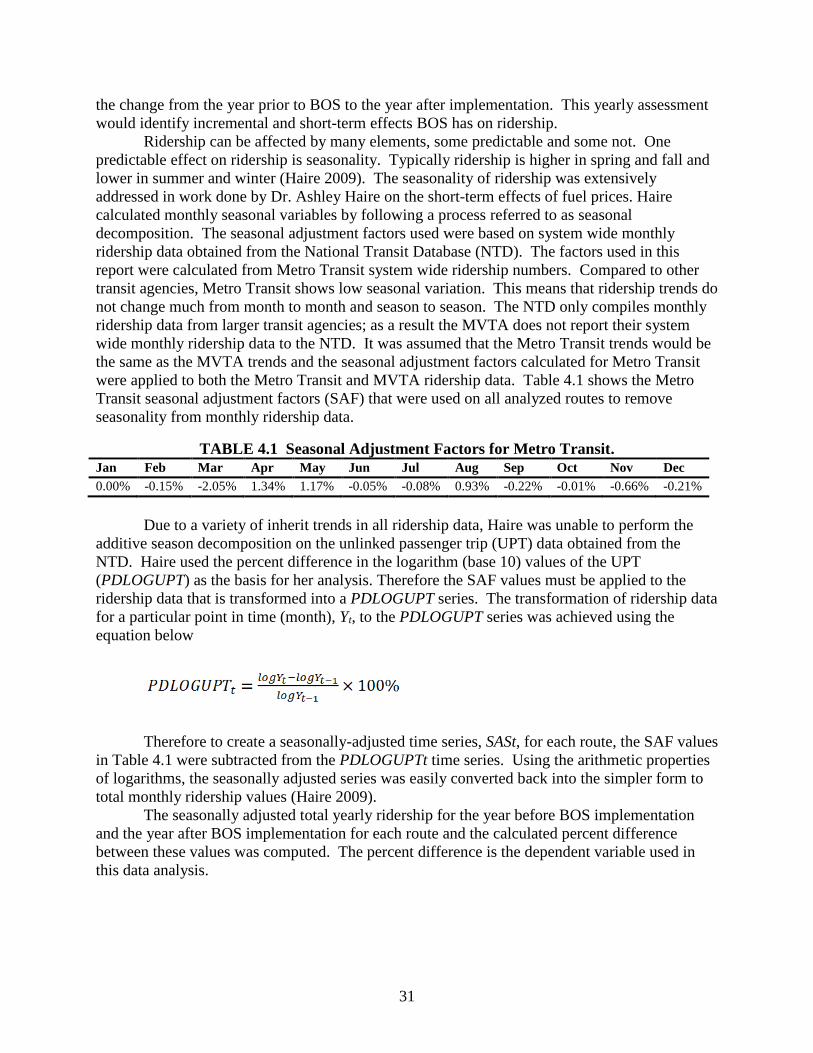
31
the change from the year prior to BOS to the year after implementation. This yearly assessment
would identify incremental and short-term effects BOS has on ridership.
Ridership can be affected by many elements, some predictable and some not. One
predictable effect on ridership is seasonality. Typically ridership is higher in spring and fall and
lower in summer and winter (Haire 2009). The seasonality of ridership was extensively
addressed in work done by Dr. Ashley Haire on the short-term effects of fuel prices. Haire
calculated monthly seasonal variables by following a process referred to as seasonal
decomposition. The seasonal adjustment factors used were based on system wide monthly
ridership data obtained from the National Transit Database (NTD). The factors used in this
report were calculated from Metro Transit system wide ridership numbers. Compared to other
transit agencies, Metro Transit shows low seasonal variation. This means that ridership trends do
not change much from month to month and season to season. The NTD only compiles monthly
ridership data from larger transit agencies; as a result the MVTA does not report their system
wide monthly ridership data to the NTD. It was assumed that the Metro Transit trends would be
the same as the MVTA trends and the seasonal adjustment factors calculated for Metro Transit
were applied to both the Metro Transit and MVTA ridership data. Table 4.1 shows the Metro
Transit seasonal adjustment factors (SAF) that were used on all analyzed routes to remove
seasonality from monthly ridership data.
TABLE 4.1 Seasonal Adjustment Factors for Metro Transit.
Jan Feb Mar Apr May Jun Jul Aug Sep Oct Nov Dec
0.00% -0.15% -2.05% 1.34% 1.17% -0.05% -0.08% 0.93% -0.22% -0.01% -0.66% -0.21%
Due to a variety of inherit trends in all ridership data, Haire was unable to perform the
additive season decomposition on the unlinked passenger trip (UPT) data obtained from the
NTD. Haire used the percent difference in the logarithm (base 10) values of the UPT
(PDLOGUPT) as the basis for her analysis. Therefore the SAF values must be applied to the
ridership data that is transformed into a PDLOGUPT series. The transformation of ridership data
for a particular point in time (month), Yt, to the PDLOGUPT series was achieved using the
equation below
Therefore to create a seasonally-adjusted time series, SASt, for each route, the SAF values
in Table 4.1 were subtracted from the PDLOGUPTt time series. Using the arithmetic properties
of logarithms, the seasonally adjusted series was easily converted back into the simpler form to
total monthly ridership values (Haire 2009).
The seasonally adjusted total yearly ridership for the year before BOS implementation
and the year after BOS implementation for each route and the calculated percent difference
between these values was computed. The percent difference is the dependent variable used in
this data analysis.

32
4.2.7 Appling 12 point Moving Average
From service changes to fare increases and also strikes, there are many factors that affect transit
ridership data. While two major strikes that occurred at Metro Transit were identified many
other factors were unidentifiable. To help reduce the effect of other external factors that affect
ridership, a 12-point moving average was applied to all 18 routes analyzed. The 12-point
moving average smoothed the data so that the effect due to BOS was much clearer. It also
helped to identify times of ridership change that were not due to BOS, but due to strong external
factors that could not be determined.
Figures 4.1 and 4.2 show MVTA route 464 versus time. Route 464 travels along IH-35W
from the southern suburbs into Minneapolis. Figure 4.1 depicts the ridership starting in January
1991. Both figures clearly show the smoothing effect of the 12-point moving average. BOS
sections along the 464 route opened in 1996 and in 2001. To better see the ridership increase in
1996, Figure 4.2 shows monthly ridership from 1995 through 1997. A clearly visible jump can
be seen near March of 1996. A jump like this one is not always visible each year a BOS lane
was added. This is most likely due to external factors. Figure 4.1 shows a peak around July of
2001. Although BOS was implemented along 464 in 2001, this peak is clearly not due to BOS
implementation but other factors that are unknown. Route data that showed strong irregular
behavior, like route 464 in 2001 was removed. A total of 8 data sets were removed, but is
important to note that only sets with strong irregular behavior were removed. There were other
sets where the data was most likely affected by external factors, but due to lack of information,
properly identifying these factors was impossible.
FIGURE 4.1 MVTA Route 464 Ridership from Jan 1991 to Oct 2008
0
1000
2000
3000
4000
5000
6000
Jun
-91
Ap
r-9
2
Feb
-93
Dec
-93
Oct
-94
Au
g-9
5
Jun
-96
Ap
r-9
7
Feb
-98
Dec
-98
Oct
-99
Au
g-0
0
Jun
-01
Ap
r-0
2
Feb
-03
Dec
-03
Oct
-04
Au
g-0
5
Jun
-06
Ap
r-0
7
Feb
-08
Dec
-08
Route 464
Original Data Moving Average

33
FIGURE 4.2 MVTA Route 464 Ridership from 1994 to 1998.
4.2.8 Independent variables
As previously stated a total of 32 data sets were compiled. Each data set was for a route during a
certain year of BOS implementation. Each data set incorporated the inbound and outbound
travel of that route. Therefore each route was considered a loop that would travel into town in
the morning peak on half the loop and travel out of town in the evening peak on the other half of
the loop.
Six potential predictor variables were identified for each data set. The first was a binary
that stated whether that route had a BOS section on it previously. The second variable is related
to the first; if a BOS section existed previously, then the second variable states how many years
since the previous section was opened. The third is the total length of BOS section(s) along a
route’s loop.
The final three variables are all related to the speed data obtained from the MnDOT
extraction program. The average number of minutes per day in which the speed was below 35
mph was determined. Then the average speed was calculated for the times during which the
speeds were below 35mph. The sixth independent variable was the average bus passenger time
saved when the freeway speed was below 35 miles per hour. This value was derived from the
maximum possible speed differential between personal vehicles traveling at the average speed
(when below 35mph) and a bus allowed to travel up to 15 mph faster along the shoulder (with a
max speed of 35mph). Time saving values ranged from 0.213 minutes per mile to 1.596 minutes
per mile.

34
4.2.9 Prediction Models
Three methods were used to analyze the 32 data sets: a multi-variable model, single-
variable models, and a confidence interval. As previously stated the dependent variable was
percent change in ridership from the year prior to BOS implementation to the year after
implementation. The independent variables were, (A) the binary variable representing the
inaugural year of BOS, (B) the years since a previous BOS section’s implementation, (C) the
total length of BOS sections on a corridor, (D) minutes per day that the freeway speed was below
35 mph, (E) the average speed of traffic when speeds were below 35 mph and (F) the average
time savings for a bus on a BOS route when using the shoulder.
4.2.10 Multi-variable Model
Using the statistical computer program, SPSS, the 32 data sets were examined with the
goal of finding a multi-variable model using some or all of the previously discussed independent
variables. Linear regression analysis indicated none of the six independent variables were good
predictors. This is most likely due to the limited number of data points and the amount of scatter
within the data sets. As previously mentioned, there are many other external factors that can
affect transit ridership. While a strongly significant model could not be created, a multi variable
linear regression could be created using the variables with relatively strong significance. The
created model is shown below as Equation 1.
4.2.11 Single-variable model
A multi-variable model appeared to not be an effective way to model the incremental effects on
ridership due to BOS. Therefore each independent variable was separately compared to the
dependent variable, percent change. Comparisons were done using the correlation coefficient, r.
Table 4.2 shows the correlation coefficients for each independent variable compared to percent
difference as well as the Student’s t-value.
TABLE 4.2 Correlation Coefficient and T-Stats for Each X Value Compared to Percent.
Difference.
A: First
Year -
Binary
B:
Length
C: Years
from
Previous
D: Average
Min/Day
Speed below
35mph
E: Average
Speed when
below
35mph
F: Average Time
Savings when Speed
below 35mph
(min/mile)
r 0.0292 -0.0823 -0.2489 -0.1409 0.3048 -0.2993
t 0.165 -0.467 -1.453 -0.805 1.810 -1.77
The variables with the strongest correlation to the percent change in ridership are variable E and
F. Both of these values have sign’s that are counter intuitive of what one would assume. The
correlation coefficient for variable E is positive meaning when speeds increase (from 0 to
35mph) the percent difference in ridership also increases. The correlation coefficient for variable
F is negative, meaning when the time savings decreases the percentage change in ridership

35
increases. While the trends may be counterintuitive, a t-test on these values determined them to
be somewhat significant. For a two tailed t distribution, t90 is equal to 1.694 and t95 is equal to
2.037. Therefore the correlation coefficient is significant at 90% but not at 95%. Because of the
counterintuitive nature of the correlation coefficients, scatter plots were used to better understand
the distribution of the data points. Figures 4.3 and 4.4 are scatter plots of percent change in
ridership versus average bus time savings when freeway speed is below 35mph (variable F) and
average freeway speed when below 35mph (variable E) respectively.
FIGURE 4.3 Scatter Plot of Average Time Savings vs. Percent Change in Ridership.
FIGURE 4.4 Scatter Plot of Average Speed vs. Percent Change in Ridership.
When the scatter plots in Figures 4.3 and 4.4 are examined, one can see that the majority
of data points are clustered together with no apparent trends. When the few data points outside
the cluster are evaluated, a slight trend is identified. Despite the t value being significant at 90%
for both these variables, the trends between the percent change in ridership and the independent
variables E and F are determined by only a few data points. A small part of the data sets are
0.000
0.200
0.400
0.600
0.800
1.000
1.200
1.400
1.600
1.800
-40% -20% 0% 20% 40% 60% 80%
Av
era
ge
Tim
e S
av
ing
s w
he
n
spe
ed
be
low
35
(min
/m
ile
)
Percent Change in Ridership
0.00
5.00
10.00
15.00
20.00
25.00
30.00
35.00
-40% -20% 0% 20% 40% 60% 80%
Av
era
ge
Sp
ee
d w
he
n b
elo
w
35
mp
h
Percent Change in Ridership

36
providing all the correlation. From the scatter plots, it was determined that there is no strong
relationship between these values and percent difference.
A count of the observations with increases in ridership versus those with decreases
indicates that there is a 71% chance that the route ridership will increase after BOS
implementation. Also, if there is an increase in ridership, the average increase is 17%. When the
average freeway speed (when the speed is below 35 mph) is between 15 mph and 25 mph, and
the times savings is greater than 0.5 minutes per mile, the probability of an increase in ridership
is 76% with an average increase of 15%.
4.2.12 Confidence Interval
A confidence interval was calculated from the mean and standard deviation of the sample. The
mean percent difference was 9.41% and the standard deviation was 0.173. A 90 percent
confidence interval returns a range of values from 4.5% to 14.3%. Therefore, with 90 percent
confidence, implementation of a BOS section will increase ridership on a single route by at least
4.5% and as much as 14.3%.
4.2.13 Conclusion
Due to the limitations of the data set, creating a reliable and statistically significant multi-
variable or single-variable model was not possible. In most cases, there is clear indication of
ridership increase after BOS implementation. The predictor variables chosen were based on the
available data as well as experience based hypotheses. The lack of statistically significant
relationships shows that predicating human behavior is very difficult. While time savings,
average speed and the time in which speeds are below 35 mph can be calculated based on
empirical data, the average commuter likely responds only to perceptions of these values.
The data indicate with 90% confidence, ridership will increase by at least 4.5% and as
much as 14.3%. There is 71% chance of ridership increase as a result of BOS implementation;
and if there is a positive change in ridership it will be an average increase of 17%. It appears that
people will be willing to switch to BOS because of the perceived benefit, not the actual benefits.
4.3 STATED PREFERENCE SURVEY
Section 4.2 discussed how BOS affected ridership in the Minneapolis-Saint Paul metropolitan
area. Characteristics of transit systems and transit ridership vary city to city; therefore to
characterize the city of Austin and how Austinites could respond to a BOS system, a stated
preference survey was created. The survey consisted of nine questions. Table 4.3 gives a
summary of the 9 questions asked; the complete survey is attached in Appendix D. Each
question had multiple-choice answers. It was administered via an online survey platform:
kwiksurveys.com. The goal of the survey was to gage how Austinites would respond to buses
using a freeway shoulder during times of congestion. The survey targeted persons who
commuted alone in their personal vehicle in the morning. The questions specifically asked about
a person’s morning commute instead of their round trip commute to simplify responses and
avoid confusion.

37
TABLE 4.3 Stated Preference Survey Questions.
Questions
1) Do you currently drive alone and use Loop 1 (MoPac), IH-35 or US183 during the AM
(7:00-9:00AM) traffic peak period?
2) How long is your typical door-to-door commute time (include parking, walking to and
from your car, etc)?
3) What percentage of your trip is spent using Loop 1 (MoPac), IH-35 or US183?
4) What percentage of your trip do you spend in congestion?
5) Would you try a transit service knowing it will be able to use a shoulder to bypass
congestion on the freeway?
6) Do you have any flexibility in what time you arrive at your place of employment?
7) If your place of employment does not allow for flexibility in your arrival time, how
much earlier to do you leave home to ensure you are on time to work?
8) Knowing that taking a bus on shoulder option will guarantee you a consistent travel time
in the morning, would you switch from driving to taking the bus?
9) How much time would a bus need to save on the freeway section of its route for you to
use transit in the morning commute?
Questions 1 through 4 were intended to characterize the respondent’s morning commute.
Questions 6 through 8 were used to determine the importance of reliability for commuters and if
an increase in service reliability would convince commuters to switch to transit. Question 9 was
asked to help determine what commuters would expect in time savings to switch from their
personal vehicles to transit. Question 5 was used to determine whether a person would try the
transit service using BOS.
The survey received 295 responses from Austin residents. Contingency tables and cross-
classification of survey responses were used to evaluate the survey. Initially all questions were
cross classified with Question 5 to get an understanding of the commuting characteristics of
persons who would try a transit system using BOS. The Chi Squared Test was also used to
identify any strong correlation among survey responses. The survey identified three factors for
enticing drivers to try transit: 1) the typical commute time, 2) the percentage of trip spent in
congestion and 3) the driver’s desired time savings. The responses to Question 1 and Question 3
were not significant factors.
4.3.1 Typical Commute Time
This second question asked about the respondent’s typical commute time. It should be noted that
these are most likely perceived and approximate travel times. The majority of respondents, 54%,
had a commute time between 10-30 minutes. When the responses to question 2 were cross
classified with question 5 it was seen that as commute time increased, the probability of a person
trying the bus increased. Figure 4.5 shows this trend.

38
FIGURE 4.5 Probability of a driver trying the bus for a range of commute times.
4.3.2 Percent of Commute on Freeway
Question three asked about the perceived percentage of time the respondent typically spends in
congestion during their morning commute. Figure 4.6 shows the probability that a driver will try
transit with BOS for each percentage bracket. These values along with The Chi Squared Test
performed on these responses shows there is no correlation between the percentages of time
spent on a freeway and a driver’s willingness to switch to BOS. Therefore, when targeting
persons to try BOS, it is necessary to target a wider range of potential riders than only persons
who use the three main freeway corridors in Austin. Targeting freeway commuters as well as
drivers using arterials and collectors is also necessary.
0.00%
10.00%
20.00%
30.00%
40.00%
50.00%
60.00%
70.00%
80.00%
90.00%
100.00%
Less than10 minutes
10-20minutes
21-30minutes
31-40minutes
Greaterthan 41minutes
Pro
ba
bil
ity
of
Try
ing
BO
S
Typical Commute Time

39
FIGURE 4.6 Probability of a driver trying the bus for a range of percent time spent on
major Austin freeways.
4.3.3 Percent of Commute in Congestion
Question 4 looked at the percentage of a driver’s trip spent in congestion. Like typical travel
time, this is a perceived value. Traveler definitions of congestion vary as well as their
perceptions of the durations of congested travel. Figure 4.7 shows the probably of a driver trying
a BOS transit service with respect to their time spent in congestion.
0.00%
10.00%
20.00%
30.00%
40.00%
50.00%
60.00%
70.00%
80.00%
90.00%
100.00%
0% - 33% 33% - 66% 66%-100% I don't usethese corridors
Pro
ba
bil
ity
of
Try
ing
BO
S
Perceived Percentage ot Time Spend on Freeway

40
FIGURE 4.7 Probability of a driver trying BOS Transit with respect to congestion.
Figure 4.7 shows that a driver who perceives that 33% or more of the commute trip is
spent in congestion is more likely to try transit than a person who perceives that less than 33% of
the commute is congested. A Chi Squared test was also performed on responses to question 4 in
relation to question 5. The Chi Square Test showed a strong association between willingness to
try transit and time spent in congestion at a 10% level of significance.
4.3.4 Significance of Reliability
Question 6, 7 and 8 are all linked in determining the importance of reliability. Question 6 asked
whether a person’s employer allowed arrival time flexibility. If the employer did not allow
flexibility, they were asked how much extra time the respondents add to their trip to ensure they
get to work on time. Question 8 asked if an increase in reliably would entice a person to switch
modes. The goal of these questions was to determine not only the importance of reliability but
also a measure of how much reliability based time savings would entice one to try the service.
Question 8 asked if a person would switch to BOS knowing it would increase their commute
reliability, 44% said yes and 56% said no. These results coupled with the results from question 6
and 7 indicate that reliability is not a major factor for a commuter’s mode choice.
4.3.5 Desired Time Savings
Question 9 asked how much a BOS bus would have to improve one’s travel time to cause mode
switch. The survey had 7 multiple-choice categories for responses to question 9. During the
analysis of the survey responses, the categories were condensed to 4. When a Chi Squared test
was preformed, there was a strong association between desired time saving and willingness to try
transit at 5% significance. Figure 4.8 shows the probability of commuters trying transit for
different desired time savings. The 5 to 7 minute category has a 100% probability of commuter
switching. It is important to note, that while the probability is 100% there are only 5 responders
in this category and they all responded yes. This figure shows that time savings is not necessary
to entice single drivers to try transit, but having a high time savings can help.
0.00%
10.00%
20.00%
30.00%
40.00%
50.00%
60.00%
70.00%
80.00%
90.00%
100.00%
0% - 33% 33% - 66% 66%-100%
Pro
ba
bil
ity
of
Try
ing
BO
S
Percent of Trip in Congestion

41
FIGURE 4.8 Probability of Switching to Transit for a Range of Desired Time Savings.
4.3.6 Conclusions
From the survey, it appears that there are 3 deciding factors for enticing drivers to try transit: (1)
the typical commute time, (2) the trip percentage spent in congestion and (3) the driver’s desired
time savings. To better understand answers for Question 2 (typical commute time) and Question
9 (desired time savings) these were cross-classified. This cross-classification resulted in the
graph shown in Figure 4.9. The graph shows that those who will try a BOS transit service, have
a typical commute time over 21 minutes and they want at least seven minutes in time savings.
FIGURE 4.9 Cross Classification of Question 2 and 9 for Drivers Willing to Try Transit.
0%
20%
40%
60%
80%
100%
120%
0-5 min 5-7 min 7+ Not a Factor
Pro
ba
bil
ity
of
Try
ing
BO
S
Desired Time Savings
0.00%
5.00%
10.00%
15.00%
20.00%
25.00%
Less than10
10+20 21+30 31+40 41 +
Pe
rce
nta
ge
of
Sa
mp
le t
ha
t w
ou
ld T
ry
BO
S
Typical Commute Time
Evaluation of Sample That Would Try BOS
0-5min
5 -7 min
7+ min
Not a Factor

42
Figure 4.9 provides a characterization of Austin in terms of a BOS system. People cannot
generally notice a time savings less than a few minutes. The survey responses show that
commuters want to be able to perceive a timesaving if they are going to switch modes. The
perceived threshold for time savings seems to be a value of 7 or more minutes. It can be
determined from the Austin survey that routes with commuters traveling further are the target
BOS customers and for those commuters to try BOS they want to see time savings.
4.4 POSSIBLE BOS EFFECTS ON AUSTIN RIDERSHIP
Two corridors have been identified as possible corridors for a BOS pilot project in Austin,
Texas. These are:
1. US-183 NB: On-Ramp before Ohlen Road Exit to Spicewood Sp. Exit (7.17 mi)
2. IH-35 SB: On-Ramp before Braker Lane Exit to 15th St, MLK Exit (9.00 mi)
Section 4.2 concluded that (with 90% confidence) ridership will increase by at least 4.5%
and as much as 14.3%. The average change in ridership for the Minneapolis Data was 9.41%.
Also, there is 71% chance of ridership increase as a result of BOS implementation, and if there is
a positive change in ridership it will be an average increase of 17%. This section will use these
percentage increases in yearly route ridership to determine the ridership increase that would
result on the four test corridors if the effects of BOS in Austin are similar to those found in the
Minneapolis-Saint Paul area.
A total of seven bus routes traverse the two possible test corridors in Austin. Some routes
only travel along one corridor while others use two. Total weekday ridership totals were
obtained for these seven routes. For December 2014, Ridership data was obtained (Perteet
2015). These numbers were compared to the total August 2008 ridership for the entire Capital
Metro bus operation obtained from the NTD (National Transit Database n.d.). Comparing the
route ridership data to the total system data gives the percentage of the total Capital Metro
ridership that is traveled on each route. Table 4.4 lists the seven routes along with the corridors
they use, their average December 2014 daily ridership, and the cost of a one-way ride. Found on
the Capital Metro Online Rider’s Guide under fare and passes is the cost of a one-way ride or the
cost of a single-ride fare for adults. This fare does not apply to individuals who are senior
citizens or have physical disabilities.
Capital Metro is increasingly finding its system as a preferred way to get around. As
given in the table, the flyer route 142 traveling on IH-35 SB has an average weekday ridership of
nearly 985 where riders pay approximately $1.75. During the year of 2012, Capital Metro
provided on average 112,000 rides each weekday. Thus, flyer route 142 experiences a percentage
of 0.88 of the total Capital Metro ridership.
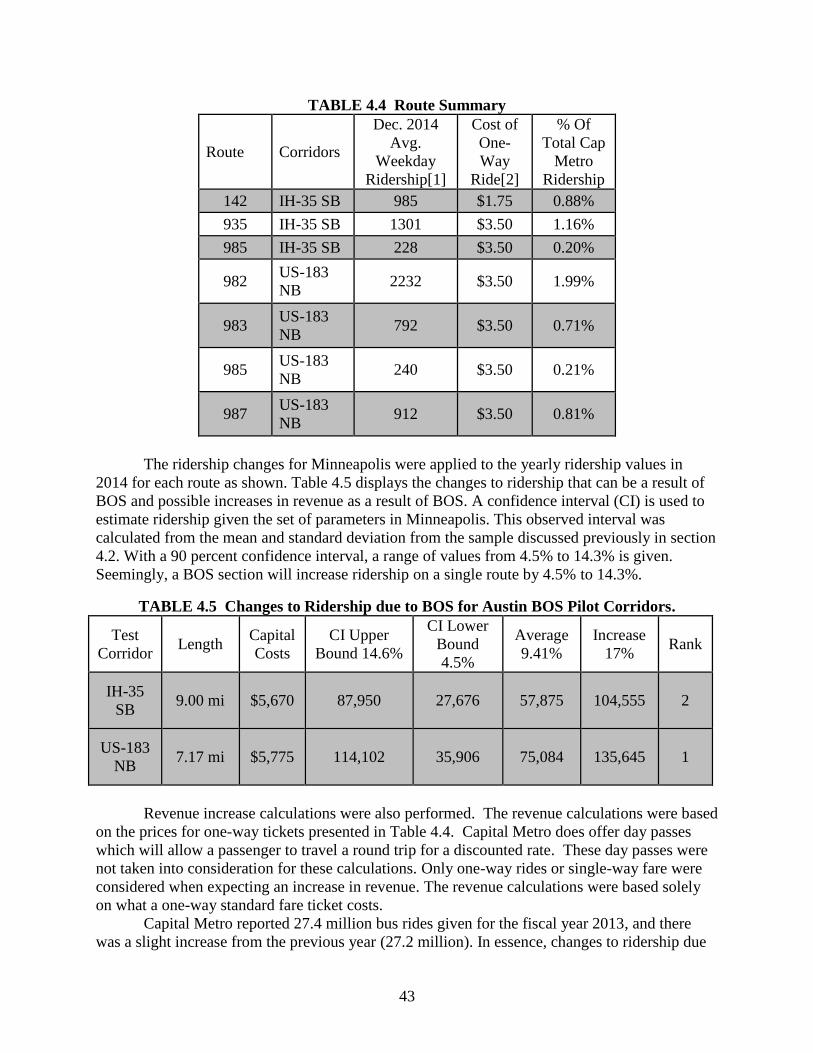
43
TABLE 4.4 Route Summary
Route Corridors
Dec. 2014
Avg.
Weekday
Ridership[1]
Cost of
One-
Way
Ride[2]
% Of
Total Cap
Metro
Ridership
142 IH-35 SB 985 $1.75 0.88%
935 IH-35 SB 1301 $3.50 1.16%
985 IH-35 SB 228 $3.50 0.20%
982 US-183
NB 2232 $3.50 1.99%
983 US-183
NB 792 $3.50 0.71%
985 US-183
NB 240 $3.50 0.21%
987 US-183
NB 912 $3.50 0.81%
The ridership changes for Minneapolis were applied to the yearly ridership values in
2014 for each route as shown. Table 4.5 displays the changes to ridership that can be a result of
BOS and possible increases in revenue as a result of BOS. A confidence interval (CI) is used to
estimate ridership given the set of parameters in Minneapolis. This observed interval was
calculated from the mean and standard deviation from the sample discussed previously in section
4.2. With a 90 percent confidence interval, a range of values from 4.5% to 14.3% is given.
Seemingly, a BOS section will increase ridership on a single route by 4.5% to 14.3%.
TABLE 4.5 Changes to Ridership due to BOS for Austin BOS Pilot Corridors.
Test
Corridor Length
Capital
Costs
CI Upper
Bound 14.6%
CI Lower
Bound
4.5%
Average
9.41%
Increase
17% Rank
IH-35
SB 9.00 mi $5,670 87,950 27,676 57,875 104,555 2
US-183
NB 7.17 mi $5,775 114,102 35,906 75,084 135,645 1
Revenue increase calculations were also performed. The revenue calculations were based
on the prices for one-way tickets presented in Table 4.4. Capital Metro does offer day passes
which will allow a passenger to travel a round trip for a discounted rate. These day passes were
not taken into consideration for these calculations. Only one-way rides or single-way fare were
considered when expecting an increase in revenue. The revenue calculations were based solely
on what a one-way standard fare ticket costs.
Capital Metro reported 27.4 million bus rides given for the fiscal year 2013, and there
was a slight increase from the previous year (27.2 million). In essence, changes to ridership due

44
to BOS were found calculating for each of the Austin BOS Pilot corridors. First, the yearly
number of riders is calculated given the percentage of total Capital Metro Ridership and the 27.4
million bus rides given for the year. Second, yearly revenue is found by taking the product of the
cost of a one-way ride and the yearly number of riders. The resulting calculations for possible
revenue generation are summarized in Table 4.6.
TABLE 4.6 Possible Revenue Generation due to BOS on Austin Pilot Corridors.
Test
Corridor Length
Capital
Costs
CI Upper
Bound 14.6%
CI Lower
Bound
4.5%
Average
9.41%
Increase
17% Rank
IH-35
SB 9.00 mi $5,670 $247,520 $ 77,891 $ 162,879
$
294,255 2
US-183
NB 7.17 mi $5,775 $511,325 $ 160,907 $ 336,473
$
607,869 1
The total fare box revenue generated by the entire Capital Metro system in fiscal year
2008 was $6 million (Capital Metropolitan Transporation Authority FY 2008). The possible
increases in fare box revenue shown in TABLE 4.6 could have a substantial effect on total
revenue. As previously stated there are options for reduced fares with day passes which would
reduce the actual revenue generation; however, there is no doubt that the readership increase
predicted can have very advantageous effects on fare box revenue.
4.5 CONCLUSIONS
The survey responses show that commuters must be able to perceive a time savings. This
counters what was seen from the evaluation of the ridership from Minnesota. From the
Minnesota data it was shown that while time savings can be calculated, the average commuter
does not make their decision based on the actual time savings. There is no strong relationship
between time savings and increase in ridership; therefore commuters are likely making their
decision based on perceived time savings. But while a statistically significant forecasting model
was not determined, the Minnesota data clearly shows that BOS implementation will likely
increase route ridership. There is 71% change of ridership increase as a result of BOS
implementation. A 90% confidence interval yields a ridership increase of at least 4.5% and as
much as 14.3%. While seasonality and noticeable external factors were removed from the data
sets there were still other factors that could have affected the percent change in ridership.
Knowing that other external factors affected the data, the observations still showed a substantial
ridership increase. The concluding percent changes in ridership will have advantageous effects
on fare box revenue in Austin. BOS implementation on the four pilot corridors could generate
additional revenue as much as $250,000 annually.

45
CHAPTER 5 CONCLUSIONS
This project clearly shows that BOS could be an extremely effective project from a cost and
benefit standpoint. Not only is a BOS system easy and inexpensive to implement, the benefits
can be enormous. Part 1 outlined the nine criteria that should be used if an Austin system were
to be implemented. Recommendations for an Austin pilot test are:
1. All BOS shoulders be at least 10 ft. in width and have adequate pavement depth to support
bus usage,
2. Buses use the right shoulder and continuous shoulder segments should be at least 2,500 ft.
(buses could possibly utilize auxiliary lanes when present instead of shoulders),
3. Buses should not exceed 35 mph on the shoulder or 15 mph faster than traffic in the main
lanes,
4. BOS signs be placed on ramps and along BOS corridors,
5. Bus operators be trained properly for BOS and only use the shoulder if comfortable doing so,
6. Buses yield to emergency vehicles or stalled vehicles stopped on the shoulder,
7. At least six buses travel along the corridor per day,
8. A BOS pilot test corridor should need no structural improvements to the shoulder and
minimal restriping,
9. Texas Transportation Code should be updated to allow a BOS Pilot Program.
Analyses in Chapter 2 show that there are two excellent locations for BOS on IH-35 and
US-183 in Austin, TX that may provide significant benefits to bus riders. Chapter 3 presented an
evaluation of the sites from a benefit-cost perspective. The corridors therefore are ranked for
recommendation for a BOS pilot program in the following order:
1. US-183 NB: On-Ramp before Ohlen Road Exit to Spicewood Sp. Exit (7.17 mi)
2. IH-35 SB: On-Ramp before Braker Lane Exit to 15th St, MLK Exit (9.00 mi)
Chapter 4 examined ridership changes due to BOS. The data obtained from the Twin
Cities clearly shows that BOS can result in increased ridership. There is 71% chance of ridership
increase as a result of BOS implementation. A 90% confidence interval yields a ridership
increase of at least 4.5% and as much as 14.6%. Chapter 4 also described results of a stated
preference survey administered in Austin, Texas. The survey responses show that commuters
must be able to perceive a time savings.

46
REFERENCES
Capital Area Council of Governments (CAPCOG). 2008 18” Aerial Imagery. 2008.
<http://data.capcog.org/Information_Clearinghouse/download-
interface/2008_imagery_download.html>. Access October 2008.
Capital Metro. Schedules and Maps. 2008.
<http://www.capmetro.org/riding/schedulesandmaps.asp>. Access October 2008.
Capital Metro. Rider’s Guide. Fares and Passes. 2015.
< https://www.capmetro.org/fares/>. Access June 2015.
Capital Metro. News and Announcements. Capital Metro Ridership Soars in 2012.
January 2013. < https://www.capmetro.org/news-item.aspx?id=1953>. Access June 2015.
Capital Metropolitan Transporation Authority. (FY 2008). Comprehensive Annual Financial
Report. Finance Department , Austin, Texas.
Conover, Jennifer. Bus Only Shoulders in the Twin Cities. Power point presentation.
<http://www.dot.state.mn.us/metro/teamtransit/>. Access September 2008.
Douma, Frank. Bus-Only Shoulders in the Twin Cities. Hubert H. Humphrey Institute of Public
Affairs. June 2007. <http://www.hhh.umn.edu/img/assets/11475/Bus%20Only%
20Shoulders%20Report%20FINAL.pdf>. Access September 2008.
Google Earth. Image U.S. Geological Survey. March 2003.
Guerra, Jesus. Bus on Shoulders – Miami Dade County Demonstration Project. Presentation for
APTA Workshop. 2008.
Hollander, Sarah. RTA, Laketran will test use of shoulder lanes for buses. The Plain Dealer.
May 3, 2008. <http://www.cleveland.com/news/plaindealer/index.ssf?/base/cuyahoga/
1209803560157200.xml&coll=2>. Access September 2008.
Martin, Peter. Bus Use of Shoulders – A Synthesis of Transit Practice. TCRP Synthesis 64.
July 5, 2006. <http://onlinepubs.trb.org/onlinepubs/tcrp/tcrp_syn_64.pdf>. Access
September 2008.
Martin, Peter. A Guide for Implementing Bus-On-Shoulder (BOS) Systems. Preliminary Draft,
Interim Report. TCRP Project D-13. June 2007.
Metro’s I-71 “Bus-On-Shoulder” Project off to a Great Start. <http://www.go-
metro.com/news/2007/nr48.html>. November 7, 2008.
National Transit Database. (n.d.). Historical Data Files: Monthly Database. National Transit
Database: <http://www.ntdprogram.gov/ntdprogram/data.htm>. Retrieved September
2009.
O.D.O.T. Agrees Metro Will Continue Use of I-71 Shoulder. August 5, 2008.
<http://www.sorta.com/news/2008/nr36.html>. Access September 2008.
Perteet. Technical Memorandum 1: Existing Conditions. Prepared for: Capital Metropolitan
Transportation Authority, Everett, Washington. 2009.
Perteet. ServicePlan2020. Prepared for: Capital Metropolitan Transportation Authority.
2010.<https://www.capmetro.org/uploadedFiles/Capmetroorg/Future_Plans/Service_Plan
_2020/ServicePlan2020%20-%20Final%20Report.pdf>. Access June 2015.
Phalon, Erin. NJDOT to open Route 9 Bus shoulder lanes in Old Bridge. November 29, 2006.
<http://www.state.nj.us/transportation/about/press/2006/112906.shtm>. Access
September 2008.
Schmidt, Steve. High-Tech Bus Lanes Coming. San Diego Union-Tribune. August 22, 2008.

47
<http://www.signonsandiego.com/uniontrib/20080822/news_1n22bus.html>. Access
September 2008.
Shrank, David, Bill Eisele, and Tim Lomax. The 2012 Urban Mobility Report. Texas
Transportation Institute. September 2012.
US Census Bureau. State & County Quickfacts. 2013.
<http://quickfacts.census.gov/qfd/states/48000.html>. Access March 2015.

48
APPENDICES
Appendix A: Active BOS Projects
Appendix B: Potential Characteristics for Austin BOS
Appendix C: Freeway Restriping and Repaving Cost Estimates (Murphy, 2009)
Appendix D: Survey of Austinites (administered via kiwksurveys.com)

49
APPENDIX A: ACTIVE BOS PROJECTS
Seattle, Washington Twin Cities, Minnesota Auckland, New
Zealand Ottawa, Ontario,
Canada Dublin, Ireland
Vancouver, British Columbia
Year Started 1970's Late 1991/ Early 1992 1991 1992 1998 --
Roads SR-520 WB (Freeway)
SR-522 (Arterial) Numerous (Freeway and
Arterial)
Northern, Northwest,
and Southern Motorways
Regional Road 174 Regional Road 417
N2, N3, N4, N6, N8, N11 (mostly arterial)
Route 1 (Freeway, Queue Jumper)
Current Miles of BOS 2.7 mi (SR-520)
2.2 mi (SR-522) over 270 mi -- 14 mi 50 to 70 mi --
Max/Design Speed Posted Speed Limit 35 mph 44 mph Posted Speed Limit Posted Speed Limit --
Can use Shoulder when
speeds drop below N/A 35 mph N/A N/A N/A --
Max Speed Differential with Mainline Traffic
None 15 mph -- None N/A --
Hours of Operation No Restrictions No Restrictions No Restrictions No Restrictions
Varies from No
Restriction to only peak periods
--
Signage (Mainline)
Wayside HOV diamond lane
traffic signs (SR-520)
"Transit Only" (SR-522)
"Shoulder – Authorized Buses Only” every .25 to .5 mile
-- -- -- --
Signage (On-Ramp) -- “Watch for Buses on
Shoulders” on On-Ramps -- -- -- --
Pavement Markings HOV Diamonds (SR-520)
"Only Transit" (SR-522) None -- --
"Bus Lane" and solid
white line --
Left/Right Shoulder Right Right Right Right Right Right
Shoulder Width 13-14ft 10ft (11.5 on bridges)
Minimum & 12ft (Desired) 10ft (min)
16.4 ft (RR-174) & 3.5m bus lane, 1m
shoulder, 1m refuge
edge (RR-417)
10ft minimum --
Pavement Thickness -- 7 in minimum -- -- Full Thickness --
Max Normal Cross
Slope -- 2 - 5 % -- 2% -- --
Eligible Vehicles
Buses and 3+ HOVs
(SR-520)
Buses (SR-522) All Metro Transit buses and
registered Charter buses -- All Public Transit Buses and Taxis --

50
Bethesda, Maryland Fairfax County, Virginia Wilmington,
Delaware
Toronto, Ontario,
Canada Atlanta, Georgia San Diego, California
Year Started -- Around 2000 -- 2003 September 2005
December 2005
(Original) Fall 2009
(Expansion)
Roads
US-29 NB (Arterial) &
I-495 EB (Freeway, Queue
Jumper)
EB Route-267 (Freeway)
US-202 SB
(Freeway, Queue
Jumper)
Highway 403 GA-400 (Freeway)
SR-52 & I-805
(Freeway, Original)
I-805 (Expansion)
Current Miles of BOS 4 mi (US-29) & 3
mi (I-495) 1.3 mi (Queue Jumper) 1500 ft 3 mi 12 mi
4 mi (Original)
20 mi (Expansion)
Max/Design Speed 55 mph 25 mph -- 38 mph 35 mph 35 mph
Can use Shoulder when
speeds drop below -- 25 mph -- 38 mph 35 mph
35 mph (Original)
30 mph (Expansion)
Speed Differential with
Mainlane Traffic -- -- -- 12 mph 15 mph 10 mph
Hours of Operation
3pm to 8pm (US-29) &
6am to 9am; 3pm to 7pm
(I-495)
Monday-Friday 4pm to 8pm
No Restrictions No Restrictions No Restrictions No Restrictions
Signage (Mainline) Typical HOV signage --
Diamond & Light
permitting bus use
(green bus = go,
green bus w/ red X =
don't go)
"Authorized Buses
Using Shoulder" every
200 to 300 meters
Same as Twin Cities
"Transit Lane - Authorized Buses
Only" about every .5
mile
Signage (On-Ramp) -- -- -- --
Same as Twin Cities
except Black on White rather than
Black on Yellow
--
Pavement Markings HOV Diamond double solid white line Diamond 20cm wide solid white
edge line None "Only Bus Transit"
Left/Right Shoulder Right Right Right Right Right Right (Pilot Project)
Left (2009 Expansion)
Shoulder Width -- -- -- 12.3 Widened to 12ft
None Changed though
10 ft Desired
(Original) 11ft
(Expansion)
Pavement Thickness -- -- -- -- -- --
Normal Cross Slope -- -- -- -- -- --
Eligible Vehicles -- -- -- Bus operators
authorized by the MTO MARTA buses
Route 960 Express Bus

51
Columbus, Ohio Mountainside & Old Bridge,
New Jersey Miami, FL Cincinnati, Ohio Cleveland, Ohio
Year Started November 2006 Unknown (Route-22)
November 2006 (Route 9) March 2007 July 2007 June 2008
Roads I-70 (Freeway) Route-22 EB (Arterial)
Route-9 NB & SB (Arterial)
SR-874 (Freeway) &
SR-878 (Freeway) I-71 NB (Freeway) I-90 (Freeway)
Current Miles of BOS 10 mi 1 mi (Route-22)
4 mi (Route-9) 9 mi 11.7 mi --
Max/Design Speed 35 mph -- 35 mph 35 mph 35 mph
Can use Shoulder when speeds drop below
35 mph -- 25 mph 30 mph 35 mph
Speed Differential with
Mainlane Traffic 15 mph -- 15 mph -- --
Hours of Operation No Restrictions Commute Period No Restrictions No Restrictions No Restrictions
Signage (Mainline) Same as Twin Cities
"Buses May Use Shoulder" (Route-22)
"Bus O" (Route 9)
"Emergency Stopping
Only on Shoulder -
Authorized Bus Lane"
-- --
Signage (On-Ramp) Yellow Warning Sign -- "Buses Traveling on
Shoulder" -- --
Pavement Markings None
None
(Route-22) "Bus Only"
(Route 9)
None -- --
Left/Right Shoulder Right Right Right Left Right
Shoulder Width 10ft 12-ft 10 ft Minimum (12ft
where trucks >250 vph) 12ft 10ft
Pavement Thickness Full Depth Updated to Full Thickness -- -- --
Normal Cross Slope -- Updated from 4% to 2.5% 2 - 6% -- --
Eligible Vehicles COTA Buses -- KAT Transit Buses Rt-71X & Rt-72 --

52
APPENDIX B: POTENTIAL CHARACTERISTICS FOR AUSTIN BOS
Data for IH-35 SB

53
Data for IH-35 SB, Test Corridor

54
Data for IH-35 SB, All Days

55
Data for IH-35 SB, Wednesday 12/03/2014

56
Data for IH-35 SB, Thursday 12/11/14

57
Data for IH-35 SB, Wednesday 12/17/14
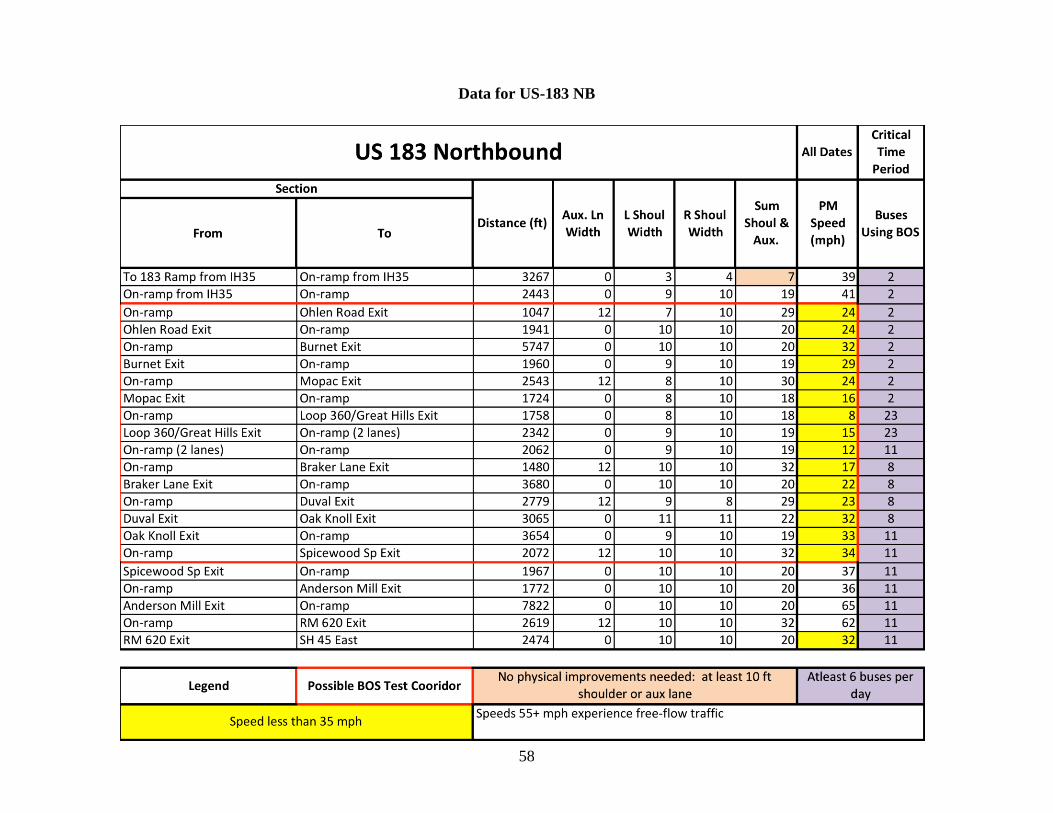
58
Data for US-183 NB

59
Data for US-183 NB, Test Corridor

60
Data for US-183 NB, Wednesday 12/3/14

61
Data for US-183 NB, Wednesday 12/10/14

62
US-183 NB, Wednesday 12/17/14

63
APPENDIX C: FREEWAY RESTRIPING AND REPAVING COST ESTIMATES
(MURPHY, 2009)
IH-35 Corridor: No resurfacing and no restriping needed
US-183 Corridor: Resurfacing Only (no restriping)
US-183 Pavement Resurfacing – Unit costs
Item 341 2014 Dense Graded Hot Mix (QCQA) Ty‐ B PG 70‐ 22 Ton 72.78
Item 354 2052 Plane asphalt concrete pavement (0” – 3‐ 1/2”) SY 2.50
Striping and Markers – Unit costs
Item 8020 2003 Reflectorized profile pavement marking 6” Ty 1 (white) LF 0.91
Item 8020 2008 Reflectorized profile pavement marking 6” Ty 1 (yellow) LF 0.91
Item 666 2015 Reflectorized pavement marking 6” (Broken) (white) LF 0.41
Item 672 2012 Reflectorized pavement marker Ty 1 – White EA 3.25
Item 677 2001 Eliminate pavement markings and markers LF 0.58
Item 678 2001 Pavement surface preparation for markings (6”) LF 0.01
Striping material and installation cost per center‐ line mile (6 lanes total)
Solid white profile edge stripe = 2 lines x 5280 = 10,560 LF of striping x 0.91 = $9610
Solid yellow profile edge strip = 2 lines x 5280 = 10,560 LF of striping x 0.91 = $9610
$19,220
Multiplier to account for additional markings for ramp gores, accel / decel lanes etc. 2.00
Estimated cost per center line mile for materials and installation to stripe IH 35
= 2.00 x $19,220
= $38,440 per center‐ line mile
*striping not needed for IH-35 or US-183
Pavement Resurfacing – Unit costs
Plane (mill) existing 2” surface and stockpile.
1X10’ (outside shldr) = 10’ wide paved surface x 5280 LF
= 52800 SF/9SF/SY
= 5867 SY x $2.50
= $14,667
Hot mix Ty B = 110 lbs / SY / inch thick
3”/SY = 330 lbs/SY/2000lbs/ton
= 0.165 tons/SY x 5867 SY x $72.78 ton HMAC
= $70,455
Multiplier to account for Mobilization, traffic control, ancillary items, possible night placement
=2.0 x ($14,667+$70,455) = $170,244 (resurface) = $170,244 per lane mile (average)

64
APPENDIX D: SURVEY OF AUSTINITES
Bus on Shoulder Survey
This survey, administered via kiwksurveys.com, is targeted at persons who commute during the
morning by personal vehicle. Many Austinites use freeways during their morning commute.
Most of these freeways are plagued with congestion during these times. Speeds during the
morning are often below 10 miles per hour. Traffic on these corridors can add not only
considerable time to a person’s commute trip but also stress. Traffic on these corridors is variable
with some days adding even more time to a person’s commute. The option of allowing buses to
start using freeway shoulders like bus bypass lanes is being considered. A bus would be able to
use the shoulder to bypass congestion on Austin’s freeways. A bus using a shoulder will be able
to move faster than personal vehicles and will allow for bus riders to save on their commute
time. It will also add reliability to a commuter’s trip. Since the bus’s travel time will no longer be
directly affected by any variability in traffic.
1) Do you currently drive alone and use Loop 1 (MoPac), IH-35 or US183 during the AM
(7:00-9:00AM) traffic peak period?
a.Yes
b.No
2) How long is your typical door to door commute time (include parking, walking to and
from your car, etc.)?
a. Less than 10 minutes
b.10-20 minutes
c. 21-30 minutes
d.31-40 minutes
e.Greater than 41 minutes
3) What percentage of your trip is spent using Loop 1 (MoPac), IH-35 or US183?
a.0%-33%
b.33%-66%
c.66%-100%
d. I don’t use these corridors
4) What percentage of your trip do you spend in congestion?
a.0%-33%
b.33%-66%
c.66%-100%
5) Would you try a transit service knowing it will be able to use a shoulder to bypass
congestion on the freeway?
a.Yes
b.No

65
For Questions 6-8
Congestion on Austin’s Freeways is variable. The bus’ ability to use the shoulder will allow for
an increase reliability in bus service. Using the bus for morning commute will allow for a
consistent commute time.
6) Do you have any flexibility in what time you arrive at your place of employment?
a.Yes, my employer allows for flexibility in my arrival time
b.No, I have to be at work at a specific time
7) If your place of employment does not allow for flexibility in your arrival time, how much
earlier do you leave home to ensure you are on time to work?
a.0-5 minutes
b.5-10 minutes
c.10-15 minutes
d.15-20 minutes
e. More than 20 minutes
f. My place of employment allows for flexibility in what time I arrive
8) Knowing that taking a bus on shoulder option will guarantee you a consistent travel time
in the morning, would you switch from driving to taking the bus?
a.Yes
b.No
Most commuter bus routes in Austin travel from “Park and Rides” to Central Austin (University
of Texas campus, The Capital, and Downtown). Switching to transit may require time to travel
from home to the bus route and then from a bus stop to your destination. While there may be
added time at the beginning and end of your trip, the time spent in congestion will be less.
9) How much time would a bus need to save on the freeway section of its route for you to use
transit in the morning commute?
a.0 minutes
b.1-3 minutes
c.3-5 minutes
d.5-7 minutes
e.7-10 minutes
f. Greater than 10 minutes