the university of oklahoma graduate college an in vitro outgrowth ...
127
THE UNIVERSITY OF OKLAHOMA GRADUATE COLLEGE AN IN VITRO OUTGROWTH ORIENTING FACTOR: STUDIES CONCERNING IT AND ITS RELATION TO THE REPORTED GROWTH STIMULATING PROTEINS FROM THE SUBMAXILLARY GLAND OF MICE A DISSERTATION SUBMITTED TO THE GRADUATE FACULTY in partial fulfillment of the requirements for the degree of DOCTOR OF PHILOSOPHY BY SISTER EILEEN MARIE BAST, S.S.N.D. Norman, Oklahoma 1966
Transcript of the university of oklahoma graduate college an in vitro outgrowth ...

THE UNIVERSITY OF OKLAHOMA GRADUATE COLLEGE
AN IN VITRO OUTGROWTH ORIENTING FACTOR: STUDIES CONCERNING ITAND ITS RELATION TO THE REPORTED GROWTH STIMULATING PROTEINS
FROM THE SUBMAXILLARY GLAND OF MICE
A DISSERTATION SUBMITTED TO THE GRADUATE FACULTY
in partial fulfillment of the requirements for thedegree of
DOCTOR OF PHILOSOPHY
BYSISTER EILEEN MARIE BAST, S.S.N.D.
Norman, Oklahoma 1966

AN IN VITRO OUTGROWTH ORIENTING FACTOR: STUDIES CONCERNING ITAND ITS RELATION TO THE REPORTED GROWTH STIMULATION PROTEINS
FROM THE SUBMAXILLARY GLAND OF MICE
APPROVED BY
Dissertation commit/ï se

ACKNOWLEDGMENTS
To Kenneth S. Mills, Associate Professor of Zoology, for the directions of this problem; for the use of his research laboratory, supplies, and privately owned camera; for his many helpful suggestions concerning the writing of this dissertation; and for his encouragement, trust, patience, and time.
To C. Clinton Smith and Walter L. Dillard, graduate students in zoology, for their help and suggestions in the laboratory.
To Blake Grant, graduate student in zoology, for his help with the gel separation techniques.
To the many graduate students in zoology and friends who have assisted me in various ways.
To my Committee for their suggestions and help in the preparation of this dissertation.
To the Department of Zoology for a Graduate Teaching Asslstant- ship, space, and some of the materials used in this research.
To the School Sisters of Notre Dame, St. Louis Province, for financial support during my last two years of study.
iii

TABLE OF CONTENTS
PageACKNOWLEDGMENTS............................................. iiiLIST OF TABLES................. vLIST OF ILLUSTRATIONS.....................................viiiLIST OF PLATES.......................................... xChapter
I. INTRODUCTION ..................................... 1II. MATERIALS AND METHODS............................. 8III. RESULTS....................■ ......... 27
Purification of the Male Mouse SubmaxillaryCrude Homogenate......... 27
Fractionation of Other Male Mouse Tissue CrudeHomogenates................................... 4-1
Assay of the Purified Fractions................... 4-5Effect of Varying the Concentration of theSubmaxillary Protein......................... 4-5
Molecular Weight Estimation of the SubmaxillaryOutgrowth Orienting Protein............... 55
Lability of the Submaxillary OutgrowthOrienting Protein. . . . ..................... 60
Outgrowth Response between Expiants from Tissues other than Chick Cardiac to the OutgrowthOrienting Protein.............................. 60
Effect of Different Kinds of Medi,a on the Actionof the Outgrowth Orienting Protein............ 67
-, Monolayer Outgrowth Response to the OutgrowthOrienting Protein............................. 67
IV. DISCUSSION ................................ 70V. SUMMARY........................................... 79
LITERATURE CITED................... 81APPENDIX................................................. 85
iv

LIST OF TABLES
Table' PageI. Purification of Male Mouse Submaxillary Crude
Homôgenàte on Sephadex G-25. . ....................28II. Absorption Spectra for Male Mouse Submaxillary Crude
Homegenate Represented by Area A, Fig. la. . . . . . 30III. Fractionation of. Male Mouse Submaxillary Crude
Homogenate on Sephadex G-75............. 86IV. Fractionation of Male Mouse Submaxillary Crude Homo
genate on Sephadex G-lOO........................ 87V. Absorption Spectra of Fractions 1, 2, and 3. . . . . . 88VI. Absorption Spectra of Fractions A and 5............ 89VII. Void Volume Determination with 0.5 ml Blue Dextran and
Fractionation of 0.5 ml of Male Mouse Submaxillary Crude Homogenate on Sephadex G-lOO.............. 90
VIII. Void Volume Determination with 0.5 ml Blue Dextran andFractionation of 0.5 ml Lyophilized Protein from Area A, Fig. la, on Sephadex G-lOO in 0.02 M Sodium Phosphate Buffer, pH 6.5 . . ......................91
IX. Void Volume Determination with 0.5 ml Blue Dextran andFractionation of 0.5 ml Lyophilized Protein from Area A, Fig. la, on Sephadex G-lOO in'0;005 M Tris HDl Buffer, pH 7 . 2 ..............................92
X. Densitometer Analysis of Electrophoretic Separationsof Protein Represented by Area A, Fig. la, and Peak IV, Fig. 3 a ......................... 93
XI. Fractionation of Male Mouse Submaxillary CrudeHomogenate on Sephadex G-200, Chromatographic Column I ........................... 94
XII. Fractionation of 2 ml of Male Mouse Submaxillary CrudeHomogenate on Sephadex G-200, Chromatographic Column II....................................... 95
V

LIST OF TABLES— ContinuedTable PageXIII. Recycling of Area D ............................... 96XIV. Fractionation of 1 ml of Male Mouse Submaxillary Crude
Homogenate on Sephadex G-200, Chromatographic Column II. ................................. 97
XV. Densitometer Analysis of Electrophoretic Separation of Protein Represented by Area A, Fig. la, and Peak I>2 , Fig. 5 d ....................... 98
XVI. Void Volume Determination with 0.5 ml Blue Dextran and Fractionation of 0.5 ml Male Mouse Submaxillary Crude Homogenate Purified by Ethanol Precipitation . 99
XVII. Densitometer,Analysis of 35 min ElectrophoreticSeparation of Protein from Area A, Fig. l a ...... 100
XVIII. Densitometer Analysis of 35 min ElectrophoreticSeparation of Protein from Male Mouse Submaxillary Crude Homogenate Purified by Ethanol Precipitation . 101
XIX. Densitometer Analysis of 90 Electrophoretic Separationof Protein from Area A, Fig. la..................102
XX. Densitometer Analysis of 90 min ElectrophoreticSeparation of Protein from Male Mouse Submaxillary Crude Homogenate Purified by Ethanol Precipitation . 103
XXI. Void Volume Determination with 0.5 ml Blue Dextranand Fractionation of 0.5 ml of (NH,)2S0^ Purified Male Mouse Submaxillary Crude Homogenate in 0.02 M Sodium Phosphate, pH 6 . 5 ........................104.
XXII. Void Volume Determination with 0.5 ml Blue Dextranand Fractionation of 0.5 ml of (NH, )gSO Purified Male Mouse Submaxillary Crude Homogenate on Sephadex G-lOO in 0.005 M Tris HCl Buffer, pH 7.5. . 105
XXIII. Purification of Male Mouse Muscle Crude Homogenateand Male Mouse Thymus Crude Homogenate on Sephadex G-25............................................... 106
XXIV. Absorption Spectrum of Male Mouse Muscle CrudeHomogenate......................................... 107
XXV. Void Volume Determination with 1.0 ml Blue Dextran andFractionation of 1.0 ml of Male Mouse Muscle Crude Homogenate on Sephadex G-lOO ....................... lOS
Vi

LIST OF TABLES— ContinuedTable PageXXVI. Void Volume Determination with 0.5 ml Blue Dextran
and Fractionation of 0.5 ml of Male Mouse Thymus Crude Homogenate on Sephadex G-lOO...................109
XXVII. Assay of Male Mouse Submaxillary Crude HomogenateFractionations......... 4-8
XXVIII. Assay of Male Mouse Thymus and Muscle CrudeHomogenate Fractionations ................ 53
XXIX. Weight Estimation of Protein in 1 ml of Extract,Area A of G-25 Fractionation, November, 1963........ 54
XXX. Measurements of Cell Axis Angles. . . . . . . . . . . . 110XXXI. Measurements of,Cell Axis Angles. ...............IllXXXII. Measurements of Cell Axis Angles.......................112
XXXIII. Measurements of Cell Axis Angles............. 113XXXIV. Measurements of Cell Axis Angles....................... 114XXXV. Measurements of Cell Axis Angles....................... 115XXXVI. Measurements of Cell Axis Angles....................... 116XXXVII. Measurements of Cell Axis Angles....................... 117XXXVIII. Measurements of Cell Axis Angles....................... 113XXXIX. Void Volume Determination with 0.5 ml Blue Dextran and
the Elution of Trypsin and Bovine Serum Albumin on Sephadex G-lOO (12/6/65)............................ 119
XL, Void Volume Determination with 0.5 ml of Blue Dextran and the Elution of Trypsin and Bovine Serum Albumin on Sephadex G-lOO (2/17/66)........................ 120
XLI. Lability of the Outgrowth Orienting Protein............ 62XLII. Summary of the Number of Slides Cultured Containing
Explants other than Chick Cardiac or Nerve............ 63XLIII. Summary of Chick Nerve Tissue Cultures..................65XLIV. Types of Culture Media Used for Chick Cardiac Explants. 68
vii

LIST OF ILLUSTRATIONS
Figure Page1. Fractionation of Male Mouse Submaxillary Crude
Homogenate on G-25 Gel and G-75 G e l ............... 292. Fractionation of Male Mouse Submaxillary Crude
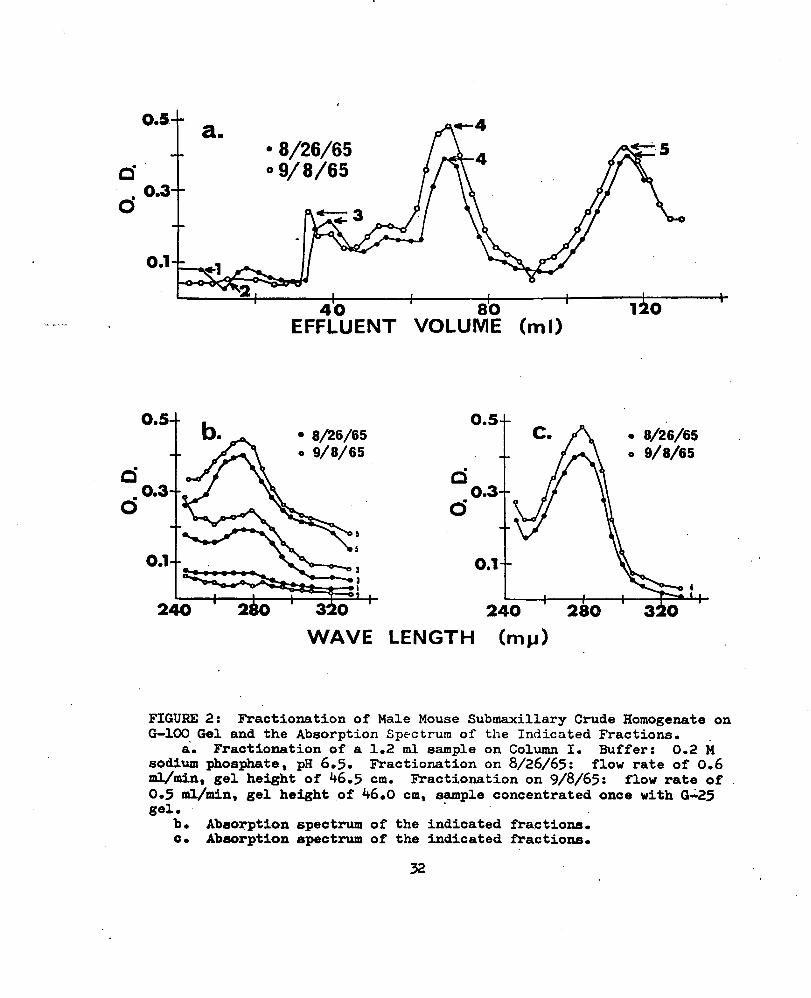
Homogenate on G-lOO Gel and the Absorption Spectrum of the Indicated Fractions..................32
3. Separations of Male Mouse Submaxillary Proteinson G-lOO Gel................. ............ 33
4-. Densitometer Analysis of the ElectrophoreticSeparations of Protein Represented by Area A of the G-25 Gel Fractionation and Peak IV of the G-lOO Gel Fractionation..........................35
5. Fractionation of Male Mouse Submaxillary CrudeHomogenate on G-200 G e l ...................... 36
6. Densitometer Analysis of the Electrophoretic Separations of Protein Represented by Area A of the G-25 Gel Fractionation and Peak Dg of the G-200 Gel Fractionation.............. . 38
7. Comparison of the Elution Curve of the Male MouseSubmaxillary Crude Homogenate with the ElutionCurve of the Crude Homogenate Purified byEthanol Precipitation ......................... 39
8. Densitometer Analysis of the ElectrophoreticSeparations of the Proteins in the Male Mouse Submaxillary Crude Homogenate Purified by Gel Filtration or Ethanol Precipitation ............ 40
9. Fractionation of Male Mouse Submaxillary CrudeHomogenate Purified by Precipitation withAmmonium Sulfate................................. 42
viii

LIST OF ILLUSTRATIONS— Continued
Figure Page10. Fractionation of Male Mouse Muscle Crude
Homogenate................... .................11. Fractionation of Male Mouse Thymus Crude
Homogenate.................................... A412. Change in the Average Angle of the Axes of Cells
with the Midline as the Concentration of Submaxillary Protein Varied....................... .56
13. Elution Volumes of Blue Dextran, Peak IV from MaleMouse Submaxillary Crude Homogenate, Trypsin,and Bovine Serum Albumin................... . . 53
14. Elution Volumes of Blue Dextran, Peak IV fromAmmonium Sulfate Purified Male Mouse Submaxillary Crude Homogenate, Tiypsin, and Bovine Serum Albumin......................................59
15. The Relation between Vg / Vq of Proteins andTheir Molecular Weight........................ 6l
ix

LIST OF PLATES
Plate Pagelo The Effect of Some Submaxillary Fractions
upon Outgrovth Pattern................. A7II. The Effect of Thymus and Muscle Extracts upon
Outgrowth Pattern . . . . . . . . . . . . . . 52III. The Effect of Various Concentrations of Sub
maxillary Extract upon Outgrowth Pattern. . . 5?TV. Pattern of Outgrowth between Pancreas, Gut,
and Nerve Explants. . . . . . . . . . . . . . 67
AN IN VITRO OUTGROWTH ORIENTING FACTOR: STUDIES CONCERNING ITAND ITS RELATION TO THE REPORTED GROWTH STIMULATING PROTEINS
FROM THE SUBMAXILLARY GLAND OF MICE
CHAPTER I
INTRODUCTION
Some effects of certain proteins extracted from the submaxillary glands of mice upon cell growth in vitro have been described. These are nerve growth stimulation (Bueker, et a2., 1959; Levi-Montalcini and Cohen, I960), increased division and subsequent kératinisation of cells from the epidermal layer of dorsal skin and the eyelid (Cohen, 1965), enhancement of the growth of lung mesenchymal tissues and dedifferentiation of skeletal muscle and cartilage (Attardi, at al.., 1965), and stimulation and orientation of cellular outgrowth between chick cardiac explants (Bast and Mills, 1963). The nerve growth protein was purified and described by Cohen (i960). The epidermal outgrowth protein was also isolated and described by Cohen (1962). The macromolecular fraction which enhances growth of mesenchymal tissues and causes dedifferentiation of skeletal muscle has been only partially purified and described (Attardi, et ad., 1965). Outgrowth stimulation and orientation of cells from cardiac explants was produced by a crude, water soluble extract from the submaxillary glands, by the extract purified by ethanol
1

2precipitation, and by the alcohol fraction after it was further purified by precipitation with ammonium sulfate. No description of the orienting factor was reported (Bast and Mills, 1963).
The studies of nerve growth stimulation in vitro and in vivo were conducted mainly with a highly purified fraction of the water soluble extract from the mouse submaxillary glands (Levi-Montalcini and Booker, 1960a; Levi-Montalcini and Booker, 1960b; Levi-Montalcini and Cohen, I960; Cohen, I960). The purification processes involved ethanol precipitation; ammonium sulfate precipitation; DEAE cellulose anion exchange; and three cation exchange columns, the products of which were called the CM-1 fraction, the CM-2 fraction, and the GM-3 fraction. When the least pure of the ion exchange purified proteins, CM-1 fraction, was administered to newborn mice, there was a loss of body weight and stunted growth, a failure of hair growth, a precocious opening of the eyelids, and a precocious eruption of the upper and lower incisors. These effects were not present in the mice treated with the more purified CM-3 fraction. In 1962 Cohen isolated and characterized a heat stable protein from the CM-2 fraction which elicited precocious opening of the eyelids and eruption of the teeth in newborn mice, but this protein did not produce stunting or inhibition of growth. These latter two effects were abolished by heating the submaxillary extract. Cohen (1965) used the heat-stable protein for growth enhancement of embryonic chick dorsal skin explants and sheets of epidermal cells removed from the dermis of the eyelid with trypsin.
These studies have indicated that there are at least two proteins in the mouse submaxillary gland that produce effects upon cellular growth in vitro. The outgrowth orienting factor could easily

3be yet another protein which remains in the material retained from the first three purification procedures, i.e., the preparation of the crude homogenate, the ethanol precipitation, and the ammonium sulfate precipitation.
The nerve growth protein from the submaxillary glands of mice has been repeatedly reported to be specific for enhancement of the growth of sensory and sympathetic ganglia with no detected effects on other sectors of the nervous system or other organs (Levi-Montalcini and Booker, 1960a; Levi-Montalcini and Booker, 1960b; Levi-Montalcini and Cohen, I960; Cohen, I960). In vivo specificity of the nerve growth factor for sensory and sympathetic ganglia was demonstrated by the injection of the purified protein from the mouse submaxillary glands into newborn mice or chick embryos (Levi-Montalcini and Cohen, I960). Mitotic counts, volume measurements of cells, photomicrographs of whole mounts of the sympathetic thoracic chain ganglia, and photomicrographs of histological sections of stellate ganglia and superior cervical ganglia were given for the noninjected and injected mice. However, these authors did not report any details in method or results, but merely stated that no effects were detected in other sectors of the nervous system or in other organs. No reports of in vitro studies concerning tissue explants other than sensory or sympathetic tissue could be found.
Cohen (i960) injected the purified nerve growth factor from mouse submaxillary glands into rabbits. He then isolated the gamma globulin fraction which contained antibodies from the serum. The antibody fraction was then injected into newborn mice and almost total destruction of neurons in the sympathetic chain resulted but no effects in

u"other tissues" were observed. Information on which "other tissues" and on how these "other tissues" were analyzed was not found. No in vitro studies using tissues other than spinal and sympathetic ganglia have been reported.
The epidermal growth factor, also present in the CM-1 fraction, has been reported to be specific for enhancing the growth of epidermal tissue (Attardi, et al., 1965; Cohen, 1965). The belief held by Cohen and Elliott (1963) that the epidermal growth factor is specific seems to be based upon the observation that when newborn mice and rats and juvenile mice (12-20 days of age) were injected with the purified protein an enhanced keratinization of the foot epidermis, tail epidermis and dorsal skin epidermis resulted, with no obvious enhancement of the growth of the dermis. The paper did not state whether other tissues in the mice besides the skin from the foot, tail, or back were examined or how they were analyzed. Only dermal and epidermal tissues have been compared in vitro.The fact that the epidermal growth factor enhances in vitro growth of sheets of epidermal cells, even when they were removed from the dermis with trypsin, does not conflict with the idea that the growth-stimulating protein is specific. On the other hand, it does not offer evidence for the specificity of the protein’s effect as Cohen (1965) has implied. Therefore, no conclusive evidence has been reported which rules out the possibility that either the nerve growth factor or the epidermal growth factor is the same as the vitro cardiac outgrowth orienting factor.
The nerve growth factor has been shown to be present in a variety of biological materialsj i.e., mouse sarcoma I80, snake venoms, mouse submaxillary glands (Levi-Montalcini and Cohen, I960), and the combined

]
5axial structures (spinal ganglia, spinal cord, notochtt’d and somite derivatives) of 7-8 day chick embryos (Bueker, et al., I960). Low levels of nerve growth-promoting activity has been reported from cell-free extracts of mouse kidney, thymus, spleen, placenta, heart and voluntary muscles by Bueker, et al., (i960), and in the serum of adult and weanling mice by Levi-Montalcini and Booker (1960a). The epidermal growth factor has been prepared only from the submaxillary glands of adult male mice. Extracts of adult female mouse submaxillary glands, bull and cow submaxillary glands, and sheep submaxillary glands do not produce the characteristic in vivo effects of the epidermal growth factor— the acceleration of incisor eruption and opening of the eyelid in new-born mice (Cohen,1962). The macromolecular fraction which enhances the growth of mesenchymal tissues and causes dedifferentiation of skeletal muscle has only been obtained from the submaxillary gland of mice. Neither effect was obtained with extracts of mouse thymus, liver, kidney, and pancreas (Attardi, et al., 196$).
In 1959 Porath and Flodin separated protein molecules by passing a solution through a column packed with cross-linked dextran gel particles (commercially known as Sephadex). Although the elution volume for a molecule of specific molecular weight varies with the density and volume of the gel in the column, an excellent linear correlation between the common logarithm of the molecular weight and the ratio of the elution volume to the void volume has been reported by various workers. Whitaker (1963) used Sephadex G-75 gel for the molecular weight range of 13,000- 4.0,200 and Sephadex G-lOO gel for 13,000-76,000. Wieland, Duesberg and Determann (1963) used Sephadex G-200 gel for the molecular weight range

6of 13,000-150,000. Andrews (1964.) used Sephadex G-75 gel for the molecular weight range of 3,500-67,000 and Sephadex G-lOO gel for 3,500-160,000.Leach and O’Shea (1965) used Sephadex G-200 gel for molecular weights upto 225,000.
The molecular weight of the nerve growth protein has been estimated as 44,000 from ultracentrifugation (Cohen, I960). The molecular weight of the epidermal growth promoting protein has been reported to be 14,638 on the basis of amino acid composition (Cohen, 1962). The gel filtration molecular weight estimations for these two compounds have not been reported.
Deviation from the radial spreading of cells from an explant, termed oriented outgrowth in this paper, has been explained by Weiss (1934, 1941, 1952) by "contact guidance." According to Weiss (1934) patterned outgrowth is due only to the physical structure of the ground substance. In the case of a plasma clot this would be the orientation of the fibrinogen fibers in the clot. Cells growing out of an explant move along the fibers of the clot and therefore reflect the pattern of the fibers. Not only specificity of the in vitro cardiac outgrowth orienting factor, but also "contact guidance" as a possible explanation of the effect of the submaxillary extract upon the cellular outgrowth pattern between explants, could be further tested by using different types of tissues in the cultures. Sarcoma cells (Abercrombie, 196I), kidney epithelium (Weiss and Taylor, 1956), fibroblasts (Abercrombie, et al., 1957) and nerve tissue outgrowth (Weiss, 1934) have been observed to undergo contact guidance.

7Further study, especially concerning the relationship between
the nerve growth factor and the outgrowth orienting factor seemed necessary. The outgrowth pattern studied in a number of different kinds of tissue culture medium and conditions would give further assurance that the extract was responsible for the oriented growth. The nerve growth factor is reported as being highly specific for nerve cells. This response would be compared by subjecting several different types of tissue to the outgrowth orienting factor. Extracts of two other tissues, skeletal muscle and thymus, would also contribute toward the relationship as some growth promoting proteins from the submaxillary gland are reported to be limited in origin. Early crude extracts which contained the outgrowth orienting factor indicated that it is in the same class of protein as the nerve growth factor. Upon further purification, a description of characteristics such as molecular weight, absorption spectra, lability to pH and temperature changes, and solubility could be compared to the reported characteristics of other mouse salivary gland growth factors.

CHAPTER II
MATERIALS AND METHODS
The submaxillary salivary glands were obtained from adult malemice which originated from Jackson Laboratories and have been maintained
%by the Department of Zoology at the University of Oklahoma. The mice were anesthetized with chloroform and the excised submaxillary glands were placed in sterile 0.1% saline solution at 0°C for approximately A hours. All the tissues were handled as aseptically as was practically possible. Connective tissue and sublingual glands were removed and discarded before the submaxillary glands were frozen and stored at -11°C in the freezing compartment of a refrigerator. Various amounts of submaxillary tissue (wet weight) were collected and pooled on the following separate occasions; 6 g in June, 1963; 12.5 g in July, 1964; 2 g in October, 1965; and 6.7 g in January, 1966. Adult male mouse skeletal muscle (thigh), 1 g in July, 1964, and 4 g in October, 1965, and thymus from male mice 2-6 weeks old, 1 g in July, 1964, and 0.6 g in February, 1966, were collected. The various types of tissue were pooled and handled separately, in the same manner as the submaxillary glands.
At the beginning of the extraction process the tissue was thawed and placed in a chilled semimicro. Waring blendor Monel metal jar and 8.25 ml of cold, glass-distiled, sterile water were added for each gram
8

9(wet weight) of tissue (Cohen, I960). After homogenizing the tissue for 2 min in the Waring blendor, maceration was completed in a glass tissue homogenizer (Kontes, Size 0) which was kept in. an ice bath. The homogenates were centrifuged (Servall Refrigerated Automatic Centrifuge, Model RC-2; rotor head radius, 4..25") at 15,000 x g (11,250 rpm) for 10 min at a temperature of 0-3°C. All centrifugations were performed with this centrifuge and head and at the same temperature, time, and force unless otherwise indicated. After centrifugation the supernatant was decanted and saved. All residues were resuspended in 2.75 ml of glass-distilled, sterilized water for each gram of original tissue (wet weight) and discarded. Once, with the 6 g sample of submaxillary tissue (June, 1963), these first two centrifugations were at a force of 27,000 X g (15,000 rpm).
The nucleoproteins were precipitated from the supernatant by a modification of Cohen's method (i960). One ml of streptomycin sulfate solution, 0.2 M, was added to each 9 ml of the pooled supernatant solution and the pH immediately adjusted to 6.9-7.1 with NaOH. Once Cohen's procedure was followed exactly. With the 6 g sample of the submaxillary tissue (June, 1963) the pH of the streptomycin sulfate solution was adjusted to 7.8 with NaOH before its addition to the pooled supernatant solution. The mixture was placed in the refrigerator overnight and then centrifuged. The supernatant was stored at -11°C. The material prepared in this fashion will be called crude homogenate throughout this paper. It was used as the starting material for the alcohol purification, the ammonium sulfate purification, and for most of the separations on the gel chromatography columns. Before its application on the gel chromatography

10columns, the crude homogenate was centrifuged for 5 min or filtered through a cellulose membrane filter (Millipore, pore size 0.U5 Type Code HA.).
Some of the proteins were removed by precipitation with alcohol following Cohen's method of purification of the nerve growth stimulating factor (Cohen, I960). In this purification step each ml of the crude homogenate which was used was combined with 0.07 ml of absolute ethanol. The mixture was placed in the cold centrifuge (0°C) and the precipitation reaction was allowed to proceed for 15 min before the mixture was centrifuged. The precipitate was discarded and 0.33 ml of absolute ethanol was added for each ml of the original solution. The second alcohol treatment for 4-5 min at 0°C was followed by centrifugation; the supernatant was discarded and the active fraction was taken up in 0.1 ml of water for each ml of crude homogenate. This material was filtered through a cellulose membrane filter before it was used for electrophoretic and gel column fractionation analysis.
Cohen's method (i960) of ammonium sulfate purification was used. The pH of a saturated ammonium sulfate solution was adjusted to 7.4- with ammonia. Two-thirds ml of the saturated ammonium sulfate solution was added to each ml of the crude homogenate used in this purification step. The mixture was placed in the cold centrifuge (0°C) and allowed to stand for 15 min before the mixture was centrifuged. The precipitate was discarded and the supernatant was combined with an equal volume of saturated (NH^)2S0^ solution. The second precipitation reaction proceeded for 15 min at 0°G and the mixture was centrifuged. The supernatant was discarded. The precipitate was dissolved in 1 ml of glass-distilled

11water. This material was analyzed by fractionation on a gel chromatography column.
Four types of cross-linked dextran gels (Porath and Flodin,1959), commercially known as Sephadex G-25, G-75, G-lOO, and G-200, were used as packing material in the chromatography columns. The dry Sephadex powder was suspended in an excess of liquid ((0.03 M sodium phosphate buffer, pH 6.5; 0.005 M Tris (hydroxymethyl aminomethane) HCl buffer, pH"s.7.2; or glass-distilled water)) and allowed to swell. The swelling times were at least; G-25, 1 day; G-75, 4 hr; G-lOO, 1 day; and G-200,4 days. Repeated sedimentation and décantation removed fine particles.
Two styles of chromatography columns were used. Both were glass. One column had an inside diameter of 1.8 cm and length of 51 cm.The lower end tapered from 1.8 to 0.5 cm in 1.25 cm. The exit of this column was a glass tube 0.5 x 2 cm. A 0.5 x 15 cm piece of polyethylene tubing was tightly fitted into the 0.5 cm bottom of the column with a ring of the appropriate size and thickness of tubing. A clamp on the polyethylene tubing was used to prevent buffer flow during periods when the column was not in use. In order to achieve better resolution the lengths of the columnar exit and of the polyethylene tubing were reduced in later experiments to approximately 0.75 cm and 4-6 cm respectively.This column will be referred to as Column I.
The other chromatography column had an inside diameter of 2.2 cm and was 80 cm high. A sintered glass filter (extra coarse pore size) was fixed in the lower end. A 1 mm bore ground glass stopcock was fitted into the bottom of the column by centering it in a hole in a #3 neoprene stopper pressed approximately 2 mm from the sintered glass filter.

12The column was cooled by a water jacket, an outside glass tube whose diameter was 3.5 cm. This column will be referred to as Column II.
Column I was prepared for use in the following way. The columnar exit of the column was tightly packed with glass wool. The tapered portion of the column was filled with approximately 1 cm of glass beads.^ The column was filled with 20-30 cm of buffer. Vertical alignment of the column was established with a plumb line. A funnel reservoir was attached to the top of the column and the homogeneous slurry of the swollen Sephadex gel particles of the desired porosity was added. After about 10 cm of the gel had settled on the beads the clamp was opened and the gel packed as buffer flowed through the column. Excess gel was removed from the funnel reservoir with a pipette. The height of the gel bed varied from 42.5 cm to 4-6 cm. When this column was packed with Sephadex G-200 gel a slurry of swollen Sephadex G-25 gel, which settled to form a layer of approximately 0.75 cm, covered the glass beads before the gel of fine particle size was packed.
Column II was prepared by covering the sintered glass filter with beads to form a 2-3 mm layer, adding a slurry of swollen Sephadex G-25 gel which settled to form a 3-4 mm layer, filling the column with 25-50 cm of buffer, and adding the homogeneous slurry of swollen Sephadex G-200 gel into the column and the attached funnel reservoir. After about 10 cm of the gel had settled the stopcock was opened and the remainder of the column was packed under buffer flow. Water from a refrigerated bath (Fisher, Isotherm) was circulated through the water jacket on this column.
^#12 glass glow beads; the type used in art work, i.e., signmaking.

13 .
The temperature of the water in the reservoir of this refrigerated bath was 10° + 1°C.
The columns packed with the G-lOO gel and G-200 gel were stabilized by washing with buffer solution for at least 5 hr. A filter paper disc, the diameter of the column, was placed on the top of the gel in the smaller column to prevent disturbing the gel bed during the application of the sample and buffer, but no paper disc was necessary on the gel in the larger column. Before application of the sample most of the buffer above the gel bed was removed with a pipette, then the stopcock or clamp at the bottom was opened and the last few ml of buffer were allowed to soak into the gel bed. When the fluid level reached the gel surface the sample was applied.
The volume of buffer outside the gel grains in the column bed, also known as the void volume (V^), was determined by applying a 0.5 ml,1 ml, or 2 ml sample of a 0.2# solution of a dextran polymer with an average molecular weight of 2 x 10^, Blue Dextran, (Pharmacia Fine Chemicals, Inc.) to the chromatography columns. The volume of buffer required to elute this substance, which is excluded by the gel granules, is the void volume. The effluent was collected in vials and the volumes of the collected fractions from the time of the application of the sample were determined by weight to the nearest 0.01g(Torsion balance, Model DLT2).One ml was assumed to weight 1 g at room temperature. Blue Dextran absorbs light strongly at a wave length of 625 mp (Technical brochure, "Blue Dextran 2000", Pharmacia Fine Chemicals, Inc.) and the light absorbance of the effluent was measured at this wave length on the Beckman DU Spectrophotometer. The amount of light absorbed was plotted against

14the total effluent volume. The amount of light absorbed by the effluent increases as the dye emerges from the gel bed and decreases as the dye is washed from the gel. The increased absorbance when the dye was present in the effluent resulted in a peak on the graph and also indicated the volume of effluent that contained the dye. The elution volume of the sample of Blue Dextran was determined from a graph by extrapolating both sides of the solute peak to an apex and reading the elution volume of this peak to the nearest 0.1 ml from the x axis under this point. The total volume of the sample of Blue Dextran applied to the gel bed was used to estimate the dilution factor of the gel bed. The visible movement of the Blue Dextran through the column bed was a means of evaluating the uniformity of the packing of the gel and the column design.
The elution volume (V^) of a sample which contained protein was determined in the same way as the void volume (Vq) except that the protein in the effluent was determined by measuring the amount of light absorbed at 280 mp (Goldfarb, et al., 1951). Again, the amount of light absorbed by the effluent increases as the proteirrmaterial emerges from the gel bed and decreases as the protein is washed from the gel. A linear relation exists between the ratio of elution volume to void volume and the common logarithm of the molecular weight of the material washed from the gel, Vg/V^ = log mol. wt. (Whitaker, 1963). The smaller chromatography column (Column l) was calibrated with a 0.5 ml sample which contained either 10 mg of reconstituted, lyophilized trypsin (Nutritional Biochemicals Corp., Cleveland, Ohio), molecular weight 23,800 (Cunningham, 1954), or 12.5 mg of bovine serum albumin (Mann Research Laboratories, Inc., New York, New York), molecular weight 67,000 (Loeb and Scheraga, 1956).

15Large sample volumes of 7-10 ml were applied to the columns of
G-25 or G-75 gel. Smaller sample volumes of 0.5, 1 dr 2 ml were used on columns of G-lOO or G-200 gel. After the sample entered the gel,buffer was added. Attached to the top of the column was a reservoir of buffer so that there would be a hydrostatic pressure of approximately 20-30 cm of water on the gel bed in Column I or 10-12 cm of water on the gel bed in Column II. Samples of approximately 3 ml were collected. These samples were weighed whenever void volume determinations of the gel bed were made. The samples were stored in 5 ml glass vials at -11°C. Before the purified extract was used in culturing it was sterilized by filtration through a cellulose membrane.
Fractionation was monitored by measuring the absorption of light in the ultraviolet range (usually at a wave length of 280 mp, but 290- 310 mp were also used where this is indicated in the results) with a Beckman Model DB Spectrophotometer with a constant flow-through, silica • absorption cell and continuous recorder; or by reading the amount of light absorbed by the collected samples at a wave length of 280 mp on a Beckman Model DU Spectrophotometer with photomultiplier attachment and the hydrogen lamp. Silica absorption cells (Beckman) which transmit light in the wave length of 220 to 2500 mp were used for both the reference and the sample solutions. Readings were corrected for interference by ultraviolet absorbing material, spontaneously released from the dextran gels (Ackers, 19&A), by setting transmission at 100# with the buffer from the washed down column. The 100# transmission level was set with unused buffer when G-25 gel, G-75 gel, and twice when G-lOO gel (8/26/65 and 9/8/65) was used.

16The absorption spectrum for some of the fractions from the gel
separations was determined. Measurements were generally made for wave lengths separated by 1 mp in the wave length range of 270 to 285 mp, every 5 mp from X = 2.̂ 5 to 270 mji and from 285 to 310 mji, and every 10 mp from X = 310 to 330 mp. Measurements always proceeded from the shorter to the longer wave lengths. The light absorption measurements are reported in terms of per cent transmission and optical density. The per cent transmission was read from the Beckman Spectrophotometer; the optical density was determined from a table (Hodgman, I960).
The crude homogenates of the male and female mouse submaxillary glands used by Bast and Mills (1963) were compared by paper chromatography with the protein material in the first peak (as judged by light absorption at A = 280 mp) of the effluent packed with G-25 gel. The chromatographic solvent, butanol-water-acetic acid, was prepared by mixing 4 parts of n-butanol, 5 parts of metal-free water, and 1 part of glacial acetic acid. The lower phase from this mixture was put into a glass container in the bottom of the 41 x 75 x 63 cm chromatographic chamber. The upper phase of this emulsion was used as the developing phase in the descending chromatographs. Samples of 5 lambda were placed 5 cm from the edge of the chromatographic paper.
After developing, the chromatograms were dried, placed in methanol for 5 min and stained for 10 min in a bromophenol blue dye solution, prepared by combining 2 ml of glacial acetic acid, 1 g of mercuric chloride, and 0 .05 g of bromophenol blue powder in a volumetric flask and bringing the volume to 100 ml with glass-distilled water.Three six-minute rinses in 5% glacial acetic acid followed. The dried

17chromatogram was exposed to ammonia. This procedure detects large protein molecules. Another dried chromatogram was sprayed with ninhydrin {0.3% ninhydrin in 95% ethanol), a detector for amino acids and small peptidea
Some of the protein fractions were concentrated by adding of 133 mg of dry Sephadex G-25 gel (Medium) to each ml of sample solution (Flodin, et ad., I960, modified). After addition of the G-25 gel it was allowed to swell for at least 4-5 min and was removed either by suction filtration on a Buchner funnel (1.5 cm inside diameter), using filter paper cut to the appropriate size (Whatman, No. l), or by filtering the sample through a cellulose membrane filter. This procedure was sometimes repeated as many as four times, depending upon the final concentration desired before electrophoretic studies were made. Aliquots of some of the concentrated submaxillary crude homogenate were also fractionated on chromatography columns of the G-lOO and the G-200 gels.
Prior to lyophilisation 15 ml aliquots of the protein material represented by the first peak obtained by purifying the submaxillary crude homogenate on Sephadex G-25 g®l (Table I, 12/65) and material represented by Area Dg (Fig. 5d) were desalted on chromatography Column I packed with Sephadex G-25 gel which had been washed with glass distilled water. Porath and Flodin (1959) originally introduced this technique of gel filtration for desalting protein solutions. The desalted protein solutions, pH 6.9 or 7.0 were stored frozen at -11°C for1-3 days before lyophilisation. Approximately 30 ml of the protein solution were frozen in each conical lyophilisation flask, then lyophil- ized according to standard procedures.

18Electrophoresis of variously purified protein fractions was
carried out on 1" x 4 l/2" - 6 3/4" cellulose polyacetate strips (Gelman Instrument Co. or Millipore Filter Corp.) in a modified Beckman Model R Electrophoresis Cell as described by Dillard (1966). The cell was filled with barbiturate buffer, ionic strength 0.075, pH 8.5. The electrophoresis strips were pretreated by floating them on buffer in a plastic tray. The cellulose polyacetate strips from Gelman Instrument Co. were pretreated for approximately 10 min; the cellulose polyacetate strips from Millipore Filter Corp. were pretreated for approximately 3 min. The wet strips were placed on the extended folding rack and this rack was placed in the cell. The lid was sealed onto the cell with tape and the atmosphere was equilibrated for at least 15 min. A 20 or 30 lambda sample was applied to the strip with a sample applicator (Beckman #320005). A current of 6-10 milliamperes, applied for 35 min to 3 l/4 hours, was supplied from a regulated power supply (Reco, Model E-800-2).
The cellulose polyacetate strips were removed immediately after electrophoretic separation. They were dried between sheets of blotter paper at 37°C and stained for approximately 15 min in Napthol Blue Black (Colour Index No. 246; Conn, 1953), 1 mg/ml in 10% acetic acid. After2-3 rinses in a 5% water solution of glacial acetic acid the cellulose polyacetate strips were made transparent in the following way.
Either dried or drained strips were placed in a 95% ethanol rinse for 1-3 min. A glass plate was placed under the strip to prevent stretching of the strip while handling it. The strip on the glass plate was placed in the clearing solution of 25% glacial acetic acid and 75% ethanol (95%) for 1-3 min. The excess liquid was removed by pulling a rubber
19squeegee gently and evenly over the whole length of the strip. The strip was peeled off the glass plate after it was dried in an oven at 80-110°G for approximately 30 min or air dried overnight.
The electrophoretic strips were analyzed with a scanning densitometer (Photovolt Scanner, Model 520; Photovolt Densitometer,Model 501a) that had a 2 mm aperture. The instrument was adjusted to zero optical density at the place of least light absorbance on the electrophoretic strip. The strips were scanned from the anodal end beginning at a position 16 mm from the origin. Optical density readings were recorded at each mm as the electrophoretic strip was moved from the 16 mm position, through the origin, to a position 55 mm in the cathodal direction.
The various fractions from the gel purifications of the submaxillary gland muscle, and thymus homogenates were assayed for their effect on cells grown in tissue cultures. Cultures were grown in Maximow deep depression slides or 30 ml plastic tissue culture flasks (Falcon Plastics), The culture medium usually consisted of 20^ embryo extract (Bast and Mills, 1963) and 80^ Simms (1942) solution. A few times several other media were used. One consisted of 5 drops of horse serum (Difco Laboratories) and 2 ml Simms solution. Another was 5 drops, of agamma horse serum (Hyland Laboratories) and 2 ml Simms solution. .A third consisted of 10% Tissue Culture Medium #199 (Morgan, e;t al..1950), 70% Hanks solution (Hanks and Wallace, 1949), and 20% agamma horse serum. Buffered (4.5% sodium citrate) penicillin G (Eli Lilly and Co.), 200 units/ml of medium, was the antibiotic usually used, but once mycostatin (E. R. Squibb and Sons) in the amount of 200 units/ml of
20medium and once in the amount of 100 units/ml of medium was used. Whennecessary the pH of the media which contained Simms solution was adjustedwith IN NaOH or with 00^. The pH of the medium which contained Hankssolution was adjusted with 7.5% or 10% Na^CO or with CO . The measured< - 3 2pH of the medium was 7.3-7.5 when it was used (Beckman Model 76 expanded scale pH meter).
Monolayers of cells were grown from explants on the surface of the plastic culture flasks or the cover glasses of the Maximow depression slides in a medium which consisted of 10% T. C. Medium # 199, 70% Hanks and 20% agamma horse serum. Cells were grown in plasma clots in all the media described. The plasma clots were prepared by combining equal amounts of embryo extract and reconstituted, lyophilized chick plasma (Difco) with approximately 20-30 tissue explants. These three components were immediately stirred with a stainless steel insect pin or hypodermic needle and allowed to form a clot which adhered to the cover glass. The
3tissue explants, approximately 0.125 mm , were obtained by dicing selected tissue from White Leghorn chick embryos. Usually the embryos were 7-9 days old. The tissues selected were chick heart, kidney, liver, gut, posterior limb, or spinal cord. Embryonic mouse heart tissue, 14. and 15 day embryonic chick spinal cord tissue, and 14- day embryonic chick pancreas tissue were also cultured.
After the clots had formed the cover glass was inverted over the depression slide and sealed with paraffin. The completed culture slides were labeled, placed in wooden racks, and incubated (cover glass down) at 37°C. When the cultures were incubated longer than 24- hours the . slides were inverted at the beginning of the second day.

21Culturing operations were performed in a 61 x 153 x 55 cm dry
box which had been sterilized by washing the interior with a surface active bactericidal and mycocidal agent (Cetylcide) and exposing it to UV light for at least one hour. A slanted, 150 x 31 cm plate of glass on the front permitted a view of one's work. A.16 cm opening across the bottom of the front provided an entrance for hands and arms. Hands and arms were scrubbed with soap and water, rinsed with a bactericide and dried on a sterile towel before placing them in the cabinet. A continuous, regulated flow of filtered air into the dry box maintained a positive air pressure and reduced the possibility of bacterial or mold spores entering the cabinet. When needed, a regulated flow of COg into the dry box was available. A binocular, wide-field, dissecting microscope (Bausch and Lomb "StereoZoom"), with eye pieces projecting through an opening in the glass front of the dry box, and two variable intensity dissecting lamps (Bausch and Lomb) were also available inside the dry box for aid in dissections and dicing of the tissue.
Fine dissecting instruments, microsyringes, and the Millipore filter holders and filter discs were sterilized by immersion in 70% alcohol for at least 15 min. Glassware was sterilized in a steam autoclave for 15-30 min at 15-20 lbs/in^ pressure and 121°G, then heat dried. Dishes were routinely washed in a 1% solution of a non-toxic neutral liquid detergent (7X). They were rinsed with running tap water, distilled water, and three changes of glass distilled water, then air dried.
At each culturing session the materials, the method of preparation, and the time of incubation before observing and photographing the outgrowth

22from the expiants were the same for the control cultures and for each group of experimental slides. Usually the proteins extracted from the mouse tissues which were added to the experimental culture slides were dissolved in 15 pi of sodium phosphate buffer (pH 6.5), but 1.5, 5, 10, 11, 4-5, 60 and 150 pi of extract were also used. The kinds and the amount of the mouse tissue proteins in the volumes added varied with different purification procedures and different stages of the same purification procedure.
The weight of the extracted mouse submaxillary protein in one ml of the extract represented by Area A (Fig. la) of the Sephadex G-25 gel fractionation from November, 1963, was 3 mg. This was determined by washing 2 pieces of dialzying tubing in water, drying them, placing a 1 ml aliquot of the protein extract into one of the pieces of tubing, dialyzing against water at 3°C for one week with frequent changes of glass-distilled water (the empty piece of dialyzing tubing was in the same container), drying them in the air for one week followed by drying in a desiccator for 2 weeks, and weighing them on an analytical balance (Mettler, Type H-6). Two sets of five weighing each were taken and averaged. After the weighing the dialyzing membranes were softened in water. The one which contained the protein extract was slit open and washed. Both samples of dialyzing membrane were washed and dried as before. Each piece of dialyzing membrane was weighed 5 times and the weights averaged. The piece of dialyzing tubing which did not contain the protein extract served as a control. The length of time each piece of tubing was removed from the desiccator for weighing was approximately the same in all instances.

23In general the pattern of outgrowth was determined as radial
or oriented by inspection of the culture slides in all the cultures studied in 1964. and 1965. These cultures were almost always photographed. A quantitative assessment of the extent of oriented outgrowth as influenced by the amount of submaxillary protein added to the experimental culture or water added to the control cultures was attempted. This study was done in 1966 by an analysis on photomicrographs of the outgrowth between cardiac explants.
A stock solution of the lyophilized, desalted mouse submaxillary extract, represented by Area A of the G-25 fractionation (Fig. la) was prepared by dissolving 5 mg in 5 ml of glass-distilled water. -Eleven,20, 27, or 4-5 pg of protein in 11, 20, 27, or 45 pi of water were added to the 2.5 ml of medium in each of the experimental culture slides. An aliquot of the protein stock solution was diluted with an equal volume of water. Forty-eight pi (24- pg) were also used in experimental culture slides.
In the quantitative analysis of the photomicrographs a line was drawn connecting the midpoint of the widest part of each pair of expiants on the print. This line is called the midline. Lines parallel to and approximately one cm from it were constructed on both sides. The cells in this midregion strip, one cm on each side of the midline, were not analyzed. Lines parallel to the midline and 3 cm from it were drawn on either side of the midregion. The cells in these two strips, each 2 cm wide, were analyzed.
A line was drawn through the long axis of the cell body of the bipolar cells. The angle between this line and the midline was measured.

24The part of the cell nearer the explant was called the proximal end.When the proximal process of the cell was nearer the midline, the angle was designated as positive; when the distal end was nearer the midline the angle was designated as negative. If the axis of the cell were parallel with the midline, its angle was zero. Any cell suspected of being an amoebocyte was disregarded. For each photomicrograph the sum of these angles was divided by the number of angles measured and this average number of degrees was plotted against the amount of submaxillary protein added to the culture slide. The algebraic sum tended to be closer to zero the more the fibrocytes tended to be parallel to each other. The average angle for all of the cells grown in the presence of a particular amount of submaxillary protein was also calculated and plotted. These averages determined the shape and placement of the curve in Fig. 12j All explants in all the cultures which were closer together than 0.70 mm, far enough apart to have an outgrowth region between them, and not close enough to a third explant to have the outgrowth region visibly affected by this third explant were photographed. Twice the outgrowth region between explants which were 0.71 and 0.75 mm apart were photographed on separate negatives and the outgrowth regions analyzed as described when both explants were close enough to be photographed at the same time.
Control cultures were prepared for this variation-in-concentra- tion study by adding 11, 20, 27, or 4-5 pi of water to the 2.5 ml of medium in each culture slide. Photomicrographs were taken and analyzed, and the data plotted, as described for the experimental cultures.
Lability of the outgrowth orienting protein was tested by heating aliquots of the protein material in solution to 100°G or by treating the

25protein for 1 hr in a 0.1 N HGl or 0.1 N NaOH solution. The activity of the boiled extract, 15 pi per culture slide, was tested. Ten pi of a1 N solution of acid or base was added to 90 pi of the protein fraction represented by Area A of the G-25 fractionation of November, 1963 (Fig. l), or the protein fraction represented by Area Dg of the G-200 gel fractionation (Fig. 5d). After one hr, 15 pi of this material were added to the medium in the experimental slides, or the pH of the treated protein solution was readjusted. The pH of the submaxillary extract treated with NaOH was not readjusted to near neutrality. The measured pH of the culture medium in these slides was 7.6-7.8. Once, when testing the material in Area A of the G-25 fractionation for NaOH lability,15 pi of 0.1 N NaOH (90 pi of water and 10 pi of 1 N NaOH) were added to2 culture slides, as a type of control culture. The pH of the submaxillary protein solution treated with 0.1 N HGl was readjusted by adding an equal volume of 0.1 N NaOH. Fifteen pi of this diluted, treated extract was added to the experimental slides.
In examinations of the culture slides a phase contrast and dark field microscope (Bausch and Lomb) was used. Cultures were scanned immediately after preparation. The cultures were observed, descriptive notes taken, and photomicrographs made at 15 or 18 hr, often again at 24. hr, and occasionally at times as long as 4-8 hr after incubation at 37°C. The phase contrast microscope was equipped with a long working distance condenser and a triocular head. Photomicrographs were taken with a 2 1/4."X 2 1/4." camera (Reflex-Korelle) and with microscope lens combinations of 70 X dark field, 200 x phase contrast, and 420 x phase contrast. Panchromatic film was used (Kodak Verichrome Pan or Rex). Prints were

26enlarged 2.1 times.' A stage micrometer was photographed with this enlargement system and used to calculate actual magnifications.
The term "outgrowth" is used in this paper to denote the cells which seem to be growing adjacent to an explant. No distinction was made between cellular hyperplasia and cellular migration from the explant.

CHAPTER III
RESULTS
Purification of the Male Mouse Submaxillary Crude HomogenateExcess streptomycin sulfate from the precipitation of the nucleo-
proteins was removed from three 10 ml aliquots of the male mouse submaxillary crude homogenate (MMSCH) by gel filtration on Sephadex G-25 gel (Table I). Sodium phosphate buffer, 0.02 M and pH 6.5, was used. In these purifications the variations in the amount of ultraviolet light absorbed by the first 72 or 79 ml of effluent indicated the presence of two different groups of protein material of differing molecular weights. These are designated as Areas A and B on Fig. la. The absorption spectra of the materials represented by Area A from the purification in November, 1963, and the comparable peak from the purification in July, 1964-, showed maximum absorption at wave lengths of 276 to 283 mp and minimum absorption at 250 mp (Table II). Analysis of the material represented by Area A on paper chromatography showed no migration in a butanol-water-acetic acid solvent when the chromatogram was stained with ninhydrin or with bromophenol blue. Chromatographic comparison of this material represented by Area A with the male mouse submaxillary crude homogenate and the female mouse submaxillary crude homogenate used by Bast and Mills (1963), stained with ninhydrin, showed more spots and darker spots on the paper chromatogram from the sample of male mouse submaxillary crude homogenate than -
27

TABLE IFÜRIFICATION OF MALE MOOSE SUBMAXILLARY CRUDE HOMOGENATE ON SEPHADEX G-25
DATE OF PURIFICATION 11/63 7/64 12/65Gel bed dimensions— cm (diameter x height)
MMSJH Preparation dateSpectrophotometer ModelAbsorbed light recording method
Wave length— m}iPlow rateReadings recorded
1.8 X 42.06/63DB
Continuous280
1.8 X 42.07/64DB
ContinuousVaried
1.8 X 47.57/64 and 10/65,pooled DU
Aliquot Headings 280
- 0.7 ml/min 1.1 ml/minml t T 0. D. ml mu i> T 0. D. ml % T 0. D.35.5 100 0.000 36.0 280 100 0.000 38 100 0.00036.5 58 0.237 37.0 280 70 0.155 41 45 0.34737.5 3 1.523 40.0 280 0 56 0038.0 99 2.000 53.0 300 0 59 47 0.32858.0 99 2.000- 58.5 300 0 61 47 0.43858.5 23 0.638 61.0 310 60 0.222 64 42 0.37759.5 31 0.509 62.0 310 43 0.319 67 19 0.72160.5 25 0.602 62.5 310 42 0.377 70 8 1.09761.5 19 0.721 63.0 310 45 0.347 73 38 0.55363.5 32 0.495 66.0 310 60 0.222 76 34 0.36972.0 33 0.482 79.0 310 61 0.215 79 /33 0.420
C»
ml — Effluent volumemu —4fàve length56 T — Percent transmission 0, D.— Optical density

do’
8040
EFFLUENT VOLUME (m l)
2.0--
G 1 .0-
8040
EFFLUENT VOLUME (m l)
FIGURE 1: Fractionation of Male Mouse Submaxillary Crude Homogenate onG-25 Gel and G-75 Gel. A 0.02 M sodium phosphate buffer, pH 6.5 was used.
a. Fractionation of a 10 ml sample on G-25 gel in Column I. Date: 11/63. Height of gel: 42.0 cm.
b« Fractionation of a 10 ml sample on G-75 gel in Column I. Flow rate: 1.0 ml/min. Height of gel: 43.0 cm.
29

30TABLE II
ABSORPTION SPEOTRA FOR MALE MOUSE SUBMAXILLARY CRUDE HOMOGENATE REPRESENTED BY AREA A, FIG. la
WAVELENGTH(m)i)
November. 1963 Julv. 1964%Transmission
OpticalDensity
%Transmission
OpticalDensity
245 92 0.036 42 0.377250 93 0.032 51 0.292255 91 0.041 50 0.301260 89 0.051 46 0.337265 85 0.071 40 0.398270 85 0.071 36 0.444271 36 0.444272 84 0.076 35 0.456273 - — 35 0.456274 84 0.076 34 0.469275 ■ 84 0.076 34 0.469.276 83 0.081 33 0.482277 83 0.081 33 0.482278 83 0.081 33 0.482279 83 0.081 33 0.482280 83 0.081 33 0.482281 83 0.081 33 ■ 0.482282 83 0.081 33 0.482283 83 0.081 33 0.482284 84 0.076 34 0.469285 85 0.071 35 0.456290 88 0.056 43 0.367295 92 0.036 57 0.244300 ,95 0.022 71 0.149305 96 0.018 79 0.102310 97 0.013 82 0.086320 98 0.009 . 85 0.071330 98 0.009 86 0.067

31from the sample of female mouse submaxillary crude homogenate. Some protein material did not move from the origin.
Fractionation of a 10 ml aliquot of MMSCH on Sephadex G-75 (Fig. lb; Table III) monitored at a wave length of 290 mp with the Beckman DB Spectrophotometer, equipped with the continuous recorder, showed little separation. More separation was achieved with a smaller sample volume and Sephadex G-lOO (Fig. 2a; Table IV). Differences in the height of the gel in Column I and the concentration of the material in the sample applied to the gel resulted in some variations in the height and position of the peaks of absorbed ultraviolet light. The absorption spectra of the material in the effluent fractions numbered 3 and 4- in.Fig. 2a (Fig. 2b; Tables V and VI showed maximum ultraviolet light absorption at or near )\ = 280 mp. The absorption spectra of the materials in the fraction numbered 5 showed maximum absorption at X = 275 mp (Fig. 2c; Table VI). The absorption spectra of the materials in the fractions numbered 1 and 2 (Fig. 2b; Table V) showed no definite peak of maximum absorption, but rather slight random fluctuations. Increased separation of the material represented by peaks V and VI in Fig. 3a (Table VII) was achieved when the sample was reduced to 0.5 ml.
Ten mg of lyophilized submaxillary protein, represented by Area A of the G-25 fractionation of December 1965 (Table l), had 4 peaks in the first 80 ml of the effluent (Fig. 3b; Table VIIl). The four peaks of absorbed ultraviolet light were assumed to represent four .groups of protein molecules of different molecular weight. The lyophilized material was dissolved in 0.5 ml of 0.02 M sodium phosphate buffer, pH6.5, and the same kind of buffer was used to equilibrate the gel, A
0.5 “
8/26/659/8/65û*
0.3--O’
0.1-1
8040EFFLUENT VOLUME (m l)
0.54 8/26/659/8/65
Q'd
0.3 ■
0.1--
240
8/26/659/8/65
d0.3
O'
0.1
240 280
W AVE LENGTH (m p)
FIGURE 2: Fractionation of Male Mouse Submaxillary Crude Homogenate onG-lOO Gel and the Absorption Spectrum of the Indicated Fractions.
a. Fractionation of a 1.2 ml sample on Column I. Buffer: 0.2 Msodium phosphate, pH 6.5. Fractionation on 8/26/65: flow rate of 0.6ml/min, gel height of 46.5 cm. Fractionation on 9/8/65: flow rate of0.5 ml/min, gel height of 46.0 cm, sample concentrated once with G-25 gel.
b. Absorption spectrum of the indicated fractions.c. Absorption spectrum of the indicated fractions.
32

I V0.2
40 80 120>^ 0.6+<0zLUQ
0.4_j<O£ 0.2- o
40 80 120
I - III0.2
40 120EFFLUENT VOLUME ( m l)
FIGURE 3i Separations of Male Mouse Submaxillary Proteins on G-lOO Gel. Column I and 0.5 ml sample volumes were used.
a. Fractionation of MMSCH. Buffer; 0.02 M sodium phosphate, pH6.5. Flow rate: 0.4 ml/min. Height of gel; 40.5 cm.
b. Fractionation of 10 mg of lyophilized protein represented by Area A of the G-25 fractionation. Buffer; 0.02 M sodium phosphate, pH 6.5. Flow rate,; 0.5 ml/min. Height of gel; 45.4 cm.
c. Fractionation of 5 mg of lyophilized protein represented by Area A of the G-25 fractionation. Buffer; 0.005 M Tris HCl, pH 7.2, Flow rate: 0.5 ml/min. Height of gel: 45.5 cm.
33

. 34similar elution curve (Fig. 3c; Table IX) was obtained from the separation of 5 mg (in 0.5 ml of Tris HCl buffer) of the same material on a column of G-lOO gel equilibrated in 0.005 M Tris HCl buffer, pH 7.2, although the first three peaks merged into two in this separation.
Electrophoresis of the protein material in peak IV of the G-lOO fractionation (Fig. 2a, sample 4 of 9/8/65) showed, after staining, two dark blue bands which migrated toward the cathode, and a band at the origin. The two cathodal bands corresponded in position with the third and fourth cathodal bands which had been separated electrophoretically from the protein material represented by Area A of the G-25 fractionation. The optical density of the bands were analyzed with the densitometer and these results are diagramed in Fig. 4 (Table X).
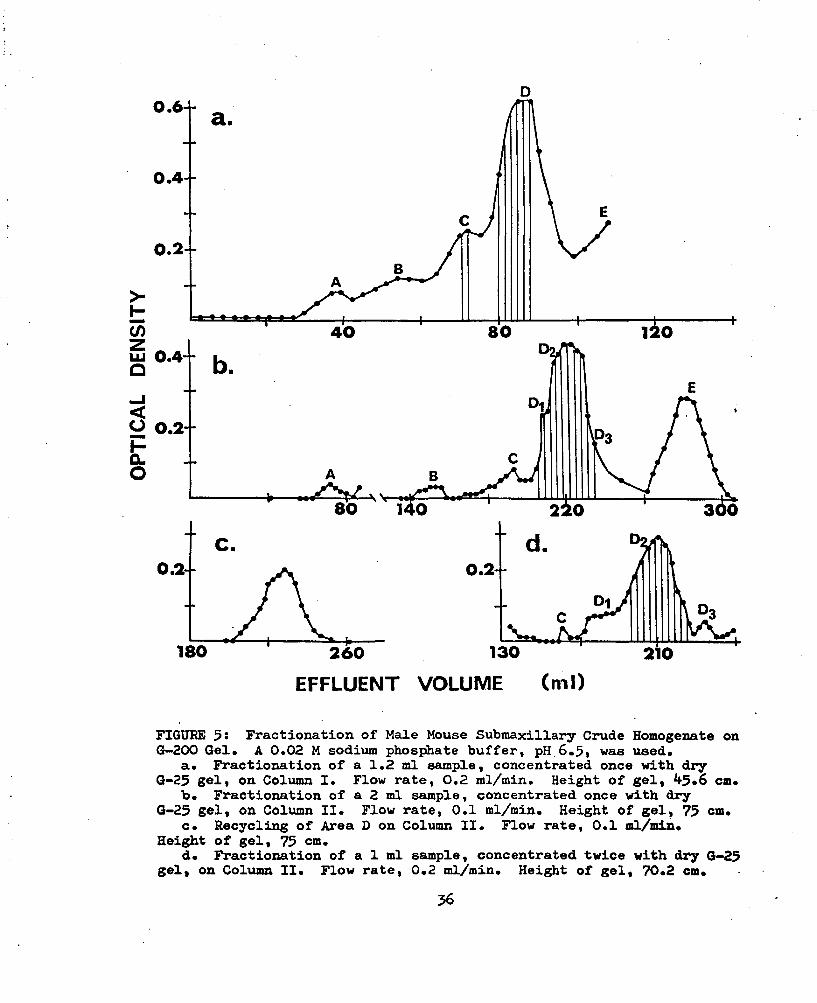
The least cross-linked gel, Sephadex G-200, did not increase the separation previously achieved with the G-lOO gel when a 1.2 ml sample of MbCCH was fractionated on Column I (Fig. 5a, Table XI). Better separation was obtained when a 2 ml sample was fractionated on Column II (Fig. 5b; Table XII). Recycling of the material represented by Area D in Fig. 5b did not increase the separation of the material even though the volume of each of the ten samples was reduced by concentration with dry G-25 gel and each sample was applied consecutively (Fig. 5c; Table XVIIl). Better separation was achieved by reducing the volume of the sample of MMSCH applied to Column II to 1 ml (Fig. 5d; Table XIV). The ten fractions indicated by the vertical lines in Fig. 5d, Area D^, were pooled, desalted and lyophilized. When a sample was electrophoresed the pattern of the bands was similar in number and spacing to that obtained from the same quantity of material represented by Area A of the G-25 fractionation

0.3+
0.2
15 + 15 +30 +45ODISTANCE (mm)
d
d0.1
+45+30+15DISTANCE (m m )
FIGURE 4: Densitometer Analysis of the Electrophoretic Separations ofProtein Represented by Area A of the G-25 Gel Fractionation and Peak IV of the G-lOO Gel Fractionation. The 30 A protein saunples were applied at the distance indicated as zero. The samples were electrophoresed for 90 minutes at 10 milliamperes with the voltage gradually decreasing from 200 to 100 volts. The anodal distance from the origin is indicated as the cathodal distance from the origin is indicated as . The protein in both fractions had been concentrated twice with diy Sejdiadex G-25 gel.
a. Protein Represented by Area A of the G-25 Gel Fractionation.b. Protein Represented by Peak IV of the G-lOO Gel Rcaotionation.
35
0.64-
0.4
0.2
>k-</) 8040ZLU 0.4 O— J <O 0.2
t ..O
300
D:
0.2 0.2
180 130260 210EFFLUENT VOLUME (m l)
FIGUEE 5î Fractionation of Male Mouse Submaxillary Crude Homogenate on G-200 Gel. A 0.02 M sodium phosphate buffer, pH 6.5, was used.
a. Fractionation of a 1,2 ml sample, concentrated once with dry G-25 gel, on Column I. Flow rate, 0.2 ml/min. Height of gel, 45.6 cm.
b. Fractionation of a 2 ml sample, concentrated once with dry G-25 gel, on Column II. Flow rate, 0.1 ml/min. Height of gel, 75 cm.
c. Recycling of Area D on Column II. Flow rate, 0.1 ml/min.Height of gel, 75 cm.
d. Fractionation of a 1 ml sample, concentrated twice with dry G-25 gel, on Column II. Flow rate, 0.2 ml/min. Height of gel, 70.2 cm.
36

37(desalted and lyophilized material of the fractionation of December,1965, Table I). These bands of differently charged proteins are represented in Fig. 6 (Table XV). The vertical displacement of the line represents the amonnt of white light absorbed by the densitometer which, in turn, represents the darkness of the band of stained protein on the electrophoretic strip. The relative height of the peaks that are the same distance from the origin are different in the more purified material (protein represented by Area D2) and the less purified material (protein represented by Area A). The relative height of cathodal peak 3 and anodal peak 2 of the protein sample represented by increased and the relative height of cathodal peaks 2 and 5 decreased.
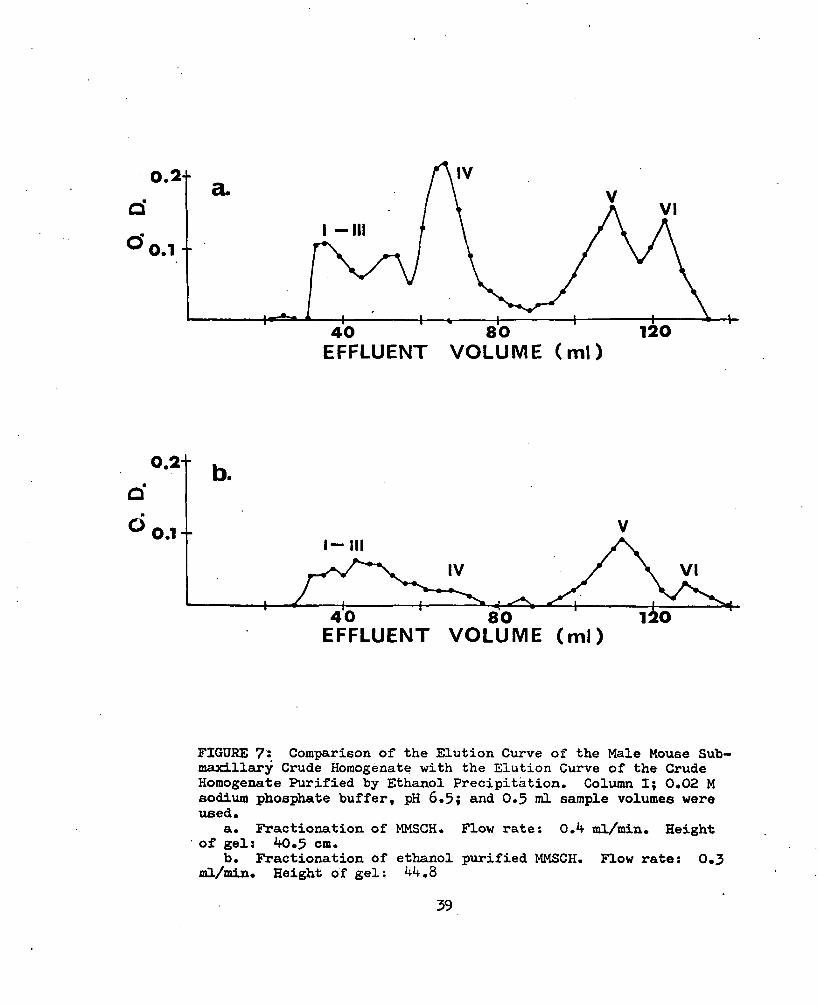
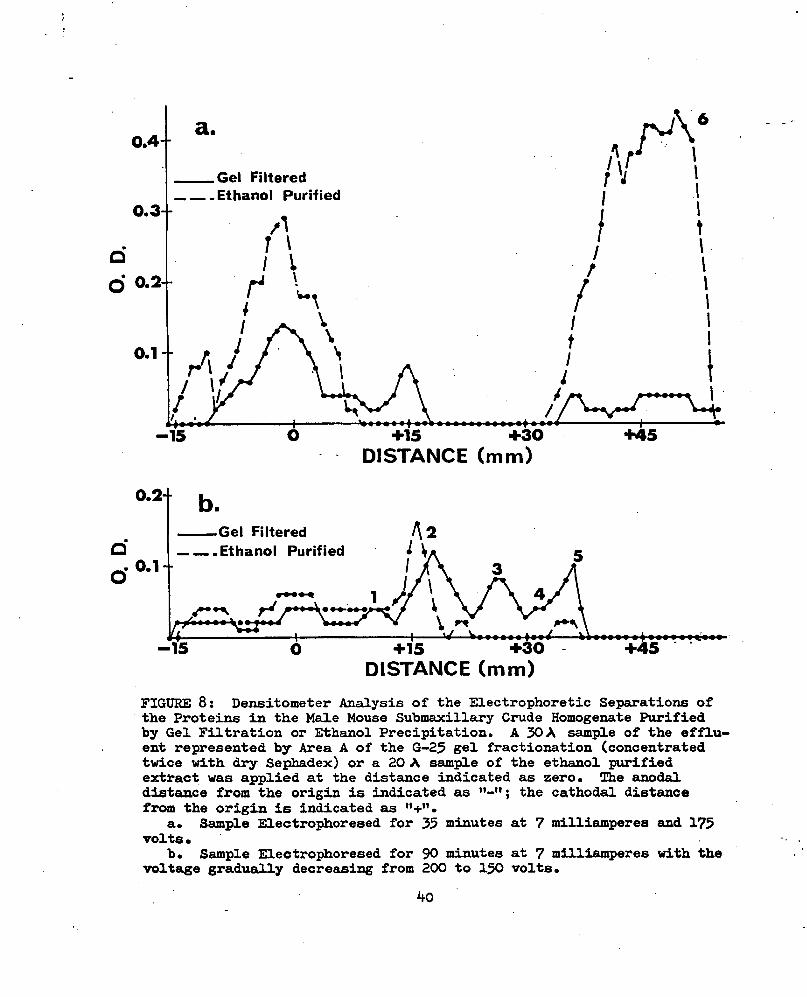
Purification of the MbfâCH by precipitation with ethanol did not eliminate the peaks which were present in the first 135 ml of effluent from the fractionation on Sephadex G-lOO gel, but it did decrease the relative height of peak IV and increased the relative height of peak V (Fig. 7; Tables VII and XVI). Electrophoretic comparison of the proteins in the material represented by Area A of the G-25 fractionation and those present in the material from the alcohol purification showed that bands 2 and 6, especially band 6, were being concentrated by the alcohol purification. Strips were analyzed with the densitometer. Figure 8 shows the amount of light absorbed by the densitometer as peaks (Tables XVII- XX). Due to the short length of the electrophoretic strip the protein material which migrated as band 6 (peak 6, Fig. 8a) was no longer on the
■ strip when the material was electrophoresed for 90 min. The material electrophoresed for 90 min showed better separation of the bands nearer the origin than that electrophoresed for 35 min.

0.3
1-20.2
dd
0.1
+15DISTANCE (m m )
.0.1
DISTANCE (m m )
FIGURE 6: Densitometer Analysis of the Electrophoretic Separations ofProtein Represented by Area A of the G-25 Gel Fractionation and Peak D_ of the G-200 Gel Fractionation. The 20 A samples, each containing 0.4 mg of reconstituted, lyophilized protein, were applied at the distance indicated as zero. The samples were electrophoresed for 1 3/4 hours at 7-10 milliamperes and 200-225 volts. The anodal distance from the origin is indicated as the cathodal distance from the originis indicated as "+".
a. Protein Represented by Area A of the G-25 Gel Fractionation.b. Protein Represented by Peak Dg of the G-200 Gel Fractionation.
38
0.2+O ’
I - IIIO ’ 0 .1
1208040EFFLUENT VOLUME ( m l )
0.2
o’O 0.1 I - III
8040EFFLUENT VOLUME ( m l )
FIGURE 7: Comparison of the Elution Curve of the Male Mouse Suh-maxillsu*y Crude Homogenate with the Elution Curve of the Crude Homogenate Purified by Ethanol Precipitation. Column I; 0.02 M sodium phosj^ate buffer, pH 6.5; and 0.3 ml sample volumes were used.
a. Fractionation of MMSCH. Flow rate: 0.4 ml/min. Heightof gel: 40.5 cm.
b. Fractionation of ethanol purified MMSCH. Flow rate: 0.3ml/min. Height of gel: 44,8
59
0.4--
Gel Filtered Ethanol Purified
0.3 -
d 0.2- u
0.1
+30+15DISTANCE (m m )
0.24
Gel Filtered Ethanol PurifiedQ
+30+15DISTANCE (m m )
FIGURE 8: Densitometer Analysis of the Electrophoretic Separations ofthe Proteins in the MsüLe Mouse Submaxillary Crude Homogenate Purified by Gel Filtration or Ethanol Precipitation. A 30 A sample of the effluent represented by Area A of the G-23 gel fractionation (concentrated twice with dry Sephadex) or a 20 A sample of the ethemol purified extract was applied at the distance indicated as zero. The anodal distance from the origin is indicated as ; the cathodal distance from the origin is indicated as .
a. Sample Electrophoresed for 33 minutes at 7 milliamperes and 173 volts.
b. Sample Electrophoresed for 90 minutes at 7 milliamperes with the voltage gradually decreasing from 200 to 130 volts.
40

41The elution curve of the MMSCH purified by precipitating the
protein with ^0% to "70% saturation of ammonium sulfate showed four distinct peaks in the first 80 ml of effluent when 0.02 M sodium phosphate buffer, pH 6.5 was used (Fig. 9a; Table XXl). The first three peaks merged into two when the column of Sephadex 0-100 was equilibrated with 0.005 M Tris HDl buffer, pH 7.2 (Fig. 9b; Table XXIl). The protein material represented by peaks V and VI were not eliminated but were relatively decreased.
Fractionation of Other Male Mouse Tissue Crude HomogenatesThe excess streptomycin sulfate used to precipitate the nucleo-
proteins was removed from a 7 ml aliquot of the male mouse muscle crude homogenate (MMM3H) by filtration on Sephadex 0-25 gel (Fig. 10a; Table XXIIl). This purification monitored by the Beckman DB Spectrophotometer with the constant flow-through cell and recorder, showed maximum light absorption over a 15 ml effluent volume. This volume is represented as Area A and is divided into two fractions, A^ and A2 in Fig. 10a. Area A was extrapolated to 0% transmission as the wave length was changed to 300 mp in the plateau area in an attempt to detect separation of this material. The absorption spectrum of the material represented by A2 showed maximum absorption at wave lengths of 273-280 mp and minimum absorption at 250 mji (Table XXIV) . Further separation of the proteins in the MMM3H was obtained by the fractionation of a one ml sample on Sephadex G-lOO (Fig. 10b; Table XXV).
Two peaks were also obtained in the first 80 ml of effluent from a 7 ml aliquot of male mouse thymus crude homogenate (MMTCH) fractionated on Sephadex G-25 (Fig. 11a; Table XXIII). This fractionation

1.0-û ‘o’
0.5- -
8040 120EFFLUENT VOLUME (m l)
1.0--do' I-III
0.5-- v-vi40EFFLUENT VOLUME (m l)
FIGURE 9: Fractionation of Male Mouse Submaxillary Crude HomogenatePurified by Precipitation with Ammonium Sulfate. G-100 gel and Column I were used.
a. Fractionation of a phate, pH 6.5. Flow rate
b. Fractionation of a pH 7.2. Flow rate;
0.5 ml sample. Buffer: 0.02 M sodium phos- 0.5 ml/min. Gel height: 45.6 cm.
0.5 ml sample. Buffer: 0.005 M Tris HCl,45.1 cm.0.5 ml/min. Gel height:42

2.0"
40 80EFFLUENT VOLUME (m l)
0.2+
8040 120EFFLUENT VOLUME (m l)
FIGUBE 10: Fractionation of Male Mouse Muscle Crude Homogenate.Column I and 0.02 M sodium phosphate buffer, pH 6.5, were used.
a. Fractionation of a 7 ml sample on G-25 gel. Flow rate: 1.6ml/min. . Height of gel: 48 cm.
b. Fractionation of a 1.0 ml sample on G-100 gel. Flow rate: 0.3 ml/min. Height of gel; 46 cm.
43

2.0+
O ' 1 ()
8040EFFLUENT VOLUME ( m l )
0,3+
0.1--
8040EFFLUENT VOLUME (m l)
FIGURE 11: Fractionation of Male Mouse Thymus Crude Homogenate.Column I and 0.02 M sodium phosphate buffer, pH 6,5, were used.
a. Fractionation of a 7 ml sample on G-25 gel. Flow rate:1.0 ml/min. Height of gel: 42 cm,
b. Fractionation of a 0,5 ml sample on G-100 gel. Flow rate: 0.4 ml/min. Height of gel: 45,2 cm.
44

45vas monitored bÿ the Beckman DB Spectrophotometer with the constant flow-through cell and recorder. Further separation of the proteins in the MMTCH was achieved on Sephadex G-100 (Fig. 1Tb; Table XXVT).
Assay of the Purified Fractions All fractions of the tissue extracts from the various purifications
on the gel columns which were suspected of containing the in vitro outgrowth orienting activity were assayed. In the Sephadex G-25 and G-75 purifications the outgrowth orienting activity was present in the first fractions which absorbed ultraviolet light. Oriented outgrowth was observed in the cultures to which the fraction represented by peaks 4 and IV from the Sephadex G-100 columns or peak D on the Sephadex G-200 columns had been added. The orienting activity was retained in Dg when the material in peak D was fractionated into three groups of molecules of differing molecular weight (Plate I; Table XXVIl).
The orienting activity was also mediated by the extract of the thymus gland from sexually immature male mice (Plate II, lb, 2b; Table XXVIII).
Effect of Varying the Concentration of the Submaxillarv Protein The concentration of the protein in the effluent represented by
Area A of the fractionation on the Sephadex G-25 (Fig. la) was 3 mg/ml (Table XXIX). Therefore, there were 45 pg of protein in the 15 pi which were added to the 2.5 ml of medium in the culture slides to produce the patterned outgrowth effect. When the amount of the outgrowth orienting protein, the lyophilized material represented by Area A of the G-25 fractionation, added to the cultures was varied, little or no change in

46
PLATE ITHE EFFECT OF SOME SUBMAXILLARY FRACTIONS UPON OUTGROWTH PATTERN
la Dark field photmicrograph of radial outgrowth between severalchick cardiac explants in a control culture. Incubation time:27 hr. Culture medium: Simms. Additive: None. Explantsbeating. Culture date: 7/17/64.
lb Dark field photomicrograph of oriented outgrowth betweenseveral chick cardiac explants cultured with submaxillary protein. Incubation time: 27 hr. Culture medium: Simms.Additive: 15 yl of M^GCH, Area A of the G-25 fractionation(Fig. la). Explants beating. Culture date: 7/17/64.
2a Phase contrast photomicrograph of radial outgrowth between chickcardiac explants cultures with protein represented by Peak I. Incubation time: 15 hr. Culture medium: Simms. Additive:30 ul of MMSCH, purified by ammonium sulfate precipitation and fractionated on Sephadex G-100 (Fig. 9a). Explants beating. Culture date: 2/26/66.
2b Phase contrast photomicrograph of oriented outgrowth betweenchick cardiac explants cultured with protein represented by Peak IV. Incubation time: 15 hr. Culture medium: Simms.Additive : 30 pi of M^GCH, purified by ammonium sulfate .precipitation and fractionated on Sephadex G-100 (Fig. 9a). Explants beating. Culture date: 2/26/66.
3a Phase contrast photomicrograph of radial outgrowth between chickcardiac explants in a control culture. Incubation time: 15hr. Culture medium: Simms. Additive: 11 pi of water. Expiants beating. Culture date: 2/18/66.
3b Phase contrast photomicrograph of oriented outgrowth betweenchick cardiac explants cultured with protein represented by Peak Dg. Incubation time: 15 hr. Culture medium: Simms.Additive: 11 pL of water + 44 pg of reconstituted lyophilizedprotein from the MMSCH purified on Sephadex G-200 (Fig. 5d). Explants beating. Culture date; 2/18/66.

TABLE XX7IIASSAY OF MALE MOUSE SUBMAXILLARY CRUDE HOMOGENATE FRACTIONATIONS
MATERIAL ADDED TO EXPERIMENTAL CARDIAC CULTURES Amount Sqphedex ̂Cul) Tvne Fraction
CULTUREDATE
NO. OF CULTURES OBSERVED
TOTALNO.
OUTGRCWTHPATTERN
60 G-25 A of 11/63 12/31/63 4 4 No outgrowth15 G-25 A of 11/63 1/22, 3/31, 4/7/65
and routinely (See Table XLIV)
2, 1, 3 Oriented
1.5 G-25 A of 11/63 11/23/64 2 2 Radial5 G-25 A of 11/63 11/23/64 2 2 Radial
150 G-25 A of 11/63 11/23/64 2 2 No outgrowth15 G-25 A of 7/64 7/17,23/64 2, 2 4 Oriented15 G-25 B of 7/64 7/23/64 2 2 Radial15 G-25 1 7/16, 17, 23/64 2. 2. 2. 6 Radial15 G-75 3 7/16, 17, 23/64 2, 1, 2 5 Orie nted15 G-75 8 7/25/64 2 2 Radial15 G-75 15 & 16 7/25/64 2 2 Radial
See Table I and Figures la and lb.

TABLE XXVII— Continued
MATERIAL ADDED TO EXPERIMENTAL CARDIAC CULTURES Amount Sephadex Cul) Tvne Fraction
CULTUREDATE
NO. OF CULTURES OBSERVED
TOTALNO.
OUTGROWTHPATTERN
15 G-100 1 of 8/65 9/2/65 1 1 Radial30 G-100 1 of 8/65 9/2, 23/65 1, 1 2 Radial15 G-100 2 of 9/65 9/2/65 1 1 Radial30 G-100 2 of 9/65 9/2, 23/65 1, 2 3 Radial
15 G-100 3 of 8/65 9/2/65 1 1 Radial30 G-100 3 of 8/65 9/2, 23/65 1, 2 3 Radial15' G-100 4 of 8/65 9/2/65 1 1 Oriented30 G-100 4 of 8/65 9/2, 16, 23/65 1, 1̂ , 2 4 Oriented45 G-100 4 of 8/65 9/16/65 l3 1 Oriented15 G-100 5 of 8/65 9/2/65 1 1 Radial30 G-100 5 of 8/65 9/2, 9/23, 10/16/65 1, 2, 2 5 Radial
pFraction concentrated once with Sephadex G-25. ^See Fig. 2a.^Chick Pancreas tissue.

TABLE XXVII--Continued
MATERIAL ADDED TO EXPERIMENTAL CARDIAC CULTURES Amount Sephadex (ul) Tvue Fraction
CULTUREDATE
NO. OF CULTURES OBSERVED
TOTALNO.
OUTGROWTHPATTERN
15 • G-100 I of Fig. 9a 2/18/66, 2/28/66 . 1, 1 2 Radial
30 G-100 I of Fig. 9a 2/18, 2/26/66 1, 1 2 Radial
15 G-100 IV of Fig. 9a 2/18, 2/26/66 1, 1 2 Oriented
30 G-100 IV of Fig. 9a 2/18/2/26/66 1, 1 2 Oriented
15 G-100 I of Fig. 9b 2/26/66 1 1 Radial
15 G-100 IV of Fig. 9b 2/26/66 1 1 Oriented
15I G-200 G of Fig. 5a 9/23, 10/16/65 2, 2 U Radial115 - G-200 D of Fig. 5a 9/23,.10/16/65 2, 1 3 Oriented
11^ G-200 Dg of Fig. 5d 2/18/66 2 2 Oriented
VJlO
^Effluent concentrated twice with Sephadex G-25.'Effluent desalted and lyophilized; each pi contained 4 pg of the protein.

51PLATE II
THE EFFECT OF THYMUS AND MUSCLE EXTRACTS UPON OUTGROWTH PATTERN
la Phase contrast photomicrograph of radial outgrowth betweenchick cardiac explants in a control culture. Incubationtime; 15 hr. Culture medium: Simms. Additive: None.Explants beating. Culture date: 6/15/64.
lb Phase contrast photomicrograph of oriented outgrowth betweencardiac explants cultured with thymus protein. Incubation time : 26 hr. Culture medium: Simms. Additive: 15 piof MMTCH, Area A of the G-25 fractionation (Fig, 11a). Expiants beating. Culture date: 7/16/64.
2a Phase contrast photomicrophotograph of radial outgrowth betweenchick cardiac explants cultured with Fraction 3, thymus protein. Incubation time : 20 hr. Culture medium; Simms.Additive: 45 pi of MMTCH purified on Sephadex G-100 (Fig.lib). One explant beating. Culture date: 3/4/66.
2b Phase contrast photomicrograph of oriented outgrowth betweencardiac explants cultured with Fraction 6, thymus protein. Incubation time; 20 hr. Culture medium; Simms. Additive :45 pi of MMTCH purified on Sephadex G-100 (Fig. 11b).One explant beating. Culture date: 3/4/66.
3a Phase contrast photomicrograph of radial outgrowth betweencardiac explants cultured with Fraction 27, thymus protein. Incubation time: 20 hr. Culture medium: Simms. Additive:60 pi of MMTACH purified on Sephadex G-100 (Fig. lib). Expiants beating. Culture date: 3/4/66.
3b Phase contrast photomicrograph of radial outgrowth betweenchick cardiac explants cultured with muscle extract.Incubation time; 15 hr. Culture medium: Simms. Additive:15 pi of MMOH, Area A of the G-25 fractionation (Fig. 10a). Explants beating. Culture date: 7/17/64.

TABLE XXVIIIASSAY OF MALE MOUSE THYMUS AND MUSCLE CRUDE HOMOGENATE FRACTIONATIONS
MATERIAL ADDED TO EXPERIMENTAL CARDIAC CULTURES CULTURE TOTAL OUTGROWTHAmountiyiL)
DATE OBSERVED NO. PATTERN
15
♦ ^
THYMUS EXTRACT G-25 A of Fig. 11a 7/16, 17, 23/64 2, 2, 2, 6 Oriented
30 G-100 •3 of Fig. 11b 2/26/66 1 1 Radial45 G-100 3 of Fig. lib 2/26, 3/4/66 1, 1, 2 Radial60 G-100 3 of Fig. lib 3/4/66 1 1 Radial45 G-100 6 of Fig. 11b 3/4/66 1 1 Oriented60 G-100 6 of Fig. 11b 3/4/66 1 1 Oriented30 G-100 27 of Fig. 11b 2/26/66 1 1 Radial45 G-100 27 of Fig. lib 2/26, 3/4/66 1, 1 2 Radial60 G-100 27 of Fig.11b 3/4/66 1 1 Radial
15MUSCLE EXTRACT G-25 Aj of Fig. 10a 7/16, 17, 23/64 2, 2, 2 6 Radial
VJlVjO

TABLE XXIXWEIGHT ESTIMATION OF PROTEIN IN 1 ML OF EXTRACT, AREA A OF G-25 FRACTIONATION, NOVEMBER, 1963
WEIGHT (gramsil WEIGHT (grams)DATE
Membrane A Membrane BDATE Membrane A
+ 1 ml of extractMembrane B
9/ 8/65 0.59450 0.61172 11/29/64 0.58827 0.603249/10/65= 0.59475 0.61240 11/30/64 0.58825 0.603409/20/65 0.59382 0.61190 11/30/64 0.58837 0.603709/27/65 0.59400 0.61180 12/ 1/64 0.58823 0.603389/30/65 0.59376 0.61172 12/ 2/74 0.58828 0.60341AVMAΠ0.59417 0.61191 AVERAGE 0.58828 0.60343
4/11/65 0.59000 0.604504/12/65 0.59002 0.604494/23/65 0.59009 0.605004/24/65 0.59001 0.605154/27/65 0.59007 0.60500AVERAGE 0.59004 0.60483
CALCULATION A — 11/29 to 12/2 CALCULATION B — A/ll to A/27Correction factor: 0.61191 - 0.60343 = 0.00848 0.61191 - 0.60483 = 0.00708Enmty membrane weight: 0.59417 - 0.00848 = 0.58769 0.59417 - 0.00708 = 0.58709
(corrected) 'Wt. of protein in 1 ml: 0.58828 - 0.58569 = 0.00259 0.59003 - 0.58709 = 0.00294
aonroximatelv 3 mg/ml anoroximatelv 3 mg/ml
Ul4̂
55the average angle of the axes of the emerging cells was observed with an increase from 11 pg to 20 pg or from 27 pg to 45 pg of the added protein. In the range between 20 pg and 27 pg, increase in the amoimt of added protein resulted in marked reduction of the average axis angles of the outgrowing cells from +17° to 0°. At the higher concentrations of the extract, therefore, the axes of the outgrowing fibroblast-shaped cells in the zone where the angles were measured were almost parallel with the midline between the two explants. At all concentrations of the extract the average slope of the cell axes was less for the experi- . mental cultures than for the controls (Fig. 12; Tables XXX-XXXVIIl). Plate III shows the cellular outgrowth pattern in the cultures which contained 20 pi, 27 pi, or 45 pi of water in the control cultures or the same amount of protein extract in the experimental cultures.
Molecular Weight Estimation of the Submaxillarv OutgrowthOrienting Protein
The void volume of four of the Sephadex G-100 gel beds used,determined by the application of a 0.2^ solution of Blue Dextran, was26.8 ml (Fig. 13; Table XXXIX), 32.8 ml (Fig. 14; Table XL), 33.4 ml(Fig. 13; Table VII), and 34-4 ml (Fig. 14; Table XXI). The relationof the elution volume to the void volume (V̂ / V^) was 1.41 and 1.35( ) for bovine serum albumin, 1.07 and 1.08 ( ^for bovine serum albumin dimer, and 2.74 and 2.34 ( ^6.8 ^26.8 35.8trypsin (Fig. 13 and 14; Tables XXXIX and XL). This same relationshipfor a ' sample of MMSCH was 1.97 ( ) and for a sample of the ammoniumsulfate purified MMSCH was 2.01 ( )• The Vg/V^ values for the34 «4

io“+oo
O " ooixi o+
oooo• • ••
oooo•XLU
oo
o Controls o Experimental X Average for controls + Average for expérimentais
+40--
A M O U N T A D D E D
FIGURE 12: Change in the Average Angle of the Axes of Cells withthe Midline as the Concentration of Submaxillary Protein Varied. In the control cultures the indicated amount of water, in ;il, was added to the 2.5 ml of medium in the slide. In the experimental, cultures the invested amount of lyophilized protein represented by Area A of the G-25 gel fractionation, in pg, was added to the 2.5 ml of medium in the slide «
56

5 6PLATE III
THE EFFECT OF VARIOUS CONCENTRATIONS OF SUBMAXILLARY EXTRACTUPON OUTGROWTH PATTERN
la Phase contrast photomicrograph of radial outgrowth betweenchick cardiac expiants in a control culture. Incubation time: 15 hr. Culture medium: Simms. Additive: 20 piof water. One explant beating. Date : 2/18/66.
lb Phase contrast photomicrograph of radial outgrowth betweenchick cardiac explants cultured with submaxillary protein. Incubation time: 15 hr. Culture medium: Simms. Additive :20 pi of water + 20 pg of lyophilized MMSCH, Area A of the G-25 fractionation (Fig. la). Explants beating. Culture date : 2/l8/66.
2a Phase contrast photomicrograph of radial outgrowth betweechick cardiac explants in a control culture. Incubation time: 15 hr. Culture medium: Simms. Additive : 27 pi of water.One explant beating. Culture date: 2/18/66.
2b Phase contrast photomicrograph of oriented outgrowth betweenchickcardiac explants cultured with submaxillary protein. Incubation time: 15 hr. Culture medium: Simms. Additive:27 pi of water + 27 pg of lyophilized MMSCH, Area A of the G-25 fractionation (Fig. la). Explants beating. Culture date : 2/18/66.
3a Phase contrast photomicrograph of radial outgrowth betweenchick cardiac explants in a control culture. Incubation time :15 hr. Culture medium: Simms. Additive: 4-5 pi of water.Explants beating. Culture date: 2/18/66.
3b Phase contrast photomicrograph of oriented outgrowth betweenchick cardiac explants cultured with submaxillary protein. Incubation time : 15 hr. Culture medium: Simms. Additive :45 pi of water+ 45 pg of lyophilized M^CCH, Area A of the G-25 fractionation (Fig. la). Explants beating. Culture date : 2/l8/66.

0 0.4
65
30 40 7023 60
EFFLUENT VOLUME (m l )
1.2--o serum albumin • trypsin
. 0.8 -
74
0.4o#
37.9__hL.
23 25 54 58
4088
3068
3578
45 serum albumin 98 trypsin
EFFLUENT VOLUME (ml)
FIGURE 13s Elution Volumes of Blue Dextran, Peak IV from Male Mouse SubmaxillELry Crude Homogenate, Trypsin, and Bovine Serum Albumin. G-100 gel. Column I, 0.5 ml sample volumes, and 0.02 M sodium phosphate buffer, pH 6.5« were used.
a. Elution volumes of Blue Dextran and Peak IV from MMSCH.a-I = void volume for the gel bed used for trypsin and bovine serumalbumin. a-II = void volume for the gel bed used for MMSCH. a-III = Peak XV from MMSCH; flow rate, 0.4 ml/min; gel height, 40.5 cm.
b. Elution volume of 10 mg trypsin and 12.5 mg bovine serumalbumin. Flow rate: 0.2 ml/min.
58

1.2 --
0.8-
^0 .4 -I—(/)Z 69|34LJJQ 26 30 8040 50 7060
0.8 -
0.4
b.
/ / I76|.8
/ î \ o serum albumin * trypsin
\
- yA / di I'mer
3511,1
/\\
2760
3066
V/ ■
9./ y\
\
35 76
EFFLUENT86
441.4 Nt/i45 96
VOLUME (m l)
4-:^50 serum albumin
106 trypsin
FIGURE l4: Elution Volumes of Blue Dextran, Peak IV from AmmoniumSulfate Purified Male Mouse Submaxillary Crude Homogenate, Trypsin, and Bovine Serum Albumin. G-100 gel, Column I, 0.5 ml sample volumes, and 0.02 M sodium phosphate buffer, pH 6.5, were used.
a. Elution volumes of Blue Dextran and Peak IV from ammonium sulfate purified MMSCH. a-I = void volume for the gel bed used for trypsin and bovine serum albumin. a-II = void volume for the gel bed used for ammonium sulfate purified MMSCH. a-III = Peak IV from ammonium sulfate purified MMSCH; flow rate, 0.5 ml/min; gel height, 45.6 cm.
b. Elution volume of 10 mg trypsin and 12.5 mg bovine serum albumin. Flow rate: 0.5 ml/min. Gel height: 45.1 cm.
59

60proteins of known molecular weight are plotted against the common logarithm of their molecular weight in Fig. 15. From the straight line drawn between these points, the log of the molecular weight of the outgrowth orienting protein is 4.6l. Therefore, the molecular weight is approximately 41^000.
Lability of the Submaxillary Outgrowth Orienting Protein Actiyity of the outgrowth orienting protein was destroyed by
heating the protein in phosphate buffered solution to its boiling point. The orienting factor was also inactivated by an exposure to 0.1 N NaoH or to 0.1 N HCl for 1 hr (Table XLI).
• Outgrowth Response between Explants from Tissues other than Chick Cardiac to the Outgrowth Orienting Protein
Explants of embryonic mouse ventricle or embryonic chick kidney, liver, gut, limb, or pancreas tissue were grown in plasma clots. Fifteen ^ of the submaxillary extract represented by Area A of the G-25 fractionation were added to the experimental cultures. Outgrowth between the explants was observed and photomicrographed. Radial outgrowth was observed in the control cultures of these various issues. Oriented outgrowth was observed in the experimental cultures (Table XLII). The processes from nerve tissue explants were also observed and photographed in control and experimental cultures. This study is summarized in Table . XLIII. Radial outgrowth was observed in both the control and in the experimental cultures. Plate IV shows representative microphotographs of the cellular outgrowth from pancreas, gut, and nerve explants.

3+
2 -
4.5 4.7LOG OF MOLECULAR W EIGHT
4.3 4.9W EIGHT
5.1
FIGURE 13 i The Relation between / Vq of Proteins and their Molecular Weight. 1. Log of mol. wt. of trypsin, 2),800 (Cunningham, 1954) . 4.58; Ve / Vo = 2.74 and 2.34. 2. Log of mol. wt. ofbovine serum albumin, 67,000 (Loeb and Scheraga, 1936) ■ 4.83;Ve / Vo > 1.42 emd 1.33. 3. Log of mol. wt. of bovine serumalbumin dimer, 134,000 (Sogami and Foster, 1962) = 3.13; Ve / V© ■1.08 and 1.07. V© / V© for Peak IV of MMSCH - 1.97 and for Peak XV of ammonium sulfate purified MMSCH = 2.01. 4.6l > log of 40,800,
61

TABLE XLILABILITY OF THE OUTGROWTH ORIENTING PROTEIN
CULTURE CONTROL CULTURES CONDITION OF THE MNECH IN EXPERIMENTAL CULT.DATE JiiAXltAOi 15 pi
Normal 0.1 N NaOH NormalHeated to 100°C
Exposed to 0.1 N NaOH
Exposed to 0.1 N HCl
5/12/64 • A of G-25^ 2^ - R^ 1 - 0 2 - R6/ 3/64 A of G-25 2 - R 2 - 0 3 - R6/ 8/64 A of G-25 1 — R i 2 - 0 2 - R
6/10/64 A of G-25 2 - R 2 - E 2 - 0 2 - R 2 - R
7/23/64 A of G-25 2 - R 2 - R2/19/66 Dg of G-200^ 2 - 0 2 - R
MICCH, Area A of the G-25 fractionation of 11/63 (Fig. la); 15 pi added to cultureNumber of slides observed ^Pattern of the oUtgrowth: R = Radial; 0 = Oriented.MÏBCH, D2 (Fig. 5d); 45 pg of protein in 11 pi of water added to culture.

TABLE XLIISUMMARY OF THE NUMBER OF SLIDES CULTURED CONTAINING EXPLANTS OTHER THAN CHICK CARDIAC OR NERVE
CULTUREDATE
NUMBER OF SLIDES OBSERVED Chick Tissue Mouse Tissue
Ventricle C* E**
Kidney C* E**
Liver C* E**
Gut C* E**
Limb C* E»*
Pancreas C* E** G* E**
4/ 7/64 3 3 3 16/ 8/64 1 2 2 26/10/64 2 2 3 26/15/64 2 ■ 2 2 1 1 2 2 26/17/64 •1 1 2 2 2 2 2 2 2 26/24/64 2 2 3 3 2 2 2 2 2 27/ 7/64 2 25/11/65 2 29/16/65 2
Totals 11 12 5 5 6 5 5 6 9 7 6 6 5 4
* Control cultures— outgrowth pattern radial.^ Experimental cultures contained 15 pi MMSCH, Area A of G-25 fractionation of ll/63,
Fig. la— outgrowth pattern oriented.Experimental cultures contained 30 or U5 pi of purified MMSCH, Fraction A of G-100 fractionation of 8/65, Fig. 2a, concentrated once with Sephadex G-25— outgrowth pattern oriented.
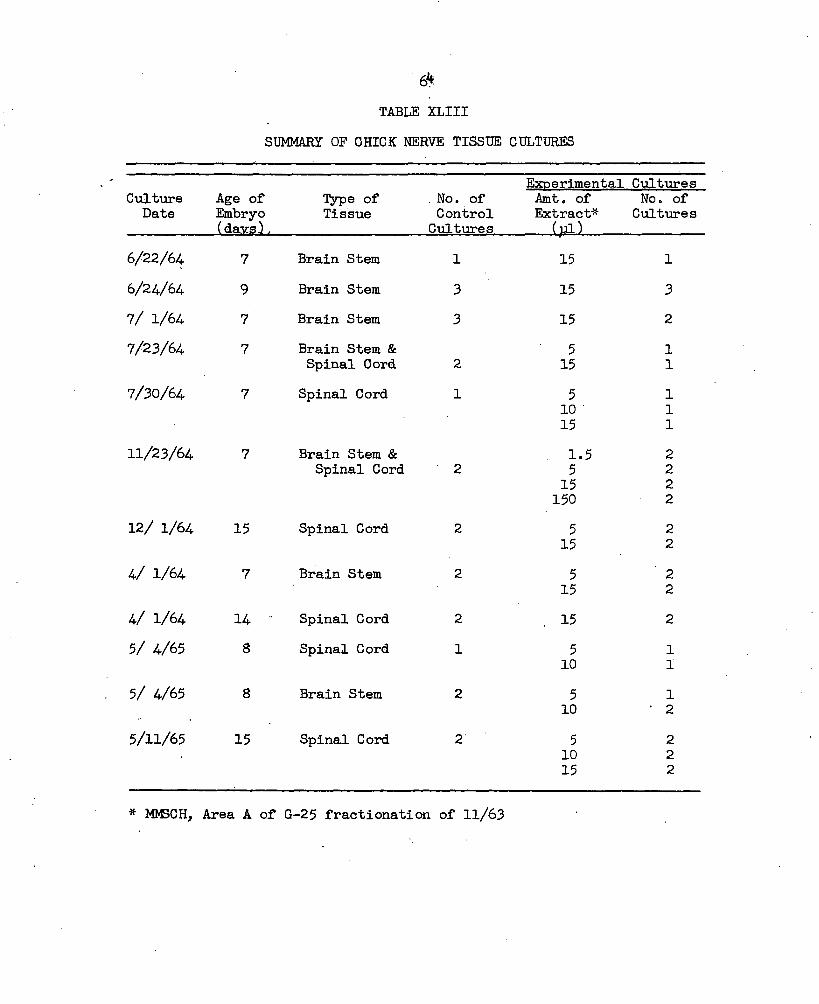
64TABLE XLIII
SUMMARY OF CHICK NERVE TISSUE CULTURES
CultureDate
Age of Embryo (dairs] ,
Type of Tissue
. No. of Control Cultures
Amt. of Extract*
(pi)
No. of Cultures
6/22/64 7 Brain Stem 1 15 16/24/64 9 Brain Stem 3 15 37/ 1/64 7 Brain Stem 3 15 27/23/64 7 Brain Stem & 5 1
Spinal Cord 2 15 17/30/64 7 Spinal Cord 1 5 1
10 115 1
11/23/64 7 Brain Stem & . 1.5 2Spinal Cord 2 5 2
15 2150 2
12/ 1/64 15 Spinal Cord 2 5 215 2
4/ 1/64 7 Brain Stem 2 5 215 2
4/ 1/64 14 Spinal Cord 2 . 15 25/ 4/65 8 Spinal Cord 1 5 1
10 15/ 4/65 8 Brain Stem 2 5 1
10 • 25/11/65 15 Spinal Cord 2 5 2
10 215 2
* MbCCH, Area A of G-25 fractionation of 11/63

■- ' 65 PLATE IV
PATTERN OF OUTGROWTH . BETWEEN PANCREAS, GUT, AND NERVE EXPLANTS
la Phase contrast photomicrograph of radial outgrowthbetween chick pancreas explants in a control culture.Incubation time: 15 hr. Culture medium: Simms.Additive: None. Culture date; 7/7/64.
lb- ■ Phase contrast photomicrograph of oriented outgrowth betweenchick pancreas explants cultured with submaxillary protein.Incubation time : 15 hr. Culture medium: Simms. Additive:15 pi of Area A of the. G-25 fractionation (Fig. la).Culturedate: 7/7/64.
2a Phase contrast photomicrograph of radial outgrowth betweenchick gut explants in a control culture. Incubation time:15 hr. Culture medium: Simms. Additive; None.Culture date: 6/15/64*
2b Phase contrast photomicrograph of oriented outgrowth betweenchick gut explants cultured with submaxillary protein.Incubation time: 15 hr. Culture medium: Simms. Additive :15 pi of MMSCH, Area A of the G-25 fractionation (Fig. la).Culture date: 6/24/64.
3a Phase contrast photomicrograph of oriented outgrowth betweenchick spinal cord"expiants in a control culture. Incubation time: 24 hr’. Culture medium; Simms. Additive : None.Culture date: 7/1/64•
3b Phase contrast photomicrograph of radial outgrowth betweenchick spinal cord explants cultured with submaxillary protein. Incubation time: 24 hr. Culture medium: Simms. Additive :15 pi of MMSCH, Area A of the G-25 fractionation (Fig. la).Culture date; 7/I/64.

67Effect of Different Kinds of Medium on the Action
of the Outgrowth Orienting Protein Oriented outgrowth was observed in the experimental cultures
which contained MMSCH when various kinds and combination of culturing medium were used. Besides the usual medium composed of S0% Siimns salt solution and 20% embryo extract, oriented outgrowth was also observed in the 4 experimental culture slides which contained 2 ml of Simms solution and 5 drops of horse serum, in the 7 which contained 2 ml of Simms solution and 5 drops of agamma horse serum, and in the 2 which contained 70% Hanks solution, 10% Tissue Culture Medium #199, and 20^ agamma horse serum. Radial outgrowth was observed in the same number of control cultures which contained one of the various types of medium but ho male mouse submaxillary gland extract (Table XLIV).
Monolaver Outgrowth Response to the Orienting Protein Oriented outgrowth was not observed in the experimental cultures,
which contained the usual amount (15 yl/2.5 ml of culture medium) of the submaxillary extract represented by Area A of the G-25 fractionation, when the outgrowth from the explants was a monolayer of cells adhering to a glass or plastic surface. Nine control and nine experimental culture slides, cultured on 6 different days, were observed and photographed.The culture medium consisted of 70% Hanks solution, 10$ Tissue Culture Medium #199, and 20$ agamma horse serum. Double the amount of medium and 30 pi of extract was used on two different occasions in a total of four 30 ml plastic flasks, but oriented outgrowth was never observed in these flasks although monolayer outgrowth flourished around the 40-60

TABLE XLIVTYPES OF CULTURE MEDIA USED FOR GHICJC CARDIAC EXPLANTS
CULTURE MEDIUM CULTURE DATE NO. OF SLIDES OBSERVED
EXTRACT*ADDED
PATTERN OF 0UTŒ10WTH
Simms solution + 3/31/64 4 None Radialhorse serum 4 15 yl Oriented
Simms solution + 3/3/j 4/7j 5/12/64 4) 2, 1 None Radialagamma horse serum 4, 2, 1 15 pi Oriented
Hanks solution + 199 + 7/1; 7/25/64 1, 1 None Radialagamma horse serum 1, 1 15 pi Oriented
Simms solution + Routinelyembryo extract 1/22; 3/31/ 4/7;5/12; 2, 4, 3, 2, None Radial
2, 1, 3, 1 15 pi Oriented6/8; 10, 15, 17, 24; 1, 2, 2, 1, 2 None Radial
2, 2, 2, 1, 2 15 pi Oriented
7/16, 17, 23; 11/23/64; 2, 2, 2, 2 None Radial2, 2, 2, 2 15 pi Oriented
4/1; 9/2, 23; IO/16/65 2, 2, 2, 2 None Radial2, 2. 2. 2,, 15 ul Oriented

69beating cardiac expiants in each culture. The same number and type of control cultures (nothing added to the medium in these cultures) were also observed. The outgrowth pattern in the control cultures was similar to that in the experimental cultures.

CHAPTER IV
DISCUSSION
Heat water solubility, absorption of light of 280 mjx,lability to strong acid and base, large molecular weight, and electrophoretic behavior support the statement that the in vitro outgrowth orienting factor studied in this work is a protein. The solubility of the outgrowth orienting protein in pure water indicated that it was an albumin. This solubility was predicted because the salts present within the tissue during the preparation of the crude homogenate material and the salts of the 0.02 M sodium phosphate buffer were removed on G-25 gel columns which were packed and washed with glass distilled water.The solubility of the outgrowth orienting protein in pure water was confirmed by dissolving the lyophilized material in pure water and the outgrowth orienting activity was retained.
The detection of the amount of proteins spectrophotometrically at the wave length of 280 mja is a very sensitive method with the advantage that the sample is not destroyed. However, the absorption of light is due entirely to the tyrosine, tryptophan, and phenylalanine present. The amount of light absorbed at a wave length of 280 mp may vary by a factor of 5 or more for equal concentrations of proteins since their amino acid composition may differ considerably (Sober, et al..
70

711965). Therefore, the amount of absorption indicated by the various heights of the different peaks of the elution curve for a sample is not an indication of the absolute amount of the protein present. A concentration curve specific for each peak is necessary before absorbance at a wave length of 280 mji can be related to the amount of protein present. The outgrowth orienting protein was not sufficiently purified to make a study of the amino acid composition profitable.
The molecular weight of the outgrowth orienting protein was determined by gel filtration. Whitaker (1963) obtained an excellent linear relation between the common logarithm of the molecular weight and the ratio of the elution volume (V^) to the void volume (V^). Calibration of Column I was done with samples of bovine serum albumin and trypsin. Two peaks were obtained from the sample of bovine serum albumin.The detection by elution of a dimer in bovine serum albumin was not mentioned by Whitaker (1963) nor by Leach and O’Shea (1965), but was reported by Andrews (1964). Whitaker (1963) quoted Wagner and Scherage as reporting that bovine serum albumin is known to contain at least two proteins. Although trypsin presented a broad elution curve the excessive trailing was not due to improper packing of the column because the elution curve for Dextran Blue presented a narrow sharply rising and falling curve. The wide peak is probably due to the impurity of the trypsin since Hakim, et al., (1962) reported that both commercial beef and pork trypsin are heterogeneous.
The heights of the G-lOO gel in the column varied but the Vg / Vq has been found to be a constant for each protein regardless of column size. The void volume determinations can be considered to be

72accurate because Blue Dextran has an average molecular weight of 2,000,000 and would be totally excluded from the gel particles. No significant difference was reported in the / 7^ of proteins when the temperature varied a few degrees although a temperature effect was observed between 3.3°C and 25-27°C. Since the elution volumes were interpolated to the nearest 0.1 ml, the molecular weight is significant to three figures even though the void volume of the column used was less than 100 ml. Sometimes a second material was placed on the column before the first emerged (i.e., MM5CH sample was added before the Blue Dextran sample emerged) as theielution volume is not influenced by this procedure (Whitaker, 1963).
Electrophoresis was used to determine the number of dissimilarly charged proteins in some of the gel separated fractions. Concentration of the protein, one of the many critical parameters in electrophoresis,, must be considered in this work since G-lOO gel filtration in Column I diluted the 0.5 ml applied samples from 6.5 to 10.5 times. The amount of dilution depends upon the sample size, the void volume of the column, the column size, and the irregularities in the flow of the sample through the column. Fractions were concentrated by lyophilization and with dry Sephadex G-25 as the spaces within the gel particles permit water and salts to enter and the result is a concentration of the protein under conditions in which the pH and ionic strength of the solution remain constant (Baling, 1963). Although the practical concentration factor is only 2-5 times in each step, this is a very mild method and it can be repeated (Gelotte and Rrantz, 1959).

73Molecular sieve chromatography was used for purification as well
as an analytical technique for establishing the molecular weight of the outgrowth orienting protein. The separations on the G-25 columns removed streptomycin sulfate, amino acids and small peptides. This treatment also divided the larger molecular weight material into the two fractions which are diagramed on Fig. 2a. The protein material represented by Area A contained the outgrowth orienting factor; that represented by Area B did not. The fractionation on the column packed with G-75 gel indicated that the molecular weight of the active material was large enough to warrant the use of gel particles with less cross-linking for the separation of the outgrowth orienting protein from the other proteins in the tissue extract.
The fractionation on the G-lOO and G-200 gels not only removed the excess streptomycin sulfate, amino acids and small peptides but also separated the larger proteins. The shape of the elution peaks indicated the purity of the fractions on the basis of the molecular weight of the material (Whitaker, 1963), i.e., the shape of peak D in Fig. 5b indicated partial separation of the outgrowth orienting protein from other proteins since there were irregularities in its slope and it was asymmetrical. Separation was achieved between peaks Dg 'ànd in Fig. 5d.The slope of peak was constant from base to apex and symmetrical.By using only the material represented by the indicated area under D2 the incomplete separation of D-̂ from D2 can be disregarded because the fractions which contained mixtures of these two peaks were not used.
The most efficient method of obtaining the outgrowth orienting protein of the purity used in this work seems to be the following. Large

74aliquots of the crude homogenate, such as those used on the G-25 gel, .. could be purified and desalted on G-25 gel equilibrated with distilled water. Small samples of the lyophilized protein could be applied in small volumes to a column of G-lOO gel and the desired fraction selected from the effluent. The information from the fractionation on the G-200 gel, especially the separation of the material in peaks and from Dg may be useful if an electrophoretically pure preparation of the orienting factor, - obtained from a G-lOO gel separation, is not possible on an ion-exchange column. The separation of from the outgrowth orienting protein present in represents the removal of material of a smaller molecular weight. No indication of such a separation was observed when the extract was fractionated on G-lOO gel.
The variations which were used in the tissue culturing in the presence of the outgrowth orienting protein indicate the following.First, the orientation response in the tissue cultures does not appear to be due to an interaction between the components of the tissue culture" medium since three combinations of media were used in addition to the usual combination of 20^ embryo extract and 80%Simms salt solution. Oriented outgrowth was observed in experimental cultures and radial outgrowth was observed in the control cultures. Second, a three-dimensional medium seems to be necessary as oriented outgrowth is not observed when cells are grown on a plane surface of glass or plastic. Third, the results with the various kinds of embryonic tissues used— chick and mouse ventricle; chick kidney, liver, gut, pancreas, and skeletal muscle—
indicate that the outgrowth orienting protein is not specific for cells from a particular organ. The shape of the oriented cells allow

75classification as fibroblastic according to Willmer (1965). Although he states that it is usually difficult, if not impossible, to designate the class to which a cell belopgs, e.g., epitheliocyte, mechanocyte (fibroblast), amoebocyte, by the shape of the cell, cell classification by shape may be made with some degree of accuracy during the early growth. All the tissue explants contained a mixed population of cells so that the 15-25 hr oriented outgrowth studied in this work may be composed mainly of mesenchymal cells.
The eighth type of tissue used, embryonic chick explants from the central nervous system, did not show oriented outgrowth. The pattern of the nerve processes around the tissue explants appeared to be the same in the control and the experimental cultures. This indicates that the outgrowth orienting protein is not orienting the fibers in the plasma clot since Weiss (193A) has shown that if the fibers in the clot are oriented, i.e., by tension, the nerve fibers in the outgrowth around the nerve tissue explant will be oriented. The many variations in the amount of the submaxillary gland extract added to the nerve cultures suggest that the absence of patterned outgrowth in these cultures is not due to too much or too little submaxillary gland extract.
Another variation used in the tissue culturing in the presence of the outgrowth orienting factor indicated that the amount of orientation is dependent upon the amount of protein added to the medium.Although the average angle which the cells made with the midline connecting the explants was always less in the experimental cultures than in the control cultures, the differences at the 11 pg and 20 pg levels were slight. In the range between 20 pg and 27 pg the amount of added
«y-

76protein resulted in marked reduction of the average axis angles of the fibroblast-shaped cells. The marked reduction did not continue to become greater when the added protein was increased to 45 }ig. The data presented in this study, does not eliminate the possibility of a threshold response.
Cultures which contained 27 or 45 of the purified submaxillary gland protein, showed oriented outgrowth. The control cultures did not exhibit oriented outgrowth. Since the distances between the explants in the former cultures averaged 0.48 mm (range of 0.13 mm to 0.75 mm) and the distances between, the explants in the latter cultures averaged 0.36 mm (range of 0.18 mm to 0.67 mm) the outgrowth orientation observed in this study seems not to be due to the "two-centre" effect described by Weiss (1952). If the outgrowth orientation were due to the. orientation of fibrin between the explants by the tension produced as a result of their growth one would expect the outgrowth pattern to be similar in all the cultures as the average distance and the range of the distance between the explants were similar.
The data presented here support the idea that the outgrowth orienting protein differs from the other proteins in the mouse submaxillary gland which have been studied. Attardi, et al., (1965) reported that the nerve growth factor was present in the protein represented by the first peak of the separation of mouse submaxillary extract, purified by precipitation with 40-70% ammonium sulfate, on Sephadex G-lOO gel. The protein represented by the first elution peak, using the same preparation of submaxillary extract and the same buffer

77(0.005 M Tris HCl, pH 7.2, Attardi, 1966) did not show cellular outgrowth orienting activity in the cardiac cultures (Fig. 12).
The elution curve reported by Attardi, et al., (1965) was similar to that obtained from the mouse submaxillary extract when a 0.02 M sodium phosphate buffer, pH 6.5, was used (Fig. 3 and 9). Therefore, the lack of orientation of outgrowth in the cultures which contained the protein represented by peak 3, Fig. 2a, also support the idea that the nerve growth stimulating protein does not mediate the orientation effect. The molecular weight of the nerve growth factor was estimated from ultracentrifugation by Cohen (i960) to be approximately 44,000, The molecular weight of the outgrowth orienting factor is estimated from gel filtration to be approximately 41,000. Although the molecular weight difference was not large, the nerve growth protein has the larger molecular weight and would be expected to emerge from the G-lOO gel column before the outgrowth orienting protein. The nerve growth factor on the elution curve reported by Attardi, et ad., (1965) stated that the nerve growth factor does emerge first.
Analysis of the proteins present in a sample of MMSGH purified by ethanol precipitation, which is the first step in the purification of the nerve growth factor, indicated that the nerve growth protein and the outgrowth orienting protein are different. When the ethanol purified sample was fractionated on G-lOO gel, the relative differences in the amount of light absorbed by the aliquots of effluent indicated that proteins other than the outgrowth orienting protein were being concentrated (Fig. 7). The outgrowth orienting protein was present in the material represented by Peak IV and the nerve growth factor was present in the

78proteins emerging first. When the ethanol purified sample of submaxillary extract was analyzed by electrophoresis, the relative differences in the stained bands of protein indicated that protein other than the outgrowth orienting protein were being concentrated (Fig. 8). At the concentration of the protein solution used, electrophoretic analysis of the outgrowth orienting factor (Peak IV of the G-lOO fractionations) showed, besides a band at the origin, proteins which migrated as cathodal Band 3 and cathodal Band 4.(Fig. 4). Figure 8 shows that the ethanol purification concentrates cathodal Band 2 especially cathodal Band 6.
The position of the macromolecular fraction in the elution curve is similar to that of the outgrowth orienting protein. Attardi, et al.. (1965) reported that the growth effects produced by the macromolecular fraction from the submaxillary gland extract were the dedifferentiation of skeletal muscle and cartilage and the enhancement of mesenchymal growth and these effects were not observed when the submaxillary gland extract was replaced by extracts from thymus, liver, kidney, or pancreas tissue. The outgrowth orienting activity was produced by an extract of the thymus gland.
The outgrowth orienting protein differs from the other protein described from the mouse submaxillary gland, the epidermal outgrowth factor (Cohen, 1962). The epidermal outgrowth factor has an estimated molecular weight of approximately 14,600 and is heat stable. This molecule is considerably smaller than the outgrowth orienting protein and the outgrowth orienting protein is also heat labile.

CHAPTER V
SUMMARY
The outgrowth orienting factor has been shown to be a heat labile protein with a molecular weight of approximately 41,000. The patterned outgrowth response depends upon the concentration of the protein. Using the extract from the mouse submaxillary glands of mice, purified by filtration on Sephadex G-25 gel, there was little or no orientation response below 20 pg of protein per 2.5 ml of medium in the culture slides and a maximum effect above 27 pg of protein per 2.5 ml of medium. Although monolayer outgrowth from explants was not patterned, the orientation response does not seem to be due to the orientation of the ultrastructure of the plasma clot since nerve processes, which exhibited patterned outgrowth when the fibrin in the clot was oriented by tension, did not exhibit oriented outgrowth in the presence of the submaxillary extract. The outgrowth orienting factor has been shown to affect the fibroblastic outgrowth from embryonic chick pancreas, liver, gut, kidney, and skeletal muscle explants as well as fibroblastic outgrowth from embryonic ventricle tissue from mice and chickens.
The orientation of cellular outgrowth seems to be mediated by a protein which is different from the growth stimulating proteins which have been described from the submaxillary gland of mice. Analysis by
79

800-100 gel filtration indicated that the outgrowth orienting protein has a molecular weight smaller than the nerve growth factor since the nerve growth factor has been reported to emerge first from the gel column.The protein material represented by the first ultraviolet absorption peak was added to the culture slides, but it did not mediate the cellular orientation of the outgrowth from the cardiac explants. The protein material represented by the fourth absorption peak did mediate cellular orientation from cardiac explants. Molecular weight estimation of the outgrowth orienting protein from the ratio of elution volume to the void volume on a calibrated gel column, position differences in the effluent from gel filtration, and electrophoretic analysis of the first step in the purification of the nerve growth factor support the idea that the nerve growth factor and the outgrowth orienting factor are different proteins.
The outgrowth orienting factor is different from the epidermal growth factor which is heat stable and has a molecular weight of approximately 14,600. This molecule is considerably smaller than the outgrowth orienting protein and the outgrowth orienting protein is also heat labile.
The outgrowth orienting factor seems to differ from the protein or proteins in the macromolecular fraction from the mouse submaxillary gland which has been reported to affect mesenchymal tissue outgrowth in vitro. An extract of the thymus gland did not produce the reported effects upon mesenchymal tissue, but in this study an extract of the thymus gland did mediate oriented outgrowth.

LITERATimE CITED
Abercrombie, M. 1961. Behaviour of normal and malignant connectivetissue cells in vitro. Canad. Cancer Conf., 101.
Abercrombie, M., J. E. M. Heaysman, and H. M. Karthauser. 1957. Social behaviour of cells in tissue culture. III. Mutual influence cf sarcoma cells and fibroblasts. Exp. Cell Res., 12.: 276-291.
Ackers, Gary K. 1964. Molecular exclusion and restricted diffusionprocesses in molecular sieve chromatography. Biochem., 2" 723-730.
Andrews, P. 1964. Estimation of the molecular weights of proteins by Sephadex gel-filtration. Biochem. J., 2i* 222-233.
Attardi, D. Gandini, R. Levi-Montalcini, and B. S. Wenger. 1965.Submaxillary gland of mouse: effects of a fraction on tissuesof mesodermal origin vitro. Science, 150: 1307-1309.
Attardi, D, Gandini. 1966. Personal communication.Bast, Sister Eileen Marie, and K. S. Mills. 1963. Mouse submaxillary
gland extract as a growth -stimulator and orientor of chickcardiac cells in vitro. Growth, 2%: 295-304.
Baling, Carl Gustaf. 1963. Gel filtration of conjugated urinary oestrogens and its application in clinical assays. Acta Endocrinol., ^ (Suppl 79): 9-96.
Bueker, E. D., I. Schenkein, and J. Bane. 1959. Nucleoprotein fractions from organs of the mouse and their nerve growth stimulating effects on mouse ganglia in vitro. Anat. Rec,, 133: 256.
Bueker, E. D., I. Schenkein and J. Bane. I960. The problem of distribution of a nerve growth factor specific for spinal and sympathetic ganglia. Cancer Research, 20: 1220-1228.
Cohen, S. I960. Purification of a nerve-growth promoting protein from the mouse salivary gland and its neuro-cytoxic antiserum.Proc. Natl. Acad. Sci., 4^: 302-311.
81

82Cohen, So 1962. Isolation of a mouse submaxillary gland protein
accelerating incisor eruption and eyelid opening in the newborn animal. J. Biol. Chem., 237: 1555-1562.
Cohen, S. 1965. Isolation and biological effects of an epidermal growth- stimulating protein. In Molecular and Cellular Aspects of Development (Edited by Eugene Bell), New York: Harper & Row, 4.60-4-71.
Cohen, S., and G. A. Elliott. 1963. The stimulation of epidermal kera- tinization by a protein isolated from the submaxillary gland of the mouse. J. Invest. Derm., 40,' 1-5.
Conn, H. J. 1953. Biological stains, 6th ed. Biotech Publications,Geneva, New York.
Cunningham, L. W. 1954» Molecular-kinetic properties of crystallinediisopropyl phosphoryl trypsin. J. Biol. Chem., 211: 13-19.
Dillard, Walter L. 1966. The in vitro growth and identification of beta cells of the embryonic chick pancreas. Dissertation.University of Oklahoma, Norman, Oklahoma.
Flodin, P., B. Gelotte, and J. Porath. I960. A method for concentrating solutes of high molecular weight. Nature, 188: 493-494»
Gelotte, B. and A. Rrantz. 1959. Purification of pepsin by gel filtration. Acta Chem. Scand., 12.: 2127.
Goldfarb, A. R., L. J. Saidel, and E. Mosovich. 1951. The ultraviolet absorption spectra of proteins. J. Biol. Chem., 193: 397-404»
Hakim, A. A., R. L. Peters, E. G. Samsa, and P. J. Van Melle. 1962, Heterogeneous nature of crystallized trypsins. Enzymol., 2^: 134-154»
Hanks, John H., and Roslyn E, Wallace. 1949. Relations of oxygen and temperature in the preservation of tissue by refrigeration.Proc. See. Exptl, Biol. Med., %!: 196-200.
Hodgman, Charles D . Editor, I960. Handbook of chemistry and physics. Cleveland: The Chemical Rubber Publishing Co.
Leach, A. A., and P. C. O'Shea. 1965. The determination of protein molecular weighjts of up to 225,000 by gel-f iltration on a single column of Sephadex G-200 at 25 and 40°. J. Chromatog.,12: 245-251.
Levi-Montalcini, R., and B. Booker. 1960a. Excessive growth of the sympathetic ganglia by a protein isolated from the salivary gland. Proc. Natl. Acad. Sci., 373-384»
Levi-Montalcini, R. and B. Booker. 1960b. Destruction of the sympathetic ganglia in mammals by an antiserum to the nerve-growth promoting factor. Proc. Natl. Acad. Sci., 46: 384-391»

83 ,Levi-Montalcini, R,, and S. Cohen. I960. Effects of the extract of the
mouse submaxillary salivary glands on the sympathetic system of mammals. Ann. N. Y. Acad. Sci., 8̂ : 324-34-1 •
Loeb, G. I., and H. A. Scheraga. 1956. Ify-drodynamic and thermodynamic properties of bovine sernm alb-umin at low pH. J. Phys, Chem., 60: 1633-1644,
Morgan, J., H. Morton, and R. Parker. 1950. Nutrition of animal cellsin tissue culture I. Initial studies on a synthetic medium.Proc. Soc. Exptl. Biol. Med., 22.: 1-8.
Porath, J ., and P . Flodin. 1959. A method for desalting and groupseparation. Nature, 183; 1657-1659.
Simms, H. S., and M. Sanders. 1942. Use of serum ultrafiltrate intissue cultures for studying fat deposition and for propagation of viruses. Arch. Path., 22: 619-635.
Sober, Herbert A., Robert W. Hartley, Jr., William R. Carroll, and E. A.Peterson. 1965. Fractionation of proteins. In The Proteins,Vol. Ill (Edited by Hans Neurath), New York: Academic Pressk
Sogami> M., and J. F. Foster. 1962. Resolution of oligomeric andisomeric forms of plasma albumin by zone electrophoresis on polyacrylamide gel. J. Biol. Chem., 237: 2514-2521.
Weiss, Paul. 1934. In vitro experiments on the factors determining the course of the outgrowing nerve fiber. J. Exptl, Zool.,68: 393-448.
Weiss, Paul. 1941. Nerve patterns: the mechanics of nerve growth.Growth, 5.: 163-203.
Weiss, Paul. 1952. Comments and communications: attraction fieldsbetween growing tissue cultures. Science, 115: 293-295.
Weiss, P. and A, C. Taylor. 1956. Fish scales as substratum for uniform orientation of cells in vitro. Anat. Rec., 124:381.
Whitaker, John R. k 1963̂ , Determination of molecular weights of proteins by gel filtration on Sephadex. Anal. Chem., 35:150-153.
Wieland, T.,.P. Duesberg, and H. Determann. 1963. Zum Molekulargewiohtder Lactat-dehydrogenases. Studien des Verhaltens bei der Gelfiltration. (Svmimary in English). Biochem. Z., 357: 303-311.

84Willmer, E. N. 1965. Morphological problems of cell type, shape,
and identification. In Cells and tissues in culture, Vol. (Edited by E. N. Willmer), New York; Academic Press.

A P P E N D I X

86
TABLE IIIFRACTIONATION OF MALE MOUSE SUBMAXILLARY CRUDE HOMOGENATE
ON SEPHADEX G-75
EFFLUENTVOLUME(ml)
%TRANSMISSIONOPTICALDENSITY
31.0 100 0.00032.0 99 0,00437.0 30 0.52342.0 3 1.52347.0 7 1.15552.0 4 1.39857.0 1 2.00062.0 1 2.00067.0 3 1.52372.0 ■ 10 1.00077.0 16 0.79682.5 24 0.62089.5 61 0.21594.5 34 0.469100.5 25 0.602106.0 16 0.796111.0 12 0.921116.0 9 1.046126.0 4 1.398136.0 19 ■ 0.721141.0 35 0.456

87TABLE TV
FRACTIONATION OF MALE MOUSE SUBMAXILLARY CRUDE HOMOGENATEON SEPHADEX G-lOO
EFFLUENT % EFFLUENT %VOLUME TRANS OPTICAL VOLUME TRANS OPTICAL(ml) MISSION DENSITY (ml) MISSION DENSITY
Fractionated on 8/26/65 Fractionated on 9/8/656 84 0.076 3 92 0.036
12 95 0.22 6 92 0.03615 86 0.066 9 92 0.03618 84 0.076 13 89 0.05121 85 0.071 19 90 0.04624 87 0.061 22 90 0.04627 89 0.051 25 92 0.03630 . 89 0.051 28 92 0.03633 89 0.051 31 92 0.03636 64 0.194 34 57 0.24439 62 ' 0.208 37 67 0.17442 66 0.181 40 67 0.17445 72 0.143 43 72 0.14348 75 0.125 46 72 0,14351 71 0.149 49 67 0.17454 68 0.168 52 63 0.20157 69 0.161 55 63 0.20160 69 0.161 58 65 0.18763 69 0.161 62 56 0.25266 49 0.310 64 , 44 0.35769 41: 0.387 67 35 0,45672 43 0.367 70 33 0.48275 56 0.252 73 40 0.39878 68 0.168 76 51 0.29281 77 0.114 79 65 0.18784 80 0.097 82 73 0.13787 84 0.076 85 76 0.11990 84 0.076 88 79 0.10293 85 0.071 91 90 0.04696 86 0.066 94 80 0.09799 82 0.086 97 77 0.114102 75 0.125 100 72 0.143105 69 0.161 103 65 0.187108 58 . 0.237 106 58 0.237111 51 0.292 109 50 0.301114 42 0.377 112 42 • 0.377117 40 0.398 115 38 0.420120 47 0.328 118 42 0.377121 47 0.328
124 55 0.260127 60 0.222130 61 0.215

88TABLE V
ABSORPTION SPECTRA OF FRACTIONS 1, 2, AND 3
WAVELENGTH(m>i)
FRACTION 1 8/26/65
% T 0. D.FRACTION 2 9/8/65
% T 0. D.FRACTION 3
8/26/65 9/8/65% T 0. D. $ T O.D.
245 84 0.076 87 0.061 66 0.181 53 0.276250 85 0.071 90 0.046 69 0.161 60 0.222255 85 0.071 92 0.036 69 0.161 61 0.215260 86 0.066 92 0.036 69 0.161 63 0.201265 86 0.066 93 0.032 67 0.174 61 0.215270 86 0,066 93 0.032 65 0.187 60 0.222271 86 0.066 93 0.032 65 0.187 60 0.222272 86 0.066 93 0.032 65 0.187 60 0.222273 86 0.066 93 0.032 64 0.194 59 0.230274 86 0.066 92 0.036 64 0.194 59 0.230275 86 0.066 92 0.036 64 0.194 59 0.230276 87 . 0.061 93 0.032 64 0.194 58 0.237277 87 0.061 93 0.032 64 0.194 59 0.230278 87 0.061 93 0.032 64 0.194 58 0.237279 87 0.061 94 0.027 64 0.194 58 0.237280 87 0.061 94 0.027 64 0.194 58 0.237281 88 0.056 94 0.027 64 0.194 60 0.222282 88 0.056 94 0.027 65 0.187 60 0.222283 88 0.056 94 0.027 65 0.187 60 0.222284 89 0.051 94 0.027 65 0.187 61 0.215285 88 0.056 92 0.036 66 0.181 61 0.215290 90 0.046 93 0.032 71 0.149 65 0.187295 91 0.041 94 0.027 77 0.114 71 0.149300 91 0.041 95 0.022 82 0.086 75 0.125305 92 0.036 95 0.022 85 0.071 77 0.114310 93 0.032 96 0.018 87 0.061 81 0.092320 94 0.027 97 0.013 87 0.061 81 0.092330 94 0.027 97 0.013 90 0.046 83 0.081
$ T = Percent Transmission 0. D.= Optical Density

89TABLE VI
ABSORPTION SPECTRA OF FRACTIONS 4 AND 5
WAVELENGTH(m>i)
FRACTION 4 8/26/65 9/8/65
FRACTION 5 8/26/65 9/8/65
% T 0. D. % T 0. D. % T 0. D. % T 0. D.
24.5 61 0.215 54 0.268 54 0.268 47 0.328250 67 0.174 61 0.215 54 0.268 47 0.328255 65 0.187 60 0.222 51 0.292 45 0.347260 59 0.229 53 0.276 46 0.337 42 0.377265 51 0.292 46 0.337 42 0.377 40 0.398270 45 0.347 39 0.409 41 0.387 37 0.432271 44 0.356 38 0.420 40 0.398 37 0.432272 42 0.377 37 0.432 40 0.398 37 0.432273 42 0.377 36 0.444 39 0.409 36 0.444274 41 0.387 36 0.444 39 0.409 36 0.444275 40 0.398 35 0.456 40 0.398 36 0.444276 40 0.398 34 0.469 41 0.387 37 0.432277 40 0.398 34 0.469 41 0.387 37 0.432278 39 0.409 34 0.469 41 0.387 38 0.420279 39 0.409 33 0.482 42 0.377 38 0.420280 39 • 0.409 33 0.482 43 0.367 38 0.420281 39 0.409 33 0.482 43 0.367 39 0.409282 39 0.409 34 0.469 44 0.356 40 0.398283 39 0.409 34 0.469 45 0.347 40 0.398284 40 0.393 35 0.456 46 0.337 42 0.377285 42 0.377 36 0.444 47 0.328 43 0.367290 50 0.301 44 0.357 52 0.284 50 0.301295 66 0.181 60 0.222 57 0.244 55 0.260300 80 0.097 75 0.125 60 0.222 58 0.237305 89 0.051 85 0.071 61 0.215 59 0.229310 92 0.036 87 0i06l 62 0.208 60 0.222320 95 0.022 92 0.036 65 0.187 64 0.194330 97 0.013 93 0.032 72 0.143 66 0.181
% T = Percent Transmission 0. D,= Optical Density
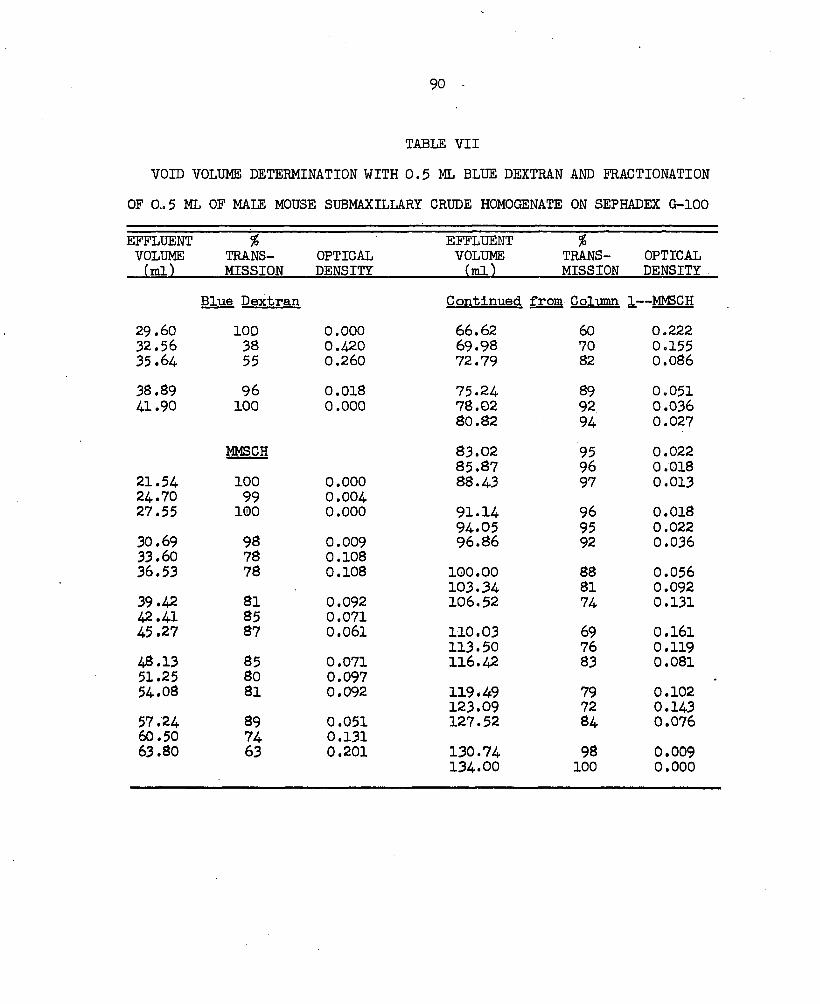
90
TABLE VIIVOID VOLUME DETERMINATION WITH 0.5 ML BLUE DEXTRAN AND FRACTIONATION
OF 0..5 ML OF MALE MOUSE SUBMAXILLARY CRUDE HOMOGENATE ON SEPHADEX G-lOO
EFFLUENTVOLUME(ml)
%TRANSMISSION
OPTICALDENSITY
EFFLUENTVOLUME(ml)
%TRANSMISSION
OPTICALDENSITY
Blue Dextran Continued from Column 1— M&GCH29.60 100 0.000 66.62 60 0.22232.56 38 0.420 69.98 70 0.15535.64 55 0.260 72.79 82 0.08638.89 96 0.018 75.24 89 0.05141.90 100 0.000 78.02 92 0.036
80.82 94 0.027MMSCH 83.02 95 0.022
85.87 96 0.01821.54 100 0.000 88.43 97 0.01324.70 99 0.00427.55 100 0.000 91.14 96 0.018
94.05 95 0.02230.69 98 0.009 96.86 92 0.03633.60 78 0.10836.53 78 0.108 100.00 88 0.056
103.34 81 0.09239.42 81 0.092 106.52 74 0.13142.41 85 0.07145.27 87 0.061 110.03 69 0.161
113.50 76 0.11948.13 85 0.071 116.42 83 0.08151.25 80 0.097 .54.08 81 0.092 119.49 79 0.102
123.09 72 0.14357.24 89 0.051 127.52 84 0.07660.50 74 0.13163.80 63 0.201 130.74 98 0.009134.00 100 0.000

91TABLE VIII
VOID VOLUME DETERMINATION WITH 0.5 ML BLUE DEXTRAN AND FRACTIONATIONOF 0.5 ML LYOPHILIZED PROTEIN FROM AREA A, FIG. la
ON SEPHADEX G-lOO IN 0.02 M SODIUM PHOSPHATE BUFFER, pH 6.5EFFLUENTVOLUME(ml)
%TRANSMISSION
OPTICALDENSITY
EFFLUENTVOLUME(ml)
%TRANSMISSION
OPTICALDENSITY
Blue Dextran Submaxillary Protein. Continued28.15 100 0.000 69.78 29 0.53830.95 63 0.201 72.53 40 0.39833.85 46 0.337 75.18 60 0.22236.81 82 0.086 78.00 75 0.125
81.25 86 0.06684.55 90 0.046
Submaxillary Protein87.32 91 0.04125.66 100 0.000 90.07 92 0.036
29.15 83 0.081 93.15 92 0.03632.08 63 0.201
95.88 94 0.02735.09 70 0.155 98.64 95 0.02238.05 66 0.181 101.47 96 0.01841.14 66 0.181
104.90 95 0.02244.01 73 0.137 107.99 95 0.02246.91 73 0.137 111.17 96 0.01849.64 66 0.181
114.14 96 0.01852.64 60 0.222 117.13 98 0.00955.80 64 0.194 120.34 99 0.00458.74 68 0.168
123.73 99 0.00461.45 60 0.222 126.51 99 0.00464.20 44 0.357 129.79 100 0.00067.12 31 0.509
133.29 99 0.004

92
TABLE IXVOID VOLUME DETERMINATION WITH 0,5 ML BLUE DEXTRAN AND FRACTIONATION
OF 0.5 ML LYOPHILIZED PROTEIN FROM AREA A, FIG, la, ONSEPHADEX G-lOO IN 0,005 M TRIS HCl BUFFER, pH 7.2
EFFLUENTVOLUME(ml)
%TRANSMISSION
OPTICALDENSITY
EFFLUENTVOLUME(ml)
%TRANSMISSION
OPTICALDENSITY
Blue Dextran Submaxillarv Protein. Continued27,62 100 0,000 61,28 63 0,20130,52 87 0,061 64.16 71 0.14933.38 31 0,509 67.06 79 0,10236,38 85 0,071 70,08 88 0.05639.94 100 0,000 72,82 94 0,027
75.80 97 0.013Submaxillarv Protein 78,64 100 0.000
81,69 100 0,00027,84 100 0,000 84,46 100 0,00030,70 98 0,00933.51 69 0,161 87,32 100 0,000
91.32 100 0,00035.54 78 0,108 94.29 100 0,00037.97 84 0.07640.96 80 0,097 97,00 100 0,000
100,00 100 0,00043.66 75 0,125 102,84 101 — —
46.51 78 0,10849.51 81, 0,092 105,58 102 ----
109,32 101 ----
52,66 80 0,097 111,70 102 — —
55,69 70 0,15558,40 62 0,208 114.45 102 —
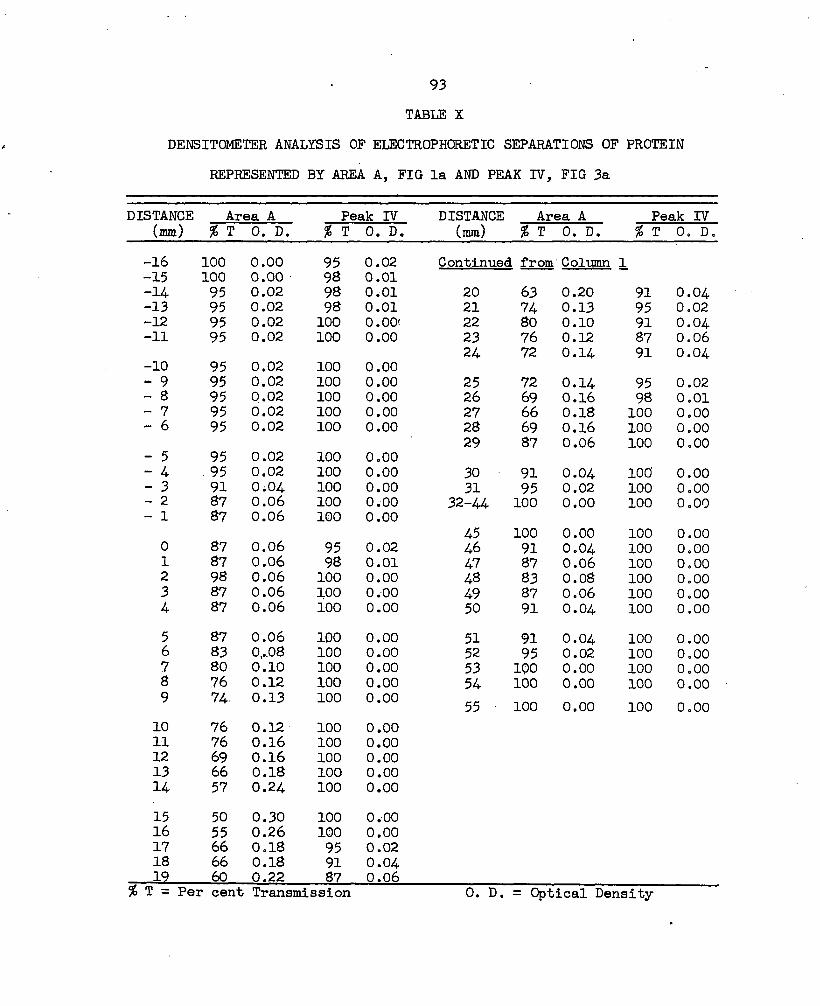
93TABLE X
DENSITOMETER ANALYSIS OF ELECTROPHORETIC SEPARATIONS OF PROTEIN REPRESENTED BY AREA A, FIG la AND PEAK IV, FIG 3a
DISTANCE Area A Peak IV DISTANCE Area A Peak IV(mm) % T 0. D. % T 0. D. (mm) % T 0. D. % T 0, D.
-16 100 0.00 95 0.02 Continued from Column 1-15 100 0.00 98 0.01-14 95 0.02 98 0.01 20 63 0.20 91 0.04-13 95 0.02 98 0.01 21 74 0.13 95 0.02-12 95 0.02 100 O.OOi 22 80 0.10 91 0.04-11 95 0.02 100 0.00 23 76 0.12 87 0.06
24 72 0.14 91 0.04-10 95 0.02 100 0.00- 9 95 0.02 100 0.00 25 72 0.14 95 0.02— 8 95 0.02 100 0.00 26 69 0.16 98 0.01- 7 95 0.02 100 0.00 27 66 0.18 100 0.00— 6 95 0.02 100 0.00 28 69 0.16 100 0.00
29 87 0.06 100 0.00- 5 95 0.02 100 0.00- 4 . 95 0.02 100 0.00 30 91 0.04 100 0.00- 3 91 0.04 100 0.00 31 95 0.02 100 0.00- 2 87 0.06 100 0.00 32-44 100 0.00 100 0.00- 1 87 0.06 100 0.00
45 100 0.00 100 0.000 87 0.06 95 0.02 46 91 0.04 100 0.001 87 0.06 98 0.01 47 87 0.06 100 0.002 98 0.06 100 0.00 48 83 0.08 100 0.003 87 0.06 100 0.00 49 87 0.06 100 0.004 87 0.06 100 0.00 50 91 0.04 100 0.005 87 0.06 100 0.00 51 91 0.04 100 0.006 83 0,..08 100 0.00 52 95 0.02 100 0.007 80 0.10 100 0.00 53 100 0.00 100 0,008 76 0.12 100 0.00 54 100 0.00 100 0.009 74 0.13 100 0.00 55 100 0.00 100 0.0010 76 0.12 100 0.0011 76 0.16 100 0.0012 69 0.16 100 0.0013 66 0.18 100 0.0014 57 0.24 100 0.0015 50 0.30 100 0.0016 55 0.26 100 0.0017 66 0.18 95 0.0218 66 0.18 91 0.0419 60 0.22 87 0.06
% T = Per cent Transmission 0. D. = Optical Density

94TABLE XI
FRACTIONATION OF MALE MOUSE SUBMAXILLARY CRUDE HOMOGENATEON SEPHADEX G-200, CHROMATOGRAPHIC COLUMN I
EFFLT3ENT %VOLUME • OPTICAL(ml) TRANSMISSION DENSITY3 98 0.0096 98 0.0099 98 - 0.00912 98 0.00915 98 0.00918 98 0.00921 98 0.00924 98 0.00927 99 0.00430 95 0.02233 89 0.05137 84 0.07639 84 0.07642 87 0.06145 85 0.07148 82 0.08651 79 0.10254 76 0.11957 76 0.11960 77 0.11464 74 0.13167 64 0.19470 58 0.23772 56 0,25275 57 0.24478 51 0.29280 39 0.40985 24 0.62088 24 0.62090 33 0.48293 47 0.32896 60 0.22299 66 0.181102 63 0.201105 58 0.237108 52 0.28Z.

95TABLE XII
FRACTIONATION OF 2 ML OF MALE MOUSE SUBMAXILLARY CRUDE HOMOGENATE ON SEPHADEX G-200, CHROMATOGRAPHIC COLUMN II
EFFLUENT % EFFLUENT %VOLUME TRANS OPTICAL VOLUME TRANS OPTICAL(ml) MISSION DENSITY (ml) MISSION DENSITY
10/13/65 Continued from Column I42 100 0.000 193 84 0.07657 100 0.000 196 89 0.05160 100 0.000 199 90 0.04663 100 0.000 201 89 0.05166 98 0.009 204 83 0.08169 93 0.032 207 53 0.27672 91 0.041 210 51 0.29275 94 0.027 213 42 0.37778 96 0.018 216 40 0.39881 97 0.013 219 37 0.43284 96 0.018 222 37 0.43287 94 0.027 225 39 0.409
228 40 0.39811/3/65 231 59 0.229
132 Pooled 234 71 0.149135 99 0.004138 100 0.000 248 89 0.051141 100 0.000 261 95 0.022144 96 0.018 264 85 0.071
267 80 0.097147. 96 0.018 270 73 0.137150 94 0.027153 93 0.032 273 66 0.181156 94 0.027 276 59 0.229159 100 0.000 279 53 0.276
282 52 0.284162 100 0.000 285 54 0.268165 100 0.000168 98 0.009 288 60 0.222171 98 0.009 290 66 0.181174 97 0.013 294 76 0.119
296 83 0.081177 96 0.018 299 91 0.041180 93 ■ 0.032183 ,94 0.027 302 97 0.013186 90 0.046 306 100 0.000189 88 0.056 309 ■ 100 0.000.
311 100 0.000

96TABLE XIII
RECYCLING OF AREA D
EFFLUENTVOLUME % OPTICAL(mi) TRANSMISSION DENSITY
198 100 0.000201 100 0.000203 98 0.009206 96 0.018209 91 0,041212 . 87 0.061215 81 0.092218 74 0.131220 70 0.155222 67 0.174225 66 0.181228 63 0,201231 67 0.174234 70 0.155237 79 0.102240 ■ 86 0.066243 94 0.027252 99 0.004261 100 0.000
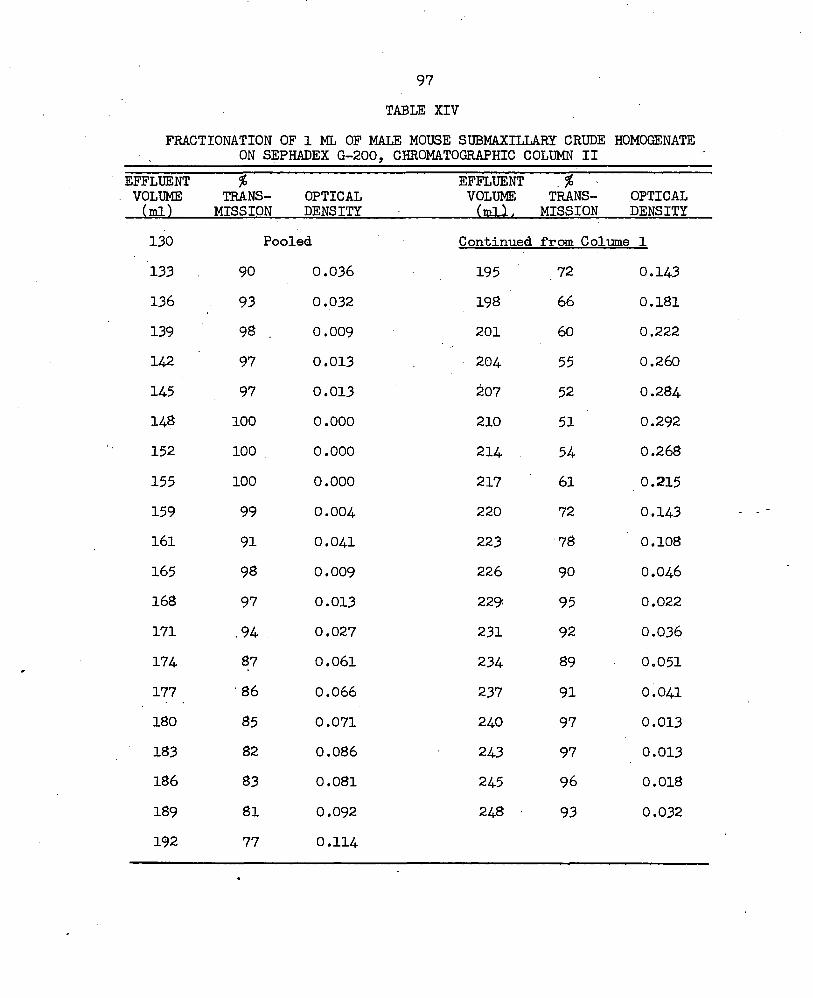
97TABLE XIV
FRACTIONATION OF 1 ML OF MALE MOUSE SUBMAXILLARY CRUDE HOMOGENATE ON SEPHADEX G-200, CHROMATOŒAPHIC COLUMN II
EFFLUENTVOLUME(ml)
%TRANSMISSION
OPTICALDENSITY
EFFLUENTVOLUME(mil.
%TRANSMISSION
OPTICALDENSITY
130 Pooled Continued from Colume1 1133 90 0.036 195 72 0.143136 93 0.032 198 66 0.181139 98 . 0.009 201 60 0.222142 97 0.013 204 55 0.260145 97 0.013 207 52 0.284148 100 0.000 210 51 0.292152 100 0.000 214 54 0.268155 100 0.000 217 61 0.215159 99 0.004 220 72 0.143161 91 0.041 223 78 0.108165 98 0.009 226 90 0.046168 97 0.013 229 95 0.022171 .94 0.027 231 92 0.036174 87 0.061 234 89 0.051177 86 0.066 237 91 0.041180 85 0.071 240 97 0.013183 82 0.086 243 97 0.013186 83 0.081 245 96 0.018189 81 0.092 248 ■ 93 0.032192 77 0.114

98TABLE
DENSITOMETER ANALYSIS OF ELECTROPHORETIC SEPARATIONS OF PROETINREPRESENTED BY AREA A, FIG la, AND PEAK D^ FIG. 5d
DISTANCE Area A Peak IV DISTANCE Area A Peak IV(mm) % T 0. D. % T 0. D (mm) % T L. D. % T 0. Do
-16 %00 p. 00 100 0.00 Continued from Colimn 1-15 95 0.02 95 0.02
7 , 76 0.12 87 0.06- U 95 0.02 93 0.03 8 80 0.10 87 0.06-13 95 0.02 93 0.03 9 83 0.08 87 0.06-12 91 0.04 93 0.03
10 83 0.08 ,91 0.04-11 91 0.04 95 0.02 11 80 0.10 91 0.04-10 91 0.04 95 0.02 12 69 0.16 91 0.04- 9 93 0.03 95 0.02
13 66 0.l8 87 0.06- 8 95 0.02 95 0.02 14 72 0.14 83 0.08- 7 95 0.02 95 0.02 15 83 0.08 87 0.06— 6 95 0.02 98 0.01
16 87 0.06 91 0.04- 5 95 0.02 98 0.01 17 91 0;04 95 0.02- 4 93 0.03 98 0.01 18 87 0.06 95 0.02- 3 91 0.04 95 0.02
19 83 0.08 91 0.04- 2 87 0.06 95 0.02 20 80 0.10 95 0.02- 1 83 0.08 95 0.02 21. 76 0.12 95 0.020 83 0.08 95 0.02
22 66 0.18 95 0.021 83 0.08 95 0.02 23 66 0.18 93 0.032 80 0.10 91 0.04 24 83 0.08 91 0.043 69 0.16 91 0.04
25 100 0.00 95 0.024 60 0.22 91 0.04 26-55 100 0.00 100 0.005 57 0.24 91 0.046 66 0.18 87 0.06
% T = Percent Transmission 0. D. = Optical Density
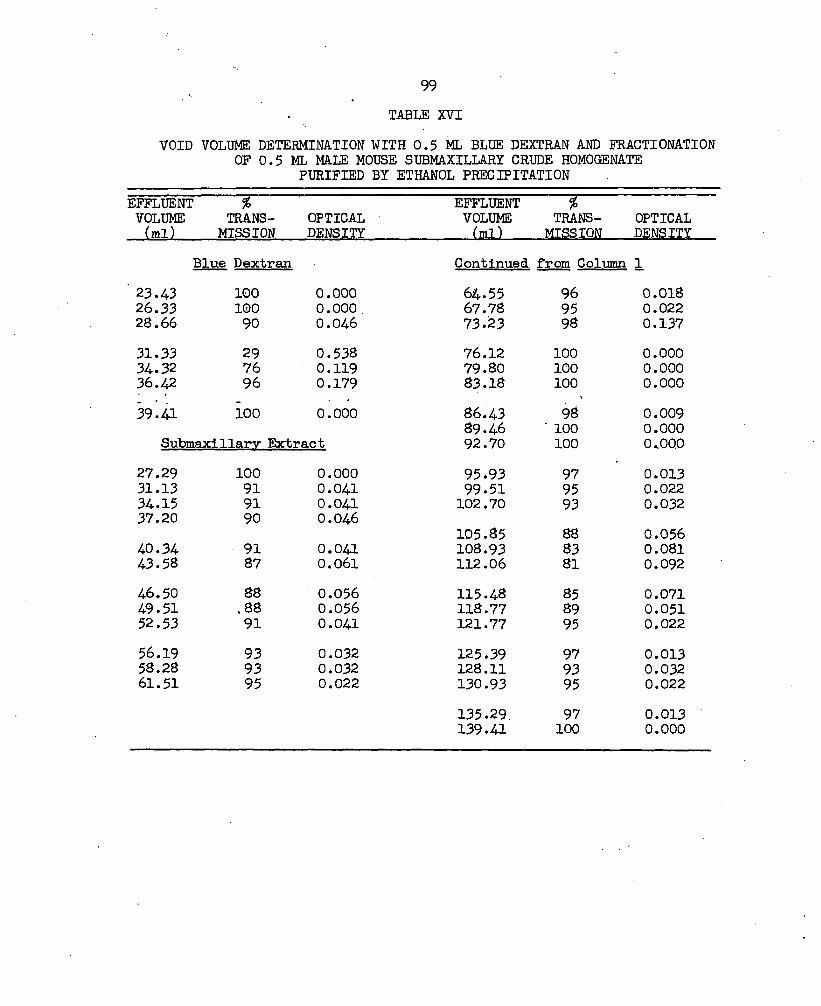
99TABLE XVI
VOID VOLUME DETERMINATION WITH 0.5 ML BLUE DEXTRAN AND FRACTIONATIONOF 0.5 ML MALE MOUSE SUBMAXILLARY CRUDE HOMOGENATE
PURIFIED BY ETHANOL PRECIPITATIONEFFLUENTVOLUME(ml)
..TTRANSMISSION
OPTICALDENSITY
EFFLUENTVOLUME(ml)
%TRANS
MISSIONOPTICALDENSITY
Blue Dextran Continued from Column 123.43 100 0.000 64.55 96 0.01826.33 100 0.000 , 67.78 95 0.02228.66 90 0.046 73.23 98 0.13731.33 29 0.538 76.12 100 0.00034.32 76 0.119 79.80 100 0.00036.42 96 0.179 83.18 100 0.00039.a 100 0.000 86.43 98 0.009
89.46 ■ 100 0.000Submaxillarv Extract 92.70 100 O.OQO
27.29 100 0.000 95.93 97 0.01331.13 91 0.041 99.51 95 0.02234.15 91 0.041 102.70 93 0.03237.20 90 0.046
105.85 88 0.05640.34 91 0.041 108.93 83 0.08143.58 87 0.061 112.06 81 0.09246.50 88 0.056 115.48 85 0.07149.51 .88 0.056 118.77 89 0.05152.53 91 0.041 121.77 95 0.02256.19 93 0.032 125.39 97 0.01358.28 93 0.032 128.11 93 0.03261.51 95 0.022 130.93 95 0.022
135.29, 97 0.013139.41 100 0.000

100TABLE XVII
DENSITOMETER ANALYSIS OF 35 MIN ELECTROPHORETIC SEPARATIONOF PROTEIN FROM AREA A, FIG la
DISTANCE/mm) % T
DISTANCE 0. D . (mm) % T
DISTANCE 0. D.______(mm) % T 0. D,
Continued Continued7 91 0.04 34 100 0.00
-16 100 0.00 8 91 0.04 35 95 0.02-15 100 0.00 9 93 0.03 36 91 0.04-14 100 0.00 10 95 0.02 37 91 0.04-13 100 0.00 11 95 0.02 38 95 0.02-12 100 0.00 12 93 0.03 39 95 0.02-11 100 0.00 13 91 0.04 40 95 0.02-10 95 0.02 14 85 0.07 41 98 0.01-9 93 0.03 15 83 0.08 42 95 0.02—8 91 0.04 16 87 0.06 43 95 0.02-7 87 0.06 17 95 0.02 44 95 0.02-6 87 0.06 18 100 0.00 45 91 0.04-5 83 0.08 19 100 0.00 46 91 0.04—4 80 0.10 20 100 0.00 47 91 0.04-3 76 0.12 21 100 0.00 48 91 0.04-2 74 0.13 22 100 0.00 49 91 0.04-1 72 0.14 23 100 0.00 50 91 0.040 74 0.13 24 100 0.00 51 91 0.041 76 0.12 25 100 0.00 52 95 0.022 80 0.10 26 100 0.00 53 95 0.023 83 0.08 27 100 0.00 54 95 0.024 91 0.04 28 100 0.00 55 95 0.025 91 0.04 29 100- 0.006 91 0.04 30 100 0.00
31 100 0.0032 100 0.0033 100 0.00
% T = Percent Transmission; 0, D.=0ptical Density

101TABLE XVIII
DENSITOMETER ANALYSIS OF 35 MIN ELECTROPHORETIC SEPARATION OF PROTEINFROM MALE MOUSE SUBMAXILLARY CRUDE HOMOGENATE ETHANOL PRECIPITATION
DISTANCE(mm) % T 0. D
DISTANCE(mm) % T 0.' D.
DISTANCE(mm) % T 0. D.
-16 100 0.00 Continued Continued-15 91 0.04
7 95 0,02 .34 91 0.04-lA 91 0.04 8 95 0.02 45 87 0.06-13 83 0.08 9 100 0.00 36 76 0.12-12 84 0.08
10 100 0100 37 66 0.18-11 80 0.10 11 100 0.00 .38 63 0.20-10 95 0.02 12 100 0.00 39 60 0.22-9 87 0.06
13 100 0.00 40 52 0.28-8 83 0.08 14 100 0.00 41 44 0.35-7 80 0.10 15 100 0.00 42 40 0.39-6 69 0.16
16 100 0.00 43 45 0.34-5 63 0.20 17 loo 0.00 44 41 0.38-4- 63 0.20 100 0.00 45 41 0.38-3 55 0.26
19 100 0.00 46 38 0.42-2 52 0.28 20 100 0.00 47 38 0.42-1 51 0.29 21 100 0.00 48 39 0.410 60 0.22
22 100 0.00 49 39 0.411 66 0.18 23 100 0.00 50 36 0 «442 66 0.18 24 100 0.00 51 38 0.423 66 0.18
25 100 0.00 52 39 0.404 72 0.14 26 100 0.00 53 52 0.285 .76 0.12 27 100 0.00 , 54 83 0.086 80 0.10
28 100 0.00 55 100 0.0029 100 0.0030 100 0.0031 100 0.0032 100 0.0033 95 0.02
% T = Percent Transmission; 0. D. Optical Density

102TABLE XIX
DENSITOMETER ANALYSIS OF 90 MIN ELECTROPHORETIC SEPARATION OFPROTEIN FROM AREA A, FIG. la
DISTANCE(mm) % T 0. D.
DISTANCE(mm) % T 0. D
DISTANCE (mm) % T 0. D.
Continued Continued-16 100 0.00 7 95 0.02 34 87 0.06-15 95 0.02 8 95 0.02 35 83 0.08
9 93 0.03 36 80 0.10-14- 95 0.02 10 91 0.04 37 91 0.04-13 95 0i02 11 91 0.04 38 100 0.00-12 95 0.02 12 93 0.03 29 100 0.00-11 95 0.02 13 95 0.02 40 100 0.00-10 95 0.02 14 91 0.04 41 100 0.00-9 95 0.02 15 87 0.06 42 100 0.00-8 95 0.02 16 83 0.08 43 100 0.00-7 98 0.01 17 80 0.10 44 100 0.00-6 98 0.01 18 76 0.12 45 100 0.00-5 98 0.01 19 80 0.10 46 100 0.00-4- 95 0.02 20 83 0.08 47 100 0.00-3 95 0.02 21 87 0.06 48 100 0.00-2 95 0.02 22 91 0.04 49 100 0.00-1 91 0.04 23 93 0.03 50 100 0.000 91 0.04 24 91 0.04 51 100 0.001 91 0.04 25 85 0.07 52 100 0.002 91 0.04 26 83 0.08 53 100 0.003 91 0.04 27 83 0.08 54 100 0.004 95 0.02 28 87 0.06 55 100 0.005 95 0.02 29 91 0.046 95 0.02 30 93 0.03
31 91 0.0432 91 0.0433 89 0.05
% T = Percent Transmission 0. D. = Optical Density

103TABLE XX
DENSITOMETER ANALYSIS OF 90 MIN ELECTROPHORETIC SEPARATION OF PROTEINFROM MALE MOUSE SUBMAXILLARY CRUDE HOMOGENATE PURIFIED BY ETHANOL
PRECIPITATION
DISTANCE DISTANCE DISTANCE(mm) % T 0. D. (mm) % T 0. D. (mm) % T 0. D,
Continued Continued-l6 100 0.00 7 91 0.04 34 95 0.02-15 100 0.00 8 91 0.04 36 .95 0.02
9 91 0.04 36 95 0.02-14 95 0.02 10 91 0.04 37 100 0.00-13 93 0.03 11 91 0.04 38 100 0.00-12 91 0.04 12 91 0.04 39 100 0.00-11 91 0.04 13 89 0.05 40 100 0.00-10 91 0.04 14 87 0.06 41 100 0.00-9 91 0.04 15 76 0.12 42 100 0.00-8 95 0.02 16 69 0.16 43 100 0.00-7 95 0.02 17 76 0.12 44 100 0.00^6 95 0.02 18 91 0.04 45 100 0.00-5 95 0.02 19 98 0.01 46 100 0.00-4 91 0.04 20 100 0.00 47 100 0.00-3 91 0.04 21 95 0.02 48 100 0.00-2 87 0.06 22 95 0.02 49 100 0.00-1 87 0.06 23 100 0.00 50 100 0.000 87 0.06 24 100 0.00 51 100 0.001 87 0.06 25 100 0.00 52 100 0.002 87 0.06 26 100 0.00 53 100 0.003 91 0.04 27 100 0.00 54 100 0.004 91 0.04 28 100 0.00 55 100 0.005 91 0.04 29 100 0.006 91 0.04 30 100 0.00
31 100 0.0032 100 0.0033 100 0.00
% T = Percent Transmission; 0, D. = Optical Density.

104 TABLE XXI
VOID VOLUME DETERMINATION WITH 0.5 ML BLUE DEXTRAN AND FRACTIONATION OF 0.5 ML OF (NH^)gSO^ PURIFIED MALE MOUSE SUBMAXILLARY CRUDE HOMOGENATE
ON SEPHADEX G-lOO IN 0.2 M Sodium Phosphate Buffer, pH 6.5
EFFLUENTVOLUME(ml)
%TRANSMISSION
OPTICALDENSITY
EFFLUENTVOLUME(ml)
%TRANSMISSION
OPTICALDENSITY
Lue Dextran Column 1. Continued26.34 Pooled 58,08 37 0.43229.49 100 0.000 61.12 25 0.60232.90 68 0.168 64.21 10 1.00036.39 71 0.149 67.25 6 1.22239.40 96 0.018 70.57 8 1.097
73.92 26 0.585Submaxillarv Extract
76.70 51 0.29218.63 Pooled 79.34 67 0.17423.47 100 0.000 82.68 75 0.12526.42 97 0.013
85.87 78 0.10829.27 93 0.032 88.49 80 0.09732.26 35 0.456 91.28 81 0.09235.06 48 0.319
94.06 78 0.10837.86 41 0.387 97.08 80 0.09741.20 42 0.377 100.44 74 0.13144.66 52 0.284
103.15 70 0.15547.69 43 0.367 106.16 77 0.11451.01 26 0.585 109.11 87 0.06154.18 28 0.553
114.00 96 0.018118.72 100 0.000121.64 100 0.000

105TABLE XXII
VOID VOLUME DETERMINATION WITH 0.5 ML BLUE DEXTRAN AND FRACTIONATION OF 0.5 ML OF (NH^ÏgSO^ PURIFIED MALE MOUSE SUBMAXILLARY CRUDE HOMOGENATE
ON SEPHADEX G-lOO In 0.005 M Tris HGl B-uffer, pH 7.2
EFFLUENT % EFFLUENT %VOLUME TRANS OPTICAL VOLUME TRANS OPTICAL(ml) MISSION DENSITY (ml) MISSION DENSITY
Blue Dextran Continued from Column I16.83 Pooled 60.30 16 0.79629.10 100 0.000 63.36 10 1.00032.02 58 0.237 66.14 10 1.00037.88 97 0,013 68.82 22 0.658a . 38 100 0.000 71.74 , 40 0.398
75.24 57 0.244Submaxillarv Extract75.24 57 0.24424.55 Pooled 78.83 64 0.194
27.44 100 0.000 81.78 64 0,19431.00 86 0.06684.87 63 0.201
33.87 24 0.620 88.46 60 0,22236.77 19 0.721 91.45 60 0.22240.04 35 0.456
95.50 56 0.25243.19 45 0.347 98.77 58 0.23745.86 27 0.569 101.70 70 0,15548.77 21 0,678
105.23 78 0.10851.52 29 0.538 108.37 82 0.08654.48 37 0.523 111.39 86 0.06657.50 30 0.523
114.32 89 0.051117.34 89 0.051120.19 92 0.036

106
TABLE XXIIIPURIFICATION OF MALE MOUSE MUSCLE CRUDE HOMOGENATE
AND MALE MOUSE THYMUS CRUDE HOMOGENATE ON SEPHADEX G-25
MUSCLE HOMOGENATE THYMUS HOMOGENATEEFFLUENTVOLUME(ml)
WAVELENGTH(mu)
%TRANSMISSION
OPTICAL - DENSITY
EFFLUENTVOLUME(ml)
% ~ TRANSMISSION
OPTICALDENSITY
41.0 280 100 0.000 39.0 100 0.00042.0 280 98 0.004 40.0 91 0.04143.0 280 91 0.041 43.0 13 0.88644.0 280 68 0.168 46.0 7 1.15544.5 280 36 0.444 53.0 21 0.67844.5 290 80 0.097 60.0 54 0.26847.0 290 58 0.237 61.5 77 0.11448.5 290 51 0.292 63.5 48 0.31949.0 290 . 51 0.292 65.0 37 0.43250.0 290 52 0.284 68.5 50 0.30157.5 290 73 0.137 71.5 62 0.20860.5 290 80 0.097 74.0 64 0.19461.7 280 48 0.319 81.0 66 0.18162.0 280 63 0.201 88.0 51 0.29264.0 280 78 0.108 96.5 46 0.33767.5 280 64 0.19468.3 ■ 280 70 0.15571.0 280 72 0.14378.0 280 74 0.13185.0 280 75 0.12592.0 280 69 0.161100.5 280 70 0.222110.0 280 46 0.337121.0 280 70 • 0.155
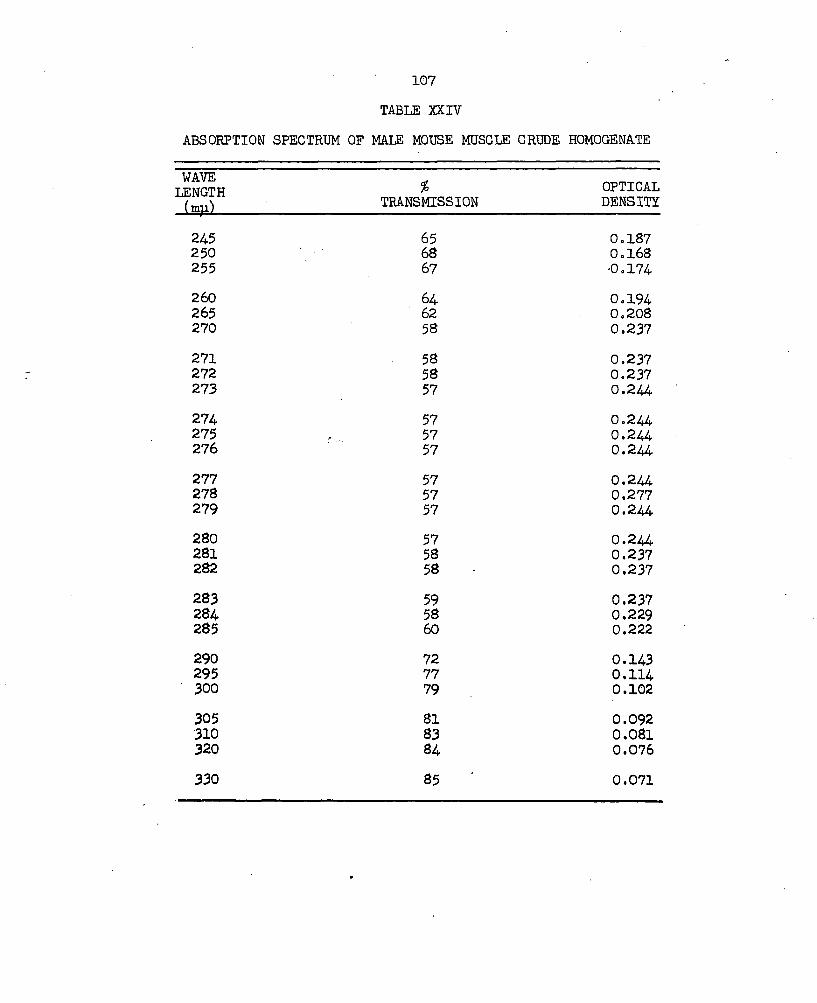
107TABLE XXIV
ABSORPTION SPECTRUM OF MALE MOUSE MUSCLE CRUDE HOMOGENATE
WAVELENGTH % OPTICAL(mp) TRANSMISSION DENSITY
245 65 0.187250 68 0.168255 67 -0.174260 64 0.194265 62 0.208270 58 0.237271 58 0.237272 58 0.237273 57 0.244274 57 0.244275 57 0.244276 57 0.244277 57 0.244278 57 0.277279 57 0.244280 57 0.244281 58 0.237282 58 0.237283 59 0.237284 58 0.229285 60 0.222290 72 0.143295 77 0.114■ 300 79 0.102305 81 0.092310 83 0.081320 84 0.076330 85 0.071
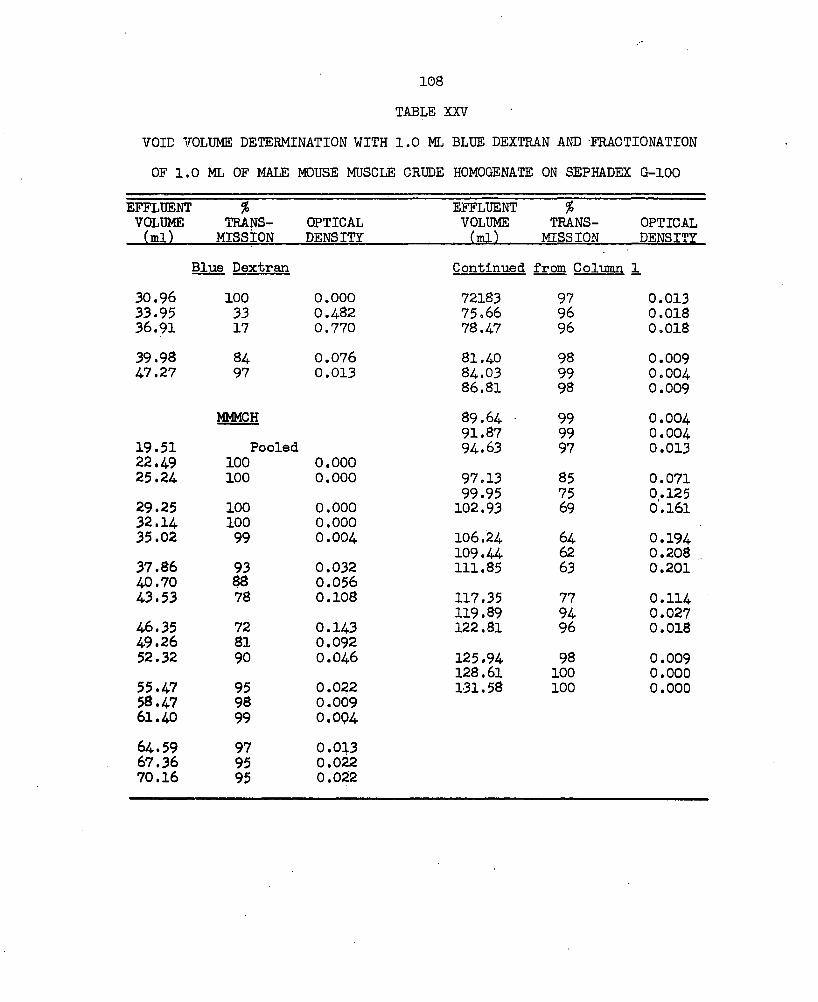
108TABLE XXV
VOIE VOLUME DETERMINATION WITH 1.0 ML BLUE DEXTRAN AND FRACTIONATIONOF 1.0 ML OF MALE MOUSE MUSCLE CRUDE HOMOGENATE ON SEPHADEX; G-loo
EFFLUENTVOLUME(ml)
%TRANSMISSION
OPTICALDENSITY
EFFLUENTVOLUME(ml)
%TRANSMISSION
OPTICALDENSITY
Blue Dextran Continued from Column 130.96 100 0.000 72183 97 0.01333.95 33 0.482 75.66 96 0.01836.91 17 0.770 78.47 96 0,01839.98 84 0.076 81.40 98 0.00947.27 97 0.013 84.03 99 0.00486.81 98 0.009
MMMCH 89.64 99 0.00491.87 99 0.004
19.51 Pooled 94.63 97 0.01322.49 100 0.00025.24 100 0.000 97.13 85 0.071
99.95 75 0.12529.25 100 0.000 102.93 69 0.16132.14 100 0.00035.02 99 0.004 106.24 64 0.194
109.44 62 0.20837.86 93 0.032 111.85 63 0.20140.70 88 0.05643.53 78 0.108 117.35 77 0.114
119.89 94 0.02746.35 72 0.143 122.81 96 0.01849.26 81 0.09252.32 90 0.046 125.94 98 0.009128.61 100 0.00055.47 95 0.022 131.58 100 0.00058.47 98 0.00961.40 99 0.0Q464.59 97 0.0^367.36 95 0.02270.16 95 0.022

109TABLE XXVI
VOID VOLUME DETERMINATION WITH 0.5 ML BLUE DEXTRAN AND FRACTIONATIONOF 0.5 ML OF MALE MOUSE THYMUS CRUDE HOMOGENATE ON SEPHADEX G-lOO
EFFLUENTVOLUME(ml)
iTRANSMISSION
OPTICALDENSITY
EFFLUENTVOLUME
(ml)TRANS
MISSIONOPTICALDENSITY
Continued from Column 123.39 100 0.000 65.50 100 0.00026.87 89 0.051 69.45 100 0.00029.88 39 0.409 72.69 100 0.00032.37 100 0.000 75.39 100 0.000
78.70 100 0.000MMTCH 82.62 100 0.000
21.35 Pooled 85.56 100 0.00024.34 . 100 0.000 88.60 100 0.00027.28 97 0.013 91.39 98 0.00930.08 63 0.201 94.81 93 0.03232.92 87 0.061 97.63 80 0.09735.78 87 0.061 100.56 65 0.18738.46 85 0.071 103.90 54 0.26841.60 92 0.036 107.01 57 0.24444.38 96 0.018 110.28 77 0.11447.35 97 0.013 112.68 82 0.08650.65 98 0.009 115.15 85 0.07153.50 99 0.004 118.41 94 0.02756.56 98 0.009 121.87 100 0.00059.45 98 0.009 125.14 100 0.00062.44 100 0.000 128.32 100 0.000

TABLE XXX
MBASÜBEHENTS OF CELL AXIS ANGLES
Culture Slide contained 2.5 ml of Medium and 11 pi of Water
DATE SLIDENUMBER
number of ANGLES MEASHRED
ACCUMULATEDTOTAL(°)
AVERAŒ(°)
DISTANCE BETW^N EXPLANTS (mm)
1/29/66 2 39 +1246 +31.9 0.532/ 5/66 2 30 + 7S3 +26.1 0.352/19/66 2 65 +1486 +22.9 0.452/27/66 1 19 + 555 +29.2 0.212/27/66 1 19 + 311 +16.4 0.442/27/66 1 10 + 157 +15.7 0.352/27/66 1 32 + 384 +12.0 0.42
TOTALS 214 +4922
Hë
AVERAΠOF TOTAIS: +23.0

TABLE m i
MEASUBEMENTS OF CELL AXIS ANCÜÆS
DATE SLIDENUMBER
NUMBER OF AN(H£S MEASURED
ACCUMULATED TOTAL (°)
AVERAGE(°)
DISTANCE BETWEEN EXPLANTS (mm)
1/29/66 1 58 +1207 +20.8 0.302/ 5/66 2 47 + 536 +11.4 0.672/19/66 1 36 + 917 +25.5 0.442/19/66 1 59 +13-3 +22.1 0.402/27/66 1 12 + 451 +37.6 0.322/27/66 1 15 + 215 +14.3 0.222/27/66 1 22 + 206 + 9.4 0.572/27/66 1 45 + 658 +14.6 0.282/27/66 1 26 + 340 +13.1 0.18
TOTALS 320 +5833
MHH .
AVERAΠof TOTALS: +18.2

TABLE m i lMEASUREMENTS OF CELL AXIS ANGLES
Culture Slide contained 2.5 ml of Medium and 20 jil of Water
DATE SLIDENUMBER
NUMBER OF ANGLES MEASURED
ACCUMULATED TOTAL (°)
AVERAGEn
DISTANCE BETWEEN EXPLANTS (mm)
2/19/66 1 67 +1089 +16.3 0.342/19/66 1 56 +1910 +34.1 0.382/19/66 1 64 +1206 +18.8 0.352/19/66 2 40 +1099 +27.5 0.262/27/66 1 35 + 638 +18.2 0.28
2/27/66 1 22 + 724 +32.9 0.18
TOTALS 284 +6666
t->K
AVERAGE OF TOTALS: +23.5

TABLE m i l l
MEASUBEMENTS OF CELL AXIS ANGLES Slide contained 2.5 ml of Medium and 20 jjg of Ijycjphilized G-25 Practicxi in 20 }il of Water
DATE SLIDENUMBER
NUMBER OF ANGLESmeasured
ACCUMULATED TOTAL (°)
AVERAGEn DISTANCE BETWEEN EXPLANTS (mm)
2/19/66 1 90 +1806 +20.1 0.24
2/19/66 1 71 +1573 +22.1 0.42
2/19/66 2 90 +1077 +12.0 0.502/27/66 1 39 + 272 + 6.9 0.222/27/66 1 31 + 385 +12.4 0.45
2/27/66 1 62 + 852 +13.7 0.352/27/66 1 38 + 747 +19.6 0.102/27/66 1 40 + 611 +15.3 0.682/ 5/66 1 34 + 590 +17.4 0.24
2/ 5/66 1 27 + 606 +22.4 0.253/ 5/66 2 13 + 323 +24.8 0.38
TOTALS 535 +8842 ,
G
AVEBAΠOF TOTALS; +16.5

TABLE XXXIV
MEASUBEMENTS OF CELL ÈXJS ANŒÆSSUda caatalned 2.5 ml of Medium and 24 }ig of Lyophllized G-25 Fraction In 48 pi of Water
DATE SLtDENUMBER
imMBER OF ANήS MEASUBED
ACCUMULATED TOTAL (0)
AVERAGE(°)
DISTAUSE BETWEEN EXPLANTS (mm)
3/5/66 1 41 - 68 - 1.7 0.303/5/66 1 30 + 40 + 1.3 0.223/5/66 1 27 +397 +14.7 0.41
3/5/66 1 22 -113 - 5.1 0.25
3/5/66 2 15 +192 +12.8 0.363/5/66 2 34 +593 +17.4 0.513/5/66 2 55 +491 + 8.9 0.313/5/66 2 42 +287 + 6.8 0.283/5/66 3 25 +269 +10.7 0.29
3/5/66 3 17 + 19 + 1.1 0.633/5/66 3 89 -212 — 2.4 0.23
3/5/66 3 22 +329 +15.0 0.473/5/66 3 23 +142 + 6.2 0.22TOTAIS 442 +2366
tii
A V m c æ OF TOTALS: +5.4

TABLE XXXVMEASUREMENTS OF CELL AXIS ANGLES
Culture Slide contained 2.5 ml of Mediijm and 27 of Water
DATE SLIDENUMBER
NUMBER OF ANGLES MEASURED
ACCUMULATED TOTAL (0)
AVERAGE(°)
DISTANCE BETWEEN .EXPLANTS (mm)
1/29/66 1 53 + 627 +11.8 0.371/29/66 2 60 ' +1138 +19.0 0.29
2/19/66 1 40 + 710 +17.8 0.41
2/19/66 1 78 +1917 +24.6 0.362/19/66 2 48 +1139 +23.7 0.392/19/66 2 41 + 882 +21.5 0.52
3/ 5/66 1 37 + 522 +14.1 0.573/ 5/66 1 38 + 598 +15.7 0.313/ 5/66 1 24 + 504 +21.0 0.30
TOTALS ' 419 +8037
t->Hvn
AVERAGE OF TOTALS +19.2
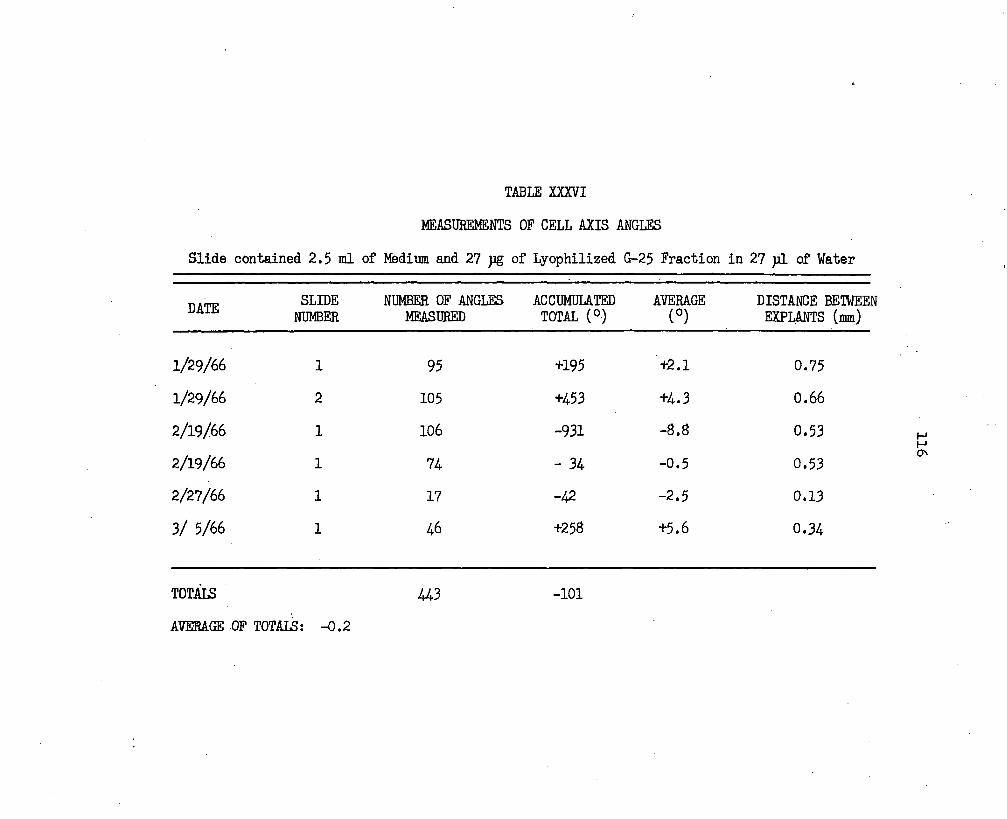
TABLE XXX7IMEASUREMENTS OP CELL AXIS ANGLES
Slide contained 2.5 ml of Medium and 27 yig of Lyophilized G-25 Fraction in 27 pi of Water
DATE SLIDENUMBER
NUMBER OF ANGLES MEASURED
ACCUMULATED TOTAL (°)
AVERAGE(°)
DISTANCE BEIWEEN EXPLANTS (mm)
1/29/66 1 95 +195 +2.1 0.751/29/66 2 105 +453 +4.3 0.66
2/19/66 1 106 -931 -8,8 0.532/19/66 1 lU - 34 -0.5 0.532/27/66 1 17 -42 -2.5 0.133/ 5/66 1 46 +258 +5.6 0.34
TOTALS 443 -101
AVERAGE OF TOTALS: -0.2

TABLE XXXVIIMEASUREMENTS OF CELL AXIS ANGLES
Culture Slide contained 2.5 ml of Medium and 4-5 pi of Water
DATE SLIDENUMBER
NUMBER OF ANGLES MEASURED ■
ACCUMULATED TOTAL (°)
AVERAGE(°)
DISTANCE BETWEEN EXPLANTS (mm)
1/29/66 1 29 + 529 +18.2 0.331/29/66 2 64 +1301 +20.3 0.342/10/66 1 62 +1072 +17.3 0.292/19/66 2 142 +1539 +10.8 0.313/ 5/66 1 25 + 441 +17.6 0.51
TOTALS • 322 +4882AVERAŒ OF TOTALS: +15.3

TABLE XXXVIIIMEASUREMENTS OF CELL AXIS ANGLES
Slide contained 2.5 ml of Medium and 45 yg of Lyophilized G-25 Fraction in 45 pi of Water
DATE SLIDENUMBER
NUMBER OF ANGLES MEASURED
ACCUMULATED TOTAL (°)
AVERAGE(°)
DISTANCE BETWEEN EXPLANTS (mm)
1/29/66 2 31 + 189 +6.1 0.511/29/66 2 36 + 147 +4.1 0.712/19/66 1 177 + 307 +1.7 0.342/19/66 2 62 + 644 +10.4 0.523/ 5/66 1 6 + 2 +0.3 0.22
TOTALS 312 +1289
Hax
AVMAGE OF TOTALS: +4.1

119TABLE XXXIX
VOID VOLUME DETERMINATION WITH 0.5 ML BLUE DEXTRAN AND THE ELUTIONOF TRYPSIN AND BOVINE SERUM ALBUMIN ON SEPHADEX G-lOO (12/6/65)
EFFLUENTVOLUME(ml)
%TRANSMISSION
OPTICALDENSITY
EFFLUENTVOLUME(ml)
%TRANSMISSION
OPTICALDENSITY
Blue Dextran Trvnsin23.66 100 0.000 41.75 Pooled26.58 38 0.420 44.53 100 0.00029.71 65 0.187 47.57 100 0,00032.46 95 0.022 50.99 100 0.000
54.32 92 0.03657.63 73 0.137
Bovine Serum Albumin 60.91 64 0.19464.66 65 0.18721,33 Pooled 67.59 65 0.18723.48 92 0.03626,54 55 0.260 70.70 59 0.229
74.05 54 0.26829.24 42 0.377 77.52 55 0.26032.48 54 0.26836.04 17 0.770 80.32 57 0.244
83.57 58 0123738.94 7 1.155 87.19 54 0.26841.61 42 0.37744.69 85 0.071 90.41 52 0.284
94.11 52 0.28447.83 96 0.018 97.55 54 0.26850.71 98 0.00953.62 99 0.004 100.37 61 0.215103.22 70 0.15556.51 100 0.000 . 106.22 78 0.10859.26 100 0.000
109.88 81 0.092112.94 89 0.051
. 116.27 89 0.051119.37 94 0.027122.80 95 0.022

120TABLE XL
VOID VOLUME DETERMINATION WITH 0.5 ML OF BLUE DEXTRAN AND THE ELUTIONOF TRYPSIN AND BOVINE SERUM ALBUMIN ON SEPHADEX 0-100 (2/17/66)
EFFLUENTVOLUME(ml)
%TRANSMISSION.
OPTICALDENSITY
EFFLUENT VOLUME - (ml)
%TRANSMISSION
OPTICALDENSITY
Blue Dextran Trvnsin26.97 100 0.000 56.92 100 0.00029.96 66 0.181 60.00 95 0.02232.98 38 0.420 62.96 72 0.14336.02 92 0.036 65.68 56 0.25238.89 99 0.004 68.57 49 0,310
71.68 55 0.260Bovine Serum Albumin
75.22 60 0.22224.69 Pooled 79.31 62 0.20827.61 97 ’ 0.013 82.12 61 0.21530.81 86 0.066 85.05 62 0.208
88.25 65 0.18733.65 54 0.268 91.49 64 0.19436.52 53 0.276 94.50 60 0.22239.46 54 0.268
97.65 56 0.25242.29 19 0.721 100.59 55 0.26046.17 45 0.347 104.78 59 0.22952.31 83 0.076 107.49 67 0.17455.14 84 0,076 111,12 77 0.11458.12 99 0.004 113.97 84 0.07661.09 100 0.000