Hong Kong Library Association Education and Career Forum Mr. Lawrence Tam HKU SPACE August 11, 2007.


Requirements of the tradable real estate index
• Trading – benchmark indices for settlement of property derivatives – Property derivatives – financial derivatives
with a portfolio of properties as underlying.
• Tradable indices – more than an economic indicator
• Four additional requirements besides the basic requirements of accurately and reliably reflect changes in price levels
(1) Objectivity
• Cannot be easily manipulated by "insiders"
• Involves no subjective judgment • Based on actual transactions • Clear and objective rules of sampling
(definition of outliners)

(2) Transparency
• Mechanics of computation is clear openly accessible
• Replicable results – Any third party can reproduce the same set
of results following the computation procedures using the same set of data.

(3) Wide Coverage
• Reflect changes in price level of the entire market or sub-markets – Too small a sample / portfolio –
biased and prone to manipulation

(4) Timeliness
• Index values are published in final form (not provisional, no revision) on a monthly basis
• Tme lag - no more than 3 months.
Modified Repeat Sales Method
• Lack of complete information on property attributes
– Problem of missing variables in the specification
of the hedonic price model
• Centaline-City residential index is hedonic based index – Cover estate type development only – Model specification not revealed to the public


Problems of repeat sales method 1. Lack of data
2. Exact collinearity between time and age
– difficult to estimate the age effect (including the effect of depreciation)
3. Quality not constant (e.g. home improvement)
4. Sample selection bias
5. Index revision

1. Lack of Data • Very liquid and actively traded market • Close to 880,000 repeat sales pairs over a
period of 21 years (1992-2012) – excludes all 1st hand sales from developers (usually in the form of presale) – On average over 40,000 pairs per year.
• Average holding period: appr. 4 years
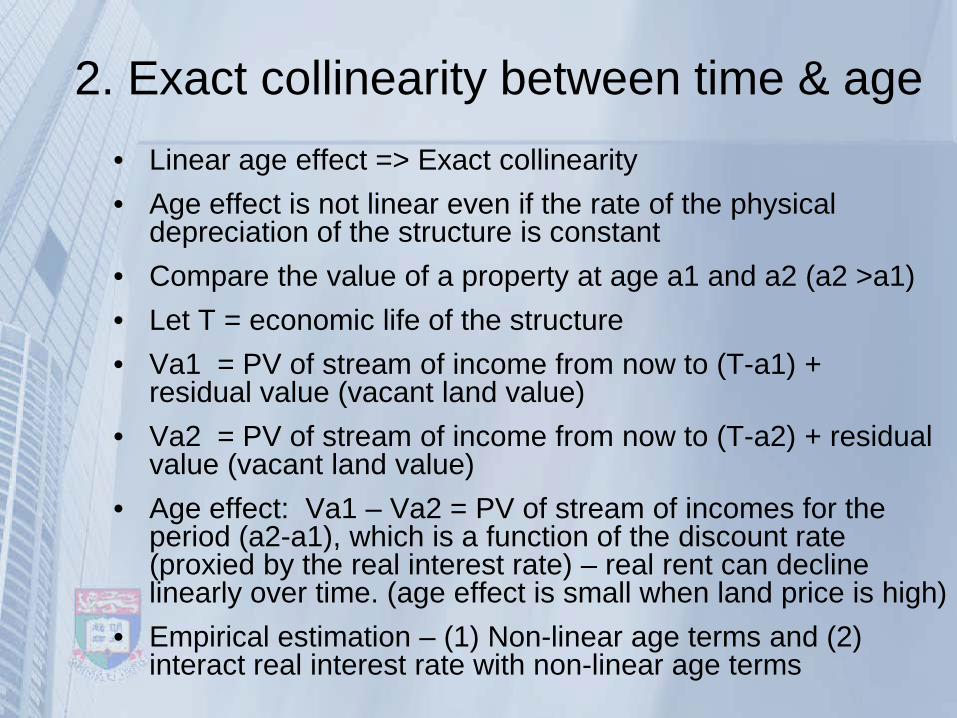
2. Exact collinearity between time & age • Linear age effect => Exact collinearity • Age effect is not linear even if the rate of the physical
depreciation of the structure is constant • Compare the value of a property at age a1 and a2 (a2 >a1) • Let T = economic life of the structure • Va1 = PV of stream of income from now to (T-a1) +
residual value (vacant land value) • Va2 = PV of stream of income from now to (T-a2) + residual
value (vacant land value) • Age effect: Va1 – Va2 = PV of stream of incomes for the
period (a2-a1), which is a function of the discount rate (proxied by the real interest rate) – real rent can decline linearly over time. (age effect is small when land price is high)
• Empirical estimation – (1) Non-linear age terms and (2) interact real interest rate with non-linear age terms
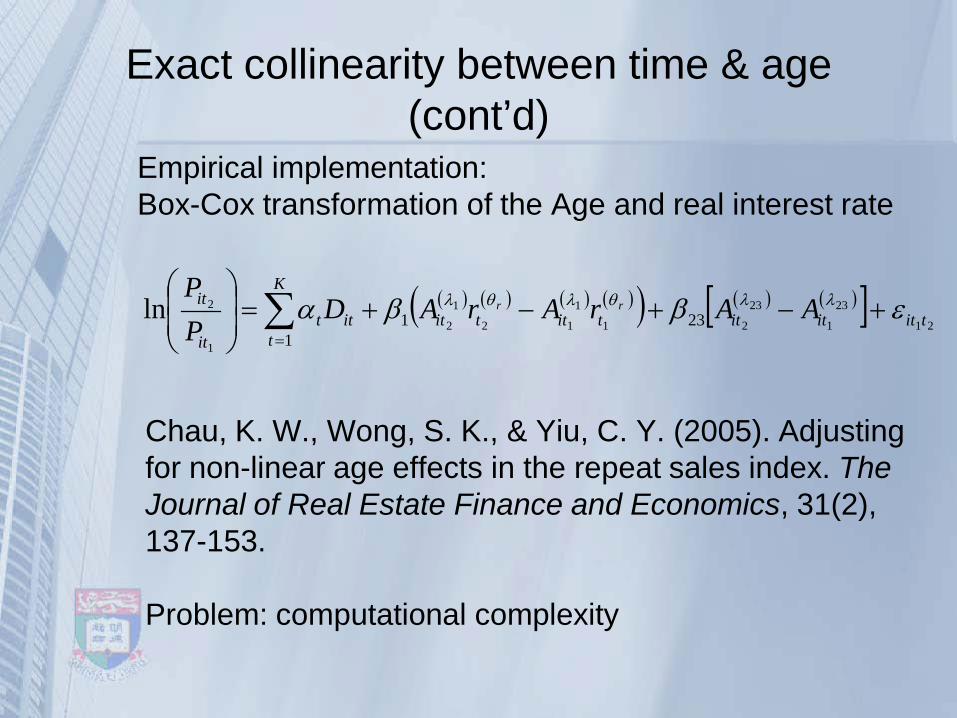
Chau, K. W., Wong, S. K., & Yiu, C. Y. (2005). Adjusting for non-linear age effects in the repeat sales index. The Journal of Real Estate Finance and Economics, 31(2), 137-153. Problem: computational complexity
( ) ( ) ( ) ( )( ) ( ) ( )[ ]21
23
1
23
21
1
12
1
2
1
2231
1ln tititittittit
K
titt
it
it AArArADPP
rr εββα λλθλθλ +−+−+=
∑=
Empirical implementation: Box-Cox transformation of the Age and real interest rate
Exact collinearity between time & age (cont’d)
3. Change in attributes • High land prices
– 60% - 80% of the value of a property attributable to land.
– home improvements / renovation / redecoration (add value to the structure) have relatively little effect housing prices
• significant home improvements are unlikely
to be approved • Units with illegal improvements are difficult
to transact – less likely to be repeat sales pairs
Change in attributes (cont’d) Changes in environmental attributes
– lost of a seaview – Increases accessibility
More likely to occur with long holding period pairs Case and Shiller’s solution: Weight least squares: Down weight the repeat sales pairs with longer holding periods. Case, K.E. and Shiller, R.J. (1987). "Prices of single family homes since 1970: new indexes for four cities", New England Economic Review, Sept/Oct, 45-56.
4. Sample selection bias
A real issue • Short holding period pairs (flips) have
abnormal behavior
• Long holding period pairs – increase in probability of quality change
• Repeat sales pairs behave differently from single sales transactions
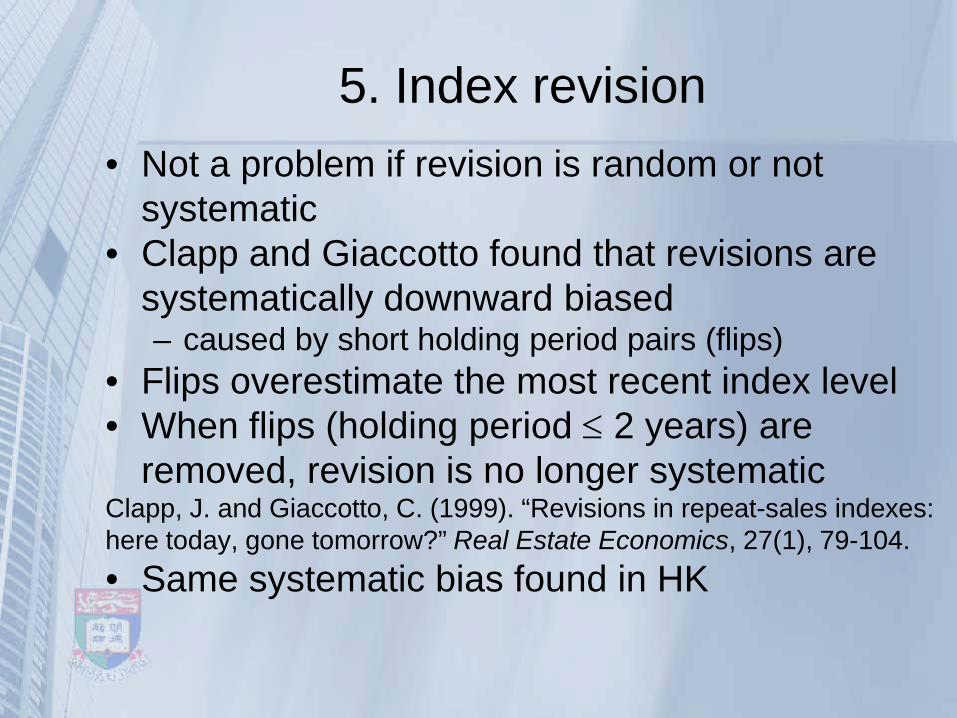
5. Index revision • Not a problem if revision is random or not
systematic • Clapp and Giaccotto found that revisions are
systematically downward biased – caused by short holding period pairs (flips)
• Flips overestimate the most recent index level • When flips (holding period ≤ 2 years) are
removed, revision is no longer systematic Clapp, J. and Giaccotto, C. (1999). “Revisions in repeat-sales indexes: here today, gone tomorrow?” Real Estate Economics, 27(1), 79-104. • Same systematic bias found in HK

t1 t2 t3
Rn,1 RF,1
Rn,2 RF,2
Rn,3 RF,3
Effect of flips on index revision
t
t
t

HKU-REIS (cont’d)
Data cleaning (dealing with outliners) • Data entry error • Non-arms length transactions • Data pairs with large standard error (> d) are
excluded • Included data increase d but remains stable
after d > 1 (< 1% of the entire sample) • Mechanical rule - objectivity • Government (Rating and Valuation Department)
spots these outliners manually and based on professional judgment

HKU-REIS (cont’d)
10 year rolling estimate • Index fixed once published • Automatically excludes pairs with holding
periods ≥ 10 years • Zero weight on long holding period pairs
(12%) • The effect of depreciation
– (1) minimized (average holder period ≤ 4 years) – (2) fixed (will not grow as the time span
increases over time)
HKU-REIS (cont’d)
• Index revision • Revision is not systematic when pairs with
holding period ≤ 4 months are excluded (10% of the sample) – result based on experiment
• The average growth rates of the flips were about 10 times that of the non-flip pairs
• Excluding flips also prevent manipulation of index value by short term transactions

Who are the flippers? Hypothesis: • Informed traders who can spot under priced properties
(high information cost) • These informed traders are experts in valuation but are
not trend predictors and therefore will re-sell the property quickly (function like arbitrager)
• Examples of flippers: estate agents, land assemblers (for redevelopment), foreclosure dealers or their “friends”.
Empirical implications: • Less flippers in areas with properties that are more
homogeneous (e.g. estate type developments) • Increase in transaction cost (e.g. increase stamp duties)
=> less frequent flips but higher average excess return on flips

Property price indices in Hong Kong
• Rating and Valuation Department Indices – All 2nd hand single sales – quality controlled by assessed rent http://www.rvd.gov.hk/en/property_market_statistics/index.html
• Centa-City Index All 2nd hand single sales of estate type development http://www.centadata.com/cci/cci_e.htm
• The University of Hong Kong Real Estate Index Series (HKU-REIS) http://hkureis.versitech.hku.hk/ – Details of index construction method and historical data
(since July 1991) – Updated every month (6 weeks time lag) – Username: kwchau – Password: 846434
0
50
100
150
200
250
300
1991
1992
1993
1994
1995
1996
1997
1998
1999
2000
2001
2002
2003
2004
2005
2006
2007
2008
2009
2010
2011
2012
2013
(Jan
200
0 =1
00)
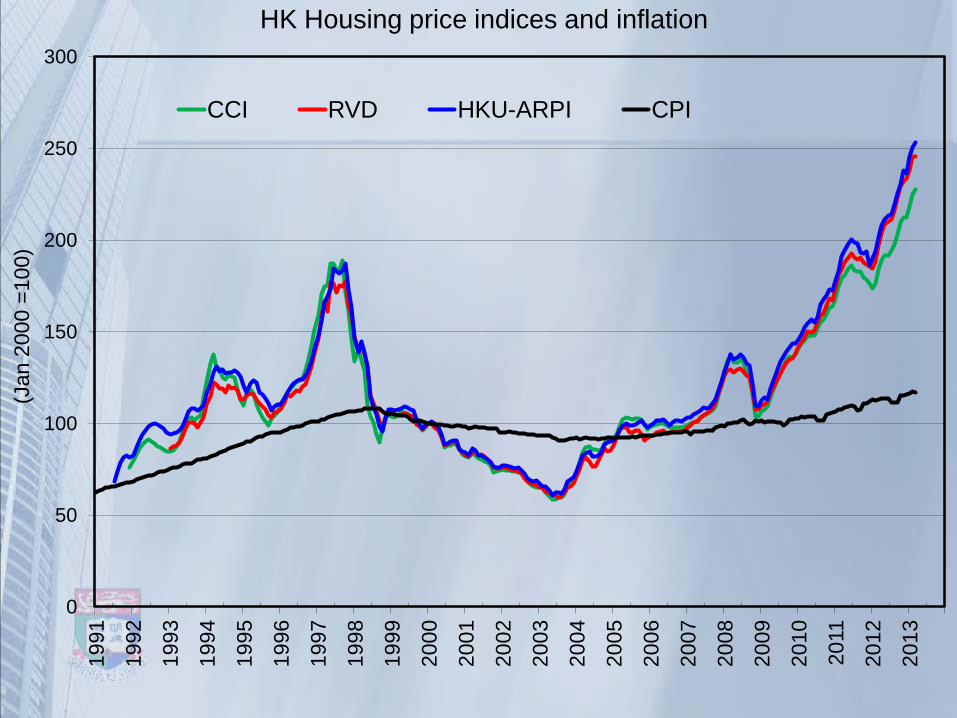
HK Housing price indices and inflation
CCI RVD HKU-ARPI CPI

Thank You Important:
For private circulation only Not to be published in any form