
The University of Birmingham School of Geography, Earth ...Lise Bourdeau-Lepage2 1. Introduction The...
28
The University of Birmingham School of Geography, Earth & Environmental Sciences Working Papers No. 17 ADVANCED SERVICES AND REGIONAL INTEGRATION: THE CASE OF THE CEECs Lise Bourdeau-Lepage Université de Bourgogne LEG-CNRS-MSH BP 26611 21066 Dijon Cedex-France [email protected] June 2005 ISBN: 07044 25173
Transcript of The University of Birmingham School of Geography, Earth ...Lise Bourdeau-Lepage2 1. Introduction The...
The University of Birmingham School of Geography, Earth & Environmental
Sciences
Working Papers
No. 17 ADVANCED SERVICES AND REGIONAL
INTEGRATION: THE CASE OF THE CEECs
Lise Bourdeau-Lepage
Université de Bourgogne LEG-CNRS-MSH
BP 26611 21066 Dijon Cedex-France [email protected]
June 2005
ISBN: 07044 25173

Advanced services and regional integration: the case of the CEECs
Working Papers on Services, Space, Society (WPSSS17)
(i)
Advanced services and regional integration: the case of the
CEECs
Contents Page
1. Introduction 1 2. Differentiated Evolution of Employment Structures 4 2.1 Methodological remarks 5 2.2 A slow catching-up process 6 Table 1: CEEC and EU-6 employment structures as percentages 8 (1995 and 2000) 2.3 A twofold evolution of countries 8
3. A Regional Typology 10 3.1 Marked regional specificities 10 3.2 Four classes of regions 13 Table 2: Characteristics of region-classes in 2000 13
4. Conclusion 16
5. References 19
Appendix 22 Table A1: Region –classes in 2000 22 Table A2: Evolution of employment structures (1995-2000) 23 Table A3: Employment structures in the CEEC regions (1995, 2000) 24 Table A4: CEEC regional location quotients in 2000 (employment structures) 25 Table A5: Euclidean distance of the CEECs and of CEEC regions from EU-6 26 Average structure (1995 and 2000)

Advanced services and regional integration: the case of the CEECs
Working Papers on Services, Space, Society (WPSSS17)
1
Advanced services and regional integration: the case of the CEECs1
by
Lise Bourdeau-Lepage2
1. Introduction
The demise of communism, the ensuing opening up of the Central and Eastern
European Countries (CEECs) and the liberalization of trade triggered the ongoing
process of integration with the European Union and indeed with the world economy.
Integration is a polysemic concept with political, institutional, social, technological and
economic facets. Here, its economic aspects alone are considered. Economic integration
is generally taken to mean decreasing transaction costs or trade costs (Traistaru et al.,
2002). It is understood as trade liberalization (Baldwin, 1995; Traistaru et al., 2002;
Brülhart, 2001), common trade policy, the single market, social and regional
regulations, mutual recognition, harmonization, standardization and competition policy.
Thus, in many studies, the economic integration is analyzed through foreign direct
investments, trade and convergence of GDP per capita (e.g. Altomonte and Resmini,
1999; Landesmann, 1995; Petrakos, 2002; Sapir, 1996). Moreover, research focuses on
change in the location of industries and in their geographic concentration resulting from
the process of integration (Amiti, 1997; Brülhart, 2000; Resmini, 2003; Traistaru et al.,
2002). In this paper, integration is defined as a process by which interactions, especially
complex, high-level interactions, develop among countries, regions and cities. Thus, the
concept of integration is related to the formation of networks. The CEECs will be
successfully integrated into an enlarged Europe if they come to play a significant part in
the post-industrial economy. The existence of intense interactions among EU15 and
1 I would like to thank J.-M. Huriot and the referee for their comments and suggestions. 2 Université de Bourgogne, LEG-CNRS-MSH, BP 26611 21066 Dijon Cedex-France, [email protected]
Advanced services and regional integration: the case of the CEECs
Working Papers on Services, Space, Society (WPSSS17)
2
CEEC is not a sufficient condition for successful integration. The nature of the
interactions is crucial.
In the face of European integration, the evolution of each of the CEECs will be an
original combination of two extreme models.
The first model rests on hierarchy. The CEECs might become EU “peripheral
countries” in the economic sense. This could come about through the relocation of labor
intensive activities of some previous EU members to the CEECs, where labor costs are
lower. Or it could also come from the CEEC choice of trade and production
specializations based on labor intensive and raw material intensive activities resulting
from unfavorable initial conditions (ill-adapted economic structures, unstable political
environment, peripheral geographical position with regard to the EU, low-skilled labor
force, lack of entrepreneurship) and structural rigidities which hinder the adjustments of
these countries to international competitive conditions. In this case, the CEECs would
not become strategic decision-makers. This function would be fulfilled by some EU-15
members. This model would constitute only a partial integration of the CEECs with a
form of hierarchy headed by previous EU members. The trade specialization in low-
value-added activities of the CEECs and especially of the Balkan countries underlined
by Petrakos (2002) and by Radosevic (2002) illustrates this situation.
The second model involves the formation of network interactions among all countries in
an enlarged Europe. The CEECs would engage in advanced economic activity just like
any previous EU states, that is, they would be integrated into the processes of creation,
decision making and control at the European scale. This would imply well-developed
advanced services in the CEECs because it is the level of development of such services
which enables, among other things, a country to participate in the global network. Some
research which concludes that the CEECs are not really integrated into the European
innovation system (e.g. Radosevic, 2002) cast doubts on this scenario.
Advanced services and regional integration: the case of the CEECs
Working Papers on Services, Space, Society (WPSSS17)
3
Accordingly, this paper examines the level of advanced services in the CEECs. These services are of growing strategic importance across the whole range of production
sectors in developed economies (Bailly and Coffey, 1994; Miles and Wyatt, 1991;
Riddle, 1986; Peneder et al.. 2001; Daniels, 1993). Post-industrial production is more
and more intangible, personalized and global. The resulting complexity of economic
interactions increases the need for coordination (Bourdeau-Lepage and Huriot, 2005),
which gives a decisive role to advanced services. Information becomes the main input
of the globalized economy (Castells, 1996). The rise of advanced services is both the
cause and the consequence of globalization, in a cumulative process (Sassen, 2000).
Thanks to advanced services, large cities, and the regions around them, become closely
interconnected within global networks (Sassen 2000; Taylor 2000). The growth of these
services is a major factor of change in regional disparities, as well as of the emergence
of global cities (Bourdeau-Lepage, 2004; Bourdeau-Lepage and Huriot, 2002 and
2005).
Consequently, the successful integration of the CEECs will depend on their involvement
in the post-industrial production system in which advanced services play a leading part
in driving competitiveness and growth. Therefore, the development of advanced
services will be a key factor in the successful integration of the CEECs into an enlarged
EU. It will also enhance the future performances of these countries permitted by
innovation activities. For decades these countries operated with planned economies. The
priority was given to the “material sphere” and services were considered as
unproductive (Andreff, 1993). Industry was predominant; service supply was deficient
and of poor quality. Furthemorer, the contributions from services to GDP and to total
employment were relatively low (Illeris, 1996; Stare, 2002).
With the deregulation of business, economic coordination has taken on a new form.
Coordination is no longer achieved through central planning; the old regulations and
routines are no longer operative and new economic agents have adopted market
practices and business strategies (Bourdeau-Lepage, 2004). Thus, the institutional and

Advanced services and regional integration: the case of the CEECs
Working Papers on Services, Space, Society (WPSSS17)
4
business environment changed and adapted to the market economy. In this context, on
the one hand, some services, in particular, traditional services like transport, provided
by the manufacturing enterprises themselves, were externalized. On the other hand, new
services have emerged (Pietras 2002; Stare, 2005). This has led to a rise in services in
the CEECs, and especially in services related to production (producer services and
finance) concerning the employment and gross value-added structures (Facchini and
Segnana, 2003). This reflects a change in the production structure, the intensity of
which depends on the skill and qualification levels of the labor force. This change will
prepare the success or the failure of CEECs’ integration into the EU.
The aim of this paper is to appraise the potential of CEEC regions for integration into
the EU by examining the most prominent features of their production structures with
special emphasis on the relative importance of advanced services.
The paper is organized as follows: First of all, the main features of employment
structures in the CEECs are stated and compared to those of 6 established European
countries. This evaluation shows that CEEC production potentials fall short of the EU-6
average (section 2). Then, regional production potentials are assessed by calculating
Euclidean distances between the employment structure by sector in each region and the
average employment structure of EU-6 countries (section 3). Large disparities among
the CEECs are observed at regional level. Finally, the analysis reveals that there are
clearly unequal potentials for EU integration explained by three interdependent factors:
the location effect, the historical effect and the metropolitan effect (section 4).
2. Differentiated Evolution of Employment Structures This section aims at characterizing the evolving production structures of the CEECs
relative to the EU average. First, the methodological basis of the analysis is set out
(2.1). Second, the main changes in the CEEC employment structure between 1995 and
Advanced services and regional integration: the case of the CEECs
Working Papers on Services, Space, Society (WPSSS17)
5
2000 are identified and comparisons with the EU-6 employment structure are made
(2.2). Third, differences in country structures are revealed (2.3).
2.1 Methodological remarks
The analysis is based on employment data for 17 NACE branches (European
nomenclature of activities) at NUTS1 level in 1995 and 2000. It covers Bulgaria, the
Czech Republic, Estonia, Hungary, Latvia, Lithuania, Poland, Romania and Slovakia as
well as six established European members: Denmark, France, Greece, Ireland, Italy and
Spain. This data set is provided by the regional data base of Eurostat (REGIO). A more
extended analysis is not possible since the data are deficient at a 17 NACE level for
Slovenia and for the other EU-15 countries. The breakdown of services into 11 branches
is rather limited. The two branches “financial intermediation” and “real estate, renting
and business activities” are not disaggregated. Consequently, they are used as a proxy of
advanced services.
In order to evaluate the potentials for integration, CEEC structures of employment are
compared with a European reference by calculating the Euclidean distances between
employment structures.
An employment structure can be represented by the vector of the shares of the different
branches in total employment. The gaps between employment structures can then be
evaluated from the distance between the corresponding vectors.
Distances between numerical vectors, such as the Tchebychev distance, the Klafszky
distance, the logarithmic distance or the angular distance, have statistical drawbacks,
and in particular entail some loss of information. Furthermore, some of them give
greater weights to the largest differences between vectors (Colorni et al., 2001 for a
summary). Euclidean distance is chosen here because all the gaps between vectors are
treated equally, and also because it is easy to calculate and interpret.

Advanced services and regional integration: the case of the CEECs
Working Papers on Services, Space, Society (WPSSS17)
6
The differences in employment structure between each country, measured by Euclidean
distances, can be used to compare potentials for successful integration into an enlarged
Europe. To facilitate the interpretation, distances are presented on a base of 100. Thus,
this relative Euclidean distance varies from 0 between identical structures to 100
between the most widely differing structures (note in appendix). It must be recalled that
these figures have no absolute meaning because they result from the particular distance
used. But they can be compared with each other and over time. The Euclidean distance
is a simple indicator of dissimilarity but it requires careful interpretation. A large
distance to the EU-6 average may indicate that the country is either lagging behind or
alternatively very far ahead in the conversion process. For the CEECs, the first
possibility is more likely but the second cannot be excluded.
2.2 A slow catching-up process
In the CEECs, from 1995 to 2000, the total number of jobs decreased by 3.8% with the
greatest drops in Estonia, Bulgaria and Romania, where it declined by 9.8%, 9.3% and
9.1% respectively, and the lowest reductions in Poland and Latvia (table A2). The only
exception to this trend was Hungary, with a 5.7% rise in employment, the sign of a
better economic climate than in the other CEECs and of a more advanced adjustment
process. Over this period, in the EU-6, employment increased by 9.3%.
In this context, de-industrialization in the CEECs was noticeable, with 13.7% fewer jobs
in the industry and construction sector. However this sector still accounted for an
average 29.6% of employment in the CEECs compared to 26.5% in the EU-6 in 2000.
Conversely, advanced services expanded with respective employment increases of 9.2%
and 22% in financial intermediation and real estate & business activities over the 1995-
2000 period (table A2). Their expansion was more intensive in the CEECs than in EU-6.
Nevertheless, in the CEECs, these activities occupied about half as many workers on
average as in the EU-6 in 2000 (6.6% versus 12.8%, table 1). Even with the decline of
agricultural employment everywhere except in Romania, agriculture was still dominant

Advanced services and regional integration: the case of the CEECs
Working Papers on Services, Space, Society (WPSSS17)
7
in the CEECs and employed 23.3% of workers in comparison with 5.7% in the EU-6
(table 1).
The CEEC employment structure differed from the EU-6 structure in the weight of
traditional market services and non market services too. These services were less
developed in the CEECs than in EU-6 and accounted for 21% and 19.4% respectively
compared with 25.2% and 29.8% in the EU-6 in 2000. Their growth was more
significant in the EU-6 than in the CEEC between 1995 and 2000 (table A2). Thus, the
catching-up of the CEECs on these activities will probably last.
These tendencies in the CEEC employment structure reflect the implementation of the
market economy after the abandonment of real socialism. Economic transformations
take time, especially because of the need for the labor force to adapt in terms of skill
and qualification. Some countries, such as Estonia, are adapting better than the others.
The CEECs still suffer from the domination of industry and from underdeveloped
services compared with the EU-6. Overall, their employment structure is
following the same trend as the EU-6, that is to say de-industrialization, expansion
of services and decline of agriculture (except for Romania and Bulgaria) but these
changes are not intense enough to allow to the CEECs to catch-up with the EU-6
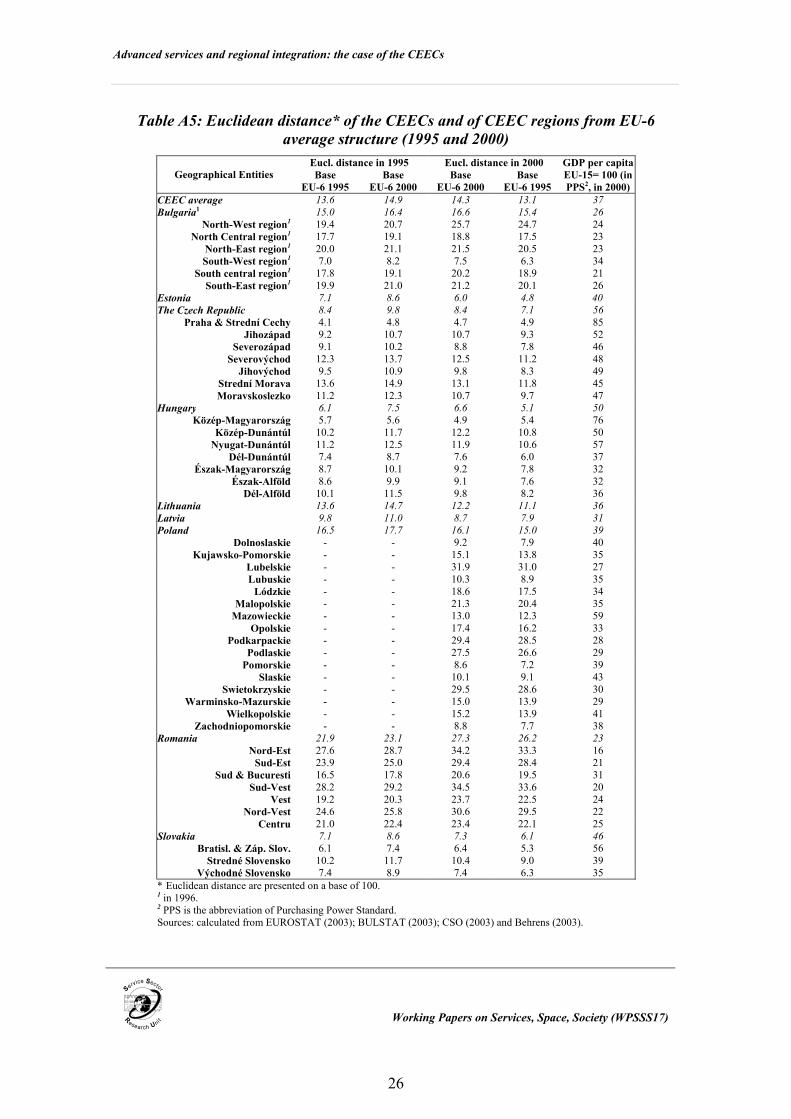
employment structure in the near future. From 1995 to 2000, the Euclidean
distance of employment structure between the CEECs and EU-6 increased from
13.6 to 14.3. This resulted especially from the increasing distance of Bulgaria and
Romania (table A5). These two countries are distinguished by a low level of
transformation compared with the other transition economies perceived from the
analysis of employment structure.
Advanced services and regional integration: the case of the CEECs
Working Papers on Services, Space, Society (WPSSS17)
8
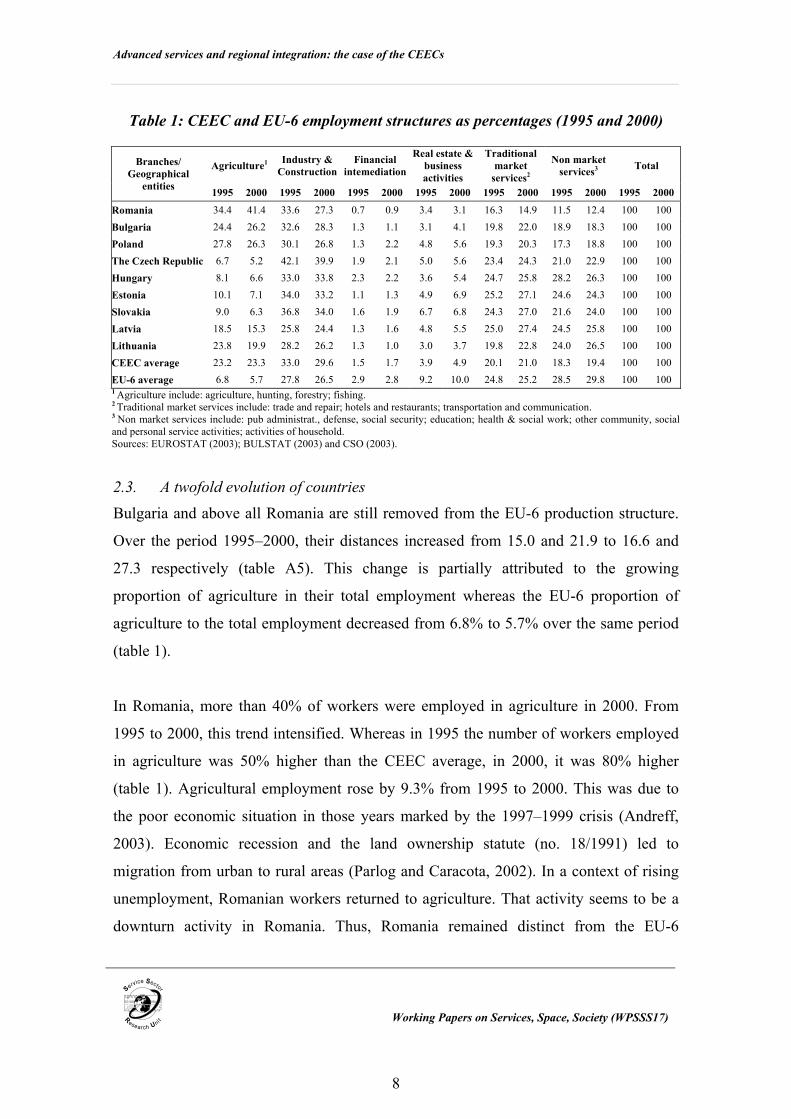
Table 1: CEEC and EU-6 employment structures as percentages (1995 and 2000)
Agriculture1 Industry & Construction
Financial intemediation
Real estate &business activities
Traditional market
services2
Non market services3 Total Branches/
Geographical entities 1995 2000 1995 2000 1995 2000 1995 2000 1995 2000 1995 2000 1995 2000
Romania 34.4 41.4 33.6 27.3 0.7 0.9 3.4 3.1 16.3 14.9 11.5 12.4 100 100 Bulgaria 24.4 26.2 32.6 28.3 1.3 1.1 3.1 4.1 19.8 22.0 18.9 18.3 100 100 Poland 27.8 26.3 30.1 26.8 1.3 2.2 4.8 5.6 19.3 20.3 17.3 18.8 100 100 The Czech Republic 6.7 5.2 42.1 39.9 1.9 2.1 5.0 5.6 23.4 24.3 21.0 22.9 100 100 Hungary 8.1 6.6 33.0 33.8 2.3 2.2 3.6 5.4 24.7 25.8 28.2 26.3 100 100 Estonia 10.1 7.1 34.0 33.2 1.1 1.3 4.9 6.9 25.2 27.1 24.6 24.3 100 100 Slovakia 9.0 6.3 36.8 34.0 1.6 1.9 6.7 6.8 24.3 27.0 21.6 24.0 100 100 Latvia 18.5 15.3 25.8 24.4 1.3 1.6 4.8 5.5 25.0 27.4 24.5 25.8 100 100 Lithuania 23.8 19.9 28.2 26.2 1.3 1.0 3.0 3.7 19.8 22.8 24.0 26.5 100 100 CEEC average 23.2 23.3 33.0 29.6 1.5 1.7 3.9 4.9 20.1 21.0 18.3 19.4 100 100 EU-6 average 6.8 5.7 27.8 26.5 2.9 2.8 9.2 10.0 24.8 25.2 28.5 29.8 100 100 1 Agriculture include: agriculture, hunting, forestry; fishing. 2 Traditional market services include: trade and repair; hotels and restaurants; transportation and communication. 3 Non market services include: pub administrat., defense, social security; education; health & social work; other community, social and personal service activities; activities of household. Sources: EUROSTAT (2003); BULSTAT (2003) and CSO (2003).
2.3. A twofold evolution of countries
Bulgaria and above all Romania are still removed from the EU-6 production structure.
Over the period 1995–2000, their distances increased from 15.0 and 21.9 to 16.6 and
27.3 respectively (table A5). This change is partially attributed to the growing
proportion of agriculture in their total employment whereas the EU-6 proportion of
agriculture to the total employment decreased from 6.8% to 5.7% over the same period
(table 1).
In Romania, more than 40% of workers were employed in agriculture in 2000. From
1995 to 2000, this trend intensified. Whereas in 1995 the number of workers employed
in agriculture was 50% higher than the CEEC average, in 2000, it was 80% higher
(table 1). Agricultural employment rose by 9.3% from 1995 to 2000. This was due to
the poor economic situation in those years marked by the 1997–1999 crisis (Andreff,
2003). Economic recession and the land ownership statute (no. 18/1991) led to
migration from urban to rural areas (Parlog and Caracota, 2002). In a context of rising
unemployment, Romanian workers returned to agriculture. That activity seems to be a
downturn activity in Romania. Thus, Romania remained distinct from the EU-6

Advanced services and regional integration: the case of the CEECs
Working Papers on Services, Space, Society (WPSSS17)
9
production structure in terms of agricultural employment. In Bulgaria, while the
agricultural sector employed about one in four of the workers, there were more jobs in
industry and construction than in agriculture in 2000. These two Balkan countries are
characterized by a weak service sector and by underdeveloped advanced services.
Although the Polish distance was similar to that of Bulgaria in 2000, Poland is in a
better position than both Bulgaria and Romania. Closer analysis of the employment
structures provides some explanations. First, between 1995 and 2000, the Polish
structural gap with the EU-6 narrowed (from 16.5 to 16.1; table A5). Second, advanced
services, and in particular financial intermediation, are more extended in Poland than in
Romania or Bulgaria. Consequently, the Polish gap is more the result of an
overdeveloped agriculture and/or underdeveloped public and traditional market services
than the effect of underdeveloped advanced services (table 1). Thus, Poland’s
specificity is characterized by a well-developed strategic sector compared with other
CEECs, a predominance of agriculture and a proportion of employment in industry and
construction close to that of EU-6.
Given the small Euclidean distance varying from 6 to 12.2 and the characteristics of
their employment structures, other countries were closer to the EU-6 average structure
than Romania and Bulgaria. However, some differences were noticeable.
Thus, in the Czech Republic, Slovakia, Estonia and Hungary, the proportion of
agricultural employment in 2000 was very close to the EU-6 average of 5.7%, with
5.2%, 6.3%, 6.6% and 7.1% respectively while in Lithuania and Latvia this proportion
was 19.9% and 15.3% respectively (table 1). Industry and construction was the
dominant activity of these four countries. It employed more than one-third of workers in
2000. Moreover, financial intermediation, real estates & business activities were more
developed in Slovakia, Estonia, the Czech Republic and Hungary where they accounted
for more than 7.5% of employment. Furthermore, traditional market sector was equally
as well-developed in these four countries as in the EU-6.
Advanced services and regional integration: the case of the CEECs
Working Papers on Services, Space, Society (WPSSS17)
10
The analysis shows a differentiated development of advanced services across the
CEECs and a split between Central and Baltic countries and the two Balkan* countries
in terms of employment structure. Particularly Estonia, Hungary, the Czech Republic
and Slovakia appear to be in a more favorable position than Bulgaria and Romania for
successful integration into the EU.
Indeed, this analysis conducted at the national level reveals the framework in which
regional structures are situated. Within this given framework, regional structures may
differ and be variously endowed in activities which facilitate their integration. The
occurrence of marked economic differences among the CEECs suggests there will be
regional disparities in their potential for integration.
3. A Regional Typology
This section draws attention to similarities and differences in the potentials for
integration of 49 CEEC regions as reflected by their employment structure in 2000. The
same data are used as previously (table A3). The relative size of the main sectors in the
49 regions is evaluated by calculating their location quotients (LQ). For a given sector,
LQ is the ratio of the proportion of that sector in the region’s employment to the average
proportion of that sector in all 49 regions. LQ allows direct comparisons among the
employment structures of the 49 regions. The study is conducted in two stages. First of
all, differences in regional specialization are identified with particular emphasis on
advanced services (3.1). Then, CEEC regions are classified so as to characterize the
overall regional structure of the CEECs (3.2).
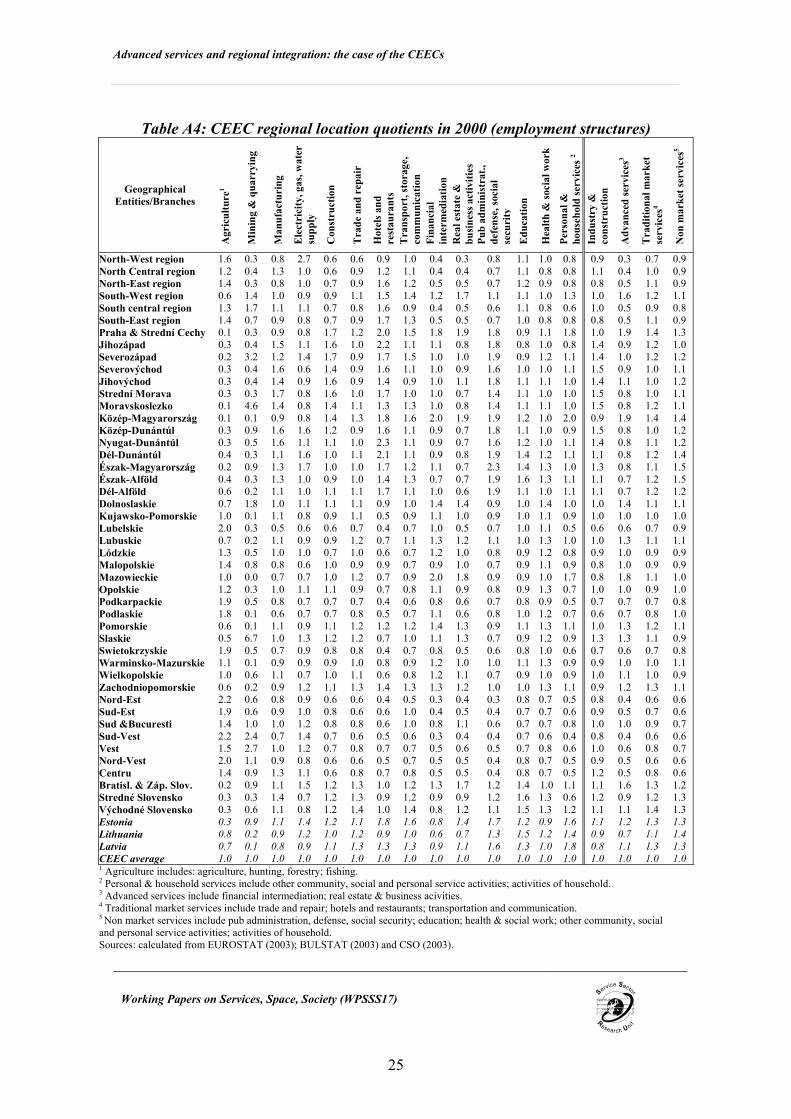
3.1 Marked regional specificities
CEEC regions are distinguished by their level of agricultural activity, the proportion of
which varied in 2000 from 1.7% in Közép-Magyarorsz (Hungary) to 51.2% in the
Romanian Sud-Vest and Nord-Est regions. Thus, there is a dramatic regional
differentiation. In 2000, agriculture accounted for less than 12% of employment in the
Czech, Slovakian and Hungarian regions whereas in the eastern regions of Romania and
Advanced services and regional integration: the case of the CEECs
Working Papers on Services, Space, Society (WPSSS17)
11
Poland more than 26% of jobs were in agriculture (table A3). Overall, Romania, Poland
and Bulgaria display a significant East-West split. In Poland, this is a well-known
pattern, Poland A and Poland B (Bourdeau-Lepage, 2002 and Chi et al., 2003).
Agriculture is over-represented in eastern regions relative to the CEEC regional
average, with the location quotient varying from 2.2 to 1.6 (table A4) in 2000. These
differences in agricultural activity within CEEC regions intensified from 1995 to 2000
(note that Polish regions are excluded owing to the lack of data for 1995). Thus, the
proportion of agriculture in employment grew in all Romanian and Bulgarian regions
while it declined in the Czech, Slovakian and Hungarian regions. Then, because of their
increasing proportion of agricultural activity, the Romanian and Bulgarian regions
become more and more removed from the European pattern. Indeed, their sectoral
adjustment process has increased their future economic vulnerability with regard to the
post-industrial economy. This remark should be completed by observation of changes in
their industrial employment structures and the development of services.
In terms of location quotients, relative specializations in industry and construction are
less marked than in agriculture. In 2000, the Hungarian, Slovakian and Czech regions
(except for the Budapest and Prague regions) and the Slaskie region (Poland), the
Bulgarian North-Central region and the Romanian Centru region were more specialized
in industry and construction than the CEEC regional average, their LQs varying from
1.1 to 1.5 (table A4). As expected, the greatest location quotients in the industry and
construction sector and in agriculture varied in opposing directions. Thus, the eastern
regions and the remaining regions were not specialized in this sector.
Financial intermediation as well as real estate & business activities sectors are highly
discriminating among CEEC regions. Advanced services are principally concentrated in
metropolitan regions (except for the Bucharest region). In these regions, they accounted
for at least 10% of employment in 2000 as compared with an average of 6.6% in CEEC
regions and 2.2% and 2.7% respectively in the Bulgarian North-West region and the
Romanian Sud-Vest region. It appears that the relative specializations of the five capital
Advanced services and regional integration: the case of the CEECs
Working Papers on Services, Space, Society (WPSSS17)
12
regions in advanced services differ. It is more marked in the Warsaw region (LQ: 1.8)
and above all in the Prague and Budapest regions (LQ: 1.9), while the Bratislava and
Sofia regions are less specialized than these three regions (LQ: 1.6). For the Sofia
region, this could stem from the general economic characteristics of Bulgaria, which has
less advanced structures than the other countries (Bourdeau-Lepage, 2004). To a lesser
extent, five Polish regions are also relatively specialized in advanced services. These are
the western border regions and a southern border region (Slaskie). Their share of jobs in
advanced services is from 20% to 60% higher than the average proportion in the 49
CEEC regions (table A4). Poland’s east-west split is again apparent.
The employment structure analysis by region, conducted by using location quotients,
reveals clear relative specialization, especially in activities related to globalization such
as finance and producer services, but also in agricultural activities. CEEC regions in
2000 displayed a simple pattern: an east-west split for agriculture and a center-south
split for advanced services.
In addition, at the regional level, the differences in the Euclidean distances to the EU-6
average ranged from 4.7 to 34.5 in 2000. The Euclidean distance of the Romanian Sud-
Vest region from the EU-6 average was about 7.5 times greater than that of the Prague
region. It should be pointed out that regional data are compared with the EU-6 average,
which masks substantial disparities. Regions follow approximately the same trend as
their respective countries but differences are much more marked. (table A5). Thus, the
Czech, Hungarian and Slovakian regions are close to the EU average, whereas the
Bulgarian and Romanian regions (except the Sofia region) are very far from it. The
Polish regions lie at various distances from the EU average.
These observations may suggest large differences in integration potentials among the 49
CEEC regions. To understand better these complex discrepancies and to identify the
regions with similar employment structures, the 49 CEEC regions were ranked in
ascending order.
Advanced services and regional integration: the case of the CEECs
Working Papers on Services, Space, Society (WPSSS17)
13
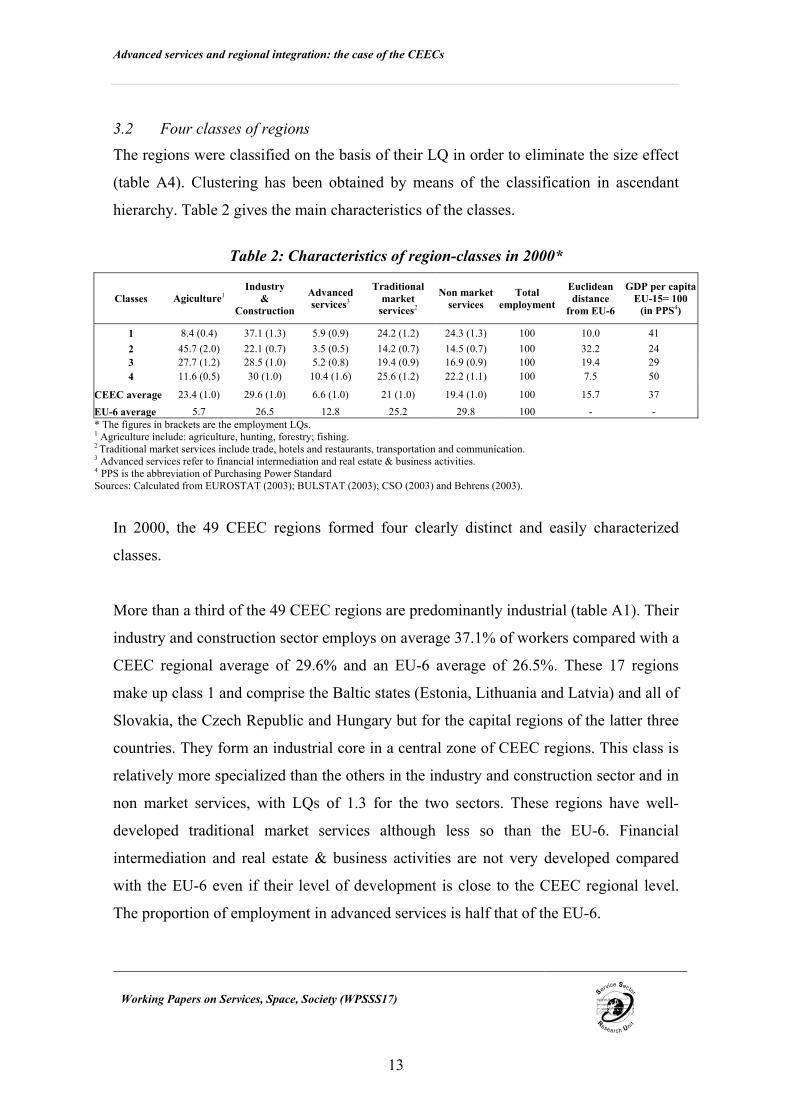
3.2 Four classes of regions
The regions were classified on the basis of their LQ in order to eliminate the size effect
(table A4). Clustering has been obtained by means of the classification in ascendant
hierarchy. Table 2 gives the main characteristics of the classes.
Table 2: Characteristics of region-classes in 2000*
Classes Agiculture1 Industry
& Construction
Advanced services3
Traditional market
services2
Non market services
Total employment
Euclidean distance
from EU-6
GDP per capita EU-15= 100
(in PPS4)
1 8.4 (0.4) 37.1 (1.3) 5.9 (0.9) 24.2 (1.2) 24.3 (1.3) 100 10.0 41 2 45.7 (2.0) 22.1 (0.7) 3.5 (0.5) 14.2 (0.7) 14.5 (0.7) 100 32.2 24 3 27.7 (1.2) 28.5 (1.0) 5.2 (0.8) 19.4 (0.9) 16.9 (0.9) 100 19.4 29 4 11.6 (0.5) 30 (1.0) 10.4 (1.6) 25.6 (1.2) 22.2 (1.1) 100 7.5 50
CEEC average 23.4 (1.0) 29.6 (1.0) 6.6 (1.0) 21 (1.0) 19.4 (1.0) 100 15.7 37 EU-6 average 5.7 26.5 12.8 25.2 29.8 100 - - * The figures in brackets are the employment LQs. 1 Agriculture include: agriculture, hunting, forestry; fishing. 2 Traditional market services include trade, hotels and restaurants, transportation and communication. 3 Advanced services refer to financial intermediation and real estate & business activities. 4 PPS is the abbreviation of Purchasing Power Standard Sources: Calculated from EUROSTAT (2003); BULSTAT (2003); CSO (2003) and Behrens (2003).
In 2000, the 49 CEEC regions formed four clearly distinct and easily characterized
classes.
More than a third of the 49 CEEC regions are predominantly industrial (table A1). Their
industry and construction sector employs on average 37.1% of workers compared with a
CEEC regional average of 29.6% and an EU-6 average of 26.5%. These 17 regions
make up class 1 and comprise the Baltic states (Estonia, Lithuania and Latvia) and all of
Slovakia, the Czech Republic and Hungary but for the capital regions of the latter three
countries. They form an industrial core in a central zone of CEEC regions. This class is
relatively more specialized than the others in the industry and construction sector and in
non market services, with LQs of 1.3 for the two sectors. These regions have well-
developed traditional market services although less so than the EU-6. Financial
intermediation and real estate & business activities are not very developed compared
with the EU-6 even if their level of development is close to the CEEC regional level.
The proportion of employment in advanced services is half that of the EU-6.

Advanced services and regional integration: the case of the CEECs
Working Papers on Services, Space, Society (WPSSS17)
14
In contrast with class 1, class 2 consists of an underdeveloped zone on the eastern
border of the CEEC regions. It is composed of nine regions where on average more than
45% of jobs are in agriculture and where the economic performance as measured by per
capita GDP (on a base of 100 for EU-15 in Purchasing Power Standard) amounted only
to 24% of EU per capita GDP in 2000 (table A1 and table 2). The relevant regions are
located along the eastern fringe of the CEECs. They include the eastern regions of
Poland (Lubelskie, Podlaskie, Podkarpackie, Swietokrzyskie), all the Romanian regions
(except the central, western and Bucharest regions) and the Bulgarian North-West
region. In these agricultural regions (LQ: 2), advanced services are not expanding and
employed a mere 3.5% of workers in 2000. The relative under-representation of
traditional market services and non market services completes the picture of this class
(table 2). The employment structure of class 2 is far from that of EU-6 and indeed from
that of the other classes. Its Euclidean distance from the EU-6 average varied from 25.7
for the Bulgarian North-West region to 34.5 for the Sud-vest Romanian region in 2000.
Consequently, the differences in employment structures are too sizeable for the gap to
be narrowed in the immediate future.
The third class is an intermediate zone between West and East, characterized by a
balance between agriculture and industry and by a weak level of economic performance
(41% of EU per capita GDP). This class includes the six central regions of Poland, three
Romanian regions (the Bucharest, western and central regions) and the easternmost
Bulgarian regions (table A1). The balanced distribution of activities between the
industry and construction sector and the agricultural sector, and the low proportion of
employment in advanced services are the main features of class 3. Thus, the agricultural
sector and the industry and construction sector provide 27.7% and 28.5% of
employment respectively while advanced services account for only 5.2% of
employment. The employment structure of this class is still far removed from the EU-6
structure. The Euclidean distance varied from 15 for the Polish region of Warminsko-
Mazurskie to 23.7 for the Romanian Vest region in 2000, with an average of 19.4. The
Bucharest region deserves a comment. This region is included in class 3 rather than
Advanced services and regional integration: the case of the CEECs
Working Papers on Services, Space, Society (WPSSS17)
15
class 4 because of its agricultural over-representation and the underdevelopment of
advanced services in the vicinity of the Romanian capital.
Finally, urbanized regions, and to a lesser extent the Polish western borders, are
classified as advanced services centers in the CEECs and have the highest economic
performance of CEEC regions. Class 4 is composed of the capital regions (except
Bucharest) and five western regions of Poland (table A1). Its outstanding feature is its
high relative level of advanced services compared with the CEEC regional average.
Class 4 easily ranks first for advanced services sector, which is largely more represented
(LQ: 1.6) than the CEEC average. Advanced services account for more than 10% of
employment, which is close to the EU-6 average. Among the regions in this class,
advanced services are expanding more in the capital regions than in the Polish western
borders. That is hardly surprising. It is well-known that these activities are concentrated
in large cities. It is through advanced services that large cities, and the surrounding
regions, become closely interconnected within global networks. Thus, large cities seem
to take on the same role in Central and Eastern Europe as in Western Europe. This class
has as well-developed traditional market services sector as EU-6. However, the industry
and construction sector is dominant, employing 30% of workers. This characteristic
means this class does not fully match the EU-6 employment structure. Nevertheless, it is
the closest to the EU-6 with an average Euclidean distance of 7.5 (table 2). Within this
class, the Warsaw region lies at the greatest distance from the EU-6 structure. This does
not reflect underdevelopment of the advanced services but is due to the considerable
weight of the agricultural sector in the vicinity of the capital city. Thus, the Polish
capital region is in a better position than implied by the indicator of dissimilarity.
Region class 4 (urbanized class) and region class 1 (industrialized class) appear to be
the classes that are the most advanced in the transition process, based on their Euclidean
distance, the characteristics of their employment structure and their per capita GDP.

Advanced services and regional integration: the case of the CEECs
Working Papers on Services, Space, Society (WPSSS17)
16
4. Conclusion Examining employment structures and economic performances reveals significant
differences between Central and Eastern Europe and Western Europe, as well as serious
disparities between regions in the CEECs. This could lead to critically unequal
potentials for EU integration, especially in terms of global coordination. Consequently,
the overall process of integration will prove more complex than the two models
described in the introduction. CEEC regions differ and will continue to differ in the way
they interact with each other and with the EU regions. Thus, it is very difficult to predict
the future role of these regions in the EU. This role will depend notably on three series
of interdependent factors resulting from the present analysis: the location effect, the
historical effect and the metropolitan effect.
The location effect conveys the handicap of the geographical periphery. Developing
regions of classes 2 and 3 are still a long way short of the European level of economic
performance and employment structure. These regions do not possess well-developed
advanced services compared with the EU-6. Consequently, they do not display the
requisite features to participate in the processes of decision-making, creation and
control. Coordination functions seem to be fulfilled by other regions such as the capital
regions of the CEECs. Thus, the Bulgarian, Romanian and Polish regions and especially
the eastern border regions have little chance of full integration into the EU network of
economic coordination and power. In addition, these regions do not enjoy a favorable
geographical location. They have a peripheral position with respect to the EU and are
located near weakly developed countries like the Ukraine whereas the Western regions
benefit from the proximity of EU (Resmini, 2003). In this context, the Eastern border
regions, might become the “peripheral regions” of the enlarged Europe. This
peripherality refers not only to geography but also takes on an economic meaning as
underlined by Copus (2001). Thus, these regions may well be only partially integrated
into the enlarged Europe. This situation is likely to continue after enlargement if nothing
is done for developing infrastructures and education in the immediate future. Actually,
some commentators, notably Tondl & Vuksic (2003), recommend investing in transport

Advanced services and regional integration: the case of the CEECs
Working Papers on Services, Space, Society (WPSSS17)
17
infrastructures to overcome the location disadvantages of these easternmost regions, but
such a measure may be counter-productive. Indeed, in accordance with agglomeration
economics, it could reinforce the attractiveness of the most developed regions rather
than of the least developed ones. Thus, one can hardly conceive any efficient economic
measure in favour of the latter regions.
Not surprisingly, each region’s past affects its current potential for integration, so that a
historical effect must also be considered. As expected, the Czech, Hungarian, Slovakian
and Western Polish regions are in a more favorable position than regions of classes 2
and 3. In this respect, they form the historical industrial core of Central and Eastern
Europe. In the early 19th century, the Czech Republic and the regions around the
Hungarian cities of Miskolc, Gyor and Pecs were as industrialized as France was
(Bairoch, 1997). Thus, long-term history matters. The past differences in development
between the CEEC regions and countries seem to have affected the transition process of
CEEC regions. In combination with their historical assets, these regions enjoy location
advantages relative to their proximity to the EU, especially in terms of markets and
investments (Tondl and Viskav, 2003). Consequently, the Hungarian, Czech, Slovakian
and Western Polish regions, together with Estonia, Latvia and Lithuania, are the most
advanced in the catching-up process.
Even these geographically and historically advantaged regions are highly differentiated
depending on their level of urbanization.
Among the Central and Western regions, the urbanized regions (class 4) and especially
the capital regions have the employment structures that most resemble that of the EU-6.
Services are more developed and productive, and efficient firms have developed in
these regions. In addition, these regions attract foreign direct investments and are
relatively specialized in advanced services. Agglomeration economies and spatial
spillovers play a significant part in this concentration. These regions benefit from the
advantages in terms of political, social and economic factors enjoyed by the capital
Advanced services and regional integration: the case of the CEECs
Working Papers on Services, Space, Society (WPSSS17)
18
cities, that is to say from the proximity of political power and economic decisions-
makers (Bourdeau-Lepage and Huriot, 2002). These regions have a more diversified
and skilled labor force than the others. Most of the foreign direct investment in their
respective countries is concentrated in these areas. Thus, between 1996 and 2000 the
Polish, Hungarian, Slovakian and Czech capital regions accumulated foreign direct
investment stocks, evaluated as a percentage of GVA (growth of value-added) at twice
the national average (Tondl and Vuksic, 2003). As a whole, their economic performance
in terms of progress in the transition process is better than that of other regions. This is
confirmed by several studies which report that in the regions where capital cities are
located, services are more extensive and growth outperforms other regions (in
particular, Erkut and Özgen, 2003; Resmini 2003; Tondl and Vuksic, 2003 and Jeney,
2003). This kind of regional effect in capital regions may be called the “metropolitan
effect” by reference to the concept of the metropolis. Consequently, the capital regions
will probably fully integrate with the European Union, that is, interact with the other EU
regions and take part in the decision-making processes. These regions may well become
the gateway to the global network for all CEEC regions and the economic core of the
Central and Eastern Europe.
These three effects are mutually reinforcing and generate cumulative processes which
can hardly be halted. A number of other factors which may influence the integration
process have been omitted here because this paper seeks to shed light on production
structures. Accordingly, further analysis will be necessary for a fuller understanding of
the process of integration, in particular the role of foreign direct investments and of
social and regional regulations.

Advanced services and regional integration: the case of the CEECs
Working Papers on Services, Space, Society (WPSSS17)
19
5. References
Altomonte, C. and Resmini, L. (1999) Specialization and (Geographic) Concentration of European Manufacturing, Enterprise DG Working paper 1, Background paper for ‘The competitiveness of European Industry: 1999 Report’, Brussels.
Amiti, M. (1997) Specialisation patterns in Europe, CEP Discussion Paper, 363,
London School of Economics. Andreff, W. (1993) La crise des économies post-socialistes : la rupture d’un système,
Grenoble: Presses Universitaires de Grenoble. Bailly, A. and Coffey, W.J. (1994) Localisation des services à la production et
restructurations économiques, L’espace géographique, 1, 224-230. Bairoch, P. (1997) Victoires et déboires. Histoire économique et sociale du monde du
XVIe siècle à nos jours, Tome I, Paris: Gallimard (folio, histoire). Baldwin, R.E. (1995) The Eastern Enlargement of the European Union, European
Economic Review, 39, 474-481. Behrens, A. (2003) Produit Intérieur Brut régional des pays candidats 2000,
Communauté européennes EUROSTAT, série: Statistiques en bref, Table. 2, www.europa.gov.eu.
Bourdeau-Lepage, L. (2002) Marchés du travail et disparités régionales en Pologne,
Région et Développement, 15, 74-104. Bourdeau-Lepage, L. (2004) Metropolization in Central & Eastern European. Unequal
Chance, GaWC Research Bulletin 141(A), Loughborough University: Global and World Cities Study Group and Network, http://www.lboro.ac.uk/gawc/rb/rb141.html
Bourdeau-Lepage, L. and Huriot, J.-M. (2002) Metropolization in Warsaw. Economic Change and Urban Growth, Canadian Journal of Regional Science, vol. XXV: 3, 423-446.
Bourdeau-Lepage, L. and Huriot, J.-M. (2005) The Metroplis in Retrospect. From the
Trading Metropolis to the Global Metropolis, Louvain Economic Review, Forthcoming.
Brülhart, M. (2000) Evolving Geographical Specialization of European Manufacturing
Industry, Cahier de Recherche Economiques du Département d’Econométrie et d’Economie Appliquée, 00-08.
Advanced services and regional integration: the case of the CEECs
Working Papers on Services, Space, Society (WPSSS17)
20
Bulgarian Central Statistical Office, BULSTAT (2003), Employees by branches, data non-available.
Castells, M. (1996) The Rise of the Network Society, Oxford: Blackwell. Chi, J. Mercier, G. and Samson, I. (2003) Short term and long term assessment of
regional potential and vulnerability in accessing countries, preliminary report, Grenoble.
Colorni, A. Laniado, E. and Muratori, S. (2001) The distance between vectors in
sensitivity and conflict analysis for multicriteria decision making, in Colorni A., M. Paruccini, and Roy, B. Aide multi-critère à la décision, Brussels: European Communities.
Copus, K. A. (2001) From Core-Periphery to Polycentric Development Concepts of Spatial and Aspatial Peripherility, European Planning Studies, vol. 9, 4.
Czech Statistical Office, CSO (2003) Labour Force Survey, data non-available. Daniels, P. W. (1993) Service Industries in the World Economy, Oxford: Blackwell. Erkut, G. and Özgen, C. (2003) The Economic and Spatial Peripherality of Border
Regions in Southeastern Europe, The 43rd European Congress of the Regional Science Association, 27th-30th August 2003, Finland.
EUROSTAT, (2003) REGIO. Economic Accounts. ESA95, Brussels, data non-available. Facchini, G. and Segnana, M. L. (2003) Growth at the EU periphery: the Next
Enlargement, The Quartely Review of Economics and Finance, vol. 43, 5, 827-862. Fujita, M. and Thisse, J.-F. (2002) Economics of Agglomeration. Cities, Industrial
Location and Regional Growth, Cambridge: Cambridge University Press. Illeris, S. (1996), The Service Economy - A Geographical Approach, Wiley. Jeney, L. (2003) The Role of Urban Development in European Regional Inequalities, in:
Jakoli, A. (ed.) Frontiers of Geography, Department of Regional Geography Eotvos Lorand University, Budapest.
Krugman, P. (1996) The Self-Organizing Economy, Cambridge: Blackwell. Ladesmann, M. (1995) The Pattern of East-West European Integration: Catching-up or
Falling Behind? in Dobrinski, R. and Landesmann, M. (Ed.) Transforming Economies and European Integration Aldershot:Edward Elgar, 116-140.
Advanced services and regional integration: the case of the CEECs
Working Papers on Services, Space, Society (WPSSS17)
21
Miles, I. and Wyatt, S. (1991) Technological Change in Services and International Trade Competitiveness, Geneva: UNCTAD.
Parlog, C. and Caracota, D. (2002) Dezechilibre regionale in ocuparea fortei de munca,
A.S.E. Congress, Romania. Peneder, M. Kaniovski, S. and Dachs, B. (2001) External services, Structural Change
and Industrial Performance, Enterprise Papers, 3, European Communities. Petrakos, G. (2002) Peripheral European Transitions: Performance, Structure and Trade
Relations in the Balkan Region, Discussion Paper Series, 8 (1), 1-18. Pietras, J. (2002) Business Services in Transitional Economy of Poland, in E. Kigossy-
Schmidt (Ed.) Business Related Services in Central and Eastern Europe: A Cross-Country Approach, Deutscher Universitats-Verlarg, 131-167.
Radosevic, S. (2002) , Regional Policy, National and Regional Foresight in Central and
East European Candidate Countries, STRATA-ETAN Expert Group Action on ‘Mobilising the Regional Foresight Potential for an Enlarged European Union’, July, Brussels: EC-Research DG-Directorate K.
Resmini, L. (2003) Economic integration, industry location and frontier economies in
transition countries, Economic system, 27, 205-221. Riddle, I. D. (1986) Services-Led Growth: The Role of the Service Sector in World
Development, New-York: Praeger. Sassen, S. (2000) Cities in a World Economy, Thousand Oaks: Pine Forge Press. Sapir, A. (1996) The Effects of Europe’s Internal Market Program on Production and
Trade: A First Assessment, Weltwirtschaftliches Archiv, vol. 132, 3, 457-475. Stare, M. (2005) Service Development in transition Countries: Achievements and
Missing Links, in Bryson, J. and Daniels, P.W. (Ed.) The Handbook of Services Industries, Cheltenham: Edward Elgar, Forthcoming.
Taylor, P.J. (2000) World cities and territorial states under conditions of contemporary globalization, Political Geography, 19, 5-32
Tondl, G. and Vuksic, G. (2003) What makes regions in Eastern Europe catching-up? The role of foreign investment, human resources and geography, IEF Working paper, 51.
Traistaru, I. Nijkamp, P. and Longhi, S. (2002) Regional Specialization and Concentration of Industrial Activity in Accession Countries, ZEI Working Paper, B16.
Advanced services and regional integration: the case of the CEECs
Working Papers on Services, Space, Society (WPSSS17)
22
Appendix
Note: Calculating distances between employment structures
Let us consider a number of spatial units j (j = 1, … J) in the CEECs, and let eu-6 designates Europe of 6. The units set can be defined in terms of regions, groups of regions, or countries. Let j
ie be the share of sector i employment, in the spatial unit j of the CEECs, with
0 100 and 100j ji i
ie e< < =∑ ,
6euie the average share of sector i employment in eu-6, with the same properties.
The Euclidean distance between the employment structure of unit j and the employment structure of eu-6 is given by:
( )26( , 6) j euii
iD j eu e e= −∑
The maximum value of this distance is 141. By dividing D by 1.41, we obtain an indicator that varies between 0 and 100:
( , 6)( , 6)1.41
D j eud j eu = .
Table A1: Region-classes in 2000
Class 1 Class 2 Class 3 Class 4
Jihozápad (cz) North-West region (bg) North Central region (bg) South-West region (bg) Severozápad (cz) Lubelskie (pl) South central region (bg) Zachodniopomorskie (pl) Nyugat-Dunántúl (hu) Podlaskie (pl) Vest (ro) Dolnoslaskie (pl) Moravskoslezko (cz) Podkarpackie (pl) Centru (ro) Lubuskie (pl) Severovýchod (cz) Swietokrzyskie (pl) North-East region (bg) Pomorskie (pl) Strední Morava (cz) Nord-Est (ro) South-East region (bg) Slaskie (pl) Közép-Dunántúl (hu) Sud-Vest (ro) Kujawsko-Pomorskie (pl) Mazowieckie (pl) Jihovýchod (cz) Sud-Est (ro) Wielkopolskie (pl) Praha & Strední Cechy (cz) Dél-Dunántúl (hu) Nord-Vest (ro) Warminsko-Mazurskie (pl) Bratislavský & Západné Slovensko (sk) Észak-Alföld (hu) Lódzkie (pl) Közép-Magyarország (hu) Észak-Magyarország (hu) Opolskie (pl) Dél-Alföld (hu) Malopolskie (pl) Stredné Slovensko (sk) Sud & Bucuresti (ro) Východné Slovensko (sk) Estonia Lithuania Latvia
Advanced services and regional integration: the case of the CEECs
Working Papers on Services, Space, Society (WPSSS17)
23
Table A2: Evolution of employment structures (1995–2000)
1995 2000 Percentage change in employment structures between 1995 and 2000 1995 2000
Branches CEEC average
Bul
gari
a*
Est
onia
The
Cze
ch
Rep
ublic
Hun
gary
Lith
uani
a
Lat
via
Pola
nd
Rom
ania
Slov
akia
EU-6 average
Total 100 100 -3.8 -9.3 -9.8 -4.6 5.7 -3.4 -0.7 -0.7 -9.1 -7.4 9.3 100 100
Agriculture1 23.2 23.4 -3.0 -2.3 -37.0 -26.2 -14.7 -19.1 -17.8 -6.0 9.3 -35.2 -9.0 6.8 5.7 Mining & quarrying 2.0 1.3 -35.6 -37.3 -21.7 -27.4 -43.8 -10.3 -35.5 -33.0 -43.9 -8.5 -27.8 0.3 0.2 Manufacturing 23.1 20.5 -14.6 -21.3 -17.9 -9.7 9.6 -7.3 -13.1 -13.3 -26.3 -16.4 2.0 19.7 18.4 Electricity, gas, water supply 1.9 1.8 -8.5 4.7 -3.9 -23.7 -17.0 -15.4 4.1 -10.3 1.3 0.7 -10.2 0.8 0.7
Construction 6.0 5.9 -4.7 -23.1 14.6 -2.4 22.9 -16.0 15.6 3.7 -26.3 -11.3 12.1 7 7.2 Trade and repair 11.8 12.7 4.0 9.6 -0.9 -0.6 17.7 10.3 18.6 5.8 -10.3 4.9 10.9 14.7 14.9 Hotels and restaurants 1.8 1.9 3.4 11.4 15.7 1.5 14.4 44.3 11.3 8.7 -24.7 -4.0 20.1 4.2 4.6 Transport, storage, communication 6.6 6.3 -7.3 -12.9 -10.9 -2.9 -2.5 5.8 -7.2 -0.7 -24.6 0.6 6.1 5.9 5.7
Financial intemediation 1.5 1.7 9.2 -24.0 11.6 7.7 1.5 -25.2 18.0 21.3 4.2 6.3 5.6 2.9 2.8 Real estate & business activities 3.9 4.9 22.0 18.5 28.2 8.7 56.8 17.7 13.5 50.6 -16.3 -5.8 19.2 9.2 10.0
Pub administrat., defense, social security 3.2 3.9 14.4 25.1 -1.9 14.5 6.4 14.9 11.2 22.5 12.3 5.4 8.1 8.1 8.0
Education 6.4 6.6 -1.3 -14.7 -17.1 -3.3 -5.2 14.2 -3.4 2.7 -3.4 6.9 5.7 6.9 6.6 Health & social work 5.7 5.8 -1.9 -20.9 -20.4 2.6 4.4 7.7 -9.0 -3.1 2.5 4.4 9.2 7.3 7.3 Other community, social and personal service activities
2.9 3.1 4.1 -17.3 1.0 3.1 -12.8 -17.4 31.1 39.2 -18.3 -12.2 59.0 3.2 4.7
Activities of household 0.0 0.0 38.1 - - 150.0 -45.1 - - - - - 15.0 3.0 3.2
Agriculture1 23.2 23.3 -3.0 -2.3 -37.0 -26.2 -14.7 -19.1 -17.8 -6.0 9.3 -35.2 -9.0 6.8 5.7 Industry & construction 33.0 29.6 -13.7 -21.2 -11.9 -9.7 8.3 -10.2 -6.3 -11.6 -26.2 -14.3 3.9 27.9 26.5
Financial intemediation 1.5 1.7 9.2 -24.0 11.6 7.7 1.5 -25.2 18.0 21.3 4.2 6.3 5.6 2.9 2.8 Real estate & business activities 3.9 4.9 22.0 18.5 28.2 8.7 56.8 17.7 13.5 50.6 -16.3 -5.8 19.2 9.2 10.0
Traditional market services2 20.1 21.0 0.2 1.1 -3.1 -1.1 10.1 11.0 8.9 4.1 -16.6 2.9 11.3 24.7 25.2
Non market services3 18.3 19.4 2.2 -12.3 -10.8 4.1 -1.6 6.8 4.4 8.0 -2.4 2.9 14.4 28.4 29.8 Total 100 100 -3.8 -9.3 -9.8 -4.6 5.7 -3.4 -0.7 -0.7 -9.1 -7.4 9.3 100.0 100.0* 1996-2000. 1 Agriculture include: agriculture, hunting, forestry; fishing. 2 Traditional market services include trade and repair; hotels and restaurants; transportation and communication. 3 Non market services include pub administrat., defense, social security; education; health & social work; other community, social and personal service activities; activities of household. Sources: EUROSTAT (2003); BULSTAT (2003) and CSO (2003).
Advanced services and regional integration: the case of the CEECs
Working Papers on Services, Space, Society (WPSSS17)
24
Table A3: Employment structures in the CEEC regions (1995*, 2000)
Agriculture1 Industry & construction
Traditional market
services2
Financial intermediation
Real estate & business activities
Non market services3 Geographical Entities /
Branches Total
1995 2000 1995 2000 1995 2000 1995 2000 1995 2000 1995 2000 EU-6 average 100 6.8 5.7 27.8 26.5 24.8 25.2 2.9 2.8 9.2 10.0 28.5 29.8 North-West region 100 30.6 38.6 31.2 25.2 16.1 15.7 1.0 0.7 1.2 1.5 19.9 18.3 North Central region 100 25.3 27.2 36.1 32.5 18.5 20.4 1.0 0.7 1.5 2.1 17.6 17.1 North-East region 100 31.8 33.3 27.2 23.4 20.1 22.2 1.1 0.8 1.7 2.5 18.0 17.9 South-West region 100 12.6 13.3 33.2 29.1 23.8 26.0 2.1 2.0 7.0 8.5 21.3 21.1 South central region 100 27.4 30.5 35.1 30.5 16.5 19.5 0.9 0.7 1.8 2.3 18.3 16.4 South-East region 100 31.3 32.8 28.9 24.1 20.7 23.3 1.0 0.9 1.6 2.2 16.4 16.7 Praha & Strední Cechy 100 4.0 2.9 33.1 30.6 27.6 29.1 2.7 3.2 8.1 9.6 24.5 24.7 Jihozápad 100 10.3 7.4 41.8 42.1 23.2 24.3 2.0 2.0 3.6 4.1 19.1 20.3 Severozápad 100 5.1 3.9 44.8 41.7 26.1 24.4 1.6 1.6 3.3 4.8 19.1 23.6 Severovýchod 100 7.8 6.1 46.4 43.8 21.8 22.0 1.8 1.8 3.6 4.2 18.6 22.1 Jihovýchod 100 8.7 7.7 42.2 40.9 20.0 20.5 1.5 1.7 6.0 5.4 21.6 23.7 Strední Morava 100 8.4 6.0 46.5 45.3 20.7 21.9 1.6 1.7 2.8 3.5 20.0 21.5 Moravskoslezko 100 4.0 3.3 48.2 44.4 22.1 24.6 1.1 1.8 4.0 3.8 20.4 22.1 Közép-Magyarország 100 2.3 1.7 27.9 28.0 29.3 30.1 3.5 3.4 6.6 9.3 30.3 27.4 Közép-Dunántúl 100 8.3 6.9 42.1 43.9 20.4 21.3 1.8 1.6 2.4 3.5 25.0 22.8 Nyugat-Dunántúl 100 7.7 6.1 42.0 41.8 21.9 23.5 2.0 1.6 2.3 3.7 24.1 23.2 Dél-Dunántúl 100 12.2 10.0 31.3 32.5 24.4 24.9 1.2 1.6 2.1 4.1 28.8 26.8 Észak-Magyarország 100 6.7 5.6 37.6 37.2 21.3 23.0 2.1 2.0 2.8 3.7 29.5 28.5 Észak-Alföld 100 11.0 8.9 30.3 33.3 23.3 24.5 1.6 1.2 2.2 3.5 31.5 28.6 Dél-Alföld 100 17.9 14.9 29.9 31.7 24.1 24.8 1.5 1.7 1.7 2.8 24.8 24.1 Dolnoslaskie 100 - 15.6 - 30.7 - 22.7 - 2.4 - 6.9 - 21.7 Kujawsko-Pomorskie 100 - 24.2 - 29.4 - 20.6 - 2.0 - 4.7 - 19.2 Lubelskie 100 - 47.9 - 16.4 - 14.5 - 1.6 - 2.6 - 16.9 Lubuskie 100 - 17.0 - 29.3 - 23.8 - 2.3 - 6.1 - 21.5 Lódzkie 100 - 29.7 - 27.2 - 18.5 - 2.0 - 4.7 - 17.9 Malopolskie 100 - 33.8 - 23.5 - 18.2 - 1.6 - 5.0 - 17.8 Mazowieckie 100 - 22.4 - 22.6 - 22.4 - 3.5 - 8.8 - 20.3 Opolskie 100 - 27.8 - 28.9 - 17.9 - 1.9 - 4.6 - 18.9 Podkarpackie 100 - 44.8 - 21.9 - 13.9 - 1.3 - 3.1 - 15.0 Podlaskie 100 - 42.1 - 18.3 - 16.1 - 1.9 - 3.0 - 18.6 Pomorskie 100 - 14.3 - 30.2 - 25.0 - 2.5 - 6.5 - 21.7 Slaskie 100 - 12.2 - 38.3 - 22.8 - 1.9 - 6.4 - 18.3 Swietokrzyskie 100 - 44.9 - 20.4 - 15.4 - 1.4 - 2.7 - 15.3 Warminsko-Mazurskie 100 - 24.7 - 26.6 - 20.5 - 2.0 - 4.9 - 21.3 Wielkopolskie 100 - 24.4 - 30.3 - 20.9 - 2.1 - 5.2 - 17.2 Zachodniopomorskie 100 - 15.1 - 27.8 - 27.1 - 2.3 - 5.8 - 21.9 Nord-Est 100 43.0 51.2 29.0 22.5 13.9 11.8 0.6 0.5 2.2 2.2 11.3 11.8 Sud-Est 100 37.5 44.4 30.1 25.3 18.8 15.5 0.7 0.7 2.1 2.4 10.8 11.8 Sud & Bucuresti 100 25.9 32.2 36.9 29.5 17.9 17.8 0.9 1.3 6.0 5.6 12.4 13.6 Sud-Vest 100 43.3 51.2 30.0 23.4 14.2 11.9 0.6 0.6 2.1 2.1 9.7 10.8 Vest 100 30.1 35.9 35.0 30.7 18.7 16.6 0.8 0.8 3.3 2.9 12.2 13.1 Nord-Vest 100 38.3 45.9 31.9 25.6 13.9 13.2 0.8 0.8 3.1 2.3 12.0 12.2 Centru 100 29.1 34.0 40.4 34.3 15.8 16.0 0.7 0.9 2.5 2.3 11.5 12.5 Bratislava & Záp. Slov. 100 8.2 5.8 35.9 33.7 25.5 26.6 1.9 2.2 8.1 8.5 20.4 23.2 Stredné Slovensko 100 9.8 7.3 40.2 36.9 22.6 25.8 1.4 1.6 4.7 4.2 21.4 24.2 Východné Slovensko 100 9.9 6.4 35.1 32.0 23.6 28.9 1.3 1.4 5.8 5.7 24.3 25.6 Estonia 100 10.1 7.1 34.0 33.2 25.2 27.1 1.1 1.3 4.9 6.9 24.6 24.3 Lithuania 100 23.8 19.9 28.2 26.2 19.8 22.8 1.3 1.0 3.0 3.7 24.0 26.3 Latvia 100 18.5 15.3 25.8 24.4 25.0 27.4 1.3 1.6 4.8 5.5 24.5 25.8 CEEC average 100 20.7 23.4 34.6 29.6 20.6 21.0 1.4 1.7 4.0 4.9 18.8 19.4 * 1996 for Bulgarian regions. 1 Agriculture includes: agriculture, hunting, forestry; fishing. 2 Traditional market services include trade and repair; hotels and restaurants; transportation and communication. 3 Non market services include public administration, defense, social security; education; health & social work; other community, social and personal service activities; activities of household. Sources: calculated from EUROSTAT (2003); BULSTAT (2003) and CSO (2003).
Advanced services and regional integration: the case of the CEECs
Working Papers on Services, Space, Society (WPSSS17)
25
Table A4: CEEC regional location quotients in 2000 (employment structures)
Geographical Entities/Branches
Agr
icul
ture
1
Min
ing
& q
uarr
ying
Man
ufac
turi
ng
Ele
ctri
city
, gas
, wat
er
supp
ly
Con
stru
ctio
n
Tra
de a
nd r
epai
r
Hot
els a
nd
rest
aura
nts
Tra
nspo
rt, s
tora
ge,
com
mun
icat
ion
Fina
ncia
l in
term
edia
tion
Rea
l est
ate
&
busi
ness
act
iviti
es
Pub
adm
inis
trat
., de
fens
e, so
cial
se
curi
ty
Edu
catio
n
Hea
lth &
soci
al w
ork
Pers
onal
&
hous
ehol
d se
rvic
es 2
Indu
stry
&
cons
truc
tion
Adv
ance
d se
rvic
es3
Tra
ditio
nal m
arke
t se
rvic
es4
Non
mar
ket s
ervi
ces5
North-West region 1.6 0.3 0.8 2.7 0.6 0.6 0.9 1.0 0.4 0.3 0.8 1.1 1.0 0.8 0.9 0.3 0.7 0.9 North Central region 1.2 0.4 1.3 1.0 0.6 0.9 1.2 1.1 0.4 0.4 0.7 1.1 0.8 0.8 1.1 0.4 1.0 0.9 North-East region 1.4 0.3 0.8 1.0 0.7 0.9 1.6 1.2 0.5 0.5 0.7 1.2 0.9 0.8 0.8 0.5 1.1 0.9 South-West region 0.6 1.4 1.0 0.9 0.9 1.1 1.5 1.4 1.2 1.7 1.1 1.1 1.0 1.3 1.0 1.6 1.2 1.1 South central region 1.3 1.7 1.1 1.1 0.7 0.8 1.6 0.9 0.4 0.5 0.6 1.1 0.8 0.6 1.0 0.5 0.9 0.8 South-East region 1.4 0.7 0.9 0.8 0.7 0.9 1.7 1.3 0.5 0.5 0.7 1.0 0.8 0.8 0.8 0.5 1.1 0.9 Praha & Strední Cechy 0.1 0.3 0.9 0.8 1.7 1.2 2.0 1.5 1.8 1.9 1.8 0.9 1.1 1.8 1.0 1.9 1.4 1.3 Jihozápad 0.3 0.4 1.5 1.1 1.6 1.0 2.2 1.1 1.1 0.8 1.8 0.8 1.0 0.8 1.4 0.9 1.2 1.0 Severozápad 0.2 3.2 1.2 1.4 1.7 0.9 1.7 1.5 1.0 1.0 1.9 0.9 1.2 1.1 1.4 1.0 1.2 1.2 Severovýchod 0.3 0.4 1.6 0.6 1.4 0.9 1.6 1.1 1.0 0.9 1.6 1.0 1.0 1.1 1.5 0.9 1.0 1.1 Jihovýchod 0.3 0.4 1.4 0.9 1.6 0.9 1.4 0.9 1.0 1.1 1.8 1.1 1.1 1.0 1.4 1.1 1.0 1.2 Strední Morava 0.3 0.3 1.7 0.8 1.6 1.0 1.7 1.0 1.0 0.7 1.4 1.1 1.0 1.0 1.5 0.8 1.0 1.1 Moravskoslezko 0.1 4.6 1.4 0.8 1.4 1.1 1.3 1.3 1.0 0.8 1.4 1.1 1.1 1.0 1.5 0.8 1.2 1.1 Közép-Magyarország 0.1 0.1 0.9 0.8 1.4 1.3 1.8 1.6 2.0 1.9 1.9 1.2 1.0 2.0 0.9 1.9 1.4 1.4 Közép-Dunántúl 0.3 0.9 1.6 1.6 1.2 0.9 1.6 1.1 0.9 0.7 1.8 1.1 1.0 0.9 1.5 0.8 1.0 1.2 Nyugat-Dunántúl 0.3 0.5 1.6 1.1 1.1 1.0 2.3 1.1 0.9 0.7 1.6 1.2 1.0 1.1 1.4 0.8 1.1 1.2 Dél-Dunántúl 0.4 0.3 1.1 1.6 1.0 1.1 2.1 1.1 0.9 0.8 1.9 1.4 1.2 1.1 1.1 0.8 1.2 1.4 Észak-Magyarország 0.2 0.9 1.3 1.7 1.0 1.0 1.7 1.2 1.1 0.7 2.3 1.4 1.3 1.0 1.3 0.8 1.1 1.5 Észak-Alföld 0.4 0.3 1.3 1.0 0.9 1.0 1.4 1.3 0.7 0.7 1.9 1.6 1.3 1.1 1.1 0.7 1.2 1.5 Dél-Alföld 0.6 0.2 1.1 1.0 1.1 1.1 1.7 1.1 1.0 0.6 1.9 1.1 1.0 1.1 1.1 0.7 1.2 1.2 Dolnoslaskie 0.7 1.8 1.0 1.1 1.1 1.1 0.9 1.0 1.4 1.4 0.9 1.0 1.4 1.0 1.0 1.4 1.1 1.1 Kujawsko-Pomorskie 1.0 0.1 1.1 0.8 0.9 1.1 0.5 0.9 1.1 1.0 0.9 1.0 1.1 0.9 1.0 1.0 1.0 1.0 Lubelskie 2.0 0.3 0.5 0.6 0.6 0.7 0.4 0.7 1.0 0.5 0.7 1.0 1.1 0.5 0.6 0.6 0.7 0.9 Lubuskie 0.7 0.2 1.1 0.9 0.9 1.2 0.7 1.1 1.3 1.2 1.1 1.0 1.3 1.0 1.0 1.3 1.1 1.1 Lódzkie 1.3 0.5 1.0 1.0 0.7 1.0 0.6 0.7 1.2 1.0 0.8 0.9 1.2 0.8 0.9 1.0 0.9 0.9 Malopolskie 1.4 0.8 0.8 0.6 1.0 0.9 0.9 0.7 0.9 1.0 0.7 0.9 1.1 0.9 0.8 1.0 0.9 0.9 Mazowieckie 1.0 0.0 0.7 0.7 1.0 1.2 0.7 0.9 2.0 1.8 0.9 0.9 1.0 1.7 0.8 1.8 1.1 1.0 Opolskie 1.2 0.3 1.0 1.1 1.1 0.9 0.7 0.8 1.1 0.9 0.8 0.9 1.3 0.7 1.0 1.0 0.9 1.0 Podkarpackie 1.9 0.5 0.8 0.7 0.7 0.7 0.4 0.6 0.8 0.6 0.7 0.8 0.9 0.5 0.7 0.7 0.7 0.8 Podlaskie 1.8 0.1 0.6 0.7 0.7 0.8 0.5 0.7 1.1 0.6 0.8 1.0 1.2 0.7 0.6 0.7 0.8 1.0 Pomorskie 0.6 0.1 1.1 0.9 1.1 1.2 1.2 1.2 1.4 1.3 0.9 1.1 1.3 1.1 1.0 1.3 1.2 1.1 Slaskie 0.5 6.7 1.0 1.3 1.2 1.2 0.7 1.0 1.1 1.3 0.7 0.9 1.2 0.9 1.3 1.3 1.1 0.9 Swietokrzyskie 1.9 0.5 0.7 0.9 0.8 0.8 0.4 0.7 0.8 0.5 0.6 0.8 1.0 0.6 0.7 0.6 0.7 0.8 Warminsko-Mazurskie 1.1 0.1 0.9 0.9 0.9 1.0 0.8 0.9 1.2 1.0 1.0 1.1 1.3 0.9 0.9 1.0 1.0 1.1 Wielkopolskie 1.0 0.6 1.1 0.7 1.0 1.1 0.6 0.8 1.2 1.1 0.7 0.9 1.0 0.9 1.0 1.1 1.0 0.9 Zachodniopomorskie 0.6 0.2 0.9 1.2 1.1 1.3 1.4 1.3 1.3 1.2 1.0 1.0 1.3 1.1 0.9 1.2 1.3 1.1 Nord-Est 2.2 0.6 0.8 0.9 0.6 0.6 0.4 0.5 0.3 0.4 0.3 0.8 0.7 0.5 0.8 0.4 0.6 0.6 Sud-Est 1.9 0.6 0.9 1.0 0.8 0.6 0.6 1.0 0.4 0.5 0.4 0.7 0.7 0.6 0.9 0.5 0.7 0.6 Sud &Bucuresti 1.4 1.0 1.0 1.2 0.8 0.8 0.6 1.0 0.8 1.1 0.6 0.7 0.7 0.8 1.0 1.0 0.9 0.7 Sud-Vest 2.2 2.4 0.7 1.4 0.7 0.6 0.5 0.6 0.3 0.4 0.4 0.7 0.6 0.4 0.8 0.4 0.6 0.6 Vest 1.5 2.7 1.0 1.2 0.7 0.8 0.7 0.7 0.5 0.6 0.5 0.7 0.8 0.6 1.0 0.6 0.8 0.7 Nord-Vest 2.0 1.1 0.9 0.8 0.6 0.6 0.5 0.7 0.5 0.5 0.4 0.8 0.7 0.5 0.9 0.5 0.6 0.6 Centru 1.4 0.9 1.3 1.1 0.6 0.8 0.7 0.8 0.5 0.5 0.4 0.8 0.7 0.5 1.2 0.5 0.8 0.6 Bratisl. & Záp. Slov. 0.2 0.9 1.1 1.5 1.2 1.3 1.0 1.2 1.3 1.7 1.2 1.4 1.0 1.1 1.1 1.6 1.3 1.2 Stredné Slovensko 0.3 0.3 1.4 0.7 1.2 1.3 0.9 1.2 0.9 0.9 1.2 1.6 1.3 0.6 1.2 0.9 1.2 1.3 Východné Slovensko 0.3 0.6 1.1 0.8 1.2 1.4 1.0 1.4 0.8 1.2 1.1 1.5 1.3 1.2 1.1 1.1 1.4 1.3 Estonia 0.3 0.9 1.1 1.4 1.2 1.1 1.8 1.6 0.8 1.4 1.7 1.2 0.9 1.6 1.1 1.2 1.3 1.3 Lithuania 0.8 0.2 0.9 1.2 1.0 1.2 0.9 1.0 0.6 0.7 1.3 1.5 1.2 1.4 0.9 0.7 1.1 1.4 Latvia 0.7 0.1 0.8 0.9 1.1 1.3 1.3 1.3 0.9 1.1 1.6 1.3 1.0 1.8 0.8 1.1 1.3 1.3 CEEC average 1.0 1.0 1.0 1.0 1.0 1.0 1.0 1.0 1.0 1.0 1.0 1.0 1.0 1.0 1.0 1.0 1.0 1.0 1 Agriculture includes: agriculture, hunting, forestry; fishing. 2 Personal & household services include other community, social and personal service activities; activities of household. 3 Advanced services include financial intermediation; real estate & business acivities. 4 Traditional market services include trade and repair; hotels and restaurants; transportation and communication. 5 Non market services include pub administration, defense, social security; education; health & social work; other community, social and personal service activities; activities of household. Sources: calculated from EUROSTAT (2003); BULSTAT (2003) and CSO (2003).
Advanced services and regional integration: the case of the CEECs
Working Papers on Services, Space, Society (WPSSS17)
26
Table A5: Euclidean distance* of the CEECs and of CEEC regions from EU-6 average structure (1995 and 2000)
Eucl. distance in 1995 Eucl. distance in 2000 Geographical Entities Base
EU-6 1995 Base
EU-6 2000 Base
EU-6 2000 Base
EU-6 1995
GDP per capita EU-15= 100 (in PPS2, in 2000)
CEEC average 13.6 14.9 14.3 13.1 37 Bulgaria1 15.0 16.4 16.6 15.4 26
North-West region1 19.4 20.7 25.7 24.7 24 North Central region1 17.7 19.1 18.8 17.5 23
North-East region1 20.0 21.1 21.5 20.5 23 South-West region1 7.0 8.2 7.5 6.3 34
South central region1 17.8 19.1 20.2 18.9 21 South-East region1 19.9 21.0 21.2 20.1 26
Estonia 7.1 8.6 6.0 4.8 40 The Czech Republic 8.4 9.8 8.4 7.1 56
Praha & Strední Cechy 4.1 4.8 4.7 4.9 85 Jihozápad 9.2 10.7 10.7 9.3 52
Severozápad 9.1 10.2 8.8 7.8 46 Severovýchod 12.3 13.7 12.5 11.2 48
Jihovýchod 9.5 10.9 9.8 8.3 49 Strední Morava 13.6 14.9 13.1 11.8 45 Moravskoslezko 11.2 12.3 10.7 9.7 47
Hungary 6.1 7.5 6.6 5.1 50 Közép-Magyarország 5.7 5.6 4.9 5.4 76
Közép-Dunántúl 10.2 11.7 12.2 10.8 50 Nyugat-Dunántúl 11.2 12.5 11.9 10.6 57
Dél-Dunántúl 7.4 8.7 7.6 6.0 37 Észak-Magyarország 8.7 10.1 9.2 7.8 32
Észak-Alföld 8.6 9.9 9.1 7.6 32 Dél-Alföld 10.1 11.5 9.8 8.2 36
Lithuania 13.6 14.7 12.2 11.1 36 Latvia 9.8 11.0 8.7 7.9 31 Poland 16.5 17.7 16.1 15.0 39
Dolnoslaskie - - 9.2 7.9 40 Kujawsko-Pomorskie - - 15.1 13.8 35
Lubelskie - - 31.9 31.0 27 Lubuskie - - 10.3 8.9 35
Lódzkie - - 18.6 17.5 34 Malopolskie - - 21.3 20.4 35
Mazowieckie - - 13.0 12.3 59 Opolskie - - 17.4 16.2 33
Podkarpackie - - 29.4 28.5 28 Podlaskie - - 27.5 26.6 29
Pomorskie - - 8.6 7.2 39 Slaskie - - 10.1 9.1 43
Swietokrzyskie - - 29.5 28.6 30 Warminsko-Mazurskie - - 15.0 13.9 29
Wielkopolskie - - 15.2 13.9 41 Zachodniopomorskie - - 8.8 7.7 38
Romania 21.9 23.1 27.3 26.2 23 Nord-Est 27.6 28.7 34.2 33.3 16
Sud-Est 23.9 25.0 29.4 28.4 21 Sud & Bucuresti 16.5 17.8 20.6 19.5 31
Sud-Vest 28.2 29.2 34.5 33.6 20 Vest 19.2 20.3 23.7 22.5 24
Nord-Vest 24.6 25.8 30.6 29.5 22 Centru 21.0 22.4 23.4 22.1 25
Slovakia 7.1 8.6 7.3 6.1 46 Bratisl. & Záp. Slov. 6.1 7.4 6.4 5.3 56
Stredné Slovensko 10.2 11.7 10.4 9.0 39 Východné Slovensko 7.4 8.9 7.4 6.3 35
* Euclidean distance are presented on a base of 100. 1 in 1996. 2 PPS is the abbreviation of Purchasing Power Standard. Sources: calculated from EUROSTAT (2003); BULSTAT (2003); CSO (2003) and Behrens (2003).