The Uneasy Case for Marijuana as Chemical Impairment Under ... · The Uneasy Case for Marijuana as...
70
2/5/15 4:18 PM 101 The Uneasy Case for Marijuana as Chemical Impairment Under a Science- Based Jurisprudence of Dangerousness Andrea Roth* ABSTRACT As the marijuana legalization movement lurches forward, states face a jurisprudential dilemma in addressing the burgeoning public health issue of “drugged driving.” Zero-tolerance laws targeting driving with any illegal drug in one’s system, justified under a “jurisprudence of prohibition” based on the blameworthiness of the drug itself, are no longer a good fit. Instead, states have attempted to treat marijuana like alcohol, and have imported drunk driving’s “jurisprudence of dangerousness,” by enacting “per se” driving-under-the-influence-of (DUI) marijuana laws redefining DUI as driving with a certain amount of THC, marijuana’s main psychoactive compound, in one’s blood. These laws are legitimate, we are told, because they are analogous to “per se” .08% blood-alcohol concentration (BAC) impairment laws. What lawmakers have forgotten, and what legal scholars have largely neglected, is the buried and colorful history of drunk driving’s jurisprudence of dangerousness, and the scientific * Assistant Professor, UC Berkeley School of Law. I owe a tremendous debt of gratitude to Frank Zimring for his close mentorship on this project, and to David Sklansky for his guidance on a companion project that informed this one. For extensive feedback on that companion project I am also grateful to Eric Biber, Andrew Bradt, Anne Joseph O’Connell, Saira Mohamed, John Paul Reichmuth, Avani Mehta Sood, Rachel Stern, Karen Tani, and Chuck Weisselberg. I also greatly benefited from comments of participants in the Harvard Criminal Justice Roundtable, Berkeley Faculty Workshop, Washington and Lee Faculty Workshop, UC Davis-UC Berkeley Summer Workshop, and SMU Criminal Justice Colloquium. For invaluable insight into DUI alcohol and marijuana I thank Matt Dalton, James Gibbons-Shapiro, Kyle Graham, Dr. Michael Hlastala, Bruce Kapsack, Alex Kreit, CHP Sergeant Jarod Primicerio, and Tamar Todd. For excellent research assistance, I thank Daphne Chen, Anna Christensen, Shanita Farris, Purba Mukerjee, Amanda Rogers, and Kian Tamaddoni.
Transcript of The Uneasy Case for Marijuana as Chemical Impairment Under ... · The Uneasy Case for Marijuana as...

2/5/15 4:18 PM
101
The Uneasy Case for Marijuana as Chemical Impairment Under a Science-Based Jurisprudence of Dangerousness
Andrea Roth*
ABSTRACT
As the marijuana legalization movement lurches forward, states face a jurisprudential dilemma in addressing the burgeoning public health issue of “drugged driving.” Zero-tolerance laws targeting driving with any illegal drug in one’s system, justified under a “jurisprudence of prohibition” based on the blameworthiness of the drug itself, are no longer a good fit. Instead, states have attempted to treat marijuana like alcohol, and have imported drunk driving’s “jurisprudence of dangerousness,” by enacting “per se” driving-under-the-influence-of (DUI) marijuana laws redefining DUI as driving with a certain amount of THC, marijuana’s main psychoactive compound, in one’s blood. These laws are legitimate, we are told, because they are analogous to “per se” .08% blood-alcohol concentration (BAC) impairment laws. What lawmakers have forgotten, and what legal scholars have largely neglected, is the buried and colorful history of drunk driving’s jurisprudence of dangerousness, and the scientific
* Assistant Professor, UC Berkeley School of Law. I owe a tremendous debt of gratitude to
Frank Zimring for his close mentorship on this project, and to David Sklansky for his guidance on a companion project that informed this one. For extensive feedback on that companion project I am also grateful to Eric Biber, Andrew Bradt, Anne Joseph O’Connell, Saira Mohamed, John Paul Reichmuth, Avani Mehta Sood, Rachel Stern, Karen Tani, and Chuck Weisselberg. I also greatly benefited from comments of participants in the Harvard Criminal Justice Roundtable, Berkeley Faculty Workshop, Washington and Lee Faculty Workshop, UC Davis-UC Berkeley Summer Workshop, and SMU Criminal Justice Colloquium. For invaluable insight into DUI alcohol and marijuana I thank Matt Dalton, James Gibbons-Shapiro, Kyle Graham, Dr. Michael Hlastala, Bruce Kapsack, Alex Kreit, CHP Sergeant Jarod Primicerio, and Tamar Todd. For excellent research assistance, I thank Daphne Chen, Anna Christensen, Shanita Farris, Purba Mukerjee, Amanda Rogers, and Kian Tamaddoni.

2/5/15 4:18 PM
102 CALIFORNIA LAW REVIEW [Vol. XX:nnn
framework established by the country’s first “traffic czar,” William Haddon Jr., for proving the link between specific BACs and crash risk. Under this framework – which focuses first and foremost on fatal single-car crashes and case-control studies with a randomly selected control group – the illegitimacy of the new wave of DUI marijuana laws is painfully obvious. In fact, the few single-car crash and case-control studies that have been conducted have found no relationship between THC blood levels and increased relative risk of crash. Properly understood, the history of drunk driving offers what is still the only valid scientific framework for using the criminal law as an instrument of public safety.
Abstract ........................................................................................................... 101 Introduction ..................................................................................................... 103 I. DUI Alcohol’s Established Framework for a Science-Based
Jurisprudence of Dangerousness .......................................................... 106 A. The Road to .08% Through Machines and Studies on Crash
Risk .............................................................................................. 106 1. The New Crime of DUI and the Need for an “Impairment”
Machine .................................................................................. 107 2. Early Attempts to Equate BAC with Dangerousness ............. 114 3. Haddon’s Science-Based Agenda for Using BACs to
Target Dangerous Driving ..................................................... 121 4. The Punitive Turn in the 1980s and the Final Push Toward
.08% ....................................................................................... 127 B. Haddon’s Legacy: A Compulsory Scientific Framework for
Proving Criminally Dangerous Impairment ................................. 130 II. Punishment Without Purpose: The Illegitimacy of Criminal Per Se DUI
Marijuana Laws ................................................................................... 138 B. The Rise of Drugged Driving Laws and Recognition of the
Arbitrariness of Per Se Limits ...................................................... 138 1. The Rise of Drugged Driving Laws ....................................... 138 2. Marijuana’s Profound Differences from Alcohol in Terms
of Ability to Identify Proximity of Use, Psychoactive Influence, and Impairment from Specific Blood Levels ........ 140
A. The Prohibitionist Approach: Zero-Tolerance DUI Illicit Drug Laws ............................................................................................. 144
B. The Illegitimacy of Per Se THC Thresholds ................................ 147 1. Legalization and the Rise of Per Se Marijuana Laws:
Political Compromise Without a Penal Purpose .................... 147 2. The Scientific Invalidity of Per Se DUI Marijuana Limits
Under Haddon’s Established Framework .............................. 151 a. Single-car fatal crashes ................................................... 151

2/5/15 4:18 PM
201x] DESKTOP PUBLISHING EXAMPLE 103
b. Case-control studies comparing THC levels of drivers in crashes to randomly stopped drivers under identical conditions. ....................................................................... 155
c. Simulated and on-road concentration-specific driver impairment studies. ......................................................... 162
III. The Road Ahead: Crafting Legitimate Drugged Driving Laws Under a Science-Based Jurisprudence of Dangerousness ................................. 165
Conclusion ....................................................................................................... 168
INTRODUCTION
If you can’t measure it, measure it anyway. - University of Chicago economist Frank Knight
- In 1931, Prohibition was on its last legs, Henry Ford’s assembly lines had
churned out over ten million Model Ts and were on to the Model A, and the new federal system of numbered highways was five years old.1 The specter of “drunk driving” had begun to invade the nation’s psyche, and law enforcement and health officials scrambled to address the issue by urging states to criminalize “driving under the influence” of, or driving “while impaired” by (DUI), alcohol, which jurors were told meant driving unsafely as a result of alcohol. But jurors did not always believe uncorroborated police testimony about a suspect’s drunkenness. Moreover, the medical community was concerned that much of the dangerous impairment causing fatal crashes did not manifest in obvious drunkenness, and might not even be capable of detection through means other than difficult-to-perform blood tests.2 The criminal law, as an instrument of protecting the nation from a burgeoning public health crisis, was failing.
Help would arrive in the form of the “Drunk-O-Meter,” a balloon-like device that could measure a motorist’s blood-alcohol concentration (BAC) simply by capturing his breath. On New Year’s Eve 1938, on the streets of Indianapolis, the Drunk-O-Meter made its public debut, and the jurisprudence of dangerousness undergirding drunk driving laws entered the scientific age. Not only could the Drunk-O-Meter offer corroboration of police testimony of DUI, it allowed researchers to explore the relationship between particular BACs and a driver’s level of impairment, through experiments and study of crashes. And it could do so, it turned out, because of the uniquely predictable and uniform properties of ethyl alcohol, allowing scientists to easily infer proximity of use, precise level of alcohol intoxication in the brain, and level of
1. See generally DAN MCNICHOL, THE ROADS THAT BUILT AMERICA: THE INCREDIBLE
STORY OF THE U.S. INTERSTATE SYSTEM (2006) (discussing the increase in number of motor vehicles sold and development of the interstate highway system).
2. See discussion infra at I.

2/5/15 4:18 PM
104 CALIFORNIA LAW REVIEW [Vol. XX:nnn
driver impairment from BAC. Still, this initial wave of experimentation was lacking in the scientific rigor typical of epidemiological research of public health problems.
Luckily for drunk driving jurisprudence, the country’s first “traffic czar” in the late 1960s, the bow-tied “workaholic government bureaucrat” William Haddon Jr.,3 was an epidemiologist. Haddon transformed the science of alcohol and traffic safety by explaining the need to test BACs of drivers in single-car fatal crashes, to conduct case-control studies comparing BACs of fatal crash victims with those of randomly stopped drivers in similar circumstances, and to conduct realistic on-road and simulated BAC-specific driver impairment studies. Bathed in the scientific ethos Haddon established, researchers conducted meticulous studies with thousands of motorists showing precise increased relative crash risks at precise BACs. These studies revealed a precipitous rise in crash risk at .10% and .15% BAC, and a lesser but still troubling increased relative crash risk at .08%.4 At the prodding of federal officials, states would eventually adopt these BACs as presumptive proof of impairment, and later – after DUI enforcement took a punitive, law-and-order turn in the 1980s – would redefine the very crime of DUI in terms of BAC.
The history of drunk driving’s science-based “jurisprudence of dangerousness” should be compulsory reading for today’s policymakers because it created a valid agenda – indeed, the only valid agenda we have – for using science to define criminally dangerous chemical “impairment.” It is true that DUI laws have occasionally veered close to a “jurisprudence of prohibition” – banning driving while drunk because drunkenness itself is morally blameworthy – in the form of “zero-tolerance” laws for minors and calls to lower the limit even further to .05%. Even so, the legitimacy of these special (and not uncontroversial) laws has always turned on the strength of either their prohibitionist logic or their link to increased relative accident risk, as judged through Haddon’s established framework.
Unfortunately, Haddon’s lessons appear to be lost on policymakers facing the next perceived public health crisis being addressed through the criminal law: drugged driving. As the marijuana legalization movement lurches forward, states have faced a jurisprudential dilemma. Before legalization, a number of states had passed “zero-tolerance” laws banning driving with any amount of any illicit drug in one’s system, justified under a jurisprudence of prohibition; because any use of the drug is morally blameworthy, any use while driving can legitimately be criminalized. But in those states that have wholly or partially legalized marijuana, prohibition is no longer a good fit as a theory of punishment. Voters have instead chosen to treat marijuana, in essence, like alcohol.
In line with legalization advocates’ own analogies to alcohol, law enforcement and policymakers in several states have reasoned that the way to criminalize DUI marijuana in an age of legalization is simply to import the DUI
3. BARRON H. LERNER, ONE FOR THE ROAD: DRUNK DRIVING SINCE 1900 38 (2011).
4 See infra at 144.
2/5/15 4:18 PM
201x] DESKTOP PUBLISHING EXAMPLE 105
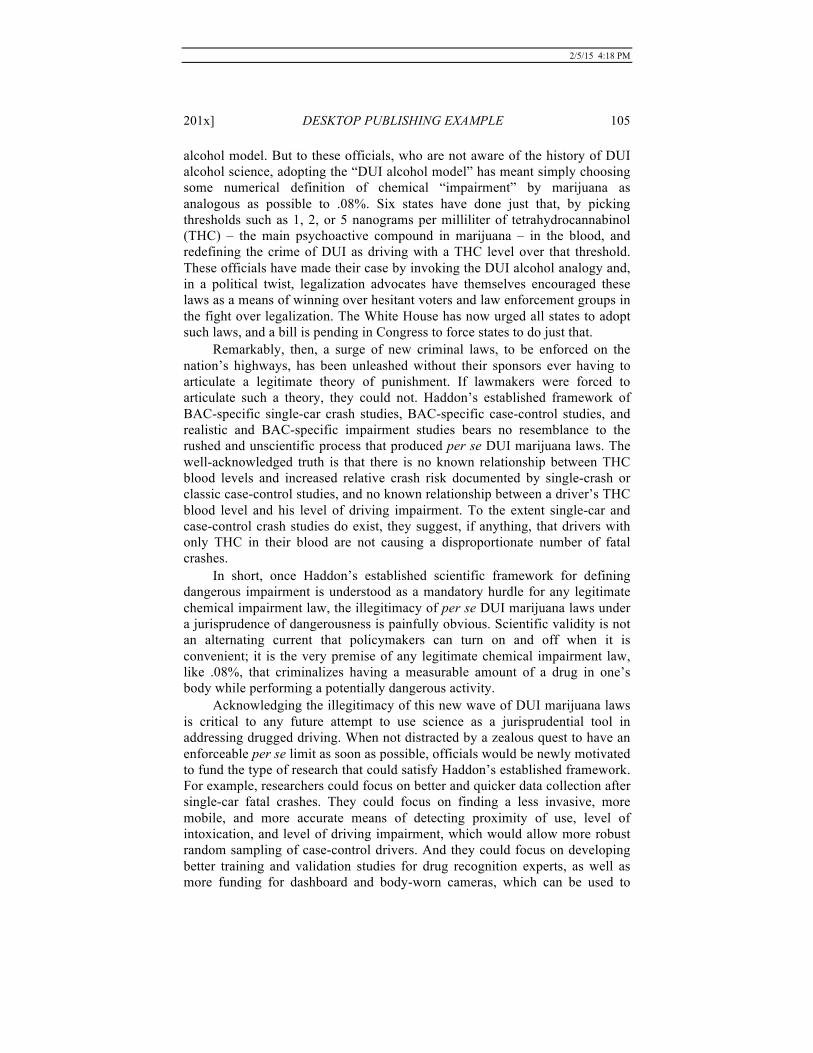
alcohol model. But to these officials, who are not aware of the history of DUI alcohol science, adopting the “DUI alcohol model” has meant simply choosing some numerical definition of chemical “impairment” by marijuana as analogous as possible to .08%. Six states have done just that, by picking thresholds such as 1, 2, or 5 nanograms per milliliter of tetrahydrocannabinol (THC) – the main psychoactive compound in marijuana – in the blood, and redefining the crime of DUI as driving with a THC level over that threshold. These officials have made their case by invoking the DUI alcohol analogy and, in a political twist, legalization advocates have themselves encouraged these laws as a means of winning over hesitant voters and law enforcement groups in the fight over legalization. The White House has now urged all states to adopt such laws, and a bill is pending in Congress to force states to do just that.
Remarkably, then, a surge of new criminal laws, to be enforced on the nation’s highways, has been unleashed without their sponsors ever having to articulate a legitimate theory of punishment. If lawmakers were forced to articulate such a theory, they could not. Haddon’s established framework of BAC-specific single-car crash studies, BAC-specific case-control studies, and realistic and BAC-specific impairment studies bears no resemblance to the rushed and unscientific process that produced per se DUI marijuana laws. The well-acknowledged truth is that there is no known relationship between THC blood levels and increased relative crash risk documented by single-crash or classic case-control studies, and no known relationship between a driver’s THC blood level and his level of driving impairment. To the extent single-car and case-control crash studies do exist, they suggest, if anything, that drivers with only THC in their blood are not causing a disproportionate number of fatal crashes.
In short, once Haddon’s established scientific framework for defining dangerous impairment is understood as a mandatory hurdle for any legitimate chemical impairment law, the illegitimacy of per se DUI marijuana laws under a jurisprudence of dangerousness is painfully obvious. Scientific validity is not an alternating current that policymakers can turn on and off when it is convenient; it is the very premise of any legitimate chemical impairment law, like .08%, that criminalizes having a measurable amount of a drug in one’s body while performing a potentially dangerous activity.
Acknowledging the illegitimacy of this new wave of DUI marijuana laws is critical to any future attempt to use science as a jurisprudential tool in addressing drugged driving. When not distracted by a zealous quest to have an enforceable per se limit as soon as possible, officials would be newly motivated to fund the type of research that could satisfy Haddon’s established framework. For example, researchers could focus on better and quicker data collection after single-car fatal crashes. They could focus on finding a less invasive, more mobile, and more accurate means of detecting proximity of use, level of intoxication, and level of driving impairment, which would allow more robust random sampling of case-control drivers. And they could focus on developing better training and validation studies for drug recognition experts, as well as more funding for dashboard and body-worn cameras, which can be used to

2/5/15 4:18 PM
106 CALIFORNIA LAW REVIEW [Vol. XX:nnn
corroborate and study physical manifestations of chemical impairment. Alternatively, they would be newly motivated to consider and develop a regime of swift but certain non-penal, regulatory consequence that might end up being more effective than criminal DUI drug enforcement.
Part I of this Article dusts off the buried and colorful history of the evolution of American drunk driving laws, explaining the road to .08%, the choice DUI lawmakers have faced between a “jurisprudence of prohibition” and a “jurisprudence of dangerousness,” and the establishment of Haddon’s scientific framework for defining dangerous chemical impairment. Part II explores the history of drugged driving laws, the prohibitionist approach of zero-tolerance drugged driving laws, and the political compromise resulting in per se THC laws to combat DUI marijuana, and explains why these per se laws are illegitimate under a science-based jurisprudence of dangerousness. Part III briefly describes a suggested course for future drugged driving research and jurisprudence. I conclude with parting thoughts on the lessons of the DUI story for criminal justice in the scientific age, as a case study revealing technology’s potentially distorting effects on criminal jurisprudence.
I. ESTABLISHING THE FRAMEWORK FOR A SCIENCE-BASED JURISPRUDENCE
OF DANGEROUSNESS: THE STORY OF DUI ALCOHOL
A. The Road to .08%: Breath Machines and the Study of Crash Risk While drunk driving is often overlooked in legal academia5 as a small,
quirky, gritty corner of the law involving only socially privileged defendants, this description is not entirely true and, even where true, only makes the field more in need of study. In fact, DUI is one of the most frequently committed crimes in the country,6 involves “some of the most complex [cases] in the criminal justice system,”7 and is the training grounds for America’s public criminal trial lawyers.8 It is also a public health issue of tremendous social
5. To be sure, sociologists, criminologists, and historians have published social and cultural
histories of DUI, which have discussed the science and penal theories underlying drunk driving laws and their effectiveness as a tool of social control. See, e.g., LERNER, supra note 3; JAMES B. JACOBS, DRUNK DRIVING: AN AMERICAN DILEMMA (1989); H. LAURENCE ROSS, CONFRONTING DRUNK DRIVING: SOCIAL POLICY FOR SAVING LIVES (1992); SOCIAL CONTROL OF THE DRINKING DRIVER (1998, Michael D. Laurence, John R. Snortum, & Franklin E. Zimring, eds.) [hereinafter LAURENCE ET AL. 1988]. 6 See Federal Bureau of Investigation, Uniform Crime Report, Crime in the United States, 2012, at 1, available at http://www.fbi.gov/about-us/cjis/ucr/crime-in-the-u.s/2012/crime-in-the-u.s.-2012/persons-arrested/arrestmain.pdf.
7. National Traffic Law Center, Challenges and Defenses II: Claims and Responses to Common Challenges and Defenses in Driving While Impaired Cases, at v. 8 Numerous prosecutors and public defenders to whom I have spoken were trained primarily on DUI cases. The large number of DUI-specific manuals for prosecutors also evinces the profession’s recognition that such cases are both ubiquitous and entrusted to new lawyers. See,

2/5/15 4:18 PM
201x] DESKTOP PUBLISHING EXAMPLE 107
import: according to federal officials, alcohol-related crashes cost the United States more than $37 billion annually, and in 2010 alone, more than 10,000 people on American roads – one every 51 minutes – died in such crashes.9 Over the history of the nation, this carnage has “exceed[ed] the death toll of all our wars.”10
Frank Zimring has suggested that “the student of legal policy can examine drunk driving as an example of exceptionally fast change in the criminal law.”11 Compared with the arc of homicide law, the century-long arc of DUI law is quite short. The DUI story therefore offers the luxury of a documented account of how legal models can change in response to our perceived need to, and perceived ability to, measure things that may be relevant to determining criminality. It is in many ways a success story, but both its bright and dark moments offer critical lessons that explain why the nation’s most recent attempt to invoke criminal law to insure public safety, through per se DUI marijuana laws, has no legitimate penal purpose to anchor it.
1. The New Crime of DUI and the Need for an “Impairment” Machine People have been drinking and driving in this country since the invention
of the automobile, and various states have prohibited DUI by statute or common law since at least the beginning of the twentieth century.12 But there is nothing inevitable about using the criminal law as the primary means of addressing drunk driving; indeed, “there is . . . an awkward fit between drunk driving and criminal law.”13 DUI is unique in that it is an inchoate traffic offense. Unlike traffic laws that prohibit running a red light or crossing the center line, DUI criminalizes a physiological condition that might cause one to engage in these risky behaviors. While other conditions potentially causing traffic harm – such as sleepy, distracted, or angry driving – are targeted by aggressive public education campaigns, states generally do not criminally punish them.
The traditional justification for invoking the criminal law against drinking drivers, even before they have run a red light or caused a crash, has been that their driving is “more dangerous, by an order of magnitude, than other forms of
e.g., National District Attorney’s Association, National Traffic Law Center, available at http://www.ndaa.org/ntlc_home.html. 9 See National Highway Traffic Safety Administration, Impaired Driving, at http://www.nhtsa.gov/Impaired.
10. Perez v. Campbell, 402 U.S. 637, 657 (1971) (Blackmun, J., concurring in part and dissenting in part).
11. Franklin E. Zimring, Foreword, JACOBS, supra note 5, at x. 12. 1968 ALCOHOL AND HIGHWAY SAFETY REPORT, COMM. ON PUB WORKS, 90TH CONG.
2D. SESS. 100 (1968) [hereinafter 1968 REPORT]; JACOBS, supra note 5, at 57. Pennsylvania, for example, passed its first “driving while intoxicated” statute – without defining “intoxicated” – in 1909. See Robert J. Schefter, Under the Influence of Alcohol Three Hours After Driving: The Constitutionality of the (a)(5) Amendment to Pennsylvania’s DUI Statute, 100 DICK. L. REV. 441, 444 (1996). Drunken driving was not an offense at common law unless it was a “nuisance.” 1968 Report at 100 n.1, 139 . See generally LERNER, supra note 3.
13. JACOBS, supra note 5, at 63.

2/5/15 4:18 PM
108 CALIFORNIA LAW REVIEW [Vol. XX:nnn
impaired driving.”14 The drunk driver, it is said, is no less than a “ticking bomb” who is punished for “creating a significant risk of injury or death to fellow road users.”15 The statutory phrases “intoxication,” “impairment,” and being “under the influence” are not medical terms,16 but rather legal terms, intended to capture the blameworthy level of alcohol intoxication at which a driver is so potentially dangerous to others as to be justifiably labeled a criminal.
That threshold has always been understood to turn on the extent to which a person’s intoxication is likely to cause harm – that is, to cause a crash. In California, jurors are instructed that, to find a defendant guilty of driving “under the influence,” they must find that “his or her mental or physical abilities are so impaired that he or she is no longer able to drive a vehicle with the caution of a sober person, using ordinary care, under similar circumstances.”17 If “impairment” meant any deviation from stone-cold sobriety, then any drinking driver would be guilty; as the California Highway Patrol chief declared in 1934, “[n]o man who has been drinking is a safe driver . . . .”18 But DUI alcohol laws, at least for adults, have never been justified on the argument that any drinking whatsoever is dangerous or otherwise morally blameworthy. Such a jurisprudence of “prohibition” would be politically untenable. A 1940 paper in the Journal of the American Medical Association noted that while “[t]here can be little doubt that the operation of motor vehicles would be safer if the drivers were prohibited from consuming any alcohol whatever,” Prohibition “demonstrated the inability to enforce legislation so generally unpopular . . . . Public sentiment is definitely against the drunken driver but not against the drinking driver.”19 In short, only dangerous drinking and driving by adults can legitimately be criminalized in this country.
The specter of the “drunken driver” – the dangerous drinking driver – arose largely because of the massive increase in fatal car crashes in the first few decades of the twentieth century,20 itself a result of the mass production of cars
14. Id. at 59. 15. Id. 16. Even if the legal community were inclined to impute such a medical definition, none
existed. See, e.g., Herman A. Heise, Alcohol and Automobile Accidents, 103 J. AM. MED. ASS’N 739, 741 (1934) (1934) at 741 (“No definite amount of alcohol in body fluids has been officially designated above which a person is intoxicated and below which he is sober.”).
17. Cal. Crim. Jury Instr. 2110 (2014 ed.). 18. “More Drunk Drivers,” L.A. TIMES, Mar. 15, 1934, A4. See also Henry Newman &
Edwin Fletcher, The Effect of Alcohol on Driving Skill, 115 J. AM. MED. ASSOC. 1600 (Nov. 9, 1940); Lerner Supra note 3 at 25 (noting wide acceptance by scientists that small amounts of alcohol interfered with cognitive functioning); H. LAURENCE ROSS, DETERRING THE DRINKING DRIVER: LEGAL POLICY AND SOCIAL CONTROL 2 (1984) [hereinafter ROSS (1984)] (noting studies showing that at very low BACs, driving ability is still “noticeably affected”).
19. Newman & Fletcher, supra note 18, at 1602 (emphasis added). 20. LERNER, supra note 3, at 15-16. Even before the advent of cars, anecdotal data about
drunkenness of public transport operators causing accidents was well publicized. Id. See also Franklin E. Zimring, Law, Society, and the Drinking Driver: Some Concluding Reflections, in LAURENCE ET AL. 1988, supra note 4, at 381 (“The American public always believed that drinking, or at least elevated levels of intoxication, increased the risk of automobile crashes.”).

2/5/15 4:18 PM
201x] DESKTOP PUBLISHING EXAMPLE 109
and the end of Prohibition.21 Faced with anecdotal evidence suggesting that drivers who were clearly drunk – showing obvious signs of intoxication – were overrepresented among those in fatal crashes, as well as newspaper accounts of highly publicized highway deaths at the hands of these so-called “killer- drunk[s],”22 several state legislatures began a serious push to get such drivers off the roads.23 Thus, DUI laws were “classical” during this period in the sense that they targeted what the community had adjudged “clearly blameworthy conduct,” and their “[p]enalties and procedures were drawn from the general criminal law and seemed to be appropriate to the behavior in question.”24
From a law enforcement perspective, there were two key problems with this dangerousness-based “impairment” regime. The first was that jury acquittal rates in drunk driving cases were relatively high.25 This tendency to acquit rose not simply from disagreement over whether certain signs of drunkenness suggested impairment. The Book of Proverbs’ description of the effects of too much wine – “woe, sorrow, contentions, babbling, wounds without cause, and redness of eyes”26 – bears a striking resemblance to the factors police relied on in the early days of DUI prosecutions to prove impairment,27 and in cases where obvious signs of drunkenness were captured on film at the stationhouse, prosecutions were generally successful.28 Rather, the problem was that, in cases where the only evidence of impairment was a police officer’s uncorroborated testimony of his observations of a driver, it was the “suspect’s word against an officers,” and factfinders – even judges – were “loath to convict.”29
The second problem was the suspicion of many police and public health officials that drivers might be unsafe to drive even when they exhibited no
21. Annual car sales went from eight thousand in 1900 to eight million in 1920. LERNER,
supra note 3, at 15. Los Angeles officials soon after Prohibition claimed a “‘vast increase in drunk driving since repeal . . . .’” Id. at 21 (citing More Drunk Drivers,” L.A. TIMES, Mar. 15, 1934, A4).
22. See ROSS, supra note 5, at 22. Criminologists appear in agreement that this socially constructed term is highly misleading and obfuscates the complexity of drinking-driving behavior. See, e.g., Alan C. Donelson, The Alcohol-Crash Problem, in LAURENCE ET AL. 1988, supra note 5, at 32 (noting that the “killer drunk” became “mythologized, obscuring a more complicated reality, which features diverse patterns and outcomes of drinking-driving behavior as well as diverse types of people who engage in that behavior”).
23. See, e.g., Uniform Act Regulating Traffic on Highways, § 47, 1935 Ill. Laws 1247, 1258. 24. ROSS (1984), supra note 18, at 1. 25. See, e.g., HARRY KALVEN, JR. & HANS ZEISEL, THE AMERICAN JURY 67, 71, 295 (1966)
(comparing judge and jury acquittal rates for drunken driving). 26. Proverbs 23:29, THE HOLY BIBLE: AUTHORIZED KING JAMES VERSION (2010). 27. See, e.g., R.N. Harger, Some Practical Aspects of Chemical Tests for Intoxication, 35 J.
Crim. L. & Criminology 202, 203 (1944) (noting that the “usually accepted signs” of impairment are “the odor of the breath, abnormal speech, clumsiness of movement, and evidence of ‘stimulation,’” or belligent or otherwise abnormal behavior).
28. In cases after the dawn of breath testing but where a suspect refused a breath or blood test, and thus where it was the “suspect’s word against an officer’s” and “most judges [were] loath to convict,” police in the early 1960s began to fight back “in a score of cities by making each suspect the star of a two-minute movie, frequently in sound and color.” C.P. Gilmore, How the Camera Catches Crooks, POPULAR SCIENCE, June 1962, at 194. Suspects “almost always plead guilty when shown movies of how they looked when they were brought in.” Id. at 52-53.
29. Gilmore, supra note 28, at 194.

2/5/15 4:18 PM
110 CALIFORNIA LAW REVIEW [Vol. XX:nnn
outward signs of obvious, fall-down drunkenness.30 Law enforcement attempted to address this problem by giving a battery of “field sobriety tests” (FST) to suspects stopped for erratic driving or suspected of being drunk. The thought was that, if a suspect both failed to pass the tests and had exhibited erratic driving, then they were unsafe to drive as a result of alcohol even if not obviously drunk. But early FSTs – such as forcing a suspect to say “Methodist Episcopal” several times fast31 – were notoriously subjective and unscientific, and were viewed as difficult to pass even by sober people. On the other hand, FSTs appeared to generate a fair number of false negatives. A study in Los Angeles County in the 1920s showed that a substantial number of drivers stopped for unsafe driving passed FSTs with flying colors but still had moderate levels of alcohol concentration in their urine.32 While urine testing was discounted as “grossly inaccurate” at the time,33 the study at least suggested that unsafe drivers were going undetected with current methods of enforcement.
Thus, law enforcement had at least two strong incentives to find a mechanical means of measuring chemical impairment from alcohol. First, they needed a more reliable and objective means of proving impairment, to better corroborate imprecise or less than credible police officer testimony. Second, they needed a way of detecting levels of impairment below obvious drunkenness, to prove that such levels were, indeed, causing carnage that would inspire public outrage and merit criminal punishment..
It was not a foregone conclusion that science could even offer an accurate mechanical way to identify drivers with alcohol concentrations rendering them unsafe to drive. The most direct way to measure the effects of ethyl alcohol on the brain would be to sample brain tissue, which was possible in fatal cases but “with living subjects . . . would not be very popular.”34 Spinal fluid was also considered a possibility until researchers realized not only how difficult it was to obtain, but that the alcohol concentration in the lumbar region (where fluid samples were typically taken) was generally much lower than brain concentration.35 Urine testing was highly inaccurate and saliva, while easy to obtain, was too likely to contain “residual” mouth alcohol that couldpotentially
30. See, e.g., C.W. Muehlberger, Cook County Coroner, Letter to the Editor, 115 J. AM. MED.
ASS’N Dec. 21, 1940, at 2198 (“The public associates the term ‘drunk’ with a stage of alcoholic intoxication characterized by staggering gait and confused or slurred speech. . . . Such standards, while entirely suitable for purposes of hospital classification, are hardly adequate for diagnosis of the influence of alcohol on motorists.”).
31. LERNER, supra note 3, at 24; Harger, supra note 23, at 203. 32. Emil Bogen, The Diagnosis of Drunkenness— A Quantitative Study of Acute Alcoholic
Intoxication, CAL. & WESTERN MEDICINE, June 1927, at 779, available at http://www.ncbi.nlm.nih.gov/pmc/articles/PMC1655515/?page=5; id. at 778 (“[A] person may be under the influence of alcohol to an extent that seriously affects his . . . driving . . . without presenting the entire common syndrome of drunkenness.”).
33. Lester D. Ellerbrook & Chester B. VanGaasbeek, The Reliability of Chemical Tests for Alcoholic Intoxication, 122 J. AM. MED. ASS’N 996, 998 (Aug. 7, 1943).
34. Harger, supra note 23 at 205. 35. Richard R. Burgee, A Study of Chemical Tests for Alcoholic Intoxication, 17 Maryland L.
R. 193, 197 (1957)..

2/5/15 4:18 PM
201x] DESKTOP PUBLISHING EXAMPLE 111
overestimate brain alcohol concentration.36 The Cleveland Police Department in the 1930s developed an “alcohol test” consisting of a “stereoscope” and two small images that appeared separate to a sober person but appeared to an “even slightly intoxicated [person]” to be merged; apparently, some traffic-court judges were accepting the evidence “as proof of intoxication.”37 Yet the stereoscope could at most detect the presence, not precise concentration, of alcohol in a person’s system, and thus was of limited use.
The good news was that the unique properties of ethyl alcohol offered the possibility of estimating brain alcohol concentration through blood and breath testing. Alcohol is, of course, a drug, with central nervous system effects – including euphoria, depression, and disorientation – similar to many other legal and illegal drugs.38 But its “pharmacokinetic” properties (how it is processed by the body) and “pharmacodynamics” properties (how it acts on the body)39 are quite unusual.40 It is much less potent than most other drugs, meaning that high concentrations must be present in the body for its effects to take hold. In turn, such high concentrations of alcohol “affect[] all organ and biochemical systems of the body.”41 It is both water and fat soluble, meaning that it equilibriates rapidly between blood and brain and “produces no active metabolites.”42 Alcohol also quickly dissipates from the body almost entirely through metabolism.43 The level of alcohol in one’s bodily fluids at any given point is proportional to rates of absorption, distribution, and elimination that are similar (though not identical) among humans.44 And because of alcohol’s complete water solubility and volatility at body temperature, the level of alcohol in one’s breath from the depths of one’s lungs (deep-lung air or “end-expiratory” breath) is in a generally constant and measurable ratio with the level of alcohol in one’s arterial blood.45 In turn, one’s BAC is generally proportional, in a
36. Id. 37. Eye Test Shows Up Tipsy Drivers, POPULAR SCIENCE, July 1936, at 22. 38. See generally DAVID L. FAIGMAN ET AL., MODERN SCIENTIFIC EVIDENCE: THE LAW
AND SCIENCE OF EXPERT TESTIMONY, § 41:20 (2012-13 ed.) (discussing the similarities between the pharmacological properties of alcohol and narcotic drugs such as morphine).
39. See generally Donelson, supra note 22, at 4 (explaining the difference between the two major branches of pharmacology: pharmacokinetics and pharmacodynamics).
40. American Prosecutors Research Institute, Alcohol Toxicology for Prosecutors: Targeting Hardcore Impaired Drivers 5 (July 2003), available at http://www.ndaa.org/pdf/toxicology_final.pdf [hereinafter APRI (2003)].
41. FAIGMAN ET AL., supra note 38, at § 41:20. 42. Gary M. Reisfield et al., The Mirage of Impairing Drug Concentration Thresholds: A
Rationale for Zero Tolerance Per Se Driving under the Influence of Drugs Laws, 36 J. ANAL. TOXIC. 353, 353 (2012).
43. Donelson, supra note 22, at 5. A very small amount is excreted in breath, urine, and sweat. Id.
44. Id. 45. When a person drinks ethyl alcohol, it travels from the stomach, to the intestines, to the
blood, and to all bodily tissues, including air pockets deep within one’s lungs called “alveoli,” which are surrounded by blood-rich membranes. Some portion of the alcohol in one’s blood evaporates into the alveoli. As you exhale, your BrAC starts at its lowest level and rises until it reaches its peak as the deep air from the alveoli is finally expelled. According to “Henry’s Law,” at a constant 34 degrees Celsius (the average temperature of human breath when it leaves the mouth), one’s BrAC is in a constant ratio with one’s BAC. This ratio differs for each person, but is close to 2100 to 1. Thus, the

2/5/15 4:18 PM
112 CALIFORNIA LAW REVIEW [Vol. XX:nnn
linear fashion, to the intensity of the effect on the user’s central nervous system.46
Alcohol’s distinctive qualities enabled Swedish physician Erik M.P. Widmark to develop an equation – still used in prosecutions today, when blood or breath testing has been refused by a defendant – linking one’s BAC and one’s body weight, amount of alcohol consumed, time of last consumption, and alcohol elimination rate.”47 Widmark also developed in 1922 a means of blood testing for alcohol concentration.48 Blood tests were hard to administer in time to be useful for DUI prosecution, however, especially in rural areas. Moreover, blood tests required the aid of a medical professional, and most physicians were hesitant to cooperate with police because BAC tests were not within the doctor-patient relationship and, thus, not covered by medical malpractice insurance.49
Researchers thus focused their efforts on breath testing. A 1927 Popular Science article hailed the invention of an early balloon-like device by W.D. McNally, a Chicago “coroner’s chemist,” by declaring that it could “tell infallibly whether a person has taken a single drink” (leading the authors to lament that “[a] drinking man doesn’t stand a chance these days”).50 While the test was significant in that it required no invasive blood draw, it too proved only the presence, rather than the dosage, of alcohol in the body.
Finally, in 1931, Dr. Rolla Harger, a biochemist at Indiana University and police consultant, invented the “Drunk-O-Meter” – the first machine that required no invasive testing, offered an estimate of blood-alcohol concentration, and could potentially be used by police during roadside traffic stops. The person being tested blew air into a balloon, and the air was then released into a chemical solution (see Fig. 1). In the presence of alcohol, the chemical solution changed color. The greater the color change, the more alcohol in the breath. The suspect’s blood alcohol concentration (BAC) could then be estimated from the breath alcohol concentration (BrAC) through a simple, scientifically accepted conversion ratio.51 Fresh from the laboratory, the Drunk-O-Meter made its public debut in 1938, on New Year’s Eve, on the streets of Indianapolis.52 In 1941, competitors developed the “Intoximeter” and
number that a breath test reports as the BAC is not actually the BAC, but a calculated estimate thereof. See generally FAIGMAN ET AL., § 41:32, 38, 40.
46. FAIGMAN ET AL. § 41:22. The effects are more pronounced when one’s BAC is rising rather than falling. Id. See also Donelson, supra note 22, at 6-7 (noting that "the greater the amount of alcohol present in the body, the greater the effects of alcohol" and discussing the results of a study that showed that 86% of participants were judged intoxicated at BACs between 151 and 200 mg%, while only 34% were judged intoxicated at BACs between 51 and 100 mg%).
47. See Clarke’s Analytical Forensic Toxicology 320-21 (2d ed. 2013). See also APRI (2003), supra note , at 16-17.
48. See, e.g., Rune Andreasson & Wayne A. Jones, The Life and Work of Erik M.P. Widmark, 17 Am. J. Forensic Med. & Path. 177 (1996), available at http://journals.lww.com/amjforensicmedicine/Fulltext/1996/09000/The_Life_and_Work_of_Erik_M__P__Widmark.1.aspx#.
49. See 1968 REPORT, supra note , at 105. 50. Tests a Tippler’s Breath, POPULAR SCIENCE, Aug. 1927, at 56. 51. See supra note 45. 52. See How Police Nab Drunk Drivers: From Drunkometer to Breathalyzer, 90.9WBUR

2/5/15 4:18 PM
201x] DESKTOP PUBLISHING EXAMPLE 113
“Alco-Meter,” similar machines that also used chemical solutions and balloons to test BrAC.
In cases of obvious drunkenness, Drunk-O-Meter results gave law enforcement what it had hoped for: corroboration of police testimony and, thus, more convictions. A suspect’s claim that he was not obviously drunk, stacked up against an officer’s testimony, was much less believable when the state introduced test results showing that the suspect blew a .20% BAC, which an expert could explain was likely the equivalent of drinking several alcoholic beverages in a short time. In turn, the public was all too familiar with the risks of driving while obviously drunk, and had little trouble, in the more egregious cases with mechanical corroboration, convicting.53
Anticipating that drunk drivers could now be proven guilty with certainty, the press celebrated the Drunk-O-Meter as nothing short of an “impairment” machine. A scholar writing in 1953 heralded the Drunk-O-Meter as fulfilling the “age-old dream of man” to have the sort of proof “whereby a situation is fed into a device and out rolls the correct adjudication.”54 One journalist described it as a “scientific wonder[] that measure[s] the immeasurable.”55 A 1955 Popular Science article excitedly observed that “[t]he hunches and walk-a-straight-line methods of old-time police work are being replaced by scientific
Fig. 1. A demonstration of Harger’s “Drunk-O-Meter” in 1950. (Reprinted with permission from the Associated Press)
devices to tell the cops just how drunk a driver is by analyzing a whiff of his breath.”56 Numerous other newspaper accounts described the new gadget with
(Dec. 31, 2012), available at hereandnow.wbur.og/2012/12/31/breathalyzer-history.
53. See, e.g., Richard L. Holcomb, Alcohol in Relation to Traffic Accidents, 111 J. AM. MED. ASS’N 1076, 1077 (1938) (noting that “prosecutions based on the tests have been unusually successful”).
54. Dillard S. Gardner, Breath-Tests for Alcohol: A Sampling Study of Mechanical Evidence, 31 TEX. L. REV. 289 (1953).
55. David Le Roi, How Drunk is Drunk? Science Has the Answer, TIMES PICTORIAL, Sept. 30, 1950, at 9.
56. Joseph Dorlaque, New Machines Get Drunks Off the Road, POPULAR SCIENCE, Oct. 1955, at 166.

2/5/15 4:18 PM
114 CALIFORNIA LAW REVIEW [Vol. XX:nnn
awe.57 Courts, too, were impressed. One court expressed relief that “[t]he prosecution need no longer rely solely upon” field sobriety tests now that “scientific methods” could “determine exactly the extent to which a suspect is ‘under the influence of intoxicating liquor.’”58 Indeed, some courts, citing the availability of the Drunk-O-Meter, found police testimony legally insufficient for DUI conviction.59 In short, a “steadily growing respect” was building for the Drunk-O-Meter’s “superiority over human testimony.”60
Yet in cases where a suspect was not obviously drunk, the Drunk-O-Meter’s results did not make the jury’s job simpler, absent some sense of what a particular BAC meant in terms of safe driving. In choosing which drivers to morally condemn, the public appeared no more interested in criminalizing low levels of intoxication – at least not based solely on a loss of efficiency in certain driving skills – than they were before the Drunk-O-Meter. Indeed, large swaths of the public drove at low levels of intoxication, and would have experienced no small amount of cognitive dissonance in widening the criminal net to include anyone whose driving was affected by alcohol. As one doctor wrote in a letter to the American Medical Association (AMA), “Drunkenness is distinctly a social and legal condition . . . . While chemical tests can prove that a man is intoxicated they cannot prove that a man is drunk.”61 Without proof that driving with, say, a .15% BAC actually caused an unacceptable number of road accidents, the public was unmoved by this mechanical wonder in cases with ambiguous non-machine evidence of morally blameworthy “impairment.”
2. Early Attempts to Equate BAC with Dangerousness While courts and commentators continued to praise the Drunk-O-Meter as
an “impairment” machine, certain public health officials appeared to recognize that the only meaningful way to show that certain BACs equated to criminal impairment was not simply to quantify BACs, but to determine the extent to which certain BACs caused, or posed a high risk of, harm – in the case of traffic safety, a car crash.
Yet any attempt to identify the “cause” of a crash as being driving with a certain BAC was challenging for several reasons. First, the cause of a crash, and the assignment of fault for the crash, might be a complex web of factors difficult to untangle. Second, there was little reliable data on non-fatal-crashes, many of which are not reported, for much of the twentieth century. And fatal crashes, while recorded, might have a disproportionate number of drunk drivers
57. See, e.g., James Doherty Drunkometer Demonstrated At N.U. School: Prosecutors View Tests by Inventor, CHI. TRIBUNE, Aug. 17, 1950, at A13 (celebrating Harger’s training of 100 young prosecutors in a “special course on criminology”).
58. McKay v. State, 235 S.W.2d 173, 174 (Tex. Cr. App. 1950) (quoting a 1950 Northwestern study).
59. See, e.g., State v. Matchok, 82 A.2d 444, 446 (N.J. Super. A.D. 1951) (holding that doctor’s testimony about smell of alcohol on defendant’s breath was insufficient proof of DUI, particularly “in view of modern scientific advances” for quantitatively testing intoxication, and the doctor’s unfamiliarity with such modern tests).
60. Dorlaque, supra note 56, at 166. 61. Dr. W.C. Woodward, Letter to Dr. Herman Heise, 103 J. AM. MED. ASSOC. 741 (1934).
2/5/15 4:18 PM
201x] DESKTOP PUBLISHING EXAMPLE 115
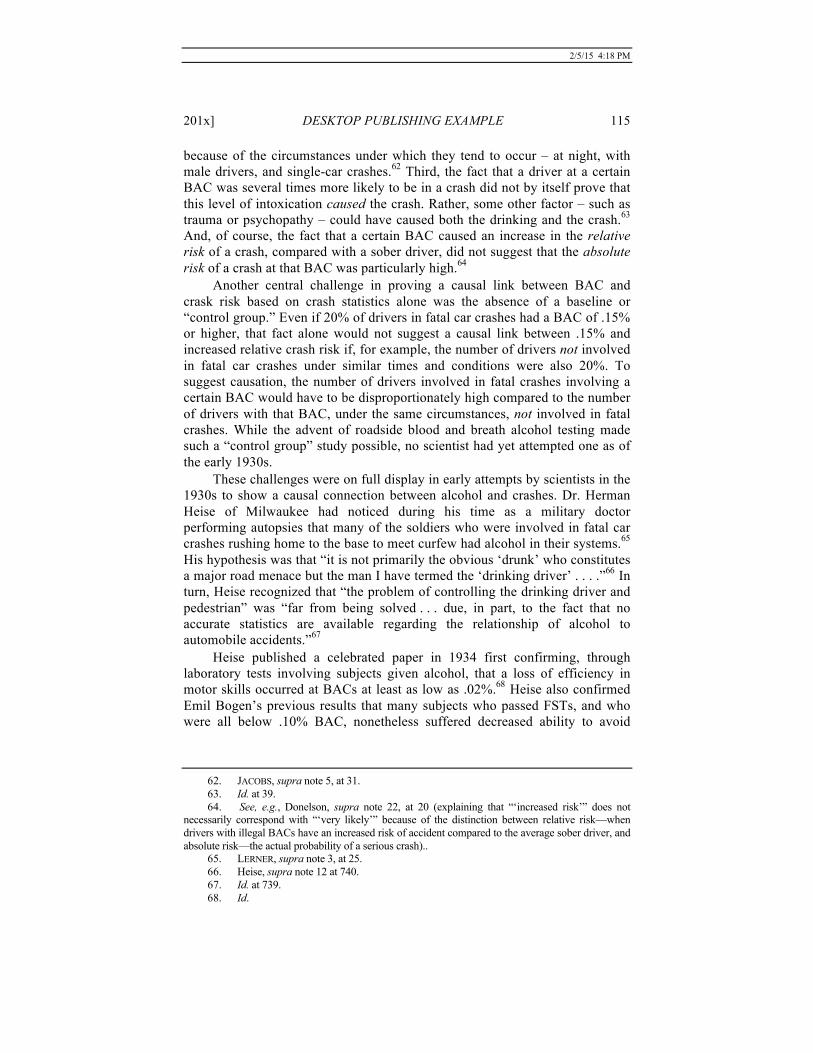
because of the circumstances under which they tend to occur – at night, with male drivers, and single-car crashes.62 Third, the fact that a driver at a certain BAC was several times more likely to be in a crash did not by itself prove that this level of intoxication caused the crash. Rather, some other factor – such as trauma or psychopathy – could have caused both the drinking and the crash.63 And, of course, the fact that a certain BAC caused an increase in the relative risk of a crash, compared with a sober driver, did not suggest that the absolute risk of a crash at that BAC was particularly high.64
Another central challenge in proving a causal link between BAC and crask risk based on crash statistics alone was the absence of a baseline or “control group.” Even if 20% of drivers in fatal car crashes had a BAC of .15% or higher, that fact alone would not suggest a causal link between .15% and increased relative crash risk if, for example, the number of drivers not involved in fatal car crashes under similar times and conditions were also 20%. To suggest causation, the number of drivers involved in fatal crashes involving a certain BAC would have to be disproportionately high compared to the number of drivers with that BAC, under the same circumstances, not involved in fatal crashes. While the advent of roadside blood and breath alcohol testing made such a “control group” study possible, no scientist had yet attempted one as of the early 1930s.
These challenges were on full display in early attempts by scientists in the 1930s to show a causal connection between alcohol and crashes. Dr. Herman Heise of Milwaukee had noticed during his time as a military doctor performing autopsies that many of the soldiers who were involved in fatal car crashes rushing home to the base to meet curfew had alcohol in their systems.65 His hypothesis was that “it is not primarily the obvious ‘drunk’ who constitutes a major road menace but the man I have termed the ‘drinking driver’ . . . .”66 In turn, Heise recognized that “the problem of controlling the drinking driver and pedestrian” was “far from being solved . . . due, in part, to the fact that no accurate statistics are available regarding the relationship of alcohol to automobile accidents.”67
Heise published a celebrated paper in 1934 first confirming, through laboratory tests involving subjects given alcohol, that a loss of efficiency in motor skills occurred at BACs at least as low as .02%.68 Heise also confirmed Emil Bogen’s previous results that many subjects who passed FSTs, and who were all below .10% BAC, nonetheless suffered decreased ability to avoid
62. JACOBS, supra note 5, at 31. 63. Id. at 39. 64. See, e.g., Donelson, supra note 22, at 20 (explaining that “‘increased risk’” does not
necessarily correspond with “‘very likely’” because of the distinction between relative risk—when drivers with illegal BACs have an increased risk of accident compared to the average sober driver, and absolute risk—the actual probability of a serious crash)..
65. LERNER, supra note 3, at 25. 66. Heise, supra note 12 at 740. 67. Id. at 739. 68. Id.
2/5/15 4:18 PM
116 CALIFORNIA LAW REVIEW [Vol. XX:nnn
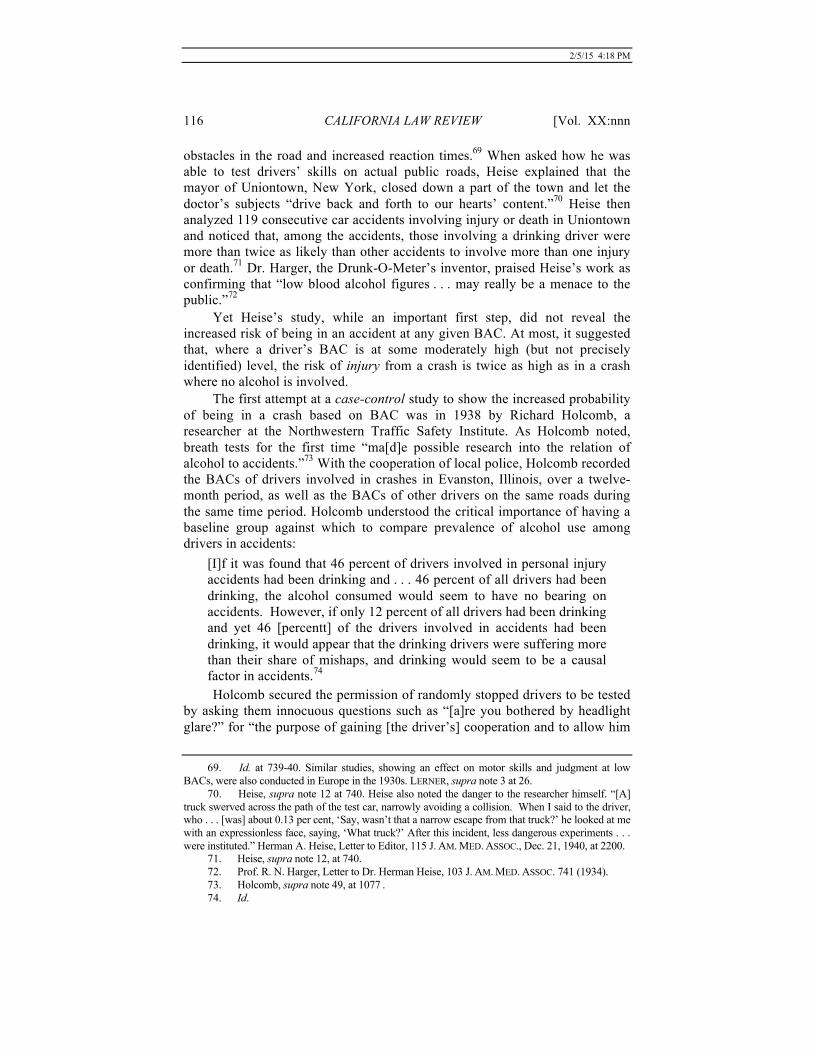
obstacles in the road and increased reaction times.69 When asked how he was able to test drivers’ skills on actual public roads, Heise explained that the mayor of Uniontown, New York, closed down a part of the town and let the doctor’s subjects “drive back and forth to our hearts’ content.”70 Heise then analyzed 119 consecutive car accidents involving injury or death in Uniontown and noticed that, among the accidents, those involving a drinking driver were more than twice as likely than other accidents to involve more than one injury or death.71 Dr. Harger, the Drunk-O-Meter’s inventor, praised Heise’s work as confirming that “low blood alcohol figures . . . may really be a menace to the public.”72
Yet Heise’s study, while an important first step, did not reveal the increased risk of being in an accident at any given BAC. At most, it suggested that, where a driver’s BAC is at some moderately high (but not precisely identified) level, the risk of injury from a crash is twice as high as in a crash where no alcohol is involved.
The first attempt at a case-control study to show the increased probability of being in a crash based on BAC was in 1938 by Richard Holcomb, a researcher at the Northwestern Traffic Safety Institute. As Holcomb noted, breath tests for the first time “ma[d]e possible research into the relation of alcohol to accidents.”73 With the cooperation of local police, Holcomb recorded the BACs of drivers involved in crashes in Evanston, Illinois, over a twelve-month period, as well as the BACs of other drivers on the same roads during the same time period. Holcomb understood the critical importance of having a baseline group against which to compare prevalence of alcohol use among drivers in accidents:
[I]f it was found that 46 percent of drivers involved in personal injury accidents had been drinking and . . . 46 percent of all drivers had been drinking, the alcohol consumed would seem to have no bearing on accidents. However, if only 12 percent of all drivers had been drinking and yet 46 [percentt] of the drivers involved in accidents had been drinking, it would appear that the drinking drivers were suffering more than their share of mishaps, and drinking would seem to be a causal factor in accidents.74 Holcomb secured the permission of randomly stopped drivers to be tested
by asking them innocuous questions such as “[a]re you bothered by headlight glare?” for “the purpose of gaining [the driver’s] cooperation and to allow him
69. Id. at 739-40. Similar studies, showing an effect on motor skills and judgment at low BACs, were also conducted in Europe in the 1930s. LERNER, supra note 3 at 26.
70. Heise, supra note 12 at 740. Heise also noted the danger to the researcher himself. “[A] truck swerved across the path of the test car, narrowly avoiding a collision. When I said to the driver, who . . . [was] about 0.13 per cent, ‘Say, wasn’t that a narrow escape from that truck?’ he looked at me with an expressionless face, saying, ‘What truck?’ After this incident, less dangerous experiments . . . were instituted.” Herman A. Heise, Letter to Editor, 115 J. AM. MED. ASSOC., Dec. 21, 1940, at 2200.
71. Heise, supra note 12, at 740. 72. Prof. R. N. Harger, Letter to Dr. Herman Heise, 103 J. AM. MED. ASSOC. 741 (1934). 73. Holcomb, supra note 49, at 1077 . 74. Id.

2/5/15 4:18 PM
201x] DESKTOP PUBLISHING EXAMPLE 117
to get over the strangeness of the situation.”75 Then assistants dressed in “physicians’ white smocks” approached the driver “for the dual purpose of making a favorable impression on the driver and of making themselves readily visible to other traffic . . . .”76 Remarkably, of 1,750 drivers stopped, only 24 refused to be tested.77
Holcomb found that a driver with a BAC of .15% was 33 times more likely to be involved in a crash than a sober driver. He also found that almost 25% of drivers involved in crashes had a BAC of over .10%, compared to less than 3% of the control group. In contrast, he found that ratio of drinkers in the accident group to drinkers in the control group reached around 1 to 1 at BACs of .05-.06% or lower. Notably, a full 12% of the control group had been drinking to some extent.78 While it was only one study, Holcomb’s results were highly influential, no doubt because they were clearly the most salient studies thus far to the question of what level of intoxication should be deemed “impairment” for purposes of American criminal law.
3. NSC/AMA Criteria and the Need for a Better Impairment Machine Based in large part on Holcomb’s study,79 the newly formed Committee
on Tests for Intoxication of the National Safety Council (NSC), along with the AMA, published a joint report in 1939 that set forth what it viewed as appropriate criteria for determining driver “impairment” based on BAC for purposes of DUI laws. The report suggested that there be no DUI prosecution at BACs below .05%; that there should always be a DUI prosecution at BACs above .15%, and that such a level should be presumptive evidence of impairment; and that a driver between .05 and .15 should be prosecuted only if the circumstances “give definite confirmation of such influence.”80
The NSC/AMA criteria were not simply scientific assessments confirming the level of increased risk of accident at different BACs; that was what Holcomb had done. Rather, the report’s recommendations were value judgments, based on the increased crash risk associated with various BACs, about what level of risk should be considered “impairment” for purposes of triggering criminal liability. The committee’s decision to place the exoneration threshold at .05% rather than a lower number reflected a desire to “vindicate[] the . . . temperate driver.” “Temperate driver” was, of course, not a scientific term signaling the existence or absence of a particular effect or phenomenon, but a socially constructed category of drinking drivers whose level of intoxication was, in the committee’s view, too low to warrant criminal punishment. And while many on the committee wished to set an upper limit of
75. Id. at 1078. 76. Id. 77. Id. at 1077–78. 78. Id. at 1078. 79. See Ellerbrook & VanGaasbeek, supra note 29, at, 998 (noting that the Committee’s
chosen thresholds were created after developing crash risk data “calculated from the data of Holcomb”).
80. LERNER, supra note 3, at 28 (citing Herman A. Heise, Burt R. Shurly, and Thomas A. McGoldrick, “Report of the Committee to Study Problems of Motor Vehicle Accidents,” 1939 and 1942).

2/5/15 4:18 PM
118 CALIFORNIA LAW REVIEW [Vol. XX:nnn
.11% rather than the “’extremely conservative’” .15%, others were concerned that .11% would subject to criminal liability at least “’a few tolerant persons’” who could hold their liquor better than most.81
Those in favor of a lower threshold could also point to the decisions of Norway and other Scandinavian countries in the mid-1930s to criminalize not only driving while impaired, but also the act of simply driving with a BAC over a certain threshold, sometimes as low as .02%.82 Historians and criminologists have described this “Scandinavian model” as resulting from those countries’ dire drunk driving problems, “a politically powerful and moralistic temperance movement that was willing to blame almost any social ill on alcohol,” and their lesser focus on individualism and civil liberties in their crime policies.83
In the end, the committee chose .15%, knowing that the data suggested that those between .10 and .15% were over ten times more likely to cause a crash. In their judgment, the increased risk associated with .10% did not unambiguously merit criminal punishment, at least not in a nation whose citizens were still reeling from the collapse of Prohibition and had a laissez-faire attitude toward alcohol.84 And while it is not clear why the NSC/AMA would have special skills in making such value judgments, the criteria were highly influential on DUI policy for decades thereafter. In 1939 alone, Indiana and Ohio adopted the chart wholesale in their new “driving under the influence” (DUI) laws.85 Several other states, as well as the Uniform Vehicle Code, followed suit in the next few years.86
Even as the Drunk-O-Meter’s readings were being used to study accident rates and thereby set national crime policy, scientists and law enforcement officials were acknowledging that the device was not quite the “truth machine” the public believed it to be. Dr. Holcomb noted up front in his 1938 study that the Drunk-O-Meter was “somewhat less accurate than urinalysis.”87 Later, the NSC itself acknowledged that the Drunk-O-Meter offered only a “rough measure” of BAC and “requires a chemist’s delicate balance” for an accurate reading.88 By the 1940s, some studies began to question anew whether BAC was even a good proxy for impairment,89 with one trio of Canadian studies concluding that BAC, at least at low levels, was not a reliable indicator of how alcohol affects the brain.90 Based on these and other studies, the Michigan
81. Id. at 29. 82. See, e.g., ROSS (1984), supra note18, at 22-24. 83. See, e.g., id. 84. LERNER, supra note 3, at 30. 85. ROSS (1984), supra note18, at xv (citing Indiana Acts 1939, ch. 48, § 52). 86. See, e.g., McKay v. State, 235 S.W.2d 173, 175 (Tex. Cr. App. 1950) (citing the study and
the presumptions suggested therein with approval). 87. Holcomb, supra note 49, at 1077. 88. Dorlaque, supra note 52, at 167. 89. See, e.g., Time a Factor in Drunkenness, Laboratory Tests Reveal, POPULAR SCIENCE,
Aug. 1942, at 207 (noting a Stanford Medical School study showing that while an initial drink caused some impairment, performance “returned to normal” afterwards “despite small doses which kept the [BAC] . . . constant”).
90. I.M. Rabinowitch et al., Medicolegal Aspects of Chemical Tests of Alcoholic Intoxication, 39 J. CRIM. L., CRIMINOLOGY., 225, 234 (1948); I.M. Rabinowitch, Medicolegal Aspects of Chemical

2/5/15 4:18 PM
201x] DESKTOP PUBLISHING EXAMPLE 119
Supreme Court in 1949 held that the Drunk-O-Meter did not pass muster under the Frye “general acceptance” test for admissibility of novel scientific evidence. The Court analogized the test’s “‘continuous series of errors’” to “‘a slot machine,’” and noted that because of its questionable reliability and the “‘elaborate exposition’”91 necessary to explain its inner workings, its admission might result, like the polygraph, “’in a trial of the [machine] rather than the issues in the cause.’”92
Notwithstanding the misgivings of some courts and scientists about the reliability of the Drunk-O-Meter, Dr. Harger defended its use in the absence of a better alternative to addressing the drunk driving crisis. In a rebuttal to the Canadian study, he insisted that “the disposition of the daily crop of drunken driving cases cannot await absolute perfection in the field of chemical tests.”93 The Supreme Court itself would express similar sentiments. In holding in 1957 that involuntary blood testing of a DUI suspect did not violate due process,94 the Court relied in no small part on the perceived necessity of such scientific tests, however imperfect or invasive, in ending the carnage caused by drunk driving:
Modern community living requires modern scientific methods of crime detection lest the public go unprotected. The increasing slaughter on our highways, most of which should be avoidable, now reaches the astounding figures only heard of on the battlefield. The States, through safety measures, modern scientific methods, and strict enforcement of traffic laws, are using all reasonable means to make automobile driving less dangerous. As against the right of an individual . . . must be set the interests of society in the scientific determination of intoxication, one of the great causes of the mortal hazards of the road.95 Luckily for Dr. Harger, absolute perfection – or at least a step closer to it
– arrived before the scientific conflict over the Drunk-O-Meter’s reliability had a chance to affect the legitimacy of Holcomb’s crash studies or the NSC/AMA’s criminal policy recommendations. In 1954, Robert Borkenstein, a former Indiana police officer with only a high school education, invented the “Breathalyzer” while on a two-week vacation.96 The machine boasted standardized reagents and reaction times, as well as a “colorimetry” system that offered more precision than the Drunk-O-Meter (see Fig. 2).97 The
Tests of Alcoholic Intoxication, 26 CAN. B. REV. 1437, 1439 (1948); Charles U. Letourneau, Chemical Tests in Alcoholic Intoxication, 28 CAN. B. REV. 858, 871 (1950). 91 People v. Morse, 38 N.W.2d 322, 323 (Mich. 1949).
92. Id. (quoting State v. Bohner, 246 N.W. 314, 317 (Wis. 1933)). See also State v. Hunter, 68 A.2d 274, 276-77 (N.J. Super. A. D. 1949) (granting new trial based on a Drunk-O-Meter expert’s failure to use the right type of druggist’s scale to measure the weight of absorbed vapor).
93. R.N. Harger, Medicolegal Aspects of Chemical Tests of Alcoholic Intoxication: Comments on Dr. I.M. Rabinowitch’s Paper, 39 J. CRIM. L. & CRIMINOLOGY 402, 410 (1948).
94. Breithaupt v. Abram, 352 U.S. 432, 437 (1957). 95. Id. at 439. 96. LERNER, supra note 3, at 48-49. 97. BREATH TESTING FOR PROSECUTORS,,at 11.

2/5/15 4:18 PM
120 CALIFORNIA LAW REVIEW [Vol. XX:nnn
breathalyzer’s portability allowed people to use it at cocktail parties for informal experimentation; at one scientific conference in 1956, attendees watched a colleague become visibly drunk at a .08% BAC.98 Because early models forced users to manually set a baseline, however, the machine’s detractors labeled it the “Dial-a-Drunk” machine, and its credibility suffered somewhat from the theoretical ability for police to manipulate it.99 A few courts refused to allow the Breathalyzer until its reliability became more established, likening it to the “push button justice” of another recent invention used in traffic prosecutions, the radar gun.100 Still, by the mid-1950s, public and judicial opinion toward breath machines reached a sort of repose. Conviction rates increased, and the public began to perceive breath-test results as “practically impossible to deny in court.”101
Fig. 2. Robert Borkenstein training police officers on the Breathalyzer in 1969. (Reprinted with permission from Indiana University Archives)
Even as courts and the public began to accept Breathalyzer results as
reliable proof of BAC, , jurors continued to acquit in drunk driving cases in larger numbers than in trials of other crimes.102 Perhaps this was a function of a new wave of scientific challenges at trial by the well-organized DUI defense bar, or of jury nullification in protest of sentences that the public viewed as too punitive,103 or even an unintended effect of the NSC’s setting of the presumptive threshold at .15%.104 Or, as public health officials would later claim, perhaps it was the result of continued disbelief that moderate levels of
98. LERNER, supra note 3, at 49. 99. BREATH TESTING FOR PROSECUTORS, supra note 92, at 11. 100. People v. Seger, 63 Misc.2d 921, 925 (Town Ct. 1970) (quoting People v. Offermann,
204 Misc. 769, 774-75 (N.Y. Sup. Ct. 1953)). 101. Dorlaque, supra note 52, at 270. See also Chemical Tests and the Drunken Automobile
Driver, 154 J. AM. MED. ASSOC., Dec. 27, 1958, at 1279 (reporting conviction rates above 95% in Detroit, Los Angeles, Milwaukee, Minneapolis, and Chicago). 102 See generally Kalven & Zeisel, supra note 25.
103. This was the overwhelmingly prevalent theory of judges interviewed by Kalven and Zeisel in DUI cases, who speculated that jurors could “visualize themselves in [the] defendant’s] position.” KALVEN & ZEISEL, supra note 25, at 266.
104. LERNER, supra note 3, at 51 (arguing that .15% essentially became the “default value for DWI prosecutions”).

2/5/15 4:18 PM
201x] DESKTOP PUBLISHING EXAMPLE 121
intoxication were morally blameworthy.105 As one historian has described public opinion at the time, there was still a sense that moderate levels of intoxication suggested the driver was merely a “social drinker,” a term that with a “positive connotation, suggesting that such an individual was both sociable and harmless.”106
3. Haddon’s Science-Based Agenda for Using BACs to Target Dangerous Driving
The response of public officials in the 1950s and early 1960s to this lingering juror ambivalence was not to call for removing the question of “impairment” from the jury’s consideration. The NSC could have easily done so, of course, in the form of recommending that states adopt so-called “per se” laws. Rather than leaving the issue of “impairment” for the jury to decide on the basis of the driver’s BAC and other circumstances, a “per se” law actually redefines impairment in terms of BAC. In a per se prosecution, the question for the jury is not whether the state proved that the driver was “impaired,” but simply whether the state proved the requisite BAC based on the breath test result. . While every state in the union eventually adopted per se laws , such punitive turns did not occur in most states until well after 1980 and in some states, not until 2004.
Instead, the period from the 1940s through the 1970s was defined by a paradigm of treating drunk driving as a public health problem, under a so-called “epidemiological” model rather than a law-and-order model. With the growth of the “automobile culture” and development of the interstate highway system, car crashes became one of the most serious health crises in the United States. By the 1960s, roughly 50,000 Americans were killed a year in car crashes alone.107 If jurors – or the public, the jury writ large – looked at these statistics and still did not see low levels of intoxication in drivers as a “menace,” then it was incumbent upon officials and scientists both to confirm the risk through careful study and to educate the public about the risk. Any other “disease” would be treated similarly, after all. In the words of one official, the focus of DUI laws was first and foremost to prevent the “thousands of unnecessary deaths” from the disease of “alcoholism” itself.108
The seeds of this public health movement had been sown shortly after the Drunk-O-Meter was invented. The 1930s and 1940s saw the founding of the Research Council on Problems of Alcohol (1937), the Yale School of Alcohol Studies (1943), the National Council for Education on Alcoholism (1944), Alcoholics Anonymous (1935), and the National Safety Council (NSC)’s Committee on Tests for Intoxication (later the Committee on Alcohol and
105 See, e.g., 1968 REPORT, supra note 12, at 90, 105 (noting that only 10% of the public “felt that there was something bad or inherently stupid about the drinking driver” and that jurors would often acquit if the defendant was not a “hard core” drinker).
106. Id. at 23. 107. Id. at 53. 108. Id. at 19 (citation omitted).

2/5/15 4:18 PM
122 CALIFORNIA LAW REVIEW [Vol. XX:nnn
Other Drugs) (1936).109 Holcomb’s famous 1938 study was, after all, commissioned by a traffic safety institute in Chicago.
The person typically credited with conceptualizing the drunk driving problem as a post-war public health emergency in the 1950s and 1960s, and with ensuring that proper scientific studies undergirded public policy on drunk driving, was a Harvard-educated, “workaholic government bureaucrat” in New York by the name of William Haddon Jr. (Fig. 3).110 Unlike law enforcement types such as Borkenstein and Holcomb, Haddon actually came from the world of epidemiology.111 Haddon noticed that, up to the late 1950s, most of the data about car crashes – other than Holcomb’s study, which was done using very early breath-testing models –was anecdotal. Even by the date of the influential 1957 treatise Chemical Tests and the Law by Robert Donigan of the Traffic Institute at Northwestern, the author only cited, as evidence of a link between alcohol and risk of accident, studies showing that a high percentage of drivers involved in fatal crashes had been drinking.112 Haddon understood what Holcomb had known before him: that without an estimate of the baseline percentage of the other drivers on the road who had been drinking, such statistics by themselves were insufficient to establish that alcohol caused accidents. And even if alcohol did cause accidents, existing studies left unclear the relationship between specific BACs and increased risk.
Fig. 3. William Haddon, Jr.
(Reprinted with permission from the Insurance Institute for Highway Safety) Haddon’s first move was to study the role played by alcohol in fatal
single-car crashes in Westchester County, New York, from 1949 to 1957. When multiple cars are involved in a crash, it is often difficult to determine which car caused the crash, and what precise behavior or condition caused the
109. Id. at 19, 22. 110. Id. at 38. 111. Id. at 53-54. 112. ROBERT L. DONIGAN, CHEMICAL TESTS AND THE LAW 1, 173-74 (1957). See also
LERNER, supra note 3, at 55 (citing a 1956 Delaware study finding that 59% of crash-related deaths involved alcohol, and a Cleveland study showing that 40-60% of crash victims had alcohol in their blood).

2/5/15 4:18 PM
201x] DESKTOP PUBLISHING EXAMPLE 123
crash. Less ambiguity exists in a single-car crash; the lone driver’s impairment is much more likely to have been a causal factor.113 –. A full half (41) of the 83 fatally injured drivers in single-car crashes during the period, who had died and been tested within four hours of their crash, had a BAC of .15% or more. Another 20% (17) had a BAC between .05 and .14%, and only 3 of 83 drivers had non-zero BACs below .05%.114 The study had been the first since the 1930s to provide a scientific basis for the claim that certain BACs were actually a frequent cause of car crashes.115
Haddon next performed a classic case-control study of fatal crashes in New York City in 1962. He compared the BACs of New York drivers killed in nighttime car accidents with a control group of drivers at the same time and location who were not involved in accidents.116 By focusing on nighttime crashes, Haddon focused on the period involving the richest data in terms of alcohol and crash risk; that is, when both the percentage of drinking drivers on the road and the percentage of drivers involved in crashes are highest.117 Haddon found that 26% of the control group had a BAC over zero, and none had a BAC at or over .25%.118 In contrast, 73% of those killed had alcohol in their system, and over 50% had BACs at or over .25%.119 While these studies did not definitively connect low levels of intoxication to a specific increase in crash risk, they lay the groundwork by showing that alcohol was a causal factor in crashes.
As Haddon became convinced that a small percentage of drivers were
113. See, e.g., Paul L. Zador, Alcohol-Related Relative Risk of Fatal Driver Injuries in Relation to Driver Age and Sex, 52 J. STUD. ALCOHOL 302, 303 (1991) (“The relative crash risk for drivers fatally injured in single-vehicle crashes provides a good measure of the true contribution of alcohol to increased risk of involvement in the serious crash.”); Kenneth S. Opiela et al., Driving After Dark, 66 PUBLIC ROADS 2 (2003), available at https://www.fhwa.dot.gov/publications/publicroads/03jan/05.cfm (noting that drunk driving rates and fatal accident rates are both highest at night).
114. William Haddon Jr. & Victoria A. Bradess, Alcohol in the Single Vehicle Fatal Accident: Experience of Westchester County, New York, 169 J. AM. MED. ASS’N 1587, 1589 (1959) (explaining that 22 drivers tested negative, therefore leaving 3 drivers who had BACs between 0.01 and 0.05%). Most (63%) of the crashes occurred at night. Id. 115 Haddon also conducted a pedestrian study in 1961. While it did not directly shed light on the relationship between BAC and crash risk, it confirmed that a case-control study could show that the same BACs that generated risk in driving also generated risk in walking. While a group of researchers had published a study on pedestrian deaths and alcohol in 1941, the study merely counted the percentage of pedestrians in fatal car crashes who tested at various BACs, and included no control group. See Thomas A. Gonzales & Alexander O. Gettler, Alcohol and the Pedestrian in Traffic Accidents, 117 J. AM. MED. ASS’N 1523 (Nov. 1, 1941). Haddon, in contrast, compared 50 pedestrians who died in car crashes at particular locations with a control group of 200 pedestrians who had walked safety through the same locations at the same time. While only 33% of the control group had been drinking, 74% of those killed had been drinking. LERNER, supra note 3, at 54. 116 James R. McCarroll & William Haddon Jr., A Controlled Study of Fatal Automobile Accidents in New York City, 15 J. CHRON. DISEASES 811, 811-12 (1962). 117 Haddon did not make these advantages of nighttime study explicit to his readers, but they are evident from later research. See, e.g., M.D. Keall et al., The Contribution of Alcohol to Night Time Crash Risk and Other Risks of Night Driving, 37 Accid. Anal. Prev. 816, 816-17 (2005). 118 Id. at 824.
119. Id.

2/5/15 4:18 PM
124 CALIFORNIA LAW REVIEW [Vol. XX:nnn
causing a large percentage of highway deaths, he sought to end the use of the term “accident” altogether and refer to alcohol-related crashes as a preventable disease.120 Based on Holcomb’s study and his own studies up to that point, he also successfully urged the Rockefeller administration in 1960 to push to make driving with a BAC of .10% or higher an infraction under state law.121 That same year, the NSC’s Committee on Alcohol and Drugs (CAOD) finally lowered its suggested presumptive threshold for DUI from .15% to .10%, and the Uniform Vehicle Code followed suit two years later.122
Still, by 1964, only one state other than New York had actually changed its laws to incorporate the change from .15% to .10%.123 And while Haddon had raised the scientific bar for crash risk studies significantly, there were still few if any studies, besides Holcomb’s, showing the precise level of increased risk of accident at BACs lower than .15%.
Robert Borkenstein himself would finally fill that gap with his famous Grand Rapids Study. Borkenstein took all the 9,353 drivers involved in car crashes in the city of Grand Rapids, Michigan for a twelve-month period in 1962-63 and compared them to a control group of 8,008 drivers who had driven at the same times and locations without being involved in a crash.124 Borkenstein found that drivers with BACs less than .04% were no more likely than sober drivers to be in crashes and, surprisingly, that such a low but non-zero BAC actually lowered one’s chances of being in a crash.125 But he also found that those with a BAC of .08% were nearly twice as likely to be in a crash than similarly situated sober drivers; those with a BAC of .10% were nearly six times as likely; and those at .15% were over ten times more likely.126 Finally, Borkenstein found that injury from a crash increased with the driver’s BAC level, starting at .08%.127
By 1965, the scientific basis for labeling drunk driving a public health emergency had been firmly established by Haddon, Borkenstein, and others. Reacting to the new urgency of the issue, President Johnson created the Department of Transportation (DOT) in 1966 and named Haddon the country’s first “traffic czar,”128 heading up what would eventually be known as the National Highway Traffic Safety Administration (NHTSA). The DOT began requiring the recording of driver BACs in fatal crashes, setting the stage for
120. See LERNER, supra note 3, at 55. 121. Id. at 58.
122 Id. at 59. 123. Id. at 59.
124 R. F. Borkenstein et al., The Role of the Drinking Driver in Traffic Accidents, DEP’T OF POLICE ADMINISTRATION, INDIANA UNIVERSITY (1964).
125. Id. at 213. CAOD would later explain in a 1988 report that this so-called “Grand Rapids Dip,” was simply an “artifact resulting from different mixes of infrequent, moderately frequent, and very frequent drinkers at various [BACs].” National Safety Council, A HISTORY OF THE COMMITTEE ON ALCOHOL AND OTHER DRUGS (CAOD), Appendix, “Policy Statement on Impairment at Low Alcohol Concentrations.” 126 Id. at 213.
127. Id. at 176-77. 128. LERNER, supra note 3, at 60.

2/5/15 4:18 PM
201x] DESKTOP PUBLISHING EXAMPLE 125
further study of dose-related crash risk.129 In addition to influencing federal policy, the Grand Rapids study
convinced several more states to adopt statutory rebuttable presumptions of impairment from BACs over .15%,130 with strong public support.131 By 1969, all but seven states had done so.132 Many states even lowered their presumptive limit from .15 to .10 in response to CAOD’s recommendation to do so.133 Soon, federal laws would link highway funds to the willingness of states both to lower their presumptive threshold and implement so-called “implied consent” laws, requiring stopped motorists to submit to breath testing or have the failure to submit be used against them.134 By the 1960s, a majority of Americans expressed support for implied consent laws,135 and by 1973, every state had one.136
Still, by 1968, only Nebraska had taken the next step and passed a per se law criminalizing the mere act of driving with a BAC over a certain threshold. The remaining states, as well as the Uniform Vehicle Code, still left it to the jury to ultimately decide whether the defendant had been impaired, even at levels as high as .15% and above.137 Moreover, acquittal rates in cases involving BACs below states’ presumptive thresholds, in the meantime, were stubbornly high. Haddon, for one, blamed these high acquittal rates not on a legitimate disagreement among local communities as to whether driving with a BAC six-fold increase in crash risk was morally unacceptable, but on simple public ignorance.
Haddon’s newly formed DOT submitted a strongly worded 1968 report to Congress that became a “seminal document in the emergence of drunk driving as an American social problem.”138 It catalogued the few existing studies concluding that drivers experience impairment at BACs lower than those “at which they outwardly appear to be mildly affected or intoxicated.”139 Yet, as Haddon noted, states often chose not to prosecute DUIs, even those supported by chemical test results, because juries so often acquitted.140 Although a majority of Americans in 1968 believed that penalties for drunk driving were
129. Id. at 61. 130. See Andrew Gore, Know Your Limit: How Legislatures Have Gone Overboard with Per
Se Drunk Driving Laws and How Men Pay the Price, 16 WM. & MARY J. WOMEN & L. 423, 427 (2010)..
131. 1968 REPORT, supra note 8, at 91. 132. William Haddon, The Shocking Facts about Drinking and Driving, POPULAR SCIENCE,
May 1969, at 81. 133. See id.. 134. LERNER, supra note 3, at 61. 135. 1968 REPORT, supra note 8, at 88. 136. BREATH TESTING FOR PROSECUTORS, supra note 92, at 5. 137. 1968 REPORT, supra note 8, at 101, 122. There was some variation among states in
whether the prohibition extended to all alcohol, to merely “alcoholic liquor,” or more broadly to “intoxicants.” Most states eventually adopted a broad definition prohibiting driving “under the influence” of an intoxicating substance. Id. at 102.
138. JACOBS, supra note 5, at 27. 139. 1968 REPORT, supra note 8, at 45. 140. Id. at 103.

2/5/15 4:18 PM
126 CALIFORNIA LAW REVIEW [Vol. XX:nnn
too lenient,141 only 10% “felt that there was something bad or inherently stupid about the drinking driver.”142 Even when jurors thought it likely that the defendant had been driving while intoxicated, they would often acquit absent evidence that the defendant was a “hard core” or “problem” drinker.143 Some people still believed that low concentrations of alcohol actually “sharpen[ed]” driving ability.144
In his zeal to prove to Congress the enormity of the problem, Haddon played somewhat fast and loose in his description of existing studies. Lumping together the data from several small regional studies of fatal crashes, for example, Haddon declared that “almost half of the drivers were found to have [BACs] of .10 or greater,” although he had rightfully criticized others for drawing causal inferences based simply on number of crashes involving alcohol. Other claims made in the report – such as that “alcohol has been found to be the largest single factor leading to fatal crashes,” were unsupported by citation and simply inaccurate.145 In a follow-up report to Congress ten years later, The DOT was much more modest in its claims, concluding that “it is impossible to state conclusively that impairment of the ability to perform critical driving tasks by alcohol has caused any given fraction of crashes involving alcoholics or problem drinkers.”146
Whatever his reasons for embellishing the data in this way, Haddon used these dramatic claims to urge Congress to incentivize states to lower the presumption of impairment to .10 or, better yet, to pass per se laws defining impairment directly in terms of BAC. The United Kingdom had passed a similar law in 1967,147 and Haddon noted its effectiveness in increasing the conviction rate:
Such a [per se] statute eliminates the concepts of intoxication or impairment of driving ability altogether. Once the prohibited [BAC] has been competently put into evidence, the defense lawyer may only attack the correctness of the evidence, and should seldom succeed where the system employed has been carefully established. Overly sympathetic juries can be restrained by strict instructions to convict if the laboratory evidence is found to be valid. Trials can be shorter, saving the resources of police who would otherwise act as witnesses, and of the courts themselves. Experience under the English [per se .08] statute has shown a significantly higher rate both of guilty pleas
141. Id. at 88. 142. Id. at 90 (emphasis added). 143. See id. at 103. A study cited by Popular Science in 1958 noted that while the public
disapproved of drunk driving, “indignation was reserved for flagrant, not technical, violations— . . . not just one or two drinks.” What do motorists really believe about safety?, POPULAR SCIENCE, Oct. 1958, at 20.
144. Haddon (1969), supra note 119, at 81. 145. JACOBS, supra note 5, at 205 n.2. 146. Ralph K. Jones & Kent B. Joscelyn, Alcohol and Highway Safety 1978: A Review of the
State of Knowledge, HIGHWAY SAFETY RESEARCH INST. 41-42 (1978). 147. 1968 REPORT, supra note 8, at 106 (citing Road Safety Act of 1967).

2/5/15 4:18 PM
201x] DESKTOP PUBLISHING EXAMPLE 127
and of convictions after a full trial.148 Though few states moved immediately to a per se regime as a result of
Haddon’s report, its vehemence and scientific approach would lend legitimacy years later to arguments for per se laws and for lowering the limit to .08%, when the political climate was more conducive to passing such laws. In essence, it changed the national conversation on drunk driving and low-level intoxication. Not surprisingly, CAOD in 1971 recommended lowering the presumptive BAC for impairment from .10 to .08%,149 and in 1975 recommended that states define their presumptions as being triggered by either .08% BAC or .08% breath-alcohol concentration (BrAC), to rebut numerous defendants’ assertions that their own bodily BAC/BrAC ratio was not the one assumed by the Breathalyzer in its conversion from BrAC to BAC, and thus that a .08% test result did not prove a BAC of .08%.150
Haddon and his approach also legitimated, in the name of public health, the shaming of drunk driving “apologists.” The Licensed Beverage Industries (LBI), a trade group representing the liquor industry, ran a controversial magazine ad in 1970 that included a chart of the number of drinks one could imbibe and still “drive safely,” based on body weight.151 The NSC and AMA complained to the LBI about the ad, noting that while following the chart might allow you to remain slightly under most states’ legal intoxication limit of .10% BAC, that level still left one impaired and unsafe to drive.152 Four months after the ad ran, the Department of Transportation sent a letter to LBI noting the difference between being “safe from breaking the law” and “safe from having an automobile crash.”153 While states and jurors might not be ready to declare BACs lower than .10% as criminal, the Department warned, no one should be declaring such levels of intoxication “safe” for driving.
4. The Punitive Turn in the 1980s and the Final Push Toward .08% Even with the prodding of the DOT, most states before 1980 were in no
hurry to pass per se laws, turn DUI offenses into felonies,154 or lower their BAC thresholds to .08. Public support for such laws was not universal, and legislators’ own views of the social harm from low-level impairment, and the desirability of increasing police power over motorists, were varied. Moreover, the scientific community and criminologists were divided at the time as to whether the increased crash risk from .08% BAC was sufficiently scientifically proven, was morally blameworthy, or would have any deterrent effect on would-be impaired drivers.155
148. 1968 REPORT, supra note 8, at 122. 149. BREATH TESTING FOR PROSECUTORS, supra note 92, at 5. 150. See People v. Vangelder, 58 Cal. 4th 1, 21 (2013)..
151 LERNER, supra note 3, at 66. 152 Id. at 66-67.
153. Id. at 67. 154. See 1968 REPORT, supra note 8, at 103 (noting that generally all DUI offenses as of 1968
were misdemeanors). 155. See, e.g., U.S. GEN. ACCOUNTING OFFICE, HIGHWAY SAFETY: EFFECTIVENESS OF

2/5/15 4:18 PM
128 CALIFORNIA LAW REVIEW [Vol. XX:nnn
In 1980, with the formation of the politically formidable groups Mothers Against Drunk Driving (MADD) and Remove Intoxicated Drivers (RID), the public conversation about DUI – as with other drug crimes – began to shift away from public health and toward a law-and-order approach.156 MADD originally focused primarily on fighting local practices of lenient sentences and plea deals, giving a voice to victims in the criminal process, and lowering the legal BAC below .15% in those states that still had a .15% standard.157 In making its case, most if not all of the anecdotes MADD highlighted involved obviously intoxicated drivers who received very light sentences even after causing serious injury or death.158
MADD’s national presence and influence culminated in the creation of new federal and state apparatuses to combat drunk driving. By 1984, Ronald Reagan had created a Presidential Commission on Drunk Driving and signed federal legislation linking highway funds to states lowering their legal limit to .10% BAC, imposing stiffer penalties on those convicted, and raising the legal drinking age from 18 to 21.159 Between 1981 and 1986, 729 new state DUI laws were passed.160 While some officials from the Haddon public-health-model era did not fully approve of the wave of punitive legislation, historian Barron Lerner has noted that the new laws were “congruent with Reagan-era efforts to fix social issues through the criminal justice system . . . .”161
In 1986, prominent sociologist J. Laurence Ross and law professor Graham Hughes took on MADD’s claim that a significant decline in crash fatalities from 1980 to 1985 was due to law-and-order drunk driving reform efforts.162 There seemed to be dispute that the number of deaths attributed to drunk driving dropped significantly in the wake of many of the policies MADD and RID helped to pass.163 But these reforms were of many types: public education on the dangers of drunk driving; cultural shifts away from the romanticization of alcohol use; fewer lenient plea deals; more jail time; swifter and more certain penalties; more frequent administrative sanctions such as
STATE .08 BLOOD ALCOHOL LAWS 2 (1999), available at http:www.gao.gov/archive/1999/rc99179.pdf [hereinafter Highway Safety]; Andrew Gore, Know Your Limit: How Legislatures Have Gone Overboard with Per Se Drunk Driving Laws and How Men Pay the Price, 16 WM. & MARY J. WOMEN & L. 423, 428 (2010).
156. See LERNER, supra note 3, at 75-78; see generally MICHELLE ALEXANDER, THE NEW JIM CROW (2010).
157. See, e.g., LERNER, supra note 3, at 77. 158. See, e.g., id. at 73-74.
159 Id. at 89-90. 160 Id. at 89.
161. Id. at 90-91 (citing Jonathan Simon, GOVERNING THROUGH CRIME: HOW THE WAR ON CRIME TRANSFORMED AMERICAN DEMOCRACY AND CREATED A CULTURE OF FEAR (2007). See also Craig Reinarman, The Social Construction of an Alcohol Problem: The Case of Mothers Against Drunk Drivers and Social Control in the 1980s, 17 THEORY & SOCIETY 91, 92 (1988) (noting that MADD’s agenda fit the “social-control strategies of the Reagan administration and a renascent right).
162. See H. Laurence Ross & Graham Hughes, Drunk Driving: What Not To Do, THE NATION, Dec. 13, 1986. 163 See, e.g., Lerner, supra note 3, at 91 (noting a reported 32% drop from 1980 to 1985 in deaths attributed to drunk driving).

2/5/15 4:18 PM
201x] DESKTOP PUBLISHING EXAMPLE 129
license revocation; banning happy hours; and nonalcoholic sporting events and graduations. Ross and Hughes argued that the decline could be due to these and other causes, such as “reduced speed limit, safer cars, better roads with better lighting [and] improvements in medical techniques and in the delivery of emergency medical services.”164
At the same time, the public’s attention was “turning elsewhere” from drunk driving, as the AIDS epidemic and other new social problems emerged.165 It would take “one last push” by a government official, then-surgeon general C. Everett Koop, to remind the public that drunk driving was a critical public health issue.166 Koop held a workshop at the Mayflower Hotel in Washington, D.C. in December 1988, in which he argued for a shift to .08%. The workshop itself was a reaction to a tragedy the night of May 14, 1988, in which a driver with a BAC of .24% in Carrollton, Kentucky was driving on the wrong side of an interstate and crashed into a school bus, which then burst into flames, killing 27 children coming home from a church trip.167
Still, by 1994, only 12 states had reduced their limit to .08%, and the beverage industry fought Koop’s plan. In an ironic twist, the industry made two MADD founders, Cindi Lamb and Candy Lightner, its spokewomen. Lightner argued publicly that the vast majority of drunk driving offenders had BACs well over .08%, including the driver that killed her daughter, and that the push to lower limits to .08% from 10% would “dilute[] law enforcement efforts” against “truly dangerous drivers.”168 Lightner also argued that lowering speed limits would save more lives than lowering BACs.169 The American Beverage Institute went further, calling the push for .08% “neoprohibitionism,” and warning that calls for a .05% limit could not be far behind.170 An editorial in the Washington Times declared the push for .08% a “prohibitionist jihad driven by hysteria, not medical reality.”171
Academics also entered the fray as skeptics. Drawing on the earlier work of Gusfield and Ross, several criminologists from the late 1980s to the early 2000s argued that criminalizing BACs under .10% made little sense both in light of the limits of law enforcement and goals of the criminal law. Some argued that criminalizing driving at low BACs could only be justified on deterrence grounds, not moral blameworthiness grounds, given the modest increase in crash risk, and that even if the data showed that punitive DUI laws were effective, deterrence alone was an insufficient basis for invoking the criminal law.172 Others argued that the increased risk of a crash based on a
164 Ross & Hughes, supra note 162, at 664. 165 Lerner, supra note 3, at 115. 166 Id.
167. LERNER, supra note 3, at 125. 168. Id. at 128 (quoting Katherine Griffin, No Longer MADD, THIS WORLD, Aug. 7, 1994, at
6, 7; see also Doug Bandow, Targeting the Most Dangerous Drunk Drivers, WASH. TIMES, Jan. 28, 1994, at A23); Connie Koenenn, The Company She Keeps, L.A. TIMES, Jan. 26, 1994, at I.
169. LERNER, supra note 3, at 128. 170. Id. at 136. 171. Power MADD, WASH. TIMES, Mar. 6, 2000, at A16. 172. See, e.g., James D. Stuart, Deterrence, Desert, and Drunk Driving, 3 PUBLIC AFFAIRS

2/5/15 4:18 PM
130 CALIFORNIA LAW REVIEW [Vol. XX:nnn
BAC of .08% was simply not high enough to warrant punishment, given that the “overwhelming majority of impaired drivers caused no harm.”173 Law professor James Jacobs, in his seminal 1989 book on drunk driving, argued that focusing attention on “light drinkers” would “undermin[e] the effort to identify and isolate drunk driving as a major problem.”174 Others argued that per se laws set at low BACs gave insufficient notice to potential offenders, that driving after moderate drinking was a commonplace and morally accepted activity that therefore should not be criminalized; and that they arbitrarily set a numerical line that did not correlate with actual impairment.175
Amid this debate came yet another tragedy that would revive the political viability of reducing the legal limit to .08%: Princess Diana’s death in 1997 in Paris during a high-speed car chase with paparazzi. Notably, though, Diana’s driver’s BAC was .2275%.176 Nevertheless, MADD and numerous state legislators seized upon the episode to push the .08% issue once again; one bill introduced in New York to lower the limit from .10% to .08% was even dubbed the “Diana bill.”177 In contrast, the general counsel of the American Beverage Institute countered that Diana “was killed by an alcohol abuser, not a social drinker.”178
Nevertheless, the momentum for the switch to .08% was enough to convince President Clinton in 2000 to sign a bill withholding highway funds from the 31 states that had not yet adopted a .08% standard.179 Meanwhile, an influential metastudy by NHTSA and the CDC in 2001 found a 7% decrease in traffic deaths in states with .08%, and a 3.8 to 24% decrease in fatal crashes in states with zero-tolerance laws for minors.180 By 2004, three years after this report, all fifty states and the District of Columbia had per se offenses set at 0.08% BAC.181
B. Haddon’s Legacy: A Compulsory Scientific Framework for Proving Criminally Dangerous Impairment
The Haddon-era DUI alcohol model established how to determine, through valid science, the relationship between impairment and dangerousness. The scientific framework underlying per se DUI alcohol laws was, and continues to be, the standard against which drug impairment as a fatality risk must be judged. Those who hope to use the criminal law as an instrument of
QUARTERLY 105, 109 (1989).
173. LERNER, supra note 3, at 129. 174. JACOBS, supra note 5, at 43. 175. See, e.g., Douglas N. Husak, Is Drunk Driving a Serious Offense? 23 PHILOSOPHY AND
PUBLIC AFFAIRS 52, 71-73 (1994). 176. LERNER, supra note 3, at 133-34 (citing Andrea Stone, Diana Invoked in Alcohol Bill,
USA TODAY, Sept. 4, 1997, at 8A). 177. Id. at 134. 178. Rick Berman, MADD Doesn’t Differentiate Between Drunks and Social Drinkers,
WASH. TIMES, Sept. 26, 1997, at A18. 179 LERNER, supra note 3, at 145.
180. Id. 181. Id. at 145.

2/5/15 4:18 PM
201x] DESKTOP PUBLISHING EXAMPLE 131
public safety by setting a scientific standard for “impairment” through measurement of levels of a drug in the body must do so in a certain way to claim any validity. That way is through systematic study of single-car fatal crashes, particularly at night, and case-control studies comparing drug levels of fatal crash victims with those of a group of randomly selected drivers under similar circumstances. Those studies are the “smoking guns” for linking levels of intoxication to dangerousness for purposes of the criminal law. Without them, the venerable .08% standard would be illegitimate under a jurisprudence of dangerousness.
A casual observer might be tempted to argue that even DUI alcohol laws have veered away from Haddon’s framework, citing (1) the adoption of .08% even amid scientific controversy, coupled with recent calls from public officials to lower the limit even further to .05%, and (2) zero-tolerance DUI laws for minors. Even these examples, however, fit within the framework.
1. The controversy over .08% and calls to lower the limit to .05% While .08% was controversial, as evidenced by high DUI acquittal rates
that linger to this day,182 its advocates purported to rely on the established framework in justifying the law under a science-based jurisprudence of dangerousness. Holcomb’s 1938 paper had suggested that BACs higher than .06% increased crash risk and, while the paper was problematic, the Grand Rapids Study confirmed this result. As Borkenstein himself wrote in a follow-up paper in 1974, “[t]he probability of accident involvement increases rapidly at BACs over .08%.”183 And while the Grand Rapids Study was essentially the last case-control study of crash risk before the wave of .08% laws were passed in 2004, two subsequent, large-scale case-control studies by Blomberg et al. (2005) and Krüger and Vollrath (2005) have confirmed that significant relative risk increases begin at .08%.184 The authors, like Borkenstein and Haddon, took care to explain the need for a true control group that mirrors the driver group in every way other than BAC, including season, direction of travel, day of week, time of day, and precise location.185
A casual observer might also mistake ongoing governmental efforts over
182. See generally Rebecca Snyder Bromley, Jury Leniency in Driving and Driving Cases:
Has It Changed? 1958 versus 1993, 20 L. & PSYCH. REV. 27 at 42 Table 1 (1996) (finding jury acquittal rates in Colorado of 39% and judge acquittal rates of 27%); R.J. Cinquegrana, REPORT TO THE SUPREME JUDICIAL COURT 6-7, 55 (Oct. 2012) (hereinafter MASS. REPORT (2012)] (observing that jury acquittal rates were nearly 60%, and judicial acquittal rates in some counties were over 80%).
183. Robert F. Borkenstein et al., The Role of the Drinking Driver in Traffic Accidents, 11 BLUTALKOHOL 1 (1974).
184. Richard D. Blomberg et al., Crash Risk of Alcohol Involved Driving: A Case-Control Study – Final Report, Dunlap & Assoc. 6-7, 28-38, 70 (Sept. 2005), available at www.dunlapandassociatesinc.com/crashriskofalcoholinvolvedddriving.pdf (noting the lack of case-control studies since Grand Rapids, and publishing a study based on 1997-99 crash data (2,871 crashes) and data from thousands of randomly stopped drivers at similar times, days, and locations in California and Florida, concluding that drivers at .08% were 2.69 times more likely than sober drivers to be in an accident); H-P. Krüger & M. Vollrath, The Alcohol-Related Accident Risk in Germany: Procedure, Methods, and Results, 36 ACCID. ANAL. & PREV. 125, 131 (2004) (finding an OR of 2.8 for BACs from .05-.079 and an OR of 15.1 for BACs from .08-.159).
185. See Blomberg et al., supra note 165, 7.
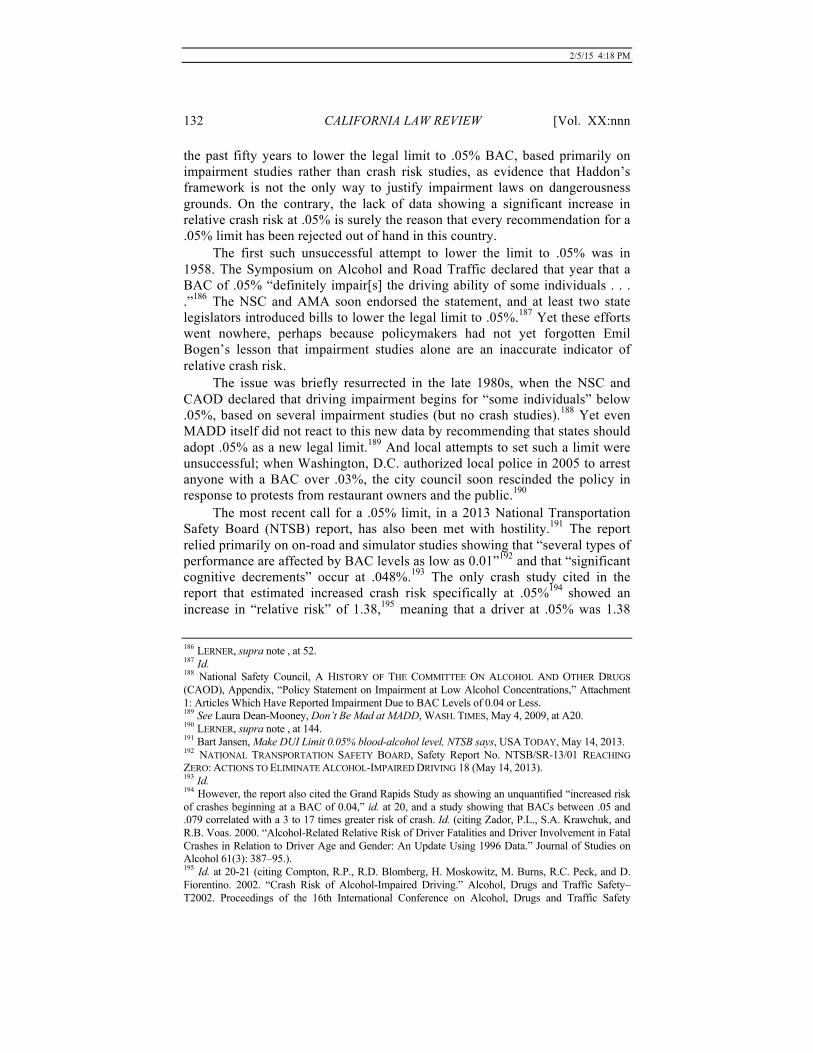
2/5/15 4:18 PM
132 CALIFORNIA LAW REVIEW [Vol. XX:nnn
the past fifty years to lower the legal limit to .05% BAC, based primarily on impairment studies rather than crash risk studies, as evidence that Haddon’s framework is not the only way to justify impairment laws on dangerousness grounds. On the contrary, the lack of data showing a significant increase in relative crash risk at .05% is surely the reason that every recommendation for a .05% limit has been rejected out of hand in this country.
The first such unsuccessful attempt to lower the limit to .05% was in 1958. The Symposium on Alcohol and Road Traffic declared that year that a BAC of .05% “definitely impair[s] the driving ability of some individuals . . . .”186 The NSC and AMA soon endorsed the statement, and at least two state legislators introduced bills to lower the legal limit to .05%.187 Yet these efforts went nowhere, perhaps because policymakers had not yet forgotten Emil Bogen’s lesson that impairment studies alone are an inaccurate indicator of relative crash risk.
The issue was briefly resurrected in the late 1980s, when the NSC and CAOD declared that driving impairment begins for “some individuals” below .05%, based on several impairment studies (but no crash studies).188 Yet even MADD itself did not react to this new data by recommending that states should adopt .05% as a new legal limit.189 And local attempts to set such a limit were unsuccessful; when Washington, D.C. authorized local police in 2005 to arrest anyone with a BAC over .03%, the city council soon rescinded the policy in response to protests from restaurant owners and the public.190
The most recent call for a .05% limit, in a 2013 National Transportation Safety Board (NTSB) report, has also been met with hostility.191 The report relied primarily on on-road and simulator studies showing that “several types of performance are affected by BAC levels as low as 0.01”192 and that “significant cognitive decrements” occur at .048%.193 The only crash study cited in the report that estimated increased crash risk specifically at .05%194 showed an increase in “relative risk” of 1.38,195 meaning that a driver at .05% was 1.38 186 LERNER, supra note , at 52. 187 Id. 188 National Safety Council, A HISTORY OF THE COMMITTEE ON ALCOHOL AND OTHER DRUGS (CAOD), Appendix, “Policy Statement on Impairment at Low Alcohol Concentrations,” Attachment 1: Articles Which Have Reported Impairment Due to BAC Levels of 0.04 or Less. 189 See Laura Dean-Mooney, Don’t Be Mad at MADD, WASH. TIMES, May 4, 2009, at A20. 190 LERNER, supra note , at 144. 191 Bart Jansen, Make DUI Limit 0.05% blood-alcohol level, NTSB says, USA TODAY, May 14, 2013. 192 NATIONAL TRANSPORTATION SAFETY BOARD, Safety Report No. NTSB/SR-13/01 REACHING ZERO: ACTIONS TO ELIMINATE ALCOHOL-IMPAIRED DRIVING 18 (May 14, 2013). 193 Id. 194 However, the report also cited the Grand Rapids Study as showing an unquantified “increased risk of crashes beginning at a BAC of 0.04,” id. at 20, and a study showing that BACs between .05 and .079 correlated with a 3 to 17 times greater risk of crash. Id. (citing Zador, P.L., S.A. Krawchuk, and R.B. Voas. 2000. “Alcohol-Related Relative Risk of Driver Fatalities and Driver Involvement in Fatal Crashes in Relation to Driver Age and Gender: An Update Using 1996 Data.” Journal of Studies on Alcohol 61(3): 387–95.). 195 Id. at 20-21 (citing Compton, R.P., R.D. Blomberg, H. Moskowitz, M. Burns, R.C. Peck, and D. Fiorentino. 2002. “Crash Risk of Alcohol-Impaired Driving.” Alcohol, Drugs and Traffic Safety–T2002. Proceedings of the 16th International Conference on Alcohol, Drugs and Traffic Safety

2/5/15 4:18 PM
201x] DESKTOP PUBLISHING EXAMPLE 133
times more likely to be in a crash than a sober driver.196 While the report labels this number a “significant[] increase[],”197 policymakers, industry, and the public appear to disagree. The Governors Highway Safety Association formally opposed the recommendation,198 and a USA Today editorial expressed concern that “lowering the legal limit would turn a lot of responsible social drinkers into criminals.”199 The American Beverage Institute (ABI) predictably derided the recommendation as “ludicrous.”200
Any argument that a .05% criminal DUI law would be “ludicrous” rests on two hidden premises. First, that the law would be part of a jurisprudence of “dangerousness” rather than “prohibition.” If the penal purpose of a .05% law were to enforce a prohibition on alcohol, such as Saudi Arabia’s zero-tolerance DUI alcohol law,201 then the failure to link .05% with significant increased crash risk would not be an issue, and the law would be legitimately related to its penal purpose. Thus, enforcing a .05% limit for underage drinkers would presumably meet with little resistance. The second hidden premise underlying the arguments against a .05% limit is that, under a jurisprudence of dangerousness, the relative crash risk associated with.05% is not significant enough to merit criminal punishment. It is true that a variety of other driving behaviors also modestly increase the relative risk of crash, such as driving with a cell phone and hands free device, which by one study is the equivalent of driving at .08% in terms of relative increased crash risk;202 driving 80 miles per hour in a 65 mile per hour zone;203 driving with a hangover;204 and driving on little sleep.205 While one might argue that driving under these conditions also (August 4–9, 2002). Montreal, Canada: International Council on Alcohol, Drugs and Traffic Safety. 196 See, e.g., What Researchers Mean by… Absolute and Relative Risk, Institute for Work & Health, http://www.iwh.on.ca/wrmb/absolute-and-relative-risk. “Relative risk” of crash - the ratio of the risk of crash at a certain BAC or THC level compared to a control group of sober drivers under similar conditions – is different from “absolute risk,” the probability of being involved in a crash at a certain BA or THC level. A driver at a .15% BAC might have a high “relative risk” of crash compared to a sober driver – say, a relative risk of 10, or 10 times more likely than a sober driver to crash, but might still have only a modest “absolute risk” of crashing – say, 10% - based on that level of impairment. Cf. id. 197 Id. at 21. 198 Jansen, supra note Error! Bookmark not defined.. 199 Don’t lower blood alcohol content to .05%: Our view, USA TODAY, May 30, 2013. 200 Jansen, supra note 171.. 201 See http://apps.who.int/gho/athena/data/GHO/SA_0000001520.html?profile=ztable&filter=COUNTRY:*;BACGROUP:* (World Health Organization database of all countries’ BAC limits; over 100 are .05% or below) [hereinafter WHO database]. 202 A 1997 study found that drivers using cell phones, even if using a hands-free device, were four times more likely to crash than other drivers. Donald A. Redelmeier & Robert J. Tibshirani, Association Between Cellular-Telephone Calls and Motor Vehicle Collisions, 336 NEW ENGLAND J. MED. 453, 456 (1997). 203 See, e.g., Letty Aarts & Ingrid van Schagen, Driving Speed and the Risk of Road Crashes: A Review, 38 ACCIDENT ANALYSIS & PREVENTION 215, 220-22 (2006). 204 “If you drink, don’t drive” motto now applies to hangovers as well, J. AM. MED. ASSOC., Oct. 7, 1983, at 1657 (describing a study indicating that a hangover may “diminish driving ability by as much as 20%”), 205 See, e.g., James M. Lyznicki et al., Sleepiness, Driving, and Motor Vehicle Crashes, 279 J. AM. MED. ASSOC. 1908, 1909 (June 17, 1998) (citing studies claiming that sleepiness is the “principal

2/5/15 4:18 PM
134 CALIFORNIA LAW REVIEW [Vol. XX:nnn
merits criminal punishment, the American justice system treats them at worst as administrative, rather than criminal, offenses.
While a few other countries claim to have a dangerousness-based .05% limit, such countries appear to be operating under inaccurate assumptions about crash risk or to have a different moral conception of the level of risk deserving punishment. For example, Norway’s conspicuous embrace of a .05% limit as early as 1936 rested on a “loose foundation,” in the words of DUI research pioneer Johannes Andenaes. In the debate preceding the law’s adoption, members of Parliament made sweeping claims that a “deplorably large part” of car accidents were “caused by the driver being under the influence” or occurred “because of drunkenness.”206 As Andenaes notes, “it seems that none of the speakers had any systematic material on which to base their statements.”207 Nonetheless, the law remains, substantially unchanged, eighty years later.
Given this state of affairs, one might reasonably speculate that the true motivation for the recent push for a .05% limit is not so much a concern with marginal increase in relative crash risk at .05%, but rather to ride the penal momentum that led from .15% to .10% to .08%, in an effort to secure more convictions through ever more conviction-friendly bounds of criminality.
2. Zero-tolerance laws for minors. A casual observer might also invoke zero-tolerance DUI laws for minors
as evidence that Haddon’s framework is not the only way to justify a dangerousness-based impairment law. And it is true that such laws are not backed up by compelling proof of minors’ significantly increased relative crash risk at low BACs. As it turns out, though, such laws are sui generis, reflecting both a partial jurisprudence of prohibition and an intuitive assumption – modestly supported by crash data – that the unique combination of minority status and non-zero (even if low) BAC is presumptively dangerous. Surely it is precisely because these laws are near the cusp of what is scientifically supportable under Haddon’s framework, and thus near the cusp of morally blameworthy conduct, that they have been controversial and minimally enforced.208
The short history of these laws – less than forty years – makes clear the unique and precarious justification underlying their adoption. Before the 1970s, most states had a drinking age of 21, and no special DUI laws for minors.209 Between 1970 and 1976, twenty-nine states lowered their drinking age to 18, presumably in response to the voting age being lowered to 18 by the Twenty-
causative factor in about 100,000 police-reported crashes each year in the United States”). 206 Johannes Andenaes, The Effects of Scandinavia’s Drinking-and-Driving Laws, 6 Scandinavian Studies in Criminology 35, 47-48 (1978) (emphasis added). 207 Id.
208. See, e.g., Susan A. Ferguson, Comment on ‘Low BAC Policies: Results and Mechanisms, INSURANCE INSTITUTE FOR HIGHWAY SAFETY, Sept. 2001, available at http://www.iihs.org/frontend/iihs/documents/masterfiledocs.ashx?id=1714. 209 Many states have had a minimum drinking age of 21 since the repeal of Prohibition. See Robert B. Voas et al., Assessing the Effectiveness of Minimum Legal Drinking Age and Zero Tolerance Laws in the United States, 35 Acc. Anal. & Prev. 579, 580 (2003).

2/5/15 4:18 PM
201x] DESKTOP PUBLISHING EXAMPLE 135
sixth Amendment.210 Upon seeing a subsequent increase in alcohol-related fatal crashes in 18 to 21-year-olds, some states in the 1980s reversed course and reimposed a drinking age of 21. As a result of this mish-mash of state drinking-age laws, young people between ages 18 and 21 in states with an age of majority of 21 had an incentive to drive to neighboring states with a drinking age of 18 to get legal alcohol, often leading them to drive home intoxicated.
While the research on youth and relative crash risk was nascent in the early 1980s, researchers were already aware that drinking drivers under age 21 were overrepresented among fatal car crash victims even though the incidence of drinking among randomly stopped young drivers was lower than among adult drivers.211 The Grand Rapids Study had found no predictable relationship between increased crash risk and age groups at varying BACs, but did find that the youngest and oldest drivers were the only groups with an increased relative risk at BACs lower than .05%.212 In addition, a study in 1983 comparing randomly stopped nighttime drivers with fatally injured nighttime drivers had shown that minors’ higher relative risk of crash occurred at all BAC levels.213 One clear reason for this disparity, independent of minors’ proclivity for drinking and driving, was simply their relative lack of driving skill and their tendency to drive during particularly hazardous times of day.214
The increasing number of youth crash fatalities, whatever its cause, put the problem of underage drinking and driving on the map and justified the federalization of alcohol laws to remove any incentive for youth to cross state lines to buy alcohol. Congress enacted the National Minimum Drinking Age Amendment in 1984 to coerce states, through withholding of highway funds, to raise their drinking age to at least 21.215 Ultimately, then, the raising of the drinking age nationwide to 21 was based not on a moral judgment against those under 21 ingesting alcohol, but on the safety issues caused by lack of uniformity among states. Still, the subsequent wave of zero-tolerance DUI laws for those under 21 was at least partially prohibitionist, intending to deter alcohol use by those just beginning to learn to drive.216
At the same time, zero-tolerance laws were also supported – if only
210 JACOBS, supra note 4, at 174. 211 See, e.g., id. at 47-48 (citing Alexander C. Wagenaar, ALCOHOL, YOUNG DRIVERS, AND TRAFFIC ACCIDENTS (1983); R. Farris et al., A Comparison of Alcohol Involvement in Exposed and Injured Drivers: Phases I and II, NHTSA TECH. REP. DOT-HS-801-826 (1976); M.W. Perrine, The Vermont Driver Profile: A Psychometric Approach to Early Identification of Potential High-Risk Drinking Drivers, in ALCOHOL, DRUGS, AND TRAFFIC SAFETY (S. Israelstam & S. Lambert, eds., 1975)). 212 See Borkenstein et al. (1974), supra note 164, at 143-154. 213 D.R. Mayhew & H.M. Simpson, Alcohol, Age, and Risk of Road Accident Involvement, PROCEEDINGS OF THE 9TH INT’L CONF. ON ALC., DRUGS & TRAFFIC SAFETY, at 937 (1983). 214 See JACOBS, supra note 4, at 177 (citing Wagenaar (1983) and Zylman (1973)); Cameron (1982) at 9 (noting that young drivers were more likely than adults to drive at night). 215 See National Minimum Drinking Age Amendment, 23 U.S.C. § 158 (1982 ed.). 216 Officials were keenly aware of the advantages of “phasing” the legal driving and drinking ages so they would not coincide, to ensure that minors did not learn to drink and drive at the same time. As Frank Zimring has noted, drinking and drinking are two activities that probably should not begin at the same time in a young person’s life. FRANK ZIMRING, THE CHANGING LEGAL WORLD OF ADOLESCENCE 108-110 (1982).

2/5/15 4:18 PM
136 CALIFORNIA LAW REVIEW [Vol. XX:nnn
modestly so – by crash studies showing that minors had higher relative crash risks at low BACs than adults.217 But the increased risk even for minors at low BACs was not particularly significant, and the push for zero-tolerance laws may not have succeeded without MADD adding them to its agenda by the early 1990s and deploying dramatic anecdotes of underage crash victims.218 Between 1983 and 1990, whether as a result of minimum drinking age, crash risk studies, MADD’s influence, or the convergence of these factors, ten states passed new laws setting special low or zero BAC limits for minors.219
Beginning in the 1990s, the NHTSA’s 1986 nationwide roadside breath-testing survey, the first of its kind since 1973, made possible another wave of research on age, BAC, and fatal crash risk.220 One 1991 study compared the 1986 survey data with federal Fatality Analysis Reporting System (FARS) data from single-car crashes in 1985 and 1986 and found that male drivers under age 21 had relative crash rates at least three times those of adult male drivers, for every BAC level. Males aged 16 to 20 were 5.8 times more likely to crash than male adult drivers at non-zero BACs under .02%; 5.5 times more likely at BACs between .02 and .04%; and 12.3 times more likely at BACs between .05% and .09%.221 The studies also further cemented the link between age and significant increases in crash risk overall. A 1994 study examining FARS data from the early 1990s showed that, while 17% of all fatal single-vehicle nighttime crashes “involved” alcohol, the percentage rose to 52% when limited to drivers aged 15-20.222
Following this next wave of research, and building on the momentum begun by MADD, numerous other states in the early 1990s passed zero-tolerance laws. By 1994, a majority of states had enacted them,223 and by 2004, all 50 states had done so.224
Recent crash risk studies that question the significance of minors’ increased crash risk at low BACs have rekindled the debate over zero-tolerance
217 A 1986 study compared fatal crash data and roadside surveys and confirmed that minors’ crash risk rose at a higher rate beginning at lower BACs. See D.R. Mayhew et al., Youth, Alcohol and Relative Risk of Crash Involvement, 18 ACCID. ANAL. & PREV. 273, 279-81 (1986). 218 See LERNER, supra note 3, at 123-24. 219 See Ralph Hingson et al., Lower Legal Blood Alcohol Limits for Young Drivers, 109 PUBLIC HEALTH REPORTS 738, 739 (1994) (noting two states with .05%; one state with .04%; three states with .02%; and four states with zero). 220 The first such nationwide roadside survey was conducted in 1973, by the NHTSA. The second was in 1986, by the Insurance Institute for Highway Safety (IIHS). And the third, in 1996, was funded jointly by the NHTSA and IIHS. See NHTSA, Pilot Test of New Roadside Survey Methodology for Impaired Driving, 6, Jan. 2007, available at http://www.nhtsa.gov/people/injury/research/pub/HS810704/index.html. 221 Zador (1991), supra note 106, at 306. 222 Hingson et al. (1994), supra note 198, at 741-43.
223 See Id., at 739 (listing numerous states and passage dates). 224 See NHTSA, Background, YOUTH IMPAIRED DRIVING MANUAL FOR SHERIFFS (Tuesday, Nov. 11 2014, 3:55 PM), http://www.nhtsa.gov/people/injury/alcohol/Sherrifs%20Web/background.html..

2/5/15 4:18 PM
201x] DESKTOP PUBLISHING EXAMPLE 137
laws’ legitimacy and effectiveness.225 While NHTSA materials frequently claim that over 30% of youth fatalities in crashes are “related” to or “involve” alcohol,226 this statistic does not show that drivers under 21 at low BACs are more likely to crash than a sober driver, or an adult driver at the same BAC. Indeed, in 2007, only 5% of drivers 15 to 20 years old killed in crashes had a BAC under .08%, which may well be less than or equal to the percentage of randomly selected young drivers at that BAC range.227
Now, zero-tolerance laws are not widely enforced,228 perhaps because of a realization that a twenty-year-old driving at a .01% BAC, while breaking the underage drinking law, does not deserve a stigmatizing DUI conviction. Moreover, the data on whether such laws reduce fatal crashes is inconsistent.229 On one theory, zero-tolerance laws might even be counterproductive; although they create a strong disincentive to take a first drink, they might actually negate any incentive to stop drinking before one’s BAC rises even farther.230 At the very least, such laws clearly represent the high-water mark with respect to what
225 A comprehensive 2005 NHTSA study found, at least at BACs less than .12%, no difference in crash risk between adults and minors. See, e.g., Blomberg et al. (2005), supra note 165, at 79. The same researchers in 2007 reran this data and concluded that there was, indeed, a statistically significant difference in crash risk between drivers 20 years old or younger and adults at BACs lower than .08%. See R.C. Peck et al., Improved Methods for Estimating Relative Crash Risk in a Case-Control Study of Blood Alcohol Levels, 2007 PROCEEDINGS OF THE INTERNATIONAL COUNCIL ON ALCOHOL, DRUGS, AND TRAFFIC SAFETY, available at http://icadts2007.org/print/101relcrashrisk.pdf. 226 See, e.g., NHTSA, Alcohol-related fatal crash rates for youth reach historic low: strategies for combating juvenile DUI, 35 ANN. EMERG. MED. 192, 192 (2000). 227 See NHTSA, Fatal Crashes Involving Young Drivers 4 (Nov. 2009), available at http://www-nrd.nhtsa.dot.gov/Pubs/811218.pdf (finding that in 2007, 31% of drivers ages 15-20 that were killed in car crashes had BACs of .01 or greater and 26% had BACs of .08 or greater). It is, for the record, no greater than the percentage of the overall driving population for that year – 5% - in that BAC range. Id. Even the fact that such laws have arguably reduced youth driving fatalities does not show that minors are highly dangerous drivers – worthy of criminal punishment – at non-zero but very low BACs. Reductions in fatalities following passage of zero-tolerance laws might show that such laws effectively deter drinking and driving at dangerously high BACs, but they do not suggest that low BACs cause crashes. Surely, for example, a zero-tolerance law for adults would also decrease fatalities, but would not prove that a .01% BAC in an adult is worthy of criminal punishment. 228 See, e.g., Susan A. Ferguson, Comments on ‘Low BAC Policies: Results and Mechanisms 141, INSURANCE INSTITUTE FOR HIGHWAY SAFETY, Sept. 2001, available at http://www.iihs.org/frontend/iihs/documents/masterfiledocs.ashx?id=1714 229 Compare NHTSA, ZERO TOLERANCE FOR YOUTH: FOUR STATES’ EXPERIENCE WITH ZERO TOLERANCE LAWS, Aug. 2000, available at http://www.nhtsa.gov/About+NHTSA/Traffic+Techs/current/Zero+Tolerance+For+Youth+Four+States%27+Experience+With+Zero+Tolerance+Laws (finding reductions in single vehicle nighttime injury crashes involving drivers under 21 as a result of zero tolerance laws); Voas, et al., supra, note 188 at 585.,(finding that zero-tolerance laws, in conjunction with minimum drinking age, reduced alcohol-positive involvement in fatal crashes); with Darren Grant, Dead on Arrival: Zero Tolerance Laws Don’t Work, 48 Economic Inquiry 756 (2010) (using federal Fatality Analysis Reporting System (FARS) data from 1988-2000 and finding no material effect of such laws on fatality rates or distribution of BACs among drivers in fatal accidents). 230 Grant (2010), supra note 207, at 769.

2/5/15 4:18 PM
138 CALIFORNIA LAW REVIEW [Vol. XX:nnn
chemical impairment communities are willing to call “criminal.”231 ***
The lesson from the DUI alcohol story is not that a DUI jurisprudence of prohibition is impossible or inherently illegitimate, nor that one cannot criminalize, through a jurisprudence of dangerousness, behavior that causes only marginal increases in crash risk. The lesson is that, if a chemical impairment law’s legitimacy is based on a jurisprudence of dangerousness, then the law has to live up to that penal purpose by meeting the established framework of the Haddon era – still the only valid framework the law has – for scientifically proving the link between chemical impairment and dangerousness. Once science reveals the danger inherent in driving at a certain measurable level of the drug’s concentration in the body, the community is still faced with the secondary decision of what level of risk should be criminal. Sometimes politics influences the decision to criminalize a certain level of risk in a way that renders bad policy, as was arguably the case with zero-tolerance laws and the push for a .05% limit. In the context of per se DUI marijuana laws, as the next Part explores, lawmakers have passed statutes that are the product of political compromise with no clear penal purpose. Such lack of purpose makes existing per se regimes, ostensibly modeled after DUI alcohol’s jurisprudence of dangerousness but with no current ability to pass muster under Haddon’s framework, illegitimate.
II. PUNISHMENT WITHOUT PURPOSE: THE ILLEGITIMACY OF CRIMINAL PER SE
DUI MARIJUANA LAWS
A. The Rise of Drugged Driving Laws and Recognition of the Arbitrariness of Per Se Limits
1. The Origins of Drugged Driving Laws As with DUI alcohol laws, drugged driving (or “DUI drug” (DUID)) laws
had their origins in a jurisprudence of dangerousness. Partly influenced by a burgeoning federal regime of drug taxation in the years before and during Prohibition,232 many of the first states to criminalize DUI explicitly included driving under the influence of drugs and narcotics along with alcohol.233 Laws
231 Zero-tolerance or low-BAC laws for truck drivers and operators of special equipment, see, e.g., Cal. Veh. Code § 23152(d) (“It is unlawful for a person who has 0.04 percent or more, by weight, of alcohol in his or her blood to drive a commercial motor vehicle . . . .”), similarly target dangerous driving through what is, in essence, a presumption of an unacceptable magnitude risk. See, e.g., U.S. DEPARTMENT OF TRANSPORTATION, FEDERAL AVIATION ADMINISTRATION, Drugs and Alcohol in Civil Aviation Accident Pilot Fatalities 6, 2004-2008, available at http://www.faa.gov (noting the FAA BAC limit of 0.04).
232. See generally John F. Galliher & Allynn Walker, The Puzzle of the Social Origins of the Marihuana Tax Act of 1937, 24 SOCIAL PROBLEMS 367, 367-69 (1977) (chronicling federal taxation on drugs leading up to 1937).
233. See, e.g., Black v. State, 130 S.E. 591, 592 (Ga. Ct. App. 1925) (“[I]t is . . . an indictable offense for any person, ‘while under the influence of intoxicating liquors or drugs,’ to operate any

2/5/15 4:18 PM
201x] DESKTOP PUBLISHING EXAMPLE 139
against DUI marijuana were not prohibitionist; most states did not criminalize the drug until the 1930s, largely in response to the Uniform State Narcotic Act in 1932 and the urging of the new Federal Bureau of Narcotics director, H. J. Anslinger.234 By 1937, every state had a law prohibiting the sale and possession of the drug.235
While marijuana and other drugs were technically illegal, federal officials’ attempt to create a marijuana “crisis” in the eyes of the public was “largely unsuccessful.”236 Every state banned marijuana, and every state by the 1960s had a drugged driving law,237 but there was no large political movement pushing to institute highly punitive drug laws, or zero-tolerance drugged driving laws, until decades later. This was true even though prosecution of drugged driving was from the start just as, if not more, challenging than prosecuting drunk driving. Drugged driving, like DUI alcohol, was typically proven in court through police testimony that the driver was acting impaired.238 Although reliable acquittal rate data from the early days of drugged driving prosecutions appears elusive, the problems with proving DUI alcohol charges to juries were surely only magnified in drugged driving cases; unlike drivers severely impaired by alcohol, who nearly always showed outward signs of drunkenness, even acute drug intoxication sometimes showed up in more “subtle symptoms.”239
The solution to this dilemma in the DUI alcohol context had come from the invention of breath testing devices, which led both to the use of BAC results to corroborate police testimony and to the ability to set presumptive (and later per se) BAC thresholds based on dosage-specific crash risk data. Both the law enforcement and scientific communities appeared to understand from the beginning, however, that the drugged driving problem could not be addressed in the way that drunk driving had been. Noted toxicologist Bryan Finkle worried at a 1974 conference that the DUI alcohol model would simply be adopted wholesale by lawmakers in the drugged driving context without sufficient thought to the complexities of the latter:
Surely the jig is up for the Drinking Driver. For the past forty years he has … had his behavior, his body fluids and his very breath analyzed by the most pedantic techniques of science, until … Researchers … made “Drunk Driver” and “Problem Driver”
motor vehicle upon any highway of this state, regardless of the rate of speed.”) (quoting The Act of 1921, 1921 Ga. Laws 255)).
234. See Galliher & Walker, supra note210, at 367-69 (noting that states had criminalized marijuana years before the Tax Act).
235. See id. at 367. 236. See id. at 371 (noting the lack of success of the Federal Bureau of Narcotic’s educational
campaign aimed to convince the public of the evils of marijuana). 237. New York was one of the last states to enact a drugged driving statute in 1966. See
People v. Litto, 822 N.Y.S.2d 130, 130-31 (App. Div. 2006) (“[I]n 1966, the [New York] Legislature added Vehicle and Traffic Law § 1192(4), making it a misdemeanor to operate a motor vehicle while impaired by the use of a drug.” (internal quotation marks omitted)).
238. See NHTSA, DRUG PER SE LAWS: A REVIEW OF THEIR USE IN STATES 1 (July 2010). 239. Barry Meier, New Test for a Highway Peril, the Drugged Driver, N.Y. Times, Sept. 25,
1989, at B7.

2/5/15 4:18 PM
140 CALIFORNIA LAW REVIEW [Vol. XX:nnn
household clichés. But what of the “Drugged Driver?” Is there a danger that, by logical progression and without relevant
knowledge, a specter is being created and legislated for the Drugged Driver? Unidentified, and cloaked in a veil of fear by a generation familiar with drug-abuse, it is natural to assume that drugs play a role in the current highway carnage. Millions of law-abiding citizens drive under the influence of drugs every day; but whether this is a significant factor in the total picture of traffic safety and requires priority attention is an important but unresolved question.240 Finkle’s concern was prescient, but premature. William Haddon Jr. had
apparently cast a long shadow; respect for the undisputable logic of his epidemiological approach remained even after the punitive turn of criminal law in the 1980s. As the AMA acknowledged in 1985, “relatively little would be gained by a per se approach [to drugged driving laws] based on arbitrary data.”241
2. Marijuana’s Profound Differences from Alcohol in Terms of Ability to Identify Proximity of Use, Psychoactive Influence, and Driving Impairment from Specific Blood Levels
To understand why the AMA would so dramatically declare that drugged driving research on crash risk was no more than “arbitrary data,” an exploration of the stark differences between alcohol – an “unusually simple drug”242 – and other drugs is in order. I focus here on marijuana because the partial or full legalization of marijuana in several states has, as explained in Part II.D, recently motivated state officials to pass per se marijuana laws. Three primary factors make the study of THC’s relationship to crash risk more difficult than with alcohol: the difficulty in identifying proximity of use, the wide variance in dose-related psychoactive influence, and the limited ability to study marijuana-related driving impairment, especially the effect of specific THC blood levels on driving.
Proximity of use. One unique property of alcohol, not shared by marijuana, is the manner in which its concentration in the blood so uniformly and predictably reflects proximity of use. Ethyl alcohol is the only psychoactive compound in the alcohol we drink. Ethyl alcohol is both fat soluble and entirely water soluble, creates no long-lived metabolites, and quickly dissipates from the body. One’s BAC has a predictable relationship with rates of absorption, distribution, and elimination that are similar among humans. Because of these qualities, breath test results can indicate with relatively high precision how long ago a person drank alcohol, and in what quantity.
The problem with marijuana’s detectability is, one might say, that it is an embarrassment of riches; as explained below, it can be detected quickly, 240 Bryan S. Finkle, “Will the Real Drugged Driver Please Stand Up?” An Analytical Toxicology Assessment of Drugs and Driving, PROCEEDINGS OF THE SIXTH INT’L CONF. ON ALCOHOL, DRUGS, & TRAFFIC SAFETY 607 (1974).
241. Drug Concentrations, J. AM. MED. ASSOC. (1985) at 2620. 242. Reisfield, supra note 42, at 353.

2/5/15 4:18 PM
201x] DESKTOP PUBLISHING EXAMPLE 141
effectively, and for a long time, confounding the ability to infer recency or extent of use from blood levels. Cannabis, the plant with marijuana as a derivative,243 has over 421 chemicals, and more than 2000 compounds are broken down in the body when one smokes it.244 The most psychoactive of these compounds is delta9-tetrahydrocannabinol (THC).245 THC from smoked cannabis is “detectable in plasma within seconds after the first puff,” with peak plasma concentration generally happening within 3 to 10 minutes.246 But THC also produces two additional compounds when it is metabolized in the liver: a psychoactive compound, 11-OH-THC, and a non-impairing, inactive compound, THC-COOH.247
While THC and its metabolites reach their peak concentrations within 3 to 90 minutes and the metabolites are excreted from the body through feces and urine,248 the compounds linger in low levels in the body for much longer. Even THC itself can be found for several hours or even days after consumption, depending on the frequency and amount of usage; a 2014 study from Norway concluded that THC can remain in the saliva of frequent cannabis users for over eight days.249 THC’s metabolites linger even longer, and can be found in one’s blood for days, weeks, or even over a month in chronic users.250 The level and timing of concentrations change not only with tolerance, but with ingestion method. For those who orally ingest marijuana (including most medical marijuana patients), such as by swallowing an extract or applying a tincture to the bottom of the tongue, the efficiency of THC’s effect goes down compared to smoking; because THC (unlike alcohol) is “barely soluble in water,” “the body absorbs only a small fraction of the available [THC] when it is swallowed,” causing THC levels and effect to be delayed.251 In sum,
243. Marijuana is a derivative of the plant Cannabis sativa. See Emma Puighermanal et al., 367 PHIL. TRANS. R. SOC. B 3254, 3254 (2012).
244. Priyamvada Sharma et al., Chemistry, Metabolism, and Toxicology of Cannabis: Clinical Implications, 7 IRAN J. PSYCHIATRY 149, 149 (2012).
245. Id. at 150. 246. When you smoke marijuana, THC itself quickly reaches a high concentration in the
blood, where about 90% of it is circulated in plasma and the rest in red blood cells, which together comprise “whole blood.” Id. at 151. 247 Id.
248. 11-OH-THC often reaches its peak concentration a few minutes after THC’s peak, See, e.g., Louis Lemberger et al., Comparative Pharmacology of Delta9-Tetrahydrocannabinol and Its Metabolite, 11-OH-Delta9- Tetrahydrocannabinol, 52 J. CLIN. INVEST. 2411, 2416 (1973) (finding that participants reached a peak “psychologic high and symptom sign score” within 2-3 minutes after intravenous administration of 11-OH-THC, but around 15-30 minutes after intravenous injection of THC), THC-COOH reaches its peak much later; in one study, the average among users was 81 minutes after ingestion. Sharma et al., supra note 222, at 152.
249. H.T. Andas et al., Detection Time for THC in Oral Fluid After Frequent Cannabis Smoking, THER DRUG MONIT 2, May 9, 2014 http://www.ncbi.nlm.nih.gov/pubmed/24819969
250. See, e.g., http://www.nhs.uk/chq/Pages/2287.aspx?CategoryID=53; Sharma et al., supra note 222, at 152 (noting that the half-life of THC for infrequent users is 1.3 days and for frequent users is 5-13 days); Amy Berning & Dereece D. Smither, Understanding the Limitations of Drug Test Information, Reporting, and Testing Practices in Fatal Crashes, NHTSA, TRAFFIC SAFETY FACTS RESEARCH NOTE, Nov. 2014, at 1, available at http://www-nrd.nhtsa.dot.gov/Pubs/812072.pdf (noting that “traces of cannabinoids can be detected in blood samples weeks after use”).
251. ALISON MACK & JANET JOY, MARIJUANA AS MEDICINE? THE SCIENCE BEYOND THE
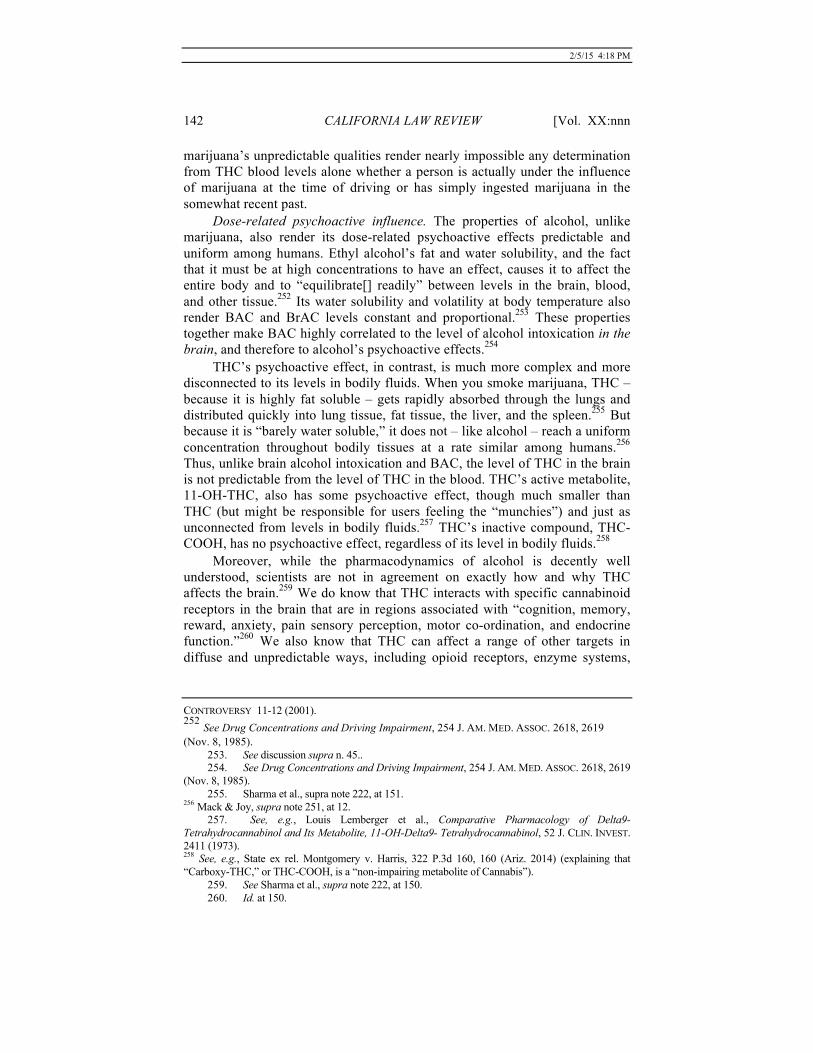
2/5/15 4:18 PM
142 CALIFORNIA LAW REVIEW [Vol. XX:nnn
marijuana’s unpredictable qualities render nearly impossible any determination from THC blood levels alone whether a person is actually under the influence of marijuana at the time of driving or has simply ingested marijuana in the somewhat recent past.
Dose-related psychoactive influence. The properties of alcohol, unlike marijuana, also render its dose-related psychoactive effects predictable and uniform among humans. Ethyl alcohol’s fat and water solubility, and the fact that it must be at high concentrations to have an effect, causes it to affect the entire body and to “equilibrate[] readily” between levels in the brain, blood, and other tissue.252 Its water solubility and volatility at body temperature also render BAC and BrAC levels constant and proportional.253 These properties together make BAC highly correlated to the level of alcohol intoxication in the brain, and therefore to alcohol’s psychoactive effects.254
THC’s psychoactive effect, in contrast, is much more complex and more disconnected to its levels in bodily fluids. When you smoke marijuana, THC – because it is highly fat soluble – gets rapidly absorbed through the lungs and distributed quickly into lung tissue, fat tissue, the liver, and the spleen.255 But because it is “barely water soluble,” it does not – like alcohol – reach a uniform concentration throughout bodily tissues at a rate similar among humans.256 Thus, unlike brain alcohol intoxication and BAC, the level of THC in the brain is not predictable from the level of THC in the blood. THC’s active metabolite, 11-OH-THC, also has some psychoactive effect, though much smaller than THC (but might be responsible for users feeling the “munchies”) and just as unconnected from levels in bodily fluids.257 THC’s inactive compound, THC-COOH, has no psychoactive effect, regardless of its level in bodily fluids.258
Moreover, while the pharmacodynamics of alcohol is decently well understood, scientists are not in agreement on exactly how and why THC affects the brain.259 We do know that THC interacts with specific cannabinoid receptors in the brain that are in regions associated with “cognition, memory, reward, anxiety, pain sensory perception, motor co-ordination, and endocrine function.”260 We also know that THC can affect a range of other targets in diffuse and unpredictable ways, including opioid receptors, enzyme systems,
CONTROVERSY 11-12 (2001). 252 See Drug Concentrations and Driving Impairment, 254 J. AM. MED. ASSOC. 2618, 2619 (Nov. 8, 1985).
253. See discussion supra n. 45.. 254. See Drug Concentrations and Driving Impairment, 254 J. AM. MED. ASSOC. 2618, 2619
(Nov. 8, 1985). 255. Sharma et al., supra note 222, at 151.
256 Mack & Joy, supra note 251, at 12. 257. See, e.g., Louis Lemberger et al., Comparative Pharmacology of Delta9-
Tetrahydrocannabinol and Its Metabolite, 11-OH-Delta9- Tetrahydrocannabinol, 52 J. CLIN. INVEST. 2411 (1973). 258 See, e.g., State ex rel. Montgomery v. Harris, 322 P.3d 160, 160 (Ariz. 2014) (explaining that “Carboxy-THC,” or THC-COOH, is a “non-impairing metabolite of Cannabis”).
259. See Sharma et al., supra note 222, at 150. 260. Id. at 150.

2/5/15 4:18 PM
201x] DESKTOP PUBLISHING EXAMPLE 143
hormones, and neurotransmitters.261 But unlike with ethyl alcohol, the extent of THC’s effects is a function of several variables that interact in complex ways, including dosage and tolerance.. And with respect to dosage, because of THC’s pharmacokinetic qualities, there is simply no predictable or uniform connection between specific blood levels of THC and its metabolites and these psychoactive effects.262 Thus, even if scientists could straightforwardly infer proximity of use from THC blood levels, marijuana’s unpredictable properties render nearly impossible any inference about the likely psychoactive effect on the brain of a specific THC blood level.
Impairment of ability to drive safely. Because BAC, unlike THC blood level, corresponds so predictably to proximity of use, brain concentration, and level and type of psychoactive effect, BAC’s effects on driving can be well studied and generalized to the adult population. Specifically, alcohol’s qualities, along with the non-invasiveness of breath testing and uncontroversial nature of alcohol use, allow for study of its impairing effects on driving through both controlled simulations at precise BAC levels and study of dosage-specific fatal crash statistics. At a 1983 NIDA conference on drugged driving, in addressing the potential aptness of the DUI alcohol model for studying DUI drugs, the somewhat pessimistic consensus was that ethanol is an “unusually good model for studying the effects of a drug on driving performance.”263 More recently, the NHTSA in a 2010 report on drugged driving acknowledged that it was only from “the epidemiological evidence of the increased risk of crash involvement associated with increased driver BACs” that “the rationale was developed for setting presumptive and then per se levels defining the alcohol-impaired driving offense.”264 And in a November 2014 publication, two NHTSA researchers acknowledged that “[c]urrent knowledge about the effects of drugs other than alcohol on driving performance is insufficient to make judgments about connections between drug use, driving performance, and crash risk.”265
The ability to study the effect of specific THC blood levels on the safety of one’s driving, on the other hand, is significantly limited by the very same factors that render alcohol so conducive to study. Controlled driving experiments under realistic conditions are difficult both because marijuana and other drugs are illegal in most states and thus cannot be administered to subjects with the same ease, and because specific levels of THC in the blood have wildly different levels of psychoactive effect depending on the person and the circumstances. As the NHTSA website acknowledges, “[i]t is difficult to establish a relationship between a person’s THC blood or plasma concentration and performance impairing effects.”266 Indeed, researchers have found that
261. Id. 262 See, e.g., Mack & Joy, supra note 251, at 12; Sharma et al., supra note 222, at 152.
263. Drug Concentrations and Driving Impairment, 254 J J. AM. MED. ASSOC. 2618, 2619 (Nov. 8, 1985).
264. NHTSA REPORT (2010), supra note 216, at 4. 265 Berning & Smither, supra note 250, at 1.
266. http://www.nhtsa.gov/people/injury/research/job185drugs/cannabis.htm (emphasis added).

2/5/15 4:18 PM
144 CALIFORNIA LAW REVIEW [Vol. XX:nnn
chronic cannabis users develop a tolerance to many of the psychomotor effects of THC,267 including those specifically related to driving tasks.268 Researchers have also noted that the impairing effects of certain drugs might be confused with the impairing effects of withdrawal from those drugs.269 In short, as a recent consensus report on drugged driving concluded, “[i]nterpreting the meaning of either drug/metabolite concentration in a single biological specimen with reference to impaired driver performance is therefore an extremely difficult task for a scientist and even more difficult for a prosecutor.”270
A. The Prohibitionist Approach: The Use of Zero-Tolerance DUI Drug Laws Before the Legalization Movement
As the 1980s drew to a close, the “war on drugs” was in full force, causing the unresolved problem of drugged driving to come to the fore. Meanwhile, government survey results revealed that millions of teenagers and adults were driving under the influence of illicit drugs.271 Beginning in 1990, twelve states272 chose to address the problem through a new DUI jurisprudence of prohibition, banning driving with any illicit drug in one’s body. Under a
267. See, e.g., Brett C. Ginsburg et al., Blood Levels Do Not Predict Behavioral or
Physiological Effects of Delta-9-Tetrahydrocannabinol in Rhesus Monkeys with Different Patterns of Exposure, 139 DRUG & ALCOHOL DEPENDENCE 1, 2 (2014); D.M. Schwope et al., Psychomotor performance, subjective and physiological effects and whole blood delta-9- tetrahydrocannabinol concentrations in heavy, chronic cannabis smokers following acute smoked cannabis, 36 J. ANAL. TOXICOL. 405, 409-11 (2012) (finding no significant effect in heavy users with respect to tracking error and reaction time, and a “minimal” effect on divided-attention tasks).
268. See, e.g., W.M. Bosker et al., Medicinal delta-9- tetrahydrocannabinol (dronabinol) impairs on-the-road driving performance of occasional and heavy cannabis users but is not detected in Standard Field Sobriety Tests. 107 ADDICTION 1837, 1837 (2012).
269. See Marzuk (1990) at 255 (noting that cocaine withdrawal may be responsible for increased accident risk). See also M. Haney et al., Marijuana withdrawal in humans: effects of oral THC or divalproex, 29 NEUROSPCYHOPHARMACOLOGY 158, 167 (2004) (noting symptoms of marijuana withdrawal: irritability, “muscle pain, chills, decreased food intake, and decreased self-reported sleep quantity”).
270. The Walsh Group, Consensus Report, Substance Abuse Policy Research Program, The Feasibility of Per Se Drugged Driving Legislation (2002), available at http://stopdruggeddriving.org/pdfs/FeasabilityofPerSeLawsConsensusReport.pdf. See also Ginsburg et al., supra note 267, at 7 (“The relationship between blood levels of THC and behavioral impairment differ from the relationship for ethanol.”).
271. SUBSTANCE ABUSE & MENTAL HEALTH SERVS. ADMIN., U.S. DEP’T OF HEALTH & HUMAN SERVS., RESULTS FROM THE 2006 NATIONAL SURVEY ON DRUG USE AND HEALTH, NATIONAL FINDINGS 2 (2007) (noting that 10.2 million people aged 12 and older reported driving under the influence of an illicit drug in the previous year).
272. See ARIZ. REV. STAT. § 28-1381 (effective June 28, 1990) (zero tolerance; includes any metabolite); UT CODE ANN. 1953 § 41-6a-517 (May 2, 1994); 625 ILCS § 5/11-501 (Aug. 15, 1997) (excepting medical marijuana use from zero-tolerance provision); IOWA CODE ANN. §321J.2 (July 1, 1998) (“any amount of a controlled substance”); GA. CODE ANN. § 40-6-391 (July 1, 2001); IND. CODE ANN. § 9-30-5-1 (July 1, 2001); MICH. COMP. L. § 257.625 (effective Sept. 30, 2003) (zero tolerance for controlled substances); WIS. STAT. ANN. § 346.63 (Dec. 19, 2003); VA. CODE ANN. § 18.2-266 (July 1, 2005) (imposing zero-tolerance for marijuana and some drugs, with low numerical thresholds for cocaine, methamphetamine, PCP, and Ecstasy); R.I. GEN. L. ANN. 1956 § 21-28.6-7 (July 1, 2006); MINN. STAT. ANN. § 169A.20 (Aug. 1, 2006) (excepting cannabis); 21 DEL. CODE ANN. § 4177 (July 10, 2007).

2/5/15 4:18 PM
201x] DESKTOP PUBLISHING EXAMPLE 145
prohibitionistic logic, these laws made sense: If having an illicit drug in one’s system is itself morally blameworthy, then driving while having the drug in one’s system is morally blameworthy, even without proof of any impairing effect. In 1990, marijuana was not only illegal in all 50 states, but a “Schedule I” drug deemed to have “no medicinal value and high potential for abuse.”273 Indeed, in most states, it still is today.274 Criminal punishment of driving with any amount of an illicit drug in one’s body therefore had a legitimate penal purpose, regardless of the inability to show any link to impairment.
Government officials were open about their embrace of this new penal theory for DUI illicit drugs, as well as about their retention of the traditional focus on dangerousness for legal drugs. The NHTSA described the central premise of zero-tolerance laws as being that “the use of the drug is illegal, not that a specific concentration equates to impairment.”275 When an Arizona man recently challenged his conviction under that state’s zero-tolerance law because he had only the inactive THC metabolite (THC-COOH) in his body, the State argued that the law simply did not target dangerousness; rather, its purpose was to target any trace of an illicit drug in the driver’s body through a “per se prohibition” and a “flat ban on driving with any proscribed drugs in one’s system.”276 One researcher arguing for a zero-tolerance approach to DUI marijuana reasoned that it “sends a clear and concise message to those who use illicit drugs such as cannabis that this behaviour [sic] will not be tolerated, especially in connection with driving.”277 Moreover, states with such laws created exceptions for prescription drugs, which were to be governed by a subjective impairment standard requiring a showing that the driver was actually under the influence of the drug.278
To be sure, this new prohibitionist approach had as its ultimate goal not simply to deter drug use, but to get more convictions in cases involving what
273 Shaunacy Ferro, Why It’s So Hard for Scientists To Study Medical Marijuana, POPULAR SCIENCE, Apr. 18, 2013, available at http://www.popsci.com/science/article/2013-04/why-its-so-hard-scientists-study-pot.
274. See, e.g., High time for advancing marijuana research, Editorial, 17 NATURE NEUROSCIENCE 481 (Apr. 2014).
275. NAT’L HIGHWAY TRAFFIC SAFETY ADMIN., PRIORITIES AND STRATEGIES FOR IMPROVING THE INVESTIGATION, USE OF TOXICOLOGY RESULTS, AND PROSECUTION OF DRUG-IMPAIRED DRIVING CASES: FINDINGS AND RECOMMENDATIONS 12 (2004).
276. See, e.g., State’s Response to Petition for Review of Special Action Decision of the Court of Appeals, State ex rel. Montgomery v. Harris, No. CV-13-0056-PR (Ariz. May 28, 2013), at 10; see also id. at 11 (arguing that the legislature had determined “that there is no level of illicit drug use which can be acceptably combined with driving a vehicle”).
277. Alan W. Jones et al., Driving under the influence of cannabis: a 10-year study of age and gender differences in the concentrations of tetrahydrocannabinol in blood, 103 ADDICTION 452, 459 (2008).
278. See, e.g., FACT SHEET, ARIZONA STATE SENATE, H.B. 2433, DUI: OMNIBUS (1990) (providing a prescription drug exception to the new zero-tolerance DUI drug law, and noting that the subjective impairment standard would apply); Del. Code. Ann. Tit. 21, § 4177(b)(3)(b) (prescription drug exception); R.I. Stat. § 21-28.6-7(3) (medical marijuana exception). A 2002 Consensus Report of criminal justice actors recommended that “[a] model [zero-tolerance] law should include . . . [p]rovisions to stipulate that legal prescription use of a drug is an affirmative defense to a DUID charge . . . .” CONSENSUS REPORT (2002), supra note 243, at 2.

2/5/15 4:18 PM
146 CALIFORNIA LAW REVIEW [Vol. XX:nnn
officials saw as dangerous, but difficult to detect, drugged driving.279 But a prohibitionist approach is an awkward fit if the justification for the law is the dangerousness of the drug’s impairing effects, rather than simply the immorality of using the drug. Presumably, the reason these states chose a prohibitionist approach to justifying a law that had dangerous driving as its ultimate raison d’etre was that they viewed the alternatives as either ineffective or impossible. Directly criminalizing dangerous drugged driving through a subjective impairment standard had proven ineffective in securing high conviction rates, and enactment of a non-zero per se limit, akin to .08% BAC, that was causally linked to increased relative crash risk had proven scientifically elusive.
Adopting a prohibitionist approach to solve a dangerousness problem may have been a bad fit in terms of penal legitimacy, but it at least made convictions easier. When asked to explain the impetus for a bill introduced in 2004 to force states to pass zero-tolerance DUI laws for illicit drugs, John Walters, then the Director of the White House Office of National Drug Control Policy, argued that “a simple clear guideline . . . is needed to combat drugged driving.”280 As one legal scholar sympathetic to such laws has argued, “[a] zero tolerance law is the easiest standard to prove,” because it does not turn on “the impact the drug has on one’s ability to drive.”281 A sponsor of a recent zero-tolerance bill in Illinois similarly acknowledged that a driver could be “sober as a judge, because they smoked [marijuana], or – or consumed it twenty days ago,” but that “it’s DUI . . . . [t]hat’s the law.”282 The sponsor explained that unlike alcohol, a context in which “.08 has been generally accepted as enough to indicate an impaired driver,” marijuana has no accepted test for driving impairment. 283
The scientific community also candidly acknowledged that the zero-tolerance approach was a way to bypass the need for science to back up a dangerousness-based DUI law. One physician suggested in a 2012 article in the Journal of Analytical Toxicology that the adoption of “zero tolerance” laws were necessary precisely because the ability to determine impairment based on non-zero numerical thresholds was a “mirage,” and that “there is abundant scientific evidence demonstrating that” finding drug concentrations analogous to the .08% BAC level in terms of indicating unsafe levels of intoxication “is
279. See, e.g., NHTSA REPORT (2010) , supra note 238, at 5 (“In most of these per se States,
the compelling argument for adoption of the drug per se statute was that, prior to the laws, a driver was far less likely to be prosecuted . . . .”).
280. Donna Leinwand, Growing Danger: Drugged Driving, USA TODAY, Oct. 21, 2004 (quoting Scott Burns); Drug Impaired Driving Enforcement Act of 2004, H.R. 3922, 108th Cong. (2004). See also Mark Hansen, Drugged State, ABA Journal (Dec. 29, 2005, 11:44 AM) (noting critics’ argument that the laws “are based not on science but on convenience,” and that “[s]ince scientists can’t agree on what level of drug or drug metabolite constitutes impairment,” politicians “often simply choose to set the standard at zero”).
281. Cafaro, supra note 291, at 45. 282 Sen. William Haine, Senate Transcript, 98th General Assembly, Reg. Session, 52nd Legislative Day, IL S. Tan. 2013 Reg. Sess. No. 52, 56 (May 17, 2013).
283. Id.

2/5/15 4:18 PM
201x] DESKTOP PUBLISHING EXAMPLE 147
unachievable.”284 Another researcher noted that zero-tolerance DUI drug laws “avoid[] the need for a reliable science-based correlation between drug concentration and level of impairment and facilitate[] enforcement.”285 Until it was possible to justify a per se limit through science and a focus on dangerousness, a prohibitionist stance – justified by the illegality of the drug itself – would have to do.
The shift toward a jurisprudence of prohibition was a clever and effective move for DUI in the context of illicit drugs. The illegality of the drug itself made the laws both legitimate in terms of penal purpose and politically feasible. If certain cultural and political shifts had not been on the near horizon, the country might have followed the urging of the NHTSA and the White House to create a nationwide “zero tolerance” drugged driving regime.286 What would throw state lawmakers for a loop, and send them scrambling to find a quick fix, was the marijuana legalization movement.
B. The Illegitimacy of Per Se THC Thresholds
1. Legalization and the Rise of Per Se Marijuana Laws: Political Compromise Without a Penal Purpose
The recently successful movements in many states to decriminalize or legalize some combination of medical and recreational marijuana, beginning with California’s medical marijuana law in 1996 and involving most recently the decisions of Colorado, Washington, Alaska, and Oregon to fully legalize recreational marijuana, has created quite a public health and jurisprudential dilemma for state officials. On the public health end, the drugged driving problem seems to have become worse. Just as the end of Prohibition gave the drunk driving problem new urgency, the legalization of marijuana seems to have increased the number of drivers on the road who have recently ingested marijuana.287 Meanwhile, the country is also facing a surge in driving by users of other legal prescription drugs and narcotics; while “drunken-driving deaths are dropping[,] . . . prescriptions for narcotic painkillers, anti-anxiety
284. Reisfield, supra note 42, at 353. See also Jones et al., supra note 248, at 459 (arguing
that because “[s]cientists find it virtually impossible to agree” on a THC concentration that leads to impairment, zero-tolerance laws are the most “pragmatic” solution).
285. F. Grotenhermen et al., Developing limits for driving under cannabis, 102 ADDICTION 1910, 1911 (2007).
286. In 2002, the NHTSA recommended that states pass per se drugged driving laws (which, at the time, meant zero-tolerance laws). Fox Butterfield, Many, Undetected, Use Drugs and Then Drive, Report Says, N.Y. TIMES, Nov. 15, 2002. As of 2012, the White House itself has urged all states to adopt “per se (‘zero tolerance’) laws.” Office of National Drug Control Policy, Executive Office of the President, Working to Reduce Drugged Driving and Protect Public Health and Safety, at 2 (Apr. 2012), available at http://www.whitehouse.gov/sites/default/ files/page/files/drugged_driving_fact_sheet_4-6-12.pdf.
287. See, e.g., Gene Johnson, More Washington State Drivers Testing Positive for Marijuana, HUFFPOST, July 1, 2014). Washington’s per se 5 ng law was passed primarily to “allay fears that legalizing pot would lead to more impaired drivers on the roads.” Gabriel Spitzer, Will Legal Marijuana Make Our Roads More Dangerous?, KPLU NEWS, Oct. 8, 2012, available at www.kplu.org/post/will-legal-marijuana-make-our-roads-more-dangerous.

2/5/15 4:18 PM
148 CALIFORNIA LAW REVIEW [Vol. XX:nnn
medications, sleep aids and other powerful drugs are rampant.”288 On the jurisprudential side of things, state officials have also faced a new
predicament in envisioning how to criminalize DUI marijuana in a world in which it is legal. The prohibitionist, zero-tolerance approach no longer works where marijuana is legal, just as it does not work for alcohol. If the use of marijuana itself is no longer deemed worthy of criminal punishment, then driving while using marijuana cannot be criminalized solely on the basis of the immorality of the drug itself. But the alternative – subjective impairment laws focused on dangerous driving – is similarly unsatisfying to states. Drugged driving prosecutions in states without zero-tolerance laws had perhaps been made slightly easier since the 1970s with the development of “Drug Recognition Expert” (DRE) training programs for police officers,289 and dashboard cameras that could corroborate police testimony in cases of clear outward signs of drug impairment. But such efforts pale in comparison to the power that per se BAC limits gave law enforcement to secure drunk driving convictions.
Faced with the prospect of marijuana being as legal as alcohol, law enforcement officials in some states have claimed they need a non-zero numerical threshold, like .08%, to successfully combat DUI marijuana.290 And the way officials and advocacy organizations in these states have sold the concept of such numerical limits to the public has simply been to analogize marijuana to alcohol. In arguing for a per se THC limit in Colorado, one bill sponsor insisted that lawmakers simply sought to hold stoned drivers “to the same standards as if you’re driving under DUI” and that drugged driving law needed an “analogous limit” to DUI. And, a co-sponsor added for good measure, jurors “really like to see that chemical test.”291 Federal officials have used similar logic. The LUCID (Limiting Unsafe Cannabis-Impaired Driving) Act, a bill introduced in March 2014 by Representative Jared Polis of Colorado, would require states that allow use of recreational or medicinal marijuana to enact per se THC limits for DUI marijuana.292 In attempting to justify the Act, Polis has explained that because states that legalize pot have chosen to “follow the will of their citizens and implement regulations to treat marijuana like alcohol,” it clearly follows that these states’ traffic laws should do the same.293
Some advocates of legalization appear to have been willing to give law enforcement a number – any number – in exchange for the holy grail of treating
288. Abby Goodnough & Katie Zezima, Drivers on Prescription Drugs: Dangerous, but Hard to Convict, N.Y. TIMES, July 24, 2010, at A1.
289. See NHTSA Report (2010) at 3. 290. See, e.g., Hearing on Montana H.B. 168, Jan. 17, 2013, at 1:32 (Rep. Moore) (noting that
Montana police struggle with DUI drug prosecutions because they do not have a “specified level,” akin to “BAC,” to measure impairment).
291. See, e.g., Statement of Rep. Waller, at 17:30; 25:28; 25:42, House Judiciary Committee, Feb. 26, 2013, available at http://www.leg.state.co.us/clics/clics2013A/cslFrontPages.nsf/Audio?OpenPage .
292. Matt Ferner, Stoned Driving Standards Could Get a Push from Congress, huffingtonpost.com, Mar. 7, 2014, available at http://www.huffingtonpost.com/2014/03/07/marijuana-high-driving_n_4914645.html. See also Lucid Act, H.R. 4179, 113th Cong. (Mar. 6, 2014).
293. Id..

2/5/15 4:18 PM
201x] DESKTOP PUBLISHING EXAMPLE 149
marijuana like alcohol.294 In Washington State, a grand compromise between legalization advocates and law enforcement led to a ballot measure that linked legalization to the enactment of a per se THC threshold for DUI marijuana of 5 nanograms per milliliter (ng/mL).295 When asked by an audience member at a panel on the new legalization law “why the initiative’s authors had seen the need for a crackdown on drugged driving after years of marijuana use in society,” the Seattle city attorney “said the language was at least, in part, a political calculation.”296 Another participant in the negotiations, interviewed by NPR, said the Washington law was “a deal-sweetener for hesitant voters.”297 A similar compromise by all accounts occurred in Colorado; the bill setting per se DUI marijuana limits in that state failed three times until the fourth time, which coincided with the passage of Amendment 64, legalizing recreational marijuana use.298 While a California per se-THC-limit bill was rejected, its “registered support[ers]” included eight law enforcement associations.299 Adding to the confusion about the penal purpose of these laws, and the evidence that they are a result of quick political compromise rather than a deliberate focus on either the immorality of drug use or the dangerousness of drug intoxication while driving, is the fact that at least two of them allow an affirmative defense for drivers with a legal prescription for marijuana.300
The tactic of analogizing to DUI, picking a number, and offering to support legalization in exchange for that number has been decently successful thus far in convincing voters and legislators to agree to per se THC limits for DUI marijuana. While the LUCID Act is still pending in committee, five states have passed laws prohibiting driving with a certain non-zero threshold of cannabinoids (such as THC) and, in some states, their metabolites, in one’s “whole blood”301: Montana (5 nanograms per milliliter (ng/mL)), Pennsylvania (1ng/mL), Ohio (2ng/mL), Nevada (2ng/mL), and Washington (5ng/mL).302 In
294. One pro-legalization website complains that “the push for 5ng/ml per se DUID is simply
a case of lazy policy makers applying alcohol standards to marijuana,” but in a fit of self-awareness, adds that “[m]aybe our constant drumbeat of “treat marijuana like alcohol” is partially to blame.” See The Russ Belville Show, Mar. 14, 2013, available at http://radicalruss.com/no-direct-correlation-between-driving-impairment-and-thc-concentration/.
295. The drugged driving law and legalization law were passed as part of the same ballot initiative. See Initiative Measure No. 502; Wash. Rev. Code 46-61-502(1)(b).
296. Kirk Johnson, Marijuana Referendum Divides Both Sides, N.Y. Times, Oct. 13, 2012. 297. See Martin Kaste, Pot’s Legal in Washington State, But Don’t Drive High, at
http://www.npr.org/2012/12/05/166531388/pots-legal-in-washington-state-but-dont-drive-high/. 298. See Matt Ferner, Too Stoned To Drive? Marijuana DUI Bill Passes Colorado House,
Huffington Post Online, Apr. 2, 2013, at http://www.huffingtonpost.com/2013/04/02/too-stoned-to-drive-marij_n_3001016.html.
299. See Bill Analysis, A.B. 2500, Calif. State Assembly Comm. on Pub. Safety, Hearing, Apr. 29, 2014.
300. See, e.g., Nev. Rev. Stat. 43-484C.110 (medical marijuana exception). California’s rejected per se 2 ng/mL bill also had a medical marijuana exception. See A.B. 2500.
301. These thresholds measure the concentration of THC in whole blood, not plasma. 302. See, e.g., Wash. Rev. Code § 46.61.502(1)(b) (“A person is guilty of driving while under
the influence of … marijuana … if the person drives a vehicle … [a]nd the person has, within two hours after driving, a THC concentration of 5.00 or higher as shown by analysis of the person’s blood.”).
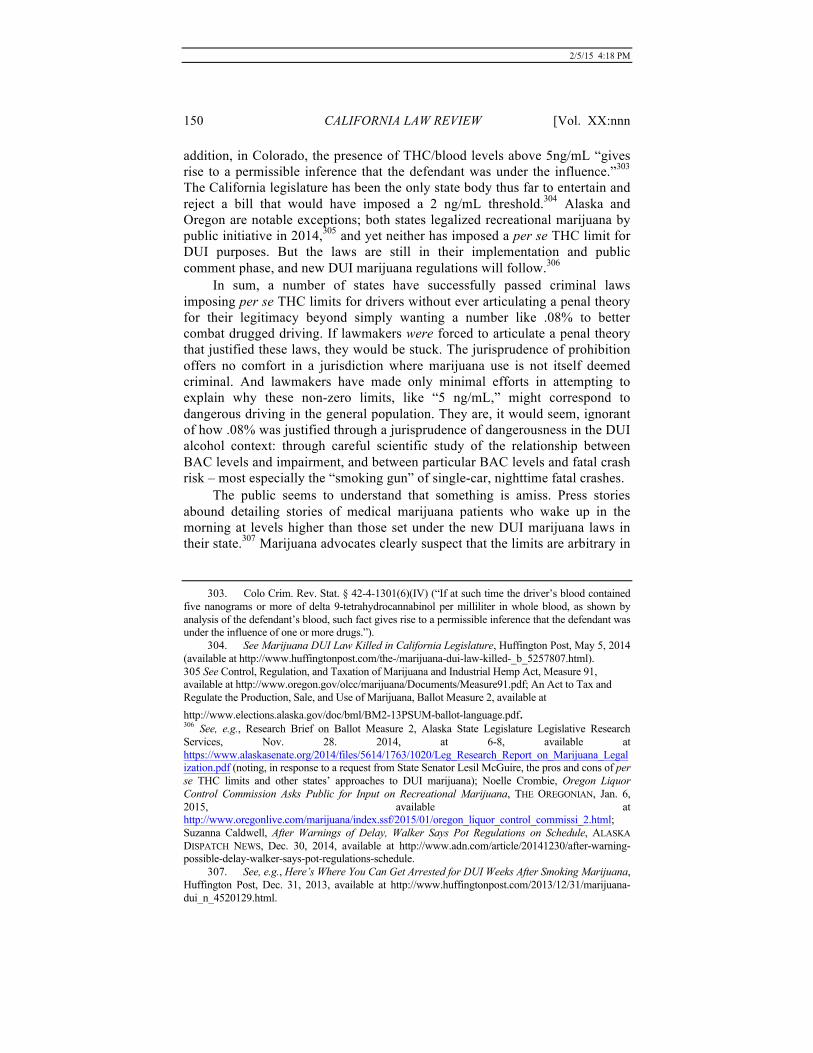
2/5/15 4:18 PM
150 CALIFORNIA LAW REVIEW [Vol. XX:nnn
addition, in Colorado, the presence of THC/blood levels above 5ng/mL “gives rise to a permissible inference that the defendant was under the influence.”303 The California legislature has been the only state body thus far to entertain and reject a bill that would have imposed a 2 ng/mL threshold.304 Alaska and Oregon are notable exceptions; both states legalized recreational marijuana by public initiative in 2014,305 and yet neither has imposed a per se THC limit for DUI purposes. But the laws are still in their implementation and public comment phase, and new DUI marijuana regulations will follow.306
In sum, a number of states have successfully passed criminal laws imposing per se THC limits for drivers without ever articulating a penal theory for their legitimacy beyond simply wanting a number like .08% to better combat drugged driving. If lawmakers were forced to articulate a penal theory that justified these laws, they would be stuck. The jurisprudence of prohibition offers no comfort in a jurisdiction where marijuana use is not itself deemed criminal. And lawmakers have made only minimal efforts in attempting to explain why these non-zero limits, like “5 ng/mL,” might correspond to dangerous driving in the general population. They are, it would seem, ignorant of how .08% was justified through a jurisprudence of dangerousness in the DUI alcohol context: through careful scientific study of the relationship between BAC levels and impairment, and between particular BAC levels and fatal crash risk – most especially the “smoking gun” of single-car, nighttime fatal crashes.
The public seems to understand that something is amiss. Press stories abound detailing stories of medical marijuana patients who wake up in the morning at levels higher than those set under the new DUI marijuana laws in their state.307 Marijuana advocates clearly suspect that the limits are arbitrary in
303. Colo Crim. Rev. Stat. § 42-4-1301(6)(IV) (“If at such time the driver’s blood contained
five nanograms or more of delta 9-tetrahydrocannabinol per milliliter in whole blood, as shown by analysis of the defendant’s blood, such fact gives rise to a permissible inference that the defendant was under the influence of one or more drugs.”).
304. See Marijuana DUI Law Killed in California Legislature, Huffington Post, May 5, 2014 (available at http://www.huffingtonpost.com/the-/marijuana-dui-law-killed-_b_5257807.html). 305 See Control, Regulation, and Taxation of Marijuana and Industrial Hemp Act, Measure 91, available at http://www.oregon.gov/olcc/marijuana/Documents/Measure91.pdf; An Act to Tax and Regulate the Production, Sale, and Use of Marijuana, Ballot Measure 2, available at http://www.elections.alaska.gov/doc/bml/BM2-13PSUM-ballot-language.pdf. 306 See, e.g., Research Brief on Ballot Measure 2, Alaska State Legislature Legislative Research Services, Nov. 28. 2014, at 6-8, available at https://www.alaskasenate.org/2014/files/5614/1763/1020/Leg_Research_Report_on_Marijuana_Legalization.pdf (noting, in response to a request from State Senator Lesil McGuire, the pros and cons of per se THC limits and other states’ approaches to DUI marijuana); Noelle Crombie, Oregon Liquor Control Commission Asks Public for Input on Recreational Marijuana, THE OREGONIAN, Jan. 6, 2015, available at http://www.oregonlive.com/marijuana/index.ssf/2015/01/oregon_liquor_control_commissi_2.html; Suzanna Caldwell, After Warnings of Delay, Walker Says Pot Regulations on Schedule, ALASKA DISPATCH NEWS, Dec. 30, 2014, available at http://www.adn.com/article/20141230/after-warning-possible-delay-walker-says-pot-regulations-schedule.
307. See, e.g., Here’s Where You Can Get Arrested for DUI Weeks After Smoking Marijuana, Huffington Post, Dec. 31, 2013, available at http://www.huffingtonpost.com/2013/12/31/marijuana-dui_n_4520129.html.

2/5/15 4:18 PM
201x] DESKTOP PUBLISHING EXAMPLE 151
their relationship to dangerous driving, but seem to believe either that the tradeoff was worth the risk or that the per se limits will eventually be changed to something more rational. The executive director of the National Organization for the Reform of Marijuana Laws (NORML), in commenting on Washington’s initiative, said that “[e]verybody anticipates if this passes, within a year or so afterwards it will be fixed . . . .”308
Yet even against the backdrop of this growing public intuition about the disconnect between per se limits and driving impairment, there seems to be little to no discussion of why the DUI alcohol analogy is a bad one, and what, precisely, is missing from the body of scientific research on marijuana impairment. That is, there is no discussion of how the DUI alcohol limits themselves were reached over decades of epidemiological research, and what body of scientific evidence would have to be developed in the marijuana context to develop a rational per se regime akin to .08% under Haddon’s compulsory framework. The next section details how the current science on marijuana as chemical impairment fares under this framework, and how that science, if anything, supports rejecting the hypothesis that THC blood levels are predictably related to increased relative crash risk.
2. The Scientific Invalidity of Per Se DUI Marijuana Limits Under Haddon’s Established Framework
To find a precise BAC level that corresponded to a morally blameworthy level of dangerous drinking and driving, Heise, Holcomb, Borkenstein, Haddon, Blomberg et al., and others knew where to look: BACs of drivers killed in single-car crashes, and case-control studies comparing BAC levels of drivers in fatal crashes with BACs of randomly stopped drivers under exactly the same conditions (aside from BAC itself). Researchers also measured, through actual driving experiments involving subjects at various BACs, the level of deterioration of various driving-related skills. They had the luxury of being able to conduct such studies because of the unique pharmacokinetic and pharmacodynamics properties of alcohol. Applying the DUI alcohol framework to the marijuana context, it is clear that the THC blood limits chosen by states have no scientific basis if their purpose is to target dangerous driving. On the contrary, the science that does exist strongly suggests that these levels do not correspond with dangerous driving impairment. This is not to say that driving while stoned is not sometimes or even often dangerous; it is only to say that, as of this writing, THC blood levels cannot legitimately be used to define chemical impairment under a science-based jurisprudence of dangerousness.
a. Single-car fatal crashes In studying alcohol, William Haddon had looked first to the ultimate
“smoking gun” of crash causation: single-car fatal crashes, in which culpability could most readily be inferred from the involvement of alcohol. He found that a full half of fatally injured drivers in 83 single-car crashes, most at night, had a
308. Johnson, supra note 266.

2/5/15 4:18 PM
152 CALIFORNIA LAW REVIEW [Vol. XX:nnn
BAC of .15% or more, another 20% had a BAC between .05 and .14%, and only 3 of 83 drivers had a non-zero BAC lower than .05%. Haddon took measures to remove drivers from the study who had not been tested shortly after the crash, so that the BAC results would better reflect the driver’s BAC at the time of the crash.
With respect to marijuana, no research team has yet conducted a single-car crash study that limits the sample to drivers tested within a certain period after an accident, focuses on THC only rather than in combination with other drugs, and distinguishes between low, moderate, and high levels of THC in the blood.309 Indeed, according to the NHTSA itself, “sound epidemiologic risk studies have not been conducted” for DUI marijuana or other drugged driving, period.310 This is in part because, “[f]ortunately for traffic safety but unfortunately for epidemiological research[,] DUI [cannabis] is far less common” than DUI alcohol.”311
Strikingly, the four studies that do offer data on THC and single-car fatal crashes suggest that THC-only users do not cause a disproportionate number of crashes. The most comprehensive study thus far has been Romano and Voas (2011), who looked to over 44,000 single-car fatal crashes listed in FARS from 1998-2009 and found that only 6% of drivers tested positive for THC or THC plus alcohol (the authors did not further separate the two).312 6% of drivers also tested positive for stimulants.313 Citing the fact that a full 7.6% of drivers in the 2007 NHTSA roadside survey tested positive for marijuana, while only 1.9% tested positive for stimulants, Romano and Voas concluded that this data “seems to suggest that stimulants may be a larger contributor to crash risk than cannabinoids.”314 Indeed, from a comparison of the FARS and NHTSA data alone, it appears that marijuana users are underrepresented, not overrepresented, among single-car crash victims.
The second single-car-crash study, Poulsen et al. (2014), found that of 460 such crashes in New Zealand from 2004 to 2009, only 35, or 7.6%, of the
309 Likewise, no THC study has yet focused – as Haddon did – on nighttime crashes. Nighttime crashes in the alcohol context were a particularly rich source of data because both alcohol use and crashes were at their apex at night. See discussion supra n. 117. Marijuana use may be less concentrated in the evening hours than alcohol use, although some studies suggest that alcohol-related nighttime crash rates have declined in states with medical marijuana laws in large part because marijuana use has substituted for alcohol use. See, e.g., Maiaia Szalavitz, Why Medical Marijuana Laws Reduce Traffic Deaths, TIME, Dec. 2, 2011, available at http://healthland.time.com/2011/12/02/why-medical-marijuana-laws-reduce-traffic-deaths/.
310. NHTSA Report (2010), supra note 216, at 3. Nor have “scientific studies to demonstrate the[] effectiveness” of per se DUID laws been conducted. Id. at 5.
311. Grotenhermen, supra note 285, at 1912. 312. Eduardo Romano & Robert B. Voas, Drug and Alcohol Involvement in Four Types of
Fatal Crashes, J. STUDIES ON ALCOHOL & DRUGS, at 567, 571 (July 2011). 313 Id. 314 Id. See also Results of the 2007 NHTSA Roadside Survey of Alcohol and Drug Use by Drivers (Drug Results), at 81 (noting percentages of marijuana use only, broken down by region, gender, etc.; drivers in the Northeast had a 9.5% THC-only rate), available at http://www.nhtsa.gov/Driving+Safety/Research+&+Evaluation/2007+National+Roadside+Survey+of+Alcohol+and+Drug+Use+by+Drivers .

2/5/15 4:18 PM
201x] DESKTOP PUBLISHING EXAMPLE 153
drivers tested positive for THC, much less at levels over 5 ng/mL.315 They concluded that there was “no apparent increased risk” of a fatal crash with “blood THC concentrations” above 5 ng/mL.316
In a similar vein, the third such study, Gjerde et al. (2011)317 found that of the 68 drivers killed in single-car accidents in Southeastern Norway from 2003 to 2008, 39 of them in the period from 4:00 p.m. to 4:00 a.m.,318 not one driver tested positive for THC only.319 Gjerde concluded there was no statistically significant association “between the use of cannabis only and fatal road accidents.”320
In the fourth and final study analyzing single-car crash data, Marie Longo et al. (2000) found that in 522 single-car non-fatal-injury crashes in South Australia from 1995-96, in which well over 90% of all drivers were found culpable, only 11 drivers – or 2% - tested positive for THC only, and only 7 drivers tested positive for both THC and alcohol.321 Compared to Haddon’s data justifying a .15% presumption of impairment based on nearly half of drivers killed in single-car crashes being over .15%, such low numbers for THC are striking.
Nonetheless, public officials and the media have taken to making sweeping claims about drugged driving causality; the Institute for Behavioral Health claimed in 2007 without citation that “20% of crashes are caused by drugged driving.”322 An NBC News reporter wrote that “new research” shows a causal link between marijuana and crashes because the percentage of drivers in
315. Helen Poulsen et al., The culpability of drivers killed in New Zealand road crashes and
their use of alcohol and other drugs, 67 Accid. Anal. & Prev. 119, 122 Table 1 (2014). The study did not break down THC blood levels except to note that, of 1046 drivers involved in any crash (single or multiple car) during the period, 96 tested positive for THC only, and of those, only 30 tested over 5 ng/mL. The study made no further distinctions between levels above 5 ng/mL. Id.
316. Id. at 126. Even if a full half of the 7.6% THC-only drivers had low blood levels, such a percentage (3.8%) would be around the percentage of drivers in Haddon’s study at non-zero BACs below .05%. Moreover, the Poulsen data likely overstate the crash risk of low THC blood levels, because of the delay in testing blood samples for THC after fatal accidents. See Grotenhermen, supra note 285, at 1913 (“Delayed sample collection causes a decrease in THC concentration, artificially inflates the calculated accident risk for a given THC concentration and blurs the differences between THC concentration classes.”).
317. Hallvard Gjerde et al., Alcohol, Psychoactive Drugs and Fatal Road Traffic Accidents in Norway: A Case-Control Study, 43 ACCID. ANAL. & PREV. 1197 (2011).
318. Id. at 1200. 319. Id. at 1199, 1201 table 4. 320. Id. at 1202. Gjerde noticed an association with fatal crashes and drivers with a
combination of THC and other drugs or alcohol, but did not break down the combination further into blood levels of each drug. Id.
321. Marie C. Longo et al., The prevalence of alcohol, cannabinoids, benzodiazepines and stimulants amongst injured drivers and their role in driver culpability, Part II: The relationship between drug prevalence and drug concentration, and driver culpability, 32 ACCID. ANAL. & PREV. 623, 626 & Table 2 (2000). Longo et al. studied 2500 injured drivers overall, but separated out single-car crashes from multiple-car crashes and gave separate analyses of each in terms of drug use prevalence. The number of drivers in each mutually exclusive drug category adds up to n=522. Id. at 626 Table 2.
322. INST. OF BEHAVIOR & HEALTH, IBH PUBLIC POLICY STATEMENT REGARDING DRUGGED DRIVERS (emphasis added).

2/5/15 4:18 PM
154 CALIFORNIA LAW REVIEW [Vol. XX:nnn
fatal accidents who tested positive for marijuana has increased three-fold in the last eleven years.323 One legal scholar recently wrote that “drug-impaired drivers are causing accidents and deaths on the roadways in increasing numbers, and the statistics are hard to ignore.”324 The National Institute on Drug Abuse’s website, in answer to the question, “How Often Does Drugged Driving Cause Accidents?,” simply cites a 2009 NHTSA study showing that 18% of fatally injured drivers tested positive for at least one drug. To the question “What drugs contribute to accidents?” the site answers that THC is, after alcohol, “the substance most commonly found in the blood of impaired drivers, fatally injured drivers, and motor vehicle crash victims” and that “4 to 14 percent of drivers who sustained injury or died in traffic accidents tested positive for THC.”325
These claims are scientifically irresponsible. One of the central lessons of the Haddon era, and a point the NHTSA itself has recently underscored, is that “the presence of a drug (medication) in a fatally injured driver is not conclusive proof the drug was associated with the accident.”326 For example, one would naturally expect, as the percentage of THC-positive drivers grow, that the percentage of THC-positive drivers in fatal accidents will grow regardless of whether THC use increases crash risk. More importantly, such dramatic numbers invariably aggregate all drugs together, or fail to differentiate THC-only use from polydrug use. Every indication from existing single-car crash studies (and, it turns out, from case-control studies involving randomly selected drivers) strongly suggests that THC blood levels alone have no relationship with increased crash risk, much less THC at levels at or below 5 ng/mL.
Even the percentage of THC-positive drivers in total (single and multiple vehicle) fatal crashes is exceedingly low, suggesting – given the widespread use of marijuana – a lack of causality. In a recent Arizona Department of Public Safety review, fewer than 1% (3 of 335) of suspected impaired drivers involved in crashes involving injury or death in 2012 tested positive only for marijuana.327 While the review was not limited to single-car crashes, those fatal crashes suspected to have involved impaired drivers are more likely than an average crash to involve culpability. Similar results came from a 2014 analysis of FARS data from 1993 to 2010, which included 986,173 drivers who were
323. Bill Briggs, Pot Fuels Surge in Drugged Driving Deaths, NBC News, Feb. 15, 2014,
available at http://www.nbcnews.com/health/health-news/pot-fuels-surge-drugged-driving-deaths-n22991.
324. Tina W. Cafaro, Slipping Through the Cracks: Why Can’t We Stop Drugged Driving?, 32 W. New Eng. L. Rev. 33, 35 (2010) (emphasis added).
325. See, e.g., National Institute on Drug Abuse, DrugFacts: Drugged Driving, at http://www.drugabuse.gov/publications/drugfacts/drugged-driving.
326. Prescription drugs and driving performance, JAMA (1985), at 20. See also José Pulido et al., Association between cannabis and cocaine use, traffic injuries and use of protective devices, 21 Eur. J. Pub. Health 753, 753-754 (2011) (surveying Spanish drivers about their involvement in non-fatal injuries in car crashes as well as drug use, and noting that while such surveys may help solve certain methodological problems in other studies, they “cannot provide causal evidence”).
327. Only another 19 tested positive for THC and alcohol or other drugs; 285 tested positive only for alcohol. See Ray Stern, Marijuana by Itself Not a Significant Factor in Fatal and Injury Crashes in 2012, DPS Data Shows, Phoenix NewTimes, May 17, 2013.

2/5/15 4:18 PM
201x] DESKTOP PUBLISHING EXAMPLE 155
involved in fatal accidents, 287,907 of whom were tested for drugs. Of those, 998, or .3%, tested positive only for THC and alcohol, and fewer than half of those, or around 450 people or .13%, tested positive only for THC.328 Drummer et al. (2004) found that, of 3398 fatally-injured drivers in three Australian states during various periods in the 1990s, only 58 (1.7%) tested positive only for THC, with only 9 testing at less than 5 ng/mL. The study did not further distinguish blood level.329 Khiabani et al. (2006) found that of approximately 30,000 drivers pulled over for suspected DUI in Norway from 1997-1999, fewer than 2% (589) tested positive only for THC or its metabolites.330 And del Rio and Alvarez (2000) found that of 285 fatally injured drivers in Spain in 1994-96, while over 60% tested positive for drugs or alcohol, zero tested positive only for THC.331
b. Case-control studies comparing THC levels of drivers in crashes to randomly stopped drivers under similar conditions.
Working within Haddon’s established framework, Borkenstein et al. and Blomberg et al. conducted classic case-control studies comparing BACs of drivers involved in fatal crashes with BACs of randomly stopped drivers under nearly identical conditions. As Haddon established, such carefully crafted case-control studies, along with single-car fatal crash studies, are the gold standard of epidemiological research on the relationship between chemical impairment and relative crash risk. As the NHTSA itself recently noted with respect to drugged driving in particular, “‘roadside studies’ would be needed to collect blood samples from motorists (not involved in accidents) who are exposed to situations similar to those of fatally injured drivers” before inferring crash causality from a driver’s drug use.332
Yet such case-control studies are harder to perform with respect to marijuana than alcohol. It is more difficult to persuade randomly stopped drivers to submit to a blood test for THC than to a breath test for BAC, and other tests for THC – such as saliva and urine – are currently less accurate than blood and may underestimate THC blood level, potentially leading to artificially high crash risk estimates for low THC levels.333 The sample sizes
328. Fernando A. Wilson et al., Fatal Crashes from Drivers Testing Positive for Drugs in the U.S., 1993-2010, 129 PUBLIC HEALTH REPORTS 342 (2014).
329. Olaf H. Drummer et al., The Involvement of Drugs in Drivers of Motor Vehicles Killed in Australian Road Traffic Crashes, 36 ACCID. ANAL. & PREV. 239 (2004).
330. Hassan Z. Khiabani et al., Relationship Between THC Concentration in Blood and Impairment in Apprehended Drivers, 7 TRAFFIC INJURY PREV. 111, 112 (2006).
331. M. Carmen del Rio & F. Javier Alvarez, Presence of illegal drugs in drivers involved in fatal road traffic accidents in Spain, 57 DRUG & ALCOHOL DEPENDENCE 77, 179 (2000). In a later study, del Rio et al. (2002) found that of 5745 fatally injured drivers in Spain from 1991-2000, while over 50% tested positive for a substance, 2.2% (127) tested positive for THC. The authors did not report how many tested positive for THC alone, but noted that cocaine was the post prevalent drug, with 54 drivers testing positive for cocaine alone. M. Carmen del Rio et al., Alcohol, Illicit Drugs and Medicinal Drugs in Fatally Injured Drivers in Spain Between 1991 and 2000, 127 FORENSIC SCI. INT’L 63, 66 (2002).
332. Prescription drugs, JAMA (1985), at 20. 333. See Garry Milman et al., Oral Fluid and Plasma Cannabinoid Ratios after Around-the-

2/5/15 4:18 PM
156 CALIFORNIA LAW REVIEW [Vol. XX:nnn
are also much smaller, given the lower incidence of THC use than alcohol use, limiting statistical significance. In addition, the delayed timing of sampling after a crash versus a roadside control tests might both overestimate the relative crash risk associated with low levels of THC, and underestimate the relative crash risk associated with THC overall. More generally, while the predictable and uniform relationship between BAC and alcohol impairment and crash risk allowed increased relative crash risk to be calculated with precision with respect to rising BAC levels, the complexity of THC’s effect on the body makes inferences about level-specific dangerousness significantly more difficult all around.
That said, none of the nine case-control studies conducted thus far on DUI marijuana with randomly-stopped drivers has found a relationship between THC blood levels alone and increased crash risk, much less THC at levels as low as 5 ng/mL. The most comprehensive thus far is Romano et al. (2014), who compared drivers from FARS fatal crash data from 2006-08 with drivers stopped as part of the NHTSA’s 2007 roadside survey. They found no increased crash risk associated with marijuana use itself, in either the THC-only group or the THC-plus-alcohol group.334
A Columbia University study by Li et al. (2013) compared 737 fatal crashes in the United States in 2007 with the NHTSA’s 2007 roadside survey of 7719 drivers. While the authors found that 9.8% of drivers were THC-positive as compared to only 5.6% of the randomly surveyed group, they did not separate those positive only for THC from polydrug users, nor did they differentiate blood level.335
The Norway study by Gjerde et al. (2011) compared tests of drivers in fatal crashes from 2003-08 to oral samples from randomly stopped drivers in the same area from 2005-06.336 After adjusting for “confounding factors,” Gjerde found that the THC-only group was even less likely to be in a crash than sober drivers, albeit at a statistically insignificant level.337
A 2011 European study comparing roadside survey results (oral and blood samples) in 15 countries with drug and alcohol hospital tests on seriously or fatally injured drivers in crashes in a subset of those countries found widely variable rates of THC use in both the overall driver population (zero to 6%) and injured or killed driver population (zero to slightly over 2%). The relative risks they calculated for THC varied widely and did not separate THC-only cases from polydrug cases. 338 The authors’ conclusion, stated with caution because
Clock Controlled Oral Delta-9-Tetrahydrocannabinol Administration, 57 Clinical Chem. 1597, 1603 (2011).
334. Eduardo Romano et al., Drugs and Alcohol: Their Relative Crash Risk, J. STUDIES ON ALCOHOL & DRUGS, Jan. 2014, at 62.
335. G. Li et al., Drug use and fatal motor vehicle crashes: A case-control study. 60 Accid. Anal. Prev. 205, 208 (2013).
336. Gjerde, supra note 317, at 1197-98. The authors collected oral samples, rather than blood samples, in order to ensure that they had plenty of controls since people are pretty reticent to give a blood sample. Id. at 1201.
337. Id. at 1201, Table 3. 338. Inger M. Bernhoft, Results from Epidemiological Research – Prevalence, Risk, and
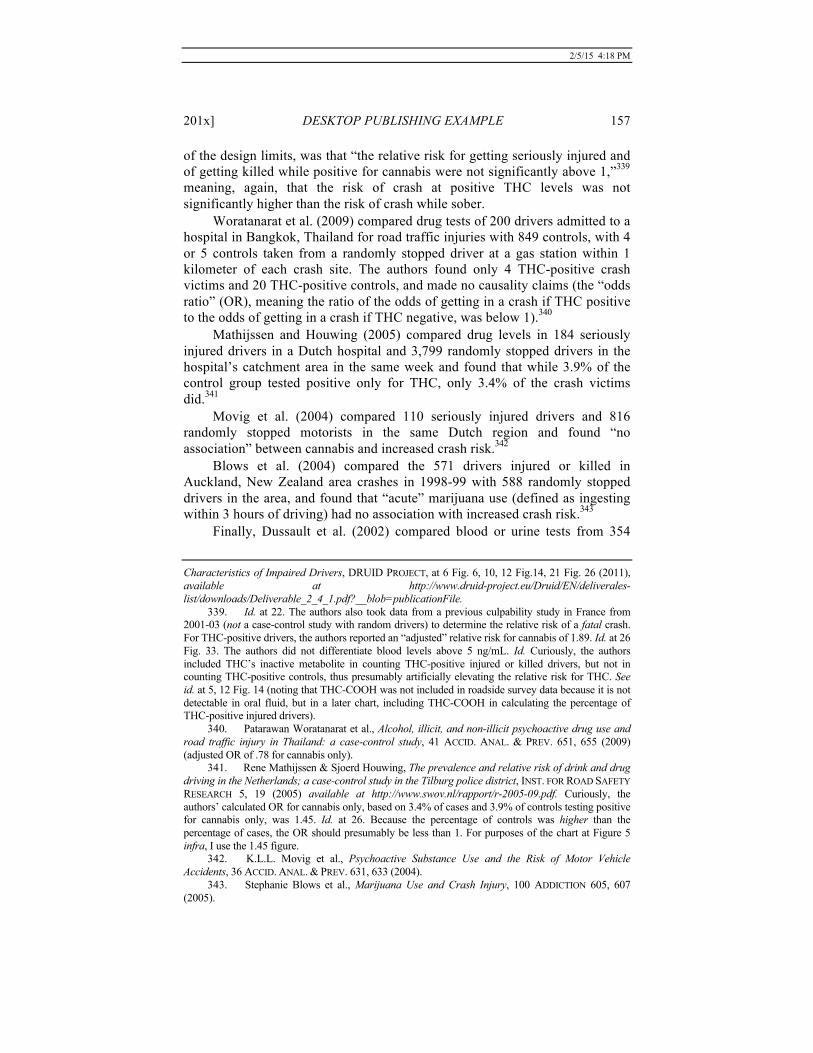
2/5/15 4:18 PM
201x] DESKTOP PUBLISHING EXAMPLE 157
of the design limits, was that “the relative risk for getting seriously injured and of getting killed while positive for cannabis were not significantly above 1,”339 meaning, again, that the risk of crash at positive THC levels was not significantly higher than the risk of crash while sober.
Woratanarat et al. (2009) compared drug tests of 200 drivers admitted to a hospital in Bangkok, Thailand for road traffic injuries with 849 controls, with 4 or 5 controls taken from a randomly stopped driver at a gas station within 1 kilometer of each crash site. The authors found only 4 THC-positive crash victims and 20 THC-positive controls, and made no causality claims (the “odds ratio” (OR), meaning the ratio of the odds of getting in a crash if THC positive to the odds of getting in a crash if THC negative, was below 1).340
Mathijssen and Houwing (2005) compared drug levels in 184 seriously injured drivers in a Dutch hospital and 3,799 randomly stopped drivers in the hospital’s catchment area in the same week and found that while 3.9% of the control group tested positive only for THC, only 3.4% of the crash victims did.341
Movig et al. (2004) compared 110 seriously injured drivers and 816 randomly stopped motorists in the same Dutch region and found “no association” between cannabis and increased crash risk.342
Blows et al. (2004) compared the 571 drivers injured or killed in Auckland, New Zealand area crashes in 1998-99 with 588 randomly stopped drivers in the area, and found that “acute” marijuana use (defined as ingesting within 3 hours of driving) had no association with increased crash risk.343
Finally, Dussault et al. (2002) compared blood or urine tests from 354 Characteristics of Impaired Drivers, DRUID PROJECT, at 6 Fig. 6, 10, 12 Fig.14, 21 Fig. 26 (2011), available at http://www.druid-project.eu/Druid/EN/deliverales-list/downloads/Deliverable_2_4_1.pdf?__blob=publicationFile.
339. Id. at 22. The authors also took data from a previous culpability study in France from 2001-03 (not a case-control study with random drivers) to determine the relative risk of a fatal crash. For THC-positive drivers, the authors reported an “adjusted” relative risk for cannabis of 1.89. Id. at 26 Fig. 33. The authors did not differentiate blood levels above 5 ng/mL. Id. Curiously, the authors included THC’s inactive metabolite in counting THC-positive injured or killed drivers, but not in counting THC-positive controls, thus presumably artificially elevating the relative risk for THC. See id. at 5, 12 Fig. 14 (noting that THC-COOH was not included in roadside survey data because it is not detectable in oral fluid, but in a later chart, including THC-COOH in calculating the percentage of THC-positive injured drivers).
340. Patarawan Woratanarat et al., Alcohol, illicit, and non-illicit psychoactive drug use and road traffic injury in Thailand: a case-control study, 41 ACCID. ANAL. & PREV. 651, 655 (2009) (adjusted OR of .78 for cannabis only).
341. Rene Mathijssen & Sjoerd Houwing, The prevalence and relative risk of drink and drug driving in the Netherlands; a case-control study in the Tilburg police district, INST. FOR ROAD SAFETY RESEARCH 5, 19 (2005) available at http://www.swov.nl/rapport/r-2005-09.pdf. Curiously, the authors’ calculated OR for cannabis only, based on 3.4% of cases and 3.9% of controls testing positive for cannabis only, was 1.45. Id. at 26. Because the percentage of controls was higher than the percentage of cases, the OR should presumably be less than 1. For purposes of the chart at Figure 5 infra, I use the 1.45 figure.
342. K.L.L. Movig et al., Psychoactive Substance Use and the Risk of Motor Vehicle Accidents, 36 ACCID. ANAL. & PREV. 631, 633 (2004).
343. Stephanie Blows et al., Marijuana Use and Crash Injury, 100 ADDICTION 605, 607 (2005).
2/5/15 4:18 PM
158 CALIFORNIA LAW REVIEW [Vol. XX:nnn
fatally injured drivers in Quebec from 1999-2001 and urine tests of 5,931 randomly stopped drivers in August 1999 and August 2000 at similar times of day, proportionately, to the fatal crashes.344 They found that 19.5% of the fatally injured drivers and 6.7% of the randomly stopped drivers tested positive for THC and/or some other drug.345 but did not state what percentage of these drivers also tested positive for alcohol,346 did not provide blood levels, tested for the inactive compound THC-COOH, and had less than a 50% voluntary participation rate among controls, suggesting a selection bias that would significantly inflate relative risk estimates.347
c. “Culpability” Studies Because of the difficulty in conducting THC crash-risk studies involving
randomly selected, similarly situated drivers as controls, researchers have instead generally settled for “culpability” analyses.348 A culpability study looks at a group of drivers involved in crashes, and divides them into two groups – those who are “culpable” for their crash, and those who are not. Researchers use the non-culpable group as a control, and compare the percentage of drivers with various qualities – such as testing positive for THC – within the two groups. If THC-positive drivers are overrepresented in the culpable group, the logic goes, one can infer causality and can calculate an OR expressing the increased odds of being in a crash due to a driver’s THC use. Traffic safety researchers now generally determine “culpability” of a driver based on eight “mitigating” factors suggested by Olaf Drummer in 1994: “the condition of the road, the condition of the vehicle, general driving conditions, the type of crash, witness observations, road law obedience, the difficulty of the task involved and the level of fatigue.” The driver is assigned a “score” for each factor based on the level of mitigation (4 being the worst the condition could be and therefore the most mitigating).349
There are significant potential problems with this approach, when compared to case-control studies with randomly selected drivers under identical conditions that formed the basis for .08% BAC laws. First, the scores are
344. C. Dussault et al., The contribution of alcohol and other drugs among fatally injured drivers in Quebec: some preliminary results, in ROAD TRAFFIC AND PSYCHOACTIVE SUBSTANCES, at 215 (2004), available at https://wcd.coe.int/com.instranet.InstraServlet?command=com.instranet.CmdBlobGet&InstranetImage=889972&SecMode=1&DocId=1279432&Usage=2#page=215. 345 Id. at 218-19. 346 See id. at 218-19.
347. Id. at 215. The authors did report that drivers using “cannabis alone” had an OR of 2.2 for crash risk and OR of 1.2 for culpability, whereas “cannabis + alcohol” had a stunningly high OR of 80.5 and OR of 2.5 for culpability. Id. at 221 Table 1. But the “cannabis + alcohol” category included only BACS above .08%, id., even though the categories purported to cover “all cannabis cases,” suggesting that the “cannabis only” category included cases with cannabis and BACs between zero and .08%.
348. See, e.g., J.G. Ramaekers, Dose related risk of motor vehicle crashes after cannabis use, 73 DRUG & ALCOHOL DEPENDENCE 109, 110 (2004) (“Epidemiologists have tried to overcome the lack of normative data from the general driving population by analyzing the culpability index of drivers involved in traffic accidents.”).
349. Longo, supra note 321, at 625 (listing Drummer (1994)’s eight mitigating factor test).

2/5/15 4:18 PM
201x] DESKTOP PUBLISHING EXAMPLE 159
somewhat subjective, based on the researcher’s (or, in some studies, the reporting police officer’s) own assessment of the circumstances of a crash.350 Second, as with other THC studies, there are so few drivers with only THC in their system that inferences in favor of causation from THC by itself are difficult to draw. One reason may be that THC users do not drive as much as alcohol users; another may be the major overlap between high-risk demographics and cannabis-user demographics: young, male, with a high drunk-driving incidence.351 Third, as with other THC studies, the generalizable inferences that can be drawn from culpability studies are limited by the numerous factors that affect the psychoactive qualities of cannabinoids.352 For these and other reasons, one researcher at the Harvard School of Public Health recently concluded that culpability studies generally can only be said to accurately measure whether someone crashed without an “identifiable external cause,” or whether an individual crashed in “good” driving conditions.353 On the other hand, culpability studies have been criticized for underestimating crash risk attributable to THC, because the “baseline crash risk in non-culpable drivers is biased upwards,”354 and because some early culpability studies finding no association between THC and crash risk counted a positive test for the inactive metabolite THC-COOH as being “positive” for THC.355
Of course, as Haddon recognized, the most probative culpability study of all is of single-car nighttime fatal crashes. With these crashes, we do not need an eight-factored test to infer culpability from the presence of alcohol or drugs in a driver’s body. Researchers would have much more valuable and objective data simply from conducting more single-car crash studies than from culpability analyses, and such studies would not be prohibitively difficult, so long as drivers are tested shortly after crashes. Moreover, the fact that the single-car crash studies that have been conducted appear to strongly suggest a lack of causality should give lawmakers and researchers pause before inferring causality from the culpability studies that do exist.
In any event, the culpability studies that have been done with respect to THC blood levels and fatal crashes have either not been relevant to, or have come to different conclusions about, whether THC alone is associated with increased crash risk. Some have found little to no association, or even a negative one. Poulsen (2014) reported curious results: an OR of 1.42 (a 42% increase in odds of crash over sober drivers) for THC levels below 2 ng/mL, a
350. Cf. Prachi Sanghavi, Using Culpability Analysis To Infer Crash Risk Requires
Unrealistic Assumptions, 43 INT’L J. EPIDEMIOLOGY 272, 272 (2014) (using cell phone studies as an example).
351. See Rebecca L. Hartman & Marilyn A. Huestis, Cannabis Effects on Driving Skills, 59 Clinical Chemistry 478, 479 (2013).
352. Hartman & Huestis, supra note 351, at 478. 353. Prachi Sanghavi, Culpability Analysis Won’t Help Us Understand Crash Risk Due To
Cell Phones, 42 INT’L J. EPIDEMIOLOGY,, 267, 267-68 (2013). 354. Mark Asbridge et al., Acute Cannabis Consumption and Motor Vehicle Collision Risk:
Systematic Review of Observational Studies and Meta-analysis, 344 BMJ E536, at 4 (2012). 355. See, e.g., Ramaekers, supra note , at 110 (noting that Terhune (1992) tested for both
THC and THC-COOH).

2/5/15 4:18 PM
160 CALIFORNIA LAW REVIEW [Vol. XX:nnn
lower OR (a lesser odds of crashing than sober drivers) for levels between 2-5 ng/mL, and an OR of 1.61 for THC levels above 5 ng/mL. Because of the small sample size, the confidence intervals ranged from .44 to 4.22 for various levels.356 Longo (2000) used Drummer’s technique and found, in a study of 2500 non-fatally-injured drivers in Australia from 1995-96, drivers who tested positive only for THC were no more likely than drug-free drivers to have been “culpable” in a non-fatal crash.357 Terhune et al. (1992) found that the “responsibility rates” of THC-only drivers were “actually lower than that of the drugfree drivers.”358 Other studies have found no association between THC and crash risk but have been discounted by researchers because of some unusual aspect of study design.359
Other culpability studies have claimed a positive association between THC-only drivers and increased crash risk, but the inference of causality from each of them is questionable. The two most cited are Drummer (2004) and Laumon (2005). Of the 3398 fatally injured drivers in Drummer’s Australian study, only 58 had only THC in their blood, and only 9 had THC levels below 5 ng/mL; the median was 12 ng/mL.360 With this small sample, Drummer calculated a .7 OR for THC concentrations below 5 ng/mL, and a 6.6 OR for the vast range between 5 and 100 ng/mL. He acknowledged the possibility of confounding factors, the fact that the ORs did not “imply a similar increase in [relative] crash risk,” and that “[n]either the size nor the statistical significance of the associations we observed can be used to directly infer causality.”361 Other researchers have tried to extrapolate what a relative crash risk might be at THC levels of 6-20 ng/mL based on Drummer’s data set, and claim to have found a slightly higher chance of a crash (compared to a sober driver) at levels above 6 ng/mL. But researchers seem in agreement that extrapolations based on such miniscule sample sizes are not a “statistically acceptable basis” for drawing conclusions about blood levels and crash risk.362
356. Poulsen, supra note , at 125 Table 5. 357. Longo, supra note 321, at 626. Others have criticized Longo’s study for using a THC
cut-off amount that is much too high (40 ng/mL) to capture low levels of THC in drivers. See, e.g., P. Mura et al., Comparison of the prevalence of alcohol, cannabis and other drugs between 900 injured drivers and 900 control subjects: Results of a French collaborative study, 133 FORENSIC SCI. INT’L 79, 80 (2003).
358. K.W. Terhune et al., The Incidence and Role of Drugs in Fatally Injured Drivers, NHTSA, at 65 (1992), available at http://ntl.bts.gov/lib/26000/26600/26685/DOT_HS_808_065.pdf.
359. See, e.g., Drummer et al., supra note 329, at 240 (reviewing previous culpability studies, including one, Lownestein and Koziol-Mclain (2001), that found increased crash risk only for alcohol and alcohol in combination with drugs, but used only urine testing for THC; and Williams et al. (1985), which found no association “but the numbers of drivers were small”); Longo (2000), supra note 321, at 624 (noting that Terhune found a decreased crash risk for THC alone, and that most previous studies had very small sample sizes for THC alone). See also Grotenhermen et al. (2007), supra note 285, at 17-20 (finding, in a metaanalysis of existing studies, no association between increased accident risk and cannabis blood levels below 10 ng/mL).
360. Drummer et al., supra note 329, at 244. 361. Id. at 245-46. 362. See Grotenhermen, supra note 285, at 1912 fig. 1. The researchers, who shared their
unpublished estimations in personal communications with Grotenhermen, estimated an OR of 2 at 8 ng/mL, up to an OR of nearly 7 at 13 ng/mL. Id.

2/5/15 4:18 PM
201x] DESKTOP PUBLISHING EXAMPLE 161
Laumon (2005)’s culpability study on over 10,000 drivers involved in fatal crashes in France from 2001-03 suffered from similar flaws. The samples were not taken until three to four hours after the incident, and some drivers with low but non-zero BACs were listed as “null BAC,” thus overreporting the number of “THC-only” cases.363 Moreover, the authors do not appear to have separated the THC-only cases from drivers with THC and other drugs in their system.364 A 2012 metastudy of nine case-control or culpability studies chosen for their use of blood-only samples and testing for THC and its active metabolite found that drivers with “acute cannabis consumption” were twice as likely as sober drivers to be in a fatal crash, but noted that “the studies in our review did not have enough data on [THC] concentration to examine dose-response effects.”365
The following graphs juxtapose Borkenstein and Blomberg et al.’s data on BAC and relative crash risk with the data from the 11 case-control and culpability studies on marijuana that separate THC from other drugs (those 8 studies with straight lines offer only one relative risk estimate for THC without measuring or distinguishing precise blood levels):
Fig. 4. BAC and relative crash risk, from Borkenstein et al., Krüger & Vollrath, and
Blomberg et al. data366
363. See id. at 1913. 364. See Laumon, supra note , at 4 (separating BAC-negative drivers out from THC-positive
drivers, but apparently not those testing positive for other drugs). 365. Asbridge et al., supra note , at 4-5. One additional culpability study, Bédard (2007),
found an association between cannabis and increased crash risk. They looked to FARS data on fatally injured drivers from 1993 to 2003 (N=314,636), used citation for a driving infraction (like speeding) as a proxy for culpability, and found that cannabis-positive (and BAC-negative) drivers had a modestly higher OR of 1.29. The authors did not, however, separate THC-only cases from polydrug cases, or THC from its metabolites, and gave no blood level data. Michel Bédard et al., The Impact of Cannabis on Driving, 98 CANADIAN J. PUB. HEALTH 6, 8-10 (2007).
366. The data points are reproduced, with permission, from Blomberg et al. (2005) at xviii,

2/5/15 4:18 PM
162 CALIFORNIA LAW REVIEW [Vol. XX:nnn
Fig. 5. THC blood levels and relative crash risk, from all case-control and culpability
studies offering results for THC-only367 The differences between the graphs are almost cartoonishly stark. The
THC study results are inconsistent and generally not level-specific. Six of the studies indicate a decrease in crash risk at low levels of THC, compared to sober drivers. And the only line showing any significant increase at levels higher than 6 ng/mL, shown by Drummer et al. (2004), is an unpublished extrapolation from a study with a concededly insignificant sample size and an acknowledged possibility of confounding factors. In short, based on current studies, there is simply no established predictable or linear relationship between THC blood levels and relative risk of crash.
d. Simulated and on-road concentration-specific driver impairment studies.
As the scientists studying alcohol recognized, the most probative evidence of dangerous impairment comes from epidemiological studies of crashes, not impairment studies. For one thing, impairment studies’ “sensitivity to pharmacological drug effects” is much higher than that of crash risk studies; hence, while alcohol impairment studies show widespread impairment at BACs as low as .02%, crash risk does not predictably increase until at least .05%
Table ES-1.
367. Some studies expressed their results in terms of odds ratios; others in terms of relative risk. Others treat the two as interchangeable (the relative risk and odds ratio approach the same value when the absolute crash risk is low). I calculated the relative risk for THC-only from Terhune (1992) based on the reported percentage of culpable controls and culpable THC-only drivers (67.7% versus 57.9%) and the estimated relative risk equation used by Terhune listed at Terhune, supra note 358, at 78. To give the benefit of the doubt to the culpability studies, I have also included the attempts documented in Grotenhermen (2007) to extrapolate data from Drummer (2004) to levels from 6-20 ng/mL, and have included the Laumon (2005) data even though it is not clear that the THC-only ORs do not also include polydrug use.
2/5/15 4:18 PM
201x] DESKTOP PUBLISHING EXAMPLE 163
BAC.368 Still, impairment studies can help confirm and explain the causal link between drug use and crashes. Alcohol-related studies of impairment were particularly probative because subjects could ethically be given a wide range of doses of the drug and could drive in realistic conditions; because the dosage of alcohol corresponded predictably to level of BAC; and because as BAC rose, impairment effect with respect to specific driving-related skills rose as well.
In contrast, THC impairment studies suffer from several inherent difficulties, mirroring the difficulties in establishing any predictable relationship between THC blood levels and crash risk. First, while there have been scores of studies of THC and cognitive and psychomotor impairment, nearly all have been dosage-related (the amount of THC given to the subject to ingest) rather than blood-level-related (the amount of THC the subject has in her blood), and the dosages given to subjects have created widely varying blood levels.369 Second, frequent cannabis users are systematically underrepresented in such studies, potentially underestimating tolerance effects.370 Third, blood levels vary widely in the level of cognitive and psychomotor effect to which they correspond. Two comprehensive metastudies on THC and impairment concluded that the “relationship between THC [blood levels] and street driving performance is equivocal”371 and that “[t]he debate” over marijuana and impairment “is complicated by the temporal dissociation of THC concentrations from acute driving impairment.”372
Even within the inherent limits of dosage studies, the impairing effects vary greatly depending on the person and the skill involved. Some dosage studies show minimal to no impairment effect in most people at low to medium doses of THC.373 One study concluded that after “about three hours” the impairment effects of even a “strong social dose” of 15-20 mg is “comparable to a BAC of less than 0.03%.”374 And while alcohol tends to affect “complex driving functions” (like anticipation of traffic or reaction time) most and “automatic” functions (like tracking performance) least, THC tends to do the opposite.375 Thus, while “automatic” skills in one study were affected by
368. Ramaekers et al. (2006), supra note , at 120-21. 369. See, e.g., M.G. Lenne et al., The effects of cannabis and alcohol on simulated arterial
driving: Influences of driving experience and task demand, 42 Accid. Anal. & Prev. 859, 861 (2010). 370. See, e.g., Khiabani et al., supra note , at 111 (noting that experimental THC impairment
studies might underestimate tolerance effects because study subjects are almost always infrequent users).
371. Erin Kelly et al., A Review of Drug Use and Driving: Epidemiology, Impairment, Risk Factors and Risk Perceptions, 23 Drug & Alcohol Review 319, 326 (2004).
372. Hartman & Huestis, supra note , at 483. 373. See, e.g., C.T.J. Lamers & J.G. Ramaekers, Visual Search and Urban City Driving
Under the Influence of Marijuana and Alcohol, 16 HUM. PSYCHOPHARMACOL. 393 (2001) (finding that doses of 100 µg/kg of THC had minimal effect on nighttime city driving).
374. Franjo Grotenhermen et al., Developing Science-Based Per Se Limits for Driving Under the Influence of Cannabis (DUIC), Sept. 2005, at 6 [hereinafter Grotenhermen et al. (2005)], available at http://www.canorml.org/healthfacts/DUICreport.2005.pdf.
375. Id. See also Anthony Liguori et al., Separate and combined effects of marijuana and alcohol on mood, equilibrium and simulated driving, 163 PSYCHOPHARMACOLOGY 399, 404 (2002) (noting no effect of THC dosages on brake latency, unlike alcohol); Annick Menetrey et al., Assessment of driving capability through the use of clinical and psychomotor tests in relation to blood

2/5/15 4:18 PM
164 CALIFORNIA LAW REVIEW [Vol. XX:nnn
dosages of, say, 6 milligrams of THC, more “complex” skills remained unaffected by dosages of up to 18 milligrams,376 an amount equal to about two sellable marijuana “edibles” in Colorado.377 One hypothesis for this difference is that, unlike drinking drivers’ tendency to underestimate risk, THC-intoxicated drivers overcompensate for a known risk by slowing down or keeping distance.378
This difference between impairment of automatic and complex skills was also observed in the most realistic study to date, one that would make Herman Heise himself blush. Researchers gave subjects placebos or a mix of ethanol, orange juice, and Grand Marnier, followed by a marijuana joint 60 minutes later, and sent them off into urban “normal traffic” with a guide who had concurrent controls over the car.379 They found that while the THC-alcohol mix caused significant impairment of certain skills, the lower THC dosage lacked any “appreciable effect” on anything but tracking performance, and the higher dosage alone “had an effect that only approached significance” on skills other than tracking.380
A handful of tests have looked to THC blood levels rather than simply dosage, but have not found consistent or significant impairment in most users. One metastudy in 1998 found that even at levels of 60-70 ng/mL of THC in blood serum (meaning about 30-35 ng/mL in whole blood), fewer than half of subjects experienced “significant” impairment in all categories of driving-related skills. While the percentage was higher at slightly lower serum levels, the relationship was not linear.381 Papafotiou et al. (2005) found that subjects who smoked a marijuana cigarette were significantly impaired 80 minutes (but, curiously, not 30 minutes) after ingestion, but found that “the level of THC in the blood does not provide an accurate and reliable indicator of whether driving performance is impaired.”382 Laboratory tests, while not as probative as more cannabinoids levels following oral administration of 20 mg dronabinol or of a cannabis decoction made with 20 or 60 mg delta-9-THC, 29 J. Anal. Toxicol. 327, 336 (2005) (finding no effect on reaction time in driving test after 20 and 60 mg THC doses, but finding an effect on tracking performance). 376 Grotenhermen et al., supra note 374, at 6.
377. See, e.g., Keith Coffman, Colorado’s Edible Pot Facing Proposed Tighter Rules on Packaging, Potency, WASH. POST, Aug. 3, 2014, available at http://www.washingtonpost.com/local/colorados-edible-pot-facing-proposed-tighter-rules-on-packaging-potentcy/2014/08/03/473643be-1b4d-11e4-ae54-0cfe1f974f8a_story.html.
378. See, e.g., Grotenhermen et al. (2007)., supra note 285, at 1915. 379. See J.G. Ramaekers et al., Marijuana, Alcohol, and Actual Driving Performance, 15
HUM. PSYCHOPHARMACOL. CLIN. EXP. 551, 552 (2000). The joints had 100-200 µg/kg, which corresponds to 7-14 mg. Hartman & Huestis, supra note , at 487.
380. Ramaekers et al., supra, 341 at 554. See also H. Robbe, Marijuana’s Impairing Effects on Driving Are Moderate When Taken Alone But Severe When Combined with Alcohol, 13 HUM. PSYCHOPHARMACOL. CLIN. EXP. S70, S77-78 (1998) (finding that a 7-21 mg dose of THC had a “small” or “moderate” effect, mostly on road tracking, and concluding that “it is not possible to conclude anything about a driver’s impairment on the basis of his/her plasma concentrations of THC” or its metabolites).
381. Grotenhermen et al. (2005), supra note 374, at 28 Fig. 5. 382. K. Papafotiou, The relationship between performance on the standardised field sobriety
tests, driving performance and the level of delta-9-tetrahydrocannabinol (THC) in blood, 155 FORENSIC SCI. INT’L 172, 178 (2005) (emphasis added).

2/5/15 4:18 PM
201x] DESKTOP PUBLISHING EXAMPLE 165
realistic impairment studies, similarly indicate no predictable relationship between blood levels and impairment levels.383 Moreover, studies have consistently shown that THC blood levels in chronic users can and often do remain constant, and over 5 ng/mL, for days or even weeks after last use.384
While these inconclusive results on impairment do not prove that THC-positive drivers are not dangerous at certain blood levels, at the very least they suggest that marijuana as chemical impairment, if it is to be scientifically proven, will have to be first and foremost through epidemiological studies of crashes.
III. THE ROAD AHEAD: CRAFTING LEGITIMATE DRUGGED DRIVING LAWS
UNDER A SCIENCE-BASED JURISPRUDENCE OF DANGEROUSNESS Until lawmakers and the public understand the DUI alcohol story, they are
doomed to deploy inapt analogies to it in ways that do violence to the scientific ethic of the Haddon era, the decades of research underlying the justification for the per se DUI alcohol regime, and the principles of just punishment. The first step on the road to a legitimate chemical impairment law for marijuana, then, will be to ensure that policymakers appreciate the difference between choosing a jurisprudence of prohibition and jurisprudence of dangerousness; accept the fact that per se limits for legal drugs must be justified in terms of its scientifically demonstrated link to dangerous driving; and understand the significance of single-car and case-control crash risk studies in connecting specific drug concentrations to specific levels of risk.
The dire consequences of maintaining an illegitimate per se DUI marijuana regime are twofold. The first is, simply, injustice. There are, of course, the most obviously sympathetic cases of medical marijuana patients who wake up in the morning at 10 ng/mL and will be unfairly labeled as
383. See, e.g., J.G. Ramaekers et al., Cognition and motor control as a function of delta 9-THC concentration in serum and oral fluid: limits of impairment, 85 DRUG & ALCOHOL DEPENDENCE 114, 119 (2006) (finding that “linear relations” between THC serum levels and impairment levels existed but “were rather low,” and that the “lack of a strong association seems to indicate that serum THC cannot be taken as an accurate predictor of the magnitude of performance impairment”); Khiabani et al., supra note , at 112 (finding that in a test of 589 THC-only drivers stopped for suspected drugged driving, most passed all physician-administered clinical tests for impairment, including 43% of drivers greater than 10 ng/mL); Grotenhermen et al. (2007) , supra note , at 1913 (noting studies showing that while driving instructors rated subjects at .04% BAC as “impaired,” police rated subjects who had consumed 7 mg of THC as “unimpaired” and subjects at .08% BAC as “more impaired” than the cannabis users); Amy J. Porath-Waller & Douglas J. Beirness, An Examination of the Validity of the Standardized Field Sobriety Test in Detecting Drug Impairment Using Data from the Drug Evaluation and Classification Program, 15 Traffic Injury Prevention 125, 129 (2014) (citing studies showing no effect of cannabis on FSTs, including “walk and turn” (WAT) or horizontal gaze nystagmus (HGN) tests, except the “one leg stand”); Ginsburg et al. (2014), supra note 267, at 7 (concluded that “the lack of impairment . . . at early time points after THC administration (when blood levels were highest) indicates that blood levels of THC may not be an appropriate instantaneous measure of impairment at any threshold”).
384. See, e.g., Ginsburg et al. (2014), supra note 267, at 2,3; M.M. Bergamaschi et al., Impact of prolonged cannabinoid excretion in chronic daily cannabis smokers’ blood on per se drugged driving laws, 59 Clin. Chem. 519 (2013).

2/5/15 4:18 PM
166 CALIFORNIA LAW REVIEW [Vol. XX:nnn
criminals if they are stopped, tested, and prosecuted for DUI. But even putting these cases aside, drivers who smoke and drive – like drivers who drink and drive – are simply not worthy of criminal punishment under a jurisprudence of dangerousness unless they are dangerous. Whether one is a retributivist or utilitarian, punishment without purpose is immoral. The consequences of any DUI conviction are grave, affecting not only physical liberty but potentially opportunities for housing, voting, juror service, gun ownership, and employment.
One could imagine the cynical response that, even if a 5 ng/mL DUI marijuana law has no legitimate penal purpose, lawmakers must sometimes “ris[e] above principle”385 for the sake of tackling an otherwise intractable social ill like drugged driving. Even assuming the value of such an approach in the abstract, its logic in the marijuana context is as shortsighted as it is specious. First, the question whether dangerous driving from marijuana impairment is a prevalent problem to begin with is left unanswered by the current unscientific approach to studying the relationship between cannabis and crash risk. Second, the more our criminal law deviates from legitimate bases for punishment, and the more the definition of criminality brings average citizens into the fold, the more jurors will acquit and the more the penal regime will appear both ineffective and illegitimate.
Most fundamentally, to the extent stoned driving is indeed a burgeoning public health crisis, settling for an unscientific approach hinders the search for real solutions to that crisis. In a world in which the only goal of state officials is to generate evidence of THC blood levels for successful DUI marijuana prosecutions, rather than to truly understand the connection between blood levels, impairment, and crash risk, critical research will never be done. For example, while the future appears to hold the possibility of a breath test for THC that might have a shorter window of detection and allow quicker sampling of stopped motorists,386 such a test is still in its early experimental phase.387 Researchers are also working to develop tests to more accurately indicate timing and extent of drug use from saliva, sweat, and hair samples.388 Others have suggested the use of “pupillometry” and eye tracking389 to better measure drug impairment, though such methods are currently limited by a number of
385. See Geoffrey C. Hazard, Jr., Rising Above Principle, 135 U. Pa. L. Rev. 153 (1986). 386. See DUI Conviction Rate Study, supra note *, at x (“There are no devices available like
hand-held alcohol breathalyzer devices to detect drugs.”); M.L. Chipman et al., Being “at fault” in traffic crashes: Does alcohol, cannabis, cocaine, or polydrug abuse make a difference? 9 INJURY PREV. 343, 343 (2003) (noting that “[u]ntil a test of breath or saliva, analogous to the breath tests for alcohol, exists for other substances,” reliable case-control studies will be difficult to perform).
387. See Sarah K. Himes et al., Cannabinoids in Exhaled Breath Following Controlled Administration of Smoked Cannabis, 59 CLINICAL CHEM. 1780 (2013).
388. NHTSA REPORT (2010) at 5; see also Ramaekers et al. (2006), supra note , at 118-19 (confirming a strong correlation between THC serum and oral fluid levels, and that oral testing might hold promise for “easy-to-use, non-invasive roadside drug tests” in the future).
389. Wallace B. Pickworth & Rudy Murillo, Pupillometry and Eye Tracking as Predictive Measures of Drug Abuse, in PHARMACOKINETICS AND PHARMACODYNAMICS OF ABUSED DRUGS 127, 140 (2008) (finding that “several classes of commonly abused drugs,” including smoked marijuana, have “specific, dose-related effects” on “pupil size and measures of the light reflex.”).

2/5/15 4:18 PM
201x] DESKTOP PUBLISHING EXAMPLE 167
confounding factors.390 Better roadside surveys could also be developed to give a valid baseline for case-control studies of THC levels and crash risk, such as the voluntary roadside swab program for suspected DUI drug motorists begun in 2014 by the Los Angeles City Attorney and Police Department.391 And drug impairment prosecutions could benefit from increased use of dashboard cameras and body-worn cameras (BWCs) in DUI patrol cars, to corroborate officer testimony and FSTs. Finally, quicker and more accurate data collection after fatal car crashes – particularly single-car crashes – will be critical to studying marijuana as chemical impairment through Haddon’s framework.392
Once better roadside surveys and better data collection after crashes are available, researchers will be able to conduct the type of case-control studies that Borkenstein accomplished in the Grand Rapids Study. Specifically, case-control studies in the future should have the following characteristics to adhere to the Haddon framework:
• Blood testing rather than oral fluid or urine testing, to avoid artificially low THC-blood estimates, until a suitably reliable alternative testing method is developed;
• Large enough sample sizes in both control and driver populations to capture a statistically significant group of THC-only drivers;
• Randomly selected control driver population subject to the same conditions (time of day, etc.) as the fatal/injured driver population;
• Testing of THC alone, without its two metabolites, and without combination with alcohol or other drugs;
• Differentiation of blood levels up to a high enough number to reveal relative crash risk at low, moderate, and high levels; and
• Adjustment for remaining confounding factors such as age and sex.
Settling for an unprincipled criminal law also blinds lawmakers to an additional option for addressing drugged driving beyond current criminal impairment laws: the regulatory state. If lawmakers truly believe that low levels of THC cause impairment worthy of regulation, but cannot prove through science that blood levels can be linked through crash risk data to morally blameworthy behavior, then regulatory law, rather than penal law, might provide a legitimate means to tackle the issue. After all, early reports from the
390. The “practical utility” in using pupil size and light reflex to detect recent ingestion of drugs is limited by substantial variability among persons; the “small and transient” effect of the drugs; the level of ambient light in the surrounding area at the time of measurement; and the effect of other physical conditions such as fatigue, disease, or legal drug use. Pickworth & Murillo at 139.
391. Melissa Pamer, LAPD Highlights New Roadside Swab Drug Test, KTLA5 NEWS, Dec. 27, 2013, available at http://ktla.com/2013/12/27/lapd-highlights-new-roadside-swab-drug-test/. 392 See, e.g., Berning & Smither, supra note 250, at 3 (“As more complete data becomes available, FARS data on drug-involved driving will be strengthened.”).

2/5/15 4:18 PM
168 CALIFORNIA LAW REVIEW [Vol. XX:nnn
medical profession on the hazards of drugged driving focused not on the need to criminalize or even regulate such behavior, but simply on the need to curb it through sound advice from drug users’ physicians.393 For what it is worth, even some of the sponsors of per se bills appear to think that is what they are really trying to do. As one Colorado legislator curiously insisted in defending that state’s permissive inference of criminal guilt at 5 ng/mL, “This is a regulatory bill, not a criminal justice bill.”394 If that is indeed the purpose of such laws, then their consequences should be changed to match their justification.
CONCLUSION Per se THC-limit DUI marijuana laws, as currently conceived, serve no
legitimate penal purpose. They are not justified under a jurisprudence of prohibition, because they do not seek to punish the immorality of possessing marijuana. In the growing number of states in this country where marijuana is legal or decriminalized, the jurisprudence of prohibition is simply unavailable as a justification for criminal punishment of the simple act of driving with some amount of marijuana in one’s body.
Such laws are also not justified under a jurisprudence of dangerousness. As this Article has uncovered, what makes the emptiness of the dangerousness justification so obvious in the marijuana context is the detailed history of alcohol science and the drunk driving jurisprudence built on that science. Properly understood, this history – William Haddon’s legacy – becomes the compulsory agenda for using the criminal law as an instrument of public safety. Instead of adhering to Haddon’s framework, states with per se THC limits have focused solely on finding a number – any number – to analogize to DUI alcohol’s .08% BAC limit, without first choosing a legitimate purpose for punishing drugged driving and finding a definition of the crime that serves that purpose. State officials have forgotten that the venerable .08% limit itself was the result of decades of careful single-car crash studies and case-control studies showing a predictable and significant relationship between BAC and crash risk. Even then, .08% was controversial and arguably on the edge of what the American public was willing to condemn through the criminal law. In the marijuana context, single-car crashes and case-control studies are rare and, to the extent they exist, suggest no predictable relationship between THC blood levels and crash risk. In short, the illegitimacy of per se THC limits as an attempted analog to .08% is not a close call.
Revealing the lack of science behind per se DUI marijuana laws is not only important in its own right, as a critique of an otherwise soon-to-be ubiquitous criminal regime in this country, but also as a case study revealing the perils of technology as a potentially distorting force in modern criminal
393. See, e.g., Carlos J.G. Perry & Alan L. Morgenstern, Committee on Medical Aspects of
Automotive Safety and Council on Drugs, Drugs and Driving, 195 J. AM. MED. ASSOC. 132 (Jan. 31, 1966).
394. See Eli Stokols, Lawmakers finally send marijuana DUID measure to Hickenlooper, FOX31 DENVER NEWS, at http://kdvr.com/2013/05/06/monday-afternoon-floor-fight-looms-on-duid-bill/.

2/5/15 4:18 PM
201x] DESKTOP PUBLISHING EXAMPLE 169
law. Per se THC limits are prime examples of what James Scott describes as “heroic simplification” of a social problem by the state.395 In the administrative context, this distortion has come in the form of “policies involving simple questions and answers that are easy to translate into code, even when strong substantive reasons favor a more nuanced approach.”396 In the abortion context, such simplification arguably came in the form of what many scholars describe as the “morally arbitrary” line of viability, a bright line borrowed from the scientific community that changed as technology improved, and that the Court never seemed to treat as urgently in need of a connection to legal principle.397
Likewise, machines like the Drunk-O-Meter transform what was once a complex jury judgment about a driver’s “impairment” into a simple machine judgment about BAC. The availability of the machine uniquely allowed state officials to reduce the problem of impairment to an easily determinable element. As Jonathan Simon has suggested, simplicity in service to the state is especially problematic in criminal justice, given the ever-present possibility that “prosecutorial and judicial procedures have been smoothed or simplified to eliminate possible sources of resistance.”398 By focusing singemindedly on making DUI marijuana convictions easier through machine results comparable to the Drunk-O-Meter and its progeny, rather than focusing on the legitimacy of punishment, public officials have “allowed technical knowledge, arbitrarily, to dictate the path of justice.”399
This is not to say that drugged driving is not a public health problem, nor that the criminal law has nothing to offer as a means of combatting it. With better detection methods and more comprehensive data collection on crash-involved drivers and dose-specific drug prevalence in the overall driving population, it might be that we will find a scientific way to measure marijuana as chemical impairment. Or, at least, we might find a way to identify a numerical threshold high enough to ensure no “false positives” but low enough to detect at least some intoxicated drivers who might be acquitted under a subjective impairment standard. If not marijuana, then we might be able to measure other illicit and prescription drugs that turn out to have a more predictable relationship between dosage or measurable amount in the body and risk of harm.
But if marijuana is truly impossible to measure in a way that allows for a coherent per se DUI law in the foreseeable future based on THC blood levels, then the answer should not be to settle for incoherency in our criminal law in the name of securing more convictions. The answer should be to settle for an imperfect subjective impairment standard for criminal DUI marijuana laws, and
395. JAMES C. SCOTT, SEEING LIKE A STATE 8 (1998). 396. Citron (2008) at 1255. 397. See, e.g., Randy Beck, Gonzales, Casey, and the Viability Rule, 103 N.W. U. L. REV. 249
(2009). 398. Jonathan Simon, Uncommon Law: America’s Excessive Criminal Law & Our Common-
Law Origins, 143 DAEDALUS 62 (2014). 399. Bernard E. Harcourt, Against Prediction: Sentencing, Policing, and Punishing in an
Actuarial Age 3 (Univ. of Chicago Law Sch. Pub. Law & Legal Theory Working Paper No. 94, May 2005).

2/5/15 4:18 PM
170 CALIFORNIA LAW REVIEW [Vol. XX:nnn
to use numerical thresholds, if at all, to trigger nonpunitive regulatory sanctions. In any event, we should be guided by science in tackling the issue of drugged driving, whether our goal is to achieve justice, to promote public safety, or to have the audacity to try to do both.