The Underground of the Western Alps - Suisse - UNIL Accueil · of the PNR/NFP-20 research...
147
- I - Mémoires de Géologie (Lausanne) No. 15, 1993 The Underground of the Western Alps by Robin Marchant IMPRIMERIE CHABLOZ S.A., TOLOCHENAZ ISSN 1015-3578
Transcript of The Underground of the Western Alps - Suisse - UNIL Accueil · of the PNR/NFP-20 research...

- I -
Mémoires de Géologie (Lausanne) No. 15, 1993
The Underground of the Western Alps
by Robin Marchant
IMPRIMERIE CHABLOZ S.A., TOLOCHENAZ ISSN 1015-3578

- II -
This eloctronic version is identical to the printed edition, except for some figures which are in color here but in black and white in the printed edition.

- I -
Université de Lausanne
Faculté des Sciences
Institut de Géologie
et de Paléontologie
Mémoires de Géologie (Lausanne) No. 15, 1993
Jury de thèse:Prof. Gérard Stampfli (Directeur)Prof. Raymond Olivier (Lausanne)Dr. Riccardo Polino (Torino)Prof. Albrecht Steck (Lausanne)Prof. François Thouvenot (Grenoble)
The Underground of the Western Alps
Thèse de doctoratprésentée à la Faculté des Sciences
de l’Université de Lausannepar Robin Marchant
géologue diplômé
- II -
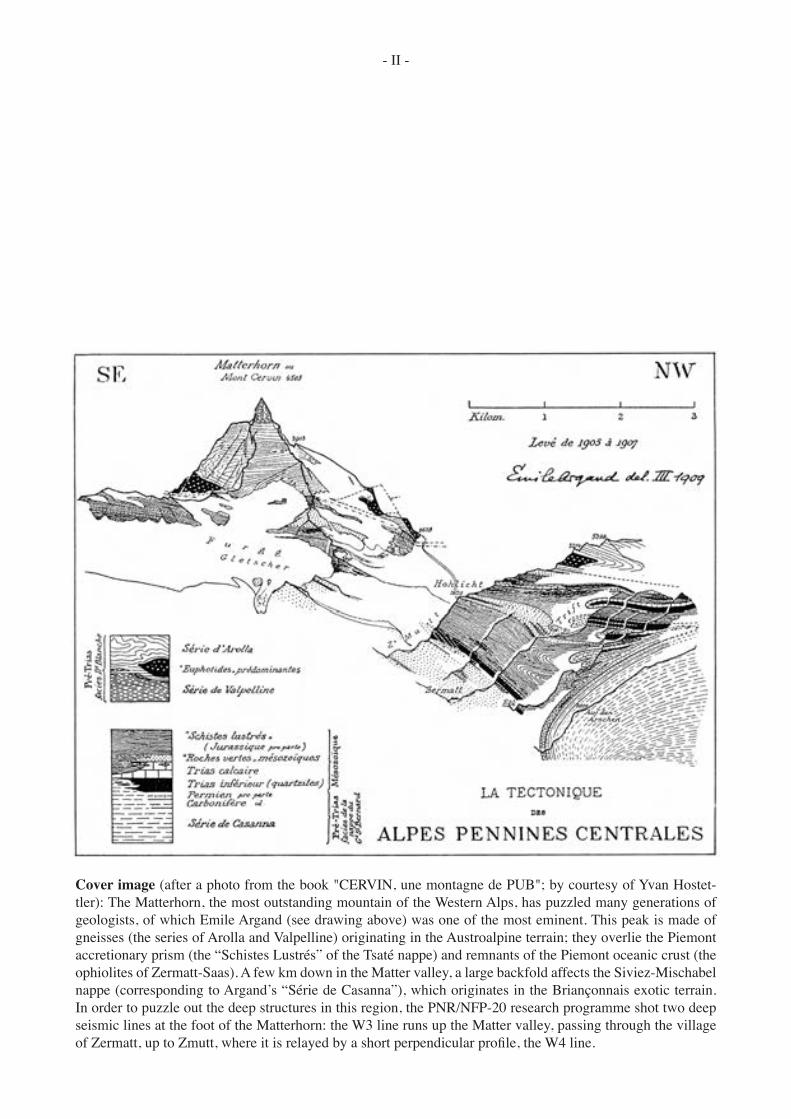
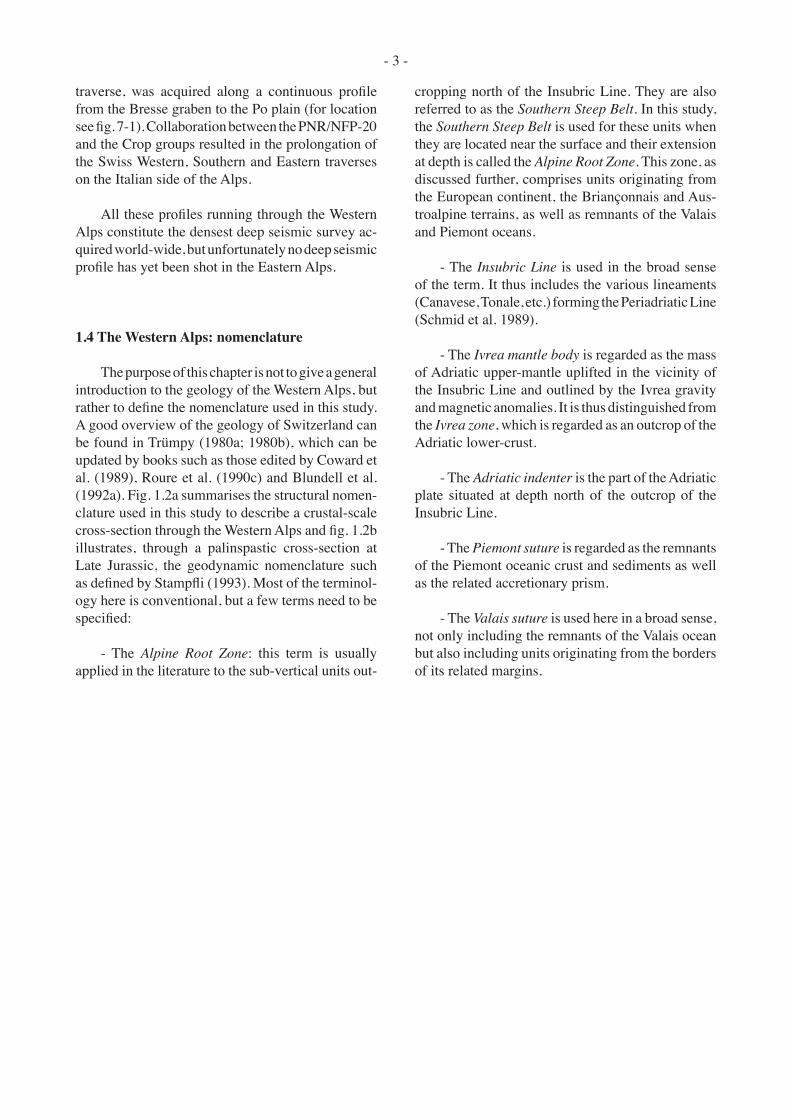
Cover image (after a photo from the book "CERVIN, une montagne de PUB"; by courtesy of Yvan Hostet-tler): The Matterhorn, the most outstanding mountain of the Western Alps, has puzzled many generations of geologists, of which Emile Argand (see drawing above) was one of the most eminent. This peak is made of gneisses (the series of Arolla and Valpelline) originating in the Austroalpine terrain; they overlie the Piemont accretionary prism (the “Schistes Lustrés” of the Tsaté nappe) and remnants of the Piemont oceanic crust (the ophiolites of Zermatt-Saas). A few km down in the Matter valley, a large backfold affects the Siviez-Mischabel nappe (corresponding to Argand’s “Série de Casanna”), which originates in the Briançonnais exotic terrain. In order to puzzle out the deep structures in this region, the PNR/NFP-20 research programme shot two deep seismic lines at the foot of the Matterhorn: the W3 line runs up the Matter valley, passing through the village of Zermatt, up to Zmutt, where it is relayed by a short perpendicular profile, the W4 line.
- III -
Abstract .................................................................... VI
Résumé ...................................................................... VI
PART I - GENERAL REMARKS
1. Introduction ............................................................. 1 1.1 The present study .............................................. 1 1.2 The PNR/NFP-20 research programme ............ 1 1.3 The Ecors and Crop alpine research
programmes ...................................................... 1 1.4 The Western Alps: nomenclature ..................... 3
2. Methodology ........................................................... 5 2.1 The modelling concept ..................................... 5 2.2 Surface geology data ........................................ 5 2.3 Seismic tools ..................................................... 6 2.4 Geodynamics .................................................... 7
3. Computer programs ............................................... 7 3.1 Introduction ....................................................... 7 3.2 Reflection seismic processing programs ........... 7 3.2.1 GEOVECTEUR (CGG™) .................................... 7 3.2.2 CHARISMA (GECO™) ................................ 7 3.2.3 CIGOGNE ................................................... 10 3.2.3.1 Description ..................................... 10 3.2.3.2 An example with the PNR/NFP-
20 W4 line ..................................... 10 3.2.3.1 General remarks on migration ........ 12 3.3 Seismic and gravity modelling programs ........ 13 3.3.1 SIERRA ...................................................... 13 3.3.2 DEUDIM .................................................... 14 3.3.3 2MOD (LCT™).......................................... 14
4. Physical properties of rocks from the WesternAlps........................................................................ 15
4.1 Introduction ..................................................... 15 4.2 Densities and P-wave velocities of Western
Alps rocks ............................................................ 15 4.3 Specific density and velocity problems .......... 16 4.3.1 Mylonitization ........................................ 16 4.3.2 Marmorization ........................................ 17 4.3.3 Granulitization/eclogitization ................. 17 4.3.4 Serpentinization ...................................... 18
PART II - MODELLING AND INTERPRETATION OF THE NAPPE SYSTEM
5. Modelling and interpretation along the W2, W3and W4 profiles .................................................... 19
5.1 General remarks .............................................. 19 5.1.1 Introduction ............................................ 19 5.1.2 Previous studies ...................................... 19 5.1.3 Geological setting ................................... 19 5.1.3.1 Introduction .................................... 19 5.1.3.2 Deformation history ....................... 22 5.1.3.3 Description of the main structural
units ............................................... 22 5.1.4 Acquisition and processing .................... 24 5.2 Modelling and interpretation of the W2
profile ............................................................. 24 5.2.1 The Vibroseis seismic sections .............. 24 5.2.2 Preliminary interpretation ...................... 27 5.2.3 The “Initial” model ................................ 27 5.2.4 Velocity modelling ................................. 30 5.2.5 The “Final” model .................................. 33 5.2.6 Interpretation of the W2 line .................. 36 5.3 Interpretation of the W3 profile ...................... 37 5.3.1 Introduction ............................................ 37 5.3.2 Interpretation .......................................... 37 5.4 Interpretation of the W4 profile ...................... 41 5.4.1 Introduction ............................................ 41 5.4.2 Interpretation .......................................... 41 5.5 The 3-D structural geometry ........................... 44 5.6 A synthetic section of the Penninic nappes .... 56 5.6.1 Construction of the section .................... 47 5.6.2 Nappe correlation ................................... 49 5.6.3 Backfolding of the External Crystalline
massifs ................................................... 49 5.7 Discussion ...................................................... 50
6. Modelling and interpretation along thesouthern half of the E1 profile ............................ 52
6.1 Introduction .................................................... 52 6.1.1 Previous studies ..................................... 52 6.1.2 Geological setting .................................. 52 6.1.3 Acquisition and processing .................... 54 6.1.4 Preliminary interpretations .................... 55 6.2 3-D seismic models ......................................... 55 6.2.1 Introduction ............................................ 55 6.2.2 The “Initial” model ................................ 55 6.2.3 The “South” model ................................ 60 6.2.4 The “Final” model ................................. 61 6.3 2-D models ..................................................... 64 6.3.1 The front of the Tambo nappe ............... 64 6.3.2 The “Chiavenna” 2-D gravity model .... 67 6.4 Interpretation of the southern half of the E1
profile ............................................................. 70 6.4.1. The migrated sections ........................... 70 6.4.2 Interpretation .......................................... 72 6.5 Discussion ...................................................... 73
Table of contents

- IV -
PART III - CRUSTAL- AND LITHOSPHERIC- SCALE INTERPRETATION
7. Crustal-scale interpretation ................................ 74 7.1 Introduction .................................................... 74 7.2 The Ecors-Crop Alp traverse ......................... 75 7.2.1 Introduction ............................................ 75 7.2.2 Interpretation .......................................... 76 7.3. The PNR/NFP-20 Western traverse .............. 79 7.3.1 Introduction ............................................ 79 7.3.2 General concept ..................................... 79 7.3.3 The W1-W2 profile ............................... 80 7.3.4 The W3 profile ...................................... 82 7.3.5 The W4 profile ...................................... 85 7.3.6 Synthetic section of the Western
traverse .................................................. 88 7.4 The PNR/NFP-20 Central traverse ................ 88 7.4.1 Introduction ........................................... 88 7.4.2 Interpretation ......................................... 88 7.5 The PNR/NFP-20 Southern traverse .............. 92 7.5.1 Introduction ........................................... 92 7.5.2 Interpretation ......................................... 92 7.6 The PNR/NFP-20 Eastern traverse ................ 93 7.6.1 Introduction ........................................... 93 7.6.2 Interpretation ......................................... 93 7.7 Discussion ...................................................... 97 7.7.1 The problem of overlying the Eastern
and Southern traverse ............................ 97 7.7.2 Mid-crustal deformation accommoda-
tion ........................................................ 98 7.7.3 Comparison of the different traverses ... 98
8. Lithospheric-scale interpretation ........................ 99 8.1 Introduction .................................................... 99 8.2. The lithosphere-asthenosphere transition ...... 99 8.3 The lithospheric cross-sections ..................... 101 8.4. Gravity modelling ........................................ 104 8.4.1 Introduction .......................................... 104 8.4.2 The gravity models ............................... 104 8.5 Discussion ..................................................... 111
9. Palinspastic reconstructions .............................. 113 9.1 Introduction .................................................. 113 9.2. From rifting to passive-margin stage ........... 113 9.3 Oceanic-subduction stage ............................. 115 9.4 Continental-collision stage ........................... 115 9.4.1 Introduction .......................................... 115 9.4.2 The Algero-Provençal phase (30 to
15 Ma) ................................................. 117 9.4.3 The Tyrrhenian phase (15 to 0 Ma) ..... 122 9.5 Discussion .................................................... 124
10. Conclusions ...................................................... 125 10.1 General remarks ......................................... 125 10.2 The origin of reflectivity ............................ 125 10.3 Tectonic style of the internal part of an
orogen ........................................................ 125 10.4 The “crocodile” seismic pattern ................. 126 10.5 Do mountain roots disappear? .................... 127
Acknowledgements ................................................. 128
References ............................................................... 129

- V -
I dedicate this work to Emile Argand, who already in 1916, on the basis of his understanding of the tectonic framework and without any geophysical data, drew a cross-section through the Western Alps featuring most of the structures revealed on the deep seismic profiles of the PNR/NFP-20 research programme.
The publication of this Ph.D. thesis was made possible thanks to the finantial support from the Fondation Dr. Joachim de Giacomi de l'Academie des sciences naturelles, from the rectorship of the University of Lausanne and from the Institut de Géologie et Paléontologie (Lausanne).
- VI -
This study is an attempt at a multi-disciplinary approach towards a better understanding of the deep structures of the Western Alps. Although mainly based on deep seismic reflection data, this study has accorded equal importance to data provided by other geophysical methods (refraction seismology, gravimetry, tomography, etc.) and by surface geology (tectonics, stratigraphy, metamorphism, geochronol-ogy, etc.). A vital lead in this study is geodynamics: any interpretation of the present deep structures of the Western Alps must find an explanation in a geodynamic evolutionary context compatible with geological surface observations and actualistic geo-dynamic models. Thus the approach used here was to start from the well known (i.e. surface geology) and to go progressively down to greater depths, first at a crustal- and then lithospheric-scale.
Detailed interpretation of seismic profiles in the Internal Alps reveals the importance of ductile de-formation and in particular the role of backfolding in the present configuration of the nappe system. The crustal- and lithospheric-scale interpretation of five deep seismic profiles distributed through the Western Alps revealed striking similarities, such as the importance of the subduction of the European continental plate, reaching a depth of around 150 km below the Po plain. These interpretations also show some differences which appear progressively along the Alpine strike, such as the geometry and the composi-tion of the Adriatic indenter. These differences can be coherently explained by a geodynamic evolutionary scenario which highlights the inheritance of structures due to the Tethyan rifting relative to the present deep structures resulting from the continental collision of the European and Adriatic plates.
La présente étude est une tentative d’approche multidisciplinaire visant à une meilleure compré-hension des structures profondes des Alpes Occiden-tales. Elle est basée principalement sur des données de sismique-réflexion profonde, mais elle accorde une égale importance à des données provenant d’autres disciplines géophysiques (sismique-réfrac-tion, gravimétrie, tomographie, etc.) et géologiques (tectonique, stratigraphie, métamor-phisme, géochro-nologie, etc.). Un des fils conducteur de ce travail est la géodynamique: toute interprétation des structures profondes actuelles des Alpes Occidentales doit pouvoir s’expliquer dans un contexte d’évolution géodynamique de cette chaîne de montagne compat-ible avec les observations de la géologie de surface et avec des modèles géody-namiques actualistes. A cet effet l’approche utilisée part du connu (la géologie de surface) pour descendre progressivement dans le monde moins connu des structures profondes à l’échelle crustale d’abord et lithosphérique ensuite.
L’interprétation détaillée de profils sismiques dans le domaine interne des Alpes a permis de mettre en évidence l’importance des déformations ductiles et en particulier le rôle important des rétro-plissement dans la configuration actuelle du système de nappe. A l’échelle crustale et lithosphérique, l’interprétation de cinq traverses sismiques réparties dans les Alpes Oc-cidentales a révélé de nombreuses similitudes, telles que l’importante subduction de la plaque continentale Européenne atteignant une profondeur de 150 km sous la plaine du Pô. Ces interprétations ont aussi démontré des différences apparaissant pro-gressivement le long de l’axe de la chaîne alpine, telles que la géométrie et la composition de l’indenteur Adriatique. Ces dif-férences ont pu trouver une explication cohérente dans un scénario d’évolution géody-namique qui met en évidence l’héritage de structures liées à l’ouverture de l’océan Téthysien dans la formation des structures résultant de la collision con-tinentale des plaques Européenne et Adriatique.
Abstract Résumé
- 1 -
1.1 The present study
This Ph.D. thesis is an attempt at a multi-discipli-nary approach towards the understanding of the deep structures of the Western Alps. Although mainly based on the PNR/NFP-20 deep seismic profiles (see § 1.2), this study has taken into account as much different information as possible in order to constrain the great number of possible interpretations of the near-vertical reflection seismology data. This additional informa-tion is provided by various geophysical methods (refraction seismology, gravimetry, tomography, etc.) and by over two centuries of intensive observations carried out by field geologists in the Western Alps (structural geology, stratigraphy, metamorphism, geochronology, etc.). In particular in the Central Alps, structural geology data offers the possibility to project surface geology down to considerable depths (10-20 km). This allows the interpreter to correlate deep seated reflectors with known geological features, which is a rather exceptional circumstance for deep seismic surveys. Furthermore any interpretation of the present deep structures has significant repercus-sions for the evolution of this mountain belt and these repercussions must be compatible with possible geodynamic evolutionary models.
The approach used here to decipher the deep structures of the Western Alps was to start from the “well known”, i.e. the surface geology, to move pro-gressively down to the “less known”, i.e. the deep lithospheric structures. Therefore, after some general remarks (chapters 1 to 4), this study starts with a de-tailed interpretation of the nappe system in the Western (chapter 5) and Eastern (chapter 6) Swiss Alps. On the basis of these results, crustal-scale interpretations along the major deep seismic profiles of the Western Alps are presented (chapter 7). Three of these profiles are then considered at a lithospheric-scale (chapter 8) and finally a geodynamic evolutionary scenario is proposed (chapter 9). In conclusion (chapter 10), consequences of this study, which are of interest for other deep seismic surveys in compressional areas, are considered.
1.2 The PNR/NFP-20 research programme
Most of the data used for this study was provided by the PNR/NFP-20 (“Projet National de Recher-che/National Forschungsprogram nº 20”) research programme financed by the Swiss National Science Foundation. This research programme was launched after the American COCORP project had proved deep seismic reflection seismology to be a powerful investigation tool for the upper-lithosphere (Brown et al. 1986). The aim of the PNR/NFP-20 project was to obtain a better understanding of the deep structures of the Swiss Alps and most of the effort went into the acquisition of deep seismic profiles, but many other additional studies were also sponsored by this project (Frei et al. 1989, 1990 & 1992; Heitzmann 1991). Ad-ditional information on this project can be also found in the NFP-20 Bulletins and in the final report “Deep structure of Switzerland - Results from NFP 20” (in prep.) including an atlas of seismic sections.
The initial aim of the PNR/NFP-20 project was to acquire through the Swiss Alps three deep seismic reflection traverses. These are the Western traverse (composed of the W1-W4 seismic lines), the South-ern traverse (S1-S7) and the Eastern (E1) traverse, respectively acquired in 1987, 1986 and 1988 (for location, see fig. 1-1). As the results were most en-couraging, additional lines were shot in 1990; these are the W5 profile, the Central traverse (lines Z1-Z3 in fig. 1-1), and the E2-E3 profiles. Information and references on the acquisition and processing of these deep seismic profiles can be found in § 2.3, § 3.2.1, § 5.1.4, § 6.1.3.
1.3 The Ecors and Crop Alpine research pro-grammes
Outside Switzerland, other deep seismic profiles have been shot in the Western Alps for the French Ecors and the Italian Crop programmes. In particular a joint Ecors-Crop deep seismic Alpine traverse (Bayer et al. 1987), here referred to as the Ecors-Crop Alp
§ 1. Introduction
PART I - GENERAL REMARKS

- 2 -
Fig.
1-1
: Tec
toni
c m
ap o
f Sw
itzer
land
with
loca
tion
of th
e PN
R/N
FP-2
0 de
ep se
ism
ic p
rofil
es (a
fter H
eitz
man
n 19
91).
See
also
fig.
5-1
, 6-1
, 7-1
and
8-1
.
- 3 -
traverse, was acquired along a continuous profile from the Bresse graben to the Po plain (for location see fig. 7-1). Collaboration between the PNR/NFP-20 and the Crop groups resulted in the prolongation of the Swiss Western, Southern and Eastern traverses on the Italian side of the Alps.
All these profiles running through the Western Alps constitute the densest deep seismic survey ac-quired world-wide, but unfortunately no deep seismic profile has yet been shot in the Eastern Alps.
1.4 The Western Alps: nomenclature
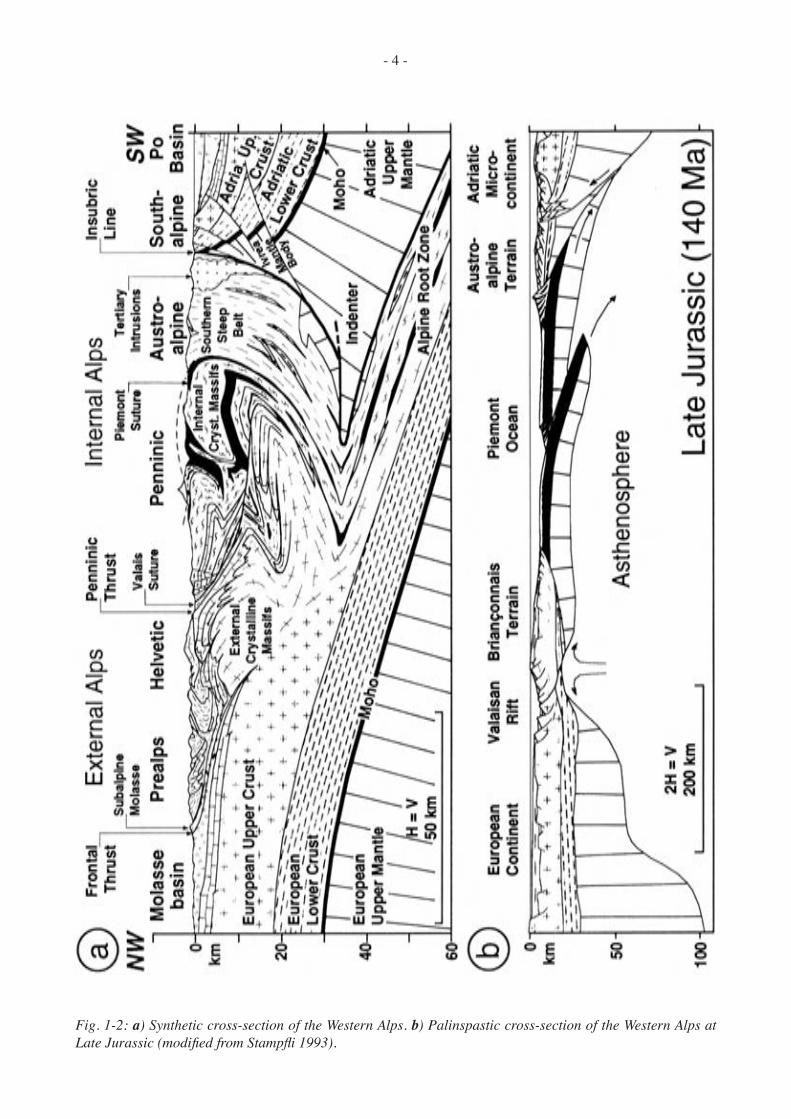
The purpose of this chapter is not to give a general introduction to the geology of the Western Alps, but rather to define the nomenclature used in this study. A good overview of the geology of Switzerland can be found in Trümpy (1980a; 1980b), which can be updated by books such as those edited by Coward et al. (1989), Roure et al. (1990c) and Blundell et al. (1992a). Fig. 1.2a summarises the structural nomen-clature used in this study to describe a crustal-scale cross-section through the Western Alps and fig. 1.2b illustrates, through a palinspastic cross-section at Late Jurassic, the geodynamic nomenclature such as defined by Stampfli (1993). Most of the terminol-ogy here is conventional, but a few terms need to be specified:
- The Alpine Root Zone: this term is usually applied in the literature to the sub-vertical units out-
cropping north of the Insubric Line. They are also referred to as the Southern Steep Belt. In this study, the Southern Steep Belt is used for these units when they are located near the surface and their extension at depth is called the Alpine Root Zone. This zone, as discussed further, comprises units originating from the European continent, the Briançonnais and Aus-troalpine terrains, as well as remnants of the Valais and Piemont oceans.
- The Insubric Line is used in the broad sense of the term. It thus includes the various lineaments (Canavese, Tonale, etc.) forming the Periadriatic Line (Schmid et al. 1989).
- The Ivrea mantle body is regarded as the mass of Adriatic upper-mantle uplifted in the vicinity of the Insubric Line and outlined by the Ivrea gravity and magnetic anomalies. It is thus distinguished from the Ivrea zone, which is regarded as an outcrop of the Adriatic lower-crust.
- The Adriatic indenter is the part of the Adriatic plate situated at depth north of the outcrop of the Insubric Line.
- The Piemont suture is regarded as the remnants of the Piemont oceanic crust and sediments as well as the related accretionary prism.
- The Valais suture is used here in a broad sense, not only including the remnants of the Valais ocean but also including units originating from the borders of its related margins.
- 4 -
Fig. 1-2: a) Synthetic cross-section of the Western Alps. b) Palinspastic cross-section of the Western Alps at Late Jurassic (modified from Stampfli 1993).
- 5 -
2.1 The modelling concept
“To come back to modelling as an explanation of the non-rational, one must acknowledge that it raises an unsolved methodological problem: how can one justify correspondences between realities which one knows to be irreducibly different ? [...] However the method is often used in exact sciences because it guides the reflection by carrying knowledge from one branch to another. Only after having exploited modelling, one can always build in these sciences an ad hoc theory which endorses the result or eventually which invalidates it; as theory is a strict process, one most often forgets the modelling that inspired it. [...] The aposteriori validation is thus a legitimate way to judge the validity of a theory, in particular the validity of modelling the complex by the simple. [...] At this stage, the judgement thus stays subjective and, even if positive, it cannot be assumed to be convincing. Modelling will thus probably never reach the relative strictness which binds mathematics to physics, and the consequence is that it will never have the same soundness and predictive power that this strictness procures. This certainly does not hinder it from serv-ing as a tool of representation and explanation at an abstract level, but one must be careful: the elaborated representation is not necessary true: modelling only brings plausible results and even if their soundness puzzles the reader, he is free to keep his distance.”
(Translated from Fivaz 1989, p.15-16)
The modelling concept comes up several times in this study, i.e. the interpretation of the deep structures of the Western Alps. For example, at different stages of processing, the deep seismic profiles on which most of this study is based use various model concepts, such as velocity/depth functions for the migration. Depth projections of surface geology, whatever the quality of the field observations, require tectonic models. Palinspastic reconstructions use geodynamic models. And of course, methods such as seismic and gravity modelling, which offer an infinite variety of solutions, are based on model concepts.
The best way of getting round the ambiguities
linked to the modelling concept - ambiguities clearly expressed in the above quotation - is to use double validation (Bateson 1980, § 3): when one has two different descriptions of the same reality, their con-frontation engenders a third one of superior logical order. Hence the interpretation of a seismic section drastically reduces the possibilities of infinite solu-tions for a corresponding gravity model. Only once an interpretation fits all the different data available can it be considered plausible. Nevertheless several solutions can be plausible and the simplest is usually considered the best.
An interpretation of a deep seismic profile in an area as complex as the Alps must be compatible with a very broad spectrum of data, collected over two centuries by specialists in different fields. Not only must this interpretation fit in with the data describing its present state (mainly geophysical and structural data), but it must also offer a plausible geodynamic evolution scenario through time, compatible in particular with geochronological and stratigraphical data. This is why a multi-disciplinary approach is essential and this study is precisely such an attempt. A brief description of some of the interpretation tools follows; the next chapter (§ 3) presents the computer tools separately.
2.2 Surface geology data
The Alpine region has been intensively surveyed by several generations of geologists and, thanks to their work, it is possible to decipher the structural complexity of this mountain belt. Already by 1911 on the basis of field observations, Argand was able to construct geological cross-sections down to depths of more than 20 km! Very few areas in the world offer the possibility to project outcropping geology with reasonable confidence to such depths. Here the PNR/NFP-20 survey offers an exceptional opportunity to correlate deep seismic reflections with specific geo-logical features, a circumstance very rarely found in other deep seismic surveys throughout the world.
However, the possibilities of projecting surface
§ 2. Methodology

- 6 -
geology to depth have their limitations. Firstly, due to several folding phases, these projections are usu-ally non-cylindrical and therefore have to be made along curved paths, which in some cases turn out to be brain-twisters. So the method used for these projections must not be regarded as pure cylindrism but rather as some kind of adapted cylindrism (Escher et al. 1988). Secondly the tectonic units have limited extensions, usually at deca-kilometric-scale. On a map view, the lateral extensions of most of the units can be roughly estimated; this is not the case for their extrapolation at great depths.
It is very difficult to estimate the precision of these depth projections. Some units have undergone such complex deformation (e.g. the Antrona unit), that it is impossible to project them precisely even down to a depth of 1 km. By contrast, some other units, such as the Antigorio nappe, can be projected with confidence over distances of a few tens of kilometres. In fact some large-scale structures (e.g. the Vanzone backfold) can be easier to project than the individual tectonic units themselves.
2.3 Seismic tools
As deep seismic profiles are usually characterised by a low signal-to-noise ratio, it is essential to try to squeeze out of them all possible information. In this study, quite a variety of displays for the same seismic line were consulted before interpreting. These displays range from pre-stacked data (e.g. single dynamite shots), stacked sections (occasionally with different offsets), various types of migrated sections and seismic attribute displays. Each of these displays brings its share of information, sometimes minor, sometimes of great importance. Most of them will be further described in the following chapter.
The wide variety of different displays for the same seismic section is due partly to different types of shot sources (dynamite and Vibroseis) used during
the field acquisition and to two processing centres (the GRANSIR Group of the Geophysical Institute at the University of Lausanne and the Geophysical In-stitute of the Federal Polytechnic School of Zürich) treating the same field data with different software and hardware. The Vibroseis data has a good sig-nal-to-noise ratio down to about 8 s (TWT) but its quality deteriorates further down. The dynamite data is rather complementary: it has a low resolution for the top part but a much better one at mid-crustal and lower-crustal levels. This is why in this study, the nappe system interpretation is based mainly on the Vibroseis data and crustal-scale interpretations mainly on the dynamite data, combining it where possible with the Vibroseis data.
2.4 Geodynamics
Geodynamic evolutionary models aim at recon-structing the past, usually starting from the present and then going back through time. But they can also be used the other way round (from past to present) to guess what kind of material can be presently found at depth. For instance, since the work of Argand (1924), it is well known that the Western Alps are due to the collision of the European and “African” plate. Since then, geodynamic reconstructions have been refined by various authors, and up-to-date models (Stampfli 1993) show that the Western Alps result from the collision of the European plate and the Adriatic micro-plate, with two terrains squeezed in between: the Briançonnais and Austroalpine ter-rains. As the collision was guided essentially by the overthrusting of the Adriatic plate, it is most likely that one would presently find at depth remnants of the European margin and the Briançonnais and Aus-troalpine terrains, as well as relicts of the Valais and Piemont oceans. The more precise the geodynamic reconstructions prove to be, the more information they provide on the present deep structures. Such an approach was used for this study and chapter 9 will focus on this aspect.
- 7 -
3.1 Introduction
Interpretation of the deep structures of the Western Alps presented here involved using several differ-ent computer programs. These are mainly seismic processing and modelling software but also gravity modelling programs. A brief description of each of these follows, together with a few examples. Most of this software is quite sophisticated and therefore greatly dependent on the hardware and operating systems for which they were designed, as well as on the various devices (digitizing tables, printers, etc.) they are linked to. During the six years spent on this study, so many software and hardware changes have occurred that the programs were not all operational during this period. In fact a few of the programs used at the beginning of this study became obsolete due to hardware upgrades.
3.2 Reflection seismic processing programs
3.2.1 GEOVECTEUR (CGG™)
GEOVECTEUR (CGG™), a very sophisticated and powerful seismic processing package produced by the Compagnie Générale de Géophysique, has been used by the GRANSIR group of the Geophysical Institute of the University of Lausanne since 1987. All the Vibro-seis as well as part of the dynamite sections shown here were produced by the GRANSIR group with this software running on the CRAY super-computers of the Federal Polytechnic School of Lausanne (Du Bois et al. 1990a & 1990b; Levato et al. 1990 & 1993). GEOVECTEUR (CGG™) is not user-friendly software and it was used in this study only for reformatting seismic data, for printing sections and for velocity analysis (see § 5.2.4).
3.2.2 CHARISMA (GECO™)
Acquired in 1989 by the Geological Institute of the University of Lausanne, CHARISMA (GECO™) is an interactive seismic interpretation system with which seismic sections can be visualised on high-resolution
computer screens. In comparison with classical paper displays, the main advantages of interpreting deep seismic lines on such a workstation are the following possibilities: instant zooming, not only for a more detailed view but also to evidence various features by greatly exaggerating the vertical (or horizontal) scale; highlighting various aspects of the seismic data through the use of different colour scales and complex trace analysis, such as reflection strength, instantaneous phase and frequency displays (Taner & Sheriff 1977; Taner et al. 1979). These three seismic attributes are based on a function which considers the seismic trace as propagating in three dimensions: time, real amplitude and imaginary amplitude. Instead of being just a sinusoid in the time/amplitude plane, the seismic trace is regarded as a spiral evolving along the time axis and rotating 360° in the quadratic space each time the original trace makes an “S” (fig. 3.1).
The instantaneous phase is defined as this rotation angle and thus has values ranging between -180° and 180° (or -π and +π as on fig. 3-1c). This function, totally independent of amplitude, is of great help in structural analysis: an extremely low-amplitude reflec-tion will have the same weight as a high-amplitude reflector. In fig. 3-2, seismic attribute displays for a window of the PNR/NFP-20 W2 stacked section can be compared with the original amplitude display. The colour coding for the instantaneous phase (fig. 3-2b) is the following: black for values between 160° and 180° and white for the other rotation angle values. Such a colour coding creates a kind of automatic line-drawing enhancing the structural aspect of the seismic data.
The reflection strength (or trace envelope) is the complement of the instantaneous phase and cor-responds to the radius of the spiral defined in the quadratic space (fig. 3-1a & 3-1b). Although fairly similar to amplitude, this function can highlight significant lithological contacts (fig. 3-2c) and can sometimes help to distinguish between simple or composite reflection (Taner & Sheriff 1977).
The instantaneous frequency (fig. 3-1d) is the derivative of the instantaneous phase function. For a good signal-to-noise ratio (which is rarely the case
§ 3. Computer programs

- 8 -
Fig. 3-1: Complex trace analysis: real (a) and quadrature (b) traces for a portion of a seismic trace. The enve-lope (or reflection strength) is shown as the dotted line in (a) and (b). c) Instantaneous phase. d) Instantaneous frequency. e) Isometric diagram of complex trace. From Taner et al. (1979).

- 9 -
Fig. 3-2: Seismic attribute displays for a window of the PNR/NFP-20 W2 Vibroseis stacked section; a: ampli-tude; b: instantaneous phase; c: reflection strength (or trace envelope); d: instantaneous frequency.

- 10 -
with deep seismic data) it can be used as a seismos-tratigraphic tool. Otherwise it can serve as quality control of the seismic data: noisy data, which causes irregularities along the instantaneous phase curve, will produce an instantaneous frequency equal or near to zero (colour coded in white in fig. 3-2d) or incoherent values producing a kind of patchwork display.
For a quantitative use of these seismic attributes, the seismic data should be processed in “true” ampli-tude, which is not the case with the seismic sections shown here. Nevertheless, these functions can qualita-tively highlight various aspects of the amplitude data for stacked as well as for migrated sections. Together with the other possibilities offered by the CHARISMA workstation (GECO™), complex trace analysis was of great help for interpreting the PNR/NFP-20 deep seismic profiles. Unfortunately, due to their great number, it is impossible to provide the reader with all the displays produced on the CHARISMA worksta-tion (GECO™).
3.2.3 CIGOGNE
3.2.3.1 Description
Another powerful interpreting tool was provided by CIGOGNE, a geometric depth-migration program. CIGOGNE is software extensively used for this study as it turned out to be of great help in interpreting seismic sections. This software was written by G. Sénéchal (Sénéchal 1989 & 1991; Sénéchal & Thouvenot 1991; Thouvenot et al. 1990) from the LGIT (Laboratoire de Géophysique Interne et Tectonophysique, Grenoble) and it was adapted to the University of Lausanne site. This migration program is based on the principle of the common tangent of two spherical wave-fronts (Hagedoorn 1954). The reflectors of the stacked section are first digitized into small individual seg-ments (for this study usually every five CDP), then converted to depth according to a velocity function which can vary horizontally and vertically and finally migrated. During the digitizing process, two groups of reflectors were differentiated by their amplitude (represented by thick and thin segments on the mi-grated sections). In fact for some sections, up to four amplitude groups (strong, good, weak and doubtful reflectors) were distinguished, but only the first two groups are represented on the sections shown here, as the two last groups tend to render the displays rather noisy. This digitizing process allows one to save some amplitude information, which is rarely the case with other similar programs.
An unquestionable advantage of this kind of mi-gration, when compared with conventional methods such as wave-equation functions, is generally the absence of artificial reflectors, such as the typical “smile” artefacts which can be impossible to distin-guish from real reflectors. This fact is particularly crucial with reflectors which migrate outside the stacked section: by adding dead traces to the ends of the stacked section, conventional migrations methods can preserve such reflectors but they are then usually covered with migration smiles. Another advantage is the extremely small computer resources needed to run a program such as CIGOGNE. Furthermore it has been demonstrated by Warner (1987) that conventional migration methods are usually inefficient below five to seven seconds (TWT).
3.2.3.2 An example with the PNR/NFP-20 W4 line
These migration problems are well illustrated through the example of the PNR/NFP-20 W4 deep seismic profile, a small (less than 8 km long) Vibro-seis line shot just above Zermatt. The stacked section (fig. 3-3a) has an excellent signal-to-noise ratio and it reveals mainly strongly west-dipping reflectors but also quite a few sub-horizontal ones. From this section, over 3,400 reflector segments were digitized into two groups, high- and low-amplitude reflectors represented respectively by thick and thin segments in fig. 3-3b. This figure also shows the velocity func-tion used for the depth conversion (fig. 3-3c). These velocities are averaged from the surface and do not therefore correspond directly to interval velocities. The interval velocities used to determine the averaged velocity function are based on processing velocity analysis, on laboratory measurements on rock samples from corresponding lithologies and on velocities re-vealed from nearby refraction seismology surveys. For this very small line no lateral velocity changes were introduced and the depth/velocity function is typical of the velocities used for the migration of seismic lines in the Penninic domain. In the less metamorphic Helvetic domain, this function usually started with velocities around 4 km/s near the surface.
The resulting depth-migrated section (fig. 3-3d) shows a drastic change in the reflector geometry when compared with the stacked section. The migration reveals that this less than 8-km-long line has in fact recorded events corresponding to a distance of over 70 km long! As many reflectors are out of plane (see § 5.4), this 70-km-long migrated section corresponds in reality to a half sphere with a radius of 50 km. A

- 11 -
Fig.
3-3
: Geo
met
ric
dept
h-m
igra
tion
of th
e PN
R/N
FP-2
0 W
4 Vi
bros
eis l
ine
usin
g th
e C
IGO
GN
E pro
gram
; a: i
nitia
l sta
cked
sect
ion
; b: d
igiti
zed
stac
ked
sect
ion
with
the
dept
h-ve
loci
ty fu
nctio
n (V
= a
vera
ged
inte
rval
vel
ocity
in k
m/s
); c
: dep
th c
onve
rted
stac
ked
sect
ion;
d: g
eom
etri
cally
dep
th-m
igra
ted
sect
ion.

- 12 -
3.2.3.3 General remarks on migration
Valasek (1992) has also migrated the PNR/NFP-20 deep seismic lines, using a algorithm very similar to the one CIGOGNE is based on. The main difference lies in the digitizing method, Valasek (1992) using an automatic line drawing program which has the ad-vantage of conserving the continuity of the reflectors and part of the amplitude information. Nevertheless, for two reasons, the use of his migrated sections for this study was avoided when ever possible: firstly many low-amplitude reflectors are not digitized, resulting in a loss of information; and secondly the velocities used for depth conversion are too high near the surface (starting at 6.0 km/s or even more) which sometimes renders correlation with the surface geology ambiguous.
Whichever migration method is used, it is im-portant to keep in mind the fact that a seismic sec-tion is only a partial representation of the structures it surveys. The first and obvious condition is that a lithological contact must have sufficient contrast in acoustic impedance (velocity * density) to produce a
conventional migration would never have produced such a neat display with reflectors migrating so far out of the section. For the same seismic line, Levato (pers. comm.) made an attempt at applying conven-tional migration (wave-equation) over a distance slightly longer than the width of the stacked section by adding 75 dead traces (corresponding to three km) to the eastern end of the line (see fig. 5-23). This small extension already reveals quite a few migration smiles in the upper part and shows that conventional migration is not well suited to handle deep seismic data, in particular for such a short line.
Furthermore, this example well illustrates the danger of interpreting deep seismic profiles on the basis of stacked sections when dipping reflectors are present: migration can drastically change the geom-etry of the reflectors. The PNR/NFP-20 W4 stacked sections show several unconformities between sub-horizontal and west-dipping reflectors. Once migrated, these unconformities become continuous reflectors showing a concave shape. The unconformities of the stacked section are in fact half of a bow-tie pattern, a pattern typical of a synform structure.
Fig. 3-4: Cross-section showing potential reflectors (numbered A to G) and the resulting depth-migration they would produce (thick lines) considering the coverage of the stacked section outlined by the dotted pattern.

- 13 -
reflection. Other conditions are summarised in fig. 3-4, where potential reflectors (A-G) are represented with their resulting depth-migration. Before interpreting a migrated section it is important to know which parts are covered by the stacked section: the top part of the section is usually cut off by mutes during the process-ing so that many near-surface potential reflectors (such as A) are not imaged. Gaps in the coverage can also occur (reflectors A-D). Structures steeper than 40° are usually not imaged (F and the right part of B). Reflectors situated outside the area corresponding to the stacked section are usually not imaged (G) unless they are dipping towards the section and located at a certain distance (part of B, C, E). For all these reasons, a migrated section is only an incomplete picture of the structures it surveys and one should keep this in mind during interpretation.
3.3 Seismic and gravity modelling programs
3.3.1 SIERRA (SIERRA GEOPHYSICS INC.™)
SIERRA, a user-friendly modelling program, can simulate in two or three dimensions various types of seismic reflection surveys: single shot gathers, CMP gathers, normal-incidence ray-tracing, etc. As with most similar programs, a model is a simplification of the geological reality it represents. This is due to various limitations, particularly for three dimensional modelling, which are the following:
- Number of layers: computing time increases exponentially with the number of layers. Therefore in this study the 3-D models are usually limited to less than ten layers. Furthermore, as a layer can only be defined vertically by one point, structures such as a recumbent fold need at least three layers to be defined.
- Resolution: computing time increases also expo-nentially with the resolution used to define the model. For this study, a maximal matrix of 250*250*250 was used to define the grid of 3-D models. With such a resolution large-scale models are not able to define small-scale features. Therefore to resolve some small-scale features, additional smaller models were created. Also to avoid extensive computing time, the model acquisition parameters used in this study are a decimalization of the field acquisition parameters, i.e. the synthetic seismograms display only one trace out of five or ten traces for the original data.
- Topography: SIERRA does not handle negative depth values, therefore, as datum planes of the models
presented here are often situated above sea level, a subtraction is necessary to compare the model with real altitude or depth values. Furthermore SIERRA’s synthetic seismograms cannot take into account topo-graphical variations along the seismic line (datum plane corrections). So, for a direct comparison with the real stacked sections, the seismic line of the model has to be defined as horizontal, which can introduce a very slight bias.
- Amplitude: SIERRA’s handling of amplitude val-ues is not well suited to direct comparison with noisy deep seismic sections (Stäuble & Pfiffner 1991b). For such surveys SIERRA’s synthetic sections tend to exaggerate the amplitude of diffractions. Therefore this study concentrates mainly on structural model-ling, paying less attention to amplitude values, and hence many of the synthetic seismograms are constant amplitude spike displays.
- Velocity gradients: rock P-wave velocities usu-ally show a sharp increase up to pressures around 2 kbar, which corresponds to a depth of about 6 km (or about 2 s on deep seismic sections). SIERRA of-fers the possibility of introducing a linear velocity gradient in its models, but this can only be a rough approximation of the hyperbolic function shown by laboratory velocity measurements. Therefore in this study, linear velocity gradients were only introduced when they could approximate the real hyperbolic function satisfactorily. Anyhow, these velocity gra-dients are significant only for the first few kilometres of the model, as at greater depths velocities tend to stay constant.
Whenever possible, velocities were chosen on the basis of laboratory measurements carried out on representative rock samples from the study area (Sellami et al. 1990 & 1993; Sellami 1993; Barblan et al. 1992). These laboratory measurements seem to be more reliable than velocities obtained by other methods (τ-p inversion, borehole measurements, refraction seismology, interval velocities derived from stacking velocities) as shown by Stäuble et al. (1993). Velocity modelling carried out in this study (see § 5.2.4) also confirmed the reliability of labora-tory measurements.
Most of the synthetic seismic sections of this study were obtained by normal-incidence ray-tracing (zero-offset approximation) using SIERRA’s implementation of the WKBJ method (Frazer & Phinney 1980). The resulting spike seismograms were convoluted with a 10-45 Hz Klauder wavelet to imitate the acquisi-tion and processing parameters of the PNR/NFP-20
- 14 -
survey. Occasionally random noise was added to the synthetic seismograms.
3.3.2 DEUDIM
DEUDIM is a 2.5-D (two dimension with the possi-bility of introducing limited lateral extensions) gravity modelling program, developed at the Geophysical Institute of the University of Lausanne and based on the Talwani prisms algorithm. Rather slow and not very user-friendly, this software was only used to create one model in this study (see § 6.3.2). DEUDIM was later replaced by the 2MOD software (LCT™).
3.3.3 2MOD (LCT™)
2MOD (LCT™) is also a 2.5-D gravity and magnetic modelling software which has the great advantage of true-time computing: as the model is altered on the screen, the resulting calculated anomaly is simultaneously displayed against the observed anomaly. In this way a good fit between observed and calculated data is very rapidly obtained. Another interesting option of 2MOD (LCT™) is the possibility to adjust automatically the structure (or the density) of one of the bodies of the model, so as to get the best fit between the calculated and observed anomaly.

- 15 -
4.1 Introduction
Most of the geophysical methods can be compared to solving an equation with two unknown factors. One of these factors is the structure, the other a physical property of rocks such as density, velocity, electric resistivity, etc. If one of the two unknown factors can be determined by other means, the equation can be solved. Therefore accurate knowledge of rock physical properties for the surveyed area is most important in order to obtain good determination of the structures, which is the main aim of the interpreter. Fortunately, the two geophysical methods used in this study are based on two physical properties which do not vary considerably (in comparison with electric resistivity or magnetic susceptibility) for the lithologies found in the Western Alps. Seismic velocities of Alpine rocks vary between 5.0 and 7.5 km/s and densities between 2.4 and 3.2 g/cm3. Hence even if wrong assumptions are made on these parameters, the resulting structures will not show too big a bias. Nevertheless, in order to obtain the most accurate interpretations possible, densities and P-wave velocities of the main litholo-gies found in the Western Alps were compiled and are presented below.
4.2 Densities and P-wave velocities of rocks in the Western Alps
If the measurement of rock densities is a straight-forward task, P-wave velocities can be determined by a wide variety of methods, which are mainly: refraction seismology, τ-p inversions, velocity analy-sis of the pre-stack seismic reflection data, optical analysis based on mineralogical orientation distri-bution, laboratory measurements on rock samples. As mentioned earlier (see § 3.3.1), the most reliable method is the laboratory measurement. This method has the advantage of taking pressure into account, a significant parameter which can considerably in-fluence velocities down to depths around 6 km. At greater depths, most micro-cracks are considered to be closed and velocities tend to become stable. Fig. 4-1 shows laboratory measurements made on an augen-gneiss sampled in the Tambo nappe (Sellami et al. 1990). P-wave velocities are measured with
increasing confining pressures in three orthogonal directions, determined on the basis of rock foliation and stretching lineation. This graph well illustrates the hyperbolic behaviour of velocities with increasing pressure. At pressures greater than 2 kbar (200 MPa), velocities tend to become constant. At the surface (0 kbar), velocities can even be reduced up to half of their deep values. Another aspect shown by fig. 4-1 is the importance of anisotropy which here reaches 10%. Velocity anisotropy increases mainly with the proportion of phyllosilicates, which render the rock velocities slower in the direction perpendicular to foliation.
The P-wave velocity compilation of table 4-1 is based where possible on measurements taken at pres-sures of 4 kbar and on the average velocity measured in the three orthogonal directions. Most of the data taken into account comes from rocks sampled in the Western Alps (Fakhimi 1976; Sellami et al. 1990 & 1993; Sellami 1993; Siegesmund & Vollbrecht 1991; Barblan et al. 1992; Burke & Fountain 1990), but for some lithologies rarely sampled by the previous authors, additional data was taken from compilations made elsewhere by Zalesski (1964), Press (1966) and Mengel & Kern (1992).
§ 4. Physical properties of rocks from the Western Alps
Fig. 4-1: P-wave velocities measured in the labo-ratory with increasing confining pressure on an augen-gneiss sample from the Tambo nappe (after Sellami et al. 1990, fig. 4). The measurements were carried out along three orthogonal directions: + = perpendicular to foliation; * = parallel to foliation and perpendicular to lineation; o = parallel to folia-tion and lineation.

- 16 -
A significant parameter of table 4-1 is the acoustic impedance (AI) which determines the reflection coef-ficient (RC) of two different lithologies as shown by the following equation:
RC = |(AI)1-(AI)2|/|(AI)1+(AI)2|
A RC greater than 0.01 is generally considered necessary to produce a distinguishable reflection. As presented in table 4-1, the main lithologies of the Western Alps can be divided roughly into three groups on the basis of their acoustic impedance (AI in 106 kg/m2s):
- Group I: AI = 15.9 to 17.1; these lithologies form most of the Alpine upper-crust.
- Group II: AI = 18.8 to 22.9; these lithologies form part of the lower-crust and are secondary com-ponents of the upper-crust.
- Group III: AI = 26.2 to 26.4; these lithologies are found mainly in the upper-mantle.
A similar subdivision is proposed by Sellami et al. (1993) and it can roughly be stated that the high-amplitude reflections observed on the deep seismic sections shot in the Western Alps are produced by contact with rocks from a different group, and that
weak reflections are due to contact from rocks of the same group. Migration and modelling velocities of this study were chosen on the basis of a weighted average taking into account the proportions of the dominant lithologies constituting the tectonic unit under consideration.
At least four mineralogical transformations can induce significant changes in the physical properties of rocks, resulting in significant geophysical impacts. These transformations are mylonitization, marmoriza-tion, granulatization/eclogitization and serpentiniza-tion; they will be discussed below.
4.3 Specific density and velocity problems
4.3.1 MYLONITIZATION
In deep seismic studies, mylonites are usually regarded as significant potential reflectors of the continental crust. However this statement is subject to quite a few exceptions in particular in the Western Alps. Mainprice et al. (1990) have calculated the RC produced by mylonites of the Western Alps using the mineralogical orientation distribution function. Their
Table 4-1: Compilation of physical properties of the main lithologies encountered in the Western Alps: P-wave velocity, density and acoustic impedance (AI). For references, see text. N.B.: some of the metagabbro samples underwent eclogitic metamorphism.
- 17 -
RC values for calcite-mylonites, sampled along the inverse limb of the Morcles nappe, in contact with their protoliths are around 0.02. They obtained values of 0.01 or less for quartz-mylonites, sampled along the Rhone-Simplon and Insubric lines, the main mylonites zones in the area covered by this study. Similar RC values can be deduced from the laboratory velocity measurements carried out by Sellami et al. (1990) in the Penninic domain surveyed by the PNR/NFP-20 E1 profile. The RC produced by a mylonitic porphyry and its protolith from the Suretta nappe yields an RC of 0.015. A mylonitic gneiss sampled in the Misox zone shows an AI of 16.6*106 kg/m2s which is nearly equal to the mean AI of orthogneisses (16.7*106 kg/m2s; see table 4-1), therefore such a mylonite in contact with its protolith would produce an RC close to zero. Siegesmund and Kern (1990) have obtained an average RC of 0.04 for 17 mylonite samples from the Insubric line.
Such low RC values, for all these mylonites zones from the Western Alps, are unlikely to yield any high-amplitude reflection unless the mylonite zone juxtaposes rocks with contrasted seismic properties. For mylonite zones from other regions, various RC values have been measured and several different hy-potheses are published. The reflectivity of ductile shear zones is either related to high pore pressures (Jones & Nur 1984), to laminated structures and anisotropy (Jones 1982; Jones & Nur 1984; Fountain et al. 1984; Christensen & Szymanski 1988), to anisotropic fab-rics (or mineral texture: Siegesmund & Kern 1990; Siegesmund et al. 1991) or to micro-cracks anisotropy (Crampin 1987; Siegesmund et al. 1991). One can conclude that, in the Western Alps, contacts (either stratigraphic or tectonic) between two contrasted lithologies are probably the predominant cause of strong reflections rather than mylonite zones.
4.3.2 MARMORIZATION
A surprising result of the seismic velocity meas-urements carried out by Sellami et al. (1990 & 1993) on Alpine rocks is the sharp velocity increase of carbonates when they are metamorphosed. Velocities of anchizonal limestones yield P-wave velocities of 5 km/s or less, around 6 km/s in epizonal conditions and around 7 km/s in the amphibolite facies. The same occurs with dolomites, which can reach velocities higher than 7.0 km/s when intensively metamor-phosed. Although this phenomenon is accompanied only by a slight increase in densities, the AI of mar-bles is similar to that produced by basic rocks and the RC of a marble/gneiss contact can reach values
higher than 0.10. Therefore in the Penninic domain, where metamorphism reaches the amphibolite facies at the surface (Frey et al. 1974) and granulite facies at depth, high-amplitude reflectors can just as well be produced by ophiolite/gneiss contacts as by mar-ble/gneiss contacts, a common lithological contact in this area.
4.3.3 GRANULITIZATION/ECLOGITIZATION
Subduction at great depths of continental crust material (several tens of kilometres or even up to a hundred or more) is now a widely accepted phe-nomenon as revealed by eclogitic metamorphism (e.g. Ernst 1971, or for the discovery of coesite in the Dora Maira massif: Chopin 1984) and in the light of increasing evidence of remobilization of continental crust material in the upper-mantle, as witnessed by various types of xenolites revealing a continental geochemical signature (e.g. Mengel 1992). Granulitization and eclogitization induce an increase both in density and velocities of the meta-morphosed rocks (Mengel & Kern 1992). Eclogites can have even a slightly greater density (3.30-3.60 g/cm3) than peridotites (3.15-3.35 g/cm3) although their P-wave velocities are similar (7.5-8.5 km/s). It is therefore seismically and gravimetrically nearly impossible to distinguish continental eclogites from the peridotitic upper-mantle. This phenomenon is well illustrated by the progressive disappearance of the Moho and lower-crust seismic signature when they are subducted at depths greater than 40 km (Valasek 1992, § 10.2.1 and references therein). This has also been well demonstrated by seismic tomographies of the Western Alps (Spakman 1986): they evidence that at least 150 km of the European plate is subducted southwards beneath the Alps and the Po plain, the European Moho probably reaching depths greater than 100 km (see § 8). Nevertheless deep seismic surveys in the area are only exceptionally able to detect the European Moho down to a maximum depth of 60 km (see the PNR/NFP-20 S1 profile, § 7.5.2).
A further problem occurs with this granulitiza-tion/eclogitization phenomenon in the Alpine orog-eny: granulitization/eclogitization occurred not only during the true continent/continent collision but even earlier during the subduction of the Piemont and Valais oceans. At present in the Western Alps, one can observe granulites and eclogites at the surface due to Alpine, Variscan or even earlier orogenic events. These highly metamorphosed units, now at the surface, are likely to yield seismic velocities and densities more representative of lower-crust than

- 18 -
typical continental upper-crust.
4.3.4 SERPENTINIZATION
Serpentinization of peridotites induces also drastic modifications in rock physical properties: peridotites usually have densities ranging from 3.15 to 3.35 g/cm3 and P-wave velocities ranging from 7.4 to 8.4 km/s (Mengel & Kern 1992). Just by adding a little water, one creates serpentinites with densities less than 2.75 g/cm3 (Rey et al. 1990, table I) and P-wave velocities down to even less than 5.0 km/s (Christensen 1992). This phenomenon is well illus-trated by certain very low velocities deduced from refraction experiments across the Ivrea body (5.0
km/s by Ansorge et al. 1979, 4.0 km/s by Giese et al. 1967). Serpentinization of peridotites also produces a very sharp increase in magnetic susceptibility, passing from 0 to 0.0003 G/Oe for a dunite to values around 0.04 G/Oe for its serpentinized equivalent (Wagner 1984). All the magnetic studies carried out on the Ivrea peridotites (Schwendener 1984; Shive 1990; Belluso et al. 1990) reveal that part of these are serpentinized. The same conclusion arises from field observations of the upper-mantle outcrops of the Western Alps, such as the Lanzo zone (e.g. Spalla et al. 1983) or the Finero unit (Steck & Tièche 1976) which is probably a slab of upper-mantle related to the Ivrea mantle body. Due to this process, it is not possible to determine the exact volume of the Ivrea body either by seismic or by gravity methods.

- 19 -
5.1 General remarks
5.1.1 INTRODUCTION
Due to the rough topography of the area, it was not possible to shoot a single and continuous deep seis-mic profile through the Alps of Western Switzerland. Hence the PNR/NFP Western traverse comprises five individual lines (W1-W5), showing different orienta-tions (for location, see fig. 5-1). Thanks to wide-angle shots, which extend these individual lines, several lines intersect, bringing a very strong constraint upon the interpretation. Another advantage of these intersect-ing lines is the control over 3-D structures, which are particularly important in this area. However, as the large-scale structures are not quite cylindrical, the building of a single and continuous synthetic profile in the Western Swiss Alps is a tricky task. Another disadvantage of this survey is that the Western profiles do not image the southern side of the Insubric line, a key feature of the Alpine orogeny.
This study is principally concerned with the W2, W3 and W4 profiles which lie in the Penninic domain. Seismic modelling was carried out mainly on the W2 profile so as to solve several interpretation problems. On the basis of depth-migrated sections, an interpretation of the nappe system is presented here for these three profiles. A crustal-scale interpretation of these lines is proposed in chapter 7.3.
5.1.2 PREVIOUS STUDIES
By comparison with the Eastern traverse (see § 6.1.1), few papers have been published specifically on the Western traverse. Several publications, describing the PNR/NFP-20 programme as a whole, mention some general aspects of the Western profiles (such as Finckh et al. 1987; Frei et al. 1989, 1990 & 1992; Heitzmann et al. 1991). Information on acquisition and processing can be found in publications from Du Bois et al. (1990a & 1990b), Valasek et al. (1990), Valasek (1992) and Levato et al. (1993). Laboratory
velocity measurements on rock samples from the survey area were carried out by Sellami et al. (1993) and Sellami (1993). Interpretations are presented in some of the above mentioned papers and in Levato et al. (1993), Green et al. (1993) and Marchant et al. (1993). Additional information can be found in the PNR/NFP-20 bulletins as well as in the final report of the PNR/NFP-20 programme (in prep.).
But for the seismic modelling, the contents of most of this chapter are nearly identical to what is presented in the paper by Marchant et al. (1993), therefore this reference will not be mentioned further.
5.1.3 GEOLOGICAL SETTING
5.1.3.1 Introduction
For over 20 years, field geologists of the Uni-versities of Lausanne, Geneva and Neuchâtel have been making a detailed review of the Penninic Alps of Valais which has led to a refined definition of the various structural units. The new nomenclature used here can be found in publications from Escher (1988), Escher et al. (1988 & 1993), Escher & Sartori (1991), Steck (1987 & 1990) and Steck et al. (1989). The reader is referred to these papers for references to the main studies undertaken previously in this area, many of which are unpublished.
Furthermore in the framework of the PNR/NFP-20 programme, an up-to-date compilation of tectonic maps was undertaken for this region at the University of Lausanne under the direction of Steck, Escher and Masson (publication in prep.). The area covered corresponds to the four Swiss maps (at a scale of 1:100,000) of the “Col du Pillon”, “Val de Bagnes”, “Oberwallis” and “Monte Rosa”. These tectonic maps were of great help for the interpretation of the deep seismic sections.
The general structure of this segment of the Al-pine belt can be understood by comparing the vertical
§ 5. Modelling and interpretation along the W2, W3 and W4 profiles
PART II - MODELLING AND INTERPRETATION OF THE NAPPE SYSTEM

- 20 -
Fig.
5-1
: Hor
izon
tal t
ecto
nic
sect
ion
(at a
n al
titud
e of
2,0
00 m
) of t
he C
entr
al A
lps (
afte
r Ste
ck e
t al.
1989
).
- 21 -
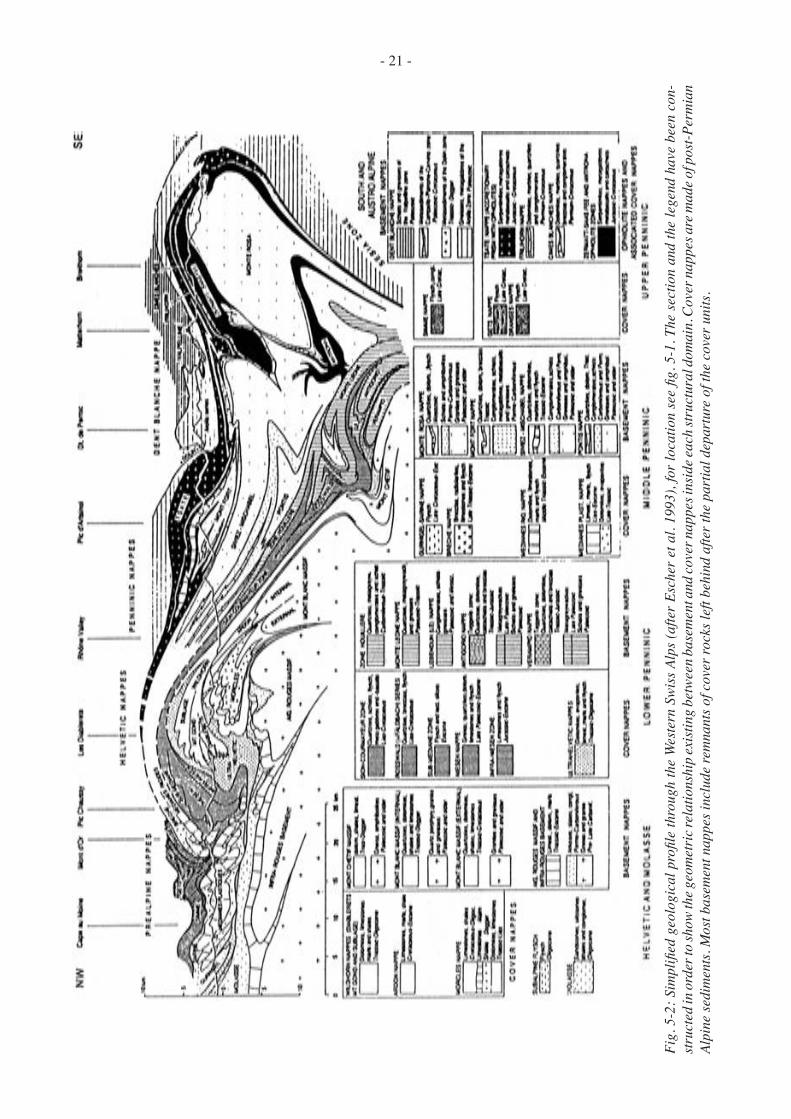
Fig.
5-2
: Sim
plifi
ed g
eolo
gica
l pro
file
thro
ugh
the
Wes
tern
Sw
iss A
lps
(afte
r Es
cher
et a
l. 19
93),
for
loca
tion
see
fig. 5
-1. T
he s
ectio
n an
d th
e le
gend
hav
e be
en c
on-
stru
cted
in o
rder
to sh
ow th
e geo
met
ric r
elat
ions
hip
exis
ting
betw
een
base
men
t and
cove
r nap
pes i
nsid
e eac
h st
ruct
ural
dom
ain.
Cov
er n
appe
s are
mad
e of p
ost-P
erm
ian
Alpi
ne se
dim
ents
. Mos
t bas
emen
t nap
pes i
nclu
de re
mna
nts o
f cov
er ro
cks l
eft b
ehin
d af
ter t
he p
artia
l dep
artu
re o
f the
cov
er u
nits
.

- 22 -
cross-sections of fig. 5-2 and 5-3 with the horizontal cross-section (at an altitude of 2000 m) of fig. 5-1, which can be regarded as a tectonic map devoid of the effects of topography.
5.1.3.2 Deformation history
One can roughly subdivide the Tertiary continen-tal-collision deformation history of this segment of the Alpine belt into 4 main phases (Steck 1990):
1.- A first NW-vergent folding phase linked to the under-thrusting of the European margin under part of the Adriatic crust (Termier’s “traîneau écraseur”, 1903), which is responsible for the nappe formation and setting.
2.- This under-thrusting is followed by a phase of dextral transpression. In the Penninic Alps, these two phases occurred under green schist and amphibolite metamorphic conditions.
3.- The indentation of part of the Adriatic plate under the Central Alps (Argand’s Insubric phase, 1916) produced two generations of south vergent folds (“backfolds”) in the ductile Central Alps and south vergent thrusts in the Southern Alps (Laubscher 1973).
4.- A dextral transpressional phase reactivated
the Rhone-Simplon line (Bearth 1956; Steck 1984; Mancktelow 1990) and the Insubric line (e.g. Schmid et al. 1989) and was accompanied by the creation of large-scale depressions and domes, such as the Rawil-Valpelline depression or the Aar-Toce culmination.
It is mainly thanks to these last three deforma-tion phases (which generated W to SW fold-axis and stretching lineations), rather than to the strong Alpine topography, that it is possible to laterally project the outcropping geology to considerable depths in the Central Alps. These projections have to be made along curved paths which take into account the vari-ous folding phases, which in some cases is a rather brain-racking task. This is further complicated by the fact that some tectonic units have limited extensions. So the method used for these projections must not be regarded as pure cylindrism but rather as a kind of adapted cylindrism (Escher 1988). An average error on the depth resulting from such projections can be estimated at about 10-20%, but this value is subject to change from case to case.
5.1.3.3 Description of the main structural units
From the top to the bottom of this nappe edi-fice, one encounters first the Dent Blanche nappe and the Sesia zone, situated on the northern side of the Canavese line (a segment of the Insubric line).
Fig. 5-3: Cross-section Brig-Hübshorn (after Steck in Marchant & Steck 1991), for location see fig. 5-1; R.-S.L = Rhone-Simplon line.

- 23 -
These two Austroalpine units, composed in fact of several tectonic sub-units, were located on the northern margin of the Adriatic plate (Stampfli & Marthaler 1990) and, during the Tertiary continental collision, they overthrusted the northern Piemont (or Alpine Tethys) margin, acting as a “traîneau écraseur rigide” (a rigid crushing sledge: Termier 1903; Steck 1987) for the underlying units. Structurally under the Austroalpine units, one finds four distinct nappes: the Zermatt-Saas, Tsaté, Cîmes Blanches and Frilihorn nappes. The Zermatt-Saas nappe consists mainly of ophiolites, which suffered eclogitic metamorphism during the eo-alpine subduction phase and are a scrap of the Piemont oceanic crust. The Tsaté nappe, an in-termixture of ophiolites and calc-schists which eluded the eo-alpine eclogitic metamorphism, represents the remains of the accretionary prism (Sartori 1987, Steck 1987, Marthaler & Stampfli 1989) formed during the subduction of the Piemont ocean. The Cîmes Blanches and Frilihorn nappes are extremely thin, made up of sediments ranging from Permian to Cretaceous. Their origin and setting mechanism are still uncertain. As it is impossible to distinguish these four nappes from each other on the seismic sections, the more general name of the Combin zone, as defined by Argand (1909) is usually used here. Another ophiolitic unit, the Antrona unit, can be structurally linked to the Zermatt-Saas nappe, but they were probably separated by the Loranco shear zone during the Tertiary deformations.
Under this suture zone, one finds five units, the Monte Rosa, the Mont Fort, the Siviez-Mischabel and the Pontis nappes, and the zone Houillère (Escher 1988), all originating from the Briançonnais domain (Stampfli & Marthaler 1990, Stampfli 1993 and ref. therein). One can subdivide their lithology into three distinct parts:
- Various Hercynian (pre-Namurian) basement gneisses intruded by Late Paleozoic granites. They form nearly the entire Monte Rosa nappe, most of the Siviez-Mischabel nappe, and part of the Pontis nappe (the Ruitor, Stalden Sup., Berisal and Mon-cucco zones).
- Continental clastic sedimentary series dat-ing from Late Carboniferous to Early Triassic with some volcano-clastics which form most of the zone Houillère and the Mont Fort nappe, parts of the Siviez-Mischabel and Pontis nappes, and a little of the Monte Rosa nappe.
- Mainly marine sedimentary series dating from the Middle Triassic to the Eocene. The main parts of this sedimentary cover were detached from their basements and can now be found in the Prealpine nappes on the external part of the belt (Baud &
Septfontaine 1980). Thus in the Penninic Alps only a few scraps of this cover can be found, such as the limestones of the Pontis nappe or the Barrhorn unit (Sartori 1990).
Under these Briançonnais units, are found those originating from the North Penninic domain (including the Valais trough). They are numerous (Jeanbourquin & Burri 1991 and ref. therein) and sometimes too thin and too similar in their lithology to be individually distinguished on the seismic sections. Therefore they are grouped here arbitrarily in three different units:
- The Sion-Courmayeur zone s.l., which includes the Sion-Courmayeur zone s.s., consisting of Meso-zoic and Tertiary (?) sediments with a few ophiolitic rocks and the shaly Rosswald series (Lias-Tertiary (?)).
- The Monte Leone nappe s.l., formed of various gneisses and some crystalline meta-conglomerates in which the Fäldbach zone (Lias-Late Cretaceous(?)), a chaotic formation with green rocks is included for convenience.
- The Lebendun nappe s.l., whose main part is made of clastic meta-sedimentary Mesozoic rocks (confused by most authors with Paleozoic) with smaller amounts of Paleozoic Penninic basement (Spring et al. 1992). The Sabbione zone (Lias-Dog-ger) is also included here.
Under these typical Valais units lie those origi-nating from the South Helvetic margin (Steck 1987), which are the following from south to north:
- The Antigorio nappe, a large-scale anticlinal basement fold nappe, mainly made up of Hercynian orthogneisses.
- Beneath the Antigorio nappe, the lowest observ-able basement unit, the Verampio nappe, is made of the Baceno micaschists (of indeterminate pre-Triassic age) and the Verampio granites, usually regarded as Paleozoic (Steck 1984).
- The Teggiolo zone, a Mesozoic meta-sedi-mentary series which is the cover of the two former basement nappes.
- Below these lowest outcropping units of the Alpine edifice, the existence of at least one other base-ment nappe can be supposed on the basis of structural and paleogeographic criteria: the radical part of the Wildhorn Helvetic sedimentary cover nappe, which is situated south of the Gotthard massif (Masson et al. 1980, fig. 5), must therefore have its basement some-where under the Verampio nappe. This hypothetical basement unit is called here the “X” nappe.
- The Gotthard and Aar massifs, which belong to the External Crystalline massifs, consist mainly of Hercynian basement and some Permo-Carboniferous
- 24 -
sediments and volcano-clastics. A stretched syncline of the latter separates the two massifs.
- The Helvetic sedimentary cover nappes Dol-denhorn, Plammis, Jägerchruz and Wildhorn nap-pes, made of rocks from the Triassic to the Middle Oligocene.
As a result, the actual state of the Alpine orogen in the Internal western Swiss Alps is the following: an impressive pile of nappes showing a very varying and contrasted lithological succession, a situation very likely to produce seismic reflections as long as the potential reflectors do not have a strong dip.
5.1.4 ACQUISITION AND PROCESSING
The acquisition of the three deep seismic pro-files presented in this chapter was carried out by the Compagnie Générale de Géophysique (CGG) in 1987. The field spread was 19.44 km long, with 240 groups of 18 geophones spaced every 80 m. Two types of sources were used: Vibroseis with 5-6 trucks vibrat-ing every 80 m yielding a 120 nominal coverage, and dynamite with an average charge of 100 kg every 5 km. Final recording length (after cross-correlation) corresponds to 20 s (TWT) with a 4 ms sampling. Larger explosive charges, up to 1,200 kg, were fired several tens of kilometres away from the field spread so as to extend the near-vertical seismic profiles through wide-angle reflection data. Some of these shots were undertaken across the Swiss-Italian border in collaboration with CROP, the Italian equivalent of the PNR/NFP-20 project (see § 1.3). The ETH-Zürich also took advantage of some of these shots by lay-ing down a small geophone line away of the main seismic line in order to obtain more 3-D information punctually (e.g. the Arolla line, fig. 7-14).
The seismic sections presented in this chapter are only based on the Vibroseis data which have a much better signal-to-noise ratio than the dynamite data for the upper part of the sections (down to about 8 s). This upper part in fact covers most of the nappe system, which is the main subject of this chapter. The seismic sections shown here were all processed by the GRANSIR Group and detailed accounts of the processing can be found in publications from Du Bois et al. (1990a & 1990b) and Levato et al. (1993). One particularly interesting and useful aspect of the processing is the pseudo-3D study presented by Du Bois et al. (1990a). Taking advantage of the crooked line geometry, which produces locally a large scatter of CMP (Common Mid Points), they were able to obtain small stacked sections perpendicular to the
main profile. These small perpendicular sections can provide substantial information about lateral dips. Furthermore they can be used for pre-stack dynamic corrections which can considerably improve the qual-ity of the stacked section.
Processing problems occurred with the conven-tional migration (by finite-difference wave-equation) with the W2 and W4 lines as these are very short (19 and 7 km respectively) and have many steep reflectors: a lot of information gets lost on the side-edges of these sections. Geometric depth-migration based on line-drawings (the CIGOGNE program, see § 3.2.3) proved to be very helpful in avoiding such problems.
5.2 Modelling and interpretation of the W2 profile
5.2.1 THE VIBROSEIS SEISMIC SECTIONS
The W2 line starts near the town of Sierre in the Rhone valley and then runs south up the Val d’Anniviers to the village of Zinal, crossing part of the Penninic nappes (for location, see fig. 5-1). In the central part of the line, the stacked section (fig. 5-4) shows an excellent signal-to-noise ratio. At both ends, the quality deteriorates sharply, which is in part due to a reduced coverage. Below Niouc hardly any reflectors are visible: this can also be due to the fact that the seismic line in this area follows a cliff, which can cause destructive reverberations. Another cause of this low-quality data is probably related to the dense dextral fault system which affects the lower part of the Val d’Anniviers (Sartori, 1993).
The migrated section (fig. 5-5) is of good quality in its central part. However, due to the limited length of this profile (19 km), both ends of the section as well as the bottom part are smeared with migration smiles, often indistinguishable from real reflections. Furthermore this section is probably slightly under-migrated (see § 5.2.3).
The main reflectors of this profile can be subdi-vided into four groups (A-D, see fig. 5-6):
- A: south-dipping reflectors in the first 5 s cross-ing the whole section.
- B: north-dipping reflectors from CDP 300 to the end of the line, situated between 1 and 3 s.
- C: north-dipping reflectors from 4 to 7 s mainly in the southern half of the line.
- D: variously oriented reflectors located below the group C.

- 25 -
Fig. 5-4: Vibroseis stacked section of the W2 line; colour raster display.

- 26 -
Fig. 5-5: Conventional migrated section of the W2 line; colour raster display.
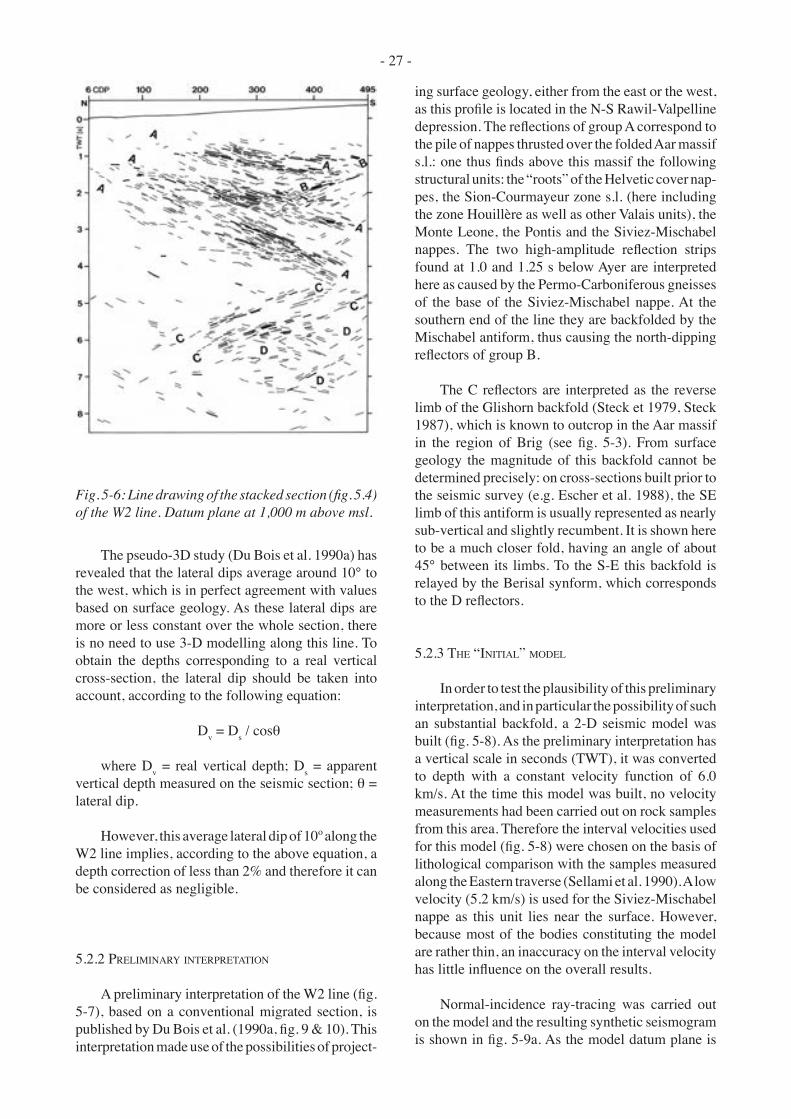
- 27 -
The pseudo-3D study (Du Bois et al. 1990a) has revealed that the lateral dips average around 10° to the west, which is in perfect agreement with values based on surface geology. As these lateral dips are more or less constant over the whole section, there is no need to use 3-D modelling along this line. To obtain the depths corresponding to a real vertical cross-section, the lateral dip should be taken into account, according to the following equation:
Dv = Ds / cosθ
where Dv = real vertical depth; Ds = apparent vertical depth measured on the seismic section; θ = lateral dip.
However, this average lateral dip of 10º along the W2 line implies, according to the above equation, a depth correction of less than 2% and therefore it can be considered as negligible.
5.2.2 PRELIMINARY INTERPRETATION
A preliminary interpretation of the W2 line (fig. 5-7), based on a conventional migrated section, is published by Du Bois et al. (1990a, fig. 9 & 10). This interpretation made use of the possibilities of project-
ing surface geology, either from the east or the west, as this profile is located in the N-S Rawil-Valpelline depression. The reflections of group A correspond to the pile of nappes thrusted over the folded Aar massif s.l.: one thus finds above this massif the following structural units: the “roots” of the Helvetic cover nap-pes, the Sion-Courmayeur zone s.l. (here including the zone Houillère as well as other Valais units), the Monte Leone, the Pontis and the Siviez-Mischabel nappes. The two high-amplitude reflection strips found at 1.0 and 1.25 s below Ayer are interpreted here as caused by the Permo-Carboniferous gneisses of the base of the Siviez-Mischabel nappe. At the southern end of the line they are backfolded by the Mischabel antiform, thus causing the north-dipping reflectors of group B.
The C reflectors are interpreted as the reverse limb of the Glishorn backfold (Steck et 1979, Steck 1987), which is known to outcrop in the Aar massif in the region of Brig (see fig. 5-3). From surface geology the magnitude of this backfold cannot be determined precisely: on cross-sections built prior to the seismic survey (e.g. Escher et al. 1988), the SE limb of this antiform is usually represented as nearly sub-vertical and slightly recumbent. It is shown here to be a much closer fold, having an angle of about 45° between its limbs. To the S-E this backfold is relayed by the Berisal synform, which corresponds to the D reflectors.
5.2.3 THE “INITIAL” MODEL
In order to test the plausibility of this preliminary interpretation, and in particular the possibility of such an substantial backfold, a 2-D seismic model was built (fig. 5-8). As the preliminary interpretation has a vertical scale in seconds (TWT), it was converted to depth with a constant velocity function of 6.0 km/s. At the time this model was built, no velocity measurements had been carried out on rock samples from this area. Therefore the interval velocities used for this model (fig. 5-8) were chosen on the basis of lithological comparison with the samples measured along the Eastern traverse (Sellami et al. 1990). A low velocity (5.2 km/s) is used for the Siviez-Mischabel nappe as this unit lies near the surface. However, because most of the bodies constituting the model are rather thin, an inaccuracy on the interval velocity has little influence on the overall results.
Normal-incidence ray-tracing was carried out on the model and the resulting synthetic seismogram is shown in fig. 5-9a. As the model datum plane is
Fig. 5-6: Line drawing of the stacked section (fig. 5.4) of the W2 line. Datum plane at 1,000 m above msl.

- 28 -
Fig. 5-8: “Initial” 2-D model for the W2 line, with normal-incidence ray-tracing on the overturned limb of the Aar massif. Datum plane at mean sea level. P-C = Permo-Carboniferous of the Siviez-Mischabel nappe; RSL = Rhone-Simplon line; Z-S = Zermatt-Saas nappe.
Fig. 5-7: Preliminary interpretation of the W2 line (after Du Bois et al. 1990a, fig. 10). D.B = Dent Blanche nappe; P-C = Permo-Carboniferous of the Siviez-Mischabel nappe; Z-S = Zermatt-Saas nappe.
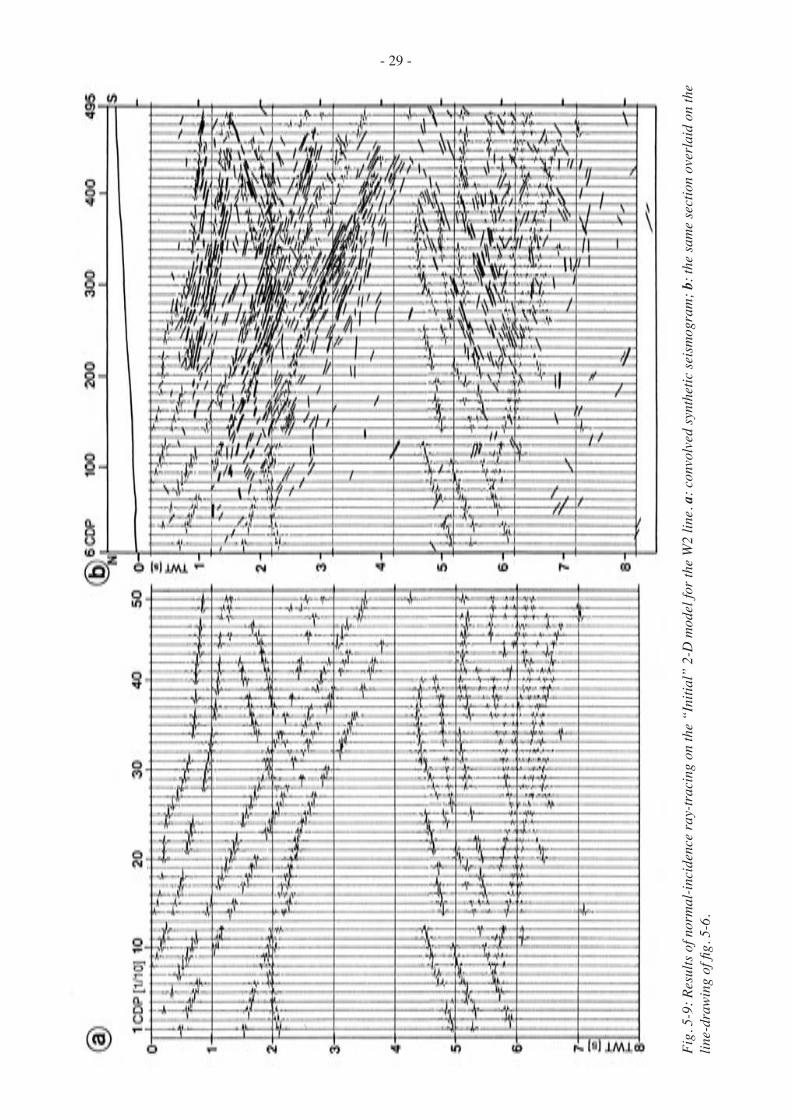
- 29 -
Fig.
5-9
: Res
ults
of n
orm
al-in
cide
nce
ray-
trac
ing
on th
e “I
nitia
l” 2
-D m
odel
for t
he W
2 lin
e. a
: con
volv
ed sy
nthe
tic se
ism
ogra
m; b
: the
sam
e se
ctio
n ov
erla
id o
n th
e lin
e-dr
awin
g of
fig.
5-6
.

- 30 -
at mean sea level, a shift of 0.25 s is necessary to compare the synthetic seismogram with the original stacked section which has a datum plane at 1,000 m above msl (fig. 5-9b). The ray-tracing did not capture any rays issued from the Zermatt-Saas nappe, which is probably located too far to the south of the line. Therefore this unit is not taken into account in the other models.
For an initial model, the synthetic seismogram shows quite a good correlation down to 4-5 s with the original stacked section. In particular the “croco-dile” pattern produced by the Mischabel backfold (at 1-2.5 s below Zinal) shows a very close fit with the seismic section. The top of the Aar massif can still be improved to get a better fit. The structures and velocity contrasts of this upper part of the model tend to deflect the rays issued from the bottom part of the section, as illustrated in fig. 5-8 for the rays related to the overturned limb of the Aar massif. This could explain the discontinuity and short extensions of the reflectors C and D.
The overall reflection pattern of the bottom part of the synthetic section is similar to the one of the original stacked section, but the position of the C reflections is different. The synthetic C reflections are located higher and extend further north than on the original C reflections. This implies that the Glishorn backfold is not as intensively folded as it is in the interpreta-tion of Du Bois et al. (1990a). The angle between the limbs of this backfold is thus probably of the order of 60° rather than 45°. Another consequence of this mismatch is that it reveals that the migrated section, on which the Du Bois et al. (1990a) interpretation is based, is under-migrated (their migrated section is different from the one shown here in fig. 5-5).
5.2.4 VELOCITY MODELLING
Another problem with the interpretation of Du Bois et al. (1990a) concerns their correlation of the two high-amplitude reflection strips, found at 1.0 and 1.25 s below Ayer, with the Permo-Carboniferous gneisses of the Siviez-Mischabel nappe. If this sub-unit is likely to produce a strong reflection at its base, which is in contact with the high-velocity marbles of the Pontis nappe, this is probably not the case at its top. Already in the field it can be extremely difficult to differentiate the Permo-Carboniferous gneisses from the overlying pre-Westphalian gneisses. Therefore it is most unlikely that these two rather similar litholo-gies can produce any significant reflections.
A more plausible interpretation of these two high-amplitude reflectors is that they are related to the Pontis marbles, which are sandwiched in between the gneisses of the Pontis and Siviez-Mischabel nappes. Such lithological contacts can produce a reflection coefficient above 0.10 (see § 4.3.2). Another argu-ment in favour of this hypothesis is the cross-section constructed by Marthaler (pers. comm.) prior to the seismic survey (fig. 5-10). On this cross-section the depth of the Pontis marbles below Vissoie corresponds nearly exactly to the depth of the two high-amplitude reflectors. Either of these arguments are sufficient to favour the second hypothesis, but to be absolutely sure seismic velocity modelling was used.
The concepts of the velocity modelling applied here are the following. The ANVIT and ANVIR mod-ules (Cordier 1983, § 13) of the GEOVECTEUR seismic processing software (CGG™) can determine the op-timal stacking velocities for each CDP along a given horizon. On the basis of these stacking velocities it is easy to calculate internal (or lithological) velocities
Fig. 5-10: Cross-section through the lower part of the Val d’Anniviers, which follows exactly the W2 seismic line (Marthaler, pers. comm.). Z.H. = zone Houillère.
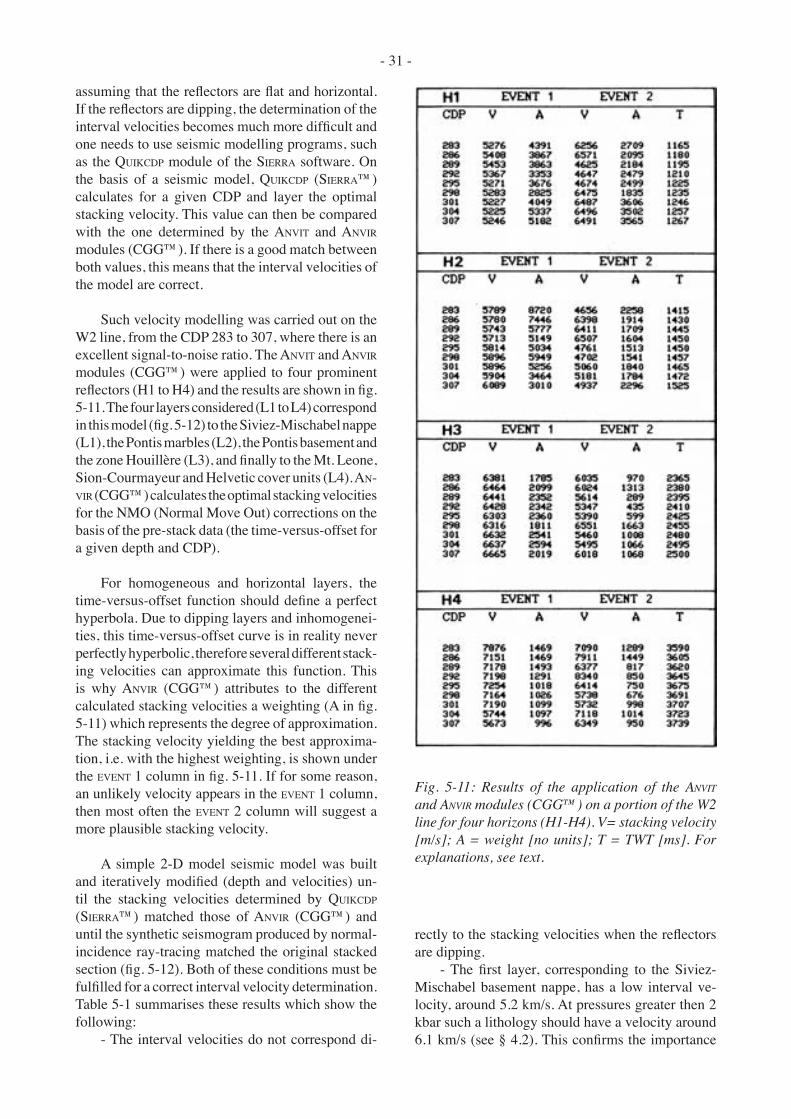
- 31 -
assuming that the reflectors are flat and horizontal. If the reflectors are dipping, the determination of the interval velocities becomes much more difficult and one needs to use seismic modelling programs, such as the QUIKCDP module of the SIERRA software. On the basis of a seismic model, QUIKCDP (SIERRA™) calculates for a given CDP and layer the optimal stacking velocity. This value can then be compared with the one determined by the ANVIT and ANVIR modules (CGG™). If there is a good match between both values, this means that the interval velocities of the model are correct.
Such velocity modelling was carried out on the W2 line, from the CDP 283 to 307, where there is an excellent signal-to-noise ratio. The ANVIT and ANVIR modules (CGG™) were applied to four prominent reflectors (H1 to H4) and the results are shown in fig. 5-11. The four layers considered (L1 to L4) correspond in this model (fig. 5-12) to the Siviez-Mischabel nappe (L1), the Pontis marbles (L2), the Pontis basement and the zone Houillère (L3), and finally to the Mt. Leone, Sion-Courmayeur and Helvetic cover units (L4). AN-VIR (CGG™) calculates the optimal stacking velocities for the NMO (Normal Move Out) corrections on the basis of the pre-stack data (the time-versus-offset for a given depth and CDP).
For homogeneous and horizontal layers, the time-versus-offset function should define a perfect hyperbola. Due to dipping layers and inhomogenei-ties, this time-versus-offset curve is in reality never perfectly hyperbolic, therefore several different stack-ing velocities can approximate this function. This is why ANVIR (CGG™) attributes to the different calculated stacking velocities a weighting (A in fig. 5-11) which represents the degree of approximation. The stacking velocity yielding the best approxima-tion, i.e. with the highest weighting, is shown under the EVENT 1 column in fig. 5-11. If for some reason, an unlikely velocity appears in the EVENT 1 column, then most often the EVENT 2 column will suggest a more plausible stacking velocity.
A simple 2-D model seismic model was built and iteratively modified (depth and velocities) un-til the stacking velocities determined by QUIKCDP (SIERRA™) matched those of ANVIR (CGG™) and until the synthetic seismogram produced by normal-incidence ray-tracing matched the original stacked section (fig. 5-12). Both of these conditions must be fulfilled for a correct interval velocity determination. Table 5-1 summarises these results which show the following:
- The interval velocities do not correspond di-
rectly to the stacking velocities when the reflectors are dipping.
- The first layer, corresponding to the Siviez-Mischabel basement nappe, has a low interval ve-locity, around 5.2 km/s. At pressures greater then 2 kbar such a lithology should have a velocity around 6.1 km/s (see § 4.2). This confirms the importance
Fig. 5-11: Results of the application of the ANVIT and ANVIR modules (CGG™) on a portion of the W2 line for four horizons (H1-H4). V= stacking velocity [m/s]; A = weight [no units]; T = TWT [ms]. For explanations, see text.
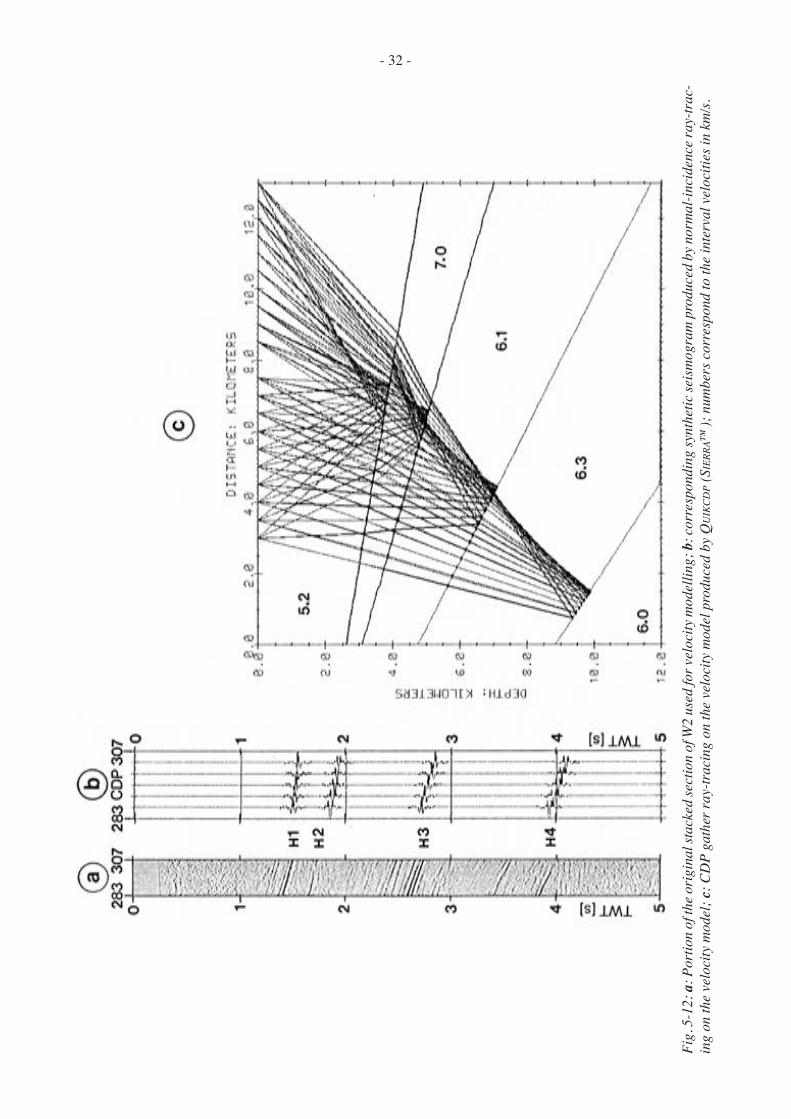
- 32 -
Fig.
5-1
2: a
: Por
tion
of th
e ori
gina
l sta
cked
sect
ion
of W
2 us
ed fo
r vel
ocity
mod
ellin
g; b
: cor
resp
ondi
ng sy
nthe
tic se
ism
ogra
m p
rodu
ced
by n
orm
al-in
cide
nce r
ay-tr
ac-
ing
on th
e ve
loci
ty m
odel
; c: C
DP
gath
er ra
y-tr
acin
g on
the
velo
city
mod
el p
rodu
ced
by Q
UIK
CD
P (S
IERR
A™);
num
bers
cor
resp
ond
to th
e in
terv
al v
eloc
ities
in k
m/s
.

- 33 -
of taking into account the velocity reduction due to open micro-cracks at depths corresponding to less than 2 kbar.
- The second layer must have a high interval velocity, around 7.0 km/s. Such a value is incom-patible with the presence of Permo-Carboniferous gneiss but perfectly compatible with the presence of marble. This is the third sound argument in favour of correlation of the two high-amplitude reflection strips, found at 1.0 and 1.25 s below Ayer, with the Pontis marbles.
- In general all the interval velocities determined here readily match the velocities measured in labo-ratory on rock samples (Sellami et al. 1993), thus confirming that this method is reliable.
- Finally, all these results demonstrate that velocity modelling can be an extremely powerful interpretation tool, which in theory should yield un-equivocal results. However, this lack of ambiguity depends largely on the quality of the stacking velocity analysis and furthermore this method is unfortunately rather tedious.
5.2.5 THE “FINAL” MODEL
On the basis of the conventional migrated sec-tion from fig. 5-5 and taking into account the results from the two previous models, a new model was built, called here the “Final” model (fig. 5-13). The two high-amplitude reflection strips, found at 1.0 and 1.25 s below Ayer, are thus related to the marbles of the Pontis nappe. Further down below this locality, the seismic model regards the rather transparent zone between 1.3 and 2.0 s as related to the basement of the Pontis nappe, the highly reflective zone, between
Table 5-1: Comparison of the stacking velocities (in km/s) obtained with ANVIR (CGG™) and QUIKCDP (SIERRA™); Int. vel. = interval velocity.
Fig. 5.13: “Final” 2-D model for the W2 line. RSL = Rhone-Simplon line; dotted line: shape of the Aar massif in the “Initial” model (fig. 5-8).

- 34 -
Fig.
5-1
4: R
esul
ts o
f nor
mal
-inci
denc
e ra
y-tr
acin
g on
the
“Fin
al”
2-D
mod
el fo
r th
e W
2 lin
e. a
: con
volv
ed s
ynth
etic
sei
smog
ram
with
add
ition
of r
ando
m n
oise
; b:
the
sam
e se
ctio
n ov
erla
id o
n th
e lin
e-dr
awin
g of
fig.
5-6
.

- 35 -
2.0 and 2.6 s as related to the zone Houillère, the transparent zone between 2.6 and 2.9 s as related to the Mt. Leone nappe and the Sion-Courmayeur zone, and the highly reflective zone between 2.9 and 3.5 s as related to the Helvetic cover nappes. The Glishorn and Berisal backfolds are here less intensively folded than on the “Initial” model: the overturned limb of the Glishorn antiform has an average dip of 45° to the north.
The results of normal-incidence ray-tracing on the “Final” model are shown in fig. 5-14. Down to 4.5 s the match between the stacked and synthetic sections is good, except for the top of the Aar massif, which in reality has a more complex structure than that of the
model. On the seismic model, a small normal fault affects the Pontis marbles beneath Zinal and produces a small shift of the corresponding reflectors, a shift also visible on the stacked section. Such a structure is most likely as it correlates well with the normal faults known at the surface (e.g. Escher 1988, fig. 2b).
For the bottom half of the model, the seismic pat-tern produced by the Glishorn and Berisal backfolds is much closer to the stacked section than with the initial model. However the reflectors corresponding to the overturned limb of the Glishorn antiform appear on the synthetic section about 1 s higher than on the stacked section. This misfit suggest that the hinge of the Glishorn backfold could be more open and not as
Fig. 5-15: Geometric depth-migration of the W2 Vibroseis line.

- 36 -
sharp as shown on the seismic model. This confirms the fact that the conventional migrated section in fig. 5-5 is slightly under-migrated and this is why geometric depth-migration was carried out.
5.2.6 INTERPRETATION OF THE W2 LINE
The results of the geometric depth-migration of the W2 line is shown in fig. 5-15. A comparison of this figure with the conventional migration (fig. 5-5) reveals that the C group of north-dipping reflectors have been moved further south on the geometric mi-grated section (reflectors 2I & 2J in fig. 5-15). This favours an interpretation (fig. 5-16) in which these north-dipping reflectors are related to the Berisal synform rather than to the overturned limb of the Glishorn backfold, which is shown in fig. 5-15 to be too steep to be imaged. The boundaries and names of the structural units situated in the area of the Ber-isal synform must be regarded as rough indications,
as at such depths correlation with surface geology becomes uncertain.
For the upper half of the section, the interpreta-tion (fig. 5-15) is quite similar to the “Final” model (§ 5.2.5). The Rhone-Simplon line was traced to depth by following a succession of reflector discontinuities (types of onlaps or toplaps), which reveal an important accident. The reflectors linked to this accident (2G) are not particularly strong as its mylonitic reflectivity is weak (§ 4.3.1) and as this fault juxtaposes rocks with similar seismic properties. Furthermore because of its southward dip, it will not be imaged on the southern end of the seismic line. Above this tectonic accident, the rather transparent zone on the southern end of the section is interpreted as the zone Houillère base-ment, which, on the basis of field and palaeographic arguments is unlikely to be located very far from the Sion-Courmayeur zone. The very strong reflections located at 5 km under Mission are probably due to large lenses of gypsum which separate the zone Houillère
Fig. 5-16: Interpretation of line W2 based on fig. 5-15.
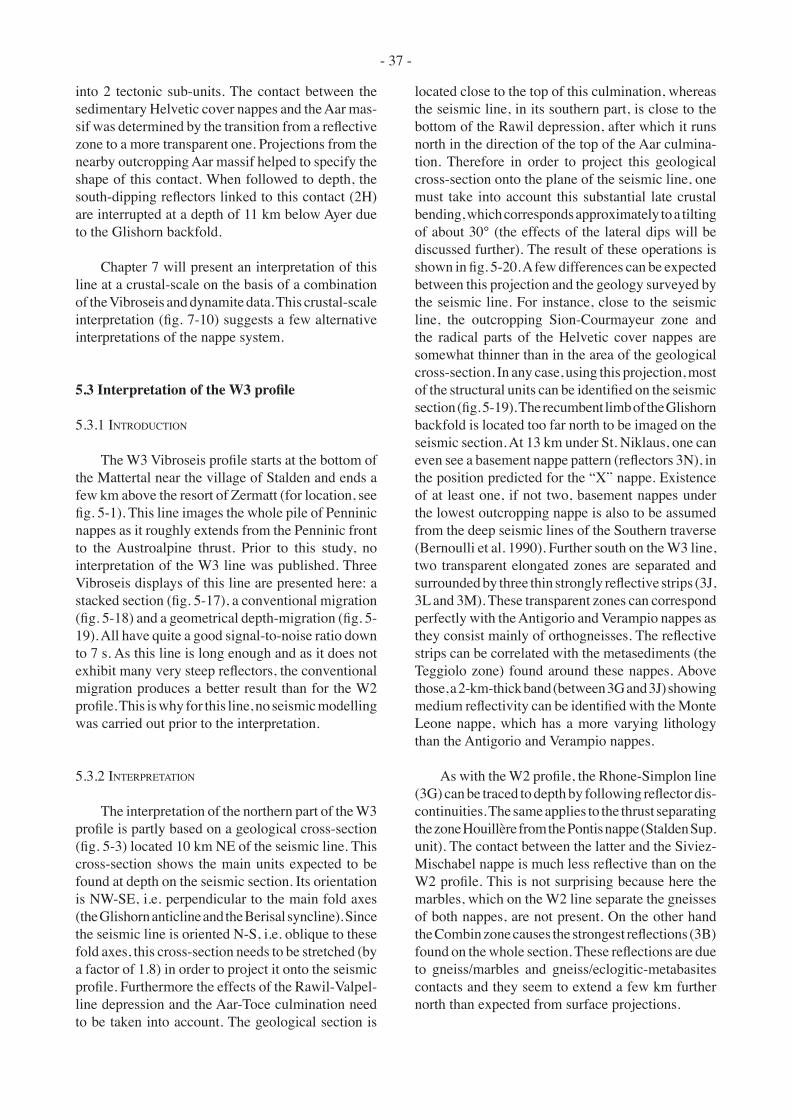
- 37 -
into 2 tectonic sub-units. The contact between the sedimentary Helvetic cover nappes and the Aar mas-sif was determined by the transition from a reflective zone to a more transparent one. Projections from the nearby outcropping Aar massif helped to specify the shape of this contact. When followed to depth, the south-dipping reflectors linked to this contact (2H) are interrupted at a depth of 11 km below Ayer due to the Glishorn backfold.
Chapter 7 will present an interpretation of this line at a crustal-scale on the basis of a combination of the Vibroseis and dynamite data. This crustal-scale interpretation (fig. 7-10) suggests a few alternative interpretations of the nappe system.
5.3 Interpretation of the W3 profile
5.3.1 INTRODUCTION
The W3 Vibroseis profile starts at the bottom of the Mattertal near the village of Stalden and ends a few km above the resort of Zermatt (for location, see fig. 5-1). This line images the whole pile of Penninic nappes as it roughly extends from the Penninic front to the Austroalpine thrust. Prior to this study, no interpretation of the W3 line was published. Three Vibroseis displays of this line are presented here: a stacked section (fig. 5-17), a conventional migration (fig. 5-18) and a geometrical depth-migration (fig. 5-19). All have quite a good signal-to-noise ratio down to 7 s. As this line is long enough and as it does not exhibit many very steep reflectors, the conventional migration produces a better result than for the W2 profile. This is why for this line, no seismic modelling was carried out prior to the interpretation.
5.3.2 INTERPRETATION
The interpretation of the northern part of the W3 profile is partly based on a geological cross-section (fig. 5-3) located 10 km NE of the seismic line. This cross-section shows the main units expected to be found at depth on the seismic section. Its orientation is NW-SE, i.e. perpendicular to the main fold axes (the Glishorn anticline and the Berisal syncline). Since the seismic line is oriented N-S, i.e. oblique to these fold axes, this cross-section needs to be stretched (by a factor of 1.8) in order to project it onto the seismic profile. Furthermore the effects of the Rawil-Valpel-line depression and the Aar-Toce culmination need to be taken into account. The geological section is
located close to the top of this culmination, whereas the seismic line, in its southern part, is close to the bottom of the Rawil depression, after which it runs north in the direction of the top of the Aar culmina-tion. Therefore in order to project this geological cross-section onto the plane of the seismic line, one must take into account this substantial late crustal bending, which corresponds approximately to a tilting of about 30° (the effects of the lateral dips will be discussed further). The result of these operations is shown in fig. 5-20. A few differences can be expected between this projection and the geology surveyed by the seismic line. For instance, close to the seismic line, the outcropping Sion-Courmayeur zone and the radical parts of the Helvetic cover nappes are somewhat thinner than in the area of the geological cross-section. In any case, using this projection, most of the structural units can be identified on the seismic section (fig. 5-19). The recumbent limb of the Glishorn backfold is located too far north to be imaged on the seismic section. At 13 km under St. Niklaus, one can even see a basement nappe pattern (reflectors 3N), in the position predicted for the “X” nappe. Existence of at least one, if not two, basement nappes under the lowest outcropping nappe is also to be assumed from the deep seismic lines of the Southern traverse (Bernoulli et al. 1990). Further south on the W3 line, two transparent elongated zones are separated and surrounded by three thin strongly reflective strips (3J, 3L and 3M). These transparent zones can correspond perfectly with the Antigorio and Verampio nappes as they consist mainly of orthogneisses. The reflective strips can be correlated with the metasediments (the Teggiolo zone) found around these nappes. Above those, a 2-km-thick band (between 3G and 3J) showing medium reflectivity can be identified with the Monte Leone nappe, which has a more varying lithology than the Antigorio and Verampio nappes.
As with the W2 profile, the Rhone-Simplon line (3G) can be traced to depth by following reflector dis-continuities. The same applies to the thrust separating the zone Houillère from the Pontis nappe (Stalden Sup. unit). The contact between the latter and the Siviez-Mischabel nappe is much less reflective than on the W2 profile. This is not surprising because here the marbles, which on the W2 line separate the gneisses of both nappes, are not present. On the other hand the Combin zone causes the strongest reflections (3B) found on the whole section. These reflections are due to gneiss/marbles and gneiss/eclogitic-metabasites contacts and they seem to extend a few km further north than expected from surface projections.

- 38 -
Fig.
5-1
7: V
ibro
seis
stac
ked
sect
ion
of th
e W
3 lin
e; c
olou
r ras
ter d
ispl
ay.
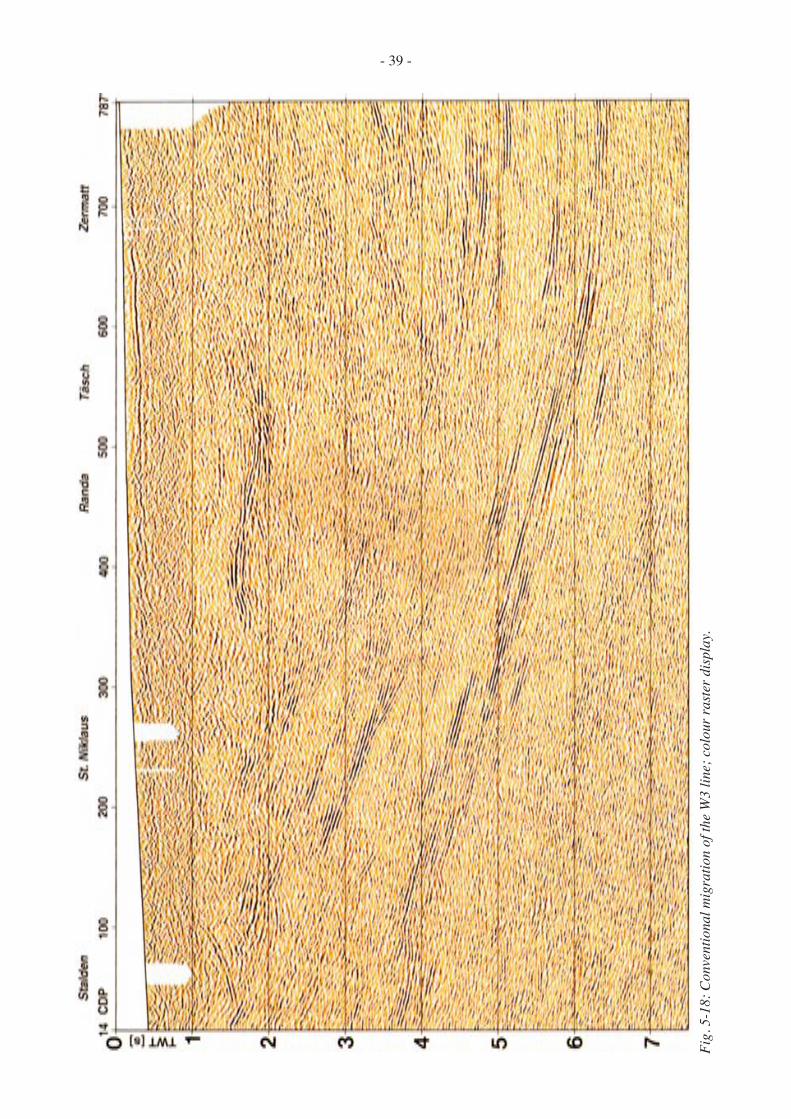
- 39 -
Fig.
5-1
8: C
onve
ntio
nal m
igra
tion
of th
e W
3 lin
e; c
olou
r ras
ter d
ispl
ay.
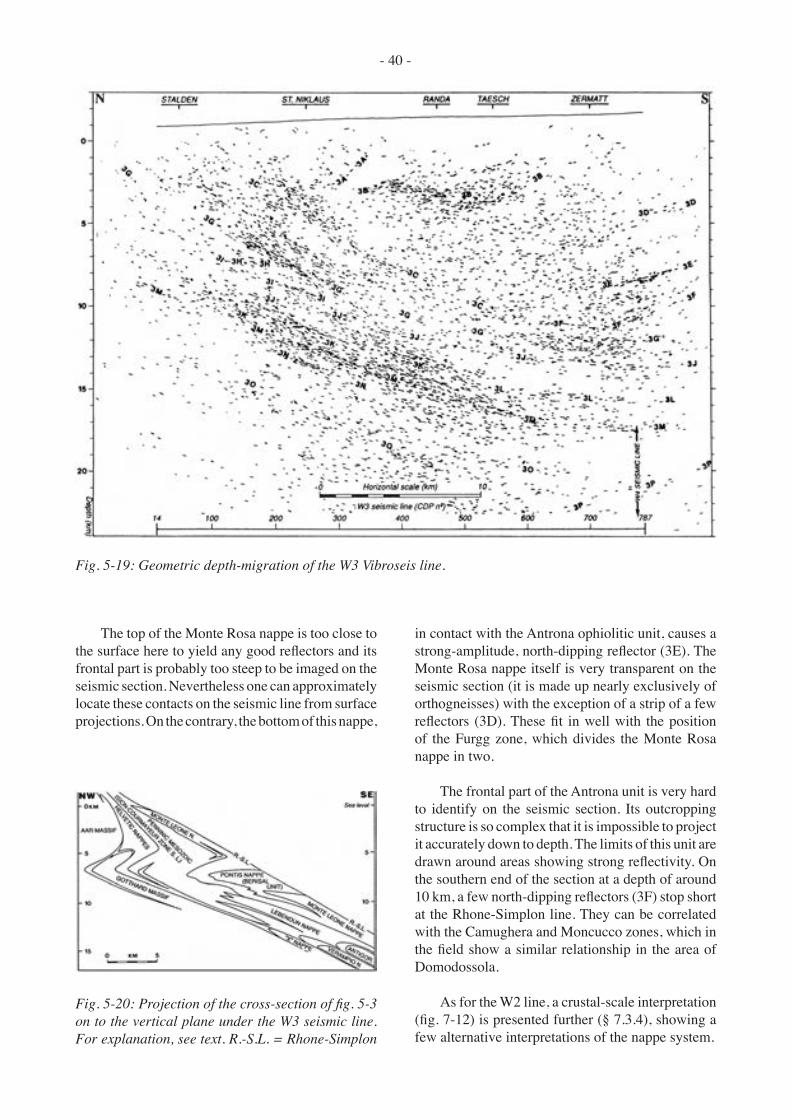
- 40 -
The top of the Monte Rosa nappe is too close to the surface here to yield any good reflectors and its frontal part is probably too steep to be imaged on the seismic section. Nevertheless one can approximately locate these contacts on the seismic line from surface projections. On the contrary, the bottom of this nappe,
in contact with the Antrona ophiolitic unit, causes a strong-amplitude, north-dipping reflector (3E). The Monte Rosa nappe itself is very transparent on the seismic section (it is made up nearly exclusively of orthogneisses) with the exception of a strip of a few reflectors (3D). These fit in well with the position of the Furgg zone, which divides the Monte Rosa nappe in two.
The frontal part of the Antrona unit is very hard to identify on the seismic section. Its outcropping structure is so complex that it is impossible to project it accurately down to depth. The limits of this unit are drawn around areas showing strong reflectivity. On the southern end of the section at a depth of around 10 km, a few north-dipping reflectors (3F) stop short at the Rhone-Simplon line. They can be correlated with the Camughera and Moncucco zones, which in the field show a similar relationship in the area of Domodossola.
As for the W2 line, a crustal-scale interpretation (fig. 7-12) is presented further (§ 7.3.4), showing a few alternative interpretations of the nappe system.
Fig. 5-19: Geometric depth-migration of the W3 Vibroseis line.
Fig. 5-20: Projection of the cross-section of fig. 5-3 on to the vertical plane under the W3 seismic line. For explanation, see text. R.-S.L. = Rhone-Simplon

- 41 -
5.4 Interpretation of the W4 profile
5.4.1 INTRODUCTION
This very short E-W line, less than 8 km long, intersects the southern end of line W3, just above Zermatt (for location, see fig. 5-1). The stacked sec-tion (fig. 5-22 and 3-2a) shows a few sub-horizontal reflectors and many others with a strong eastward dip. Some of these, once migrated (fig. 3-3d, 5-24 & 5-25), were moved well over 30 km to the east! In this figure, the part of the section located east of Findelen (the extremity of the W4 line) is an incomplete section, in the sense that horizontal or east-dipping reflectors are not imaged. However surface geology does not predict any surfaces showing such an orientation. The interpretation will show that many reflectors can be related to sideswipes. Due to these lateral reflec-tions, this seismic section must not be considered as a picture of a vertical cross-section, but rather as a 2-D image of a volume of rocks extending several tens of km away from the line.
A raw section of the Zmutt dynamite shot is shown in fig. 5-23 and an attempt of a conventional migration of the W4 line in fig. 5-24. This line is too short to obtain a good migrated section (see § 3.2.3.2), but it nevertheless provides additional information to the geometric depth-migrated section in fig. 5-25.
In chapter 7, a crustal-scale interpretation (fig. 7-16), based on the Vibroseis and dynamite data of the W4 line, is presented; this interpretation extends further to the west so as to intersect the W5 profile.
5.4.2 INTERPRETATION
On the geometric migrated section (fig. 5-25), two strong reflection strips (4B and 4D) outline a rather transparent zone. When extrapolated to the surface these reflectors coincide with the top and bottom of the Monte Rosa nappe (see interpretation in fig. 5-26). The top of this nappe is even more clearly imaged on the raw section of the Zmutt dynamite shot (fig. 5-23). Under this nappe, many rather strong reflections (4E) could be correlated with the Antrona ophiolitic unit. Further down, a few less reflective horizons, dipping to the west (4F), terminate against sub-hori-zontal reflections (4G). As on line W3, this kind of unconformity is interpreted as being caused by the Rhone-Simplon line. Under this accident, a similar seismo-facies (4H, 4I and 4K) as on line W3 is found at the same depth. Therefore these reflectors can be correlated with the Monte Leone, Antigorio and the Verampio nappes. It is quite possible that this latter nappe is folded isoclinally under the Strahlhorn; its overturned limb would then correlate with the reflec-tors 4K. This backfold would be an equivalent of the
Fig. 5-21: Interpretation of line W3 based on fig. 5-19.

- 42 -
Vanzone anticline which affects the Southern Steep belt above the Rhone-Simplon line.
Further to the east under the Monte Moro, two strips of rather strong reflectors (4L and 4M) show a kind of listric shape which flattens itself out under the seismic line. These curved reflectors are probably no migration artefacts and when extrapolated to the surface, they coincide with the two ophiolitic units (the Combin zone and the Antrona unit) which wrap the radical part of the Monte Rosa nappe. In fact, in this region, the Southern Steep belt dips progressively towards the NE and therefore the former reflections are lateral arrivals with an angle which could eventu-ally reach up to 25° relative to the E-W W4 seismic line. Further to the east on the migrated section, the area between reflectors 4M and 4N can be correlated with the Sesia zone. The high-amplitude reflective zone (4N) matches perfectly with the Canavese line if one takes into account the effect of lateral dips (towards the NE in this region). On deeper sections (fig. 3-3d & 7-13) than the one shown here (fig. 5-25), the Canavese line can be further followed to depth
Fig. 5-23: The Zmutt dynamite shot, located in the middle of the W4 line. The arrows outline the top and bottom of the Monte Rosa nappe.
Fig. 5-22: Stacked section of the W4 Vibroseis line; colour raster display.

- 43 -
Fig. 5-24: Attempt of a conventional migration of the W4 Vibroseis line, with an addition of 75 "dead" traces at the eastern end of the line (Levato, pers. comm.).
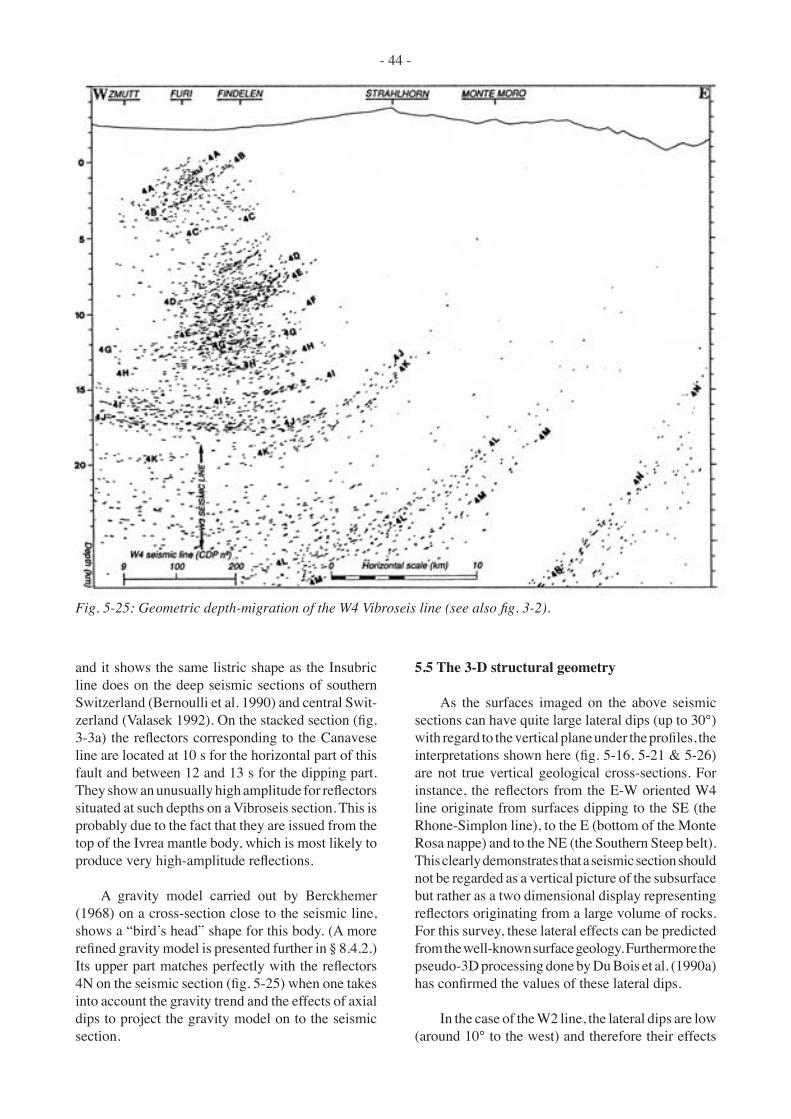
- 44 -
and it shows the same listric shape as the Insubric line does on the deep seismic sections of southern Switzerland (Bernoulli et al. 1990) and central Swit-zerland (Valasek 1992). On the stacked section (fig. 3-3a) the reflectors corresponding to the Canavese line are located at 10 s for the horizontal part of this fault and between 12 and 13 s for the dipping part. They show an unusually high amplitude for reflectors situated at such depths on a Vibroseis section. This is probably due to the fact that they are issued from the top of the Ivrea mantle body, which is most likely to produce very high-amplitude reflections.
A gravity model carried out by Berckhemer (1968) on a cross-section close to the seismic line, shows a “bird’s head” shape for this body. (A more refined gravity model is presented further in § 8.4.2.) Its upper part matches perfectly with the reflectors 4N on the seismic section (fig. 5-25) when one takes into account the gravity trend and the effects of axial dips to project the gravity model on to the seismic section.
5.5 The 3-D structural geometry
As the surfaces imaged on the above seismic sections can have quite large lateral dips (up to 30°) with regard to the vertical plane under the profiles, the interpretations shown here (fig. 5-16, 5-21 & 5-26) are not true vertical geological cross-sections. For instance, the reflectors from the E-W oriented W4 line originate from surfaces dipping to the SE (the Rhone-Simplon line), to the E (bottom of the Monte Rosa nappe) and to the NE (the Southern Steep belt). This clearly demonstrates that a seismic section should not be regarded as a vertical picture of the subsurface but rather as a two dimensional display representing reflectors originating from a large volume of rocks. For this survey, these lateral effects can be predicted from the well-known surface geology. Furthermore the pseudo-3D processing done by Du Bois et al. (1990a) has confirmed the values of these lateral dips.
In the case of the W2 line, the lateral dips are low (around 10° to the west) and therefore their effects
Fig. 5-25: Geometric depth-migration of the W4 Vibroseis line (see also fig. 3-2).

- 45 -
are almost negligible. The W3 line on its northern part, has a general lateral dip of around 25° to the west, which means that the real depths under the seismic line should be increased by about 10% (see equation in § 5.2.1) compared to the depths shown on the seismic interpretation (fig. 5-21). Further south along this line, the value of the lateral dip tends to-wards zero. At the intersection with the W4 line, one can see that the Lower Penninic nappes are nearly horizontal, which is not surprising as this intersection is very close to the bottom of the Rawil-Valpelline depression. The lateral dips for the W4 line have been mentioned above.
In fig. 5-27, a simplified horizontal cross-section (part of fig. 5-1) is combined with the real vertical cross-sections along the three seismic lines. Due to the perspective effects on this 3-D diagram the cor-rections of lateral dips are not striking: depths have been adjusted but this has little effect on the overall structural geometry. What appears clearly here is the
importance of the large-scale dome-and-basin struc-ture that affects the Central Alps (see § 5.1.3.2). The viewpoint (of fig. 5-27) is located above the bottom of the Rawil-Valpelline depression and one is looking NE towards the top of the Aar-Toce culmination.
The importance of this large-scale dome-and-basin structure can be quantified through longitudinal cross-sections following the axial plane. In fig. 5-28 a comparison of different axial dips based on longi-tudinal cross-sections is presented together with the results of the interpretation of the W2 and W3 profiles. The reference points along these longitudinal cross-sections is the contact between the Fäldbach zone and the Berisal unit, and more precisely at the Berisal synform which outcrops about 20 km to the NE of the W3 seismic line. This outcrop serves as a reference for the comparison of the axial dips. Some differences between the curves shown in fig. 5-28 are partly due to slightly different locations of the cross-sections. The curve corresponding to the seismic interpretations
Fig. 5-26: Interpretation of the W4 line based on fig. 5-25.

- 46 -
Fig. 5-27: Block diagram of the Central Swiss Alps along the W2, W3 and W4 seismic lines. For location (points A-F), see fig. 5-1.

- 47 -
goes deeper than the curves based on surface geology. This difference could be smaller, depending where one defines precisely the hinge of the Berisal synform on the seismic sections. However such a difference is not so surprising, as a field oriented geologist will be tempted to be more conservative when constructing such a cross-section.
5.6 A synthetic section of the Penninic nappes
5.6.1 CONSTRUCTION OF THE SECTION
By combining the 3 migrated sections of the W2, W3 and W4 profiles, one is able to construct a synthetic cross-section of the nappe system through the Western Swiss Alps, from the External Crystalline massifs to the Insubric line (fig. 5-29). This combina-tion however is not straightforward due to the axial dips of the main structures. For the correlation of lines W2 and W3, first one has to take into account the direction of the main fold axes, which are NE-SW. The southern end of W2 corresponds then to the northern end of W3 (see fig. 5-1). Secondly, these axes have dips between 20 and 25°; therefore the southern end of W2 is structurally several km higher than the northern part of W3. Lastly one needs to take into account the effects of the Rawil-Valpelline depression and the Aar-Toce culmination: the W2 line is located along the axis of the depression while the W3 line runs from the Aar-Toce culmination into the Rawil-Valpelline depression. All these effects can be approximated by introducing a tilt of about 30°
between the two sections. The resulting section is oriented N-S. Correlating W3 and W4 implies a tilt of about 10° between the 2 sections and an angle of 90° on the cross-section. The final result (fig. 5-29) is a synthetic cross-section of the Western Swiss Alps, first oriented N-S then W-E (fig. 5-1). This change in the orientation of the line is the reason why the radical part of the Lower Penninic nappes apparently seems to stand up, while in fig. 5-2. they plunge to depth. This again is an effect of the axial dips.
This combination of seismic sections along the Western traverse is of course a rough approxima-tion: in reality the effects of the axial dips should correspond to flexures and not to the sharp angles introduced to correlate one line with the other. To complete this synthetic section, the Moho discontinu-ity was projected on the basis of depth-migrations of the dynamite data (Valasek 1992) for the European Moho and on the basis of gravity modelling (Ber-ckhemer 1968) for the Adriatic Moho. As chapter 7 will deal with the crustal-scale interpretation along the Western traverse, only the aspects concerning the nappe system will be discussed here.
5.6.2 NAPPE CORRELATION
Once this combination of the migrated sections is carried out, one gets a very good match between the reflectors of the three sections (see fig. 5-15, 5-19 and 5-24): 2D/3A, 2E/3C, 2G/3G, 2I/3K, 2J/3M, 3E/4D, 3J/4H, etc. This combination produces not
Fig. 5-28: Comparison of axial dips along longitudinal cross-sections in the area affected by the Berisal syn-form, after Argand (1911), Steck (pers. comm.), Mancktelow (1990). Warning: some of the differences may be due to different locations of the cross-sections (see text for explanation).

- 48 -
Fig.
5-2
9: S
ynth
etic
seis
mic
sect
ion
and
inte
rpre
tatio
n al
ong
the
Wes
tern
trav
erse
. For
exp
lana
tion,
see
text
.

- 49 -
only a good correlation of the reflectivity pattern but also an excellent correlation of the interpretation of the individual lines. Only a few minor adjustments of the individual interpretations need to be made because the overall structures are not truly cylindri-cal. For instance, the axes of the Berisal synform and the Mischabel antiform are not parallel. However, as the distance between the W2 and W3 lines is not too great, this non-cylindricity has little influence.
Another way of correlating the W2 and W3 line is proposed by Valasek (1992) and shown here in fig. 5-30. The W3 migrated section is shifted vertically by 4.2 km relative to the migrated section of the W2 line in order to approximate the effects of the axial plunge. However as the values of the axial dips vary along this traverse, such a correlation is incorrect and can lead to wrong interpretation, in particular for the nappe system where discrepancies of several km can appear.
5.6.3 BACKFOLDING OF THE EXTERNAL CRYSTALLINE MASSIFS
The north-dipping reflectors (2I and 2J, fig. 5-15) of the W2 line have been interpreted as be-ing due to backfolding. This set of north-dipping reflectors located at the internal side of the External Crystalline massifs seems to be a common feature on all the seismic lines shot through the Alps: one finds them from west to east at a depth of: 22 to 15 km on the Ecors-Crop Alp line (fig. 7-5), 20 to 15 km on the PNR/NFP-20 W5 line (fig. 7-15), 18 to 11 km on the W2 line (fig. 5-15), 25 to 18 km on the PNR/NFP-20 Central line (fig. 7-18) and 18 to 10 km on the PNR/NFP-20 E-1 line (fig. 7-23). For the line in Eastern Switzerland, Pfiffner et al. (1990a) have suggested two interpretations: either it is a part of a bow-tie structure produced by the front of the Simano nappe or backthrusting associated with a late phase of backfolding (see also this study § 6.4). Along all the PNR/NFP-20 traverses, Valasek (1992) has systematically associated these north-dipping reflectors with the front of a huge wedge of Adriatic lower-crust.
These north-dipping reflections seem to have been neglected in quite a few of the interpretations of the Ecors-Crop Alp line, but when taken into consideration they have been associated with either an early Alpine structure which was later truncated (Tardy et al. 1990, fig. 6a); as backthrusting (Mugnier et al. 1989; Tardy et al. 1990, fig. 6b), or the front
of a lithospheric wedge (Roure et al. 1989; Bois & ECORS scientific party 1990; Mugnier & Marthelot 1991). None mention the possibility of a backfold, although Roure et al. (1989) show a very large-scale backfold of the Belledonne massif located a few km north and higher than the north-dipping reflectors.
This study favours a solution where these reflec-tors are attributed to the recumbent backfolding of the External Crystalline massifs, i.e. the Glishorn-Evêque antiform and the Berisal synform backfolds along the W2 line, for the following reasons:
- There is unquestionable field evidence that the southern sides of the External Crystalline massifs are affected by a large-scale antiform backfold: the Evêque anticline, which shows a dip of up to 45° to the NW for its overturned limb (Stella 1927), af-fecting the Mont Blanc massif (Steck et al. 1989), the Glishorn anticline on the Aar massif (Steck et al. 1979; Steck 1984, 1987 & 1990) and the Gotthard massif in southern central Switzerland (e.g. Probst 1980). What field observations are unable to predict is the amplitude of this backfolding, and therefore most cross-sections illustrating this backfolding are usually conservative solutions.
- The Berisal synform backfold must be relayed to the north by a significant antiform backfold so as to respect the structural logic and style. This fold-ing occurred in ductile P/T conditions (low-grade amphibolite metamorphic facies).
- There is no field evidence for any significant backthrusting affecting the southern side of the Ex-ternal Crystalline massifs.
- The set of north-dipping reflectors is too thick (between 5 and 10 km) to be interpreted as a thrust plane.
- Once migrated these reflectors move above the depth prolongation of the Insubric line, which shows a large-scale listric shape oriented towards the NW. On all the deep seismic lines shot in the internal zone of the Swiss Alps, the Insubric line, sub-vertical at the surface, flattens out towards the north at depths between 30 and 40 km. At least for the Swiss profiles, it is impossible to associate these north-dipping reflectors with a wedge of the Adriatic plate: these reflectors are located well above the In-subric line and therefore they belong to a structure inside the Lower Penninic zone. Heitzmann et al. (1991), with their interpretation of the PNR/NFP-20 Western traverse, seem to suggest the presence of a
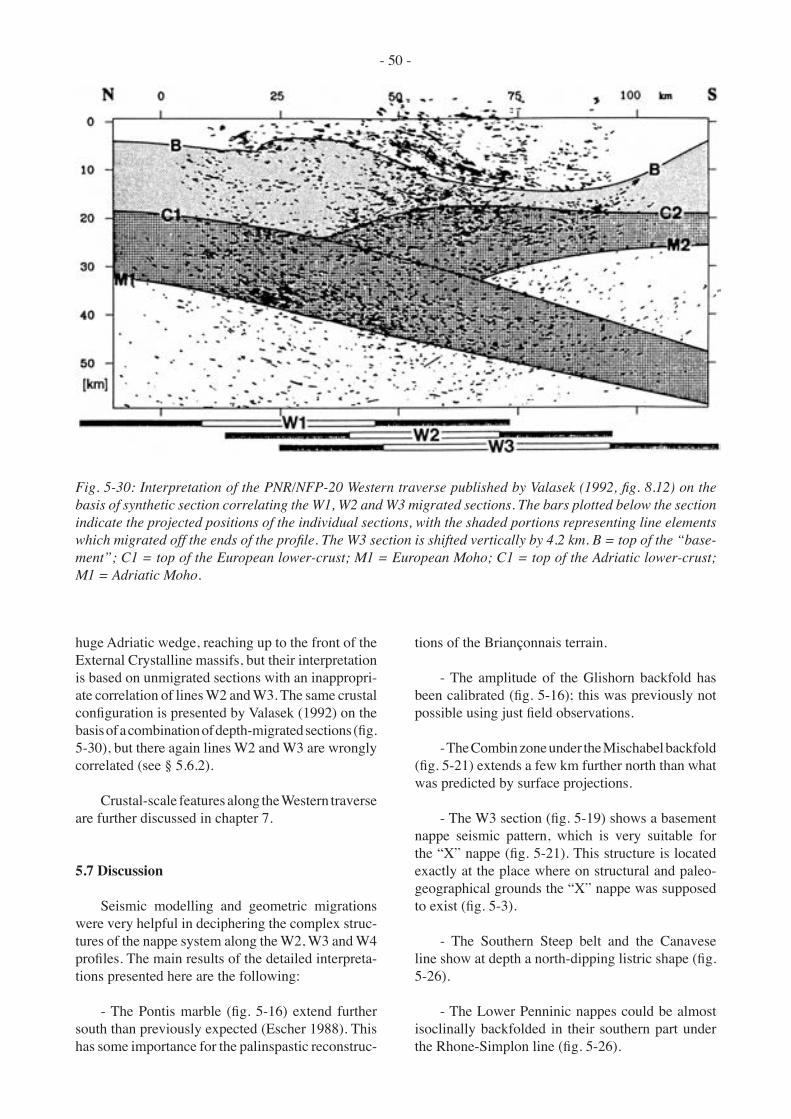
- 50 -
huge Adriatic wedge, reaching up to the front of the External Crystalline massifs, but their interpretation is based on unmigrated sections with an inappropri-ate correlation of lines W2 and W3. The same crustal configuration is presented by Valasek (1992) on the basis of a combination of depth-migrated sections (fig. 5-30), but there again lines W2 and W3 are wrongly correlated (see § 5.6.2).
Crustal-scale features along the Western traverse are further discussed in chapter 7.
5.7 Discussion
Seismic modelling and geometric migrations were very helpful in deciphering the complex struc-tures of the nappe system along the W2, W3 and W4 profiles. The main results of the detailed interpreta-tions presented here are the following:
- The Pontis marble (fig. 5-16) extend further south than previously expected (Escher 1988). This has some importance for the palinspastic reconstruc-
tions of the Briançonnais terrain.
- The amplitude of the Glishorn backfold has been calibrated (fig. 5-16); this was previously not possible using just field observations.
- The Combin zone under the Mischabel backfold (fig. 5-21) extends a few km further north than what was predicted by surface projections.
- The W3 section (fig. 5-19) shows a basement nappe seismic pattern, which is very suitable for the “X” nappe (fig. 5-21). This structure is located exactly at the place where on structural and paleo-geographical grounds the “X” nappe was supposed to exist (fig. 5-3).
- The Southern Steep belt and the Canavese line show at depth a north-dipping listric shape (fig. 5-26).
- The Lower Penninic nappes could be almost isoclinally backfolded in their southern part under the Rhone-Simplon line (fig. 5-26).
Fig. 5-30: Interpretation of the PNR/NFP-20 Western traverse published by Valasek (1992, fig. 8.12) on the basis of synthetic section correlating the W1, W2 and W3 migrated sections. The bars plotted below the section indicate the projected positions of the individual sections, with the shaded portions representing line elements which migrated off the ends of the profile. The W3 section is shifted vertically by 4.2 km. B = top of the “base-ment”; C1 = top of the European lower-crust; M1 = European Moho; C1 = top of the Adriatic lower-crust; M1 = Adriatic Moho.

- 51 -
- The Rawil-Valpelline depression and the Aar-Toce culmination can be considered a part of a large-scale dome-and-basin structure affecting most of the upper-crust (see also § 7.7.2).
- And of course, once the effects of lateral dips have been removed, the depths of the various structural units have been specified, which is often difficult just on the basis of surface projections.
This deep seismic survey of the Penninic Alps of Valais has also revealed several other interesting points:
- The projections of the outcropping geology
of this segment of the Alpine belt proved to be reli-able for correlating reflections down to considerable depths.
- They proved to be of help in identifying the origin of the reflectors. Lithological boundaries, like gneiss/marbles contacts (either stratigraphic or tectonic contacts), seem to be the dominant cause of reflections, rather than mylonite zones (see § 10.2).
- Ductile folding is a major deformation mecha-nism of internal parts of orogens and it has shown distinct seismic patterns which are similar to the “crocodile” seismic signature usually associated with indentation (see § 10.4).

- 52 -
6.1 Introduction
6.1.1 PREVIOUS STUDIES
In 1986 the E1 deep seismic line was the first profile to be shot in the frame of the PNR/NFP-20 research program and it has since been the subject of numerous publications. Acquisition, processing and preliminary interpretations are described by Finckh et al. (1987), Pfiffner et al. (1988), Frei et al. (1989, 1990 & 1992), Du Bois et al. (1990b), Valasek et al. (1990), Valasek & Holliger (1990), Valasek (1990 & 1992), Holliger (1990), Holliger & Kissling (1991), Ansorge et al. (1991), Heitzmann et al. (1991) and Green et al. (1993). More detailed interpretations can be found in publications from Butler (1990b), Valasek et al. (1991), Pfiffner (1990) and Pfiffner et al. (1990b & 1991). Seismic modelling was carried out in the Molasse basin and the Helvetic domain (Stäuble & Pfiffner 1991a & 1991b; Stäuble et al. 1993) and in the Penninic domain (Litak et al. 1991 & 1993). Crustal-scale interpretations related with geodynamic evolutionary models can be found in publications from Laubscher (1990a, 1990b, 1990c, 1990d), Schmid (1992), Schönborn (1992) and Pfif-fner (1992). As the E1 profile follows the European GeoTraverse, numerous studies of its Alpine segment integrating various geophysical methods have been published, most of them referenced in Blundell et al. (1992a). Additional information can be found in the PNR/NFP-20 Bulletins and final report (in prep.).
This chapter is only concerned with the Pen-ninic nappe system along the E1 line and chapter 7 will deal with its interpretation on a crustal-scale. Several 2-D and 3-D seismic models are presented as well as a 2-D gravity model. Seismic modelling is in essence an iterative task, progressively adjust-ing the model until its synthetic seismogram fits the stacked section satisfactorily. In fact misfits can also underline interesting information, therefore some intermediate models are also presented. Finally a detailed interpretation is presented on the basis of a depth-migrated line-drawing.
6.1.2 GEOLOGICAL SETTING
The Penninic domain along the E1 profile has been intensively surveyed by field geologists in the last two decades (Milnes 1978; Milnes & Pfiffner 1980; Probst 1980; Heinrich 1986; Löw 1987; May-erat 1989; Pfiffner et al. 1990a; Schmid et al. 1990; Schreurs 1990; Marquer 1991; Baudin et al. 1992). A brief description of the geological setting follows and, for additional information, the reader is referred to the above-mentioned publications.
Due to the Lepontine dome, most of the Pen-ninic units surveyed by the E1 profile have a strong lateral dip (up to 30°) towards the east. Thanks to this axial dip, it is possible to project surface geology confidently down to depths of around 15 km below the E1 profile. Four main deformation phases affect this area (Marquer 1991; Baudin et al. 1992 and references therein):
- D1: NW-vergent ductile thrusts and folds related to the progressive nappe stacking and occurring under high-P/low-T metamorphic conditions.
- D2: post-collisional crustal-thinning phase related to “top to the east” shearing and SSE-vergent folds with E-W axis. These ductile backfolding defor-mations are contemporaneous with the meso-alpine metamorphic peak which is presently expressed at the surface by greenschist facies in the northern part of the Penninic domain and amphibolite facies in the southern part.
- D3: discontinuous deformations with staircase-geometry folding showing a northern vergence and E-W axis and suggesting a sub-vertical northward shearing.
- D4: ductile-brittle normal faults affecting the whole nappe pile and showing a NNW-SSE strike with downthrow to the NE.
These last two phases occurred under retrograde metamorphic conditions and can be related respec-tively to uplift and late dextral movements along the Insubric line.
From top to bottom the following units are ex-
§ 6. Modelling and interpretation along the southern half of the E1 profile
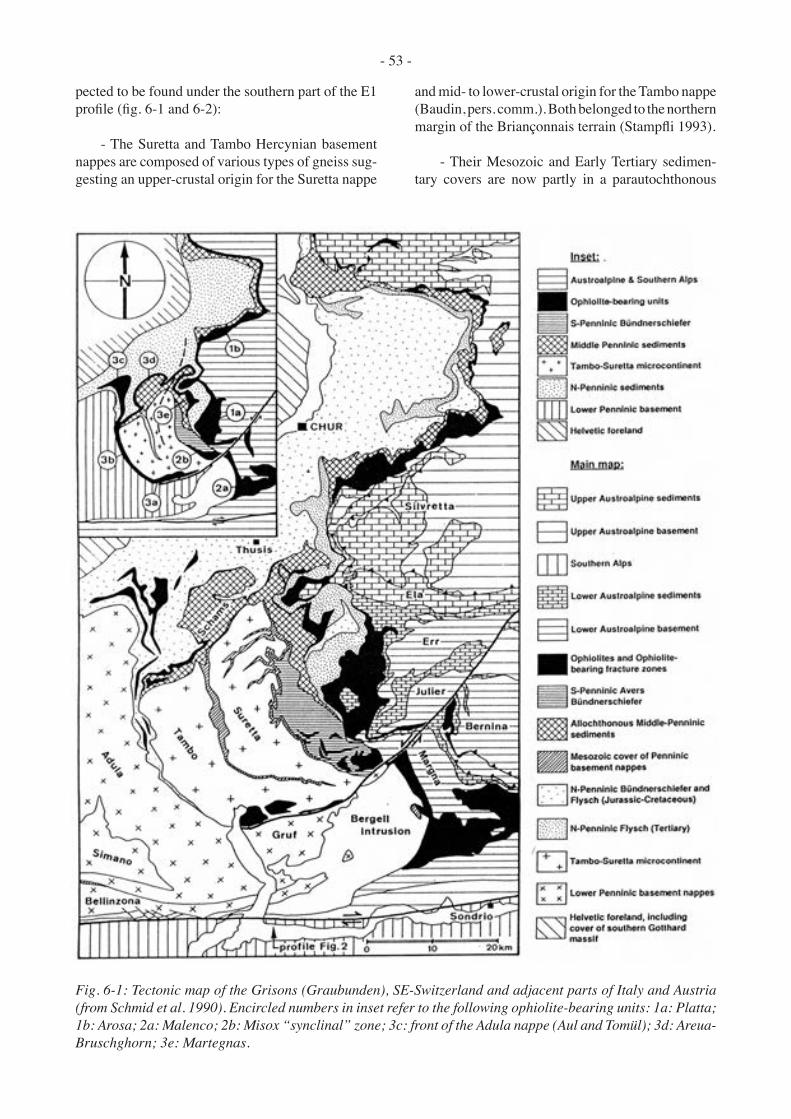
- 53 -
pected to be found under the southern part of the E1 profile (fig. 6-1 and 6-2):
- The Suretta and Tambo Hercynian basement nappes are composed of various types of gneiss sug-gesting an upper-crustal origin for the Suretta nappe
and mid- to lower-crustal origin for the Tambo nappe (Baudin, pers. comm.). Both belonged to the northern margin of the Briançonnais terrain (Stampfli 1993).
- Their Mesozoic and Early Tertiary sedimen-tary covers are now partly in a parautochthonous
Fig. 6-1: Tectonic map of the Grisons (Graubunden), SE-Switzerland and adjacent parts of Italy and Austria (from Schmid et al. 1990). Encircled numbers in inset refer to the following ophiolite-bearing units: 1a: Platta; 1b: Arosa; 2a: Malenco; 2b: Misox “synclinal” zone; 3c: front of the Adula nappe (Aul and Tomül); 3d: Areua-Bruschghorn; 3e: Martegnas.

- 54 -
position, either intensively folded on the top of the Suretta nappe, or squeezed in the thin Splügen zone, which separates the Suretta and the Tambo nappes. Another part got expelled and now forms the rather complicated Schams nappes (Schmid et al. 1990), found at the front of the Tambo and Suretta nappes, as well as above the Avers Schiefer.
- Situated between the Tambo and Adula nappes, the thin Misox zone is composed mainly of clastic sediments (Bündnerschiefer) with limestone and ophiolitic slivers, which could be interpreted as the Valais ocean accretionary prism. To the south it gives way to the Chiavenna ophiolitic body. In between the front of the Adula, Tambo and Suretta nappes and the Penninic frontal thrust, lies an substantial mass of Bündnerschiefer (Jurassic-Cretaceous), which can be subdivided into several units (Nabholz 1945; Probst 1980), two of them (Aul and Tomül) bearing ophiolitic slivers.
- The Adula nappe probably originates from edge of the European margin (Stampfli 1993), and it shows a contrasted lithology of isoclinally folded orthogneisses and paragneisses as well as some am-phibolite and limestone slivers. Its south-eastern part is separated by the Quaternary infill of the Mera valley from the Mt. Gruf basement unit. This unit can either be related to the Adula nappe (Schmid et al. 1990) or to the Briançonnais units (Baudin, pers. comm.) from which it would be separated by the Engadine dextral strike-slip fault. Both the Mt. Gruf unit and the
Adula nappe are intruded by the Novate and Bergell Mid-Oligocene granitoid intrusions.
- Below the Adula nappe and a very thin zone of metasediments, lies the Simano-Leventina-Lu-comagno basement nappe complex. These are the lowermost Alpine units known at the surface and they probably originate from the former European rift shoulder area (Stampfli 1993).
- Northwest of the Penninic thrust, the External Crystalline massifs (Aar, Tavetsch and Gotthard) and part of their related Helvetic cover nappes plunge south-eastwards below the E1 profile.
6.1.3 ACQUISITION AND PROCESSING
The acquisition (see ref. of § 6.1.1) of the E1 deep seismic profile was carried out by Prakla-Seismos AG. with a 19.12 km spread length and 18-24 geophone groups spaced every 80 m. Two types of sources were used: Vibroseis with 5-6 trucks vibrating every 40 m and yielding a 120 nominal fold and dynamite with an average charge of 100 kg every 5 km, yielding a 1-4 nominal fold. Final recording length corresponds to 20 s (TWT) with a 4 ms sampling.
As this chapter is concerned with the first 8 s (TWT), only the higher resolution Vibroseis data was used. This data shown here was processed by the GRANSIR Group at the University of Lausanne.
Fig. 6-2: N-S cross-section parallel to the E-W Swiss kilometric coordinate 755, for location see fig. 6-1 (from Schmid et al. 1990).

- 55 -
The processing sequence used (Du Bois et al. 1990a & 1990b; Pfiffner et al. 1990b, Green et al. 1993) is rather conventional for deep seismic data. However the very uneven topography along the line demanded a particularly sophisticated handling of the static cor-rections. Pre-stack dip-move-out was also of great help to increase the resolution of steep reflectors.
6.1.4 PRELIMINARY INTERPRETATIONS
Preliminary interpretations based on a Vibro-seis stacked section were published by Pfiffner et al. (1990b) for the shallow structures (down to 20 km) of the southern part of E1 profile. For this area they suggest three different possible interpretations (fig. 6-3). If some surfaces (such as the bottom of the Suretta nappe, the top of the Tambo and Adula nappes, the ophiolitic slivers of the Aul and Tomül units) can be confidently related to major reflectors, this is not the case with other features which offer different possible interpretations:
- The External Crystalline massifs which, due to their steep and complicated topography, are badly imaged on the seismic section.
- The Chiavenna ophiolitic body: either “thin” (fig. 6-3a) or “thick” (fig. 6-3b & 3c).
- The front of the Adula nappe: either situated below Canova (fig. 6-3a & 3b) or further south below Zillis (fig. 6-3c).
- The north-dipping reflectors at 5-6 s below Zillis are either part of a bow-tie structure related to the front of the Simano nappe (fig. 6-3a & 3b) or to backthrusting of the Gotthard massif (fig. 6-3c).
It is some of these ambiguities that this study tries to solve, through seismic and gravity modelling.
6.2 3-D seismic models
6.2.1 INTRODUCTION
The 3-D modelling of this chapter was undertaken in 1989 at Cornell University in collaboration with R. Litak. As this study is based on personal research, I will mainly present the models which I created myself, called “Initial”, “South” and “Final” models. R. Litak then further refined this last model and, as it has been published (Litak et al. 1993), it will only be mentioned briefly.
The velocities chosen for the models are based on the laboratory measurements carried out by Sellami et al. (1990) on rock samples from the surveyed area.
Whenever possible, a velocity gradient was introduced to take into account the low velocities of the first few kilometres. Most of the models were built with a datum plane at 0.7 km above msl, therefore a subtraction is necessary to compare the models with real depths. Normal-incidence ray-tracing was usually carried out for every ten CDPs of the Vibroseis line.
6.2.2 THE “INITIAL” MODEL
The “Initial” model, partly published in Litak et al. (1991 & 1993), is based on isohypse maps of the Suretta, Tambo and Adula nappes, constructed by Pfiffner et al. (1990a) on the basis of field structural data. For the top and the bottom of these nappes, they defined isohypse contours corresponding to altitudes of +3 to -1 km. To build the 3-D model, these contours were further extrapolated to depth on an area of 50 by 20 km (fig. 6-4). This extrapolation was done as cylindrically as possible, pure cylindrism not being applicable here because the northern part of the model plunges towards the east and its southern part towards the north. Irregularities due to small surface structures were smoothed out at depth. Fig. 6-5 illustrates through cross-sections the 3-D geometry of the model and indicates the velocities used in this model.
The layer defining the top of the Tambo nappe also takes part of the Schams nappes into account. The part of these nappes situated at the front of the Tambo nappe is not present on this model nor on the following ones. The wedge-like structure called “Mt. Gruf ?” on the model, could in fact belong to various units, such as an extension of the Mt. Gruf unit north of the Engadine line, a thickening of the Misox Bündnerschiefer (Pfiffner et al. 1990b; Schmid et al. 1990), a thickening of the Chiavenna ophiolites (Pfiffner et al. 1990b; Schmid 1992), or even an un-known unit, as surface geology is unable to predict what could be expected there.
The resulting synthetic seismogram (fig. 6-6) of this “Initial” model is already very close to the stacked section, as interpreted by Pfiffner et al. (1990b). Ex-cept for a mismatch of less than 0.4 s under the CDP 2100, the bottom of the Suretta nappe and the top of the Tambo nappe match their interpretation nearly perfectly. From the CDP 2100 to the end of the line, the bottom of the Tambo nappe corresponds well with its interpretation, but the front of this nappe shows on the synthetic seismogram a very steep reflection around 3 s below Innerferrera. Such a steep south-dipping reflection does not appear on the Vibroseis stacked section. There could be two reasons for this: one is
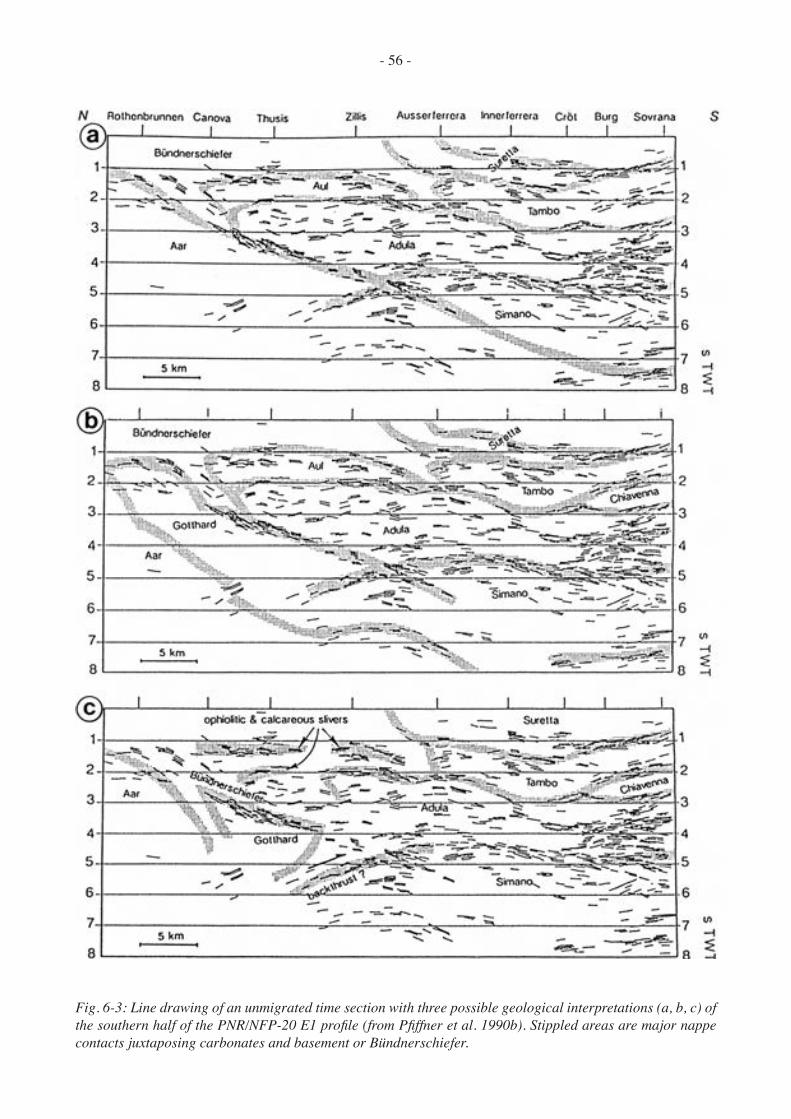
- 56 -
Fig. 6-3: Line drawing of an unmigrated time section with three possible geological interpretations (a, b, c) of the southern half of the PNR/NFP-20 E1 profile (from Pfiffner et al. 1990b). Stippled areas are major nappe contacts juxtaposing carbonates and basement or Bündnerschiefer.

- 57 -
Fig.
6-4
: Iso
hyps
e m
aps
of th
e la
yers
intro
duce
d in
the
“Ini
tial”
mod
el. T
hick
line
s ar
e fro
m P
fiffn
er e
t al.
(199
0a) a
nd th
in li
nes
are
dept
h ex
trap
olat
ions
. Hat
chin
g re
pres
ents
the
outc
rop
of th
e co
rres
pond
ing
napp
e. D
atum
pla
ne is
her
e at
sea
leve
l and
dep
ths h
ave
nega
tive
valu
es. a
: bas
e of
the
Sure
tta n
appe
(and
top
of th
e Sp
lü-
gen
zone
); b
: top
of t
he T
ambo
nap
pe (a
nd b
ase
of th
e Sp
lüge
n zo
ne a
nd th
e Sc
ham
s nap
pes p
.p.);
c: b
ase
of th
e Ta
mbo
nap
pe (a
nd to
p of
the
Mt.
Gru
f uni
t); d
: top
of
the
Adul
a na
ppe
(and
bas
e of
the
Mt.
Gru
f uni
t); e
: bas
e of
the
Adul
a na
ppe
(and
top
of th
e Lo
wer
Pen
nini
c un
its).

- 58 -
Fig.
6-4
: (co
nt.)

- 59 -
that the shape of the Tambo nappe might be different from that of the model, the other possibility is that such steep reflections are not imaged on the stacked section. In fact nowhere on this line can one observe reflections with such a strong dip. A 2-D model was built to try to solve this problem (§ 6.3.1).
The top of the Adula nappe produces a reflection quite close to its interpretation in the central part of the model, but at both ends there is a mismatch of 0.4 s. The bottom of the Adula nappe yields quite a complex pattern of reflections near its front, which is due to its kind of synform shape. Such a pattern
can also be seen on the stacked section and it is bet-ter understood when one looks at the projections of the ray paths on the isohypse map from the bottom of the Adula nappe (fig. 6-7). In order to distinguish individual rays, only those corresponding to each 50 CDP are represented. Not only does this figure illustrate the bow-tie reflection pattern produced by the synform near the front of the Adula nappe, but it highlights the effects of lateral dips. Due to the 3-D structure of this area, the seismic line can have recorded reflections issuing more than 15 km west of the line.
Fig. 6-5: Cross-sections through the “Initial” model.
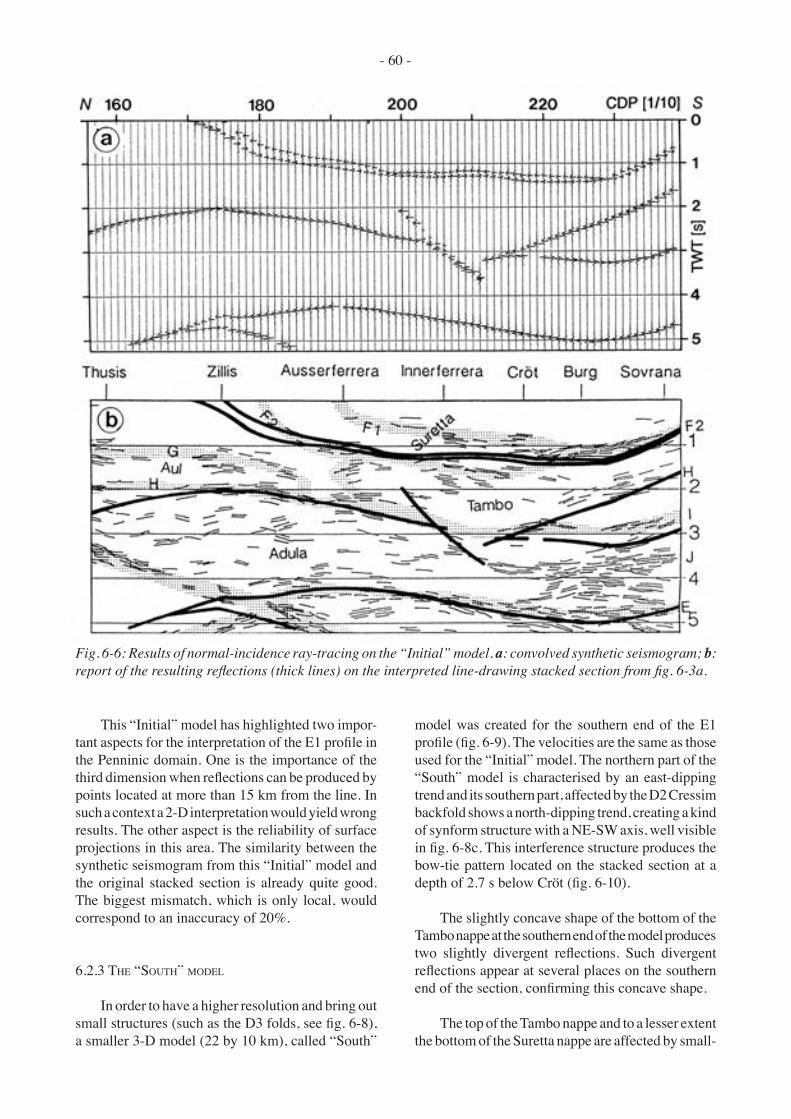
- 60 -
This “Initial” model has highlighted two impor-tant aspects for the interpretation of the E1 profile in the Penninic domain. One is the importance of the third dimension when reflections can be produced by points located at more than 15 km from the line. In such a context a 2-D interpretation would yield wrong results. The other aspect is the reliability of surface projections in this area. The similarity between the synthetic seismogram from this “Initial” model and the original stacked section is already quite good. The biggest mismatch, which is only local, would correspond to an inaccuracy of 20%.
6.2.3 THE “SOUTH” MODEL
In order to have a higher resolution and bring out small structures (such as the D3 folds, see fig. 6-8), a smaller 3-D model (22 by 10 km), called “South”
model was created for the southern end of the E1 profile (fig. 6-9). The velocities are the same as those used for the “Initial” model. The northern part of the “South” model is characterised by an east-dipping trend and its southern part, affected by the D2 Cressim backfold shows a north-dipping trend, creating a kind of synform structure with a NE-SW axis, well visible in fig. 6-8c. This interference structure produces the bow-tie pattern located on the stacked section at a depth of 2.7 s below Cröt (fig. 6-10).
The slightly concave shape of the bottom of the Tambo nappe at the southern end of the model produces two slightly divergent reflections. Such divergent reflections appear at several places on the southern end of the section, confirming this concave shape.
The top of the Tambo nappe and to a lesser extent the bottom of the Suretta nappe are affected by small-
Fig. 6-6: Results of normal-incidence ray-tracing on the “Initial” model. a: convolved synthetic seismogram; b: report of the resulting reflections (thick lines) on the interpreted line-drawing stacked section from fig. 6-3a.
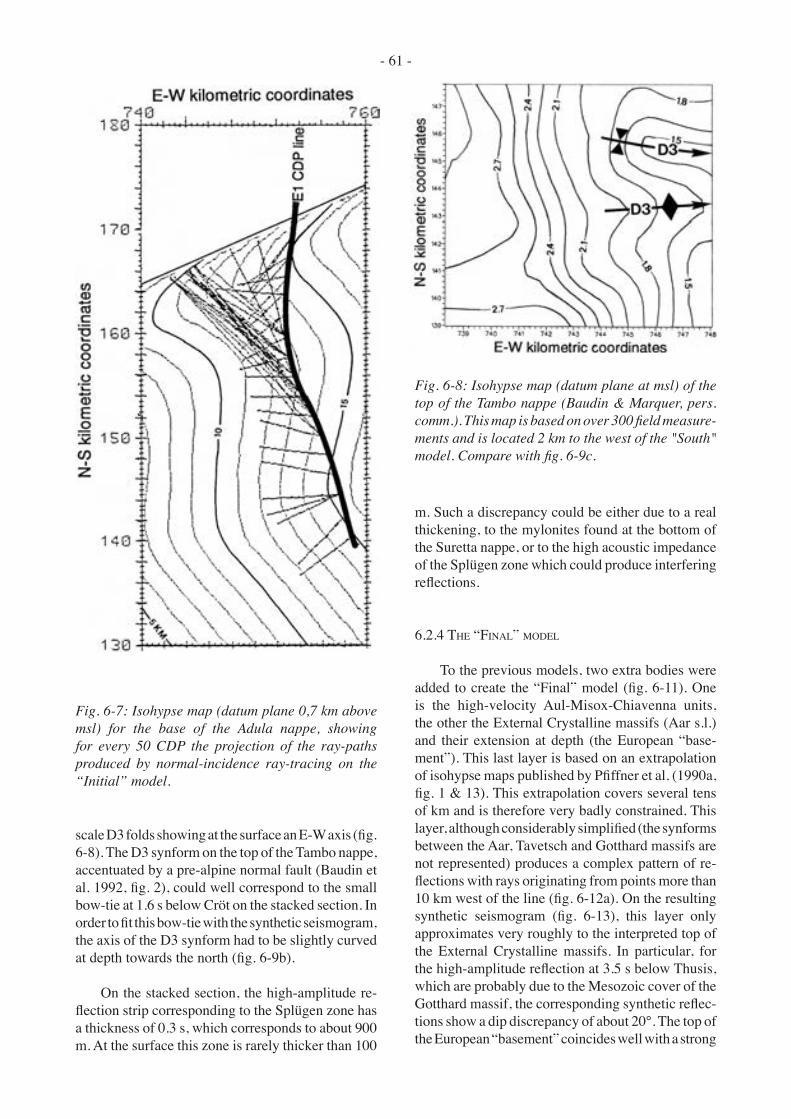
- 61 -
scale D3 folds showing at the surface an E-W axis (fig. 6-8). The D3 synform on the top of the Tambo nappe, accentuated by a pre-alpine normal fault (Baudin et al. 1992, fig. 2), could well correspond to the small bow-tie at 1.6 s below Cröt on the stacked section. In order to fit this bow-tie with the synthetic seismogram, the axis of the D3 synform had to be slightly curved at depth towards the north (fig. 6-9b).
On the stacked section, the high-amplitude re-flection strip corresponding to the Splügen zone has a thickness of 0.3 s, which corresponds to about 900 m. At the surface this zone is rarely thicker than 100
m. Such a discrepancy could be either due to a real thickening, to the mylonites found at the bottom of the Suretta nappe, or to the high acoustic impedance of the Splügen zone which could produce interfering reflections.
6.2.4 THE “FINAL” MODEL
To the previous models, two extra bodies were added to create the “Final” model (fig. 6-11). One is the high-velocity Aul-Misox-Chiavenna units, the other the External Crystalline massifs (Aar s.l.) and their extension at depth (the European “base-ment”). This last layer is based on an extrapolation of isohypse maps published by Pfiffner et al. (1990a, fig. 1 & 13). This extrapolation covers several tens of km and is therefore very badly constrained. This layer, although considerably simplified (the synforms between the Aar, Tavetsch and Gotthard massifs are not represented) produces a complex pattern of re-flections with rays originating from points more than 10 km west of the line (fig. 6-12a). On the resulting synthetic seismogram (fig. 6-13), this layer only approximates very roughly to the interpreted top of the External Crystalline massifs. In particular, for the high-amplitude reflection at 3.5 s below Thusis, which are probably due to the Mesozoic cover of the Gotthard massif, the corresponding synthetic reflec-tions show a dip discrepancy of about 20°. The top of the European “basement” coincides well with a strong
Fig. 6-7: Isohypse map (datum plane 0,7 km above msl) for the base of the Adula nappe, showing for every 50 CDP the projection of the ray-paths produced by normal-incidence ray-tracing on the “Initial” model.
Fig. 6-8: Isohypse map (datum plane at msl) of the top of the Tambo nappe (Baudin & Marquer, pers. comm.). This map is based on over 300 field measure-ments and is located 2 km to the west of the "South" model. Compare with fig. 6-9c.

- 62 -
Fig.
6-9
: Iso
hyps
e map
s (da
tum
pla
ne 0
,7 km
abo
ve m
sl) o
f the
“So
uth”
mod
el, s
how
ing
for e
very
10
CD
P th
e pro
ject
ion
of th
e ray
-pat
hs p
rodu
ced
by n
orm
al-in
cide
nce
ray-
trac
ing.
a: b
ase
of th
e Su
retta
nap
pe; b
: top
of t
he T
ambo
nap
pe; c
: bas
e of
the
Tam
bo n
appe
.

- 63 -
reflection strip at a depth of around 7 s. However, this strip could in fact correspond to the top of one or two extra nappes unknown at the surface (see § 7.6).
The top of the Aul unit was made to match the
top of the high-amplitude reflectors found around 1.2 s between Canova and Zillis, which are probably due to marble and ophiolitic slivers in contact with Bündnerschiefer. The front of the Adula nappe was extended further to the north than on the “Initial”
Fig. 6-10: Results of normal-incidence ray-tracing on the “South” model. a: constant amplitude spike seismo-gram; b: report of the resulting reflections (thick lines) on the Vibroseis stacked section.

- 64 -
model, producing again a complex reflection pattern (fig. 6-12b). This solution seems to match better with the sub-horizontal reflectors at 2.0 s below the CDP 1500, probably corresponding to the top of the Adula nappe. This layer at its southern end is shallower than on the “Initial” model, so that it matches the strong north-dipping reflector found under Sovrana at about 3 s. One second above, a larger strip of high-amplitude reflectors is interpreted as being due to the Chiavenna ophiolites and the transparent zone below to the Mt. Gruf (?) unit.
6.3 2-D models
6.3.1 THE FRONT OF THE TAMBO NAPPE
On the “Final” model, the top part of the front of the Tambo nappe was made to match a high-amplitude reflector at 1.4 s below the CDP 1930. As this reflec-tor has a slightly northward dip, the top of the Tambo nappe had a pinched-out shape, thus showing quite different geometry than at the surface. Furthermore the Schams nappes in front of the Tambo nappe are
Fig. 6-11: Cross-sections through the “Final” model.

- 65 -
Fig. 6-12: Isohypse maps from the “Final” model (datum plane 0,7 km above msl), showing for every 10 CDP the projection of the ray-paths produced by normal-incidence ray-tracing. a: the top of European “basement”; b: the base of the Adula nappe.

- 66 -
Fig. 6-13: Results of normal-incidence ray-tracing on the “Final” model. a: convolved synthetic seismogram; b: report of the resulting reflections (thick lines) on the Vibroseis stacked section.

- 67 -
not represented on the “Final” model. In order to get a better understanding of the reflection patterns which would be produced by such complex geology a 2-D model was built. This model is based on a cross-section passing through the front of the Tambo nappe (fig. 6-14). The layers most likely to produce strong reflections were introduced in the model. The cross-section was cylindrically projected along the trend defined by the “Final” 3-D model, under the E1 seismic line.
Fig. 6-14b shows the 2-D model with normal-incidence ray-tracing carried out on the bottom of the Tambo nappe, which is locally too steep to produce any reflections. The resulting synthetic seismogram (fig. 6-15) reveals several diffraction-like patterns due to the folding of the Schams nappes. These correlate with the reflections found on the stacked section at 1.3 and 1.6 seconds under Ausserferrera. Some other strong reflectors at 2.2 s below the CDP 1950 could be due to another fold of the Schams nappes (Baudin, pers. comm.) not represented on this model. The top part of the front of the Tambo nappe yields a reflec-tion which coincides with a high-amplitude reflection at 0.9 s below Ausserferrera and not with the one at 1.4 s as supposed for the “Final” model. The shape of the front of Tambo was thus corrected for the 3-D model published by Litak et al. (1993).
6.3.2 THE “CHIAVENNA” 2-D GRAVITY MODEL
On the basis of the seismic data, it is not pos-sible to solve the problem of the thickness of the
Chiavenna ophiolites which could be either “thin” (about 1 km, as on the “final” model) or “thick” (about 3 km, as in fig. 4b from Pfiffner et al. 1990b). Gravity modelling is likely to solve such a problem and all the more when the geometry of the model is constrained by two possible seismic interpretations. Therefore a 2-D gravity model was built along the E-W Swiss kilometric coordinate 755 which more or less coincides with the E1 seismic line.
On the basis of the Bouguer anomaly map of Switzerland (Klingelé & Olivier 1979), a regional anomaly map was determined for a region of 50 km around the gravity model. The Bouguer and regional anomaly along the profile are represented in fig. 6-16 and their differences reveal positive anomalies above the Aul-Tomül and Chiavenna ophiolites and a nega-tive anomaly above the Tertiary granitoid intrusions. But for these lithologies, all the rocks of this region have a very similar density, averaging around 2.70 g/cm3 (Sellami et al. 1990). Therefore a density con-trast of 0.3 g/cm3 for the ophiolites and -0.05 g/cm3 for the granites was introduced in the models.
A “best fit” model (fig. 6-17c) was first determined which gives a rough estimate of the volume of the Aul-Tomül ophiolites and of the Tertiary granitoid. A precise estimate of the latter is gravimetrically dif-ficult as the corresponding negative residual anomaly is partly influenced by the Quaternary infill of the Mera valley. In a next step, the residual anomaly with a thick Chiavenna body was calculated keeping the same volume for the Aul-Tomül ophiolites and the Tertiary intrusions as in the “best fit” model.
Fig. 6-14: a: Cross-section through the front of the Tambo nappe (from Pfiffner et al. 1990a, fig. 10). Thick lines represent the layers used in the 2-D model. b: the 2-D model of the front of Tambo nappe with ray-tracing on the base of this nappe.
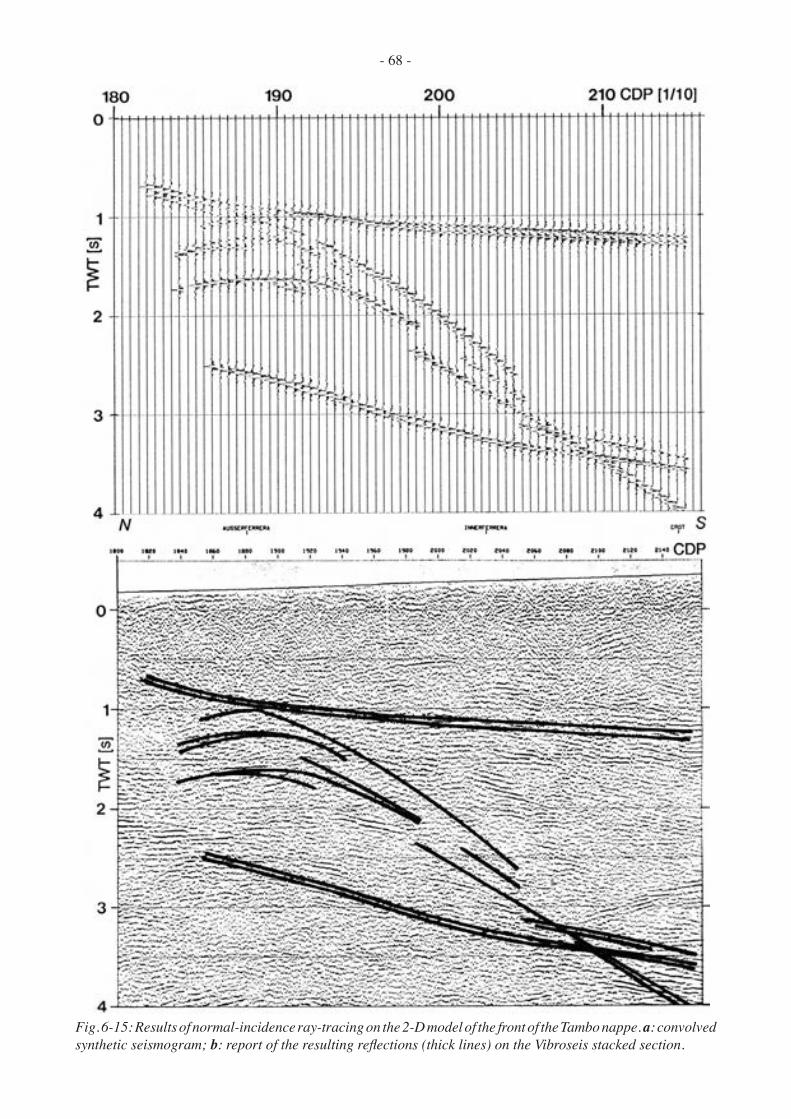
- 68 -
Fig. 6-15: Results of normal-incidence ray-tracing on the 2-D model of the front of the Tambo nappe. a: convolved synthetic seismogram; b: report of the resulting reflections (thick lines) on the Vibroseis stacked section.
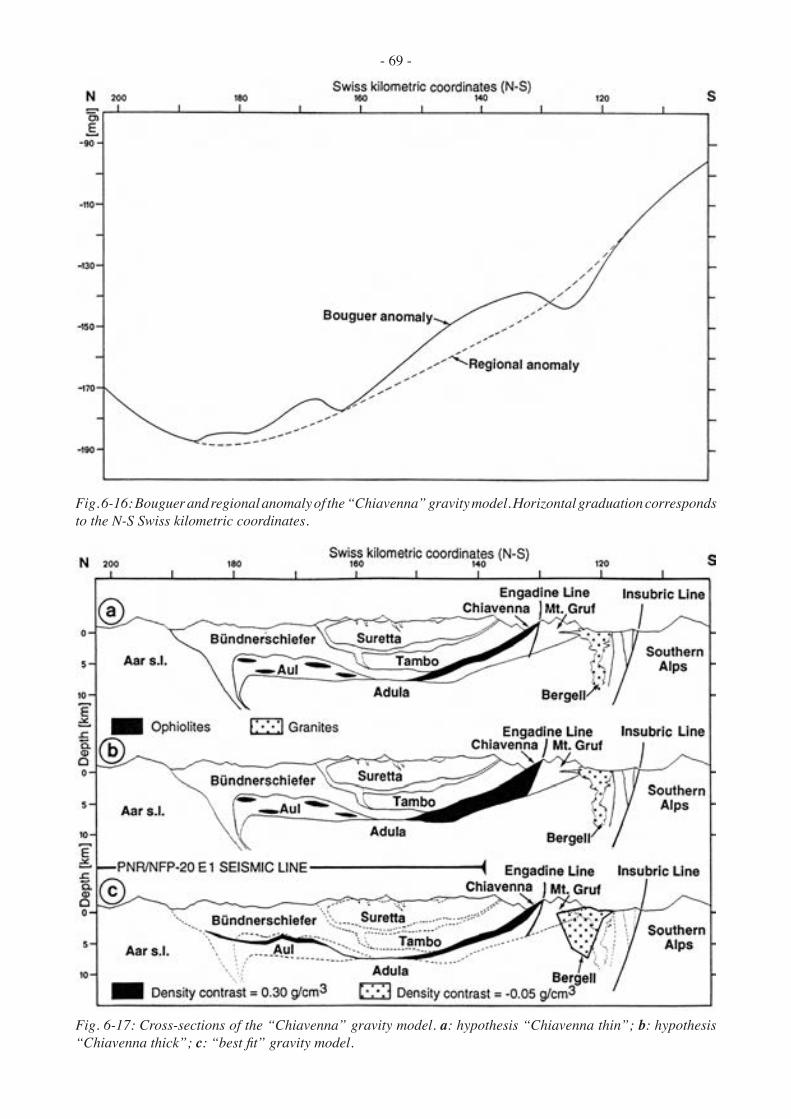
- 69 -
Fig. 6-16: Bouguer and regional anomaly of the “Chiavenna” gravity model. Horizontal graduation corresponds to the N-S Swiss kilometric coordinates.
Fig. 6-17: Cross-sections of the “Chiavenna” gravity model. a: hypothesis “Chiavenna thin”; b: hypothesis “Chiavenna thick”; c: “best fit” gravity model.
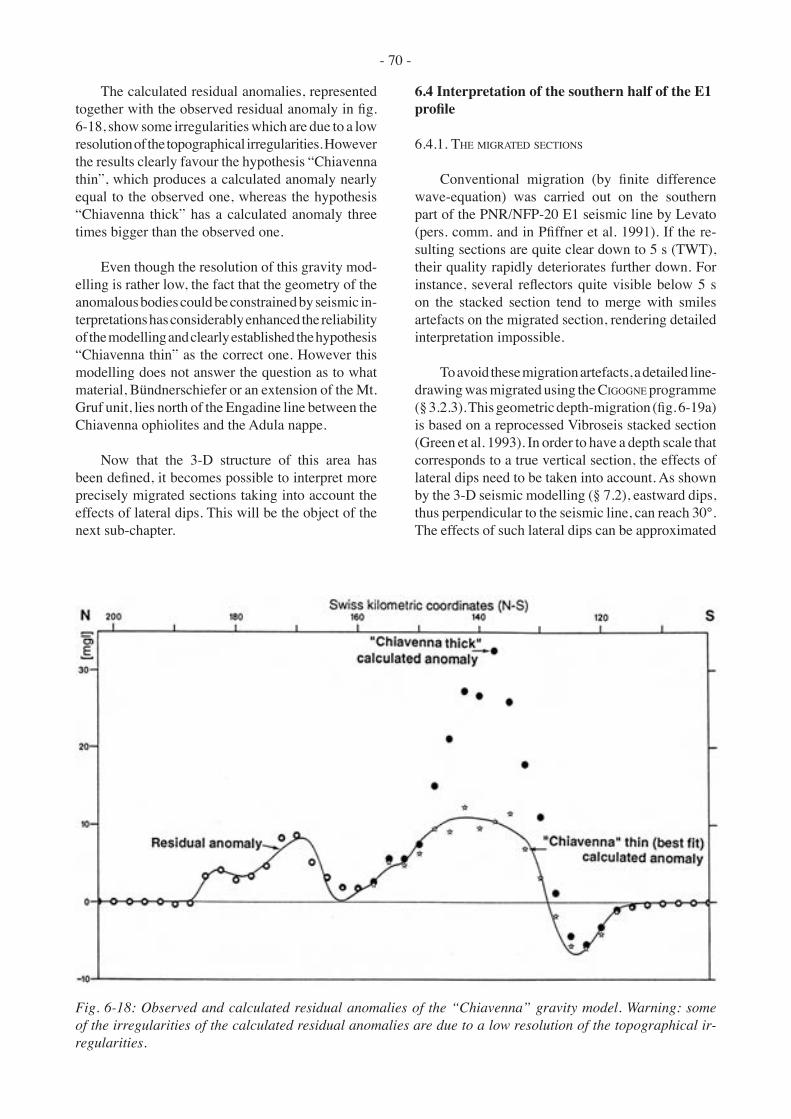
- 70 -
The calculated residual anomalies, represented together with the observed residual anomaly in fig. 6-18, show some irregularities which are due to a low resolution of the topographical irregularities. However the results clearly favour the hypothesis “Chiavenna thin”, which produces a calculated anomaly nearly equal to the observed one, whereas the hypothesis “Chiavenna thick” has a calculated anomaly three times bigger than the observed one.
Even though the resolution of this gravity mod-elling is rather low, the fact that the geometry of the anomalous bodies could be constrained by seismic in-terpretations has considerably enhanced the reliability of the modelling and clearly established the hypothesis “Chiavenna thin” as the correct one. However this modelling does not answer the question as to what material, Bündnerschiefer or an extension of the Mt. Gruf unit, lies north of the Engadine line between the Chiavenna ophiolites and the Adula nappe.
Now that the 3-D structure of this area has been defined, it becomes possible to interpret more precisely migrated sections taking into account the effects of lateral dips. This will be the object of the next sub-chapter.
6.4 Interpretation of the southern half of the E1 profile
6.4.1. THE MIGRATED SECTIONS
Conventional migration (by finite difference wave-equation) was carried out on the southern part of the PNR/NFP-20 E1 seismic line by Levato (pers. comm. and in Pfiffner et al. 1991). If the re-sulting sections are quite clear down to 5 s (TWT), their quality rapidly deteriorates further down. For instance, several reflectors quite visible below 5 s on the stacked section tend to merge with smiles artefacts on the migrated section, rendering detailed interpretation impossible.
To avoid these migration artefacts, a detailed line-drawing was migrated using the CIGOGNE programme (§ 3.2.3). This geometric depth-migration (fig. 6-19a) is based on a reprocessed Vibroseis stacked section (Green et al. 1993). In order to have a depth scale that corresponds to a true vertical section, the effects of lateral dips need to be taken into account. As shown by the 3-D seismic modelling (§ 7.2), eastward dips, thus perpendicular to the seismic line, can reach 30°. The effects of such lateral dips can be approximated
Fig. 6-18: Observed and calculated residual anomalies of the “Chiavenna” gravity model. Warning: some of the irregularities of the calculated residual anomalies are due to a low resolution of the topographical ir-regularities.
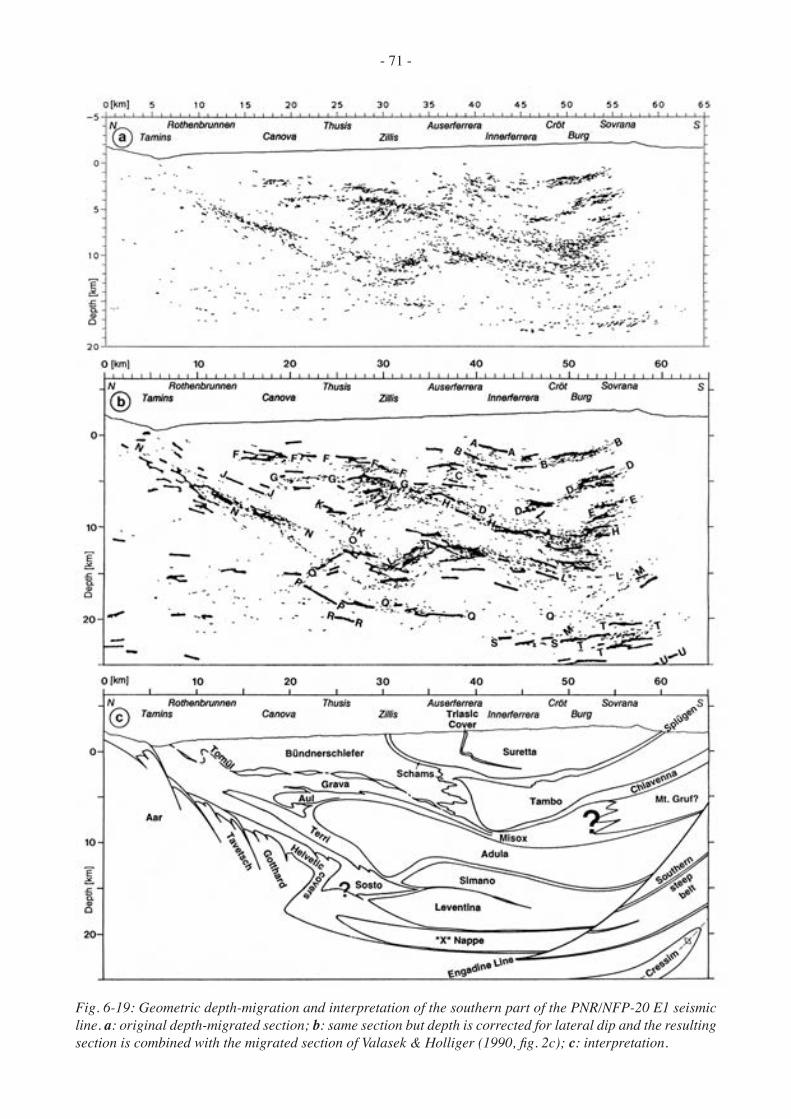
- 71 -
Fig. 6-19: Geometric depth-migration and interpretation of the southern part of the PNR/NFP-20 E1 seismic line. a: original depth-migrated section; b: same section but depth is corrected for lateral dip and the resulting section is combined with the migrated section of Valasek & Holliger (1990, fig. 2c); c: interpretation.
- 72 -
by increasing the depth scale of the original migrated section by 15% (see equation of § 5.2.1). This was done for fig. 6-19b and the resulting section was then combined with a line-drawing migration from Valasek & Holliger (1990, fig. 2c) carried out on a single fold dynamite stacked section. Because their migration velocities are too high near the surface (6.1 km/s), their vertical scale coincides quite well with the stretched scale of fig. 6-19b, as shown by the good match between both sections. The combined section (fig. 6-19b) outlines the high-amplitude reflections with the thick lines from the dynamite migrated section.
6.4.2 INTERPRETATION
The interpretation of fig. 6-19c is not fundamen-tally different from previous ones (for references, see § 6.1.1). Therefore only the major differences will be discussed here. On most interpretations, such as from Pfiffner et al. (1990b, fig. 6), the Engadine line is usually shown to stop at a depth of less than 5 km. At the surface, this Late Oligocene to Early Miocene sinistral strike-slip fault extends over a length of a 100 km. Close to the E1 seismic line, it shows a 7-km apparent uplift of its southern block. An accident as important as this certainly reaches considerable depths and could be related to a strip of steeply north-dipping reflectors (M in fig. 6-19b) found at depths of 15 to 22 km below Sovrana. If this is the case, it then becomes awkward to correlate reflectors on both sides of this fault, i.e. the reflectors due to the Lower Penninic nappes (L, Q & S) with those of the Southern Steep belt (T & U).
The 1-km-thick reflections at 5 km below Sovrana (D) are due to the Chiavenna ophiolites, as demon-strated by gravity modelling (§ 7.3.2). Below the same locality, the strong reflections at 10 km (H) can be related to the top of the Adula nappe, as shown by 3-D seismic modelling (§ 6.2). In between these two units a 5-km-thick zone appears nearly transparent but for a couple of high-amplitude reflectors (E). Two types of lithologies are likely to produce such a seismic facies: either Bündnerschiefer with marble or ophiolitic slivers or a basement nappe with its metamorphic cover. The interpretation of fig 6-19c suggests a thickening of the Misox Bündnerschiefer relayed further south by the refolded front of a base-ment nappe, possibly the Mt. Gruf unit.
Several short reflectors between 3 and 6 km below Ausserferrera (C) have opposite dips and they produce an overall seismic pattern which imitates well
the structures of the Areua and Vigogne slices (part of the Schams nappes) such as described by Baudin et al. (1992, fig. 2). There is also a good correspondence of the two high-amplitude reflection strips, found at depths around 3 and 5 km between Canova and Zillis (F & G), with the ophiolitic and marble slivers belong-ing to the Aul and Tomül units, such as illustrated in a cross-section from Nabholz (1945).
Below Tamins, the top of the Aar massif is badly imaged on the seismic sections, probably due to steep and complex structures. Further south, below Rothenbrunnen and Canova a strip of high-amplitude south-dipping reflectors (N) can be related to the sedi-mentary covers of the Tavetsch and Gotthard massifs. A few kilometres further to the south, a similar strip of reflections shows a strong northern dip between 11 and 17 km below Thusis (O). These north-dipping reflectors, imaged both on the Vibroseis and dynamite sections, are clearly distinct from the north-dipping reflectors related to the front of the Simano nappe, which are situated 10 km further to the south (L). The north-dipping O reflectors, if they are relayed by the south-dipping P reflectors, suggest the possibility of a backfold affecting the External Crystalline massifs. Such a feature is quite likely as 50 km to the west in the Bedretto valley, where the deepest structural level of the Gotthard massif is exposed, this massif is backfolded (e.g. Probst 1980). On the basis of the seismic sections, this backfold is much smaller than the one affecting the External Crystalline massifs along the Western traverse (see § 5.2).
A rather transparent zone appears between the high-amplitude L reflectors, which underline the bottom of the Adula nappe, and the sub-horizontal Q reflectors. This transparent zone corresponds well with the Simano-Lucomagno-Leventina nappe complex. At 15 km below Zillis a strong sub-horizontal reflector can be related to the syncline separating the fronts of the Lucomagno and Simano nappes. Two possibilities are offered to extend the top of External Crystalline massifs at depth. After following the reflectors N, O & P, this surface could either continue through the reflectors Q or through the reflectors R & S. In the latter case, this supposes the presence of an extra basement nappe unknown at the surface (called “X” nappe in fig. 6-19c). Such an interpretation is cor-roborated by the PNR/NFP-20 S1 seismic line. This deep seismic profile was shot on the Adula nappe and its interpretation (Bernoulli et al. 1990) shows the possibility of one or two extra basement nappes underlying the Simano-Leventina nappe (which in fact could also be structures related to backfolds; see § 7.5.2).
- 73 -
6.5 Discussion
3-D modelling benefited here from a rather ex-ceptional environment where it is possible to project surface geology at considerable depths. In this area of complex structural geology, seismic modelling was of great help in solving several interpretation problems. In particular 3-D modelling proved to be the only method of precisely determining real depths when different lateral dips affect the region surveyed by the seismic line, producing reflections from points situated over 10 km away from the line.
Gravity modelling, when constrained by seismic interpretations, also becomes a powerful tool. Here it was able to resolve a problem (the thickness of the Chiavenna ophiolites) where both seismic data and surface geology were unable to provide an answer.
At the time most of this modelling was carried out, no migrated section was available and therefore interpretations were based only on stacked sections. If one compares the overall geometry of the seismic model with its synthetic seismogram, the differences can be quite substantial. This underlines the danger of interpreting stacked sections in areas of complex geology.
On the basis of the data actually available, more refined modelling or more detailed interpretations of the nappe system of this area are beyond the resolu-tion of the seismic data. However some interpretation problems, such as the extension of Mt. Gruf unit, could be solved once the deep seismic line shot by the CROP research group in the San Giacomo valley is properly processed.
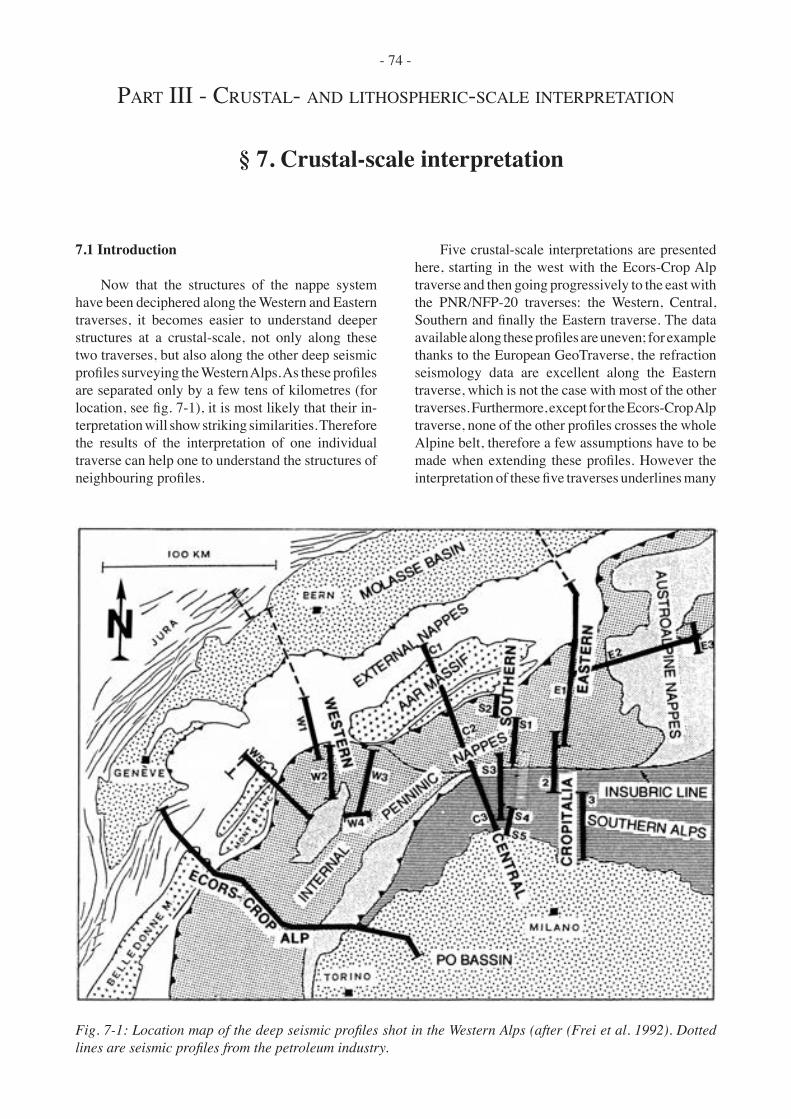
- 74 -
7.1 Introduction
Now that the structures of the nappe system have been deciphered along the Western and Eastern traverses, it becomes easier to understand deeper structures at a crustal-scale, not only along these two traverses, but also along the other deep seismic profiles surveying the Western Alps. As these profiles are separated only by a few tens of kilometres (for location, see fig. 7-1), it is most likely that their in-terpretation will show striking similarities. Therefore the results of the interpretation of one individual traverse can help one to understand the structures of neighbouring profiles.
Five crustal-scale interpretations are presented here, starting in the west with the Ecors-Crop Alp traverse and then going progressively to the east with the PNR/NFP-20 traverses: the Western, Central, Southern and finally the Eastern traverse. The data available along these profiles are uneven; for example thanks to the European GeoTraverse, the refraction seismology data are excellent along the Eastern traverse, which is not the case with most of the other traverses. Furthermore, except for the Ecors-Crop Alp traverse, none of the other profiles crosses the whole Alpine belt, therefore a few assumptions have to be made when extending these profiles. However the interpretation of these five traverses underlines many
§ 7. Crustal-scale interpretation
PART III - CRUSTAL- AND LITHOSPHERIC-SCALE INTERPRETATION
Fig. 7-1: Location map of the deep seismic profiles shot in the Western Alps (after (Frei et al. 1992). Dotted lines are seismic profiles from the petroleum industry.

- 75 -
similarities but also some major differences which appear progressively along the Alpine strike. These differences can be explained within the context of the geodynamic evolution of the Western Alps (see next two chapters).
7.2 The Ecors-Crop Alp traverse
7.2.1 INTRODUCTION
The Ecors-Crop Alp deep seismic traverse, shot in 1986 and 1987 (Bayer et al. 1987), starts in the Bresse graben and finishes in the Po plain (for location, see fig. 7-2 & 7-3). It has the advantage of being a continuous profile made up of 6 individual near-vertical-reflection seismic lines (Damotte et al. 1990) completed by a wide-angle reflection seismic survey (ECORS-CROP Deep Seismic Sounding Group 1989a & 1989b; Thouvenot et al. 1990). Unfortunately part of this wide-angle survey is lo-cated 50 km south of the deep seismic profile (fig. 7-4a) and as these data were recorded using a fan layout, depths and velocities cannot be determined accurately. However this survey clearly images an east-dipping European Moho, which reaches a depth of 50 km below the Penninic thrust (fig. 7-4b). A high-velocity body is found at mid-crustal level in the Penninic domain (the “Briançonnais” reflector) and another sharp velocity discontinuity at 15 km below the Sesia zone (the “Sesia-Lanzo” reflector). The Adriatic Moho in fig. 7-4b shows a staircase-like structure, but if migrated (Sénéchal 1989) it shows a more regular shape corresponding to an upwards flexure, which well matches the Moho reflections of the near-vertical migrated section (fig. 7-5).
This geometric depth-migrated section processed by Sénéchal and Thouvenot (1991) is probably the best migration performed on the Ecors-Crop Alp traverse. In fig. (7-5) it has been completed by projecting the migration of the wide-angle data (Thouvenot et al. 1990; Sénéchal 1991). This section along the exter-nal Alps shows good reflectivity in its upper part, a rather transparent upper-crust and a highly reflective lower-crust. In the Penninic domain, the upper half of the crust is highly reflective down to the depth corresponding to the wide-angle “Briançonnais” reflector, which according to the ECORS-CROP Deep Seismic Sounding Group (1989b) could act as a mask preventing the seismic energy from penetrat-ing deeper. The Austroalpine domain is transparent down to the “Sesia-Lanzo” reflector, which is not surprising as the Austroalpine units at the surface are sub-vertical in this area. East of the Insubric line,
the Adriatic crust generally shows good reflectivity. Additional seismic information can also be gained by consulting the coherency-weighted migrated section of Mugnier & Marthelot (1991).
Up to now over a dozen different interpretations have been published (Bayer et al. 1987; Butler 1990a; Guellec et al. 1989, 1990a & 1990b; Mugnier et al. 1989 & 1990; Mugnier & Marthelot 1991; Roure et al. 1989, 1990a & 1990b; Bois & Ecors scientific party 1990; Nicolas et al. 1990a & 1990b; Polino et al. 1990; Tardy et al. 1990; Ricou & Dauteuil 1991). Some of these interpretations, in particular in the Penninic domain, are so different that one wonders if they correspond to the same mountain belt. This is partly due to the fact that most of these interpreta-tions were established before any good migration was carried out.
Fig. 7-2: Structural map of the external Alps in the area surveyed by the Ecors-Crop Alp traverse (after Guellec et al. 1990b). 1: Mesozoic formations of the Jura mountains and the Molasse basin; 2: Cenozoic molasse; 3: Presubalpine units; 4: basement; 5-7: Charvin-Dent de Cons unit; 8: Mont Joly-Aiguille Croche units; 9a: Prealps klippen; 9b: Ultra-Helvetic (?) units; 10: Penninic units; 11: Ecors seismic line; 12: Fault; 13: Thrust; 14: Boreholes (Bzl: Brizon borehole; F: Faucigny borehole; H: Humily borehole; Slv: Salève boreholes).

- 76 -
7.2.2 INTERPRETATION
The interpretation of the Ecors-Crop Alp traverse (fig. 7-6) presented here ranges from the Molasse basin to the Po plain. In the External Alps, this interpreta-tion differs from previous ones (Guellec et al. 1989, 1990a & 1990b; Mugnier et al. 1989 & 1990) mainly by a more pronounced allochthony of the Bornes and Aravis nappes. Epard (1990) has shown that these nappes are equivalents of the Morcles nappe and that they find their homeland on the Internal Belledonne massif and not on the External Belledonne massif. Another difference with Roure et al. (1989) and Mugnier et al. (1990) is that the Roselend nappe is not regarded as Ultra-Helvetic (as indicated on some tectonic maps) but as an equivalent of the Wildhorn nappe s.l. (Epard pers. comm.), which should find its homeland at depth further towards the east. The paleogeographic situation of the Wildhorn rim-basin north of the European margin shoulder (Stampfli 1993)
implies the subduction of the whole European margin s.str. (at least 100 km of thinned crust).
The Internal Alps along this traverse do not lend themselves to detailed interpretation, as shown by the extremely varied interpretations published up to now. Probably the main reason for this is the difficulty in projecting surface geology at depths greater than 5 km. This is due, in part, to the shallow valleys and the relatively weak axial dips when compared with the Central Alps. Therefore the interpretation of fig. 7-6 is partly based on a comparison with the structures observed along the Swiss Western traverse, located 50 km to the NE, in an area where the control from surface geology is much better. The interpretation of the Western traverse (Du Bois et al. 1990b; Marchant et al. 1993) has underlined the importance of back-folding, not only for the Southern Steep belt but also for the External Crystalline massifs. Geochronologi-cal data (Hunziker et al. 1993) clearly show that the
Fig. 7-3: Structural map of the internal Alps in the area surveyed by the Ecors-Crop Alp traverse (after Tardy et al. 1990). 1: external basement massifs; 2: Dauphinois-Helvetic sedimentary cover; 3: Ultra-Helvetic (?) units; 4: Brèches de Tarentaise nappe; 5: Subbriançonnais zone and Petit Saint-Bernard unit; 6: zone Houillère; 7: internal Briançonnais units; 8: internal basement massifs; 9: sedimentary cover of the internal basement massifs; 10: ophiolites and Lanzo body; 11: “Schistes lustrés”; 12: southern Alpine realm. The grey domain corresponds to the HP metamorphosed Alpine units.
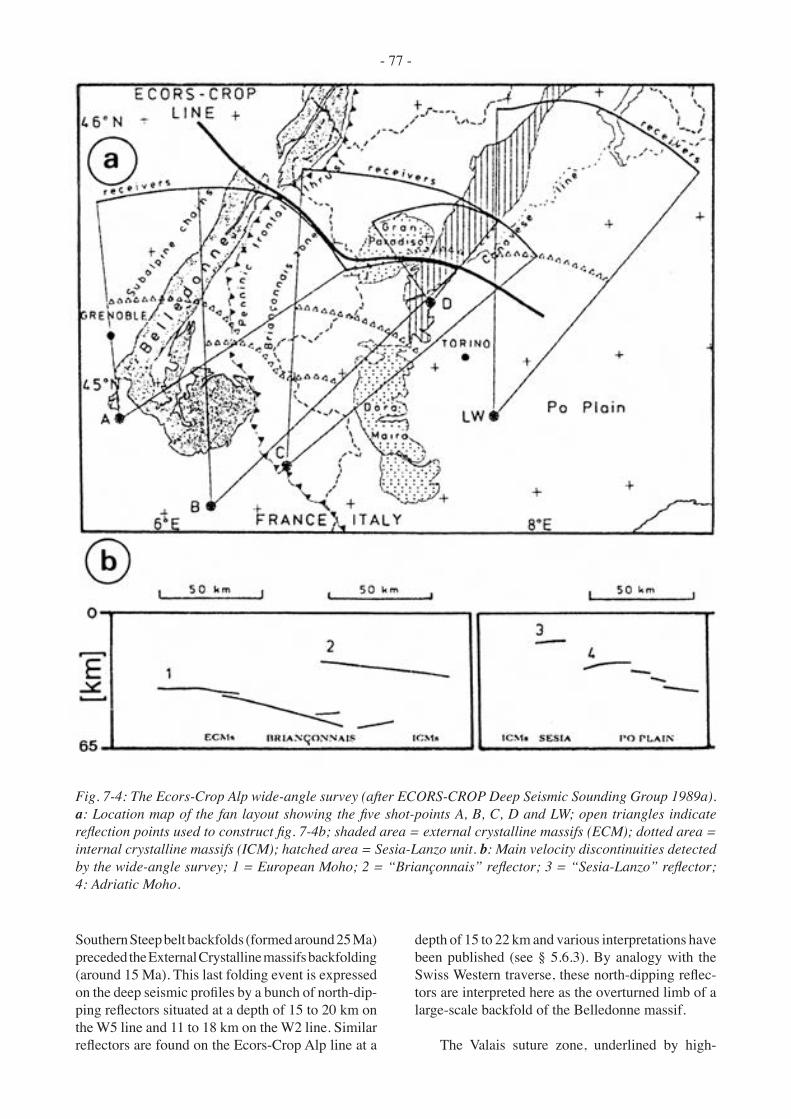
- 77 -
Southern Steep belt backfolds (formed around 25 Ma) preceded the External Crystalline massifs backfolding (around 15 Ma). This last folding event is expressed on the deep seismic profiles by a bunch of north-dip-ping reflectors situated at a depth of 15 to 20 km on the W5 line and 11 to 18 km on the W2 line. Similar reflectors are found on the Ecors-Crop Alp line at a
depth of 15 to 22 km and various interpretations have been published (see § 5.6.3). By analogy with the Swiss Western traverse, these north-dipping reflec-tors are interpreted here as the overturned limb of a large-scale backfold of the Belledonne massif.
The Valais suture zone, underlined by high-
Fig. 7-4: The Ecors-Crop Alp wide-angle survey (after ECORS-CROP Deep Seismic Sounding Group 1989a). a: Location map of the fan layout showing the five shot-points A, B, C, D and LW; open triangles indicate reflection points used to construct fig. 7-4b; shaded area = external crystalline massifs (ECM); dotted area = internal crystalline massifs (ICM); hatched area = Sesia-Lanzo unit. b: Main velocity discontinuities detected by the wide-angle survey; 1 = European Moho; 2 = “Briançonnais” reflector; 3 = “Sesia-Lanzo” reflector; 4: Adriatic Moho.

- 78 -
amplitude reflectors due contrasting lithologies, can easily be followed from the surface down to a depth of about 15 km under Val d’Isère. In that area many superposed reflectors show opposite dips. This can be caused by 3-D effects due to a change of 60° in the orientation of the seismic line (see fig. 7-6). From there on, this strong-reflectivity strip continues nearly horizontally to the east up to under Noasca, where it becomes more transparent, suggesting the presence of basement units, which could belong to the European margin. These units, as well as those situated above them, are affected by the large-scale backfold system of the Southern Steep belt.
The Briançonnais and Piemont units are nearly impossible to project at depths greater than a few kilo-metres (Deville 1990; Deville et al. 1992), therefore the extrapolation presented here is badly constrained. This extrapolation was guided by analogies with the interpretation of the PNR/NFP-20 Western profiles and also tried to attribute the strong reflections either to ophiolitic slivers or marble/crystalline contacts (which can also yield high-amplitude reflections) and the transparent areas to basement nappes.
At a depth of 15 km under the Sesia zone, a very strong 15 km long reflector appears nearly horizontal at the same location as the “Sesia-Lanzo” reflector detected by the wide-angle shot D (fig. 7-4b). Such a high-amplitude reflector could well be caused by the contact between the Sesia zone and the Lanzo lher-zolites. This intensively refolded contact outcrops 20 km south of the seismic line and shows a northward dip (Spalla et al. 1983). Being of the same lithology as the Ivrea mantle body (a part of the Adriatic up-per-mantle), the Lanzo lherzolites and serpentinites will not produce any significant reflectivity along the Insubric line. Nearly vertical at the surface, the Insubric line at depth could dip either towards the east or the west (Tardy et al. 1990). All the other deep seismic lines crossing the Insubric line have shown that this accident has a listric shape dipping towards the N or NW and flattening out at a depth of 30 to 40 km. Therefore this accident is prolonged here towards the west down to a depth of 30 km where one finds a few west-dipping reflectors truncated by the strong reflections associated with the top of a high-velocity body (called “mantle slice” in fig. 7-6). The presence of this high-velocity and dense body, detected by the wide-angle survey (ECORS-CROP Deep Seismic Sounding Group 1989b), is also implied by gravity data (Bayer et al. 1987). Although its velocity and density cannot be determined precisely, it corresponds most probably to a sliver of upper-mantle (Nicolas et al. 1990a).
As mentioned in § 7.2.1, this mantle slice could act as a mask preventing the seismic energy from penetrating deeper, which could be a good explanation for the absence in fig. 7-5 of any significant reflection below a depth of 30 km under the Penninic domain. Nevertheless the coherency-weighted migration of Mugnier and Marthelot (1991) in this area shows a few slightly-east-dipping reflectors, more or less parallel to the trend of the European Moho. These reflectors are interpreted here (fig. 7-6) partly as produced by the European lower-crust and partly as due to the Alpine Root zone (the crustal material subducted during the continental collision). This material therefore cor-responds to European upper-crust, to the Briançon-nais and Austroalpine terrains and to the Valais and Piemont suture zones. The Alpine Root zone is thus in an overturned position above the “mantle slice” and then refolded back into a normal position below, similar to the crustal-scale interpretation of the Swiss Western traverse by Marchant et al. (1993).
On the eastern side of the Insubric line, the Adri-atic Moho is clearly defined both on the vertical and wide-angle migrated sections (fig. 7-5). From a depth of around 30 km at the end of the line, the Adriatic Moho bends upwards up to a depth of about 20 km near the Insubric line. From there onwards the Moho discontinuity is segmented by a series of west-dip-ping inverse faults, showing an asymmetric flower structure. The Adriatic upper-mantle even reaches the surface, as witnessed by the peridotitic outcrops near Castelmonte. This structure of the Adriatic plate is most important because it clearly shows that the top of the Ivrea mantle body corresponds to the Adriatic Moho, a feature that previously was not clearly es-tablished on the basis of gravity and refraction data (Kissling 1984).
A detailed interpretation of the Po plain part of the Ecors-Crop Alp line is published by Roure et al. (1990b) on the basis of a migrated section on which unfortunately the Adriatic Moho is hardly visible. Down to a depth of 10 km the interpretation shown here (fig. 7-6) is very similar to theirs, with a rather transparent Plio-Quaternary sequence overlying the Messinian erosional event underlined by a strong reflection. Under this one finds relatively undeformed Burdigalian to Tortonian deposits yielding well strati-fied reflectors. Near the eastern end of the section, the contact between the Burdigalian unconformity and the Oligo-Aquitanian Gonfolitic Group can be calibrated by exploration wells (Roure et al. 1990b). The Mesozoic and Paleogene sediments, whose thick-ness varies between 0 and nearly 5 km (Roure et al. 1990b), could correspond to the stratified reflectors


- 79 -
found at a depth of 7 to 10 km near the end of the line. They overlie a rather thick transparent zone which becomes suddenly highly reflective at a depth between 12 and 17 km. Roure et al. (1990b) have interpreted these as Mesozoic sediments, implying a reduction of the Adriatic crust to a thickness of just a few kilometres, which is most unlikely. Therefore these reflectors are related here to the transition from the Adriatic upper- to the lower-crust.
7.3. The PNR/NFP-20 Western traverse
7.3.1 INTRODUCTION
This traverse is composed of 5 individual lines (W1-W5) scattered in an area covering the Prealps to the Insubric line (for location, see fig. 7-1 and 5-1). They do not form a continuous line but rather a pseudo-3D survey with intersecting profiles, which has the advantage of constraining the interpretation. On the other hand this traverse has two disadvantages: it does not image the southern side of the Insubric line and it is poorly constrained by refraction data. In the External Alps, the Western traverse intersects the two longitudinal refraction profiles ALP87 and ALP75 (see fig. 1-1). In the Internal Alps, the traverse runs in parallel to the Brig-Sesto refraction line (Ansorge et al. 1979), situated 40 km to the NE of the deep seismic profiles. This refraction model (fig. 7-7) is rather old and would need to be reinterpreted taking into account possible 3-D effects. However it shows a high-velocity body at 29-37 km below the Monte Rosa nappe and some curious velocities for the Ivrea mantle body (5 km/s), which might be due to serpentinization (see § 4.3.4).
The seismic sections of the Western traverse shown here are a combination of Vibroseis and dy-namite sections, depth-migrated with the CIGOGNE program (see § 3.2.3). The Vibroseis stacked sections were processed by the GRANSIR Group (Du Bois et al. 1990a &. 1990b; Marchant et al. 1993) and the dyna-mite stacked sections by Valasek (1992). Some slight discrepancies occur between both data sets, which are due to the fact that the dynamite CDP line does not always follow the Vibroseis CDP line exactly.
First the general concept of the deep structures along the Western traverse will be explained, after which, a crustal-scale interpretation of the individual profiles is presented. For these, the effects of lateral dips have been taken into account, so these inter-pretations correspond to true vertical cross-sections and therefore some features have a slightly different position on the seismic sections. Finally a synthetic cross-section illustrates the deep structures of the Western traverse along a continuous profile ranging from the Molasse basin to the Southern Alps. As the nappe system has already been described in chapter 5, comments will concern mainly deeper structures.
7.3.2 GENERAL CONCEPT
The general idea behind the crustal-scale inter-pretation of the Western traverse has been stated by Marchant et al. (1993). It is based on the synthetic sec-tion built with the depth-migrated Vibroseis sections (fig. 5-28) and illustrated here in fig. 7-8. The shape of the Ivrea mantle body was determined partly by the high-amplitude reflection related to the Canavese line and partly on the gravity model of Berckhemer (1968). However on the basis of the available data, the exact extension of this indenter is not very well constrained. It is quite possible that it extends a few kilometres further to the north, in the shape of a similar but smaller “mantle slice” as observed on the Ecors-Crop Alp traverse (fig. 7-6). This “mantle slice” would thus correspond to the high-velocity body detected by refraction seismology beneath the Monte Rosa (fig. 7-7).
This upper-mantle indentation has induced the large-scale backfolding of the Southern Steep belt which brings the southern limb of the Vanzone anti-form in an overturned position beneath the Penninic domain. Structural logic implies that this anticlinal backfold must be relayed at depth by a synform to bring the Alpine Root zone back into a normal posi-tion, as presented in fig. 7-8. In reality the internal structure of this deep-seated backfold is certainly much
Fig. 7-7: Refraction model along a cross-section from the Rhone valley (Brig) to Sosto, east of Lago Maggiore (after Ansorge et al. 1979, fig. 4).
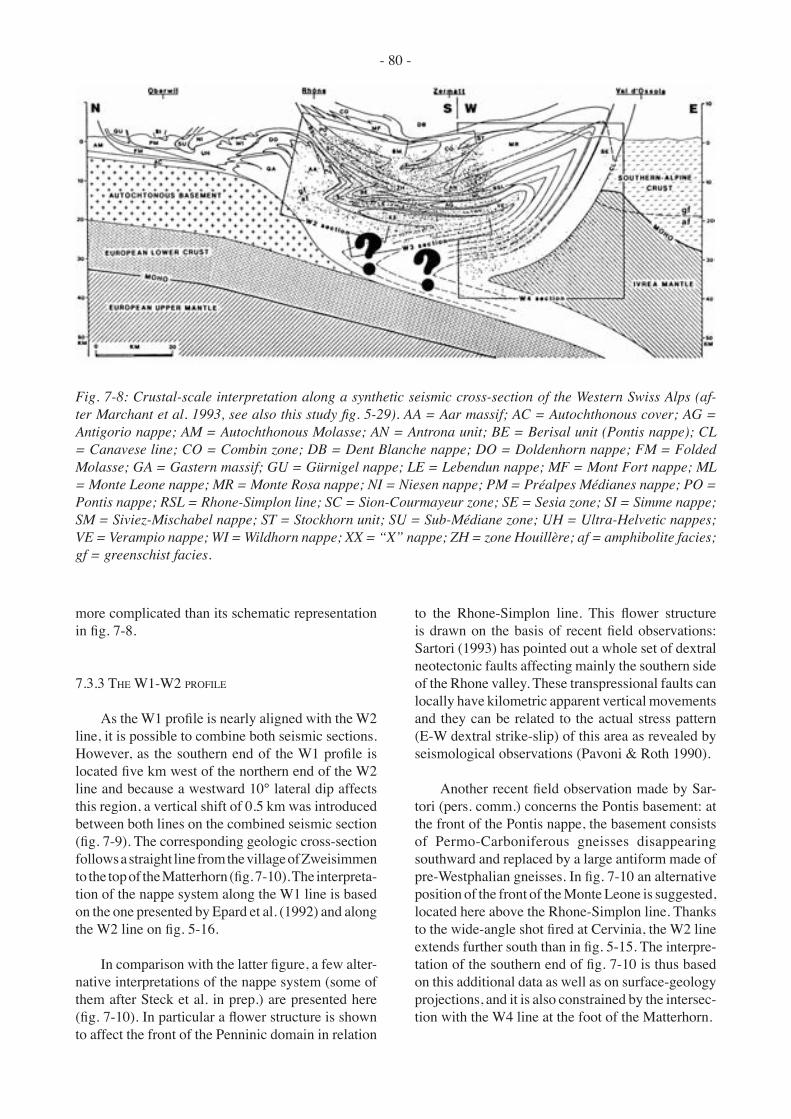
- 80 -
more complicated than its schematic representation in fig. 7-8.
7.3.3 THE W1-W2 PROFILE
As the W1 profile is nearly aligned with the W2 line, it is possible to combine both seismic sections. However, as the southern end of the W1 profile is located five km west of the northern end of the W2 line and because a westward 10° lateral dip affects this region, a vertical shift of 0.5 km was introduced between both lines on the combined seismic section (fig. 7-9). The corresponding geologic cross-section follows a straight line from the village of Zweisimmen to the top of the Matterhorn (fig. 7-10). The interpreta-tion of the nappe system along the W1 line is based on the one presented by Epard et al. (1992) and along the W2 line on fig. 5-16.
In comparison with the latter figure, a few alter-native interpretations of the nappe system (some of them after Steck et al. in prep.) are presented here (fig. 7-10). In particular a flower structure is shown to affect the front of the Penninic domain in relation
to the Rhone-Simplon line. This flower structure is drawn on the basis of recent field observations: Sartori (1993) has pointed out a whole set of dextral neotectonic faults affecting mainly the southern side of the Rhone valley. These transpressional faults can locally have kilometric apparent vertical movements and they can be related to the actual stress pattern (E-W dextral strike-slip) of this area as revealed by seismological observations (Pavoni & Roth 1990).
Another recent field observation made by Sar-tori (pers. comm.) concerns the Pontis basement: at the front of the Pontis nappe, the basement consists of Permo-Carboniferous gneisses disappearing southward and replaced by a large antiform made of pre-Westphalian gneisses. In fig. 7-10 an alternative position of the front of the Monte Leone is suggested, located here above the Rhone-Simplon line. Thanks to the wide-angle shot fired at Cervinia, the W2 line extends further south than in fig. 5-15. The interpre-tation of the southern end of fig. 7-10 is thus based on this additional data as well as on surface-geology projections, and it is also constrained by the intersec-tion with the W4 line at the foot of the Matterhorn.
Fig. 7-8: Crustal-scale interpretation along a synthetic seismic cross-section of the Western Swiss Alps (af-ter Marchant et al. 1993, see also this study fig. 5-29). AA = Aar massif; AC = Autochthonous cover; AG = Antigorio nappe; AM = Autochthonous Molasse; AN = Antrona unit; BE = Berisal unit (Pontis nappe); CL = Canavese line; CO = Combin zone; DB = Dent Blanche nappe; DO = Doldenhorn nappe; FM = Folded Molasse; GA = Gastern massif; GU = Gürnigel nappe; LE = Lebendun nappe; MF = Mont Fort nappe; ML = Monte Leone nappe; MR = Monte Rosa nappe; NI = Niesen nappe; PM = Préalpes Médianes nappe; PO = Pontis nappe; RSL = Rhone-Simplon line; SC = Sion-Courmayeur zone; SE = Sesia zone; SI = Simme nappe; SM = Siviez-Mischabel nappe; ST = Stockhorn unit; SU = Sub-Médiane zone; UH = Ultra-Helvetic nappes; VE = Verampio nappe; WI = Wildhorn nappe; XX = “X” nappe; ZH = zone Houillère; af = amphibolite facies; gf = greenschist facies.
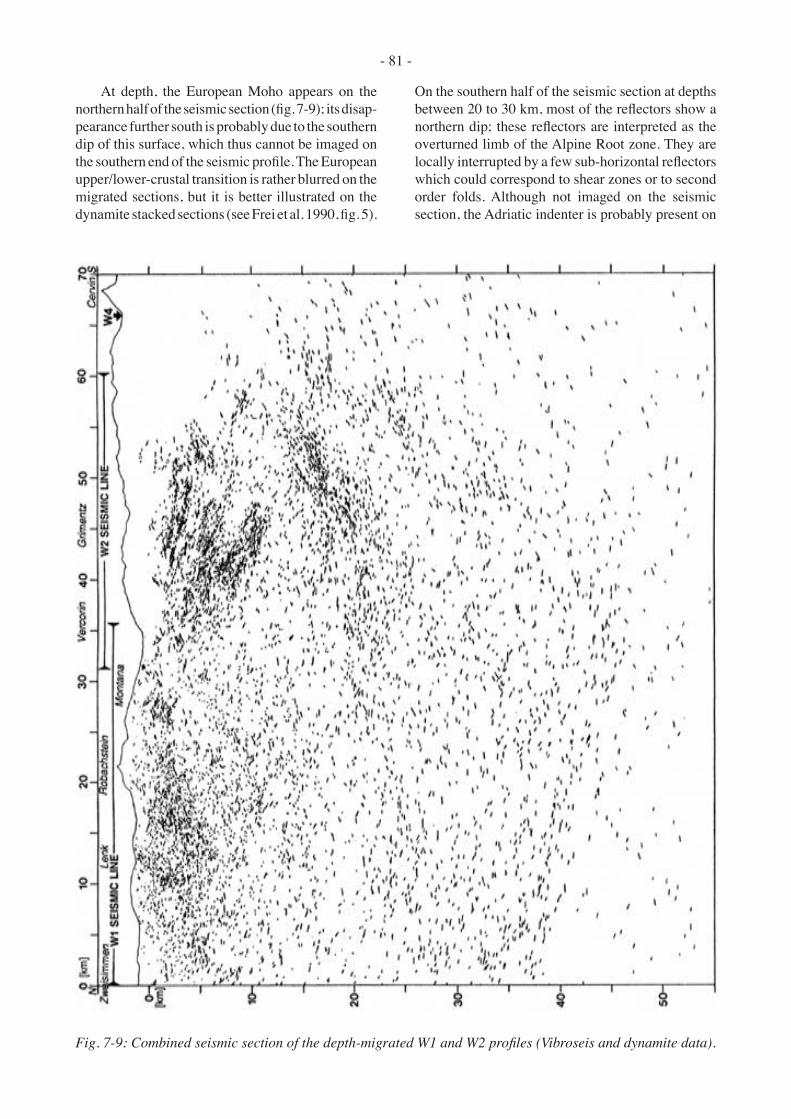
- 81 -
At depth, the European Moho appears on the northern half of the seismic section (fig. 7-9); its disap-pearance further south is probably due to the southern dip of this surface, which thus cannot be imaged on the southern end of the seismic profile. The European upper/lower-crustal transition is rather blurred on the migrated sections, but it is better illustrated on the dynamite stacked sections (see Frei et al. 1990, fig. 5).
On the southern half of the seismic section at depths between 20 to 30 km, most of the reflectors show a northern dip; these reflectors are interpreted as the overturned limb of the Alpine Root zone. They are locally interrupted by a few sub-horizontal reflectors which could correspond to shear zones or to second order folds. Although not imaged on the seismic section, the Adriatic indenter is probably present on
Fig. 7-9: Combined seismic section of the depth-migrated W1 and W2 profiles (Vibroseis and dynamite data).

- 82 -
the southern end of the profile, on the basis of the interpretation of the W4 profile (see § 7.3.5).
7.3.4 THE W3 PROFILE
In comparison with the Vibroseis section (fig. 5-19), the W3 migrated section shown here (fig. 7-11) extends 30 km further south, thanks to wide-angle shots fired in Italy, which however have only partly
imaged the top ten kilometres. The interpretation of the northern half of this profile (fig. 7-12) is more or less identical to the one of fig. 5-21. In the area of Zermatt these two interpretations show some differ-ences which are due to the fact that the cross-section of fig. 7-12 is located three kilometres east of the one of fig. 5-21.
Unfortunately, the wide-angle extension of the W3 profile tends, at its southern end, to become
Fig. 7-10: Crustal-scale interpretation of the W1 and W2 profiles.

- 83 -
parallel to the major structures, which renders the interpretation difficult. Here again the interpretation is partly based on the intersecting W4 profile and on surface-geology projections, as well as on a virtual extension with the W1-W2 profile. Near Brusson, the area is affected by the E-W Aosta normal fault. The vertical uplift of its southern side allowed a window of orthogneisses to outcrop near Brusson;
these orthogneisses are considered to belong to the Internal Crystalline massifs. The major movements along the Aosta line seem to be related to those of the Rhone-Simplon line, as suggested by Gouffon (1993). Therefore a possible relationship between both accidents is suggested in fig. 7-12, although the sub-vertical Aosta line is not imaged on the seismic section.
Fig. 7-11: Depth-migrated section of the W3 profile (Vibroseis and dynamite data).

- 84 -
As on the W1-W2 section, the reflectors at a mid-crustal level show a predominantly northward dip, most probably related to the overturned limb of the Alpine Root zone. A few south-dipping reflectors between 20 and 25 km below Randa suggest some internal folding inside the Alpine Root zone, and
some sub-horizontal reflection strips could be related to shear zones. As the W3 profile is nearly parallel to the Insubric line, this feature is badly imaged and its position is based on a projection from the W4 profile where this accident is clearly visible. Here again the European lower-crust and Moho can be distinguished
Fig. 7-11: Crustal-scale interpretation of the W3 profile.

- 85 -
better on the dynamite stacked section (see Valasek et al. 1990, fig. 8a) than on the migrated section.
7.3.5 THE W4 PROFILE
Thanks to a couple of wide-angle shots, the length of the W4 stacked section (23 km in fig. 7-13) is three times that of the W4 Vibroseis section (less than 8 km, see fig. 3-2). However some discrepancies appear between the two data sets: the west-dipping reflectors are steeper on the Vibroseis stacked section (fig. 3-2a) than on the dynamite section (see fig. 7 in Frei et al. 1990). This could be due to the more sophisticated
processing of the Vibroseis data, in particular the application of DMO (Dip Move Out) carried out on the pre-stack data (Du Bois et al. 1990b). Additional seismic information along this profile can be gained by consulting the small stacked section (fig. 7-14) acquired at Arolla. Further to the west, the interpre-tation of the W4 profile can be constrained by its intersection with the W5 line. The interpretation of the latter (fig. 7-15) reveals, in the Penninic domain, an overall structure very similar to the W2 profile.
Due to the fact that the W4 profile is oblique to the main structures, the geological cross-section (fig. 7-16) seems to be stretched in comparison with
Fig. 7-13: Depth-migrated section of the W4 profile (Vibroseis and dynamite data).

- 86 -
Fig.
7-1
4: T
he A
rolla
stac
ked
sect
ion
(Fre
i, pe
rs. c
omm
.).Fi
g. 7
-15:
Inte
rpre
tatio
n of
the
W5
profi
le (a
fter E
sche
r et a
l. 19
92).
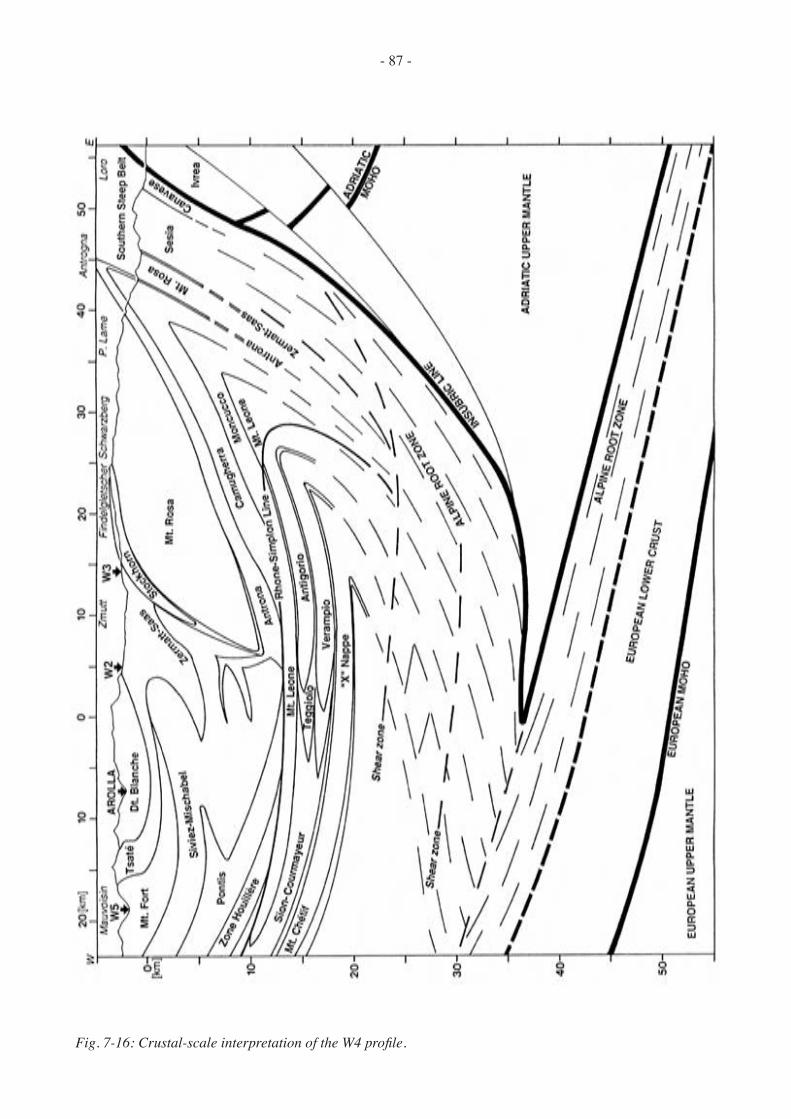
- 87 -
Fig. 7-16: Crustal-scale interpretation of the W4 profile.
- 88 -
NW-SE sections. On the crustal-scale interpretation of the W4 profile (fig. 7-16), the nappe system is the same as presented in fig. 5-25. However as the crustal-scale cross-section extends further at both ends a few new features appear. At the western end of fig. 7-16, the geology below Mauvoisin is based on the interpretation of Escher et al. (1992) and Steck et al. (in prep.) of the intersecting W5 profile (fig. 7-15). From this intersection, the interpretation then extrapolated eastward so that it correlates with the interpretation of the Vibroseis W4 line (fig. 5-25), taking advantage of the seismic information provided by the Arolla stacked section (fig. 7-14). As this section is perpendicular to the W4 profile, only the sub-horizontal reflections were considered, such as those at a depth of 1-2 km related to the Tsaté nappe and those between 16 and 18 km which can be cor-related with the Lower Penninic nappes.
At the eastern end of the geological cross-section, the structure of the Adriatic Moho, not imaged on the seismic section, is based on an analogy with the Ecors-Crop Alp profile (fig. 7-6) and gravity modelling (§ 8.4). The Insubric line can confidently be traced down to a depth of 35 km, where it seems to become sub-horizontal. As this accident is laterally imaged on the seismic section, its correct position needs to be projected in fig. 7-16 (a true vertical geologi-cal cross-section) and it is therefore slightly offset when compared to fig. 7-13. Due to the decreasing resolution of reflection seismology with depth and to granulitization/eclogitization processes (see § 4.3.3), it is difficult here to determine the exact depth of the European Moho and lower-crust as well as the exact shape of the Adriatic indenter.
7.3.6 SYNTHETIC SECTION OF THE WESTERN TRAVERSE
Now that the crustal structure along the individual PNR/NFP-20 Western profiles has been established, it is possible to build a synthetic geological cross-section along the Western traverse, such as in fig. 7-17. This synthetic profile starts in the Molasse basin, follows the W1 and W2 lines, intersects the W3 and W4 lines at Zermatt, and then continues down to the Po plain, passing through Biella. The structures of the Molasse basin and the Prealps, not surveyed by deep seismic profiles, are based on surface-geology projections. The interpretation in the Helvetic and Penninic domain is based on the projection of the geological cross-sec-tions of fig. 7-10, 7-12 and 7-16. A slightly different interpretation of the External Crystalline massifs in the area affected by the Glishorn backfold is proposed, such as suggested by Steck et al. (in prep.).
As this synthetic cross-section in its south-eastern part is located in between the areas surveyed by the Ecors-Crop Alp and the W4 profiles, its geological structures are deduced from the interpretation of these two traverses. If the Austroalpine domain seems very large here, this is due to the obliquity of the synthetic section with regard to the Sesia zone. It is most probable that at depth this zone gives way to the Lanzo peridotites, in the same way as on the Ecors-Crop Alp traverse.
7.4 The PNR/NFP-20 Central traverse
7.4.1 INTRODUCTION
This traverse comprises three individual deep seismic lines (C1-C3) constituting a nearly continu-ous line from the front of the Prealps to the Southern Alps (for location, see fig. 7-1). The seismic section of fig. 7-18 is a combination of a section from Valasek (1992, fig. 8.7) and a depth-migration of a line-draw-ing from a preliminary stacked section (Lehner, pers. comm.) which has the advantage of outlining the main reflections (thicker and longer reflectors). As these data were acquired using single-fold dynamite shots, the first few seconds of data are badly covered. Up to now only a vague interpretation at a crustal-scale has been published for this traverse by Valasek (1992). The interpretation presented here can certainly be refined, once good migrations of the Vibroseis data are available. This traverse is very close to the “Swiss Geotraverse”, a refraction profile (fig. 7-19) starting near Basel and finishing near Chiasso (Mueller et al. 1980). Although completely disconnected from the structural reality, this profile provides velocity data for the Penninic domain, such as the high-velocity layer (6.7 km/s) at a depth of around 30 km, overly-ing a thick low-velocity zone (5.9 km/s), which at a depth of 45 km gives way to a thin layer yielding a velocity of 6.6 km/s typical of the lower-crust.
7.4.2 INTERPRETATION
On the interpretation of the Central traverse (fig. 7-20), the Prealpine units, not imaged on the seismic section, are projected from surface geology. At a depth of 8 km under Meiringen, some nearly horizontal reflectors mark the contact between the Aar and Gastern massif. At a depth of 15 km under the same locality, a strip of south-dipping reflectors probably underline the frontal thrust of the External Crystalline massifs on the autochthonous European crust. Further to the SE, the structures become more


- 89 -
Fig.
7-1
8: C
ombi
ned
dept
h-m
igra
ted
sect
ions
of t
he C
entr
al tr
aver
se (
afte
r Va
lase
k 19
92, fi
g. 8
.7)
and
a m
igra
tion
of a
pre
limin
ary
line-
draw
ing
(Leh
ner
pers
. co
mm
.).

- 90 -
sub-vertical and therefore units such as the Urseren zone and the Gotthard massif are not imaged. It is most likely that at depth the Tavetsch massif is also present as it outcrops only 20 km to the NE, but it is impossible to distinguish it on the seismic section. In the Val Bedretto an anticlinal backfold affects all units, putting them in an overturned position show-ing a dip of 70° to the NW (e.g. Probst 1980). From surface-geology data it is not possible to calibrate the size of the Berisal synclinal backfold which would bring these units back into an upright position.
Further to the SE, the Antigorio nappe is doubled by a series of backfolds with an axis nearly parallel to the seismic line (Steck 1990). Under this nappe, a transparent zone can be related to the Verampio nappe. Its base is underlined by a strong south-dipping reflector, probably due to a strip of metasediments separating the Verampio nappe from other basement units belonging to the European margin, such as the hypothetical “X” nappe. Just north of the Insubric line, the Southern Steep belt could be refolded at a depth of 10 km as the presence of some sub-horizontal reflectors suggest. Such a structure can be expected, as the backfolding of the Southern Steep belt shows at the surface an “en échelon” pattern of backfolds (Steck 1990, fig. 4).
The Insubric line and the Southern Steep belt, vertical at the surface, can be traced down to a depth of 30 km along a set of high-amplitude reflectors showing a listric shape oriented towards the NW. At a depth of 30 to 35 km under Bignasco some strong reflectors seem to outline a similar, though smaller structure to
the “mantle slice” observed on the Ecors-Crop Alp traverse. Its position coincides with the high-velocity layer detected by the wide-angle experiment (fig. 7-19). As on all the other Alpine profiles, the European lower-crust and the Moho discontinuity are subducted towards the SE, accompanied by metamorphosed parts of the Briançonnais and Austroalpine terrains and relicts from the Valais and Piemont oceans (the Alpine Root zone), which would correspond well to the low-velocity layer detected on the refraction profile.
Under Como, the refraction data locates the Adriatic Moho at the depth of 34 km (fig. 7-19). From there onwards it continues upwards towards the NW and coincides with the high-amplitude reflectors reaching a depth of 22 km below Locarno. By contrast Valasek (1992, fig. 8.8) has interpreted the Adriatic Moho as a NW-plunging surface, reaching a depth of 45 km below Locarno. For at least two reasons, such an interpretation is most unlikely as his Moho does not correspond to any significant reflectors and such an interpretation is incompatible with the grav-ity data: the profile is located on the NE extremity of the Ivrea gravity anomaly, implying that some Adriatic upper-mantle material must be very close to the surface (see § 8.4.2).
The reflectors situated under the Southern Alps correspond extremely well to the structures predicted from surface geology on the cross-sections of Schu-macher (1990). In particular the north-dipping reflec-tors below Lugano highlight the basement thrusts typical of this part of the Southern Alps.
Fig. 7-19: The “Swiss Geotraverse” refraction profile (after Mueller et al. 1980, fig. 7).

- 91 -
Fig.
7-2
0: C
rust
al-s
cale
inte
rpre
tatio
n of
the
Cen
tral
trav
erse
. Mo
= M
olas
se; P
a =
Par
auto
chth
onou
s co
ver
units
; Ra
= “
Rand
kette
” Bo
rder
Cha
in u
nits
; SM
=
Suba
lpin
e M
olas
se; T
e =
Teg
giol
o zo
ne; W
i = W
ildho
rn n
appe
; see
als
o ab
brev
iatio
ns o
f pre
viou
s figu
res.

- 92 -
7.5 The PNR/NFP-20 Southern traverse
7.5.1 INTRODUCTION
This traverse is composed of several individual lines surveying the Penninic domain and the Southern Alps in Ticino. Only an interpretation of the S1 line (for location, see fig. 7-1) is presented here on the basis of a depth-migration (fig. 7-21) processed by Valasek (1992). This line is a crucial profile because it images the structures related to the Insubric line. Several very similar interpretations have been pub-lished for this line (Frei et al. 1989; Bernoulli et al. 1990; Bernoulli & Bertotti 1991; Heitzmann et al. 1991) but always on the basis of unmigrated data. A stacked section showing such steep dipping reflectors can induce significant interpretation mistakes; migra-tion will change considerably the position and dip of the reflectors. Furthermore the Southern traverse has been most often interpreted by combining it with the Eastern traverse (Holliger 1990; Ansorge et al. 1991; Valasek et al. 1991; Valasek 1992). Such a combina-tion, an horizontal projection of the Southern traverse onto the Eastern traverse, is geologically incorrect and can lead to serious interpretation errors when constructing a synthetic section (see § 7.7.1).
7.5.2 INTERPRETATION
Hardly any reflectors image the near surface of the northern end of the line, but in this region surface geology can be projected down to a depth of a few kilo-metres (Probst 1980), showing a slightly backfolded Gotthard massif (fig. 7-22). As proposed by Frei et al. (1989), the strong and horizontal reflectors at a depth of 7 km below Valbella certainly correspond to the base of the Simano-Lucomagno nappe. The contact of this nappe with the Adula nappe is not imaged on the seismic section as it lies too close to the surface. A couple of nearly horizontal strips of reflectors at a depth of 10 and 12 km below Hinterrhein and Valbella suggest the possibility of the presence of one or two extra basement nappes (“X” in fig. 7-22), unknown at the surface (Bernoulli et al. 1990). Another possible interpretation of these reflectors could be isoclinal backfolding of the above units with fold axes more or less parallel to the seismic profile (Steck 1990), similarly to the redoubled Antigorio nappe on the Central traverse (see fig. 7-20).
The Southern Steep belt and the Insubric line can be followed northwards down to a depth of 35 km; they are underlined by a highly reflective band, typical
Fig. 7-21: Depth-migrated section of the S1 profile (after Valasek 1992, fig. B16).
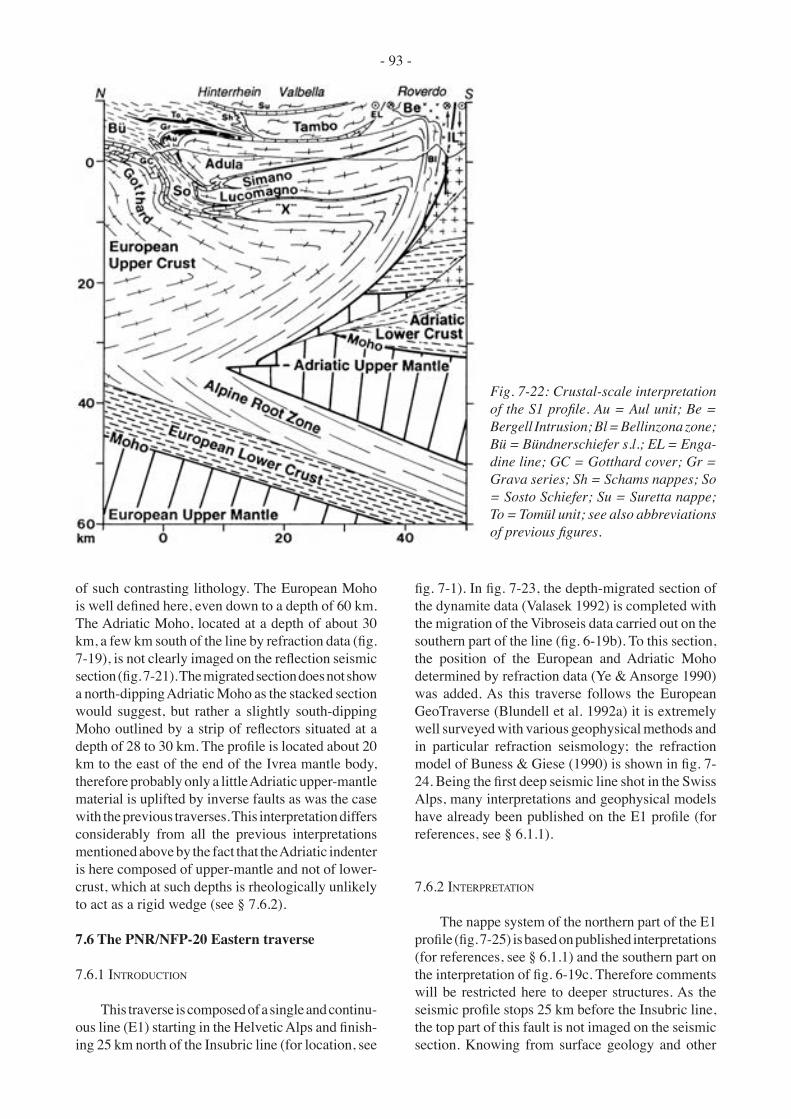
- 93 -
of such contrasting lithology. The European Moho is well defined here, even down to a depth of 60 km. The Adriatic Moho, located at a depth of about 30 km, a few km south of the line by refraction data (fig. 7-19), is not clearly imaged on the reflection seismic section (fig. 7-21). The migrated section does not show a north-dipping Adriatic Moho as the stacked section would suggest, but rather a slightly south-dipping Moho outlined by a strip of reflectors situated at a depth of 28 to 30 km. The profile is located about 20 km to the east of the end of the Ivrea mantle body, therefore probably only a little Adriatic upper-mantle material is uplifted by inverse faults as was the case with the previous traverses. This interpretation differs considerably from all the previous interpretations mentioned above by the fact that the Adriatic indenter is here composed of upper-mantle and not of lower-crust, which at such depths is rheologically unlikely to act as a rigid wedge (see § 7.6.2).
7.6 The PNR/NFP-20 Eastern traverse
7.6.1 INTRODUCTION
This traverse is composed of a single and continu-ous line (E1) starting in the Helvetic Alps and finish-ing 25 km north of the Insubric line (for location, see
fig. 7-1). In fig. 7-23, the depth-migrated section of the dynamite data (Valasek 1992) is completed with the migration of the Vibroseis data carried out on the southern part of the line (fig. 6-19b). To this section, the position of the European and Adriatic Moho determined by refraction data (Ye & Ansorge 1990) was added. As this traverse follows the European GeoTraverse (Blundell et al. 1992a) it is extremely well surveyed with various geophysical methods and in particular refraction seismology; the refraction model of Buness & Giese (1990) is shown in fig. 7-24. Being the first deep seismic line shot in the Swiss Alps, many interpretations and geophysical models have already been published on the E1 profile (for references, see § 6.1.1).
7.6.2 INTERPRETATION
The nappe system of the northern part of the E1 profile (fig. 7-25) is based on published interpretations (for references, see § 6.1.1) and the southern part on the interpretation of fig. 6-19c. Therefore comments will be restricted here to deeper structures. As the seismic profile stops 25 km before the Insubric line, the top part of this fault is not imaged on the seismic section. Knowing from surface geology and other
Fig. 7-22: Crustal-scale interpretation of the S1 profile. Au = Aul unit; Be = Bergell Intrusion; Bl = Bellinzona zone; Bü = Bündnerschiefer s.l.; EL = Enga-dine line; GC = Gotthard cover; Gr = Grava series; Sh = Schams nappes; So = Sosto Schiefer; Su = Suretta nappe; To = Tomül unit; see also abbreviations of previous figures.

- 94 -
Fig.
7-2
3: D
epth
-mig
rate
d se
ctio
n of
the
E1 p
rofil
e (a
fter V
alas
ek 1
992,
fig.
B9)
with
a p
roje
ctio
n of
the
Euro
pean
and
Adr
iatic
Moh
o de
term
ined
by
seis
mic
refr
actio
n m
odel
ling
(afte
r (Ye
& A
nsor
ge 1
990b
) and
an
over
lay
of th
e m
igra
tion
of th
e Vi
bros
eis d
ata
in th
e Pe
nnin
ic d
omai
n (fr
om fi
g. 6
-19b
).
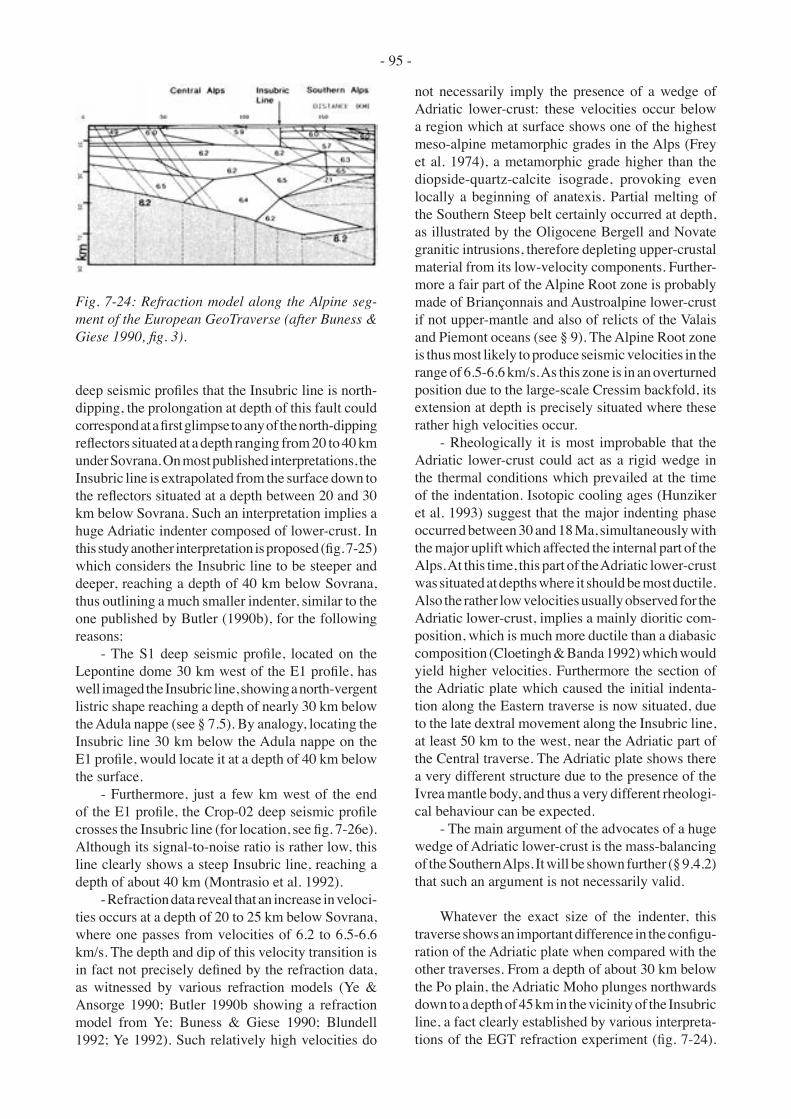
- 95 -
deep seismic profiles that the Insubric line is north-dipping, the prolongation at depth of this fault could correspond at a first glimpse to any of the north-dipping reflectors situated at a depth ranging from 20 to 40 km under Sovrana. On most published interpretations, the Insubric line is extrapolated from the surface down to the reflectors situated at a depth between 20 and 30 km below Sovrana. Such an interpretation implies a huge Adriatic indenter composed of lower-crust. In this study another interpretation is proposed (fig. 7-25) which considers the Insubric line to be steeper and deeper, reaching a depth of 40 km below Sovrana, thus outlining a much smaller indenter, similar to the one published by Butler (1990b), for the following reasons:
- The S1 deep seismic profile, located on the Lepontine dome 30 km west of the E1 profile, has well imaged the Insubric line, showing a north-vergent listric shape reaching a depth of nearly 30 km below the Adula nappe (see § 7.5). By analogy, locating the Insubric line 30 km below the Adula nappe on the E1 profile, would locate it at a depth of 40 km below the surface.
- Furthermore, just a few km west of the end of the E1 profile, the Crop-02 deep seismic profile crosses the Insubric line (for location, see fig. 7-26e). Although its signal-to-noise ratio is rather low, this line clearly shows a steep Insubric line, reaching a depth of about 40 km (Montrasio et al. 1992).
- Refraction data reveal that an increase in veloci-ties occurs at a depth of 20 to 25 km below Sovrana, where one passes from velocities of 6.2 to 6.5-6.6 km/s. The depth and dip of this velocity transition is in fact not precisely defined by the refraction data, as witnessed by various refraction models (Ye & Ansorge 1990; Butler 1990b showing a refraction model from Ye; Buness & Giese 1990; Blundell 1992; Ye 1992). Such relatively high velocities do
not necessarily imply the presence of a wedge of Adriatic lower-crust: these velocities occur below a region which at surface shows one of the highest meso-alpine metamorphic grades in the Alps (Frey et al. 1974), a metamorphic grade higher than the diopside-quartz-calcite isograde, provoking even locally a beginning of anatexis. Partial melting of the Southern Steep belt certainly occurred at depth, as illustrated by the Oligocene Bergell and Novate granitic intrusions, therefore depleting upper-crustal material from its low-velocity components. Further-more a fair part of the Alpine Root zone is probably made of Briançonnais and Austroalpine lower-crust if not upper-mantle and also of relicts of the Valais and Piemont oceans (see § 9). The Alpine Root zone is thus most likely to produce seismic velocities in the range of 6.5-6.6 km/s. As this zone is in an overturned position due to the large-scale Cressim backfold, its extension at depth is precisely situated where these rather high velocities occur.
- Rheologically it is most improbable that the Adriatic lower-crust could act as a rigid wedge in the thermal conditions which prevailed at the time of the indentation. Isotopic cooling ages (Hunziker et al. 1993) suggest that the major indenting phase occurred between 30 and 18 Ma, simultaneously with the major uplift which affected the internal part of the Alps. At this time, this part of the Adriatic lower-crust was situated at depths where it should be most ductile. Also the rather low velocities usually observed for the Adriatic lower-crust, implies a mainly dioritic com-position, which is much more ductile than a diabasic composition (Cloetingh & Banda 1992) which would yield higher velocities. Furthermore the section of the Adriatic plate which caused the initial indenta-tion along the Eastern traverse is now situated, due to the late dextral movement along the Insubric line, at least 50 km to the west, near the Adriatic part of the Central traverse. The Adriatic plate shows there a very different structure due to the presence of the Ivrea mantle body, and thus a very different rheologi-cal behaviour can be expected.
- The main argument of the advocates of a huge wedge of Adriatic lower-crust is the mass-balancing of the Southern Alps. It will be shown further (§ 9.4.2) that such an argument is not necessarily valid.
Whatever the exact size of the indenter, this traverse shows an important difference in the configu-ration of the Adriatic plate when compared with the other traverses. From a depth of about 30 km below the Po plain, the Adriatic Moho plunges northwards down to a depth of 45 km in the vicinity of the Insubric line, a fact clearly established by various interpreta-tions of the EGT refraction experiment (fig. 7-24).
Fig. 7-24: Refraction model along the Alpine seg-ment of the European GeoTraverse (after Buness & Giese 1990, fig. 3).
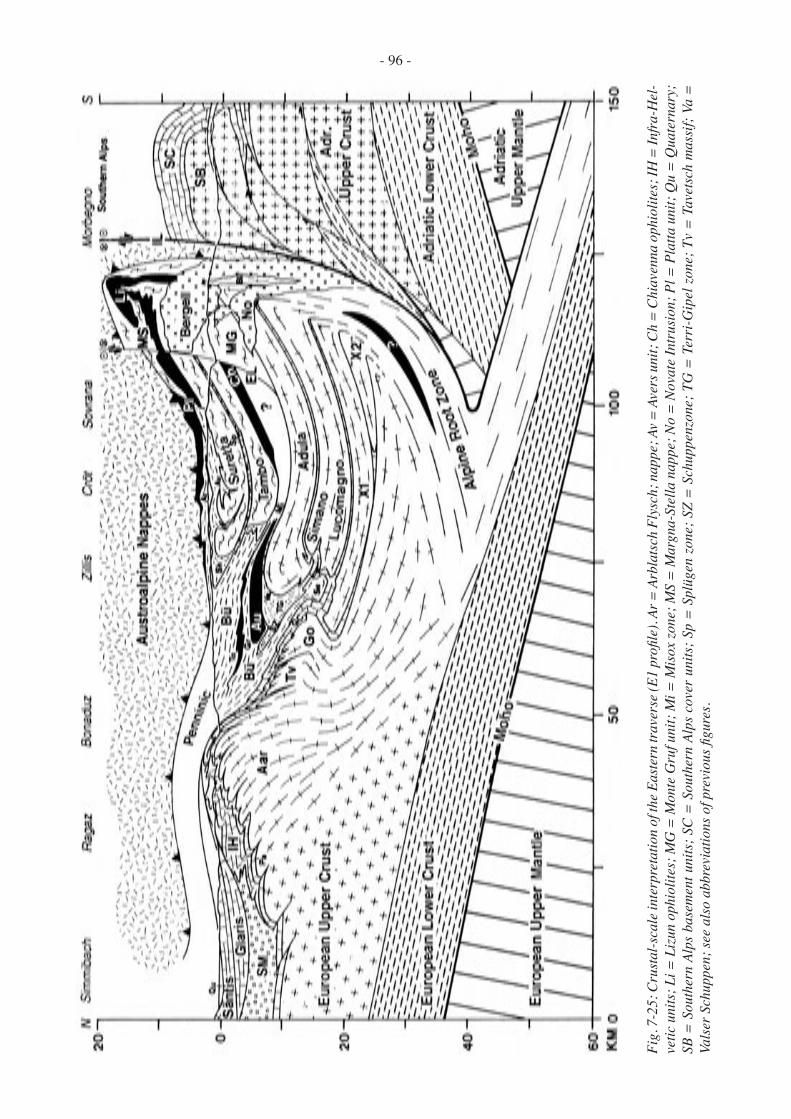
- 96 -
Fig.
7-2
5: C
rust
al-s
cale
inte
rpre
tatio
n of
the E
aste
rn tr
aver
se (E
1 pr
ofile
). Ar
= A
rbla
tsch
Fly
sch;
nap
pe; A
v = A
vers
uni
t; C
h =
Chi
aven
na o
phio
lites
; IH
= In
fra-
Hel
-ve
tic u
nits
; Li =
Liz
un o
phio
lites
; MG
= M
onte
Gru
f uni
t; M
i = M
isox
zone
; MS
= M
argn
a-St
ella
nap
pe; N
o =
Nov
ate
Intr
usio
n; P
l = P
latta
uni
t; Q
u =
Qua
tern
ary;
SB
= S
outh
ern
Alps
bas
emen
t uni
ts; S
C =
Sou
ther
n Al
ps c
over
uni
ts; S
p =
Spl
ügen
zon
e; S
Z =
Sch
uppe
nzon
e; T
G =
Ter
ri-G
ipel
zon
e; T
v =
Tav
etsc
h m
assi
f; Va
=
Vals
er S
chup
pen;
see
also
abb
revi
atio
ns o
f pre
viou
s figu
res.

- 97 -
This fact is also corroborated by a refraction survey undertaken 70 km further to the east (Scarascia & Maistrello 1990). On all the other profiles the Adri-atic Moho becomes shallower when approaching the Insubric line, with the exception of the S1 profile which shows an intermediate structure.
7.7 Discussion
7.7.1 THE PROBLEM OF OVERLYING THE EASTERN AND
SOUTHERN TRAVERSE
Holliger (1990) has proposed to overlay the Eastern and Southern traverses, in order to obtain a single and continuous synthetic deep seismic profile from the Molasse basin to the Po plain. Therefore he projected horizontally the Eastern traverse (fig. 7-26a) onto the Southern traverse (fig. 7-26b) along the trend marked by the Bouguer anomaly, which is E-W here. His resulting synthetic section (fig. 7-26c) reveals a good alignment of the European Moho from the East-
Fig. 7-26: Illustration of the problems of combining the E1 with the S1 profiles; depth-migrated sections from Valasek & Holliger (1990). For explanations, see text.

- 98 -
ern to the Southern traverse. But if one considers the nappe system, this projection is incorrect due to the strong axial dip in the Penninic domain: the position of the Adula nappe on the Southern traverse is 15 km higher than on the Eastern traverse! On the basis of such a synthetic section, one would be tempted to extend the Insubric line down to a depth of only 25 km on the Eastern profile. Furthermore such a sec-tion, especially when all the individual lines of the Southern traverse are projected (Holliger 1990, fig. 3), reveals many overlaid reflectors with opposite dips below the Insubric line, a most unlikely geological configuration.
Another possibility of projecting the Southern traverse onto the Eastern one is to take into account the axial dip prevailing north of the Insubric line. This is shown in fig. 7-26d, where the Adula nappe of both traverses are at the same level. Most of the reflectors in the vicinity of the Insubric line now show a coherent pattern suggesting that this fault reaches a depth of 40 km on the Eastern profile. However the European Moho and lower-crust show a sharp offset of 15 km which is most unlikely as witnessed by the EGT refraction data (fig. 7-24).
Both projection methods have their advantages and disadvantages. The horizontal projection is cor-rect as regards the European lower-crust and Moho, but incorrect as regards what is situated above. The structural projection is a good approximation as re-gards the nappe system and the Insubric line, but it is incorrect lower down. Whatever the method used to overlay the Eastern and Southern profiles, the synthetic section will be incorrect and will lead to significant interpretation errors. Therefore both traverses need to be interpreted separately.
7.7.2 MID-CRUSTAL DEFORMATION ACCOMMODATION
The above-mentioned discrepancy between the S1 and E1 profiles reveals an important fact: the ac-commodation of deformations at a mid-crustal level. One of the most striking facts revealed by the deep seismic surveys in the Alps is the delamination which takes place at the transition between the European lower- and upper-crust, the lower-crust acting like a layer of butter in a sandwich: the bread slices being the more rigid upper-crust and the top part of the upper-mantle (which can sometimes be even more rigid than the upper-crust, see e.g. Cloething & Banda, 1992). The European upper-mantle and lower-crust, the lower part of this sandwich, are smoothly subducted below the Adriatic plate: a map of the European Moho (Val-
asek 1992, fig. 9.20) reveals a rather smooth surface devoid of the large-scale dome-and-basin structure, as observed at the surface (i.e. the Rawil-Valpel-line depression and the Lepontine culmination). An important outcome of these observations is that this dome-and-basin structure must be directly linked to deformations occurring at a mid-crustal level, thus induced by the Adriatic indenter and the backfolding it produced.
Present gravity and magnetic 3-D models of the Ivrea mantle body (e.g. Kissling 1984; Wagner et al. 1984), as well as the present interpretations of the Alpine deep seismic traverses, reveal that the shape of the Adriatic indenter varies along the Alpine strike. It is therefore most probable that the upper-crust dome-and-basin structure can be related to the size and the intensity of indentation. This explains why a simple horizontal projection of neighbouring deep seismic lines in order to produce a synthetic seismic section is incorrect. Such projections should be divided in two parts: above and below the Adriatic indenter. Above the indenter, projections must take into account the dome-and-basin structure (such as in fig. 5-28 or 7-26d), while this is not necessary for the structures below the indenter (such as in fig. 7-26c).
7.7.3 COMPARISON OF THE DIFFERENT TRAVERSES
The interpretation of these five different traverses shows striking similarities (the subduction of the European plate, the shape of the Insubric line, etc.) but also major differences which appear progressively along the alpine strike. From east to west the intensity of the backfolding of the External Crystalline massifs increases progressively, together with the size of the indenting “mantle slice”. Contrary to the interpreta-tions of Valasek (1992), a rather drastic change in the structure of the Adriatic indenter occurs in Ticino: to the west, the Adriatic upper-mantle nearly reaches the surface (the Ivrea mantle body) while to the east, the Adriatic Moho plunges towards the north down to a depth of 45 km. This significant difference can be explained within the context of the geodynamic evolution of the Western Alps (see § 9). As geody-namics or plate tectonics are essentially movements between the asthenosphere and the lithosphere, it is at lithospheric-scale that one needs to approach geo-dynamic processes such as the Alpine orogeny.
Therefore first lithospheric-scale interpretations along three of the traverses are proposed (in the fol-lowing chapter), before considering their evolution through time and space (§ 9).

- 99 -
8.1 Introduction
Three lithospheric cross-sections of the Western Alps are presented here: one in the area surveyed by the Ecors-Crop Alp deep seismic profile, the second corresponding to the PNR/NFP-20 Western traverse and the third following the European Geotraverse, which coincides with the PNR/NFP-20 Eastern traverse (for location see fig. 8-1). They are an update of those published by Stampfli (1993, fig. 2 & 3) and their purpose is to serve as a starting point for mass-balancing of the Western Alps. These lithospheric-scale cross-sections are based on a wide range of geological and geophysical data such as deep seismic profiles, refraction seismology, tomography, etc. In order to see if these cross-sections are consistent with the gravity field, some gravimetrical modelling was carried out.
Until recently the lithospheric structures of the Alps were often regarded as a symmetrical and verti-cal subduction (“Verschluckung”) of both the Euro-pean and Adriatic plates (Laubscher 1975; Panza & Mueller 1978). Thanks to relatively high-resolution methods such as the recent tomographical studies of Spakman (1986 & 1990) or Babuska et al. (1990), the symmetrical “Verschluckung” concept gave way to a basically asymmetrical lithospheric structure, showing a substantial subduction of the European continent under the Adriatic plate (Stampfli 1993). This highlights the astonishing cross-section drawn by Argand in 1924, which is in fact very similar to those one would actually build on the basis of recent geophysical data. Argand’s cross-section shows a very substantial south-vergent subduction of the European plate under the Adriatic micro-continent, which first overthrusted the European plate before acting at depth as an indenter, causing the large-scale backfolding and backthrusting affecting the southern part of the Alps (Argand’s Insubric phase, 1911).
8.2. The lithosphere-asthenosphere transition
Since the 1970’s, many different methods have been used to try to determine the depth of the lithos-phere-asthenosphere transition in the Alps, such as:
various seismic methods (e.g. Panza & Mueller 1978; Spakman 1986; Babuska et al. 1990; Guyoton 1991; Viel et al. 1991), gravity modelling (Schwendener & Mueller 1985), various thermal studies (Pasquale et al. 1990; Cermak et al. 1992) or a combination of several methods (Suhadolc et al. 1990; Blundell 1992). Depending on the method and the data base used to determine the depth of this boundary, the results vary considerably in absolute value but nevertheless nearly all show the presence of an asymmetrical south-dip-ping Alpine lithospheric root.
Fig. 8-2 is an attempt to map the lithosphere thickness under the Western Alps. This map is mainly based on the tomographies of Spakman (1986 & 1990), but other studies, such as those of Guyoton (1991) and Babuska et al. (1990), which have both revealed subcrustal discontinuities, have been taken into account. In absolute values, this map is certainly not precise (in the order of a few tens of kilometres) due to the blurred tomographical images. Neverthe-less the geographical positions of the main features, such as the southern end of the subducted European plate or the Tyrrhenian asthenospheric dome, are quite correct as they appear in the same area on most of the studies mentioned above.
This map (fig. 8-2) indicates a SE-dipping Eu-ropean plate reaching a depth of 160 km below the Po plain. The amount of subducted European plate is a key feature to calibrate palinspastic reconstruc-tions (Stampfli 1993). This subducted European plate reveals a NW-SE discontinuity (Guyoton 1991) along the Argentera massif, suggesting a subcrustal transform zone. A similar feature is revealed by Ba-buska et al. (1990) in an area close to the boundary between the Eastern and Western Alps. They sug-gest a dextral subcrustal transform zone showing a similar orientation as the one evidenced by Guyoton (1991). The area around Genoa (the “Ligurian knot”) has suffered a complex Neogene history (opening of the Algero-Provençal and Tyrrhenian oceans and the Alpine-Apenninic orogeny). Genoa is situated near the NW end of the Tyrrhenian asthenospheric dome which can be followed all along the Italian western coast (Stampfli 1993). This asthenospheric upwelling must have considerably affected pre-Neogene lithos-
§ 8. Lithospheric-scale interpretation

- 100 -
Fig. 8-1: Tectonic map (modified from Berthelsen et al. 1992), with location of the deep seismic profiles (black lines) shot in the Western Alps and location of the three lithospheric cross-sections (white lines) of fig. 8-4, -5 & -6. DB = Dent Blanche nappe; Go = Gotthard massif; GP = Grand Paradis massif; LE = Lower Engadine window; MB = Mont Blanc massif; MR = Monte Rosa nappe; Pr = Provence basin; TW = Tauern window; VVL = Villalvernia-Varzi-Levanto line.
Jura
Mou
ntai
ns
RhineGraben
Vosges
Molasse basin Northern Calcareous Alps
Prealps
Southern Alps
Po basin
NorthernApennines
Schwarz-wald
Moldan
ubian
Subalpine
Aar
LE
TW
Dolomites
AoInsubric
DB
MB
Ses
ia
Ivre
a
GP
Belle
donn
e
MR
Go
Dora
Maira
Argentera
Pelvoux
Pr
Voltri
Giu
dica
rie L
ine
VVL
Line
Molasse
Tertiary basinsFaults & thrusts Tertiary intrusifs Lower crust:Ivrea zone
STRUCTURAL DOMAINES
Mainly cover units (Permian p.p., Mesozoic & Tertiary)Mainly basement units(Paleozoic & Precambrian)
Foreland Jura Helvetic Penninic Austroalpine South Alpine Apennines
Cr1
Cr4
Cr2
ALP
E1 E2
E3
W5
W1
W2 W
3
W4S3
S1
S4S5
ECORS-
CROP
C1
C2
C3
Cr3
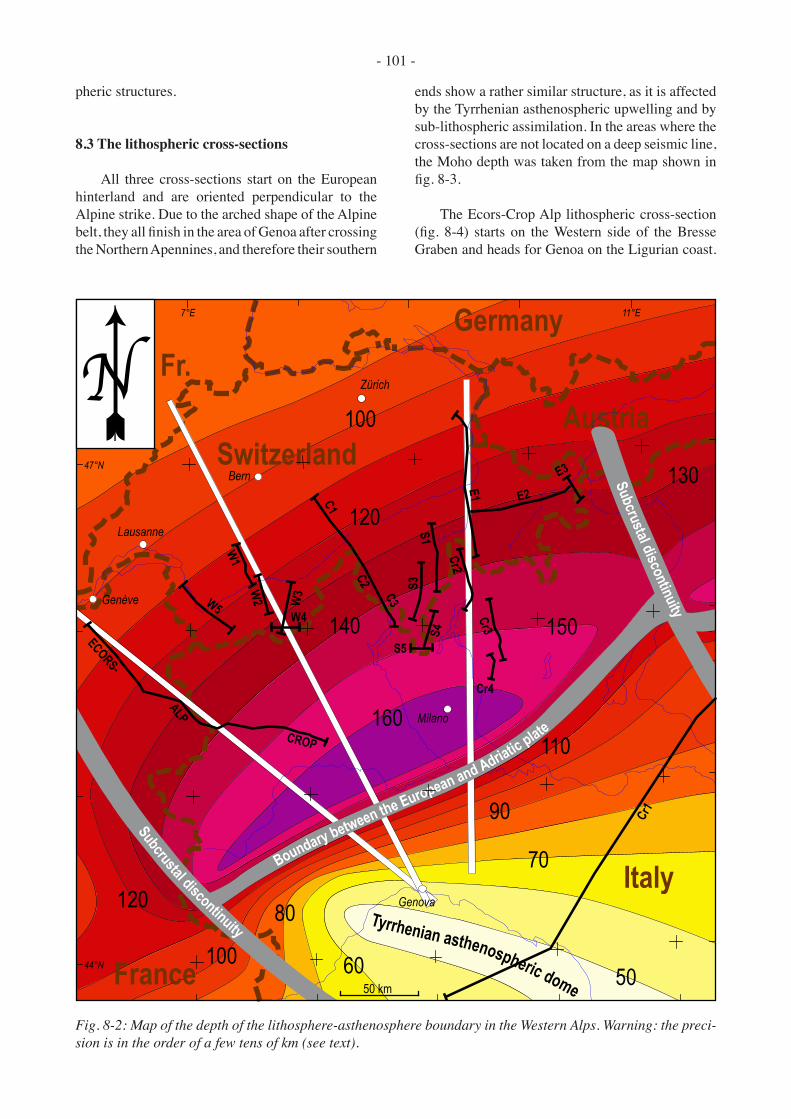
- 101 -
pheric structures.
8.3 The lithospheric cross-sections
All three cross-sections start on the European hinterland and are oriented perpendicular to the Alpine strike. Due to the arched shape of the Alpine belt, they all finish in the area of Genoa after crossing the Northern Apennines, and therefore their southern
ends show a rather similar structure, as it is affected by the Tyrrhenian asthenospheric upwelling and by sub-lithospheric assimilation. In the areas where the cross-sections are not located on a deep seismic line, the Moho depth was taken from the map shown in fig. 8-3.
The Ecors-Crop Alp lithospheric cross-section (fig. 8-4) starts on the Western side of the Bresse Graben and heads for Genoa on the Ligurian coast.
Fig. 8-2: Map of the depth of the lithosphere-asthenosphere boundary in the Western Alps. Warning: the preci-sion is in the order of a few tens of km (see text).
Tyrrhenian asthenospheric dome 5060
70
80
90
100
100
110
120
120
130
140 150
160
Germany
AustriaSwitzerland
France
Italy
Fr.
Subcrustal discontinuity
Subcrustal discontinuity
Boundary between the European and Adriatic plate
Cr1
Cr4
Cr2
ALP
E1 E2
E3
W5
W1
W2 W
3
W4
S3
S1
S4
S5
ECORS-
CROP
C1
C2
C3
Cr3
Bern
Genova
Milano
11°E
44°N
7°E
47°N
Lausanne
Genève
Zürich
50 km
N

- 102 -
As it does not exactly follow the Ecors-Crop Alp deep seismic traverse, a few features close to the surface are slightly different from the crustal-scale interpretation of fig. 7-6, such as the Lanzo unit which reaches the surface here. The Moho map of fig. 8-3 shows that in Italy this cross-section encounters two crustal discontinuities, which can be related to the Monferrato thrust and to the VVL line (Villalvernia-Varzi-Levanto line, Laubscher 1988a; for location see fig. 8-1). This area corresponds to the junction of the Alps and Apennines orogenic systems and its
deep structures are badly constrained (“the Ligurian knot”) in comparison with the Alps. The southern end of the Western traverse (fig. 8-5) also crosses these two crustal discontinuities but this is not the case for the Eastern traverse (fig. 8-6), where a few tens of kilometres of the Adriatic plate seem to be subducted below the Apenninic crust (e.g. Giese et al. 1992).
All three cross-sections are fundamentally asym-metrical and show about 150 km of subduction of the European upper-mantle under the Adriatic plate,
Fig. 8-3: Map of the Moho discontinuity depth (modified from Giese & Buness 1992).
1020
20
30
30
30
30
40
40
50
50
60
Germany
AustriaSwitzerland
France
Italy
Fr.
AAR88
AQ
LELC
B1
LN
LWC
MCD B
H
C
A
B
LBSV
JA
BLL
ES
D D
CBR
ALP75
EGT
SUDALP77
Cr1
Cr4
Cr2
ALP
E1 E2
E3
W5
W1
W2 W
3
W4
S3
S1
S4
S5
ECORS-
CROP
C1
C2
C3
Cr3
Bern
Genova
Milano
11°E
44°N
7°E
47°N
Lausanne
Genève
Zürich
50 km
N

- 103 -
Fig. 8-5: Lithospheric cross-section along the Western traverse. Aa = Aar massif; Bi = Biella intrusion; DB = Dent Blanche nappe; DK = 2nd Diorite Kinzigite unit; Ga = Gastern massif; Gü = Gürnigel nappe; MR = Monte Rosa nappe; Ni = Niesen nappe; Si = Simme nappe; Sv = Siviez-Mischabel nappe; Ts = Tsaté nappe; ZS = Zermatt-Saas nappe; see also abbreviations of previous figures.
Fig. 8-4: Lithospheric cross-section along the Ecors-Crop Alp profile. Br = lower Briançonnais units; GP = Grand Paradis massif; Iv = Ivrea zone; La = Lanzo zone; Se = Sesia zone; ZH = zone Houillère; see also abbreviations of previous figures.
��������������������
��������������������
������������ ������� ������
����������� �������� �������� ������������ �������� ���������
����������
��
��������������������
���������������������������� ����������������������������
�������������
������������������������������������
����
������������
�������
���������������������
��������������������
����
�
���
��
��������������������
����
����
������������������������ ��������� ����������� ����� ������ ���� ������
���
��
���
���
���������
��
��
������������������������������������������
��������������������
��������������������
����������� ��������������� ��������
������������ �������� ���������
���
��
��������������������
���������������������������� ����������������������������
�������������
������������������������������������
��������������������
�����
�����
��������������������
�������
��
����
��������
�����������������
���������� �������� ������ ������� ������ ������
���
��
���
���
���������
��� ���
�����������

- 104 -
which roughly corresponds to shortening estimates based on palinspastic reconstructions (Stampfli & Marthaler 1990; Stampfli 1993). This subduction implies also that a fair amount of European crust got subducted together with a certain amount of Briançonnais and Austroalpine crust as well as some relicts of the Valais and Piemont oceans. (Probably the main part of the subducted oceanic plates involved in the Alpine collision got detached and sank into the asthenosphere.) An exact amount of this subducted crustal material (the Alpine Root zone) cannot be estimated with present geophysical methods: due to granulitization and eclogitization, at depths of more than 50 km the crustal material acquires roughly the same seismic velocities and densities as the upper-mantle (see § 4.3.3).
8.4. Gravity modelling
8.4.1 INTRODUCTION
In order to test the compatibility of these lithos-pheric cross-sections with the gravity field, four gravity models were constructed across the Western Alps (for location, see fig. 8-7). These 2.5-D mod-els (2-D models with the possibility of introducing limited lateral extensions) are a first step towards a 3-D model, which would be more consistent with reality because of the arched shape of the Western
Alps. They start in the Molasse basin and finish in the Po plain; to avoid side effects, these profiles were in fact considerably extended at both ends. A standard lithospheric model (fig. 8-8) was used with densities of 2.75 g/cm3 for the upper-crust (down to a depth of 20 km); 2.90 for the lower-crust (20-32 km); 3.25 for the upper-mantle (32-120 km) and 3.20 for the asthenosphere. Due to progressive granulitization and eclogitization of the crustal material when subducted at depths greater than 40 km, a density gradient was introduced, which brings this material to the same density as the upper-mantle at a depth of 80 km.
8.4.2 THE GRAVITY MODELS
For the Ecors-Crop Alp traverse, several gravity models (Berckhemer 1968; Ménard & Thouvenot 1984; Bayer et al. 1989; Rey et al. 1990) have been published showing different solutions for the Ivrea anomaly. Due to serpentinization of peridotites, the gravity method cannot determine the exact amount of upper-mantle involved in this complex structure. However the lithospheric cross-section along the Ecors-Crop Alp of fig. 8-4 fits the gravity data as shown by the gravity model in fig. 8-9, which fol-lows the same profile as the model from Bayer et al. (1989, fig. 4). The low density Molasse and Po basins were introduced in the model, but not the dense ophiolitic bodies. The latter are probably responsible
Fig. 8-6: Lithospheric cross-section along the Eastern traverse. Ad = Adula nappe; Lu = Lucomagno nappe; Sä = Säntis nappe; Si = Simano nappe; Ta = Tambo nappe; see also abbreviations of previous figures.
����
������������������������������������������
����������������������������������������
������� ������������������������� �������� ���������
��������������������
���������������������������� ����������������������������
�������������
�����������������������
�������������
��������������������
��������������������
��������
��
��
���
�����
����
�������
��������� ���� �������
���
��
���
���
���������
� �
��������

- 105 -
in the Internal Alps for the slight differences between the observed and calculated anomalies. This gravity model is quite similar to the models published by Bayer et al. (1989, fig. 4) or Rey et al. (1990, fig. 8c), but for the effects of the upper-mantle which was not taken into account in their models.
The Western gravity profile (fig. 8-10) ap-proximately follows the cross-section of fig. 8-5. Its southern end joins the eastern extension of the
Ecors-Crop Alp deep seismic line. The low density Molasse and Po basins were introduced in the model as well as the high density ophiolitic bodies in the Internal Alps. Hardly any modifications of the initial model, based on the seismic interpretation (fig. 7-17), were necessary to get an excellent fit between the calculated and observed Bouguer anomaly. A major upwards flexure of the Adriatic crust just south of the Insubric line is necessary to bring the high density Adriatic upper-mantle close to the surface in order
Fig. 8-7: Map of the Bouguer anomaly in the Western Alps for a reference density of 2.67 g/cm3. After Klingelé et al. (1992, full curves) and after Rey et al. (1990, dotted curves).
����
����
����
����
����
����
����
����
����
����
����
���
���
���
���
���
���
���
���
���
���
���
���
�
��
��
�� ����
�����
Germany
AustriaSwitzerland
France
Italy
Fr.
Genova
11°E
44°N
7°E
47°N
50 km
NBern
Milano
Lausanne
Genève
Zürich

- 106 -
to match the Ivrea gravity anomaly. The near-surface ophiolitic bodies play a significant role for second order anomalies.
This model was then modified so to test the gravity anomaly produced by other interpretations of this traverse, such as the one of Valasek (1992, fig. 8-12) shown in this study in fig. 5-30. This alternative gravity model (fig. 8-11) has an Adriatic upper-crust reaching up to the Insubric Line and an Adriatic lower-crust extending up to the External Crystalline Massifs, thus inducing quite a different structure for the Adriatic upper-mantle. The gravity response of this model is far from matching the observed gravity
anomaly, in particular in the Internal Alps and near the Ivrea anomaly. Thus, such an interpretation is incompatible with the gravity data.
Gravity modelling was also carried out along the Central traverse (fig. 8-12) which crosses the northern end of the Ivrea gravity anomaly (fig. 8-7). This model, based on the deep seismic interpretation of fig. 7-20, is similar to the Western traverse, but for the Adriatic plate which shows a more pinched-out lower-crust (the Ivrea zone) and a thicker upper-crust, which is consistent with surface observations. The slight mismatch between the observed and calculated anomaly occurring near the transition of the Helvetic
Fig. 8-8: Densities used for gravity modelling, as a function of the depths at which the main bodies are sub-

- 107 -
Fig. 8-9: Gravity model along the Ecors-Crop Alp traverse.
� �� �� �� �� ��� ��� ��� ��� ��� ��� ��� ���
����
���
���
�
���������������
�������������
�
��
��
���
���
��
��
���
���
���������������������
����������������������
��������������������
���������������
������������
������������
��������������������
���� ��������������� ������������� ������������� ����������������������� ������� ������ ��������� ����� ��������
�������������������������������������������������
� �
� �� �� �� �� ��� ��� ��� ��� ��� ��� ��� ���
�����
���� ���� ���� ���� ���� ������������ ������������������������������
���
����
����
���
����
���
���
�����
��
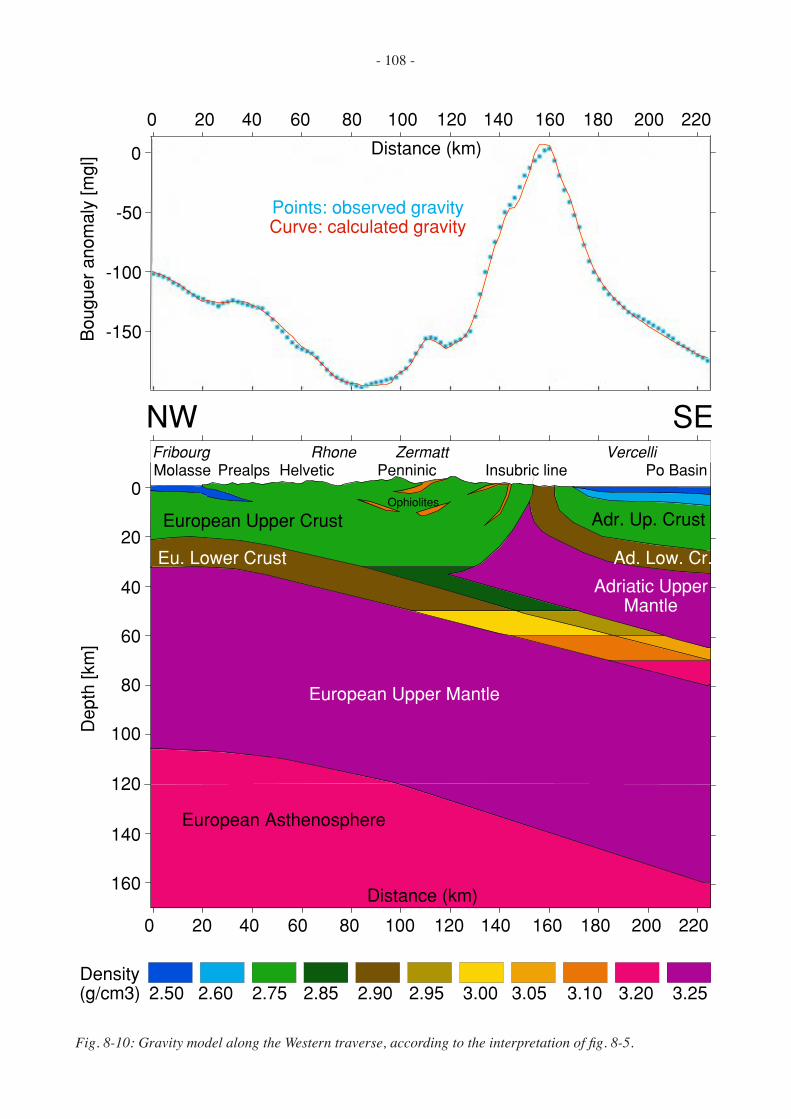
- 108 -
Fig. 8-10: Gravity model along the Western traverse, according to the interpretation of fig. 8-5.
�� �� �� �� ��� ��� ��� ��� ��� ��� ���
�
��
��
���
����������������
���� ���� ���� ���� ���� ���� ���� ���� ���� ����������������������
����������������������
���������������������
��������������������
���������������
��������������������
��������������
������������
������� ��������
����������
������� �������� �������� ��������������������� ����� ������� ��������
�
��
��
���
���
�� ��
�
���
����
����
�������������������������������������������������
�������������
�� �� �� �� ��� ��� ��� ��� ��� ��� ����
���
�����
��
���
����
����
���
����
���

- 109 -
Fig. 8-11: Gravity model along the Western traverse, according to the interpretation of Valasek (1992, fig. 8.12) shown in this study in fig. 5-30.
�� �� �� �� ��� ��� ��� ��� ��� ��� ����
�
��
��
���
���
���
�����
��
�������������
����������������������
���������������������
��������������������
���������������
��������������������
������������
������� ��������
����������
������� �������� �������� �������������
�������� ����� ������� ��������
��
��
���
���
�
���
���
���
����
����
���
����
����
�������������������������
�������������
�� �� �� �� ��� ��� ��� ��� ��� ��� ����
���� ������������������������
�� ��
���� ���� ���� ���� ���� �������� ����
�������
�������
���������������������
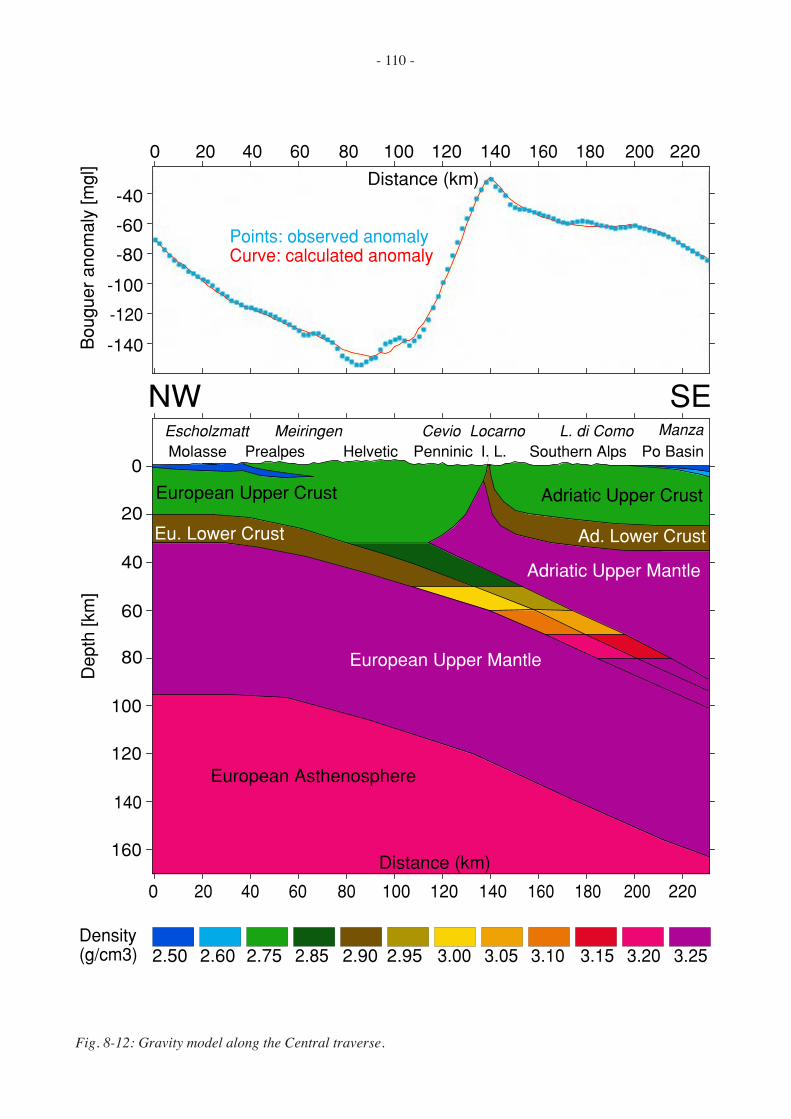
- 110 -
Fig. 8-12: Gravity model along the Central traverse.
���� ���� ���� ���� ���� ���� ���� ���� ���� ���� ����������������������
� �� �� �� �� ��� ��� ��� ��� ��� ��� ���
����
����
����
���
���
����������������
� �� �� �� �� ��� ��� ��� ��� ��� ��� ���
�������������
�
��
��
���
���
���������������������
����������������������
��������������������
���������������
��������������������
���������������
���������������������
������� ���������������� �������� �������� ����� ������������������������ ��������� ����� ������� ���������� �����
��
��
���
���
�������������������������������������������������
�� ��
���
�����
��
���
����
����
���
����
���

- 111 -
to the Penninic domain could be due to heterogeneities in the External Crystalline massifs and/or to some ophiolitic relicts of the Valais ocean.
The Eastern gravity model (fig. 8-13) follows the same profile as the one Schwendener and Muel-ler (1990) used for their model showing an elliptical high density body in the upper-mantle under the Po plain. This profile is almost coincident with the crustal-scale interpretation of fig. 7-25, which follows the EGT and the E1 deep seismic profile. Holliger and Kissling (1992) have recently published a lithos-pheric gravity model in the same area, but it shows a rather poor fit between the observed and calculated anomaly. Similarly to the gravity model of fig. 6-17, the relatively low density (2.70 g/cm3) Tertiary granitic intrusions near Morbegno are represented on the model. The strong positive Bouguer anomaly on the southern end of the model is not due to the Ivrea mantle body but to a significant flexure of the Adriatic crust, squeezed between the Southern Alps and the Northern Apennines. The intensity of this flexure increases towards the east. Thus this section shows a very different configuration of the Adriatic plate against the Insubric line in comparison with the two previous models. The Adriatic Moho is here bending downwards against the European plate. This switch from an Adriatic Moho bending upwards, over a distance of 200 km from Cuneo to Locarno, to an Adriatic Moho bending downwards along the EGT must occur rather rapidly, over a distance of less than 50 km, as shown by the Bouguer anomaly map (fig. 8-7) or by the 3-D gravity model from Kissling (1984).
8.5 Discussion
When calibrated by seismic interpretations, grav-ity modelling becomes a powerful interpretation tool, as the infinite number of possible density models is drastically reduced. It is thanks to gravity modelling
that the size of the Adriatic indenter was calibrated for the crustal-scale interpretations along the Alpine deep seismic traverses (fig. 7-6, 7-17, 7-20, 7-25). However the solutions offered by this gravity modelling must be considered only rough approximations:
- Although limited lateral extensions were intro-duced for some bodies (i.e. the Ivrea mantle body), such a 2.5-D modelling is not as precise as a true 3-D gravity modelling.
- The control on densities, although constrained by the seismic interpretations, is not perfect, in par-ticular for the uplifted Ivrea upper-mantle which can be affected by serpentinization (see § 4.3.4).
- The depth of the lithosphere-asthenosphere transition is approximate (see § 8.2) and the Earth curvature was not introduced on the gravity models. However these two facts have little influence on the crustal structures, as their effects correspond to low-amplitude anomalies with a very long wave length.
Nevertheless gravity modelling can help to deter-mine the plausibility of different seismic interpreta-tions. For instance, the crustal-scale interpretations published by Valasek (1992) along the PNR/NFP-20 Western and Central deep seismic traverses are in-compatible with the gravity data (see fig. 8-11). They show a huge indenter made of Adriatic lower-crust (instead of upper-mantle as on the interpretations presented here) which causes in the Internal Alps a gravity anomaly 80 mgl smaller than the observed anomaly. Furthermore such a model lacks a high-density body capable of causing the very strong Ivrea positive anomaly.
Now that the present lithospheric structures of the Western Alps have been determined, one can try to understand how these were brought about. This will be the subject of the next chapter.
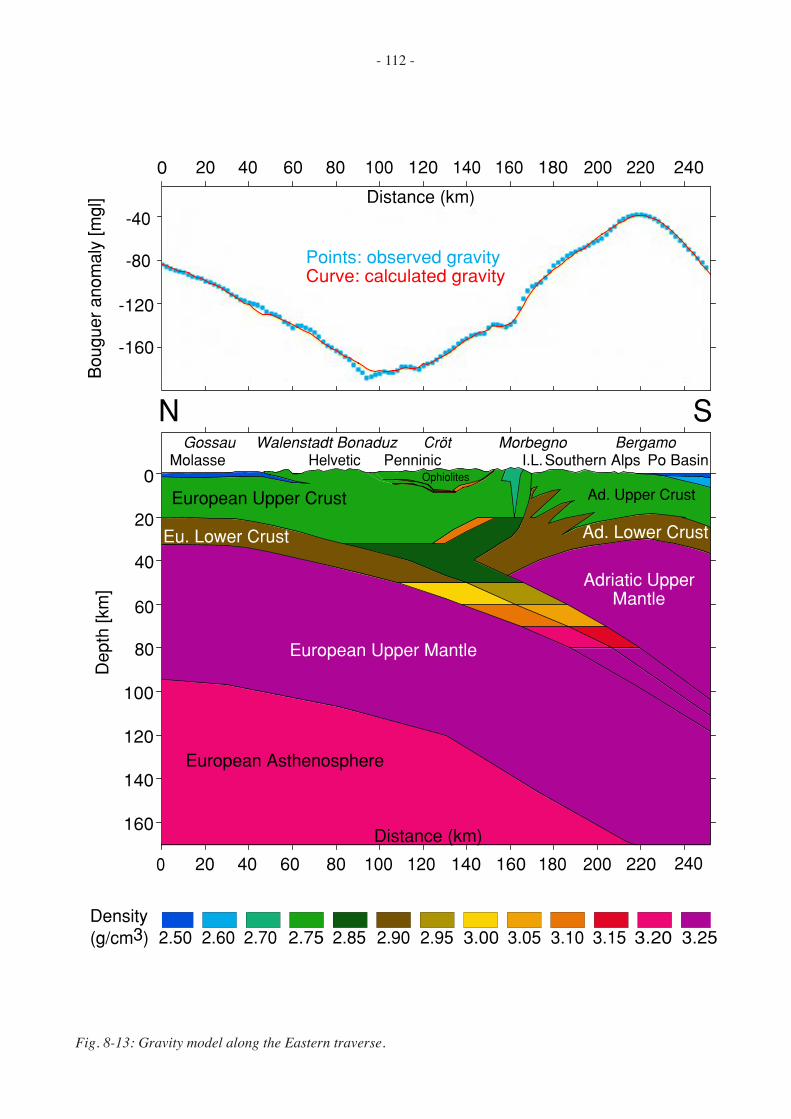
- 112 -
Fig. 8-13: Gravity model along the Eastern traverse.
���� ���� ���� ���� ���� ���� ���� ������������ ��������������������������
����������������
���
����
����
�� �� �� �� ��� ��� ��� ��� ��� ��� ��� ����
�������������
������� �������� �������� ����������������� ��������
��������������������
���������������
���������������������
��������������������
���������������
���������������
����������������������
����������
������ ���������� ������� ������������ �������
�������������������������������������������������
� �
�� �� �� �� ��� ��� ��� ��� ��� ��� ��� ����
�
��
��
��
��
���
���
���
���
���
�����
��
���
����
����
���
����
���
- 113 -
9.1 Introduction
Another approach to understand the deep struc-tures of the Alps is through palinspastic reconstruc-tions, starting at the initial stage of the orogenic cycle and then rebuilding the Alps at a lithospheric-scale on the basis of surface geology. The approach here is based on the most up-to-date works done on this subject (Stampfli & Marthaler 1990; Favre & Stampfli 1992; Stampfli et al. 1991; Stampfli 1993). These reconstructions show two important aspects rarely taken into account in other similar studies: they use actualistic geodynamic models (for example asym-metrical rifting) and they highlight the importance of lateral movements through plate cinematics. In particular they consider the Adriatic micro-continent to be an independent plate rather than a promontory of the African continent and the Briançonnais and Austroalpine as exotic terrains.
9.2. From rifting to passive-margin stage
Asymmetrical rifting, as proposed by Favre and Stampfli (1992) and derived from the “simple shear” model (Wernicke 1985), creates two very different types of passive margins (Stampfli & Marthaler 1990):
- a lower-plate margin: composed mainly of a substantial series of tilted blocks, a preserved lower-crust and a thick upper-mantle reaching the surface at the foot of the margin (denudated upper-mantle), as found actually at the foot of the Galician margin (e.g. Whitmarsh & Sawyer 1993),
- an upper-plate margin: composed by contrast mainly of upper-crust (showing many landward ori-ented faults), a considerably thinned lower-crust and very little upper-mantle.
Due to their different lithospheric structure, these two types of passive margins will show once involved in a collision a very different rheological behaviour. Structures, sedimentation, thermal history and crustal composition of these two types of margins will be rather different and therefore on the basis of such observations it can be possible to determine
the type of margin one is dealing with. Such a study was undertaken by Stampfli and Marthaler (1990) in the Alps and they came to the conclusion that an inversion of the orientation of the initial break-away fault took place during the opening of the Piemont ocean. Hence the south-western Adriatic margin is of lower-plate type (fig. 9-1a) and the north-eastern part of upper-plate type (fig. 9-1b). Such an inversion of the detachment fault has been observed elsewhere and is related to important continental transform faults acting during the rifting phase (Bally 1984). Here the continental transform fault could be related to the future Valais initial break-away fault.
On the Middle Jurassic map of fig. 9-1c, the dif-ferent segments of the three lithospheric cross-sections (Ecors-Crop Alp, PNR/NFP-20 Western and Eastern traverses) are located. Due to significant lateral move-ments, in particular the early Cretaceous opening of the Valais ocean, which will push the Briançonnais terrain to the east (Stampfli 1993), and the Cretaceous westward motion of the Austroalpine terrain, the cross-sections are segmented into at least four parts: European, Briançonnais (or Iberic s.l.), Austroalpine and Adriatic (their Apenninic segment is not taken into account here). The Adriatic segments of the Ecors-Crop Alp and Western traverses are located on the lower-plate margin whereas the Eastern traverse segment is on the upper-plate, close to the margin inversion. At this time the Austroalpine terrain is still fixed to the Adriatic plate and the location of the cross-sections well reflects the different composition of the Austroalpine nappes along the traverses. The Austroalpine segment of the Ecors-Crop Alp traverse is situated on the lower-plate margin and therefore the Lanzo peridotites can be regarded as part of the up-per-mantle. The Western traverse segment, composed mainly of lower-crust (part of the Sesia zone and Valpelline series) and tilted blocks (the Arolla series and the Mont Dolin breccias) is still on the lower-plate margin but nearer to the margin inversion. Whereas the Eastern traverse Austroalpine nappes are located on the transition of a lower- to an upper-plate margin (Favre & Stampfli 1992). The lithospheric structures of the different Adriatic and Austroalpine segments can be deduced from fig. 9-1.
§ 9. Palinspastic reconstructions

- 114 -

- 115 -
The corresponding European and Briançonnais segments are found over 600 kilometres further to the west (fig. 9-1c). The Early Cretaceous opening of the Northern Atlantic ocean will induce eastward translation and a rotation of the Iberic plate (Favre & Stampfli 1992). The Iberic plate will push the Briançonnais promontory eastward into the Piemont ocean, causing the opening of the transtensional Val-ais ocean and the beginning of the subduction of the Piemont ocean (Stampfli 1993), as illustrated by the small Jurassic-Cretaceous map of fig. 9-2a.
9.3 Oceanic-subduction stage
The main map of fig. 9-2b shows the situation during the Late Cretaceous, where both the Valais and Piemont oceans are subducted. From the Jurassic, the Briançonnais terrain has moved about 300 km eastward relative to Europe (Stampfli 1993) and the Austroalpine terrain about 150 to 200 km westward in relation to Adria (Trümpy 1992 and ref. therein). In fact, the Austroalpine terrain was probably pre-vented by the Dinaric-Pelagonian plate from moving eastward together with the Adriatic plate. This means that more than 600 km of strike-slip movements took place along the Piemont subduction zone, as can be deduced from the map in fig. 9-1c. These considerable strike-slip movements, mainly transpressional, but which can even be locally transtensional (Merle & Ballèvre 1992), are probably the main cause for the exhumation of the high-pressure eclogites related to the Piemont subduction zone. Rather than invoking mechanism such as “corner flow” (Cowan & Silling 1978) to explain the rapid exhumation of these ec-logites (Michard et al. 1993, and ref. therein) these considerable strike-slip movements are just as likely to exhume rapidly deep-seated slabs of rocks in ductile conditions, in the same way as flower structures, in brittle conditions, are able to locally expel wedges in pop-up structures.
In fig. 9-2c, a 3-D diagram illustrates the Late Cretaceous situation along the Eastern and Western traverses. This diagram underlines the considerable lateral movements which took place during the sub-duction. For example at this time, the Briançonnais segment of the Eastern traverse was subducted below
the Adriatic segment of the Western traverse. Along the Valais subduction zone, the European margin started to be subducted and it will later undergo high-pressure metamorphism during the Late Creta-ceous-Early Paleogene period. In the middle of the Piemont and Valais subduction zones, the northern part of the Briançonnais terrain was covered with the sedimentation of the Couches Rouges basin.
Along the Piemont subduction zone, the units, which suffered high-pressure metamorphism during the Early Cretaceous period, are being exhumed in a large-scale flower structure, affecting not only the accretionary prism but also the units below (the southern Briançonnais margin) and above (the Aus-troalpine terrain). An interesting feature along the proto-Insubric line is the different configuration of the Adriatic plate. On the Western traverse, the Adriatic segment, which was a lower-plate margin, had its upper-mantle eroded at surface, as the presence of chromite in the Varesotto flysch suggests (Bernoulli & Winkler 1990). Thus the Adriatic Moho is already bent towards the surface (Stampfli & Marthaler 1990), similar to the present situation on the deep seismic profiles which cross the Ivrea mantle body. This fact is further corroborated by cooling ages (Hunziker et al. 1993) which reveal that the Ivrea zone was already partly uplifted since 180 Ma. On the contrary, along the Eastern traverse segment (a former upper-plate margin which had its margin truncated by the proto-Insubric line), the Adriatic Moho is situated at a normal depth of around 30 km. This is also confirmed by cooling ages (Hunziker et al. 1993) measured in the Southern Alps: no significant uplift affected this area since 230 Ma. So already before the Tertiary, the structure, and therefore the rheological behaviour of the future Adriatic indenter is very different along the Eastern traverse compared with the other traverses situated further to the west.
9.4 Continental-collision stage
9.4.1 INTRODUCTION
This stage can be subdivided into three main phases, the first one corresponding to the meso-al-pine crustal subduction. This Eocene phase, which
Fig. 9-1: Palinspastic reconstructions at the Middle Jurassic; a: cross-section of the Adriatic lower-plate margin; b: cross-section of the Adriatic upper-plate margin; c: map view (after Stampfli 1993), showing the location of the various segments (-E: European, B: Briançonnais, -a: Austroalpine, -A: Adriatic) of the three lithospheric cross-sections of fig. 8-4 to 8-6 (A-: Ecors-Crop Alp, W-: Western, E-: Eastern).

- 116 -

- 117 -
followed the Paleocene relative lull (or “Paleocene restoration”; Trümpy 1980a), was accompanied by strong regional metamorphism and major defor-mational events with dominant NW-vergent folds and thrusts. This phase is not illustrated here, but it can be partly deduced by comparing the Late Cre-taceous (fig. 9-2) and Middle Oligocene (fig. 9-3 to 9-5) reconstructions. The next and last two phases can be directly related to oceanization events in the Western Mediterranean Sea, which induced signifi-cant rotations and translations of the Adriatic plate. Therefore the first of these two events is called the “Algero-Provençal phase” (from 30 to 15 Ma) and the second the “Tyrrhenian phase” (from 15 to 0 Ma), corresponding respectively to the opening and spreading of these two small oceans.
9.4.2 THE ALGERO-PROVENÇAL PHASE (30 TO 15 MA)
The continental collision is illustrated here (fig. 9-3 to 9-5) with reconstructions during the Middle Oligocene (30 Ma). This period is characterised by intense magmatic activity, part of which is directly linked to the Algero-Provençal rift (Provence and Sardinia) and another part occurs along the Insubric line. In fact there could well be a relation between these two magmatic zones (Stampfli, pers. comm.): the palinspastic map (fig. 9-3) shows that at 30 Ma the magmatic activity along the Insubric line is situ-ated in the prolongation of the Algero-Provençal rift and furthermore the Algero-Provençal initial break-away fault has the same orientation (dipping to the SE) as the Insubric line at this period. Therefore the Algero-Provençal transtensional phase could well have favoured the ascent of magma along the Peri-adriatic lineament.
Argand in 1911 had already realised that the present position of the north-dipping Insubric line is in fact in an overturned position due to intense backfolding. This is why it is restored in a south-dipping position (fig. 9-4) and, as mentioned above, if a possible connection with the Algero-Provençal rift initial break-away fault existed, this connection could have favoured the ascent of magmas along the Insubric line.
However this extensional event along the In-subric line was very short as the triangular opening of the Algero-Provençal ocean is accompanied by a significant rotation of the Adriatic plate (with a rotation pole situated near Genoa). This will rapidly invert the transtensional regime along the Insubric line into intense transpression. More or less at the same time, due to the overthrusting of the Adriatic plate, a significant flexure of the European plate occurs, as witnessed by the emerged region situated between the (flysch-) Molasse basin and the Paris basin. The axis of flexure of the European plate approximately follows the position of the Rhine, Bresse and Limagne grabens which are active at this time, suggesting a cause and effect relation (Stampfli, pers. comm.).
Fig. 9-4 depicts this Middle Oligocene situation along the Western traverse. The depth of most units can be roughly constrained by cooling ages (Hunziker et al. 1993). At this time, no significant backfolding has affected the units, which show dominant north-vergent folds and thrusts. Mass-balancing since the Cretaceous period implies that quite a substantial amount of the Briançonnais and Austroalpine terrains (together with relicts of the Valais and Piemont oceans) must be found at depth. Most of this material will be further subducted at even greater depths (the Alpine Root zone) together with the European lithosphere. Some subducted material could also have been underplated under the Adriatic plate. It is also most probable that some slabs of upper-mantle got incorporated in this continental accretionary prism, such as the Lanzo peridotitic unit (corresponding to the abbreviation AUM in fig. 9-4), which is interpreted as issued from the western Austroalpine lower-plate margin.
But for the Adriatic plate, the Middle Oligocene situation along the Eastern traverse (fig. 9-5) is rather similar, although the size of the Briançonnais terrain is getting smaller. Here again cooling ages (Steck & Hunziker 1992) help to determine the approximate depth of several units such as the Adula and the Bri-ançonnais nappes. Taking this data into account, the result of the reconstruction is quite different from the one recently published by Pfiffner (1992, fig. 6-26) for exactly the same cross-section and for the same period. Pfiffner locates at 30 Ma the Suretta nappe
Fig. 9-2: a: Map at Jurassic-Cretaceous boundary showing the motion of the Iberic plate (after Favre & Stampfli 1992). b: Palinspastic map at the Late Cretaceous. Abbreviations: see previous figures. c: Late Cretaceous reconstructions along the various segments of the Eastern and Western traverses. AUM = Austroalpine upper-mantle; BB = Briançonnais basement; BUM = Briançonnais upper-mantle; BLC = Briançonnais lower-crust; EUC = European upper-crust; Po = Pontis nappe; MF = Mont Fort nappe; see also abbreviations of previous figures.
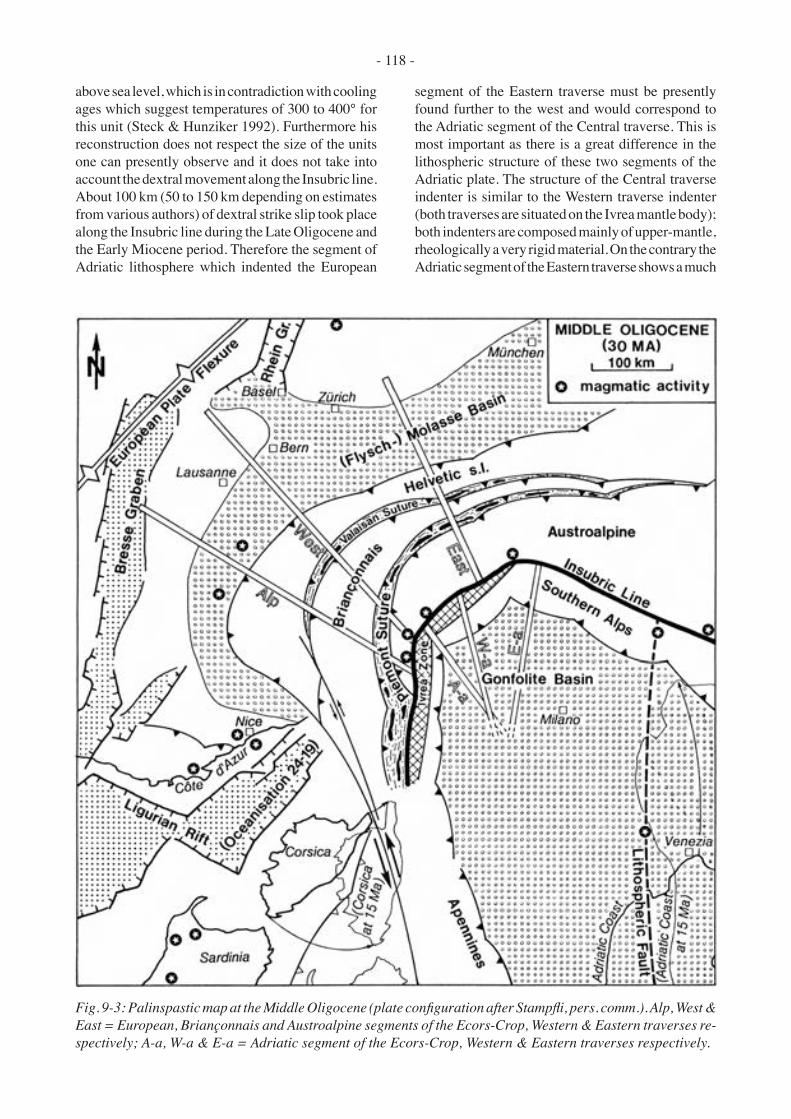
- 118 -
above sea level, which is in contradiction with cooling ages which suggest temperatures of 300 to 400° for this unit (Steck & Hunziker 1992). Furthermore his reconstruction does not respect the size of the units one can presently observe and it does not take into account the dextral movement along the Insubric line. About 100 km (50 to 150 km depending on estimates from various authors) of dextral strike slip took place along the Insubric line during the Late Oligocene and the Early Miocene period. Therefore the segment of Adriatic lithosphere which indented the European
segment of the Eastern traverse must be presently found further to the west and would correspond to the Adriatic segment of the Central traverse. This is most important as there is a great difference in the lithospheric structure of these two segments of the Adriatic plate. The structure of the Central traverse indenter is similar to the Western traverse indenter (both traverses are situated on the Ivrea mantle body); both indenters are composed mainly of upper-mantle, rheologically a very rigid material. On the contrary the Adriatic segment of the Eastern traverse shows a much
Fig. 9-3: Palinspastic map at the Middle Oligocene (plate configuration after Stampfli, pers. comm.). Alp, West & East = European, Briançonnais and Austroalpine segments of the Ecors-Crop, Western & Eastern traverses re-spectively; A-a, W-a & E-a = Adriatic segment of the Ecors-Crop, Western & Eastern traverses respectively.

- 119 -
Fig.
9-4
: Rec
onst
ruct
ion
at th
e M
iddl
e O
ligoc
ene
alon
g th
e W
este
rn tr
aver
se. A
n =
Ant
igor
io n
appe
; ML
= M
onte
Leo
ne n
appe
; Pr =
Pre
alpi
ne u
nits
, Ve
= V
eram
pio
napp
e; se
e al
so a
bbre
viat
ions
of p
revi
ous fi
gure
s.

- 120 -
Fig.
9-5
: Rec
onst
ruct
ion
at th
e M
iddl
e O
ligoc
ene
alon
g th
e Ea
ster
n tr
aver
se. A
LC =
Aus
troal
pine
low
er-c
rust
; see
als
o ab
brev
iatio
ns o
f pre
viou
s figu
res.

- 121 -
“softer” indenter, made of mainly crustal material. The map of fig 9-6 shows the trajectory followed by this rigid indenter, i.e. the Ivrea mantle body, since the Middle Oligocene (30 Ma). The trajectory followed by the Ivrea mantle body coincides perfectly with the presence of the intense backfolding which occurred just north of the Insubric line, and there is no doubt that this intense backfolding is due to the indenta-tion of this rigid body. East of the Middle Oligocene position of the Ivrea mantle body, the intensity of this backfolding decreases sharply together with the decrease of the rigidity of the Adriatic indenter.
Once the rigid wedge had indented the European segment of the Eastern traverse and moved further to the west, a more ductile portion of the Adriatic plate, made of mainly lower-crust, moved into the gap created by the westward movement of the rigid indenter. The main argument of those who advocate
the presence of a huge wedge of Adriatic lower-crust along the Eastern traverse (the size of this wedge is believed here to be much smaller, see fig. 7-25) is based on lithospheric mass-balancing of the Adriatic plate on the basis of the shortening of the upper-crust in the Southern Alps (Pfiffner et al. 1991; Schönborn 1992; Schmid 1992). In fact their mass-balancing does not take into account the asymmetry of the Piemont rift which partly thinned the lower-crust and upper-mantle of this segment of the Adriatic plate (a former upper-plate margin). Secondly they do not consider the portion of lower-crust and upper-mantle which was cut off the Adriatic plate by the south-vergent proto-Insubric line. In the third place, their mass-balancing is based on thin-skinned tectonic models (Schönborn 1992) which do not reflect the ductility of the defor-mation which took place at depth. Furthermore they do not consider the strike-slip component, which has caused a lateral stacking of the units. If these facts
Fig. 9-6: Tectonic sketch-map showing the motions of the Adriatic rigid indenter from 30 Ma to present. 1 = movement of the rigid indenter (mainly the Ivrea mantle body) from 30 to 15 Ma; 2 = area affected by back-folding from 30 to 15 Ma; 3 = present position of the Ivrea gravity anomaly defined by the 40 mgl isoline; 4 = movement of the rigid indenter (mainly the “mantle slice”) from 15 to 0 Ma; 2 = area affected by backfolding from 15 to 0 Ma; A-R = Aiguilles Rouges massif; GL = Giudicarie line; VVL = Villalvernia-Varzi-Levanto line; see also abbreviations of previous figures.

- 122 -
are taken into account, the result of mass-balancing favours a much smaller Adriatic lower-crust wedge, as shown in fig. 7-25 or 8-6.
9.4.3 THE TYRRHENIAN PHASE (15 TO 0 MA)
A slowing down of extensional activity in the Western Mediterranean occurred between the end of the Algero-Provençal oceanization around 19 Ma (Burrus et al. 1985) and the beginning of extension in the Tyrrhenian Sea (see fig. 9-7) around 12 Ma (Blundell et al. 1992b). A similar decrease in deforma-
tion activity seems to have occurred in the Western Alps, where cooling ages (Steck & Hunziker 1992) and structural data (e.g. Steck 1990, fig. 4) clearly demonstrate two distinct backfolding phases. The generation of backfolds, affecting mainly the area just north of the Insubric line, had an intensity peak between 25 and 18 Ma (Steck & Hunziker 1992) and, as mentioned above, it can be directly related to the indentation of the rigid Ivrea mantle body, an indentation itself related to the rotation and transla-tion of the Adriatic plate due to the opening of the Algero-Provençal ocean.
Fig. 9-7: Palinspastic map at the Middle Miocene showing the main movements occurring from 15 to 0 Ma (plate configuration after Stampfli, pers. comm.). See abbreviations of previous figures.
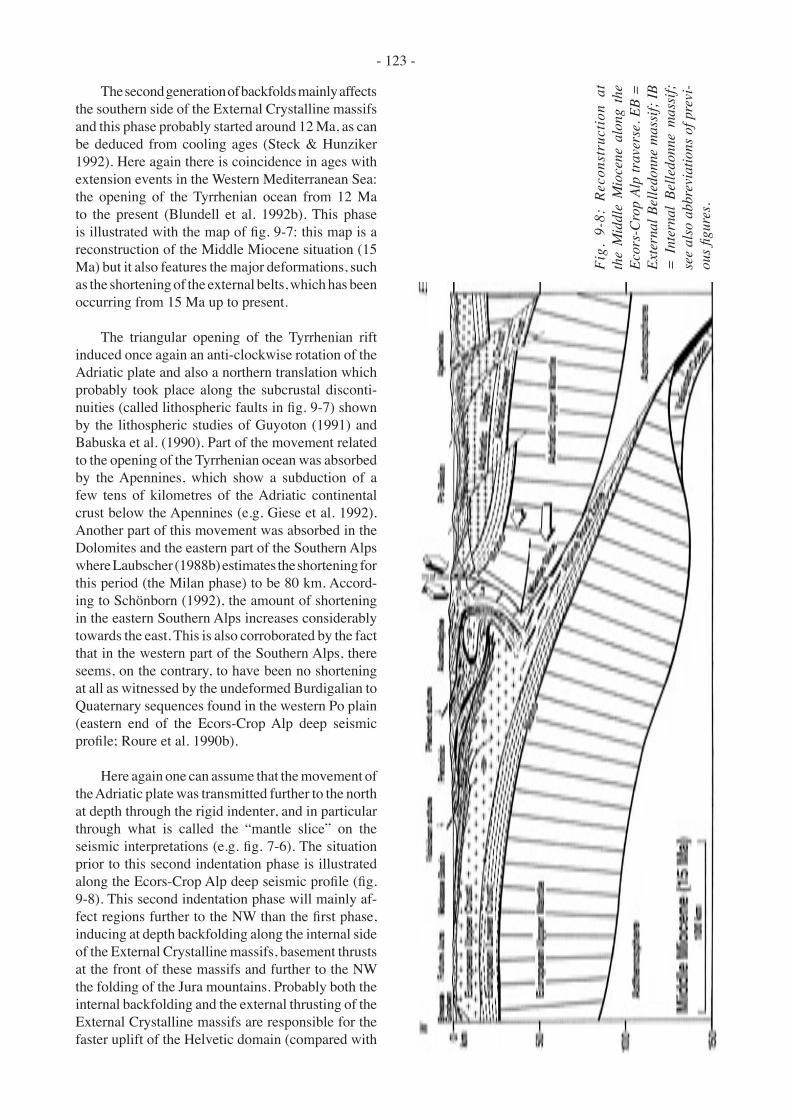
- 123 -
The second generation of backfolds mainly affects the southern side of the External Crystalline massifs and this phase probably started around 12 Ma, as can be deduced from cooling ages (Steck & Hunziker 1992). Here again there is coincidence in ages with extension events in the Western Mediterranean Sea: the opening of the Tyrrhenian ocean from 12 Ma to the present (Blundell et al. 1992b). This phase is illustrated with the map of fig. 9-7: this map is a reconstruction of the Middle Miocene situation (15 Ma) but it also features the major deformations, such as the shortening of the external belts, which has been occurring from 15 Ma up to present.
The triangular opening of the Tyrrhenian rift induced once again an anti-clockwise rotation of the Adriatic plate and also a northern translation which probably took place along the subcrustal disconti-nuities (called lithospheric faults in fig. 9-7) shown by the lithospheric studies of Guyoton (1991) and Babuska et al. (1990). Part of the movement related to the opening of the Tyrrhenian ocean was absorbed by the Apennines, which show a subduction of a few tens of kilometres of the Adriatic continental crust below the Apennines (e.g. Giese et al. 1992). Another part of this movement was absorbed in the Dolomites and the eastern part of the Southern Alps where Laubscher (1988b) estimates the shortening for this period (the Milan phase) to be 80 km. Accord-ing to Schönborn (1992), the amount of shortening in the eastern Southern Alps increases considerably towards the east. This is also corroborated by the fact that in the western part of the Southern Alps, there seems, on the contrary, to have been no shortening at all as witnessed by the undeformed Burdigalian to Quaternary sequences found in the western Po plain (eastern end of the Ecors-Crop Alp deep seismic profile; Roure et al. 1990b).
Here again one can assume that the movement of the Adriatic plate was transmitted further to the north at depth through the rigid indenter, and in particular through what is called the “mantle slice” on the seismic interpretations (e.g. fig. 7-6). The situation prior to this second indentation phase is illustrated along the Ecors-Crop Alp deep seismic profile (fig. 9-8). This second indentation phase will mainly af-fect regions further to the NW than the first phase, inducing at depth backfolding along the internal side of the External Crystalline massifs, basement thrusts at the front of these massifs and further to the NW the folding of the Jura mountains. Probably both the internal backfolding and the external thrusting of the External Crystalline massifs are responsible for the faster uplift of the Helvetic domain (compared with
Fig.
9-8
: Re
cons
truc
tion
at
the
Mid
dle
Mio
cene
alo
ng t
he
Ecor
s-C
rop
Alp
trav
erse
. EB
=
Exte
rnal
Bel
ledo
nne
mas
sif;
IB
= I
nter
nal
Belle
donn
e m
assi
f; se
e al
so a
bbre
viat
ions
of p
revi
-ou
s figu
res.

- 124 -
the Penninic domain; Steck & Hunziker 1992) which occurred during the last 10 Ma.
On a map view (fig. 9-7) a very good correlation appears between the intensity of this second indenta-tion phase and the amount of the shortening of the Molasse basin and the Jura belt (amount taken from Burkhard 1990, fig. 7). Furthermore there is also a good correlation with the intensity of the backfold-ing of the External Crystalline massifs which peters out at both ends of the rigid indenter. For instance, along the Eastern traverse where the rigid indenter is not present, hardly any backfolding affected the External Crystalline massifs and only little shorten-ing occurred on the foreland, whereas most of the movement of the Adriatic plate was absorbed by the Southern Alps.
The change in rheology of the indenter can also explain the formation of the Giudicarie sinistral fault system, which is contemporary (Laubscher 1988b) to this second indentation phase. West of the Giudicarie line, the compression was transmitted at depth through the rigid indenter, causing rather intense backfold-ing whereas east of this fault, where the Adriatic indenter shows a much softer rheology (as a former upper-plate margin), the compression was expressed mainly through an overthrusting of the Adriatic crust, shifting the Insubric line 70 km further to the north (Laubscher 1988b) and causing very little backfolding north of this accident; the backfolding being replaced by backthrusting of the Adriatic upper crust.
9.5 Discussion
The deep seismic interpretations presented in the two previous chapters, which are based on a variety of different and often independent data (geophysical
and geological), reveal striking similarities from one line to the other but also many changing features along the alpine strike. These differences underline the non-cylindricity of the Western Alps when considered at a lithospheric-scale. Most of these differences can be explained in the geodynamic evolution of this mountain belt, in particular when the palinspastic reconstructions are based on actualistic geodynamic models (i.e. giving a proper geometry and size to con-tinental margins) and careful positioning of the various micro-plates and terrains involved in the Alpine orog-eny. In particular, it has been shown that an intimate relationship exists between the Jurassic morphology of the Adriatic margin and the present geometry of the Adriatic indenter. Another intimate relationship has been highlighted between the indentation phase and the rotation of the Adriatic plate, a relationship already pointed out by Vialon et al. (1989).
Furthermore the palinspastic reconstructions outline the importance of lateral movements (over 600 km of strike slip along the Piemont subduction zone) during the Alpine orogenic cycle, a fact also emphasised recently by other authors such as Ricou & Siddans (1986), Trümpy (1988 & 1992) and Le Pichon et al. (1988). The importance of these transform movements is such that it makes 2-D mass-balancing along a single Alpine cross-section almost irrelevant, a problem often picked out by Laubscher (1988b, 1990c, 1990d). For a global understanding of the evolution of the Western Alps, 3-D mass-balancing at a lithospheric-scale is essential. A first approach towards this consists in keeping the location of the cross-sections fixed and moving laterally the various plates and terrains from one cross-section to the other, as done by Stampfli (1993), or by sticking to present cross-sections and moving their various segments through space and time as proposed here.

- 125 -
10.1 General remarks
As most conclusions resulting from this study of the deep structures of the Western Alps can be found at the end of the various chapters, they will not be repeated here. They concern either regional geology (along the Western traverse, see § 5; along the Eastern traverse, see § 6); either the Western Alps considered at a crustal (§ 7) or lithospheric (§ 8) level and the building of this mountain belt (§ 9). Inasmuch as the interpretations and models presented here are consistent, probably one of the most out-standing results is the demonstration of the intimate relationship between the present deep structures of the Western Alps and structures inherited from the Tethyan rifting. This study has also shown that a multi-disciplinary approach is essential to decipher deep seismic sections. Interpretations limited to one or two specific fields are likely to yield erroneous conclusions, such as some interpretations (e.g. Valasek 1992) which are based mainly on seismic data and are incompatible with other data such as gravity or surface geology data.
An illustration of this is the interpretation of the Western and Eastern PNR/NFP-20 deep seismic profiles as seen by some geophysicists (Green et al. 1993) who consider the Penninic thrust to be a “lis-tric structure that soles into a gently south-dipping surface at 5-6 s (15-18 km depth)”. The Penninic thrust is actually defined as the boundary between the Ultra-Helvetic domain (the European margin) and the Valais domain (oceanic). Thus the Penninic thrust was active since the Late Cretaceous subduction of the Valais ocean and underwent a long and complex deformational history. The complexity of the Pen-ninic thrust is well illustrated in the area affected by the Berisal synform (see fig. 5-3): the Penninic thrust passes between the Monte Leone nappe, originating from the European margin, and the Pontis nappe (or the Berisal unit), originating from the Briançonnais terrain. It is deformed by several superimposed folding phases and sharply truncated by the Rhone-Simplon line and thus its shape is much more complicated than proposed by Green et al. (1993).
A few more general conclusions (not restricted
to the Western Alps) can be deduced from this study and can be of interest for other deep seismic surveys in compressional areas.
10.2 The origin of reflectivity
One exceptional opportunity offered by this deep seismic survey in the Western Alps is that of correlating deep reflections (down to 25 km) with outcropping geology, something rather uncommon for other deep seismic studies carried out elsewhere. Most of the medium-to-strong amplitude reflections from this survey have been attributed to lithological boundaries and not to mylonitic zones. A lithological boundary can as well be a normal contact inside a structural unit as it can be due to a tectonic contact, like thrusts or shear zones. Mylonites, at least in this area, do not seem to produce any significant reflection (i.e. the Rhone-Simplon line, see § 5.3.2) unless the shear zone juxtaposes rocks with contrasted seismic properties (i.e. the Canavese line which juxtaposes the Sesia crustal zone with the Ivrea mantle body, see 5.4.2). This could well be the reason why no signifi-cant reflections arise under the External Crystalline massifs, where surface geology predicts substantial thrusts. These thrusts juxtapose rocks with no sig-nificant contrast of acoustic impedance.
In several other deep seismic studies, strong reflectors have often been systematically associated with mylonite zones. In this study most of the high-amplitude reflections which could be related to surface geology features are due to lithological contacts, such as marble/gneiss or ophiolite/gneiss contacts (see § 4.3), and not to mylonites.
10.3 Tectonic style of the internal part of an orogen
Another interesting aspect of this survey is that it sounds the internal part of an orogenic belt, which, at the time most of the deformations occurred (meso-alpine), was buried at depths of 10 to 20 km deeper than today. This survey is thus an example of the tectonic style of a deep-seated part of the crust in
§ 10. Conclusions
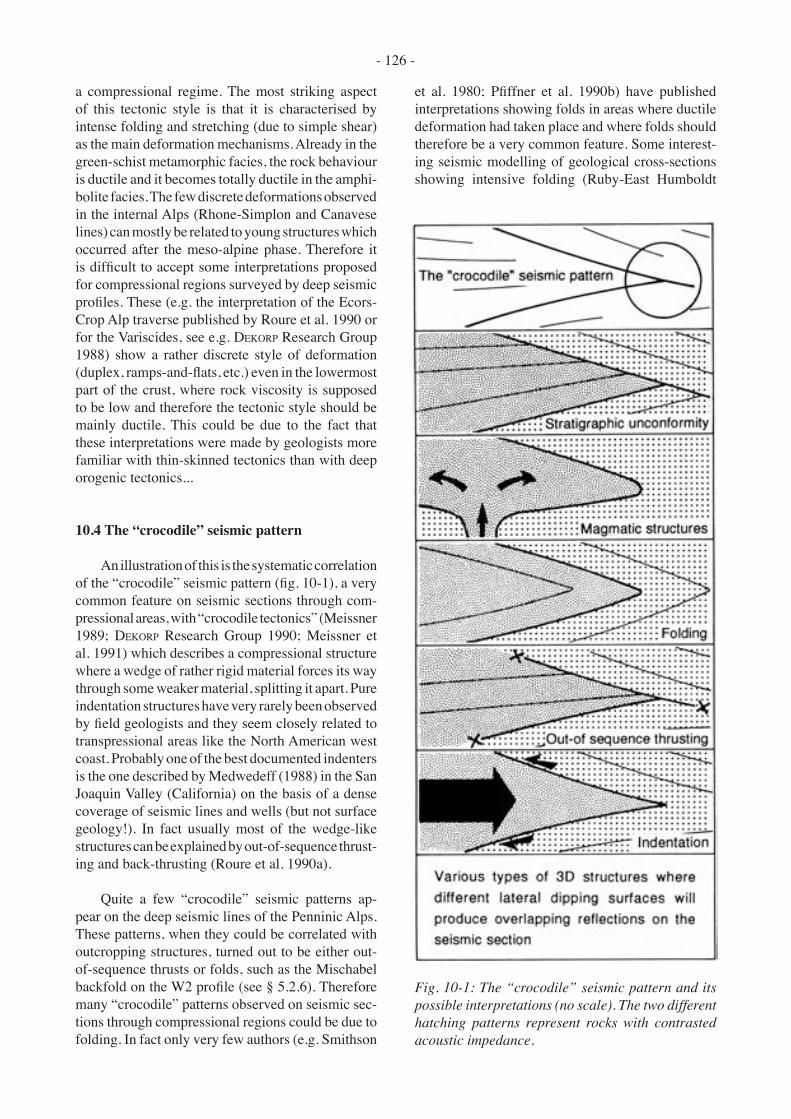
- 126 -
a compressional regime. The most striking aspect of this tectonic style is that it is characterised by intense folding and stretching (due to simple shear) as the main deformation mechanisms. Already in the green-schist metamorphic facies, the rock behaviour is ductile and it becomes totally ductile in the amphi-bolite facies. The few discrete deformations observed in the internal Alps (Rhone-Simplon and Canavese lines) can mostly be related to young structures which occurred after the meso-alpine phase. Therefore it is difficult to accept some interpretations proposed for compressional regions surveyed by deep seismic profiles. These (e.g. the interpretation of the Ecors-Crop Alp traverse published by Roure et al. 1990 or for the Variscides, see e.g. DEKORP Research Group 1988) show a rather discrete style of deformation (duplex, ramps-and-flats, etc.) even in the lowermost part of the crust, where rock viscosity is supposed to be low and therefore the tectonic style should be mainly ductile. This could be due to the fact that these interpretations were made by geologists more familiar with thin-skinned tectonics than with deep orogenic tectonics...
10.4 The “crocodile” seismic pattern
An illustration of this is the systematic correlation of the “crocodile” seismic pattern (fig. 10-1), a very common feature on seismic sections through com-pressional areas, with “crocodile tectonics” (Meissner 1989; DEKORP Research Group 1990; Meissner et al. 1991) which describes a compressional structure where a wedge of rather rigid material forces its way through some weaker material, splitting it apart. Pure indentation structures have very rarely been observed by field geologists and they seem closely related to transpressional areas like the North American west coast. Probably one of the best documented indenters is the one described by Medwedeff (1988) in the San Joaquin Valley (California) on the basis of a dense coverage of seismic lines and wells (but not surface geology!). In fact usually most of the wedge-like structures can be explained by out-of-sequence thrust-ing and back-thrusting (Roure et al. 1990a).
Quite a few “crocodile” seismic patterns ap-pear on the deep seismic lines of the Penninic Alps. These patterns, when they could be correlated with outcropping structures, turned out to be either out-of-sequence thrusts or folds, such as the Mischabel backfold on the W2 profile (see § 5.2.6). Therefore many “crocodile” patterns observed on seismic sec-tions through compressional regions could be due to folding. In fact only very few authors (e.g. Smithson
et al. 1980; Pfiffner et al. 1990b) have published interpretations showing folds in areas where ductile deformation had taken place and where folds should therefore be a very common feature. Some interest-ing seismic modelling of geological cross-sections showing intensive folding (Ruby-East Humboldt
Fig. 10-1: The “crocodile” seismic pattern and its possible interpretations (no scale). The two different hatching patterns represent rocks with contrasted acoustic impedance.
- 127 -
metamorphic core complex in Nevada and the Ivrea zone) was carried out by Hurich and Smithson (1987). The synthetic seismograms they obtained reveal many “crocodile” patterns which, due to defocusing effects, start to look increasingly like lamellae patterns when the folds are situated at greater depths. This defocusing could be a possible explanation of the disappearance of “crocodile” patterns in favour of lamellae reflectors when passing from the upper- to the lower-crust as observed by Meissner (1989).
Therefore folds can also be suitable for “croco-dile” patterns and fig. 10-1 summarises all the geo-logical structures likely to produce such a pattern on a migrated section: stratigraphic unconformities, magmatic structures like laccoliths, folds, out-of-sequence thrusts, indenters and any kind of 3-D structure which can produce overlapping reflections due to lateral arrivals. Therefore interpreters should take a careful look at the “crocodile” pattern before associating it with a geological structure. The scale and shape of the pattern (either a V or a Y shape) and the geological context (sedimentary or crystalline rocks, tectonic style, depth of deformation, etc.), can help in solving this dilemma.
10.5 Do mountain roots disappear?
On the basis of refraction seismology interpre-tations, the Alpine Moho was usually regarded as a continuous surface from the Molasse basin to the Po plain (e.g. Mueller et al. 1980). The continuity of this surface would thus suggest a rejuvenated Moho in the area of the crustal root zone. Furthermore several authors (e.g. Bois & ECORS scientific party 1991; Meissner et al. 1991) have published theories on the disappearance of mountain roots. They compared “old” mountain belts such as the Variscan orogen, where deep seismic surveys show a rather flat and continuous Moho, to “young” mountain belts, such as the Alps or the Pyrenees, where a crustal root is preserved. From this they came to the conclusion that mountain roots disappear with time, due to processes occurring at the crust/mantle boundary, such as metamorphism, material transfer, mechanical deformations, magmatic intrusions, post-collisional collapse, etc. Therefore a rejuvenated Moho (and sometimes a layered lower-crust) is created below “old” orogens and the crustal root disappears.
This study of the Western Alps has shown that although the European Moho is visible on seismic sections only down to a depth of 60 km, this surface continues further at depth, maybe down to 150 km below the Po plain, as interpreted from the tomo-graphical data. Therefore crustal roots in some other orogenic areas could well be much more substantial than suspected on the basis of reflection and refrac-tion seismology surveys.
No evidence of a rejuvenated Moho in the West-ern Alps was detected by the deep seismic profiles or the EGT refraction data. Furthermore, a recent deep seismic survey makes crustal root disappearance im-probable. The BABEL deep seismic sections (BABEL Working Group 1990) shot across the Proterozoic Svecofennian orogen exhibit a crustal root (at least 10 km deep), which was thus preserved for over 1.8 Ga. Hence the absence of crustal roots below some orogens must be explained by model other than a simple disappearance through time.
This other explanation could well be that these orogens, such as the Variscides, never had crustal roots. A crustal root will appear only if a continental plate is subducted and such a subduction is not necessarily the rule; it could even be an exception. A distinction probably needs to be made between orogens resulting from a direct continent-to-continent collision (“con-tinental” orogens) and orogens where exotic terrains, island arcs and big accretionary prisms are involved (“accretionary” orogens). Although a couple of small terrains (the Briançonnais and Austroalpine) are in-volved in the Western Alps, this mountain belt can be regarded as a “continental” orogen in the sense that no substantial island arc or big accretionary prism were present. Thus the compressional stress was directly transferred from the European plate to the Adriatic plate, resulting in the subduction of the European plate and thus the creation of a crustal root.
However, in orogens such as the Variscides and the Appalachians, substantial exotic terrains, island arcs and big accretionary prisms (developed over long periods: 50-100 Ma) were involved. All this material, usually with no lithospheric root and ill defined Moho, could well have absorbed the continental convergence stress and thus no continental subduction occurred, hence the absence of crustal roots.

- 128 -
Due to the multi-disciplinary aspect of this Ph.D. thesis, I am profoundly indebted to a great number of specialists in various fields, who helped me throughout this study. Not only did they share their knowledge on various topics, but they were very generous in providing me with often unpublished information.
Foremost I wish to express my profound gratitude to Gérard Stampfli for having accepted the supervision of my thesis. Gérard has constantly shared his knowledge and I have learned a lot from him. I cannot imagine better working conditions and I am extremely pleased to be able to collaborate with Gérard during the years to come.
My work was also closely followed by Albrecht Steck for whose advice I am deeply obliged, particularly in the field of alpine structural geology. I thank him for his constant support and for the confidence he has invested in me throughout our long years of collaboration.
I spent the first year of my doctorate under the super-vision of Raymond Olivier and I am extremely grateful to him for his constant support and for providing me with all the computer facilities I needed.
I spent two short periods at the Laboratoire de Géo-physique Interne et Tectonophysique in Grenoble, working with Guy Sénéchal and François Thouvenot. Thanks to Guy’s migration programme, which he very generously placed at my disposal, I was able to resolve quite a number of interpretation problems. I warmly thank François Thou-venot and Riccardo Polino (from the University of Torino) for having agreed to be member of my Jury and for their very pertinent remarks and criticisms which served to improve the manuscript.
This Ph.D. thesis is intimately related to the PNR/NFP-20 research programme which founded not only the deep seismic lines but also many other parallel studies in order to decipher the deep structures of the Alps. I would like to thank all the participants of this programme, and in particular its director Peter Lehner, for all these years of thrilling and sometimes challenging research.
I also worked in close collaboration with the GRAN-SIR group (Groupe Romand d’Analyse Numérique de SIsmique Réflexion) based at the Lausanne Geophysical Institut. I wish to thank Luc Du Bois, Brigitte Pruniaux, Lucia Levato, Martin Ouwehand and Souad Sellami for their precious help.
I wish to thank Robert Litak and Larry Brown from the COCORP group for having invited me to Cornell University. Robert introduced me to seismic modelling and this visit turned into a fruitful collaboration.
I am equally obliged to Adrian Pfiffner, from the University of Bern, for having supervised the modelling work along the Eastern traverse, as well as for discus-sions, sometimes controversial but always constructive, where interpretations of the deep structures of the Alps are concerned.
I am also deeply obliged to Thierry Baudin and Didier Marquer, from the University of Neuchâtel, for their help concerning the geology of the Penninic nappes in eastern Switzerland.
The personnel of the Computing Centre of the Uni-versity of Lausanne, and in particular the system-managers Daniel Henchoz ad Michel Muller, went out of their way to help me resolve a number of computing problems.
This work would not have been possible without the support of several software companies. I wish to specially thank GECO-SCHLUMBERGER for their generosity, as well as SIERRA, LCT and CGG.
I am also deeply obliged for the help and advice of my colleagues at the University of Lausanne: Jean-Luc Epard, Arthur Escher, Johannes Hunziker, Philippe Logean, Michel Marthaler, Henri Masson, Alain Pillevuit, Patricia Randrianasolomanana-Lehmann, Benoît Reymond, Mario Sartori and Guido Venturini. In particular I would like to warmly thank Philippe Favre and Maya Simon for having lent me their magnificent chalet throughout the writing of this thesis.
I am equally grateful to Preeta Muthalali and Roy Marchant for having corrected the English, thus consider-ably improving the quality of the manuscript.
I would finally like to thank a certain number of colleagues who did not help me in my work but to whom I devoted months of my assistant lectureship. François Bujan, Gianni Di Marco, Laurent Spring, Christian Talon and Jean-Claude Vannay invited me on their field expedi-tions to places as magnificent as Costa Rica and the Indian Himalayas. My sincere thanks for having shared with me unforgettable moments and for having allowed me to keep in touch with field work.
Acknowledgements

- 129 -
ANSORGE J., MUELLER S., KISSLING E., GUERRA I., MORELLI C. & SCARASCIA S. 1979: Crustal section across the zone of Ivrea-Verbano from the Valais to the Lago Maggiore. Boll. Geofisica Theor. Applic., 21/83, 149-159.
ANSORGE J., HOLLIGER K., VALASEK P., YE S., FINCKH P., FREEMAN R., FREI W., KISSLING E., MUELLER S., SMITHSON S. B. & STÄUBLE M. 1991: Integrated analysis of seismic normal incidence and wide-angle reflection measurements across the Eastern Swiss Alps. In: MEISSNER R., BROWN L., DÜRRBAUM H.-J., FRANKE W., FUCHS K., SEIFERT F. (eds.), Continental lithosphere: deep seismic reflections. Amer. Geophys. Union, Geodyn. Ser., 22, 195-206.
ARGAND E. 1909: L’exploration géologique des Alpes Pennines Centrales. Bull. Soc. Vaudoise Sci. nat., 166, 217-276.
___ 1911: Les nappes de recouvrement des Alpes Pennines et leurs prolongements structuraux. Matér. Carte géol. Suisse N.S., 31, 26 p.
___ 1916: Sur l’arc des Alpes Occidentales. Eclogae geol. Helv., 14/1, 145-191.
___ 1924: Des Alpes et de l’Afrique. Bull. Soc. Vaudoise Sci. Nat., 55/214, 233-236.
BABEL WORKING GROUP 1990: Evidence for early Proterozoic plate tectonics from seismic reflection profiles in the Baltic shield. Nature, 348, 34-37.
BABUSKA V., PLOMEROVA J. & GRANET M. 1990: The deep litho-sphere in the Alps: a model inferred from P residuals. In: FREEMAN R. & MUELLER S. (eds.), The European Geotraverse, part 6. Tectonophysics, 176, 137-165.
BALLY A.W. 1984: Structural styles and the evolution of sedi-mentary basin. Amer. Assoc. Petrol. Geol. Short Course, 238 p.
BARBLAN F. 1992: Relation entre paramètres pétrographiques et paramètres physiques de roches de la croûte continentale intermédiaire à profonde de la zone d’Ivrée. Schweiz. Mineral. Petrogr. Mitt., 72, 69-82.
BATESON G. 1980: Mind and Nature, a necessary unity. Bantam Books, New York.
BAUD A. & SEPTFONTAINE M. 1980: Présentation d’un profil pal-inspastique de la nappe des Préalpes médianes en Suisse occidentale. Eclogae geol. Helv., 73/2, 651-660.
BAUDIN T., MARQUER D. & PERSOZ F. 1992: Basement-cover relationships in the Tambo nappe (Central Alps, Swit-zerland): geometry, structure and kinematics. J. Struct. Geol., in press.
References
BAYER R., CAZES M., DAL PIAZ G. V., DAMOTTE B., ELTER G., GOSSO G., ALFRED H., LANZA R., LOMBARDO B., MUGNIER J.-L., NICOLAS A., NICOLICH R., POLINO R., ROURE F., SACCHI R., SCARASCIA S., TABACCO I., TAPPONNIER P., TARDY M., TAYLOR M., THOUVENOT F., TOREILLES G. & VILLIEN A. 1987: Premiers résultats de la traversée des Alpes oc-cidentales par sismique reflexion verticale (Programme ECORS-CROP). C. R. Acad. Sci. Paris, Sér. II, 305, 1461-1470.
BAYER R., CAROZZO M. T., LANZA R., MILETTO M. & REY D. 1989: Gravity modelling along the ECORS-CROP verti-cal seismic reflection profile through the Western Alps. Tectonophysics, 162, 203-218.
BEARTH P. 1956: Geologische Beobachtungen im Grenzgebiet der lepontinischen und penninischen Alpen. Eclogae geol. Helv., 49, 279-290.
BELLUSO E., BIINO G. & LANZA R. 1990: New data on the rock magnetism in the Ivrea-Verbano Zone (Northern Italy) and its relationship to the magnetic anomalies. Tectono-physics, 182, 79-89.
BERCKHEMER H. 1968: Topographie des “Ivrea-Körpers” abgeleitet aus seimischen und gravimetrischen Daten. Schweiz. Min. Petr. Mitt., 48/1, 235-246.
BERNOULLI D. & WINKLER W. 1990: Heavy mineral assemblages from Upper Cretaceous South- and Austro-alpine flysch sequences (N-Italy and S-Switzerland): source terranes and paleotectonic implications. Eclogae geol. Helv., 83/2, 287-310.
BERNOULLI D., HEITZMANN P. & ZINGG A. 1990: Central and southern Alps in southern Switzerland. Tectonic evolu-tion and first results of reflection seismics. In: ROURE F., HEITZMANN P. & POLINO R. (eds.), Deep structure of the Alps. Mém. Soc. géol. Fr., 156; Mém. Soc. Géol. Suisse 1; Soc. geol. ital., Vol. spec 1, 289-302.
BERNOULLI D. & BERTOTTI G. 1991: The south-alpine sedimentary cover in the southern Ticino region. In: HEITZMANN P. (ed.), Tectonics and deep structure of the Western and Southern Swiss Alps - an excursion guide. NFP/PNR-20 Bulletin, 9, 57-66.
BLUNDELL D. 1992: Europe’s lithosphere - integrated lithospheric cross section. In: BLUNDELL D., FREEMAN R. & MUELLER S. (eds.), A continent revealed - the European Geotraverse. University Press, Cambridge, 102-110.
BLUNDELL D., FREEMAN R. & MUELLER S. (eds.) 1992a: A continent revealed - the European Geotraverse. University Press, Cambridge, 275 p.

- 130 -
BLUNDELL D., MUELLER S. & MENGEL K. 1992b: Geodynamics of Europe. In: BLUNDELL D., FREEMAN R. & MUELLER S. (eds.), A continent revealed - the European Geotraverse. University Press, Cambridge, 215-232.
BOIS C. & ECORS SCIENTIFIC PARTY 1991: Post-orogenic evolu-tion of the European crust studied from ECORS deep seismic profiles. In: MEISSNER R., BROWN L., DÜRRBAUM H.-J., FRANKE W., FUCHS K., SEIFERT F. (eds.), Continental lithosphere: deep seismic reflections. Amer. Geophys. Union, Geodyn. Ser., 22, 59-72.
___ 1990: Major geodynamic processes studied from the ECORS deep seismic profiles in France and adjacent areas. Tectonophysics, 173, 397-410.
BROWN L., BARANZANGI M., KAUFMAN S. & OLIVIER J. 1986: The first decade of COCORP: 1974-1984. In: BARANZANGI M. & BROWN L. (eds.), Reflection seismology: a global perspective. Amer. Geophys. Union, Geodyn. Ser., 13, 107-120.
BUNESS H. & GIESE P. 1990: A crustal section through the north-western Italy. In: FREEMAN R., GIESE P. & MUELLER S. (eds.), The European Geotraverse: integrative studies. European Science Foundation, Strasbourg, 297-304.
BURKE M. M. & FOUNTAIN D. M. 1990: Seismic properties of rocks from an exposure of extended continental crust - new laboratory measurements from the Ivrea Zone. Tectonophysics, 182, 119-146.
BURKHARD M. 1990: Aspects of large-scale Miocene deformation in the most external part of the Swiss Alps (Subalpine Molasse to Jura fold belt). Eclogae geol. Helv., 83/3, 559-584.
BURRUS J., FOUCHER J. P., AVEDIK F. & LE DOUARAN S. 1985: Deep structure and thermicity of the Provencal Basin. In: GALSON D. A. & MUELLER S. (eds.), Proceedings of the Second Workshop on the European Geotraverse (EGT) project: the Southern Segment. European Science Foundation, Strasbourg, 183-190.
BUTLER R. W. H. 1990a: Balancing sections on a crustal scale: a view from the Western Alps. In: FREEMAN R. & MUEL-LER S. (eds.), Proceedings of the sixth workshop on the European geotraverse (EGT) project. European Science Foundation, Strasbourg, 157-164.
BUTLER R. W. H. 1990b: Notes on crustal balancing along the Alpine segment of the European Geotraverse. In: FREE-MAN R., GIESE P. & MUELLER S. (eds.), The European Geotraverse: integrative studies. European Science Foundation, Strasbourg, 263-276.
CERMAK V., BALLING N., DELLA VEDOVA B., LUCAZEAU F., PASQUALE V., PELLIS G., SCHULTZ R. & VERDOYA M. 1992: Heat-flow density. In: FREEMAN R. & MUELLER S. (eds.), Atlas of compiled data - a continent revealed - the European Geotraverse. University Press, Cambridge, 49-57.
CHOPIN C. 1984: Coesite and pure pyrope in high-grade blueschists from the Western Alps: a first record and some conse-quences. Contrib. Mineral. Petrol., 86, 107-118.
CHRISTENSEN N. I. & SZYMANSKI D. L. 1988: Origin of reflec-
tion from the Brevard Fault zone. J. Geophys. Res., 93, 1087-1102.
CHRISTENSEN N. I. 1992: Rock physics: a guide to the interpreta-tion of deep seismic reflection data. 5th Intern. Symp. on Seismic Reflection Probing of the Continents and their Margins, Banff, Canada, p. 50.
CLOETINGH S. & BANDA E. 1992: Europe’s lithosphere - mechanical structure. In: BLUNDELL D., FREEMAN R. & MUELLER S. (eds.), A continent revealed - the European Geotraverse. University Press, Cambridge, 80-90.
CORDIER J.-P. 1983: Les vitesses en sismique réflexion. Technique et Documentation, Lavoisier, Paris, 197 p.
COWAN D. S. & SILLING R. M. 1978: A dynamic model of ac-cretion at trenches and its implications for the tectonic evolution of subduction complexes. J. Geophys. Res., 83, 5389-5396.
COWARD, M. P., DIETRICH, D.& PARK, R. G. (eds.) 1989: Alpine tectonics. Geol. Soc. London, spec. publ., 45, 450 p.
CRAMPIN S. 1987: The geological and industrial implications of extensive-dilatancy anisotropy. Nature, 328, 491-496.
DAMOTTE B., NICOLICH R., CAZES M. & GUELLEC S. 1990: Mise en oeuvre, traitement et présentation du profil plaine du Pô - Massif Central. In: ROURE F., HEITZMANN P. & POLINO R. (eds.), Deep structure of the Alpes. Mém. Soc. géol. Fr., 156; Mém. Soc. Géol. Suisse 1; Soc. geol. ital., Vol. spec 1, 65-76.
DEKORP RESEARCH GROUP 1988: Results of the DEKORP 4/KTB Oberpfalz deep seismic reflection investigations. J. Geophys., 62, 69-101.
___ 1990: Reflectivity patterns in the Variscan mountain belts and adjacent areas: an attempt for a pattern recognition and correlation to tectonic units. Tectonophysics, 173, 361-378.
DEVILLE E. 1990: Principaux traits de la structure géologique de la région de Tignes mis évidence par la carte géologique Tignes à 1/50’000 (Alpes occidentales, Savoie). Géol. France, 1, 45-51.
DEVILLE E., FUDRAL S., LAGABRIELLE Y., MARTHALER M. & SARTORI M. 1992: From oceanic closure to continental colli-sion: a synthesis of the “Schistes lustrés” metamorphic complex of the Western Alps. Geol. Soc. Amer. Bull., 104, 127-139.
DU BOIS L., LEVATO L., BESNARD J., MARCHANT R., OLIVIER R., OUWEHAND M., SELLAMI S. & WAGNER J.-J. 1990a: Pseudo-3D study using crooked line processing from the swiss alpine western profile - Line 2 (Val d’Anniviers - Valais). In: LEVEN J. H., FINLAYSON D. M., WRIGHT C., DOOLEY J. C. & KENNETT B. L. (eds.), Seismic probing of continents and their margins. Tectonophysics, 173, 31-42.
___ 1990b: Aspects particuliers du traitement sismique des profils alpins suisses du PNR-20. In: ROURE F., HEITZMANN P. & POLINO R. (eds.), Deep structure of the Alps. Mém. Soc. géol. Fr., 156; Mém. Soc. Géol. Suisse 1; Soc. geol. ital., Vol. spec 1, 47-54.

- 131 -
ECORS-CROP DEEP SEISMIC SOUNDING GROUP 1989a: A new picture of the Moho under the western Alps. Nature, 337, 249-251.
___ 1989b: Mapping the Moho of the Western Alps by wide-angle reflection seismic. Tectonophysics, 162, 193-202.
EPARD J.-L. 1990: La nappe de Morcles au sud-ouest du Mont-Blanc. Mém. Géologie (Lausanne), 8, 165 p.
EPARD J.-L., MARCHANT R., ESCHER A., MASSON H., STECK A. & GRANSIR-GROUP 1992: Interpretation géologique du profil W1 “Rawil”. NFP-20 Bulletin, 11, p. 25.
ERNST W.G. 1971: Metamorphic zonations on presumably sub-ducted lithospheric slabs from Japon, California and the Alps. Contrib. Mineral. Petrol., 34, 43-59.
ESCHER A. 1988: Structure de la nappe du Grand Saint-Bernard entre le val de Bagnes et les Mischabel. Rapp. géol. Serv. hydrol. géol. nat. Suisse, 7, 28 p.
ESCHER A., MASSON H. & STECK A. 1988: Coupe géologique des Alpes occidentales suisses. Rapp. géol. Serv. hydrol. géol. natl. Suisse, 2, 11 p.
___ 1993: Nappe geometry in the Western Swiss Alps. J. Struct. Geol., 15/3-5, 501-509.
ESCHER A. & SARTORI M. 1991: The Geology of the Zermatt-Gornergrat area. In: Heitzmann P. (ed.), Tectonics and deep structure of the Western and Southern Swiss Alps - an excursion guide. NFP/PNR-20 Bull., 9, 5-12.
ESCHER A., BURRI M., MARCHANT R., MASSON H., STECK A. & GRANSIR-GROUP 1992: Geological interpretation of the Val de Bagnes (W5) seismic profile. NFP-20 Bul-letin, 11, 27.
FAKHIMI M. 1976: Interpretation seismischer aufgrund des Ge-schwindigkeitsverhaltens charakteristicher Gesteine bei Hochdrück- und Hochtemperaturversuchen am Beispiel von Ivrea. PhD thesis, Uni. Kiel, 175 p.
FAVRE P. & STAMPFLI G. 1992: From rifting to passive margin: the examples of the Red Sea, Central Atlantic and Alpine Tethys. Tectonophysics, 215, 69-97.
FINCKH P., FREI W., FREEMAN R., HEITZMANN P., LEHNER P., MÜLLER S., PFIFFNER A. & VALASEK P. 1987: Nationales Forschungsprogramm 20 «Geologische Tiefenstructur der Schweiz». Bull. Ver. schweiz. Petroleum-Geol. u. -Ing., 54/124, 59-74.
FIVAZ R. 1989: L’ordre ou la volupté. Presses Polytechniques Romandes, Lausanne, 167 p.
FOUNTAIN D. M., HURICH C. M. & SMITHSON S. B. 1984: Seismic reflectivity of mylonites zones in the crust. Geology, 12, 195-198.
FRAZER N. & PHINNEY R. 1980: The theory of finite frequency body wave synthetic seismograms in inhomogeneous media. Geophys. J. R. astr. Soc., 63, 691-717.
FREI W., HEITZMANN P., LEHNER P., MULLER S., OLIVIER R., PFIFFNER
A., STECK A. & VALASEK P. 1989: Geotraverses across the Swiss Alps. Nature, 340, 544-548.
FREI W., HEITZMANN P. & LEHNER P. 1990: Swiss NFP-20 research program of the deep structure of the Alps. In: ROURE F., HEITZMANN P. & POLINO R. (eds.), Deep structure of the Alps. Mém. Soc. géol. Fr., 156; Mém. Soc. Géol. Suisse 1; Soc. geol. ital., Vol. spec 1, 29-46.
___ 1992: NFP-20 geologische Tiefenstructur der Schweiz: ein Bericht der Programmleitung. Bull. Ver. schweiz. Petroleum-Geol. u. -Ing., 58, 45-74.
FREY M., HUNZIKER J. C., FRANK W., BOCQUET J., DAL PIAZ G. V., JÄGER E. & NIGGLI E. 1974: Alpine metamorphism of the Alps - A review. Schweiz. mineral. petrogr. Mitt., 54/2, 247-290.
GIESE P., PRODEHL C. & BEHNKE C. 1967: Ergebnisse refraktion-sseismischer Messungen 1965 zwischen dem franzö-sischen Zentralmassiv und den Westalpen. Z. Geophys., 33, 215-261.
GIESE P. & BUNESS H. 1992: Moho depth. In: FREEMAN R. & MUELLER S. (eds.), Atlas of compiled data - a continent revealed - the European Geotraverse. University Press, Cambridge, 11-13.
GIESE P., ROEDER D. & SCANDONE P. 1992: Tectonic evolution of Europe - the fragmented Adriatic microplate: evolu-tion of the Southern Alps, the Po basin and the northern Apennines. In: BLUNDELL D., FREEMAN R. & MUELLER S. (eds.), A continent revealed - the European Geotraverse. University Press, Cambridge, 190-198.
GOUFFON Y. 1993: Géologie de la “nappe” du Grand St-Bernard entre la Doire Baltée et la frontière suisse (Vallée d’Aoste - Italie). Mém. Géol. (Lausanne), 12, 147 p.
GREEN A. G., LEVATO L., VALASEK P., MILTKEREIT B., OLIVIER R., MUELLER S. & WAGNER J.-J. 1993: Characteristic reflection patterns in the Southeast Canadian Cordillera, Northern Appalachians and Swiss Alps. Tectonophysics, 219, 71-92.
GUELLEC S., TARDY M., ROURE F. & MUGNIER J.-L. 1989: Une interpretation tectonique nouvelle du massif subalpin des Bornes (Alpes occidentales): apports des données de la géologie et de la géophysique profondes. C. R. Acad. Sci. Paris, Sér. II, 309, 913-920.
GUELLEC S., LAJAT D., MASCLE A., ROURE F. & TARDY M. 1990a: Deep seismic profiling and petroleum potential in the Western Alps: constraints with ECORS data, balanced cross sections and hydrocarbon modeling. In: LETOUZEY, J. (ed.), Petroleum and tectonics in mobil belts. Editions Technip, Paris, 425-437.
GUELLEC S., MUGNIER J.-L., TARDY M. & ROURE F. 1990b: Neo-gene evolution of the western Alpine foreland in the light of Ecors-data and balanced cross section. In: ROURE F., HEITZMANN P. & POLINO R. (eds.), Deep structure of the Alps. Mém. Soc. géol. Fr., 156; Mém. Soc. Géol. Suisse 1; Soc. geol. ital., Vol. spec 1, 165-184.
GUYOTON F. 1991: Sismicité et structure lithospherique des Alpes occidentales. Thèse, Uni. J. Fourier, Grenoble, 290 p.

- 132 -
HAGEDOORN J. G. 1954: A process of seismic reflection interpreta-tion. Geophys. Prosp., 2, 85-127.
HEINRICH C. A. 1986: Eclogite facies regional metamorphism of hydrous mafic rocks in the Central Alps. J. Petrol., 27, 123-154.
HEITZMANN P. 1991: The national research programm NFP-20 on the deep structures of Switzerland. In: HEITZMANN P. (ed.), Tectonics and deep structure of the Western and Southern Swiss Alps - an excursion guide. NFP/PNR-20 Bull., 9, 1-4.
HEITZMANN P., FREI W., LEHNER P. & VALASEK P. 1991: Crustal indentation in the Alps - an overview of reflection seismic profiling in Switzerland. In: MEISSNER R., BROWN L., DÜRRBAUM H.-J., FRANKE W., FUCHS K. & SEIFERT F. (eds.), Continental lithosphere: deep seismic reflections. Amer. Geophys. Union, Geodyn. Ser., 22, 161-176.
HOLLIGER K. 1990: A composite, depth-migrated deep seismic reflection section along the Alpine segment of the EGT derived from the NFP20 eastern and southern traverses. In: FREEMAN R., GIESE P. & MUELLER S. (eds.), The Euro-pean GeoTraverse: integrative studies. European Science Foundation, Strasbourg, 245-254.
HOLLIGER K. & KISSLING E. 1991: Ray theorical depth migration: methodology and application to deep seismic reflection data across the eastern and southern Swiss Alps. Eclogae geol. Helv., 84/2, 369-402.
___ 1992: Gravity interpretation of a unified 2D-acoustic image of the central alpine collision zone. Geophys. J. Int., 111, 213-225.
HUNZIKER J., DESMONS J. & HURFORD A. 1993: Thirty-two years of geochronological work in the Central and Western Alps: a review on seven maps. Mém. Géol. (Lausanne), 13, 59 p.
HURICH C. A. & SMITHSON S. B. 1987: Compositional variation and the origin of deep crustal reflections. Earth. Planet. Sci. Lett., 85, 416-426.
JEANBOURQUIN P. & BURRI M. 1991: Les métasédiments du Pennique inférieur dans la région de Brigue-Simplon. Lithostratig-raphie, structure et contexte géodynamique dans le bassin valaisan. Eclogae geol. Helv., 84/2, 463-481.
JONES T. 1982: Seismic velocity and anisotropy in mylonites and the reflectivity of deep crustal fault zones. Geology, 10, 260-263.
JONES T. & NUR A. 1984: The nature of seismic reflections from deep crustal fault zones. J. Geophys. Res., 89, 3153-3171.
KISSLING E. 1984: Three-dimensional gravity model of the north-ern Ivrea-Verbano Zone. In: WAGNER J.-J. &. MUELLER S. (eds.), Geomagnetic and gravimetric studies of the Ivrea Zone. Mat. Géol. Suisse, Sér. Géophys., 21, 53-61.
KLINGELÉ E. & OLIVIER R. 1979: Schwere-Karte der Schweiz (Bouguer-Anomalien), Karte 4 der Geophysikalischen Landes karten 1:500’000. Bundesamt für Landestopog-raphie, Wabern/Bern.
KLINGELÉ, E., LAHMEYER, B. & FREEMAN, R. 1992: Bouguer gravity anomalies. In: BLUNDELL D., FREEMAN R. & MUELLER S. (eds.), Atlas of compiled data - a continent revealed - the European Geotraverse. University Press, Cambridge, 27-30.
LAUBSCHER H. 1973: Alpen und Plattentektonic. Das Problem der Bewegungsdiffusion an kompressiven Plattengrenzen. Z. dtsch. geol. Ges., 124, 295-308.
___ 1975: Plate boundaries and microplates in Alpine history. Am. J. Sci., 275, 865-876.
___ 1988a: The arcs of the Western Alps and the Northern Apennines: an updated view. Tectonophysics, 146, 67-78.
___ 1988b: Material balance in Alpine orogeny. Geol. Soc. Amer. Bull., 100, 1313-1328.
___ 1990a: Seismic data and the deep structures of the central Alps. In: FREEMAN R. & MUELLER S. (eds.), Proceedings of the sixth workshop on the European GeoTraverse (EGT) project. European Science Foundation, Strasbourg, 149-156.
___ 1990b: The deep structures of the central Alps inferred from both geophysical and geological data. Terra Nova, 2, 645-652.
___ 1990c: The problem of the deep structure of the Southern Alps: 3-D material balance considerations and regional consequences. In: FREEMAN R. & MUELLER S. (eds.), The European Geotraverse, part 6. Tectonophysics, 176, 103-121.
___ 1990d: The problem of the Moho in the Alps. Tectono-physics, 182, 9-20.
LE PICHON X., BERGERAT F. & ROULET M.-J. 1988: Plate kinematics and tectonics leading to the Alpine belt formation; a new analysis. Geol. Soc. Amer. Spec. Paper, 218, 111-131.
LEVATO L., DU BOIS L., MARCHANT R., OLIVIER R., SELLAMI S., SUNDERLAND P. & WAGNER J.-J. 1990: Interaction entre le traitement des données sismiques réflexion et leur modéli-sation géologique. Supercomputing Revue, 2, 11-13.
LEVATO L., PRUNIAUX B., BURRI M., ESCHER A., OLIVIER R., SEL-LAMI S. & WAGNER J.-J. 1993: Processing and preliminary results of NFP/PNR20 seismic reflection profiles from the Western Swiss Alps. Tectonophysics, 219, 93-107.
LITAK R. K., MARCHANT R. H., BROWN L. D., PFIFFNER O. A. & HAUSER E. C. 1991: Correlating crustal reflections with geologic outcrops: seismic modeling results from the southwestern USA and the Swiss Alps. In: MEISSNER R., BROWN L., DÜRRBAUM H.-J., FRANKE W., FUCHS K. & SEIFERT F. (eds.), Continental lithosphere: deep seismic reflections. Amer. Geophys. Union, Geodyn. Ser., 22, 299-305.
LITAK R., MARCHANT R., BROWN L., PFIFFNER O., SELLAMI S., LEVATO L., WAGNER J.-J. & OLIVIER R. 1993: Crustal structures and reflectivity of the Swiss Alps from three-dimensional seismic modeling: 2. Penninic nappes. Tectonics, 12/4, 925-935.
- 133 -
LÖW S. 1987: Die tektono-metamorphe Entwickelung des nördli-chen Adula-Decke (Zentralalpen, Schweiz). Beitr. Geol. Karte Schweiz N.F., 161, 84 p.
MAINPRICE D., CASEY M. & SCHMID S. 1990: The seismic proper-ties of Alpine calcite and quartz mylonites determined from the orientation distribution function. In: ROURE F., HEITZMANN P. & POLINO R. (eds.), Deep structure of the Alps. Mém. Soc. géol. Fr., 156; Mém. Soc. Géol. Suisse 1; Soc. geol. ital., Vol. spec 1, 85-96.
MANCKTELOW, N. S. 1990: The Simplon fault zone. Beitr. Geol. Karte Schweiz, 163.
MARCHANT R., STECK A., ESCHER A., LEVATO L., MASSON H., OLIVIER R., STAMPFLI G. & WAGNER J.-J. 1993: An interpretation of the deep sesimic lines from the Penninic Alps of Valais (Switzerland). Bull. Soc. Géol. France, 164/3, 81-100.
MARQUER D. 1991: Structures et cinématique des déformations Alpines dans le granite de Truzzo (Nappe de Tambo: Alpes centrales suisses). Eclogae geol. Helv., 84/1, 107-123.
MARTHALER M. & STAMPFLI G. 1989: Les Schistes lustrés à ophio-lites de la nappe du Tzaté: Un ancien prisme d’accrétion issu de la marge active appulienne. Schweiz. mineral. petrogr. Mitt., 69/2, 211-216.
MASSON H., HERB R. & STECK A. 1980: Helvetic Alps of Western Switzerland. In: Trümpy R. (ed.), Geology of Switzerland, part B. Wepf & Co., Basel, 109-135.
MAYERAT A. M. 1989: Analyses structurales et tectoniques du socle et de la couverture des nappes penniques du Rheinwald (Grisons, Suisse). Thèse de doctorat, Uni. de Neuchâtel.
MEDWEDEFF D. A. 1988: Structural analysis and tectonic sig-nificance of late-Tertiary and Quaternary, compressive-growth folding, San Joaquin Valley, California. PhD thesis, Princeton University, New-Jersey, 184 p.
MEISSNER R. 1989: Rupture, creep, lamellae and crocodiles: hap-penings in the continental crust. Terra Nova, 1, 17-28.
MEISSNER R., WEVER T. & SAOWIAK P. 1991: Continental collisions and seismic signature. Geophys. J. Int., 105, 15-23.
MÉNARD G. & THOUVENOT F. 1984: Ecaillage de la lithosphère européenne sous les Alpes Occidentales: arguments gravimétriques et sismiques liés à l’anomalie d’Ivrea. Bull. Soc. géol. Fr., 5, 875-884.
MENGEL K. 1992: The European lithosphere - evidence from xenoliths for the composition of the lithosphere. In: BLUNDELL D., FREEMAN R. & MUELLER S. (eds.), A con-tinent revealed - the European Geotraverse. University Press, Cambridge, 91-101.
MENGEL K. & KERN H. 1992: Evolution of the petrological and seismic Moho - implications for the crust-mantle bound-ary. Terra Nova, 4, 109-116.
MERLE O. & BALLÈVRE M. 1992: Late Cretaceous-early Tertiary detachement fault in the Western Alps. C. R. Acad. Sci. Paris, Sér. II, 315, 1769-1776.
MICHARD A, CHOPIN C. & HENRY C. 1993: Compression versus extension in the exhumation of the Dora-Maira coesite-bearing unit, Western Alps, Italy. Tectonophysics, 221, 173-193.
MILNES A. G. 1978: Structure and history of the Suretta nappe (Pennine zone, Central Alps): afield study. Eclogae geol. Helv., 71/1, 19-33.
MILNES A. G. & PFIFFNER O. A. 1980: Tectonic evolution of the central Alps in the cross section St Gallen-Como. Eclogae. geol. Helv., 73/2, 619-633.
MONTRASIO A., NICOLICH R. & CROP-ALPI CENTRALI WORKING GROUP 1992: CROP: Deep seismic profiles in the Central Alps. NFP-20 Bulletin, 11, 27.
MUELLER S., ANSORGE J., EGLOFF R. & KISSLING E. 1980: A crustal cross section along the Swiss Geotraverse from the Rhinegraben to the Po Plain. Eclogae geol. Helv., 73/2, 463-483.
MUGNIER J.-L. & MARTHELOT J.-M. 1991: Crustal reflections beneath the Alps and the Alpine foreland: geodynamic implications. In: MEISSNER R., BROWN L., DÜRRBAUM H.-J., FRANKE W., FUCHS K. & SEIFERT F. (eds.), Continental lithosphere: deep seismic reflections. Amer. Geophys. Union, Geodyn. Ser., 22, 177-183.
MUGNIER J.-L., GUELLEC S., MÉNARD G. & ROURE F. 1989: Géométrie et structures du socle des Alpes externes déduites des profils Ecors-Crop Alpes 1 et Ecors Alpes 2. C. R. Acad. Sci. Paris, Sér. II, 309, 733-739.
MUGNIER J.-L., GUELLEC S., MÉNARD G., ROURE F., TARDY M. & VIALON P. 1990: Crustal balanced cross-sections through the external Alps deduced from the Ecors profile. In: ROURE F., HEITZMANN P. & POLINO R. (eds.), Deep structure of the Alps. Mém. Soc. géol. Fr., 156; Mém. Soc. Géol. Suisse 1; Soc. geol. ital., Vol. spec 1, 203-216.
NABHOLZ W. 1945: Geologie der Bündnerschiefergebirge zwischen Rheinwald, Valser- und Safiental. Eclogae geol. Helv., 38/1, 1-119.
NICOLAS A., HIRN A., NICOLICH R., POLINO R. & ECORS-CROP WORKING GROUP 1990a: Lithospheric wedging in the western Alps inferred from the ECORS-CROP traverse. Geology, 18, 587-590.
NICOLAS A., POLINO R., HIRN A., NICOLICH R. & ECORS-CROP WORKING GROUP 1990b: Ecors-Crop traverse and deep strucutre of the Western Alps: a synthesis. In: ROURE F., HEITZMANN P. & POLINO R. (eds.), Deep structure of the Alps. Mém. Soc. géol. Fr., 156; Mém. Soc. Géol. Suisse 1; Soc. geol. ital., Vol. spec 1, 15-28.
PANZA G. F. & MUELLER S. 1978: The plate boundary between Eurasia and Africa in the alpine area. Mem. Sci. Geol. Padova, 33, 43-50.
PASQUALE V., CABELLA C. & VERDOYA M. 1990: Deep tem-peratures and lithospheric thickness along the European Geotraverse. In: FREEMAN R. & MUELLER S. (eds.), The European Geotraverse, part 6. Tectonophysics, 176, 1-12.

- 134 -
PAVONI N. & ROTH P. 1990: Seismicity and seismotectonics of the Swiss Alps, results of microearthquake investigations 1983-1988. In: ROURE F., HEITZMANN P. & POLINO R. (eds.), Deep structure of the Alps. 156; Mém. Soc. Géol. Suisse 1; Soc. geol. ital., Vol. spec 1, 129-135.
PFIFFNER O. A. 1990: Crustal shortening of the Alps along the EGT profile. In: FREEMAN R., GIESE P. & MUELLER S. (eds.), The European GeoTraverse: integrative studies. European Science Foundation, Strasbourg, 255-262.
PFIFFNER O. A. 1992: Tectonic evolution of Europe - Alpine orogeny. In: BLUNDELL D., FREEMAN R. & MUELLER S. (eds.), A continent revealed - the European Geotraverse. University Press, Cambridge, 180-189.
PFIFFNER O., FREI W., FINKH P. & VALASEK P. 1988: Deep seis-mic reflection profiling in the Swiss Alps: explosion seismology results for line NFP 20-East. Geology, 16, 987-990.
PFIFFNER O., KLAPER E., MAYERAT A.-M. & HEITZMANN P. 1990a: Structure of the basement-cover contact in the Swiss Alps. In: ROURE F., HEITZMANN P. & POLINO R. (eds.), Deep structure of the Alps. Mém. Soc. Géol. Fr., 156; Mém. Soc. Géol. Suisse 1; Soc. geol. ital., Vol. spec 1, 247-262.
PFIFFNER O., FREI W., STÄUBLE M., VALASEK P., LEVATO L., DU BOIS L., SCHMID S. & SMITHSON S. 1990b: Crustal shortening in the Alpine orogen: results from deep seismic reflection profiling in the eastern Swiss Alps, line NFP 20-East. Tectonics, 9, 6, 1327-1355.
PFIFFNER O. A., LEVATO L. & VALASEK P. 1991: Crustal reflec-tions from the Alpine orogen: results from deep seismic profiling. In: MEISSNER R., BROWN L., DÜRRBAUM H.-J., FRANKE W., FUCHS K. & SEIFERT F. (eds.), Continental lithosphere: deep seismic reflections. Amer. Geophys. Union, Geodyn. Ser., 22, 185-193.
POLINO R., DAL PIAZ G. V. & GOSSO G. 1990: Tectonic erosion at the Adria margin and accretionary processes for the Cretaceous orogeny in the Alps. In: ROURE F., HEITZMANN P. & POLINO R. (eds.), Deep structure of the Alps. Mém. Soc. géol. Fr., 156; Mém. Soc. Géol. Suisse 1; Soc. geol. ital., Vol. spec 1, 345-367.
PRESS F. 1966: Seismic velocities. Geol. Soc. Amer. Mem., 97, 195-218.
PROBST P. 1980: Die Bündnerschiefer des nördlischen Penninikums zwischen Valser Tal und Passo di San Giacomo. Matér. Carte géol. Suisse N.S., 153, 63 p.
REY D., QUARTA T., MOUGE P., MILETTO M., LANZA R., GALDENANO A., CAROZZO M. T., ARMANDO E. & BAYER R. 1990: Gravity and aeromagnetic maps on the western Alps: contribu-tion to the knowledge on the deep structures along the Ecors-Crop seismic profile. In: ROURE F., HEITZMANN P. & POLINO R. (eds.), Deep structure of the Alps. Mém. Soc. géol. Fr., 156; Mém. Soc. Géol. Suisse 1; Soc. geol. ital., Vol. spec 1, 107-122.
RICOU L. E. & SIDDANS W. B. 1986: Collision tectonics in the Western Alps. In: COWARD M. P. & RIES A. C. (eds.), Collision tectonics. Geol. Soc. London, Spec. Publ., 19, 229-244.
RICOU L. E. & DAUTEUIL O. 1991: La notion de décrochement dans l’interprétation du profil sismique ECORS-CROP Alpes. Eclogae geol. Helv., 84/2, 403-411.
ROURE F., POLINO R. & NICOLICH R. 1989: Poinçonnement, rétrocharriages et chevauchements post-basculement dans les Alpes occidentales: évolution intracontinentale d’une chaîne de collision. C. R. Acad. Sci. Paris, Sér. II, 309, 283-290.
ROURE F., HOWELL D. G., GUELLEC S. & CASERO P. 1990a: Shallow structures induced by deep-seated thrusting. In: LETOUZEY, J. (ed.), Petroleum and tectonics in mobil belts. Editions Technip, Paris, 15-30.
ROURE F., POLINO R. & NICOLICH R. 1990b: Early Neogene deforma-tion beneath the Po plain: constraints on post-collisional Alpine evolution. In: ROURE F., HEITZMANN P. & POLINO R. (eds.), Deep structure of the Alps. Mém. Soc. géol. Fr., 156; Mém. Soc. Géol. Suisse 1; Soc. geol. ital., Vol. spec 1, 309-322.
ROURE F., HEITZMANN P. & POLINO R. (eds.), 1990c: Deep structure of the Alps. Mém. Soc. géol. Fr., 156; Mém. Soc. Géol. Suisse 1; Soc. geol. ital., Vol. spec 1, 309-322.
SARTORI M. 1987: Structure de la zone du Combin entre les Diablons et Zermatt (Valais). Eclogae geol. Helv., 80/3, 789-814.
___ 1990: L’unité du Barrhorn (Zone Pennique, Valais, Suisse). Mém. Géol. (Lausanne), 6, 156 p.
___ 1993: Une carte des décrochements dans la vallée du Rhône. Lecture abstracts of the Schweizerisches Tek-toniker Treffen, Zürich.
SCARASCIA S. & MAISTRELLO M. 1990: Refraction results from the easterns fans and profiles in the Alps - Po plain - northern Apennines area (EGT’86). In: FREEMAN R. & MUELLER S. (eds.), Proceedings of the sixth workshop on the European GeoTraverse (EGT) project. European Science Foundation, Strasbourg, 169-178.
SCHMID S. 1992: Geodynamic evolution of the Alps along the European Geotraverse. Part 1: Pennine units and deep structure. Géol. Alpine, sér. spéc. “Colloques et excur-sions”, 1, 86-87.
SCHMID S.M., AEBLI H.R., HELLER F. & ZINGG A. 1989: The role of the Periadriatic Line in the tectonic evolution of the Alps. In: COWARD M. P., DIETRICH D. & PARK R.G.. (eds.), Alpine tectonics. Geol. Soc. London, Spec. Publ., 45, 153-173.
SCHMID S. M., RÜCK P. & SCHREURS G. 1990: The significance of the Schams nappe for reconstruction of the paleotectonic and orogenic evolution of the Penninic zone along the NFP-20 East traverse (Grisons, eastern Switzerland). In: ROURE F., HEITZMANN P. & POLINO R. (eds.), Deep structure of the Alps. Mém. Soc. géol. Fr., 156; Mém. Soc. Géol. Suisse 1; Soc. geol. ital., Vol. spec 1, 263-289.
SCHÖNBORN G. 1992: Alpine tectonics and kinematics models of the central Southern Alps. Mem. Sci. Geol. Padova, 44, 229-393.

- 135 -
SCHREURS G. 1990: Structural analysis of the Schams nappes and adjacent tectonic units in the Penninic zone (Grisons, SE-Switzerland). PhD thesis, Mitt. Geol. Inst. ETH Univ. Zürich, n° 9297.
SCHUMACHER M. E. 1990: Alpine basement thrusts in the eastern Seengebirge, Southern Alps, (Italy/Switzerland). Eclogae geol. Helv., 83/3, 645-664.
SCHWENDENER H. 1984: The Ivrea magnetic anomaly in the Valle d’Ossola and Valstrona area, Northern Italy. In: WAGNER J.-J. & MUELLER S. (eds.), Geomagnetic and gravimetric studies of the Ivrea Zone. Mat. Géol. Suisse, Sér. Géo-phys., 21, 49-52.
SCHWENDENER H. & MUELLER S. 1985: New evidence for a density anomaly in the upper mantle below the Southern Alps. In: GALSON D. A. & MUELLER S. (eds.), Proceedings of the Second Workshop on the European Geotraverse (EGT) project: the Southern Segment. European Science Foundation, Strasbourg, 115-120.
___ 1990: A three-dimensional model of the crust and upper mantle along the Alpine part of the European Geotraverse (EGT). In: FREEMAN R. & MUELLER S. (eds.), The European Geotraverse, part 6. Tectonophysics, 176, 193-214.
SELLAMI S. 1993 in prep.: Propriétés physiques de roches des Alpes suisses et leur utilisation à l’analyse de la réflectivité de la croûte alpine. PhD thesis, Uni. of Geneva.
SELLAMI S., BARBLAN F., MAYERAT A.-M., PFIFFNER A., RISNES K. & WAGNER J.-J. 1990: Compressional wave velocities of samples from the NFP20-East seismic reflection profile. In: ROURE F., HEITZMANN P. & POLINO R. (eds.), Deep structure of the Alps. Mém. Soc. géol. Fr., 156; Mém. Soc. Géol. Suisse 1; Soc. geol. ital., Vol. spec 1, 77-84.
SELLAMI S., WAGNER J.-J. & STECK A. 1993: P-wave velocities of samples from the Penninic of the western Alps along NFP20-west seismic reflection profiles. Bull. Soc. géol. Fr., 164/3, 437-449.
SÉNÉCHAL G. 1989: Migration géométrique: application aux profils ECORS-CROP ALPES. Mémoire de D.E.A., Uni. J. Fourier, Grenoble, 50 p.
SÉNÉCHAL G. 1991: Les réflecteurs du chevauchement pennique (profil ECORS Alp1): une analyse critique des données vibrosismiques. Thèse, Université J. Fourier, Grenoble, 106 p.
SÉNÉCHAL G. & THOUVENOT F. 1991: Geometrical migration of line-drawings: a simplified method applied to ECORS data. In: MEISSNER R., BROWN L., DÜRRBAUM H.-J., FRANKE W., FUCHS K. & SEIFERT F. (eds.), Continental lithosphere: deep seismic reflections. Amer. Geophys. Union, Geodyn. Ser., 22, 401-407.
SHIVE P. N. 1990: The Ivrea Zone and lower crustal magnetiza-tion. Tectonophysics, 182, 161-167.
SIEGESMUND S. & KERN H. 1990: Velocity anisotropy and shear-wave splitting in rocks along the Insubric Line (Ivrea Zone, Italy). Earth. Planet. Sci. Lett., 99, 29-47.
SIEGESMUND S. & VOLLBRECHT A. 1991: Complete seismic properties from microcrack fabrics and textures in an
amphibolite from the Ivrea zone, Western Alps, Italy. Tectonophysics, 199, 13-24.
SIEGESMUND S., KERN H. & VOLLBRECHT A. 1991: The effect of oriented microcracks on seismic velocities in an ultra-mylonite. Tectonophysics, 186/3-4, 241-251.
SMITHSON S. B., BREWER J. A., KAUFMAN S., OLIVER J. E. & ZAWIS-LAK R. L. 1980: Complex Archean lower crustal structure relevealed by COCORP crustal reflection profiling in the Wind River range, Wyoming. Earth. Planet. Sci. Lett., 46, 295-305.
SPAKMAN W. 1986: The upper mantle in the central European-Mediterranean region. In: FREEMAN R., MUELLER S. & GIESE P. (eds.), Third EGT Workshop - The Central Segment. European Science Foundation, Strasbourg, 215-221.
SPAKMAN W. 1990: The structure of the lithosphere and mantle beneath the Alps as maped by delay time tomography. In: Freeman R., Giese P. & Mueller S. (eds.), The European GeoTraverse: integrative studies. European Science Foundation, Strasbourg, 213-220.
SPALLA M. I., DE MARIA L., GOSSO G., MILETTO M. & POGNANTE U. 1983: Deformazione e metamorphismo della Zona Sesia-Lanzo meridionale al contatto con la Falda Piemontese e con il Massiccio di Lanzo, Alpi Occidentali. Mem. Soc. Geol. It., 26, 499-514.
SPRING L., REYMOND B., MASSON H. & STECK A. 1992: La Nappe du Lébendum entre “Alte Kaserne” et le val Cairasca (massif du Simplon): nouvelles observations et interprétations. Eclogae geol. Helv., 85/1, 85-104.
STAMPFLI G. 1993: Le Briançonnais, terrain exotique dans les Alpes? Eclogae geol. Helv., 86/1, 1-45.
STAMPFLI G. & MARTHALER M. 1990: Divergent and convergent margins in the North-Western alps. Confrontation to actualistic models. Geodinamica Acta, 4, 3, 159-184.
STAMPFLI G., MARCOUX J. & BAUD A. 1991: Tethyan margins in space and time. Paleogeogr., Paleoecol., Paleoclim., 87, 373-409.
STÄUBLE M. & PFIFFNER O. A. 1991a: Processing, interpretation and modeling of seismic reflection data in the Molasse Basin of eastern Switzerland. Eclogae geol. Helv., 84/1, 151-175.
___ 1991b: Evaluation of the seismic response of basement fold-and-thrust geometry in the Central Alps based on 2-D ray tracing. Annales Tectonicae, 5/1, 3-17.
___ 1993: Crustal structure and reflectivity of the Swiss Alps from 3-D seismic modeling. Part I: Helvetic nappes. Tectonics, 12/4, 911-924.
STECK A. 1984: Structures de déformation tertiares dans les Alpes centrales (transversale Aar-Simplon-Ossola). Eclogae geol. Helv., 75/1, 55-100.
___ 1987: Le massif du Simplon - réflexion sur la cinématique des nappes de gneiss. Schweiz. mineral. petrogr. Mitt., 67, 55-100.
___ 1990: Une carte des zones de cisaillement ductile des

- 136 -
Alpes Centrales. Eclogae geol. Helv., 83/3, 603-627.
STECK A. & TIÈCHE J.C. 1976: Carte géologique de l’antiforme péridotitique de Finero avec des observations sur les phases de déformation et de recristallisation. Schweiz. mineral. petrogr. Mitt., 56, 501-512.
STECK A. & HUNZIKER J. 1992: Tectonique des Alpes de Suisse centrale: chronologie des événements structuraux et thermiques. Géol. Alpine, sér. spéc. “Colloques et excur-sions”, 1, 94-95.
STECK A., RAMSAY J. G., MILNES A. G. & BURRI M. 1979: Compte rendu de l’excursion de la Société Géologique Suisse et la Société Suisse de Minéralogie et Pétrographie en Valais et en Italie du nord du 2 au 5 octobre 1978. Eclogae geol. Helv., 72/1, 287-311.
STECK A., EPARD J.-L., ESCHER A., MARCHANT R., MASSON H. & SPRING L. 1989: Coupe tectonique horizontale des Alpes centrales. Mém. Géol. Uni. Lausanne, 5, 8.
STECK A., EPARD J.-L., ESCHER A., MARCHANT R. & MASSON H. in prep.: Interpretation of the NFP-20 Western profiles. In: Deep structure of Switzerland - Results from NFP-20.
STELLA A. 1927: Sezioni geologiche attraverso la Valle di Aosta. Nuova pub. R. Uff. Geologico.
SUHADOLC P., PANZA G. F. & MUELLER S. 1990: Physical properties of the lithosphere-asthenophere boundary. In: FREEMAN R. & MUELLER S. (eds.), The European Geotraverse, part 6. Tectonophysics, 176, 123-136.
TANER M. T. & SHERIFF R. E. 1977: Application of amplitude, frequency and other attributes to stratigraphic and hy-docarbon determination. In: PAYTON C. E. (ed.), Seismic stratigraphy. A. A. P. G. Mem., 26, 310-327.
TANER M. T., KOEHLER F. & SHERIFF R. E. 1979: Complex trace analysis. Geophysics, 44, 1041-1063.
TARDY M., DEVILLE E., FUDRAL S., GUELLEC S., MÉNARD G., THOUVENOT F. & VIALON P. 1990: Interprétation structurale des données du profil de sismique réflexion profonde Ecors-Crop Alpes entre le front Pennique et la ligne du Canavese (Alpes occidentales). In: ROURE F., HEITZMANN P. & POLINO R. (eds.), Deep structure of the Alps. Mém. Soc. géol. Fr., 156; Mém. Soc. Géol. Suisse 1; Soc. geol. ital., Vol. spec 1, 217-226.
TERMIER P. 1903: Les nappes des Alpes orientales et la synthèse des Alpes. Bull. Soc. Geol. Fr. Sér. 4, 3, 711-765.
THOUVENOT F., PAUL A., SÉNÉCHAL G., HIRN A. & NICOLICH R. 1990: Ecors-Crop wide angle reflection seismics: con-strains on deep interfaces beneath the Alps. In: ROURE F., HEITZMANN P. & POLINO R. (eds.), Deep structure of the Alps. Mém. Soc. géol. Fr., 156; Mém. Soc. Géol. Suisse 1; Soc. geol. ital., Vol. spec 1, 97-106.
TRÜMPY R. 1980a: Geology of Switzerland. Part A: An outline of the geology of Switzerland. Wepf & Co., Basel, 104 p.
___ (ed.) 1980b: Geology of Switzerland. Part B: Geological excursions. Wepf & Co., Basel, 334 p.
___ 1988: A possible Jurassic-Cretaceous transform system
in the Alps and the Carpathians. Geol. Soc. Amer. Spec. Paper, 218, 93-109.
___ 1992: Ostalpen und Westalpen - Verbindes und Tren-nendes. Jb. Geol. B.-A., 135/4, 875-882.
VALASEK P. 1990: Intagrated processing and presentation of seismic reflection and refraction data recorded along the Alpine segment of the European GeoTraverse (EGT). In: FREEMAN R., GIESE P. & MUELLER S. (eds.), The European GeoTraverse: integrative studies. European Science Foundation, Strasbourg, 237-244.
VALASEK P. 1992: The tectonic structure of the Swiss alpine crust interpreted from a 2D network of deep crustal seismic profiles and a an evaluation of 3D effects. PhD Thesis, Swiss Fed. Inst. Technology Zürich, 196 p.
VALASEK P. & HOLLIGER K. 1990: Approaches towards an integrated interpretation of the NFP20 deep crustal reflection profiles along the Alpine segment of the EGT. In: FREEMAN R. & MUELLER S. (eds.), Proceedings of the sixth workshop on the European GeoTraverse (EGT) project. European Science Foundation, Strasbourg, 137-148.
VALASEK P., FREI W., STÄUBLE M. & HOLLIGER P. 1990: Processing of the NFP20 seismic reflection traverses across the Swiss Alps by the ETH-Zurich data processing center. In: ROURE F., HEITZMANN P. & POLINO R. (eds.), Deep structure of the Alps. Mém. Soc. géol. France, 156; Mém. Soc. Géol. Suisse 1; Soc. geol. ital., Vol. spec 1, 55-64.
VALASEK P., MUELLER S., FREI W. & HOLLIGER K. 1991: Results of NFP 20 seismic reflection profiling along the Alpine section of the European Geotraverse (EGT). Geophys. J. Int., 105, 85-102.
VIALON P., ROCHETTE P. & MÉNARD G. 1989: Indentation and rotation in the western Alpine arc. In: COWARD M. P., DIETRICH D. & PARK R.G. (eds.), Alpine tectonics. Geol. Soc. London, Spec. Publ., 45, 329-338.
VIEL L., BERKHEMER H. & MUELLER S. 1991: Some structural features of the Alpine lithospheric root. Tectonophysics, 195, 421-436.
WAGNER J.-J. 1984: Geophysical studies of the Ivrea Zone - a review. In: WAGNER J.-J. & MUELLER S. (eds.), Geomag-netic and gravimetric studies of the Ivrea Zone. Mat. Géol. Suisse, Sér. Géophys., 21, 13-20.
WAGNER J.-J., KLINGELÉ E. & MAGE R. 1984: Regional geomag-netic study of the southern border of the Western Alps- The Ivrea body. In: WAGNER J.-J. & MUELLER S. (eds.), Geomagnetic and gravimetric studies of the Ivrea Zone. Mat. Géol. Suisse, Sér. Géophys., 21, 21-29.
WARNER M. 1987: Migration: why doesn’t it work for deep con-tinental data? Geophys. J. R. astr. Soc., 89, 21-26.
WERNICKE B. 1985: Uniform-sense normal simple shear of the continental lithosphere. Can. J. Earth Sci., 22/1, 108-125.
WHITMARSH B. & SAWYER D.S. 1993: Upper mantle drilling in the ocean-continent transition west of Iberia. Terra Nova, 5/4, 327-331.

- 137 -
YE S. & ANSORGE J. 1990: A crustal section through the Alps derived from the EGT seismic refraction data. In: Free-man R., Giese P. & Mueller S. (eds.), The European Geotraverse: integrative studies. European Science Foundation, Strasbourg, 221-236.
YE S. 1992: Crustal structure beneath the central Swiss Alps derived from seismic refraction data. PhD thesis, Swiss Fed. Inst. Technology, Zürich.
ZALESSKI B. V. 1964: Physical and mechanical properties of rocks. Israel Program for Scientific Translations, Jerusalem.