THE TURKISH ONLINE JOURNAL - TOJETErol KARAKIRIK, Soner DURMUS Abant İzzet Baysal Üniversitesi,...
161
THE TURKISH ONLINE JOURNAL OF EDUCATIONAL TECHNOLOGY JANUARY 2005 Volume 4 - Issue 1 Assoc. Prof. Dr. Aytekin İşman Editor-in-Chief Prof. Dr. Jerry Willis Editor Fahme Dabaj Associate Editor ISSN: 1303 - 6521
Transcript of THE TURKISH ONLINE JOURNAL - TOJETErol KARAKIRIK, Soner DURMUS Abant İzzet Baysal Üniversitesi,...

THE
TURKISH ONLINE JOURNAL
OF
EDUCATIONAL TECHNOLOGY
JANUARY 2005 Volume 4 - Issue 1
Assoc. Prof. Dr. Aytekin İşman Editor-in-Chief
Prof. Dr. Jerry Willis
Editor
Fahme Dabaj Associate Editor
ISSN: 1303 - 6521
The Turkish Online Journal of Educational Technology – TOJET January 2005 ISSN: 1303-6521 volume 4 Issue 1
Copyright The Turkish Online Journal of Educational Technology 2002 2
TOJET – Volume 4 – Issue 1 – January 2005 Table of Contents
An alternative approach to Logo-based Geometry 1 Erol KARAKIRIK, Soner DURMUŞ 3
Developing A Technology Attitude Scale for Pre-Service Chemistry Teachers 2 Soner YAVUZ 17
Dynamic Visualization and Software Environments 3 Nihat BOZ 26
Improving Teacher Quality, a Keyword for Improving Education Facing Global Challenges 4 Husain JUSUF 33
Parent’s Views on Internet Use 5 H. Ferhan ODABAŞI 38
Recommendations towards Developing Educational Standards to Improve Science Education in Turkey 6 Ömer Faruk KESER
46
Teacher-Student Interactions in Distance Learning 7 Serdal TERZİ, Abdurrahman ÇELİK 54
The Relations between Global Environmental Awareness and Technology 8 Nilgün SEÇKEN 57
Toward an Effective Integration of Technology: Message Boards for Strengthening Communication 9 Arif ALTUN
68
Understanding Faculty Adoption of Technology Using the Learning/Adoption Trajectory Model: A Qualitative Case Study 10 İsmail ŞAHİN
75
User Satisfaction Evaluation of an Educational Website 11 Goknur Kaplan AKILLI 85
Fen Bilgisi Dersinde Eğitim Teknolojisi Kullanılmasına İlişkin Öğrenci Görüşleri 12 Ercan AKPINAR, Hilal AKTAMIŞ, Ömer ERGİN 93
Fen Eğitiminde Öğrencilerin Gelişimini Değerlendirmek için Elektronik Portfolyo Kullanımı Üzerine bir İnceleme 13 Hünkar KORKMAZ, Fitnat KAPTAN
101
Gazi Üniversitesi’nin Uzaktan Eğitim Potansiyeli 14 İrfan SÜER, Zeki KAYA, H. İbrahim BÜLBÜL, Hatice KARAÇANTA, Zihni KOÇ, Şaban
ÇETİN 107
Göçmen Türklere Yönelik Uzaktan Öğretim Uygulaması (F.Almanya’daki Türklerin Eğitim Sorunları ve Anadolu Üniversitesi’nin Batı Avrupa Programları) 15 Ahmet Atilla DOĞAN
114
İnternet Destekli Öğretim Sistemlerinde Bilişim Gereksinimlerinin Belirlenmesi 16 Orhan TORKUL, Cemal SEZER, Tijen ÖVER 122
İnternet Temelli Ölçmelerin Geçerliğini Sağlamada Yeni Yaklaşımlar 17 Çetin SEMERCİ, Cem BEKTAŞ 130
İnternet Üzerinden Eğitim’de Eğitim Platformu Geliştirme Kriterleri ve Uygulama Örneği 18 Caner AKÜNER 135
Oluşturmacı Öğrenme Yaklaşımının Uzmanlaşmaya Etkisi 19 Mehmet GÜROL 141
Organizasyonel Değişmede Eğitim Teknolojilerinin Rolü ve Önemi 20 Ayşen WOLFF 146
Öğretim Elemanlarının Bilgisayar Programlarını ve İnterneti Bilme ve Kullanma Amaçları (Pamukkale Üniversitesi Örneği) 21 Sadettin SARI, Ali Rıza ERDEM
151
The Turkish Online Journal of Educational Technology – TOJET January 2005 ISSN: 1303-6521 volume 4 Issue 1
Copyright The Turkish Online Journal of Educational Technology 2002 3
AN ALTERNATIVE APPROACH TO LOGO-BASED GEOMETRY
Erol KARAKIRIK, Soner DURMUS Abant İzzet Baysal Üniversitesi, Eğitim Fakültesi
[email protected], [email protected] ABSTRACT Geometry is an important branch of mathematics. Geometry curriculum can be enriched by using different Technologies such as graphing calculators and computers. Logo-based different software packages aim to improve conceptual understanding in geometry. The goals of this paper are i) to present theoretical foundations of any compute software developed to enrich primary and secondary school geometry curriculum, ii) to introduce main features of Logo, iii) to introduce a new version of Logo called LogoTurk, and iv) to present some recommendations for future research. Keywords: Geometry, Logo, LogoTurk INTRODUCTION Geometry is an important branch of mathematics. Geometry is seen as the place in the school curriculum where students learn to reason and understand the axiomatic structure of mathematics (NCTM, 2000). Since current elementary school geometry curriculums focus on lists of definitions and properties of shapes, and learning to write the proper symbolism for simple geometric concepts (Carpenter et al., 1980; Flanders, 1987), it underemphasizes relational understanding that means knowing both what to do and why. For example, learning lists of properties of quadrilaterals and triangles is as important as being involved in the process of developing and using a property-based conceptual approach for reasoning about these shapes (Battista, 2002). This approach uses such concepts as angles, sides, angle measure, length, area, congruency, and parallelism to describe and analyze spatial relationships in and among these shapes. In particular, when we define an equilateral triangle as being three-sided figure that has three equivalent angles and all sides the same length, we are using the concepts of sides, length, and angle measure to describe the spatial relationships that differentiate equilateral triangle from other triangles. Current educational theories emphasize active involvement of students on teaching-learning process. Through abstraction and reflection during this process, students construct their mathematical knowledge. Mathematics-geometry instruction should facilitate learning environment that support inquiry, problem solving and sense making in which students invent, test, and refine ideas to build complex, abstract, and powerful mathematical meanings (Battista, 2002). There are available computer software packages aiming to enrich learning environments to achieve these goals. This paper aims i) to present theoretical foundations of any computer software developed to enrich primary and secondary school geometry curriculum, ii) to introduce main features of Logo, iii) to introduce a new version of Logo called LogoTurk, and iv) to present some recommendations for future research. GEOMETRY Geometry as branch of mathematics that has special characteristics, those need to be taken into consideration. Objects and properties of objects in geometry are extremely abstract for primary school students. Students are expected to recognize shapes and comprehend their properties. Students’ developmental stage is the key that one should be aware of. There are theories developed based on studies of Piaget’s and Pierre and Dina Van Hiele’s to explain and help us on understanding of development of geometrical thinking. In Piaget’s work, there are two major themes related to geometrical thinking. Firstly, development of geometric ideas follows a definite order which is more logical than historical. Topological relations (connectedness, continuity) develop first, followed by Euclidean (angularity, parallelism, area) relations. It develops over time by integrating and synthesizing these relations to their existing schemas. Secondly, mental representation of space develops through progressive organization of the student’s motor and internalized actions. Ideas about space evolve as students interact with their environments. These two themes are supported by research (Clements & Battista, 1992). Van Hiele Theory proposes that students move through different levels of geometrical thinking. These levels are as follows:
Level 0 (Prerecognition): Since students do not comprehend visual characteristics of shapes, they are unable to identify many common shapes.
Level 1 (Visual): They can only recognize shapes as whole images. A given figure is square, for example, because it looks like a window. Students do not think of properties of shapes.

The Turkish Online Journal of Educational Technology – TOJET January 2005 ISSN: 1303-6521 volume 4 Issue 1
Copyright The Turkish Online Journal of Educational Technology 2002 4
Level 2 (Descriptive/Analytic): Students by observing, measuring, drawing, and model making can recognize and characterize shapes by their properties. For instance, a square can be thought as a figure that has four equal sides and four right angles. Students can not form classes of figures at this level. For instance, a student may not see a square as a rectangle.
Level 3 (Abstract/Relational): Students can distinguish a shape based on certain properties which it has. They can provide logical arguments, for example, the sum of the angle measures of a quadrilateral is 360, because it consists of two triangles. As students discover such properties they go beyond definitions of certain figures, for example, a square can also be seen as a rectangle because a square satisfies all conditions for being a rectangle.
Level 4 (Axiomatic): Students can establish theorems with an axiomatic structure. They recognize undefined terms, definitions, axioms, and theorems. They can produce certain number of statements to prove a statement. According to Van Hiele Theory, geometric thinking levels of students in elementary and middle school are at most level 3. Thinking at level 4 is necessary for high school geometry. According to the Van Hiele theory, the levels are progressive that students move from one level of thinking to the next. Curriculum developers and teachers should take these levels into consideration by enriching learning environment to help students to progress to a next level (Burger & Shaughnessy, 1986). There are numerous assessment reports revealing that students fail to learn basic geometric concepts especially geometric problem solving (Kouba et al., 1988; Stigler, Lee & Stevensen, 1990; the International Study Center, 1999). The current elementary and middle school geometry curriculum do facilitate opportunities for students to use their basic intuitions and simple concepts to progress to higher levels of geometric thought. Students going through such experience in elementary school do not have the necessary geometric intuition and background for a formal deductive geometry course in high schools (Hoffer, 1981; Shaughnessy & Burger, 1985). Deficiencies on conceptual and procedural understanding of students cause problems for the later study of important ideas such as vectors, coordinates, transformations, and trigonometry (Fey et al. 1984). GEOMETRY AND TECHNOLOGY NCTM’s (2000) geometry standards put emphasize on focusing on the development of careful reasoning and proof using definitions and established facts. Geometric shapes and their properties can be visualized by manipulatives. Students at level 0, 1 and 2 need to experience with concrete materials. Concrete materials such as geometry rods, geobord, isometric papers, symmetry mirrors etc. are supposed to help students construct geometric ideas. Using manipulatives benefits students across grade level, ability level, and topics which using manipulative makes sense for that topic (Driscoll, 1983; Sowell, 1989; Suydam, 1986). Clements and McMillen (1996) proposed that using Manipulatives does not always guarantee conceptual understanding: In one study, students not using manipulatives outperformed students using manipulatives on a test of transfer (Fennema, 1972). Students sometimes used manipulatives in a rote manner (Hiebert & Wearne, 1992). Clements and McMillen (1996) claims that student often fail to link their action with Manipulatives to describe the actions. Some computer manipulatives may be more beneficial than any physical manipulative. Any program having the following features can be thought as beneficial computer manipulative (Clements & McMillen, 2001, p.76). They
have uncomplicated changing, repeating, and undoing actions, allow students to save configurations and sequences of actions, dynamically link different representations and maintain a tight connection between pictured objects and
symbols, allow students and teachers to pose and solve their own problems, and allow students to develop increasing control of a flexible, extensible, mathematical tool. Such programs also
serve many purposes and help form connections between mathematical ideas. Selecting and using proper computer manipulative in learning environment should consider the following recommendations (Clements and McMillen, 2001, p.77):
Use computer manipulatives for assessment as mirrors of students' thinking, Guide students to alter and reflect on their actions, always predicting and explaining, Create tasks that cause students to see conflicts or gaps in their thinking, Have students work cooperatively in pairs, If possible, use one computer and a large-screen display to focus and extend follow-up discussions with the
class, Recognize that much information may have to be introduced before moving to work on computers, including
the purpose of the software, ways to operate the hardware and software, mathematics content and problem solving strategies, and so on,

The Turkish Online Journal of Educational Technology – TOJET January 2005 ISSN: 1303-6521 volume 4 Issue 1
Copyright The Turkish Online Journal of Educational Technology 2002 5
Use extensible programs for long periods across topics when possible. LOGO GEOMETRY Elementary school geometry should focus on the study of objects, motions, and relationships in a spatial environment (Clements & Battista, 1986; Trafton & LeBlanc, 1973). First experiences with geometry should emphasize informal study of physical shapes and their properties and have as their primary goal the development of students' intuition and knowledge about their spatial environment. Subsequent experiences should involve analyzing and abstracting geometric concepts and relationships in increasingly formal settings. Because current elementary geometry curricula focus only on identification of figures and the use of geometric terms (Kouba et al., 1988), little opportunity arises for geometric problem solving. Students have little chance to develop their spatial thinking, a skill that should have primary importance in the geometry curriculum. Students encounter little opportunity to analyze and reconceptualize substantive geometric ideas. Another deficiency in the current curriculum is that it does not always emphasize conceptualizations of topics that are most useful in the later learning of mathematics. For instance, the concept of angle normally encountered in elementary school is that of a union of two rays with a common endpoint, the same formal definition used in high school geometry. However, in trigonometry and calculus, an angle is thought of as a rotation. Existing elementary school geometry curricula do not address this second aspect of the angle concept, even though the latter aspect seems more closely related to navigation, "one of the most widespread representations of the idea of angle in the lives of contemporary Americans" (Papert, 1980, p.68). Logo geometry is developed to achieve three major goals (Clement & Battista, 2001, pp.14-15): i) achieving higher levels of geometric thinking, ii) helping students learn major geometric concepts and skills, and iii) developing power and beliefs in mathematical problem solving and reasoning. Developers of Logo Geometry have assumed that curriculum has three strands: Paths, shapes, and motions. Relational understanding can be based on these three strands. Students’ movements are recorded as paths and Logo has special commands to simulate the same movements. For instance, a command such as “FD 40” draws a straight path 40 units long. Logo has also commands that inverse this process. For instance, a command such as “BK 40” draws a straight path 40 units long in the opposite direction of previous direction which is a sort of undoing of the command “FD 40”. Logo commands help students learn to connect the idea of undoing a sequence of turtle commands to the related idea of undoing a sequence of arithmetic operations. For example, questions like “A number multiplied by 3, then added 4, if the result is 19, what should be this number?” can be solved by reversing operations addition and multiplication. Students can write different procedures to move the turtle to draw closed or nonclosed, straight and nonstraight, simple and nonsimple paths. As paths are drawn, need for turning, which is a basis for understanding angle, may arise. Students develop conceptual understanding by relating turn and angles. Students apply series of commands to draw a path. During this process, they i) learn to reflect on the Logo commands and correspondence path these command produce, ii) also correct commands related to these paths, iii) correct the procedures, iv) gain an insight of nature their errors and the ways they correct them, and vi) learn to apply this problem solving approach to different context. Second strand of Logo geometry is shapes. Shapes can be constructed by using simple paths. Logo helps students see shapes as combinations of paths. Students start to analyze shapes in terms of their components and properties. First, students identify shapes in their environment and describe and classify regions, including faces of solids. Second, students discuss properties of shapes. Finally, Students plan and write several Logo procedures to draw shapes that they observed in their environment. As Van Hiele levels are taken into consideration to help students construct the shapes by using their attributes, they can construct squares, rectangles, equilateral triangles, and regular polygons in an order by Logo procedures. Constructing regular polygons requires knowing the angle concept. Angle can be thought as a path created by a forward move, a turn, and another move. As angle concept is formed, students need to consider amount of turn which is called an angle measure. Number of sides and measure of interior angles of polygons are key attributes to distinguish regular polygons. Students need to develop conceptual understanding of these attributes before writing procedures on Logo. Differences among regular polygons once reduced to number of sides and angle measures, it may not be difficult to write Logo commands. For example, square, hexagon, and octagon can be drawn by following Logo procedures:

The Turkish Online Journal of Educational Technology – TOJET January 2005 ISSN: 1303-6521 volume 4 Issue 1
Copyright The Turkish Online Journal of Educational Technology 2002 6
Square Octagon Hexagon To square Repeat 4 [ forward 40 right 90] End.
To octagon Repeat 6 [ forward 40 right 60] End.
To hexagon Repeat 8 [ forward 40 right 45] End.
In the above example, number of repetitions and the measure of the angle used to make a turn after each forward movement determines the geometric shape constructed. For instance, 4 repetitions and 90 degree turns construct a square while 8 repetitions and 45 degree turns construct a hexagon. The total degree of the turn made in each repeat block is equal to 360 degrees. This, by itself, denotes that the constructed figure is a regular polygon. Last strand of Logo geometry is motions. The main idea of motion (transformational) geometry is that there are an infinite number of figures congruent to a given figure and that these figures may be related by a combination of geometric motions. Fundamental motions are slide, turns, and flips. The concept of congruence is base on these three motions. Any combination of these motions applied to any figure preserve the main attributes of this figure. Prior to using these concepts on Logo, students need to know that two figures are concurrent if they have the same size and shape (i.e., if and only if one fits on top of the other exactly). Two congruent figures are constructed if, and only if, there is a sequence of slides, flips, or turns that moves one onto the other. Logo commands are available to help student develop these related motion concepts. Logo "provides an operational universe within which students can define a mathematical process and then see its effects unfold. It is accessible to very young children for simple tasks, yet its operations can be systematically extended to express problems of considerable complexity" (Feurzeig & Lukas, 1972, p.39). To draw a figure in Logo, students devise a set of movement instructions for the turtle. They must determine angle measures and lengths of line segments. They can be asked to analyze the figure and break it into smaller parts that are more easily constructed. Thus, they are constantly involved in geometric problem solving. Such Logo activities encourage students to identify goals and strategies before making overt moves toward a problem solution, create efficient problem representations, make executive decisions, and debug algorithms all of which are problem-solving skills too seldom explicitly taught in the schools. In the words of Papert, "The computer allows, or obliges, the child to externalize intuitive expectations. When the intuition is translated into a program it becomes more obtrusive and more accessible to reflection" and can thus be used as material "for the work of remodeling intuitive knowledge" (1980, 145). Therefore, in the context of Logo, the teacher can help students elaborate their intuitions about the concept of rectangle by focusing their attention on its properties and by embellishing those intuitions with verbal labels and descriptions. Such elaboration is essential for progressing toward level 2, the descriptive-analytic level, in the Van Hiele hierarchy. Moreover, by designing a rectangle procedure with inputs, students begin to build intuitive knowledge about the concept of defining a rectangle. Through such a sequence of Logo-based experiences, not only are students progressing into higher levels of geometric thinking in the Van Hiele hierarchy, but also they are building conceptual structures about rectangles that can be useful in other situations, such as drawing quadrilaterals, triangles, or regular polygons. They are thus learning geometry relationally. CONCRETE TO ABSTRACT According to Piaget & Inhelder (1967), action is of paramount importance in the development of geometric conceptualizations. The child "can only 'abstract'. . . the idea of a straight line from the action of following by hand or eye without changing direction, and the idea of an angle from two intersecting movements" (p.43). Indeed, physical actions on concrete objects are necessary. But students must internalize such physical actions and abstract the corresponding geometric notions. Logo can facilitate this process, thus promoting a transition from concrete experiences with geometric ideas to abstract reasoning. For example, by first having children form paths by walking, then using Logo, children can learn to think of the turtle's actions as ones that they themselves could perform. They seem to project themselves into the place of the turtle. In so doing, they are performing a mental action--an internalized version of their own physical movements. Because children understand beginning spatial notions in terms of action and because the mathematical concept of path can be thought of as a record of movement, it seems natural to emphasize this concept in the beginning study of geometry. For example, having students visually scan the side of a wall, run their hands along the edge of a rectangular table, or walk a straight path will help them develop an intuitive concept of straightness. But in Logo, the essence of this abstract concept can be brought to a more explicit level of awareness as a "turtle path that has no turning." Because the concept is explicit and reformulated in a more formal and precise language, it can be internalized in a more abstract form. Thus, we believe that the concept of path should be taught explicitly,
The Turkish Online Journal of Educational Technology – TOJET January 2005 ISSN: 1303-6521 volume 4 Issue 1
Copyright The Turkish Online Journal of Educational Technology 2002 7
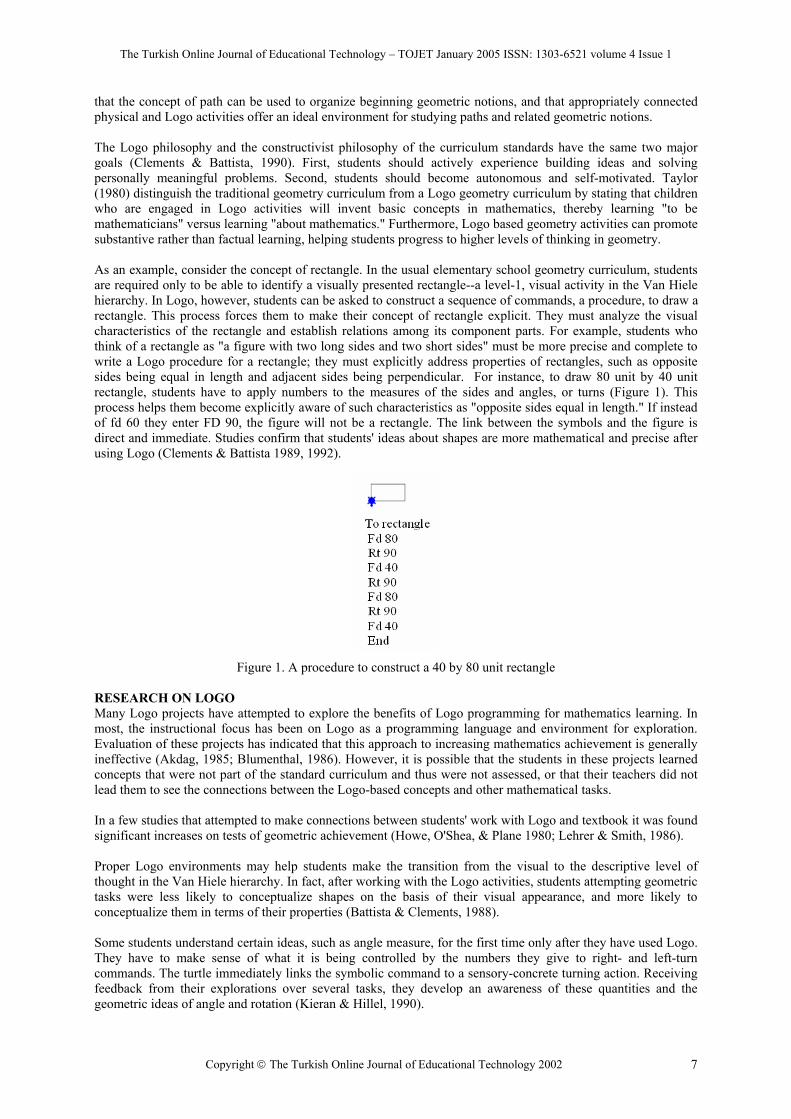
that the concept of path can be used to organize beginning geometric notions, and that appropriately connected physical and Logo activities offer an ideal environment for studying paths and related geometric notions. The Logo philosophy and the constructivist philosophy of the curriculum standards have the same two major goals (Clements & Battista, 1990). First, students should actively experience building ideas and solving personally meaningful problems. Second, students should become autonomous and self-motivated. Taylor (1980) distinguish the traditional geometry curriculum from a Logo geometry curriculum by stating that children who are engaged in Logo activities will invent basic concepts in mathematics, thereby learning "to be mathematicians" versus learning "about mathematics." Furthermore, Logo based geometry activities can promote substantive rather than factual learning, helping students progress to higher levels of thinking in geometry. As an example, consider the concept of rectangle. In the usual elementary school geometry curriculum, students are required only to be able to identify a visually presented rectangle--a level-1, visual activity in the Van Hiele hierarchy. In Logo, however, students can be asked to construct a sequence of commands, a procedure, to draw a rectangle. This process forces them to make their concept of rectangle explicit. They must analyze the visual characteristics of the rectangle and establish relations among its component parts. For example, students who think of a rectangle as "a figure with two long sides and two short sides" must be more precise and complete to write a Logo procedure for a rectangle; they must explicitly address properties of rectangles, such as opposite sides being equal in length and adjacent sides being perpendicular. For instance, to draw 80 unit by 40 unit rectangle, students have to apply numbers to the measures of the sides and angles, or turns (Figure 1). This process helps them become explicitly aware of such characteristics as "opposite sides equal in length." If instead of fd 60 they enter FD 90, the figure will not be a rectangle. The link between the symbols and the figure is direct and immediate. Studies confirm that students' ideas about shapes are more mathematical and precise after using Logo (Clements & Battista 1989, 1992).
Figure 1. A procedure to construct a 40 by 80 unit rectangle RESEARCH ON LOGO Many Logo projects have attempted to explore the benefits of Logo programming for mathematics learning. In most, the instructional focus has been on Logo as a programming language and environment for exploration. Evaluation of these projects has indicated that this approach to increasing mathematics achievement is generally ineffective (Akdag, 1985; Blumenthal, 1986). However, it is possible that the students in these projects learned concepts that were not part of the standard curriculum and thus were not assessed, or that their teachers did not lead them to see the connections between the Logo-based concepts and other mathematical tasks. In a few studies that attempted to make connections between students' work with Logo and textbook it was found significant increases on tests of geometric achievement (Howe, O'Shea, & Plane 1980; Lehrer & Smith, 1986). Proper Logo environments may help students make the transition from the visual to the descriptive level of thought in the Van Hiele hierarchy. In fact, after working with the Logo activities, students attempting geometric tasks were less likely to conceptualize shapes on the basis of their visual appearance, and more likely to conceptualize them in terms of their properties (Battista & Clements, 1988). Some students understand certain ideas, such as angle measure, for the first time only after they have used Logo. They have to make sense of what it is being controlled by the numbers they give to right- and left-turn commands. The turtle immediately links the symbolic command to a sensory-concrete turning action. Receiving feedback from their explorations over several tasks, they develop an awareness of these quantities and the geometric ideas of angle and rotation (Kieran & Hillel, 1990).
The Turkish Online Journal of Educational Technology – TOJET January 2005 ISSN: 1303-6521 volume 4 Issue 1
Copyright The Turkish Online Journal of Educational Technology 2002 8
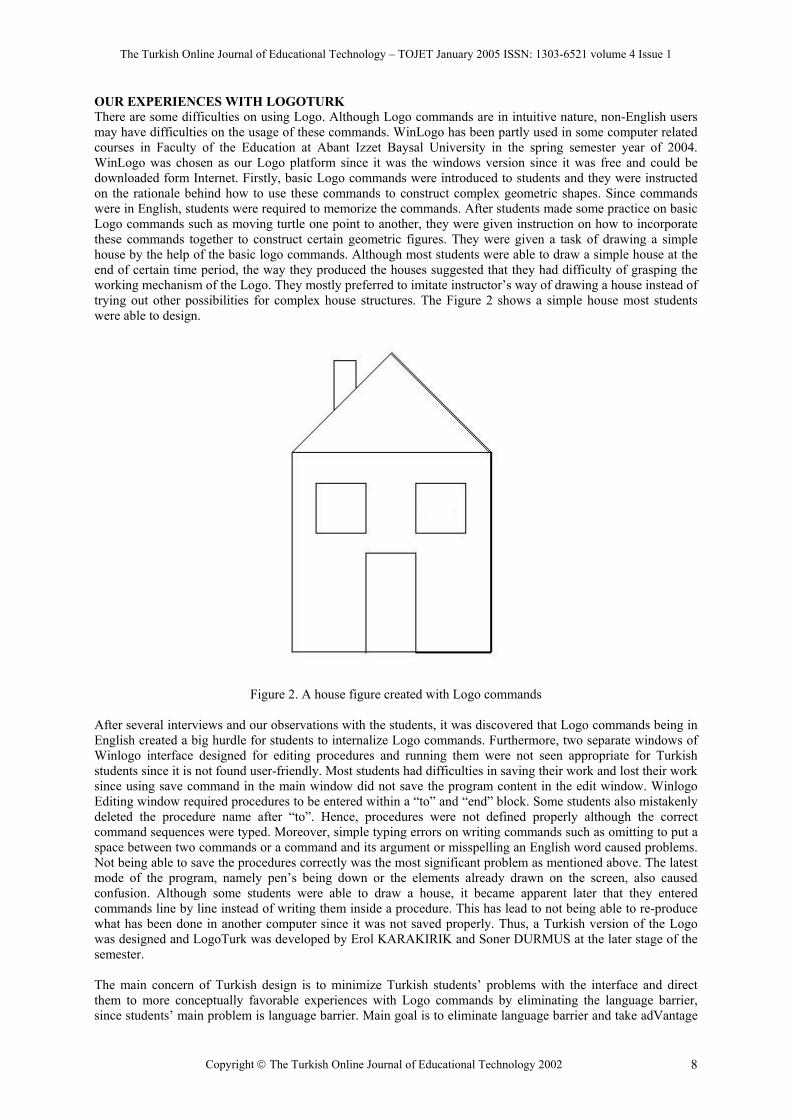
OUR EXPERIENCES WITH LOGOTURK There are some difficulties on using Logo. Although Logo commands are in intuitive nature, non-English users may have difficulties on the usage of these commands. WinLogo has been partly used in some computer related courses in Faculty of the Education at Abant Izzet Baysal University in the spring semester year of 2004. WinLogo was chosen as our Logo platform since it was the windows version since it was free and could be downloaded form Internet. Firstly, basic Logo commands were introduced to students and they were instructed on the rationale behind how to use these commands to construct complex geometric shapes. Since commands were in English, students were required to memorize the commands. After students made some practice on basic Logo commands such as moving turtle one point to another, they were given instruction on how to incorporate these commands together to construct certain geometric figures. They were given a task of drawing a simple house by the help of the basic logo commands. Although most students were able to draw a simple house at the end of certain time period, the way they produced the houses suggested that they had difficulty of grasping the working mechanism of the Logo. They mostly preferred to imitate instructor’s way of drawing a house instead of trying out other possibilities for complex house structures. The Figure 2 shows a simple house most students were able to design.
Figure 2. A house figure created with Logo commands
After several interviews and our observations with the students, it was discovered that Logo commands being in English created a big hurdle for students to internalize Logo commands. Furthermore, two separate windows of Winlogo interface designed for editing procedures and running them were not seen appropriate for Turkish students since it is not found user-friendly. Most students had difficulties in saving their work and lost their work since using save command in the main window did not save the program content in the edit window. Winlogo Editing window required procedures to be entered within a “to” and “end” block. Some students also mistakenly deleted the procedure name after “to”. Hence, procedures were not defined properly although the correct command sequences were typed. Moreover, simple typing errors on writing commands such as omitting to put a space between two commands or a command and its argument or misspelling an English word caused problems. Not being able to save the procedures correctly was the most significant problem as mentioned above. The latest mode of the program, namely pen’s being down or the elements already drawn on the screen, also caused confusion. Although some students were able to draw a house, it became apparent later that they entered commands line by line instead of writing them inside a procedure. This has lead to not being able to re-produce what has been done in another computer since it was not saved properly. Thus, a Turkish version of the Logo was designed and LogoTurk was developed by Erol KARAKIRIK and Soner DURMUS at the later stage of the semester. The main concern of Turkish design is to minimize Turkish students’ problems with the interface and direct them to more conceptually favorable experiences with Logo commands by eliminating the language barrier, since students’ main problem is language barrier. Main goal is to eliminate language barrier and take adVantage

The Turkish Online Journal of Educational Technology – TOJET January 2005 ISSN: 1303-6521 volume 4 Issue 1
Copyright The Turkish Online Journal of Educational Technology 2002 9
of conceptual part of original Logo. Proposed Logo (LogoTurk) has considered these difficulties. It is designed in a way that commands can be entered in Turkish. This has enabled students to use their own language to move the turtle in any direction they want. For example, instead of using “fd” command, students could use “ig”. Students can use English, Turkish or combination of both in LogoTurk. LogoTurk design included both Turkish and English commands in both long and short forms. Table 1 shows LogoTurk commands that are all equivalent and could be used interchangeable.
Table 1. Some LogoTurk commands Explanation Turkish Short Turkish Long English Short English Long Moves turtle 40 Pixels Forward
ig 40 Ileri 40 Fd 40 Forward 40
Moves turtle 40 Pixels backward
gg 40 Geri 40 Bk 40 Back 30
Set the pen mode down, it paints
Ka kalemaşağı pd Pendown
Set the pen mode up, it does not paint
Ky kalemyukarı pu Penup
All forms of all commands were implemented in LogoTurk. One can easily change from one mode to another by related language menu commands. For instance, all commands could be change from Turkish short form to English long form or from English long form to Turkish short form. Screenshots in Figure 3 show four different modes of the program for the same commands. This language feature is aimed to teach students English versions of the commands in order to be used in classical Logo packages if needed. Using Turkish equivalent of basic commands seemed to relieve students’ anxiety towards Logo. Hence, it is suggested that English version of Logo should not be seen as a standard and the development of local versions of logo should be supported.
Figure 3. Screenshots from LogoTurk showing four different modes for the same commands
Taking students’ difficulties into account, it is also decided to put editing window inside the main window. It was observed that students had fewer difficulties with this sort of interface design than WinLogo. In classical Logo packages, a procedure starts with “to” and ends with “end”. All commands of a procedure are between “to” and “end”. The procedures’ name must be entered after “to”. All commands can be written in one line by separating them with a space. For example, to construct a square, a procedure could be written as follows:
The Turkish Online Journal of Educational Technology – TOJET January 2005 ISSN: 1303-6521 volume 4 Issue 1
Copyright The Turkish Online Journal of Educational Technology 2002 10
To square fd 40 rt 90 fd 40 rt 90 fd 40 rt 90 fd 40 end
Or
To square repeat 4 [fd 40 rt 90] end
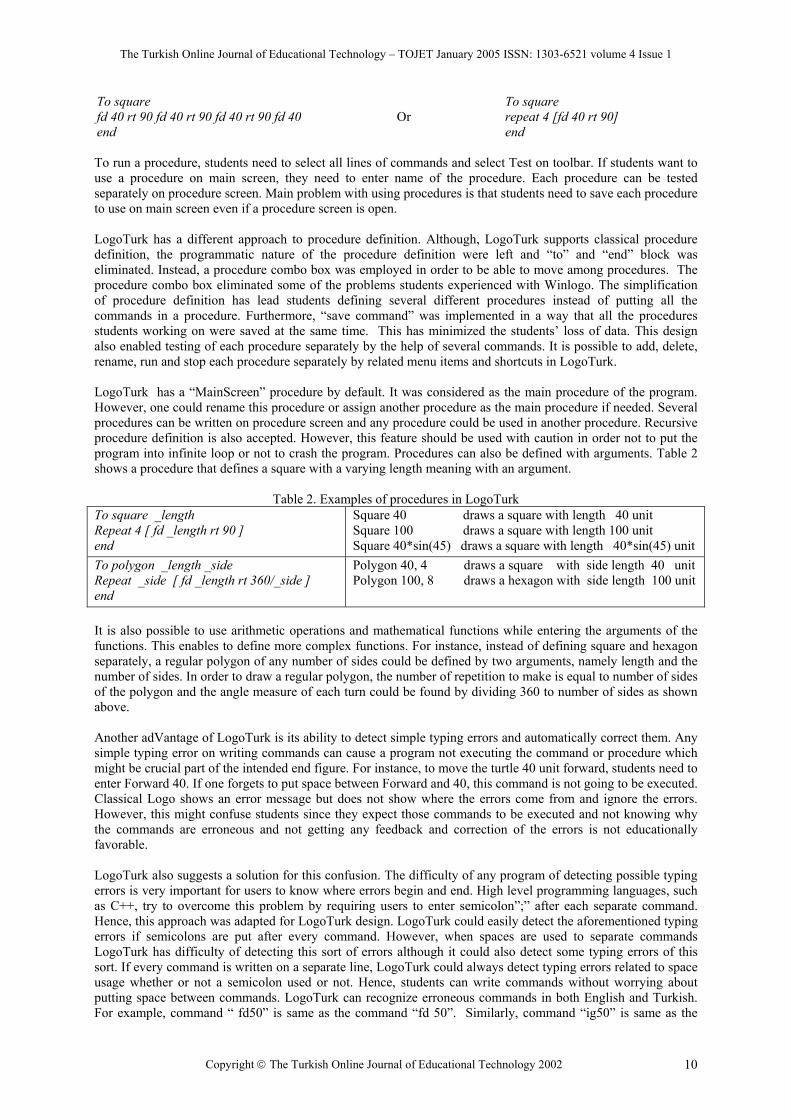
To run a procedure, students need to select all lines of commands and select Test on toolbar. If students want to use a procedure on main screen, they need to enter name of the procedure. Each procedure can be tested separately on procedure screen. Main problem with using procedures is that students need to save each procedure to use on main screen even if a procedure screen is open. LogoTurk has a different approach to procedure definition. Although, LogoTurk supports classical procedure definition, the programmatic nature of the procedure definition were left and “to” and “end” block was eliminated. Instead, a procedure combo box was employed in order to be able to move among procedures. The procedure combo box eliminated some of the problems students experienced with Winlogo. The simplification of procedure definition has lead students defining several different procedures instead of putting all the commands in a procedure. Furthermore, “save command” was implemented in a way that all the procedures students working on were saved at the same time. This has minimized the students’ loss of data. This design also enabled testing of each procedure separately by the help of several commands. It is possible to add, delete, rename, run and stop each procedure separately by related menu items and shortcuts in LogoTurk. LogoTurk has a “MainScreen” procedure by default. It was considered as the main procedure of the program. However, one could rename this procedure or assign another procedure as the main procedure if needed. Several procedures can be written on procedure screen and any procedure could be used in another procedure. Recursive procedure definition is also accepted. However, this feature should be used with caution in order not to put the program into infinite loop or not to crash the program. Procedures can also be defined with arguments. Table 2 shows a procedure that defines a square with a varying length meaning with an argument.
Table 2. Examples of procedures in LogoTurk To square _length Repeat 4 [ fd _length rt 90 ] end
Square 40 draws a square with length 40 unit Square 100 draws a square with length 100 unit Square 40*sin(45) draws a square with length 40*sin(45) unit
To polygon _length _side Repeat _side [ fd _length rt 360/_side ] end
Polygon 40, 4 draws a square with side length 40 unit Polygon 100, 8 draws a hexagon with side length 100 unit
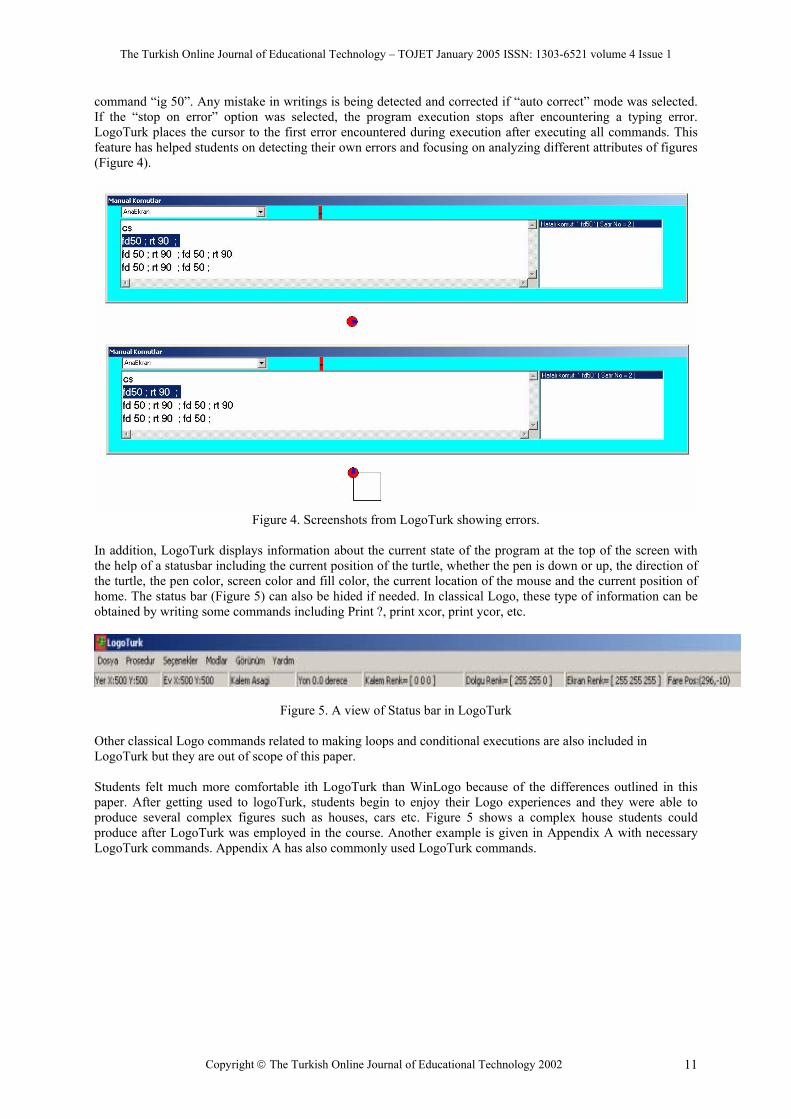
It is also possible to use arithmetic operations and mathematical functions while entering the arguments of the functions. This enables to define more complex functions. For instance, instead of defining square and hexagon separately, a regular polygon of any number of sides could be defined by two arguments, namely length and the number of sides. In order to draw a regular polygon, the number of repetition to make is equal to number of sides of the polygon and the angle measure of each turn could be found by dividing 360 to number of sides as shown above. Another adVantage of LogoTurk is its ability to detect simple typing errors and automatically correct them. Any simple typing error on writing commands can cause a program not executing the command or procedure which might be crucial part of the intended end figure. For instance, to move the turtle 40 unit forward, students need to enter Forward 40. If one forgets to put space between Forward and 40, this command is not going to be executed. Classical Logo shows an error message but does not show where the errors come from and ignore the errors. However, this might confuse students since they expect those commands to be executed and not knowing why the commands are erroneous and not getting any feedback and correction of the errors is not educationally favorable. LogoTurk also suggests a solution for this confusion. The difficulty of any program of detecting possible typing errors is very important for users to know where errors begin and end. High level programming languages, such as C++, try to overcome this problem by requiring users to enter semicolon”;” after each separate command. Hence, this approach was adapted for LogoTurk design. LogoTurk could easily detect the aforementioned typing errors if semicolons are put after every command. However, when spaces are used to separate commands LogoTurk has difficulty of detecting this sort of errors although it could also detect some typing errors of this sort. If every command is written on a separate line, LogoTurk could always detect typing errors related to space usage whether or not a semicolon used or not. Hence, students can write commands without worrying about putting space between commands. LogoTurk can recognize erroneous commands in both English and Turkish. For example, command “ fd50” is same as the command “fd 50”. Similarly, command “ig50” is same as the
The Turkish Online Journal of Educational Technology – TOJET January 2005 ISSN: 1303-6521 volume 4 Issue 1
Copyright The Turkish Online Journal of Educational Technology 2002 11
command “ig 50”. Any mistake in writings is being detected and corrected if “auto correct” mode was selected. If the “stop on error” option was selected, the program execution stops after encountering a typing error. LogoTurk places the cursor to the first error encountered during execution after executing all commands. This feature has helped students on detecting their own errors and focusing on analyzing different attributes of figures (Figure 4).
Figure 4. Screenshots from LogoTurk showing errors.
In addition, LogoTurk displays information about the current state of the program at the top of the screen with the help of a statusbar including the current position of the turtle, whether the pen is down or up, the direction of the turtle, the pen color, screen color and fill color, the current location of the mouse and the current position of home. The status bar (Figure 5) can also be hided if needed. In classical Logo, these type of information can be obtained by writing some commands including Print ?, print xcor, print ycor, etc.
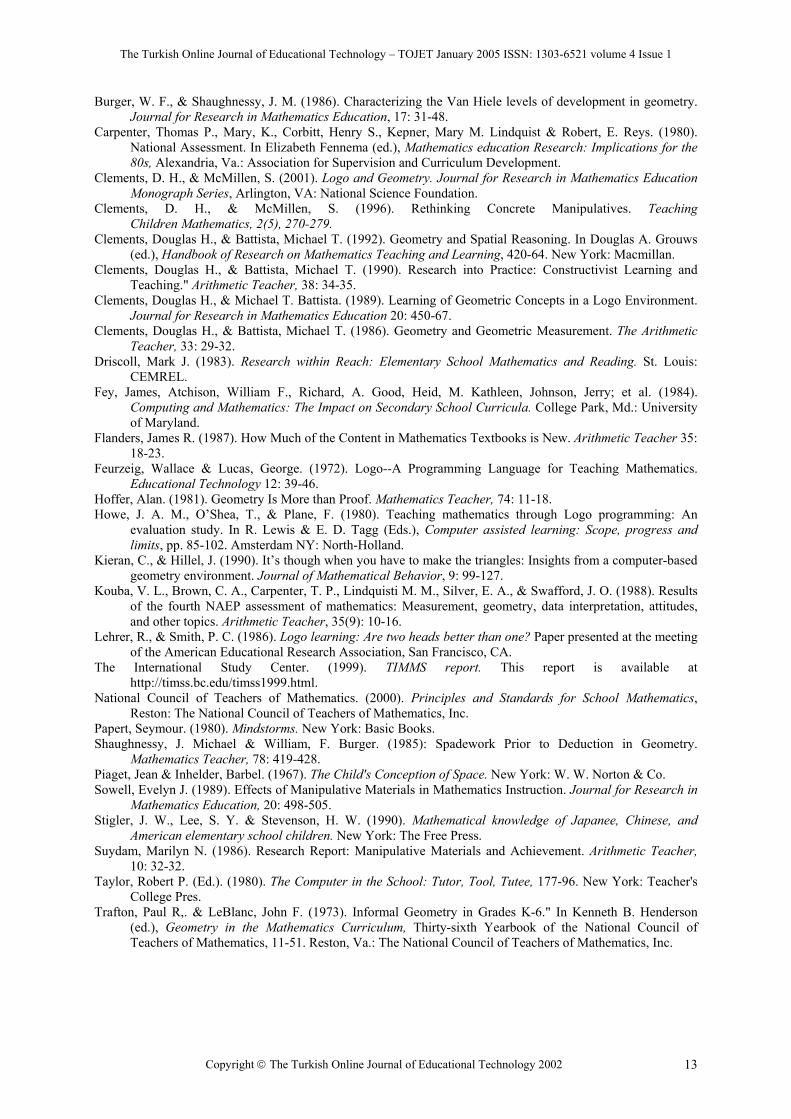
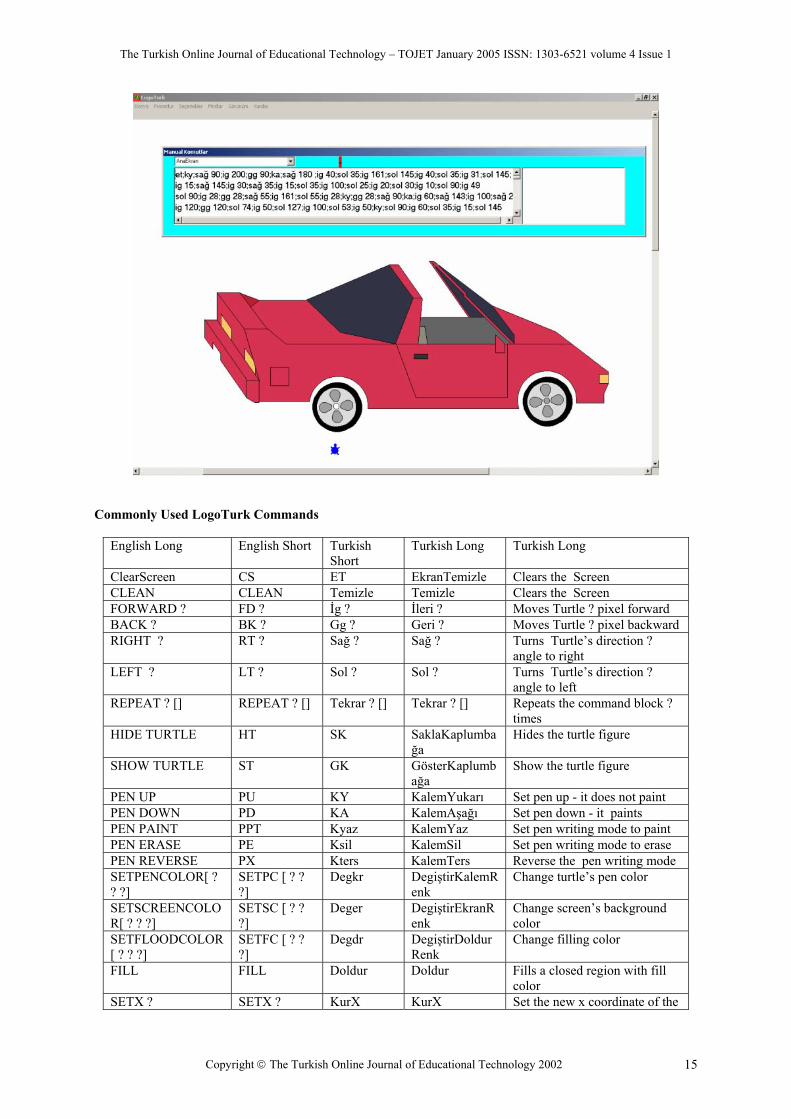
Figure 5. A view of Status bar in LogoTurk Other classical Logo commands related to making loops and conditional executions are also included in LogoTurk but they are out of scope of this paper. Students felt much more comfortable ith LogoTurk than WinLogo because of the differences outlined in this paper. After getting used to logoTurk, students begin to enjoy their Logo experiences and they were able to produce several complex figures such as houses, cars etc. Figure 5 shows a complex house students could produce after LogoTurk was employed in the course. Another example is given in Appendix A with necessary LogoTurk commands. Appendix A has also commonly used LogoTurk commands.

The Turkish Online Journal of Educational Technology – TOJET January 2005 ISSN: 1303-6521 volume 4 Issue 1
Copyright The Turkish Online Journal of Educational Technology 2002 12
Figure 4. A house figure created with LogoTurk commands. RECOMMENDATIONS FOR FUTURE RESEARCH It is proposed that designing user friendly interfaces for Logo may change dramatically students’ perception of Logo and made them focus on more conceptual oriented geometrical tasks. There is still room for making changes in the graphical interface of LogoTurk to have students much better experiences and interactions with Logo geometry. It is proposed that LogoTurk enhanced Turkish students’ Logo geometry experiences by removing the English language barrier. Requiring students to type Logo commands line by line is not seen proper in Windows environment. Hence, there is need for improvement in graphical interface. It is suggested that replacing some basic commands of Logo with user-friendly graphical elements might improve students’ interaction and help them understand better the geometrical concepts and relations. There is also a need to investigate the effects of a Logo-based learning environment on students’ attitudes and problem solving performances at the primary grades in general towards geometry. Logo environments have the potential to transform both the method and content of the elementary geometry curriculum. Our experience with LogoTurk suggests that Logo-based learning environments have the potential to enhance students’ geometry experiences and facilitate constructing their geometrical concepts and relations. This might also have consequences for changing the methods and the content of the current elementary geometry curriculum. REFERENCES Akdag, F. S. (1985). The effects of computer programming on young children’s learning. Unpublished doctoral
dissertation, Ohio State University. Battista, Michael T. (2002). Learning Geometry in a Dynamic Computer Environment. Teaching Children
Mathematics, 8 (6): 633-639. Battista, M. T., & Clements, D. H. (1988). A case for a Logo-based elementary school geometry curriculum.
Arithmetic Teacher, 36: 11-17. Blumenthal, Wendy. (1986). The Effects of Computer Instruction on Low Achieving Children's Academic Self-
beliefs and Performance. Unpublished doctoral dissertation, Nova University.
The Turkish Online Journal of Educational Technology – TOJET January 2005 ISSN: 1303-6521 volume 4 Issue 1
Copyright The Turkish Online Journal of Educational Technology 2002 13
Burger, W. F., & Shaughnessy, J. M. (1986). Characterizing the Van Hiele levels of development in geometry. Journal for Research in Mathematics Education, 17: 31-48.
Carpenter, Thomas P., Mary, K., Corbitt, Henry S., Kepner, Mary M. Lindquist & Robert, E. Reys. (1980). National Assessment. In Elizabeth Fennema (ed.), Mathematics education Research: Implications for the 80s, Alexandria, Va.: Association for Supervision and Curriculum Development.
Clements, D. H., & McMillen, S. (2001). Logo and Geometry. Journal for Research in Mathematics Education Monograph Series, Arlington, VA: National Science Foundation.
Clements, D. H., & McMillen, S. (1996). Rethinking Concrete Manipulatives. Teaching Children Mathematics, 2(5), 270-279.
Clements, Douglas H., & Battista, Michael T. (1992). Geometry and Spatial Reasoning. In Douglas A. Grouws (ed.), Handbook of Research on Mathematics Teaching and Learning, 420-64. New York: Macmillan.
Clements, Douglas H., & Battista, Michael T. (1990). Research into Practice: Constructivist Learning and Teaching." Arithmetic Teacher, 38: 34-35.
Clements, Douglas H., & Michael T. Battista. (1989). Learning of Geometric Concepts in a Logo Environment. Journal for Research in Mathematics Education 20: 450-67.
Clements, Douglas H., & Battista, Michael T. (1986). Geometry and Geometric Measurement. The Arithmetic Teacher, 33: 29-32.
Driscoll, Mark J. (1983). Research within Reach: Elementary School Mathematics and Reading. St. Louis: CEMREL.
Fey, James, Atchison, William F., Richard, A. Good, Heid, M. Kathleen, Johnson, Jerry; et al. (1984). Computing and Mathematics: The Impact on Secondary School Curricula. College Park, Md.: University of Maryland.
Flanders, James R. (1987). How Much of the Content in Mathematics Textbooks is New. Arithmetic Teacher 35: 18-23.
Feurzeig, Wallace & Lucas, George. (1972). Logo--A Programming Language for Teaching Mathematics. Educational Technology 12: 39-46.
Hoffer, Alan. (1981). Geometry Is More than Proof. Mathematics Teacher, 74: 11-18. Howe, J. A. M., O’Shea, T., & Plane, F. (1980). Teaching mathematics through Logo programming: An
evaluation study. In R. Lewis & E. D. Tagg (Eds.), Computer assisted learning: Scope, progress and limits, pp. 85-102. Amsterdam NY: North-Holland.
Kieran, C., & Hillel, J. (1990). It’s though when you have to make the triangles: Insights from a computer-based geometry environment. Journal of Mathematical Behavior, 9: 99-127.
Kouba, V. L., Brown, C. A., Carpenter, T. P., Lindquisti M. M., Silver, E. A., & Swafford, J. O. (1988). Results of the fourth NAEP assessment of mathematics: Measurement, geometry, data interpretation, attitudes, and other topics. Arithmetic Teacher, 35(9): 10-16.
Lehrer, R., & Smith, P. C. (1986). Logo learning: Are two heads better than one? Paper presented at the meeting of the American Educational Research Association, San Francisco, CA.
The International Study Center. (1999). TIMMS report. This report is available at http://timss.bc.edu/timss1999.html.
National Council of Teachers of Mathematics. (2000). Principles and Standards for School Mathematics, Reston: The National Council of Teachers of Mathematics, Inc.
Papert, Seymour. (1980). Mindstorms. New York: Basic Books. Shaughnessy, J. Michael & William, F. Burger. (1985): Spadework Prior to Deduction in Geometry.
Mathematics Teacher, 78: 419-428. Piaget, Jean & Inhelder, Barbel. (1967). The Child's Conception of Space. New York: W. W. Norton & Co. Sowell, Evelyn J. (1989). Effects of Manipulative Materials in Mathematics Instruction. Journal for Research in
Mathematics Education, 20: 498-505. Stigler, J. W., Lee, S. Y. & Stevenson, H. W. (1990). Mathematical knowledge of Japanee, Chinese, and
American elementary school children. New York: The Free Press. Suydam, Marilyn N. (1986). Research Report: Manipulative Materials and Achievement. Arithmetic Teacher,
10: 32-32. Taylor, Robert P. (Ed.). (1980). The Computer in the School: Tutor, Tool, Tutee, 177-96. New York: Teacher's
College Pres. Trafton, Paul R,. & LeBlanc, John F. (1973). Informal Geometry in Grades K-6." In Kenneth B. Henderson
(ed.), Geometry in the Mathematics Curriculum, Thirty-sixth Yearbook of the National Council of Teachers of Mathematics, 11-51. Reston, Va.: The National Council of Teachers of Mathematics, Inc.

The Turkish Online Journal of Educational Technology – TOJET January 2005 ISSN: 1303-6521 volume 4 Issue 1
Copyright The Turkish Online Journal of Educational Technology 2002 14
APPENDIX A A car drawn in LogoTurk Procedure AnaEkran et;ky;sağ 90;ig 200;gg 90;ka;sağ 180 ; ig 40;sol 35;ig 161;sol 145;ig 40;sol 35;ig 31;sol 145; ig 15;sağ 145;ig 30;sağ 35;ig 15;sol 35;ig 100 ;sol 25;ig 20;sol 30;ig 10;sol 90;ig 49 sol 90;ig 28;gg 28;sağ 55;ig 161;sol 55;ig 28;ky ;gg 28;sağ 90;ka;ig 60;sağ 143;ig 100;sağ 21 ig 120;gg 120;sol 74;ig 50;sol 127;ig 100;sol 53;ig 50;ky;sol 90;ig 60;sol 35; ig 15;sol 145; ka;ig 25;sağ 145;ig 40;sağ 35;ig 25;sol 35;ky ig 51;sol 145;ka;ig 25;sağ 145;ig 31;ky;ig 9 ;sağ 35;ig 8;ka;ig 18;ky;gg 179;sağ 90;ig 34 sol 160;ka;ig 46;sol 20;ig 100;sol 23;ig 200 ;sağ 23;ig 20;sağ 55;ig 90;sağ 40;ig 100;sağ 85 ig 50;sağ 111;ig 108;sağ 70;ig 20;ky;gg 20;ka ;sol 127;ig 90;ky;sol 149;ig 175;sağ 95;ka;ig 240 sağ 40;ig 53;ky;sağ 13;ig 60;sağ 90;ka;ig 25;ky ;sağ 36;ig 102;sağ 90;ig 2;sol 45;ka;ig 102 sol 32;ig 125;sol 12;ig 220;ky;ig 20;ka;ig 20; sol 135;ig 150;sağ 45;ig 5;sol 45;ig 100; sol 45;ig 10;sol 125;ig 150;sol 55;ig 37;ky; gg 33;sol 125;ka;ig 145;ka; sağ 170;ig 98;ky sağ 45;ka;ig 5;sol 45;ig 147;sol 45;ig 6;sol 90; ig 20;sol 37;ig 80;sol 15,5;ig 160;ky;gg 160; sağ 165;ka;ig 150;sağ 15;ig 145;sağ 52;ig 25; sağ 90;ig 20;sağ 90;ig 20;sağ 90;ig 20;sağ 90; ky;ig 20;sağ 23;ka;ig 25;sol 23;ig 20;sağ 90,5;ig 60;sağ 90 ;cember 9,8; sağ 110;ig 330;sağ 90; ccember 9,8 ;sağ 86 ;ig 110;ky;sağ 90;ig 35;sağ 90;ig 25 ka;ig 40;sol 90;ig 40;sol 90;ig 40;sol 90;ig 40;ky ;gg 91;sol 90;ig 275;sağ 70;ka;ig 125;sol 70 ig 200;sol 90;ig 117;ky;sol 90;ig 5;sağ 45;ka;ig 30 ;sol 135;ig 40;sol 90;ig 20;sol 90;ig 20;ky;ig 58;sol 90 ig 80;ka;ig 105;ky;ig 5;sol 90;ig 20;sol 90;ig 5; ka;ig 10;sağ 80;ig 42;ky;sağ 10;ig 20;ka ig 10;sağ 90;ig 30;sağ 90;ig 10;sağ 90;ig 30 ;ky;sol 90;ig 22;sağ 90;ig 185;ka;ig 130;ky sağ 90;ig 130;sol 90;ky;gg 55 ;teker ;ky;sol 68;ig 67;sağ 90;ka;ky;ig 445;sağ 180 teker ;ky;sağ 90;ig 40;degdr 215,50,80;doldur; sol 80;ig 80;degdr 215,50,80;doldur ;ig 80;degdr 215,50,80;doldur sağ 90;ig 8;degdr 215,50,80;doldur ;sol 90;ig 15;degdr 215,50,80;doldur ; gg 32;degdr 215,50,80;doldur ;sağ 90;gg 3;degdr 215,50,80;doldur sol 10;ig 25;degdr 250,200,100;doldur; ig 60;degdr 215,50,80;doldur ;sol 25;ig 50;degdr 250,200,100;doldur sağ 90;ig 50;degdr 215,50,80;doldur ;ig 30;degdr 190,30,50;doldur;sağ 80;ig 50;degdr 215,50,80;doldur; sol 40;ig 150;degdr 50,50,70;doldur sağ 40;ig 170;degdr 215,50,80;doldur; ig 40;degdr 50,50,50;doldur;sol 130;ig 40;degdr 215,50,80;doldur; sağ 5;ig 100;degdr 215,50,80;doldur; sağ 90;ig 100;degdr 215,50,80;doldur; gg 15;degdr 50,50,70;doldur ; ig 30;degdr 50,50,70;doldur ;sağ 140;ig 145;degdr 140,140,120;doldur ;gg 40;degdr 100,100,100;doldur;sol 115;ig 155;degdr 215,50,80;doldur; sol 80;ig 60;degdr 215,50,80;doldur ;sağ 85;ig 222;degdr 250,200,100;doldur ;sağ 120;ig 92;degdr 0,0,0;doldur; ig 8;degdr 220,220,220;doldur ;ig 8;degdr 160,160,160;doldur ;ig 30;degdr 160,160,160;doldur; sağ 70;ig 35;degdr 160,160,160;doldur ;sağ 80;ig 30;degdr 160,160,160;doldur ;sol 35;gg 35;degdr 160,160,160;doldur ;sol 85;ig 405;degdr 0,0,0;doldur;ig 15;degdr 220,220,220;doldur;sağ 5;ig 15;degdr 160,160,160;doldur; ig 40;degdr 160,160,160;doldur ;sağ 135;ig 25;degdr 160,160,160;doldur; sol 45;gg 35;degdr 160,160,160;doldur;gg 70; Procedure cember _a _b tekrar 25[ig _a;sol _b] Procedure cember _c _d tekrar 22,9 [ig _c;sol _d] Procedure teker ka;tekrar 36[ig 1;sol 10];sk;gg 4;ky;sağ 90;ig 4;sağ 22;ka;ig 10; tekrar 15[ig 3;sol 15] ;sol 10;ig 14;sol 55;ig 10 ;ky;gg 15;sağ 90;ig 7;sağ 90; sağ 22;ka;ig 10;tekrar 15[ig 3;sol 15] ;sol 10;ig 14;sol 55;ig 10;gk;ky ;gg 15;sağ 80;ig 7;sağ 95; sağ 22;ka;ig 10 ;tekrar 15[ig 3;sol 15] ;sol 10;ig 14;sol 55;ig 10;sk ;gk;ky;gg 15;sağ 90;ig 7;sağ 90 ;sağ 22;ka;ig 10 ;tekrar 15[ig 3;sol 15] ;sol 10;ig 14;sol 55;ig 10;sk;gk;sol 5;ky;ig 38; sol 90;gg 12;ka ;tekrar 46[ig 6;sol 8]; ky;sağ 120;ig 12;sol 117;ka ;tekrar 50[ig 7; sol 7,5]
The Turkish Online Journal of Educational Technology – TOJET January 2005 ISSN: 1303-6521 volume 4 Issue 1
Copyright The Turkish Online Journal of Educational Technology 2002 15
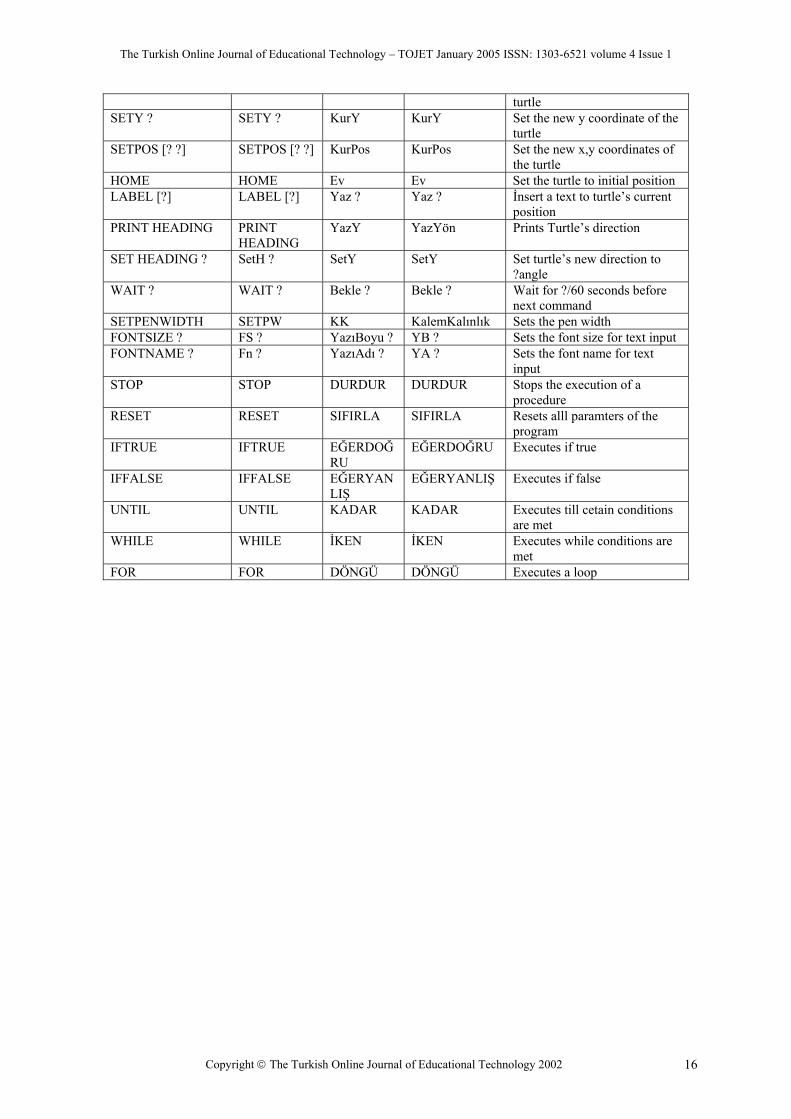
Commonly Used LogoTurk Commands
English Long English Short Turkish Short
Turkish Long Turkish Long
ClearScreen CS ET EkranTemizle Clears the Screen CLEAN CLEAN Temizle Temizle Clears the Screen FORWARD ? FD ? İg ? İleri ? Moves Turtle ? pixel forward BACK ? BK ? Gg ? Geri ? Moves Turtle ? pixel backward RIGHT ? RT ? Sağ ? Sağ ? Turns Turtle’s direction ?
angle to right LEFT ? LT ? Sol ? Sol ? Turns Turtle’s direction ?
angle to left REPEAT ? [] REPEAT ? [] Tekrar ? [] Tekrar ? [] Repeats the command block ?
times HIDE TURTLE HT SK SaklaKaplumba
ğa Hides the turtle figure
SHOW TURTLE ST GK GösterKaplumbağa
Show the turtle figure
PEN UP PU KY KalemYukarı Set pen up - it does not paint PEN DOWN PD KA KalemAşağı Set pen down - it paints PEN PAINT PPT Kyaz KalemYaz Set pen writing mode to paint PEN ERASE PE Ksil KalemSil Set pen writing mode to erase PEN REVERSE PX Kters KalemTers Reverse the pen writing mode SETPENCOLOR[ ? ? ?]
SETPC [ ? ? ?]
Degkr DegiştirKalemRenk
Change turtle’s pen color
SETSCREENCOLOR[ ? ? ?]
SETSC [ ? ? ?]
Deger DegiştirEkranRenk
Change screen’s background color
SETFLOODCOLOR[ ? ? ?]
SETFC [ ? ? ?]
Degdr DegiştirDoldurRenk
Change filling color
FILL FILL Doldur Doldur Fills a closed region with fill color
SETX ? SETX ? KurX KurX Set the new x coordinate of the
The Turkish Online Journal of Educational Technology – TOJET January 2005 ISSN: 1303-6521 volume 4 Issue 1
Copyright The Turkish Online Journal of Educational Technology 2002 16
turtle SETY ? SETY ? KurY KurY Set the new y coordinate of the
turtle SETPOS [? ?] SETPOS [? ?] KurPos KurPos Set the new x,y coordinates of
the turtle HOME HOME Ev Ev Set the turtle to initial position LABEL [?] LABEL [?] Yaz ? Yaz ? İnsert a text to turtle’s current
position PRINT HEADING PRINT
HEADING YazY YazYön Prints Turtle’s direction
SET HEADING ? SetH ? SetY SetY Set turtle’s new direction to ?angle
WAIT ? WAIT ? Bekle ? Bekle ? Wait for ?/60 seconds before next command
SETPENWIDTH SETPW KK KalemKalınlık Sets the pen width FONTSIZE ? FS ? YazıBoyu ? YB ? Sets the font size for text input FONTNAME ? Fn ? YazıAdı ? YA ? Sets the font name for text
input STOP STOP DURDUR DURDUR Stops the execution of a
procedure RESET RESET SIFIRLA SIFIRLA Resets alll paramters of the
program IFTRUE IFTRUE EĞERDOĞ
RU EĞERDOĞRU Executes if true
IFFALSE IFFALSE EĞERYANLIŞ
EĞERYANLIŞ Executes if false
UNTIL UNTIL KADAR KADAR Executes till cetain conditions are met
WHILE WHILE İKEN İKEN Executes while conditions are met
FOR FOR DÖNGÜ DÖNGÜ Executes a loop
The Turkish Online Journal of Educational Technology – TOJET January 2005 ISSN: 1303-6521 volume 4 Issue 1
Copyright The Turkish Online Journal of Educational Technology 2002 17
DEVELOPING A TECHNOLOGY ATTITUDE SCALE FOR PRE-SERVICE CHEMISTRY TEACHERS
Soner YAVUZ
Department of Chemical Education, Hacettepe University, Ankara/Turkey [email protected]
ABSTRACT Technological tools, which meet the needs of the society, have become more addictive for people with the rapid development of technology. These tools have also been used in the field of education and improved through the Internet where there is continuous information exchange. Educators needed the attitudes of the students towards technological tools, especially the Internet, and have developed scales in various structures. The aim of this study is to develop a “the scale of attitude towards technology” in order to assess the attitudes of pre-service chemistry teachers towards technological tools. In the light of the examined data, a 5-point Likert type scale consisting of 50 items was developed and administered to 162 students, who formed the sampling. At the end of the analysis, a scale with a reliability coefficient of 0,8668 consisting of 19 items and 5 subscales called “not using technological tools in education, using technological tools in education, the effects of technology in educational life, teaching how to use technological tools and evaluating technological tools.” Keywords: Technology attitude scale, attitude towards computer assisted instruction, attitude towards internet ÖZET Toplumun ihtiyacı olan gereksinimlerini karşılayan teknolojik araç-gereçler, teknolojinin hızlı ilerlemesiyle insanları kendilerine daha da bağlamaktadır. Bu araçlar yıllar boyunca eğitim alanında da kullanılmış ve sürekli bilgi alış-verişinin sağlandığı internet ortamıyla daha da gelişmiştir. Eğitimciler tarafından öğrencilerin teknolojik araçlara, özellikle de internete karşı tutumlarına ihtiyaç duyulmuş ve çok farklı yapılarda ölçekler geliştirilmiştir. Bu çalışmanın amacı hizmet öncesindeki kimya öğretmenlerinin teknolojik araçlara karşı tutumlarını değerlendiren “teknoloji tutum ölçeği” nin geliştirilmesidir. İncelenen kaynaklar ışığında 50 maddelik 5’li likert tipi ölçek oluşturulmuş, örneklem olarak seçilen 162 öğrenciye uygulanmıştır. Yapılan analizler sonucunda “teknolojik araçların eğitim alanında kullanılmama durumu, teknolojik araçların eğitim alanında kullanılma durumu, teknolojinin eğitim yaşamına etkileri, teknolojik araçların kullanımının öğretilmesi ve teknolojik araçların değerlendirilmesi” isimli 5 alt başlık içeren ve 19 maddeden oluşan, güvenirlik katsayısı 0,8668 olan ölçek geliştirilmiştir. Anahtar Kelimeler: Teknoloji tutum ölçeği, bilgisayar destekli öğretime karşı tutum, internete karşı tutum INTRODUCTION The developing technology has constructed a bridge between science and tools that meet the human needs. Improving knowledge has created the life facilitators with the help of technology and technology has affected all aspects of human life (İşman and Dabaj, 2004). Technological tools are also used in the field of education. Therefore, there as been a need for determining the student attitudes towards the technological tools that are used in education. Educators have developed various scales in order to asses the attitudes of the students towards the Internet (Tsai, Lin and Tsai, 2001). There has been a lot of research on this issue. In a study where the students’ attitudes towards the Internet was assessed, 173 students were randomly chosen among the 2003 fall students of East Mediterranean University and were administered a 5-point Likert type scale consisting of 30 items, 7 of which were about personal details and 23 of which were about attitudes towards the Internet. According to the results, the students who had computers at home thought that the friendships establish on the Internet were temporary and the contents in foreign languages did not make an obstacle, in opposition to the ones who did not have computers at home (İşman and Dabaj, 2004). The aim of the study, where Becker and Maunsaiyat (2002) examined the technological concepts and attitudes of Thai students, was to develop the Technological Concepts and Attitudes Scale through interpreting the American Technology Attitude Scale and calculating its reliability. This scale was administered in order to determine the technological concepts and attitudes of 12-15-year-old secondary school students near Bangkok. It was also examined by Thai teachers and found to be useful for the secondary school Thai students with respect to program planning, curriculum development and application. Differences were found between the American and Thai students in their technological attitudes. These differences were thought to stem from the differences between the educational systems and cultures and the teacher-centered method used by the Thai teachers. In another study where a scale was developed in order to assess the attitudes of high school students towards technology, new items were added to the computer attitude scale suggested by Selwyn for ages 16-19 and an Internet Attitude Scale of 18 items was created. The scale consisted of four subscales: perceived usefulness, affection, perceived control and behavior. The influences of gender and Internet experience on attitudes and their relationship were examined. Seven hundred and fifty-three Thai high school students who participated at the study did not show any statistical difference in their ideas

The Turkish Online Journal of Educational Technology – TOJET January 2005 ISSN: 1303-6521 volume 4 Issue 1
Copyright The Turkish Online Journal of Educational Technology 2002 18
about usefulness despite their different gender and Internet experiences. However, male students were found to have more positive feelings, less anxiety and more self confidence than female students. The students with more Internet experience were confirmed to have more positive feelings than the ones with no experience (Tsai, Lin and Tsai, 2001). In a study where the attitudes of children towards technology were analyzed, a scale was developed after the oral research and was administered to 574 students. At the end of the analysis a scale with two factors was created: interests/aptitudes and alternative preferences. The scores of primary and secondary school children for these two subscales were compared and significant differences were found. Additionally, attitude differed according to the gender (Frantom, Green and Hoffman, 2002). In the study that was conducted in order to assess the reliability of 14 previously made computer attitude scales, included 621 teachers from Texas, Florida, New York and California in 1995-96. There were 284 items in 14 scales with 32 subscales and was named as Teachers’ Computer Attitude Scale. These scales were prepared in 10 years. There were some problems at the beginning but the original versions were found to be reliable (Christensen and Knezek, 2000). In the study where the influence of gender effect on the computer usage and attitudes of the students from the ubiquitous computing campus, all students at the social sciences university were given laptop computers and a technology program was administered. All students at this university used these computers that involved the activities, in their social and academic life at the campus. The male and female students were examined with respect to their experiences, computational skills and attitudes in their four-year technologically rich environment. In 2000, reports on the computer usage and attitudes of 800 students from the ubiquitous computing campus were analyzed and the collected data showed that the students used the computers in different ways: 97 % for word processing, 98 % of them for e-mail for pleasure, 73 % of them for e-mail for classes, 50 % of them for web resources. At the end of the analysis, the categories of tool, communication, resource, entertainment and total usage were determined. When the t-test was applied to these categories on male and female students; male students were found to use the computers for resources, entertainment and total usage and no significant difference was found between the female and male students’ computer usage as a tool and for communication. The results of the attitude analysis showed that 73 % loved, 23 % liked, 4 % disliked and 1 % hated computers. Among the students, 48 % thought that computers had effects on campus life, 75 % considered as a facilitator for educational life and 48 % thought it helped their social lives (McCoy, Heafner, Burdick and Nagle, 2001). Tanguma, Martin and Crawford (2002), in their study called the integration of higher education and technology in learning environment, examined the technology using models in classrooms with a program prepared by 26 lecturers form a southeastern university. It was found that they used hardware and software, made effective applications using technology (scanner, digital camera, and voice recorders), integrated technology (video conference) and the Internet (for lesson planning) in their classrooms. In this study where the technological views of college students were investigated, possible risks caused by the increasing tendency towards e-mail, instant messages and cellular phones. 40 students form Pennsylvania Social Sciences College between the ages 17 and 29 were chosen as the sampling. The usage of cellular phones and messages and their affects on the working and daily programs were evaluated. Attitudes towards the comfort that e-mail and technology provided were examined. The conscientiousness and agreeableness dimensions of the scale produced significant results. Differences were found between the e-mail and cellular phone usage of the interpersonal and intrapersonal individuals. Significant results were determined in communication characteristics and behavior according to the gender effect (Vicario, Henniger, Austin and Chamblies, 2002). Another study aimed to determine the attitudes of the primary school children towards technology and computer experiences and their relationships. 124 students from a public school in Antalya participated in the study. In the end, although the students were indecisive about the usage of technology, they expressed positive feelings toward technology and its applications. No significant difference was found between the computer experiences basic attitudes of the students towards technology (Akbaba, 2001). In a study, which aimed to develop a questionnaire on assessment of the effects of computers on education, the effects of technology on social sciences education was evaluated in a non-technical private university in the USA. The answers to the questionnaire were collected via e-mail for four academic years. The questionnaire consisted of 50 attitude items in 5-point Likert-type Scale. At the end of post hoc analysis, taking the 25 items of the questionnaire into consideration, a scale with 4 factors was developed (Mitra, 2001). Duggan et.al. (1999) developed a scale in order to determine the students’ attitudes towards the usage of the Internet in education and the students’ attitudes were evaluated using some forms of the scale. The Thurstone equal appearing interval scale and Likert summated rating scale were the two different forms in the scale to be used. This form was administered to 188 students and with the very decisive Likert format consisting of 18 items; an “Attitude scale towards the usage of the Internet in education” was developed. At Florida College University, in 1997, at the beginning and end of the computers in technology education classes, variables of the effects of the pre-service teachers’ attitudes towards studying and learning on computers were investigated. The variables in this study were attitude towards computers, computer anxiety, confidence in computer, computer tendency, and computer usefulness and student perceptions. At the end of the class, the scale of attitude towards computers was administered to 22 students as pre and posttests. It was found at the end that the students’ attitudes turned out to be more confident and positive after the lessons were completed

The Turkish Online Journal of Educational Technology – TOJET January 2005 ISSN: 1303-6521 volume 4 Issue 1
Copyright The Turkish Online Journal of Educational Technology 2002 19
(Gunter, Gunter and Wiens, 1998). According to Selwyn (1997), both educators and researchers needed the attitudes of 16-19-year old students’ attitudes towards using computers in education and their relationships. Therefore, Selwyn developed a scale in order to determine the attitudes of students towards information technology and computers. 49 items of the pilot scale were administered to 266 students. A scale of 21 items was constructed after the factor analysis. The reliability coefficient of the scale was found to be 0,90 and test-retest reliability was found to be 0,93. The structural validity was found significant at p<0,001 level. In a study where the attitudes of teachers towards technology were psychometrically evaluated, a technological attitude scale was developed in order to evaluate the attitudes of teachers towards using technology as a teaching tool in the classroom. The reliability and validity of the scale was calculated through the data collected form 86 foreign language teachers (McFarlane, Hoffman, Green, 1997). Metu (1994), in his MS dissertation, made a research on the level of computational attitudes of Nigerian teachers towards their computer knowledge and skills. There were positive and negative attitude items in the scale. In the summer program of Alva Ikoku College, a Likert-type questionnaire was administered to 56 teachers. The teachers with no or little computational knowledge or skills were found to have more positive attitudes towards computer education. According to the research on Israelite students’ attitudes towards computers and relationships between their personalities, the Eysenck model of personality explained the individual differences with the concepts of neuroticism, extraversion and psychoticism. Upon the analysis of the data collected form 298 female students, the ones with high psychoticism and extraversion were found to have more positive attitudes towards computers. The relationship of neuroticism scores was found to be statistically insignificant (Francis, Katz and Evans, 1996). In another study where the attitude towards computers was examined, the relationship between age, education and gender was stressed. An 5-point Likert-type scale was developed and the direct effects of using computers in education were determined (Morris, 1988-89). The study, conducted over 60 college students from the South Illinois University, focused on the attitudes of pre-service teachers towards using computers. Age, previous computer experience and computational attitudes (anxiety, confidence, tendency) were chosen as variables and their relationships were investigated (Koohang, 1987). The effects of video, computer-assisted education and interactive video applications on learning performance and attitude were evaluated in a study where the pretest results were used for the randomly placement of 134 students according to their high or low levels of previous experience in 3 treatment groups. The analysis focused on achievement, gender and previous achievement levels (low, medium, high). The performance assessment means of these three treatment groups (video, computer-assisted instruction and interactive video) were 64,98 %; 73,54 % and 70,48 %. The results of the attitude scale were 75,07 %; 74,26 % and 82,87 %. The computer-assisted instruction was found to be the most effective teaching system and there was no need for additional tools like interactive videos. However, when interactive video education was compared to the computer-assisted education and video, it was found to have significant effects on the attitudes of less talented students (Dalton and Hannafin, 1986). In a study where the technological conceptions and attitudes of 13-year-old male and female students were examined, firstly 12 students were interviewed on what technology had taught them and how important it had been for them. The other 48 students were asked 10 open-ended questions on their opinions on technology. A Likert-type questionnaire of 80 questions was developed after the evaluations. The questionnaire was administered to 3000 13-year-old students form different schools in different districts of the Netherlands. The collected data were analyzed and 12 factors were determined. Significant results were found between the female and male students. Students thought that technology covered a wide range of important but not very difficult subjects. Both female and male students found to have thoughts that, female students were more talented in the field of technology however, female students appeared to have less interest in technology than male students. Page (1979) developed a Likert-type scale of 40 items in order to evaluate the attitudes of 13-18-year-old students towards science and technology. This scale consisted of four subscales, namely, technology, technical education, its industrial position and attitude towards technology. In another study, in order to assess the stereotypes of attitude towards technology, the mechanization scale was thought to be modified and administered to 89 students each of who belong to a private occupational group. The answers to the questionnaire were evaluated according to gender and target occupational group after the target occupational group was determined (Goldman and Kaplan, 1973). THE PURPOSE OF THE STUDY The advancements in science and technology result in developments in education field as in every field. These advancements require the utilization of various technologies in education. However, it is important to examine the appropriateness of these educational technologies to the subject. First it is necessary to determine the students’ interests and attitudes towards to technological tools and then it is crucial to study how practical, applicable, and economic these technological tools are. Therefore, this study aims to develop an attitude scale in order to investigate students’ attitudes towards technological tools. According to the data gathered by this scale, the usability, feasibility, and financially viability of the educational technologies can be determined more effectively. These tools have also been used in the field of education and have improved through the Internet where there is continuous information exchange. Educators have needed to find out the attitudes of the students
The Turkish Online Journal of Educational Technology – TOJET January 2005 ISSN: 1303-6521 volume 4 Issue 1
Copyright The Turkish Online Journal of Educational Technology 2002 20
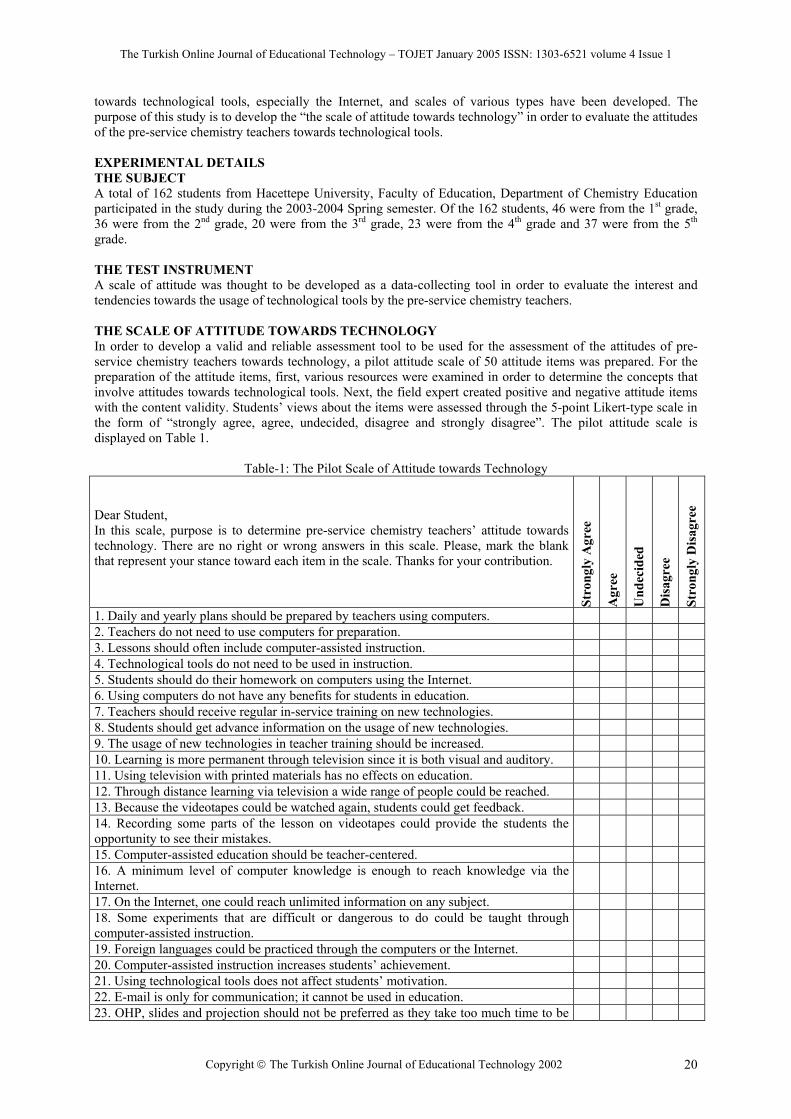
towards technological tools, especially the Internet, and scales of various types have been developed. The purpose of this study is to develop the “the scale of attitude towards technology” in order to evaluate the attitudes of the pre-service chemistry teachers towards technological tools. EXPERIMENTAL DETAILS THE SUBJECT A total of 162 students from Hacettepe University, Faculty of Education, Department of Chemistry Education participated in the study during the 2003-2004 Spring semester. Of the 162 students, 46 were from the 1st grade, 36 were from the 2nd grade, 20 were from the 3rd grade, 23 were from the 4th grade and 37 were from the 5th grade. THE TEST INSTRUMENT A scale of attitude was thought to be developed as a data-collecting tool in order to evaluate the interest and tendencies towards the usage of technological tools by the pre-service chemistry teachers. THE SCALE OF ATTITUDE TOWARDS TECHNOLOGY In order to develop a valid and reliable assessment tool to be used for the assessment of the attitudes of pre-service chemistry teachers towards technology, a pilot attitude scale of 50 attitude items was prepared. For the preparation of the attitude items, first, various resources were examined in order to determine the concepts that involve attitudes towards technological tools. Next, the field expert created positive and negative attitude items with the content validity. Students’ views about the items were assessed through the 5-point Likert-type scale in the form of “strongly agree, agree, undecided, disagree and strongly disagree”. The pilot attitude scale is displayed on Table 1.
Table-1: The Pilot Scale of Attitude towards Technology Dear Student, In this scale, purpose is to determine pre-service chemistry teachers’ attitude towards technology. There are no right or wrong answers in this scale. Please, mark the blank that represent your stance toward each item in the scale. Thanks for your contribution.
Stro
ngly
Agr
ee
Agr
ee
Und
ecid
ed
Dis
agre
e
Stro
ngly
Dis
agre
e
1. Daily and yearly plans should be prepared by teachers using computers. 2. Teachers do not need to use computers for preparation. 3. Lessons should often include computer-assisted instruction. 4. Technological tools do not need to be used in instruction. 5. Students should do their homework on computers using the Internet. 6. Using computers do not have any benefits for students in education. 7. Teachers should receive regular in-service training on new technologies. 8. Students should get advance information on the usage of new technologies. 9. The usage of new technologies in teacher training should be increased. 10. Learning is more permanent through television since it is both visual and auditory. 11. Using television with printed materials has no effects on education. 12. Through distance learning via television a wide range of people could be reached. 13. Because the videotapes could be watched again, students could get feedback. 14. Recording some parts of the lesson on videotapes could provide the students the opportunity to see their mistakes.
15. Computer-assisted education should be teacher-centered. 16. A minimum level of computer knowledge is enough to reach knowledge via the Internet.
17. On the Internet, one could reach unlimited information on any subject. 18. Some experiments that are difficult or dangerous to do could be taught through computer-assisted instruction.
19. Foreign languages could be practiced through the computers or the Internet. 20. Computer-assisted instruction increases students’ achievement. 21. Using technological tools does not affect students’ motivation. 22. E-mail is only for communication; it cannot be used in education. 23. OHP, slides and projection should not be preferred as they take too much time to be

The Turkish Online Journal of Educational Technology – TOJET January 2005 ISSN: 1303-6521 volume 4 Issue 1
Copyright The Turkish Online Journal of Educational Technology 2002 21
used. 24. Technological tools could be used for practice or revision. 25. Advanced knowledge is needed in order to be able to use computers. 26. Technological tools could only succeed when they address all the sense organs. 27. Students should receive basic education on computer literacy. 28. Teaching could reach its goal only together with technology. 29. Teaching abstract concepts could be more concrete through using technology. 30. Using the Internet in the learning process is a waste of time. 31. A university students must be able to use certain software such as word and excel. 32. Being given homework that requires computer usage puts me in stress. 33. If I were to give a seminar, I would prefer using OHP or PowerPoint to using chalk and board.
34. I believe that the information technology usage is not adequate in Turkey. 35. One does not have to use technological facilities in order to be successful in life. 36. I believe that using various appropriate technological environments could avoid waste of time in education and teaching process.
37. In order to use the technological facilities, one should know at least one foreign language.
38. Technological facilities have a positive effect on productive studying and learning. 39. Using technology would facilitate the understanding of difficult subjects. 40. Using current technologies would promote the improvement of new ones. 41. While determining the aims of a lesson plan, the technological age in education should be considered.
42. Using technology wastes the thinking potential of a human away. 43. Turkey should have a technology policy. 44. Using technology in an ethical environment should be a part of national aims. 45. In order to be able to graduate from the university, the ability to “use the technological materials of the field” should be rated.
46. I believe that academic staff is inadequate in using technology. 47. Technological changes should be considered when experiencing periods of change. 48. A life full of technology may also affect an individual in a negative way. 49. When technology is mentioned, the first things I think of are using computers and multimedia.
50. When technology is mentioned, the first things I think of are using tools and fixing them.
FINDINGS The 5-point Likert-type scale, which was prepared by the field expert, was given administered to 162 students and data were collected. The number of subjects (162) is enough for the factor analysis. Factor analysis was made on the collected data. At the end of the first analysis, a scale of 50 items and 15 factors was observed to have emerged. After the evaluation of the factor analysis results, the items with factor loading below 0,40 were decided to be omitted from the analysis. Attention was paid to the difference between the factor loading values and loading values taken from the other factors to be 0,10. Considering these values, some items were removed form the analysis and a second analysis was made. The results are displayed on Table 2.
Table-2: The Factor Analysis Results of the Attitude Scale of 19 Items Items Factor Loading Value Communalities Item Total Correlation
22 0,465 0,621 0,3889 23 0,475 0,548 0,4190 30 0,710 0,686 0,6497 21 0,659 0,573 0,5968 4 0,640 0,486 0,5828
14 0,496 0,626 0,4029 13 0,610 0,632 0,5217 24 0,432 0,484 0,3365 27 0,683 0,542 0,6134 40 0,618 0,690 0,5358 38 0,744 0,676 0,6791 39 0,733 0,665 0,6670
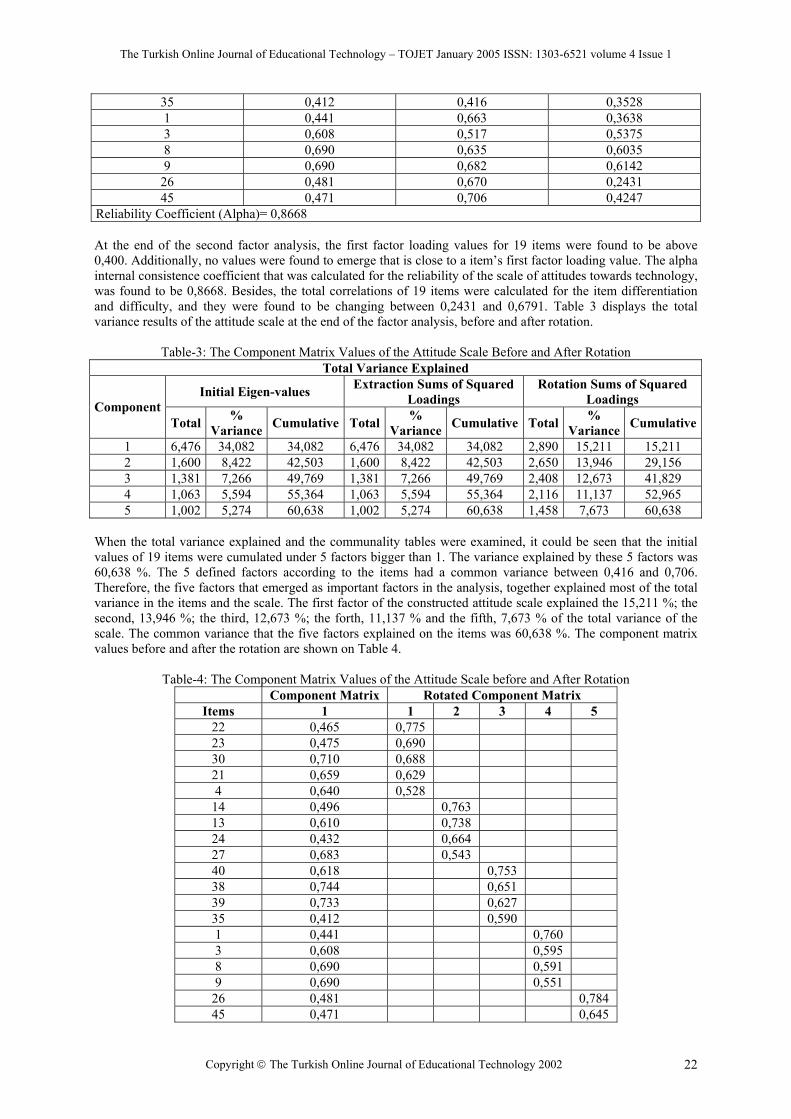
The Turkish Online Journal of Educational Technology – TOJET January 2005 ISSN: 1303-6521 volume 4 Issue 1
Copyright The Turkish Online Journal of Educational Technology 2002 22
35 0,412 0,416 0,3528 1 0,441 0,663 0,3638 3 0,608 0,517 0,5375 8 0,690 0,635 0,6035 9 0,690 0,682 0,6142
26 0,481 0,670 0,2431 45 0,471 0,706 0,4247
Reliability Coefficient (Alpha)= 0,8668 At the end of the second factor analysis, the first factor loading values for 19 items were found to be above 0,400. Additionally, no values were found to emerge that is close to a item’s first factor loading value. The alpha internal consistence coefficient that was calculated for the reliability of the scale of attitudes towards technology, was found to be 0,8668. Besides, the total correlations of 19 items were calculated for the item differentiation and difficulty, and they were found to be changing between 0,2431 and 0,6791. Table 3 displays the total variance results of the attitude scale at the end of the factor analysis, before and after rotation.
Table-3: The Component Matrix Values of the Attitude Scale Before and After Rotation Total Variance Explained
Initial Eigen-values Extraction Sums of Squared Loadings
Rotation Sums of Squared Loadings Component
Total % Variance Cumulative Total %
Variance Cumulative Total % Variance Cumulative
1 6,476 34,082 34,082 6,476 34,082 34,082 2,890 15,211 15,211 2 1,600 8,422 42,503 1,600 8,422 42,503 2,650 13,946 29,156 3 1,381 7,266 49,769 1,381 7,266 49,769 2,408 12,673 41,829 4 1,063 5,594 55,364 1,063 5,594 55,364 2,116 11,137 52,965 5 1,002 5,274 60,638 1,002 5,274 60,638 1,458 7,673 60,638
When the total variance explained and the communality tables were examined, it could be seen that the initial values of 19 items were cumulated under 5 factors bigger than 1. The variance explained by these 5 factors was 60,638 %. The 5 defined factors according to the items had a common variance between 0,416 and 0,706. Therefore, the five factors that emerged as important factors in the analysis, together explained most of the total variance in the items and the scale. The first factor of the constructed attitude scale explained the 15,211 %; the second, 13,946 %; the third, 12,673 %; the forth, 11,137 % and the fifth, 7,673 % of the total variance of the scale. The common variance that the five factors explained on the items was 60,638 %. The component matrix values before and after the rotation are shown on Table 4.
Table-4: The Component Matrix Values of the Attitude Scale before and After Rotation Component Matrix Rotated Component Matrix
Items 1 1 2 3 4 5 22 0,465 0,775 23 0,475 0,690 30 0,710 0,688 21 0,659 0,629 4 0,640 0,528
14 0,496 0,763 13 0,610 0,738 24 0,432 0,664 27 0,683 0,543 40 0,618 0,753 38 0,744 0,651 39 0,733 0,627 35 0,412 0,590 1 0,441 0,760 3 0,608 0,595 8 0,690 0,591 9 0,690 0,551
26 0,481 0,784 45 0,471 0,645
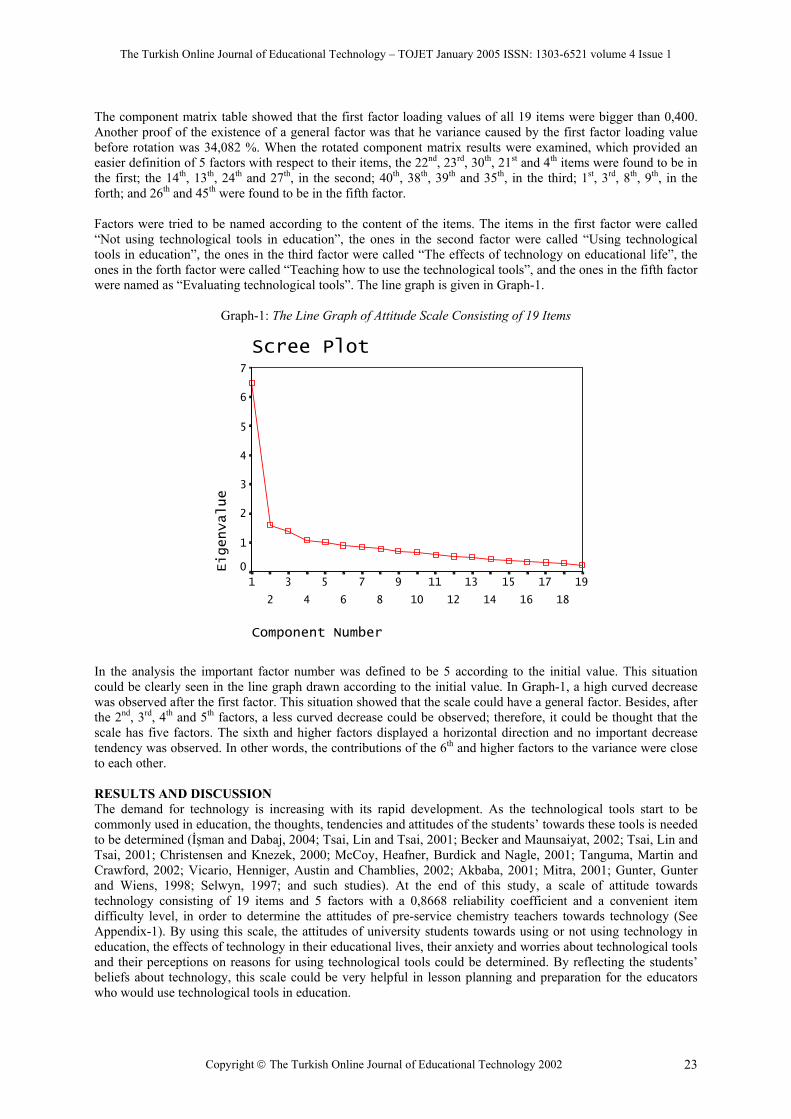
The Turkish Online Journal of Educational Technology – TOJET January 2005 ISSN: 1303-6521 volume 4 Issue 1
Copyright The Turkish Online Journal of Educational Technology 2002 23
The component matrix table showed that the first factor loading values of all 19 items were bigger than 0,400. Another proof of the existence of a general factor was that he variance caused by the first factor loading value before rotation was 34,082 %. When the rotated component matrix results were examined, which provided an easier definition of 5 factors with respect to their items, the 22nd, 23rd, 30th, 21st and 4th items were found to be in the first; the 14th, 13th, 24th and 27th, in the second; 40th, 38th, 39th and 35th, in the third; 1st, 3rd, 8th, 9th, in the forth; and 26th and 45th were found to be in the fifth factor. Factors were tried to be named according to the content of the items. The items in the first factor were called “Not using technological tools in education”, the ones in the second factor were called “Using technological tools in education”, the ones in the third factor were called “The effects of technology on educational life”, the ones in the forth factor were called “Teaching how to use the technological tools”, and the ones in the fifth factor were named as “Evaluating technological tools”. The line graph is given in Graph-1.
Graph-1: The Line Graph of Attitude Scale Consisting of 19 Items
Scree Plot
Component Number
19
18
17
16
15
14
13
12
11
10
9
8
7
6
5
4
3
2
1
Eigenvalue
7
6
5
4
3
2
1
0
In the analysis the important factor number was defined to be 5 according to the initial value. This situation could be clearly seen in the line graph drawn according to the initial value. In Graph-1, a high curved decrease was observed after the first factor. This situation showed that the scale could have a general factor. Besides, after the 2nd, 3rd, 4th and 5th factors, a less curved decrease could be observed; therefore, it could be thought that the scale has five factors. The sixth and higher factors displayed a horizontal direction and no important decrease tendency was observed. In other words, the contributions of the 6th and higher factors to the variance were close to each other. RESULTS AND DISCUSSION The demand for technology is increasing with its rapid development. As the technological tools start to be commonly used in education, the thoughts, tendencies and attitudes of the students’ towards these tools is needed to be determined (İşman and Dabaj, 2004; Tsai, Lin and Tsai, 2001; Becker and Maunsaiyat, 2002; Tsai, Lin and Tsai, 2001; Christensen and Knezek, 2000; McCoy, Heafner, Burdick and Nagle, 2001; Tanguma, Martin and Crawford, 2002; Vicario, Henniger, Austin and Chamblies, 2002; Akbaba, 2001; Mitra, 2001; Gunter, Gunter and Wiens, 1998; Selwyn, 1997; and such studies). At the end of this study, a scale of attitude towards technology consisting of 19 items and 5 factors with a 0,8668 reliability coefficient and a convenient item difficulty level, in order to determine the attitudes of pre-service chemistry teachers towards technology (See Appendix-1). By using this scale, the attitudes of university students towards using or not using technology in education, the effects of technology in their educational lives, their anxiety and worries about technological tools and their perceptions on reasons for using technological tools could be determined. By reflecting the students’ beliefs about technology, this scale could be very helpful in lesson planning and preparation for the educators who would use technological tools in education.

The Turkish Online Journal of Educational Technology – TOJET January 2005 ISSN: 1303-6521 volume 4 Issue 1
Copyright The Turkish Online Journal of Educational Technology 2002 24
REFERENCES Akbaba Altun, S., (2001). Elementary School Principials’ Attitudes towards Technology and Their Computer Experiments, The World Congress on Computational Intelligence (WCCI) Triennial World Conference, 10th, Madrid, Spain, September 10-15, 2001, 16p. Becker, K. H. and Maunsaiyat, S., (2002). Thai Students’ Attitudes and Concepts of Technology, Journal of Technology Education, vol. 13, no.2, p6-19. Christensen, R. and Knezek, G., (2000). Internal Consistency Reliabilities for 14 Computer Attitude Scales, Journal of Technology and Teacher Education, vol. 8, no.4, p327-336. Dalton, D. W. and Hannafin, M. J., (1986). The Effects of Video-Only, CAI Only and Interactive Video Instructional Systems on Learner Performance and Attitude: An Exploratory Study, U.S., Indiana, 1986-01-00. Duggan, A., Hess, B., Morgan, D., Kim, S. and Wilson, K., (1999). Measuring Syudents’ Attitude toward Educational Use of the Internet. The Annual Conference of the American Educational Research Association, Montreal, Canada, April 19-23, 1999, 23p. Francis, L. J., Katz, Y. J. and Evans, T., (1996). The Relationship Between Personality and Attitudes towards Computers: An Investigation among Female Undergraduate Students in Israel, British Journal of Educational Technology, vol. 27, no.3, p164-170. Frantom, C. G., Green, K. E. and Hoffman, E. R., (2002). Measure Development: The Children’s Attitudes toward Technology Scale (CATS), Journal of Educational Computing Research, vol. 26, no.3, p249-263. Goldman, R. D. and Kaplan, R. M., (1973). Development of a Mechanization Scale: Measurement of Stereotypes of Attitude toward Technology, EDRS Price, ED069676. Gunter, G., Gunter, R. E. and Wiens, G. A., (1998). Teaching Pre-Service Teachers Technology: An Innovative Approach. In SITE 98: Society for Information Technology and Teacher Education International Conference, 9th, Washington, DC, March 10-14, 1998, 6p. İşman, A. and Dabaj, F., (2004). Attitudes of Students towards Internet, Turkish Online Journal of Distance Education, vol. 5, no.4. Koohang, A. A., (1987). A Study of the Attitudes of Pre-Service Teachers toward the Use of Computers, Educational Communication and Technology Journal, vol. 35, no.3, p145-149. McCoy, L.P., Heafner, T.L., Burdick, M.G. and Nagle, L.M., (2001). Gender Differences in Computer Use and Attitudes on a Ubiquitous Computing Campus, The Annual Meeting of the American Educational Research Association, Seattle, WA, April 10-14, 2001, 7p. McFarlane, T. A., Hoffman, E. M. and Green K. E., (1997). Teachers’ Attitudes toward Technology: Psychometric Evaluation of the Technology Attitude Survey. The Annual Meeting of the American Educational Association, Chicago, IL, March 24-28, 1997, 13p. Metu, R., (1994). A Study of Computer Attitudes of Nigerian Teachers, The thesis presented to the Faculty of California State Polytechnic University, Pomona, 62p. Mitra, A., (2001). Developing a Questionnaire to Measure the Effectiveness of Computers in Teaching, ED-Media 2001 World Conference on Educational Multimedia, Hypermedia and Telecommunications, 13th, Tampere, Finland, June 25-30, 2001, 7p. Morris, D.C., (1988-89). A Survey of a Age and Attitudes toward Computer, Journal of Educational Technology Systems, vol. 17, no.1, p73-78. Page, R. L. and oth. (1979). Attitude Assessment in Science and Technology, CORE, vol. 3, no. 3, p9. Raat, J. H. and de Vries, M., (1985). What Do 13-Year Old Pupils Think About Technology ? The Conception of and the Attitude towards of 13-Year Old Girls and Boys, Netherlands, 1985-08-00. Selwyn, N., (1997). Students’ Attitudes toward Computers: Validation of a Computer Attitude Scale for 16-19 Education, Computers and Education, vol. 28, no.1, p35-41. Tsai, C.-C., Lin, S. S. J. and Tsai, M.-J., (2001). Developing an Internet Attitude Scale for High School Students, Computers and Education, vol. 37, no.1, p41-51. Tanguma, J., Martin, S. S. and Crawford, C.M., (2002). Higher Education and Technology Intergration into the Learning Environment: Results of a Survey of Theacher Preparation Faculty, Proceedings of SITE 2002: Society for Information Technology and Teacher Education International Conference, 13th, Nashville, TN, March 18-23, 2002, 7p. Vicario, T., Henniger, E., Austin, M. and Chamblies, C., (2002). College Students’ Responses to New Communication Tecyhnologies, ERIC EDRS, ED 463469, Reports-Research (143), 22p.
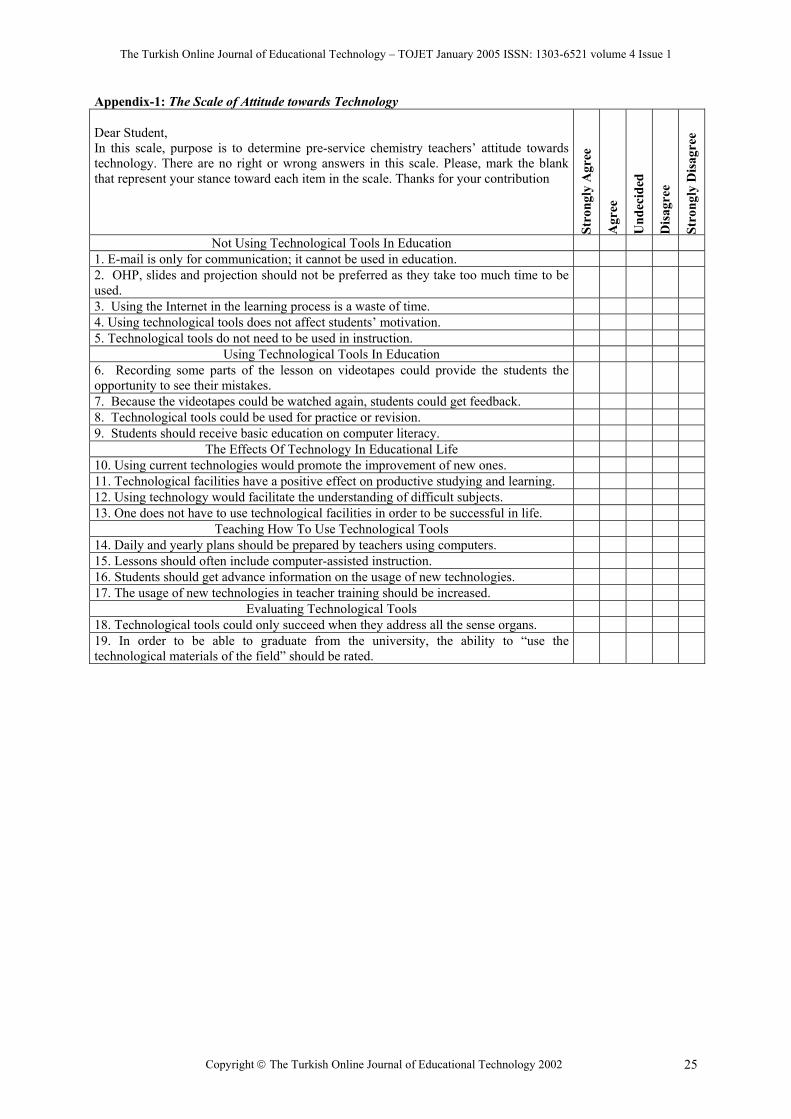
The Turkish Online Journal of Educational Technology – TOJET January 2005 ISSN: 1303-6521 volume 4 Issue 1
Copyright The Turkish Online Journal of Educational Technology 2002 25
Appendix-1: The Scale of Attitude towards Technology Dear Student, In this scale, purpose is to determine pre-service chemistry teachers’ attitude towards technology. There are no right or wrong answers in this scale. Please, mark the blank that represent your stance toward each item in the scale. Thanks for your contribution
Stro
ngly
Agr
ee
Agr
ee
Und
ecid
ed
Dis
agre
e
Stro
ngly
Dis
agre
e
Not Using Technological Tools In Education 1. E-mail is only for communication; it cannot be used in education. 2. OHP, slides and projection should not be preferred as they take too much time to be used.
3. Using the Internet in the learning process is a waste of time. 4. Using technological tools does not affect students’ motivation. 5. Technological tools do not need to be used in instruction.
Using Technological Tools In Education 6. Recording some parts of the lesson on videotapes could provide the students the opportunity to see their mistakes.
7. Because the videotapes could be watched again, students could get feedback. 8. Technological tools could be used for practice or revision. 9. Students should receive basic education on computer literacy.
The Effects Of Technology In Educational Life 10. Using current technologies would promote the improvement of new ones. 11. Technological facilities have a positive effect on productive studying and learning. 12. Using technology would facilitate the understanding of difficult subjects. 13. One does not have to use technological facilities in order to be successful in life.
Teaching How To Use Technological Tools 14. Daily and yearly plans should be prepared by teachers using computers. 15. Lessons should often include computer-assisted instruction. 16. Students should get advance information on the usage of new technologies. 17. The usage of new technologies in teacher training should be increased.
Evaluating Technological Tools 18. Technological tools could only succeed when they address all the sense organs. 19. In order to be able to graduate from the university, the ability to “use the technological materials of the field” should be rated.
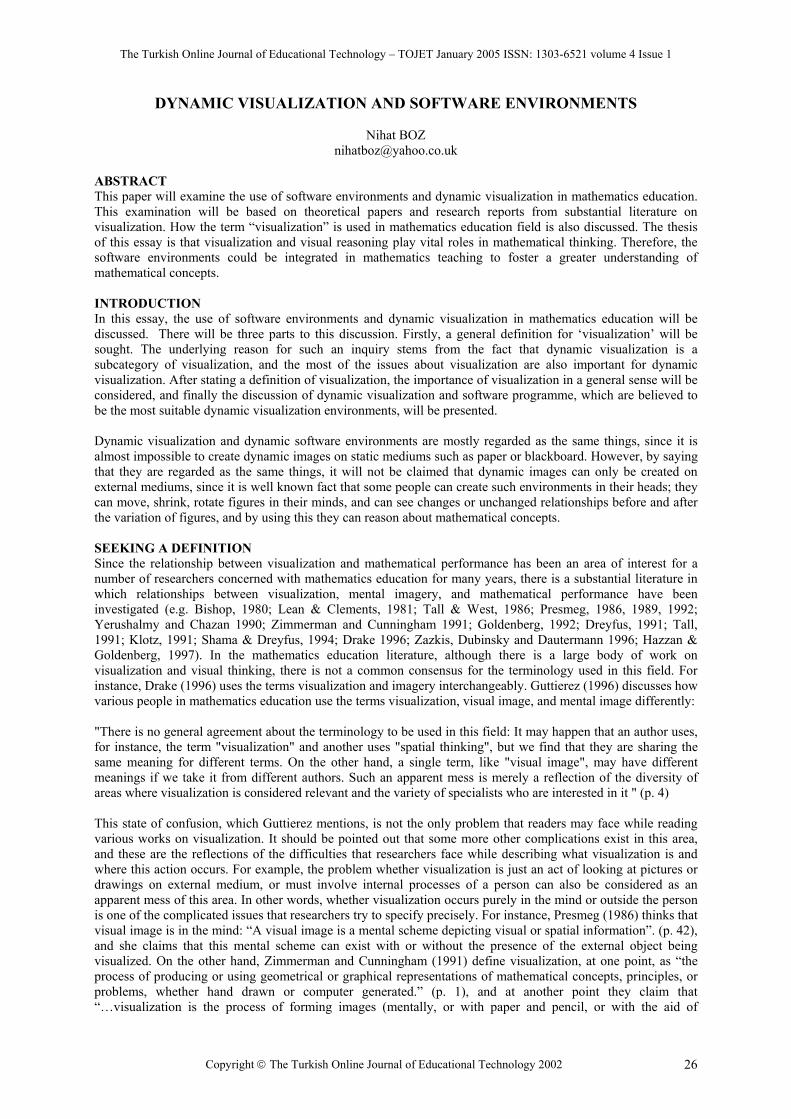
The Turkish Online Journal of Educational Technology – TOJET January 2005 ISSN: 1303-6521 volume 4 Issue 1
Copyright The Turkish Online Journal of Educational Technology 2002 26
DYNAMIC VISUALIZATION AND SOFTWARE ENVIRONMENTS
Nihat BOZ [email protected]
ABSTRACT This paper will examine the use of software environments and dynamic visualization in mathematics education. This examination will be based on theoretical papers and research reports from substantial literature on visualization. How the term “visualization” is used in mathematics education field is also discussed. The thesis of this essay is that visualization and visual reasoning play vital roles in mathematical thinking. Therefore, the software environments could be integrated in mathematics teaching to foster a greater understanding of mathematical concepts. INTRODUCTION In this essay, the use of software environments and dynamic visualization in mathematics education will be discussed. There will be three parts to this discussion. Firstly, a general definition for ‘visualization’ will be sought. The underlying reason for such an inquiry stems from the fact that dynamic visualization is a subcategory of visualization, and the most of the issues about visualization are also important for dynamic visualization. After stating a definition of visualization, the importance of visualization in a general sense will be considered, and finally the discussion of dynamic visualization and software programme, which are believed to be the most suitable dynamic visualization environments, will be presented. Dynamic visualization and dynamic software environments are mostly regarded as the same things, since it is almost impossible to create dynamic images on static mediums such as paper or blackboard. However, by saying that they are regarded as the same things, it will not be claimed that dynamic images can only be created on external mediums, since it is well known fact that some people can create such environments in their heads; they can move, shrink, rotate figures in their minds, and can see changes or unchanged relationships before and after the variation of figures, and by using this they can reason about mathematical concepts. SEEKING A DEFINITION Since the relationship between visualization and mathematical performance has been an area of interest for a number of researchers concerned with mathematics education for many years, there is a substantial literature in which relationships between visualization, mental imagery, and mathematical performance have been investigated (e.g. Bishop, 1980; Lean & Clements, 1981; Tall & West, 1986; Presmeg, 1986, 1989, 1992; Yerushalmy and Chazan 1990; Zimmerman and Cunningham 1991; Goldenberg, 1992; Dreyfus, 1991; Tall, 1991; Klotz, 1991; Shama & Dreyfus, 1994; Drake 1996; Zazkis, Dubinsky and Dautermann 1996; Hazzan & Goldenberg, 1997). In the mathematics education literature, although there is a large body of work on visualization and visual thinking, there is not a common consensus for the terminology used in this field. For instance, Drake (1996) uses the terms visualization and imagery interchangeably. Guttierez (1996) discusses how various people in mathematics education use the terms visualization, visual image, and mental image differently: "There is no general agreement about the terminology to be used in this field: It may happen that an author uses, for instance, the term "visualization" and another uses "spatial thinking", but we find that they are sharing the same meaning for different terms. On the other hand, a single term, like "visual image", may have different meanings if we take it from different authors. Such an apparent mess is merely a reflection of the diversity of areas where visualization is considered relevant and the variety of specialists who are interested in it " (p. 4) This state of confusion, which Guttierez mentions, is not the only problem that readers may face while reading various works on visualization. It should be pointed out that some more other complications exist in this area, and these are the reflections of the difficulties that researchers face while describing what visualization is and where this action occurs. For example, the problem whether visualization is just an act of looking at pictures or drawings on external medium, or must involve internal processes of a person can also be considered as an apparent mess of this area. In other words, whether visualization occurs purely in the mind or outside the person is one of the complicated issues that researchers try to specify precisely. For instance, Presmeg (1986) thinks that visual image is in the mind: “A visual image is a mental scheme depicting visual or spatial information”. (p. 42), and she claims that this mental scheme can exist with or without the presence of the external object being visualized. On the other hand, Zimmerman and Cunningham (1991) define visualization, at one point, as “the process of producing or using geometrical or graphical representations of mathematical concepts, principles, or problems, whether hand drawn or computer generated.” (p. 1), and at another point they claim that “…visualization is the process of forming images (mentally, or with paper and pencil, or with the aid of

The Turkish Online Journal of Educational Technology – TOJET January 2005 ISSN: 1303-6521 volume 4 Issue 1
Copyright The Turkish Online Journal of Educational Technology 2002 27
technology)” (p. 3). These two different views imply different notions about visualization: first one says that looking at pictures drawn on some external medium constitutes visualization in and of itself, and on the contrary, second one implies that visualization involves some sort of mental processes. Zazkis, Dubinsky and Dautermann (1996) also try to solve this complicated issue of what visualization is and where it occurs, and provide a working definition of visualization that is more precise than the others given in the literature. The following definition of visualization considers the range of different processes involved in visualization: Visualization is an act in which an individual establishes a strong connection between an internal construct and something to which access is gained through the senses. Such a connection can be made in either of two directions. An act of visualization may consist of any mental construction of objects or processes that an individual associates with objects or events perceived by her or him as external. Alternatively, an act of visualization may consist of the construction, on some external medium such as paper, chalkboard, or computer screen, of objects or events which the individual identifies with object(s) or process(es) in her or his mind. (p. 441) This definition does not restrict visualization to either the individual's mind or some external medium; on the contrary it restricts ‘visualization to constructions that transform between mental and other media.’, furthermore, this definition also dissociates itself ‘from other forms of construction of mental images based entirely on other mental images in the absence of external media.’ (Zazkis, Dubinsky and Dautermann 1996 p. 441). Put another way, this definition of visualization gives importance to the establishments of connections between internal constructions and external medium, thus the place of where the visual image is become unimportant. THE ROLE OF VISUALIZATION IN MATHEMATICS Many mathematicians and mathematics educators claim that visualization and visual reasoning play vital roles in mathematical thinking (e.g. Lean & Clements, 1981; Presmeg, 1989; Zimmerman & Cunningham, 1991; Davis, 1993; Shama & Dreyfus, 1994) Furthermore, as Fennema (1979) mentions, “…some mathematicians have claimed that all mathematical tasks require spatial reasoning.” (Cited in Lean & Clements, 1981, p. 267). For instance, Lean & Clements (1981) quote from McGee (1979) that “…H.R. Hamley, an Australian mathematician and psychologist, wrote that mathematical ability is a compound of general intelligence, visual imagery, and ability to perceive number and space configurations and to retain such configurations as mental pictures.” (p. 267). On the other hand, some authors point out that visual thinking alone cannot be enough for doing mathematics; it can only be ‘a precursor’ and ‘a complement’ to analytic thinking. Therefore they regard visualization as an alternative and powerful resource for students learning mathematics (Dreyfus, 1991; Goldenberg, 1992; Tall, 1991; Hazzan & Goldenberg, 1997). For instance, Tall (1991) points out that although visualization might give powerful source of ideas in the early stages of development of the theory of some mathematical concepts, it may also be a hindrance for doing mathematics since pictures may often suggest false theorems. Presmeg (1986) also discusses the advantages and disadvantages of visualization by developing a list of kinds of visual imagery used by students: ‘Concrete, pictorial imagery’, ‘Pattern imagery’, ‘Memory images of formula’, ‘Kinaesthetic imagery’, ‘Dynamic (moving) imagery’. She writes that over-reliance on a single diagram may bring about inflexible thinking which prevents the recognition of a concept in a non-standard diagram, and this may introduce false data. Yerushalmy and Chazan (1990) research on the ways software environments can help to mitigate some of the disadvantages of visual imagery, particularly over reliance on a single diagram. DYNAMIC VISUALIZATION AND SOFTWARE ENVIRONMENTS Tall & West (1986) mention; dynamic representations of mathematical processes may enable “the mind to manipulate them in a far more fruitful way than could ever be achieved starting from static text and pictures in a book.” (p. 107). Therefore, as many other authors point out dynamic visualization can be a very powerful tool to gain a greater understanding of many mathematical concepts or it can be a resource to solve mathematical problems. (Harel & Sowder, 1998; Goldenberg, Lewis & O’ Keefe, 1992; Presmeg, 1986; Tall &West, 1986). Although these authors use different terms for dynamic visualization: ‘dynamic imagery’ (Presmeg, 1986); ‘dynamic representations’ Tall & West, 1986; ‘viewing a triangle [geometrical object] as a dynamic entity’ (Harel & Sowder, 1997); ‘dynamic reasoning, dynamic visualization, or dynamic imagery’, (Goldenberg, 1992): it should be acknowledged that they share the same meaning. This claim is put forward by keeping in the mind the definition of visualization provided by Zazkis, Dubinsky and Dautermann (1996), which points out that visualization is an act of construction of transformations between external media and individual’s mind. Dynamic visualization is also such an act, but in this case this act constitutes moving pictures in the mind, or on some external medium ‘which the individual identifies with object(s) or process(es) in her or his mind.’ In other words, the peculiar property of dynamic visualization is that individuals who possess this ability can reason

The Turkish Online Journal of Educational Technology – TOJET January 2005 ISSN: 1303-6521 volume 4 Issue 1
Copyright The Turkish Online Journal of Educational Technology 2002 28
about the essential properties of moving, shrinking, and rotating figures, which appear on the screen or, in their mind, and thus they can solve the mathematical problems. There are research evidences too, which show that some students spontaneously develop this ability to move figures in their heads, to stretch and shrink them, to rotate them, to see them interact, and hence solve problems by using this kind of technique. (Harel & Sowder, 1998; Presmeg, 1986; Goldenberg, 1992). For instance, in their study of students’ proof schemes, Harel and Sowder (1998) report how one of the students solve the following problem:
Question: Show that the sum of the measure of the interior angles in a triangle is 180°.
They (ibid) describe Amy’s solution, which contains dynamic events, through static pictures and words as follows:1 The student (Amy) solves this question by using her dynamic visualization ability2; she rotates the two sides AB and AC of a triangle ∆ABC in opposite directions through the vertices B and C, until their angels with the segment BC are 90°, and by doing this she transforms the triangle ABC into the figure A’BCA” (Figure 1a, b). She then performs the reverse of her previous rotation and transformation, and recreates the original triangle (Figure 1c). By doing these, she can identify that the lost angles x and y from the 90° B and C are gained back in creating the angle A (Figure 1d).
Figure 1 A student’s solution for proving the sum of the measure of the interior angles in a triangle is 180°.
Since this kind of reasoning is used very infrequently among students. (Presmeg, 1986; Goldenberg, 1992), it might be considered as an “extraordinary” thinking style. However; the relevant specialty of this thinking style is not that it is an unusual way of reasoning, rather its importance is that students who have this ability can readily recognize its efficacy when they could use it. (Harel & Sowder, 1998; Goldenberg, 1992). And, as Harel & Sowder (1998) point out, they are fully able to anticipate the results of the transformations of the figures they make in their minds hence they can deduce the solutions of the problems, moreover these kinds of operations are intended the generality aspect of the conjectures rather than a particular figure. After all saying these, persons (who believe that visual is not mathematical) might still argue that the above solution cannot be accepted as a mathematical solution since it does not contain any range of formal representations in which the information forms a sequence of verbal expressions. In this respect they may be right, but this is not withstanding the importance of these kind of reasoning. Since, this kind of reasoning is regarded as a key to the analytical proof schemes that encompass mathematical proofs by Harel & Sowder (1998): Key to the analytical proof scheme is the transformational proof scheme: the creation and transformations of general mental images for a context, with the transformations directed toward explanations, always with an element of deduction. (original italic, p. 276) Students like the one mentioned above, as Goldenberg (1992) points out, learn to create such dynamic mental images and “perform such experiments in their heads without (curricular) experiences doing similar experiments with their hands and eyes.” (p. 2). If students are given suitable technologic tools, then they can develop the ability to carry out such experiments. In other words, technology can foster students’ dynamic visual reasoning ability. And fortunately, lots of software has been developed in the last twenty-five years that intended to contribute to students’ abilities to visualize in mathematics. (Cabri Geometer, Geometer’s Sketchpad, DynaGraphs, Geometric Supposer, Graphic Calculus...). Therefore, emergence of such software has inevitably influenced mathematical education, and it will continue to influence and change the ways mathematics have been taught as a result of the growing interests mathematics educators are showing in tools like these. Furthermore, these software environments also add new research areas in mathematics education. For instance, some researchers attempt to describe how work in ‘dynamic visualization environments (DVEs)’ can contribute
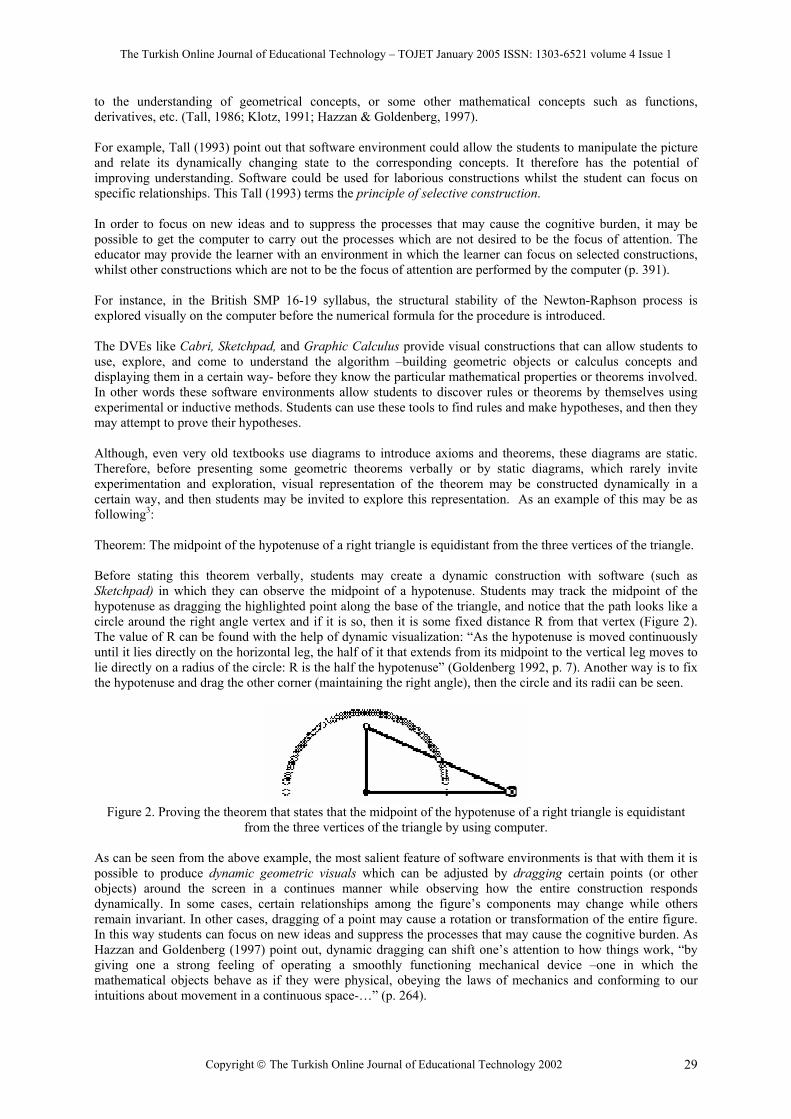
The Turkish Online Journal of Educational Technology – TOJET January 2005 ISSN: 1303-6521 volume 4 Issue 1
Copyright The Turkish Online Journal of Educational Technology 2002 29
to the understanding of geometrical concepts, or some other mathematical concepts such as functions, derivatives, etc. (Tall, 1986; Klotz, 1991; Hazzan & Goldenberg, 1997).
For example, Tall (1993) point out that software environment could allow the students to manipulate the picture and relate its dynamically changing state to the corresponding concepts. It therefore has the potential of improving understanding. Software could be used for laborious constructions whilst the student can focus on specific relationships. This Tall (1993) terms the principle of selective construction. In order to focus on new ideas and to suppress the processes that may cause the cognitive burden, it may be possible to get the computer to carry out the processes which are not desired to be the focus of attention. The educator may provide the learner with an environment in which the learner can focus on selected constructions, whilst other constructions which are not to be the focus of attention are performed by the computer (p. 391). For instance, in the British SMP 16-19 syllabus, the structural stability of the Newton-Raphson process is explored visually on the computer before the numerical formula for the procedure is introduced. The DVEs like Cabri, Sketchpad, and Graphic Calculus provide visual constructions that can allow students to use, explore, and come to understand the algorithm –building geometric objects or calculus concepts and displaying them in a certain way- before they know the particular mathematical properties or theorems involved. In other words these software environments allow students to discover rules or theorems by themselves using experimental or inductive methods. Students can use these tools to find rules and make hypotheses, and then they may attempt to prove their hypotheses. Although, even very old textbooks use diagrams to introduce axioms and theorems, these diagrams are static. Therefore, before presenting some geometric theorems verbally or by static diagrams, which rarely invite experimentation and exploration, visual representation of the theorem may be constructed dynamically in a certain way, and then students may be invited to explore this representation. As an example of this may be as following3: Theorem: The midpoint of the hypotenuse of a right triangle is equidistant from the three vertices of the triangle. Before stating this theorem verbally, students may create a dynamic construction with software (such as Sketchpad) in which they can observe the midpoint of a hypotenuse. Students may track the midpoint of the hypotenuse as dragging the highlighted point along the base of the triangle, and notice that the path looks like a circle around the right angle vertex and if it is so, then it is some fixed distance R from that vertex (Figure 2). The value of R can be found with the help of dynamic visualization: “As the hypotenuse is moved continuously until it lies directly on the horizontal leg, the half of it that extends from its midpoint to the vertical leg moves to lie directly on a radius of the circle: R is the half the hypotenuse” (Goldenberg 1992, p. 7). Another way is to fix the hypotenuse and drag the other corner (maintaining the right angle), then the circle and its radii can be seen.
Figure 2. Proving the theorem that states that the midpoint of the hypotenuse of a right triangle is equidistant
from the three vertices of the triangle by using computer.
As can be seen from the above example, the most salient feature of software environments is that with them it is possible to produce dynamic geometric visuals which can be adjusted by dragging certain points (or other objects) around the screen in a continues manner while observing how the entire construction responds dynamically. In some cases, certain relationships among the figure’s components may change while others remain invariant. In other cases, dragging of a point may cause a rotation or transformation of the entire figure. In this way students can focus on new ideas and suppress the processes that may cause the cognitive burden. As Hazzan and Goldenberg (1997) point out, dynamic dragging can shift one’s attention to how things work, “by giving one a strong feeling of operating a smoothly functioning mechanical device –one in which the mathematical objects behave as if they were physical, obeying the laws of mechanics and conforming to our intuitions about movement in a continuous space-…” (p. 264).
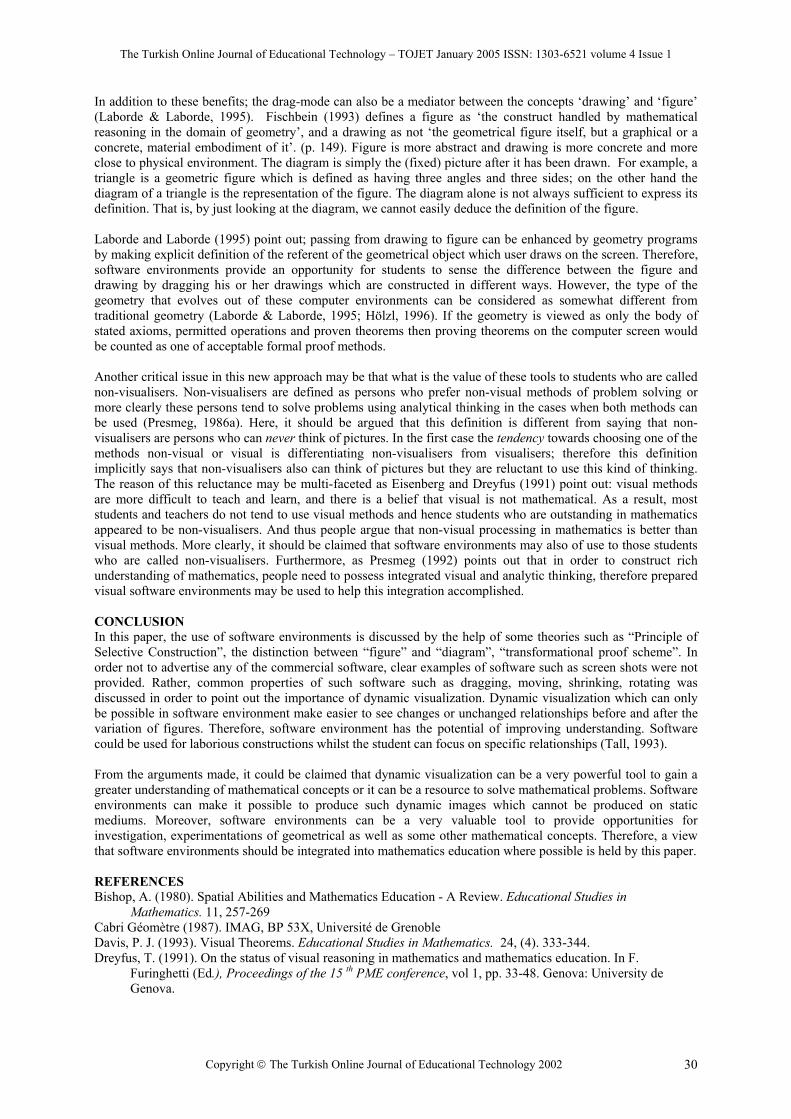
The Turkish Online Journal of Educational Technology – TOJET January 2005 ISSN: 1303-6521 volume 4 Issue 1
Copyright The Turkish Online Journal of Educational Technology 2002 30
In addition to these benefits; the drag-mode can also be a mediator between the concepts ‘drawing’ and ‘figure’ (Laborde & Laborde, 1995). Fischbein (1993) defines a figure as ‘the construct handled by mathematical reasoning in the domain of geometry’, and a drawing as not ‘the geometrical figure itself, but a graphical or a concrete, material embodiment of it’. (p. 149). Figure is more abstract and drawing is more concrete and more close to physical environment. The diagram is simply the (fixed) picture after it has been drawn. For example, a triangle is a geometric figure which is defined as having three angles and three sides; on the other hand the diagram of a triangle is the representation of the figure. The diagram alone is not always sufficient to express its definition. That is, by just looking at the diagram, we cannot easily deduce the definition of the figure. Laborde and Laborde (1995) point out; passing from drawing to figure can be enhanced by geometry programs by making explicit definition of the referent of the geometrical object which user draws on the screen. Therefore, software environments provide an opportunity for students to sense the difference between the figure and drawing by dragging his or her drawings which are constructed in different ways. However, the type of the geometry that evolves out of these computer environments can be considered as somewhat different from traditional geometry (Laborde & Laborde, 1995; Hölzl, 1996). If the geometry is viewed as only the body of stated axioms, permitted operations and proven theorems then proving theorems on the computer screen would be counted as one of acceptable formal proof methods. Another critical issue in this new approach may be that what is the value of these tools to students who are called non-visualisers. Non-visualisers are defined as persons who prefer non-visual methods of problem solving or more clearly these persons tend to solve problems using analytical thinking in the cases when both methods can be used (Presmeg, 1986a). Here, it should be argued that this definition is different from saying that non-visualisers are persons who can never think of pictures. In the first case the tendency towards choosing one of the methods non-visual or visual is differentiating non-visualisers from visualisers; therefore this definition implicitly says that non-visualisers also can think of pictures but they are reluctant to use this kind of thinking. The reason of this reluctance may be multi-faceted as Eisenberg and Dreyfus (1991) point out: visual methods are more difficult to teach and learn, and there is a belief that visual is not mathematical. As a result, most students and teachers do not tend to use visual methods and hence students who are outstanding in mathematics appeared to be non-visualisers. And thus people argue that non-visual processing in mathematics is better than visual methods. More clearly, it should be claimed that software environments may also of use to those students who are called non-visualisers. Furthermore, as Presmeg (1992) points out that in order to construct rich understanding of mathematics, people need to possess integrated visual and analytic thinking, therefore prepared visual software environments may be used to help this integration accomplished. CONCLUSION In this paper, the use of software environments is discussed by the help of some theories such as “Principle of Selective Construction”, the distinction between “figure” and “diagram”, “transformational proof scheme”. In order not to advertise any of the commercial software, clear examples of software such as screen shots were not provided. Rather, common properties of such software such as dragging, moving, shrinking, rotating was discussed in order to point out the importance of dynamic visualization. Dynamic visualization which can only be possible in software environment make easier to see changes or unchanged relationships before and after the variation of figures. Therefore, software environment has the potential of improving understanding. Software could be used for laborious constructions whilst the student can focus on specific relationships (Tall, 1993). From the arguments made, it could be claimed that dynamic visualization can be a very powerful tool to gain a greater understanding of mathematical concepts or it can be a resource to solve mathematical problems. Software environments can make it possible to produce such dynamic images which cannot be produced on static mediums. Moreover, software environments can be a very valuable tool to provide opportunities for investigation, experimentations of geometrical as well as some other mathematical concepts. Therefore, a view that software environments should be integrated into mathematics education where possible is held by this paper. REFERENCES Bishop, A. (1980). Spatial Abilities and Mathematics Education - A Review. Educational Studies in
Mathematics. 11, 257-269 Cabri Géomètre (1987). IMAG, BP 53X, Université de Grenoble Davis, P. J. (1993). Visual Theorems. Educational Studies in Mathematics. 24, (4). 333-344. Dreyfus, T. (1991). On the status of visual reasoning in mathematics and mathematics education. In F.
Furinghetti (Ed.), Proceedings of the 15 th PME conference, vol 1, pp. 33-48. Genova: University de Genova.
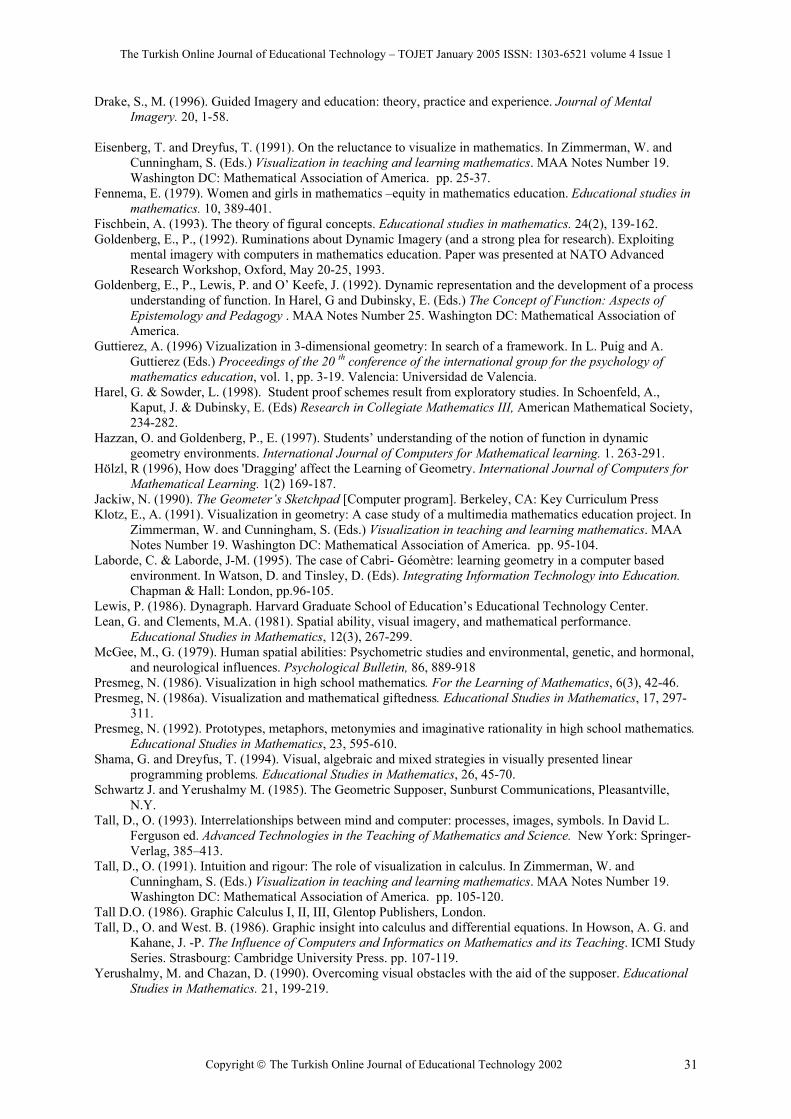
The Turkish Online Journal of Educational Technology – TOJET January 2005 ISSN: 1303-6521 volume 4 Issue 1
Copyright The Turkish Online Journal of Educational Technology 2002 31
Drake, S., M. (1996). Guided Imagery and education: theory, practice and experience. Journal of Mental Imagery. 20, 1-58.
Eisenberg, T. and Dreyfus, T. (1991). On the reluctance to visualize in mathematics. In Zimmerman, W. and
Cunningham, S. (Eds.) Visualization in teaching and learning mathematics. MAA Notes Number 19. Washington DC: Mathematical Association of America. pp. 25-37.
Fennema, E. (1979). Women and girls in mathematics –equity in mathematics education. Educational studies in mathematics. 10, 389-401.
Fischbein, A. (1993). The theory of figural concepts. Educational studies in mathematics. 24(2), 139-162. Goldenberg, E., P., (1992). Ruminations about Dynamic Imagery (and a strong plea for research). Exploiting
mental imagery with computers in mathematics education. Paper was presented at NATO Advanced Research Workshop, Oxford, May 20-25, 1993.
Goldenberg, E., P., Lewis, P. and O’ Keefe, J. (1992). Dynamic representation and the development of a process understanding of function. In Harel, G and Dubinsky, E. (Eds.) The Concept of Function: Aspects of Epistemology and Pedagogy . MAA Notes Number 25. Washington DC: Mathematical Association of America.
Guttierez, A. (1996) Vizualization in 3-dimensional geometry: In search of a framework. In L. Puig and A. Guttierez (Eds.) Proceedings of the 20 th conference of the international group for the psychology of mathematics education, vol. 1, pp. 3-19. Valencia: Universidad de Valencia.
Harel, G. & Sowder, L. (1998). Student proof schemes result from exploratory studies. In Schoenfeld, A., Kaput, J. & Dubinsky, E. (Eds) Research in Collegiate Mathematics III, American Mathematical Society, 234-282.
Hazzan, O. and Goldenberg, P., E. (1997). Students’ understanding of the notion of function in dynamic geometry environments. International Journal of Computers for Mathematical learning. 1. 263-291.
Hölzl, R (1996), How does 'Dragging' affect the Learning of Geometry. International Journal of Computers for Mathematical Learning. 1(2) 169-187.
Jackiw, N. (1990). The Geometer’s Sketchpad [Computer program]. Berkeley, CA: Key Curriculum Press Klotz, E., A. (1991). Visualization in geometry: A case study of a multimedia mathematics education project. In
Zimmerman, W. and Cunningham, S. (Eds.) Visualization in teaching and learning mathematics. MAA Notes Number 19. Washington DC: Mathematical Association of America. pp. 95-104.
Laborde, C. & Laborde, J-M. (1995). The case of Cabri- Géomètre: learning geometry in a computer based environment. In Watson, D. and Tinsley, D. (Eds). Integrating Information Technology into Education. Chapman & Hall: London, pp.96-105.
Lewis, P. (1986). Dynagraph. Harvard Graduate School of Education’s Educational Technology Center. Lean, G. and Clements, M.A. (1981). Spatial ability, visual imagery, and mathematical performance.
Educational Studies in Mathematics, 12(3), 267-299. McGee, M., G. (1979). Human spatial abilities: Psychometric studies and environmental, genetic, and hormonal,
and neurological influences. Psychological Bulletin, 86, 889-918 Presmeg, N. (1986). Visualization in high school mathematics. For the Learning of Mathematics, 6(3), 42-46. Presmeg, N. (1986a). Visualization and mathematical giftedness. Educational Studies in Mathematics, 17, 297-
311. Presmeg, N. (1992). Prototypes, metaphors, metonymies and imaginative rationality in high school mathematics.
Educational Studies in Mathematics, 23, 595-610. Shama, G. and Dreyfus, T. (1994). Visual, algebraic and mixed strategies in visually presented linear
programming problems. Educational Studies in Mathematics, 26, 45-70. Schwartz J. and Yerushalmy M. (1985). The Geometric Supposer, Sunburst Communications, Pleasantville,
N.Y. Tall, D., O. (1993). Interrelationships between mind and computer: processes, images, symbols. In David L.
Ferguson ed. Advanced Technologies in the Teaching of Mathematics and Science. New York: Springer-Verlag, 385–413.
Tall, D., O. (1991). Intuition and rigour: The role of visualization in calculus. In Zimmerman, W. and Cunningham, S. (Eds.) Visualization in teaching and learning mathematics. MAA Notes Number 19. Washington DC: Mathematical Association of America. pp. 105-120.
Tall D.O. (1986). Graphic Calculus I, II, III, Glentop Publishers, London. Tall, D., O. and West. B. (1986). Graphic insight into calculus and differential equations. In Howson, A. G. and
Kahane, J. -P. The Influence of Computers and Informatics on Mathematics and its Teaching. ICMI Study Series. Strasbourg: Cambridge University Press. pp. 107-119.
Yerushalmy, M. and Chazan, D. (1990). Overcoming visual obstacles with the aid of the supposer. Educational Studies in Mathematics. 21, 199-219.

The Turkish Online Journal of Educational Technology – TOJET January 2005 ISSN: 1303-6521 volume 4 Issue 1
Copyright The Turkish Online Journal of Educational Technology 2002 32
Zazkis, R., Dubinsky, E. and Dautermann, J. (1996). Coordinating visual and analytic strategies: a study of students’ understanding of the group D4. Journal for Research in Mathematics Education. 27, 4, 435-457.
Zimmerman, W. and Cunningham, S. (Eds.) (1991). Editors introduction: What is Mathematical Visualization? In Zimmerman, W. and Cunningham, S. (Eds.) Visualization in teaching and learning mathematics. MAA Notes Number 19. Washington DC: Mathematical Association of America. pp. 1-7.
END NOTES 1 As Goldenberg, Lewis, O’Keefe (1991) point out that describing a dynamic event or reading it through static
mediums such as paper and words which are incapable of dynamic visualization may cause problems for both authors and readers. “Therefore, the dynamics of which we [authors] speak must be created by you [readers], in your [readers’] head, as you [they] read, just as students of mathematics (for lack of dynamic representations) have been forced to all along.” (ibid, p. 1)
2Harel & Sowder (1998) do not exactly use the term dynamic visualisation ability; rather they use the term transformational proof scheme.
3 This example is adapted from Goldenberg (1992, p. 6)
The Turkish Online Journal of Educational Technology – TOJET January 2005 ISSN: 1303-6521 volume 4 Issue 1
Copyright The Turkish Online Journal of Educational Technology 2002 33
IMPROVING TEACHER QUALITY, A KEYWORD FOR IMPROVING EDUCATION FACING GLOBAL CHALLENGES
Drs. Husain Jusuf, M.Pd
IKIP Negeri Gorontalo – Indonesia [email protected]
ABSTRACT Research shows that teachers are the single most important factor in student learning in schools. Students who have access to highly qualified teachers achieve at a higher rate, regardless of other factors. Teachers to be highly qualified must be well prepared, especially in improving the quality of education facing global challenges. For this purpose, we need teacher education reform that aligns teacher preparation with the demands of an emerging information society and an increasingly interdependent world at the end of the 20th Century. One concern focused on the quality of students who plan to enter the teaching profession. Generally, teacher profession is not attractive both for the prospective students and for the qualified experienced teachers, because of the low of teachers’ welfare. As the result, the good potential students prefer to enter the other profession than enter the teaching profession, while the qualified experienced teacher, draw away from teaching profession and then enter the other profession that ensure better welfare whenever they have the opportunity for doing that. For the teaching profession to be attractive there is a need to improve teachers welfare by increasing their salary and providing good work condition that support them to carry out their task professionally. The second issue is program reform, which led to the development of standards of teacher preparation in various fields, and changes the curriculum itself. Changing the curriculum must be competency-based, point out the teacher competency. According to Heil (2003), ‘. . . a key role for higher education institutions must be to graduate future teachers who think globally, have international experience, demonstrate foreign language competence, and are able to incorporate a global dimension into their teaching’. Key Words: Teacher Quality, Professionalism, Education, Globalization, Technology
INTRODUCTION Globalization has brought a great effect to human life not only in economic issues, but also in political, social, and cultural issues. Its effect can be positive, or negative, depends on the quality of human resources. Indeed, human resources with low quality will fail, whether the only human resources with high quality standard will succeed in facing global challenges. Now is the moment when globalization will give rises to two possible alternatives for everyone and every nation.. The globalization may be as a threat or maybe as an opportunity. To be successful in facing global challenges, everyone or every nation must have great efforts to change the threat to be opportunity. These efforts must be supported by the improvement of human resources. To produce human resources with high quality, we need education with high quality too. In fact, according to the demand of facing global challenges, we need to improve the quality of education and develop education standards that contain global and international issues. According to the Guidelines for Global and International Studies Education (United States, 2002), among these issues are: what should all our students be expected to know and understand about the world? What skills and attitudes will our students need to confront future problems, which most assuredly will be global in scope? How are the global and international dimensions of learning being addressed by the new academic standards? What do scholars from the international relations discipline and experienced practitioners of global education believe students should know, and how can these insight best be incorporated into the existing standards? What global and international education guidelines are appropriate for precollegiate education? How schools implement these guidelines when confronted with so many other problems? The answers of the questions stated above present an array of diverse approaches, contents, skills, methods, and values. We need to develop a high quality education system in which every student can be provided access to the educational components that are essential to such system. According to The California Master Plan for Education (2003) among these components are as follows:

The Turkish Online Journal of Educational Technology – TOJET January 2005 ISSN: 1303-6521 volume 4 Issue 1
Copyright The Turkish Online Journal of Educational Technology 2002 34
1. A qualified and inspiring teacher in the classroom 2. A rigorous curriculum that will prepare all students for success in postsecondary education, work, and society. 3. Current textbooks, technology, and instructional materials aligned with learning expectations. 4. Adequate learning support services. 5. Qualified school or campus administrators, to maintain an educational culture that is inviting and safe, and that places a high value on student achievement and teaching excellence, and 6. A physical learning environment that is safe, well equipped, and well maintained.
All the components stated above should be provided to every students enrolled in public education, from preschool to university levels. A STRIVE TOWARDS PROFESSIONALISM For education to improve, all the teachers must have a global perspective, well prepared and provided with ongoing professional development and appropriate support. All teachers have to fulfill the standards of professional teacher. For this purpose, we need standards with international scope and how to achieve these standards. Based on the standard of the International Society for Technology in Education (ISTE), the National Council for Accreditation of Teacher Education (NCAT), the Association of Educational Communication and Technology (AECT), the American Association of School Librarian (AASL), there are some characteristics of professional teachers. Among of these characteristics are as follows:
In general, the competent teacher should have, and continually develop, the knowledge and skills in learning technologies to be able to appropriately and responsibly use tools, resources, processes, and systems to retrieve, assess and evaluate information from various media. The competent teacher should use that knowledge and skills to assist learners in solving problems, communicating clearly, making informed decisions, and in constructing new knowledge, products, or systems in diverse, engaged learning environments. Particularly, the professional teachers should have mastery about basic computer/technology operations and concept, be able to apply technology in instruction, apply concepts and skills in making decisions concerning the social, ethical, and human issues related to computer and technology. The professional teacher should understand the changes in information technologies, their effects on workplace and society, their potential to address lifelong learning and workplace needs, and the consequences of misuse. Furthermore the professional teacher should be able to use telecommunications and information-access resources to support instruction. There are some effective strategies can be implemented: 1. Improve the Curriculum of The Teacher Education by Competency Based, Broad Based, Life Skills, and Technology Based. The Competency-Based Curriculum represents an approach to instruction which emphasizes the application of knowledge in a manner which may be observed or measured. Competency-Based Curriculum guides focus on a comprehensive view of each course of study which is delineated into its essential components, a listing of the most important objectives to be mastered, and the competencies which every student should be able to demonstrate after instruction is completed. Competency-Based lessons require students to engage in activities designed to apply learning with an increased emphasis on higher order thinking skills. Students are evaluated not only on knowledge, but primarily on their ability to perform tasks associated with the knowledge acquired. Likewise an education in life skills is designed to help children and young people to learn the skills they need to deal with the likely demands and challenges of modern life, help children develop a broad range of personal, social, cognitive and environ-mental skills. Furthermore the philosophy underlying the organization of the curriculum is to provide students with the broad base of knowledge and skill which will not only allow them to compete successfully for high quality entry level positions, but will also provide the basis for lifelong success. The technology base is more concerned with giving a broad overview of the various technologies available, the functions they can perform and their advantages and constraints. In addition to studying the current capability of a technology, students should be given some insight into how that technology might develop in the future.

The Turkish Online Journal of Educational Technology – TOJET January 2005 ISSN: 1303-6521 volume 4 Issue 1
Copyright The Turkish Online Journal of Educational Technology 2002 35
2. Prepare New Teachers to Use and Integrate Technology. This can be done by integrate technology applications into pre-service teacher assignment and activities. We mean by technologies especially learning and teaching technologies are those methods and practices used to learn and to facilitate learning. It is the way we learn and the way we teach. It include the tools we use and instructional design we apply. Technology in learning refers to both tools (the hardware, software, networks,etc.) and the processes (the methods and strategies used for instructions, the design of our educational organizations, learning management systems, etc.) According to Gradler (2002), ‘. . . a growing challenge in education is establishing and implementing strategies to develop the skills and knowledge necessary for teachers to effectively use technology as instructional tools. The extent to which teachers are prepared to infuse technology into curricula and instruction is a major contextual factor’. The problems may appear in this case are: what strategies are effective for preparing new teachers to integrate technology, and what can school leaders do to enable teachers to make effective use of technology. Research findings cried out by Abbot & Faris (2000) indicate that effective strategies for preparing new teachers to use and integrate technology are: demonstrate infusion of technology into instructional practices, require that college faculty use technology in their courses as learning and teaching tool. Preserves elementary teachers learn technology integration strategies by working with and observing practicing teachers and students while they use technology. In order to integrate new technologies into the curriculum, teachers will have to select appropriate software, construct new lesson plans, resolve a number of logistical problems, and develop appropriate methods of assessing student work. Furthermore there are five studies identify strategies for school leaders to support and reinforce the exemplary use of technology with curricula, as pointed out by Cradler (2002), as follows: 1. School leaders can support on-site, just in-time learning by tailoring professional development to the perceived needs and curriculum goals and objectives of individual teachers (Cradler & Cradler (1995). 2. School leaders can allocate resources for at least four networked and internet-connected computers in each classroom (Becker, 1999). 3. School leaders need to model the use of technology in their work in order to encourage and reinforce the classroom infusion of technology by teachers (CEO Forum, 1999). 4. School leaders need to support technology policies that provide teachers easy access to technology resources and professional development opportunities (Zhao et al., 2002). 5. School leaders can enable teachers to observe practices in other district and states and to make recommendations for new practices based on their observation (OTA< 19959) 3. Select the Teacher Based on Professional Competency and Professional Responsibility. In order to ensure the high quality of education, the Government should select the teacher based on professional competency and professional responsibility. In this case, it should be taken into account that not all of the teachers who have professional competency have also professional responsibility. According to Sonoma State University Academic Sonate (2003), ‘. . . the responsibilities of the teachers fall into five main areas: (1) to their subject; (2) to their students; (3) to the institution of which s/he is a part; (4) to their profession; and (5) to the community at large’. The greatest problem in teaching is how to create, sustain, and motivate good teachers throughout their careers. Recruiting and preparing high quality teachers must remain a priority for policymaker. 4. Provide Enough Expenditure to Provide Technological Learning Tools and Equipment. When a school or district decides to implement education technology into the curriculum, one of its overriding goals must be to create plans and policies for all members of the learning community to have equitable access and use. Appropriate funding and professional development represent the key means of supporting equitable access and use of technology to ensure technology literacy and to support meaningful learning for all students. Education technology consists of a wide range of hardware, software, and technical equipment used in schools to promote learning. Computers, CD-ROMs, the internet, e-mail, television monitors, video equipment, and satellite systems for distance learning are some of the education technologies that schools are using.

The Turkish Online Journal of Educational Technology – TOJET January 2005 ISSN: 1303-6521 volume 4 Issue 1
Copyright The Turkish Online Journal of Educational Technology 2002 36
Means, Blando, Olson, Middleton, Morocco, Remz, and Zorfass (1993) suggest grouping education technologies according to their instructional use. They categorize education technology into four basic uses: tutorial, exploratory, application, and communication: 1. Tutorial use includes expository learning, demonstration, and practice. Examples are drill-and-practice software, tutoring systems, instructional television, computer-assisted instruction, and intelligent computer-assisted instruction. 2. Exploration applications may promote discovery or guided discovery approaches to helping students learn information, knowledge, facts, concepts, or procedures Examples are CD-ROM encyclopedias, micro worlds, hypermedia stacks, network search tools, and microcomputer-based laboratories 3. Application uses help students in the educational process by providing them with tools to facilitate writing tasks, analysis of data, and other uses. Examples are word processing and spreadsheet software, database management programs, graphic software, desktop publishing systems, hypermedia, network search tools, and videotape recording and editing equipment. 4. Communication uses are those that allow students and teachers to send and receive messages and information to one another through networks or other technologies. Examples are interactive distance learning through satellite systems, computer and modem, cable links, and e-mail 5. All Teachers must be well provided with Ongoing Professional Development and Appropriate support. If we are to improve education, we must avoid the tendency to rely on simple generalizations and dichotomies. We need to attend to pre-service and in-service issues in improving teacher quality. We need to be discerning in the kinds of professional development that we support. Teacher quality is not solely determined by a credential or degree, and we should think of it as a characteristic that evolves throughout a teacher’s career, rather than as a static achievement. Teacher quality is an attribute that grows or diminishes based on conditions in which a teacher works, personal motivation, and opportunities for growth and development. In order to make effective use of educational technology, not only new teachers but all of the teacher should have to master a variety of powerful tools, redesign their lesson plans around technology-enhanced resources, solve the logistical problem of how to teach a class full of students with a smaller number of computers, and take on a complex new role in the technologically transformed classroom. All teachers should recognize that they will never stop learning. According to Schrum (2002), ‘. . . technology allows all sorts of possibilities for continuing education for teachers, but first they must be comfortable using it.. What we know doesn’t work is somebody standing at the front demonstrating how to use a computer, and then everyone goes home. We know that becoming comfortable with technology takes an intense amount of time and that educators need to have the computers at school and, typically, at home if they are truly to become users’. 6. Enhance Teacher Welfare. To do the task as teachers professionally, need full concentration and inspire by the teacher. Indeed, for the teachers to be able to concentrate and to be inspiring teachers in their professional tasks, their welfare should be reasonably fulfilled. Quality teachers can be attracted, and retained by the promoting of an atmosphere of positive support for education, providing improved training and professional development, increasing teacher salaries, and installing outstanding facilities. Furthermore, special efforts must be made to attract to these schools qualified teachers who have the disposition and passion to persist in challenging environments and these teachers must receive the support necessary to enable them to improve their effectiveness. In order to attract individuals to the profession and retain them, teacher salaries should be attractive for both new and experienced teachers and salary schedules should offer opportunities for increased compensation without leaving the classroom. In addition, we must create a school culture in which teachers assume leadership roles in school decision-making, collaboration occur on a regular basis, professional development is ongoing, and new teachers are supported. Investment in the professional development of the teachers should not be lost by incentives and practices that draw most experienced teachers away from the classroom.
The Turkish Online Journal of Educational Technology – TOJET January 2005 ISSN: 1303-6521 volume 4 Issue 1
Copyright The Turkish Online Journal of Educational Technology 2002 37
CONCLUSION. Global challenges that influence all areas of human life in the world are the conditions that are naturally going on as the consequence of the rapid development of science and technology. It is impossible to be avoided but have to be faced by using resources with high quality especially human resources. To face the global challenges successfully, we need the qualified human resources that can only be produced through authentic educational program and authentic educational process with high quality. Teachers’ quality is the keyword for ensuring the quality of education that indicated by the quality of output and outcome. Without qualified competent teachers, it is impossible to build a high quality education. On the other hand, qualified competent teacher will not able to carry out their task professionally without the proper conditions that support their task. Hence, in one hand we need to continually improve teachers’ quality, and on the other hand we need to provide a proper condition to support teachers in their professional tasks. RECOMMENDATION 1. To provide a high quality education, the Government should be committed to ensuring that every student has the opportunity to learn from a qualified and inspiring teacher. 2. To provide a high quality education, there is a need to develop a professional culture that respects teaching and learning, professional staff are supported in their effort to continually improve their effectiveness in promoting student learning, school sites are well maintained, school leaders build and maintain effective partnerships with parents, community groups, and local business, and instructional material are current and aligned with the academic content standards. 3. The Government should provide grand funding to develop the quality of human resource by providing enough expenditure for education development. 4. The Government should promote recognition that becoming a qualified and professional teacher is, a long term, and developmental process. 5. The Government should pay enough attention to teachers welfare to attract the good potential students to enter the teacher profession through the institution of teacher education, and retain the qualified experienced teacher for schools. REFERENCES Avalos, Beatrice, (2002), Teachers for Twenty-First Century, Teacher Educatioa: Reflections, Debates,
Challenges and Innovations (http:/www.ibe.unesco.org/ International/Publications/Prospect/prospectsOpenFiles/pr123ofc.pdf)
Cradler, John; Crader, Ruthmary; Freman, Molly; and McNobb, Mary, (2002), Research Implications for Preparing Teachers to Use Technology (http:/caret.iste.org/caretadm/ news.documents/ProfDef.pdf)
Dias, de Figueiredo, A., (1995), What are the Big Challenges of Education for the XXI Century: Proposals for Action, University of Columbia, Portugal (http:/www.google.com/search?sourceid=navclient&hl=id&g=What+are+the+Big+Challenges+of+Education+for+XXI+Century)
Discussions of Teacher Quality (http:/www.ets.org/research/pic/teamat.pdf) Guskey, Thomas R., (2001), The Backward Approach (Journal of Staff Development, Summer 2001 Vol.22 No.
3t (http:/www.nsdc.org/library/jsd/guskey223.html) Heil, John D., and McCarthy, JoAnn, (2003), International Education and Teacher Preparation in the US, for
Presentation at The National Conference “Global Challenges and U.S. Higher Education: National Needs and Policy Implications”, Duke University, January 25 2003
(http:/www.duke.edu/web/cis/globalchallenges/pdf/heyl-abstract.pdf) Istanto, Freddy H., (2002), A Global Perspective, A Keyword for Design Education Facing XXI Century, for
Presentation at International Design Conference, Dongseo University Corea, May 18 2003 ( http://puslit.petra.ac.id/expertise/authors/I/Istanto, %20Freddy%20Handoko.htm) New ICT Curricula for the 21st Century, Design Tomorrow’s Education, Curriculum Guidelines
(http:/www.career-space.com/cdguide/serv3.htm) Schrun, Linne, (2002), Technology in the Classroom, (http:/www.enc.org/topics/ edtech/contex/document.shtm). Virginia Scale, (2002), Integrating Technology into Planning and Curriculum (http:/www.ael.org/rtec/ideas.htm) Wenglinsky, (2002), How Teaching Matters Bringing the Classroom Back into Illinois State Technology
Standards, (2001), Core Technology Standards For All Teachers (http:/talent.ed.uiuc.edu/docs/Illinois State Technology Standars.pdf)

The Turkish Online Journal of Educational Technology – TOJET January 2005 ISSN: 1303-6521 volume 4 Issue 1
Copyright The Turkish Online Journal of Educational Technology 2002 38
PARENT’S VIEWS ON INTERNET USE
Doç. Dr. H. Ferhan Odabaşı Anadolu Üniversitesi, Eğitim Fakültesi, Bilgisayar ve Öğretim Teknolojileri Eğitimi Bölümü
“The Internet is here to stay. So is the family” Joseph Turow
ABSTRACT Children’s effective use of Internet relies heavily on the factors surrounding them, thus parents’ views and attitudes are crucial for elementary children’s productive use of Internet. Besides, parental awareness on Internet helps parents to reflect to the related issues of Internet. This study tries to reveal the elementary school children’s parents’ views on Internet. A questionnaire consisting of 17 items regarding financial, social, educational and safety aspects of Internet were used to collect the data. Carried out with 94 parents; the survey indicates that the parents observe Internet as an economical media, rather unaware of the safety issues, believe that Internet enhances the academic achievement and is a necessity of contemporary life. Another highlight of the study is that parents do not believe that Internet use effects family relations negatively Keywords: internet use, children, parents
İNTERNET KULLANIMINA İLİŞKİN AİLE GÖRÜŞLERİ ÖZET Çocukların etkili İnternet kullanımında, çevresel faktörlerin etkisi büyüktür. Bu nedenle, ailelerin görüşleri ve tutumları, ilköğretim düzeyindeki çocukların etkili İnternet kullanımları için oldukça önemlidir. Ayrıca, İnternet hakkında ailesel farkındalık, ailelerin İnternet’le ilişkili konular üzerinde düşünmelerine yardımcı olur. Bu araştırmada, İnternet’le ilgili ilköğretim düzeyindeki çocukların ailelerinin görüşlerini ortaya koymaya çalışmaktadır. Araştırmada, veri toplamak için, İnternet’in mali, sosyal, eğitim ve güvenlik boyutlarıyla ilişkili 17 maddeden oluşan bir anket kullanılmıştır. Anket, 94 aileye uygulanmıştır. Anket, ailelerin güvenlik konusundan habersiz olmaktan çok İnternet’i ekonomik bir ortam olarak gördüğüne ve İnternet’in akademik başarıyı artırdığına ve çağdaş yaşamın bir gerekliliği olduğuna inandıklarına işaret etmektedir. Araştırmanın bir diğer önemli bulgusu, ailelerin İnternet’in aile ilişkilerini olumsuz etkilediğine inanmadıklarıdır. Anahtar Sözcükler: internet kullanımı, çocuklar, aileler. 1. BACKGROUND “Just as the hearth acted as the focal point for the American family in 19 th century,and television was in the 20 th century, computer units are rapidly becoming the centerpiece for the American family in 21st century” says Tortorello, one of the authors of a survey on computing and the American family (Lexmark.com). Now the world being a global village the situation is neither different nor less effective in Turkey. Arriving with the computers, the most recent technological issue in Turkey is the Internet. Internet is considered very attractive both education and entertainmentwise in Turkey (Odabaşı, 2002). The diffusion of Internet to Turkey has been late and slow, however, considering the little number of Internet users, Turkey has a chance to give training to more people on Internet use and make them gain awareness on different aspects of Internet. It is no doubt that Internet is growing like a snowball, and the related issues will keep on gaining attention. These issues can vary according to the fields of interest and this study will concentrate on the parental side of Internet issue. However, it may be appropriate to start with Internet in Turkey to form an introduction to the study. 1. 2. Internet in Turkey Turkey’s first experience with Internet started in 1990 with EARN (European Academic and Research Network). With this first attempt, Ege University had connections internationally with Pisa and Montpellier Universities. The first national connection Ege University realized was with Anadolu and Yıldız Technical Universities. The second attempt was realized in 1993 via Middle East Technical University. This connection was used for a long time, until the universities started to provide their connections via ULAKNET, an academical initiative, in 1997. It is only after ULAKNET, that a speeder and a commercial connection TTNet started to give service to larger populations. The number of users was 600 thousand in 1997 whereas it reached 2 million in 2000 (Gökçöl, 2001) and the estimated population is 3 million regarding 2001 (Odabaşı, 2002). A recent research (Superonline.com, 2003) shows the profile of Internet users as given in figures beloco.

The Turkish Online Journal of Educational Technology – TOJET January 2005 ISSN: 1303-6521 volume 4 Issue 1
Copyright The Turkish Online Journal of Educational Technology 2002 39
Gender
29%
71%
Male
Female
Figure 1. The Genders of Internet Users in Turkey
As can be seen in Figure 1, the number of the male users is quite more than female users. This situation shows consistency with other literature from the world which claims that gender always makes difference in computing (Shashaani 1994).
Age
5%
49%30%
12%
3%
1%
18 (-)
18-30
31-4041-50
51-60
60 (+)
Figure 2. The Ages of Internet Users in Turkey
The age profile given in Figure 2 shows that highest percentage (49%) of Internet users are between the ages 18-30. This might be due to that you are legally free on age 18 in Turkey and establish a life standart already by 30 which makes Internet use accesible for career issues without considering financial issues.
Marital Status
53%
45%
2%
Maried
Single
Divorced
Figure 3. The Marital Status of Internet Users in Turkey
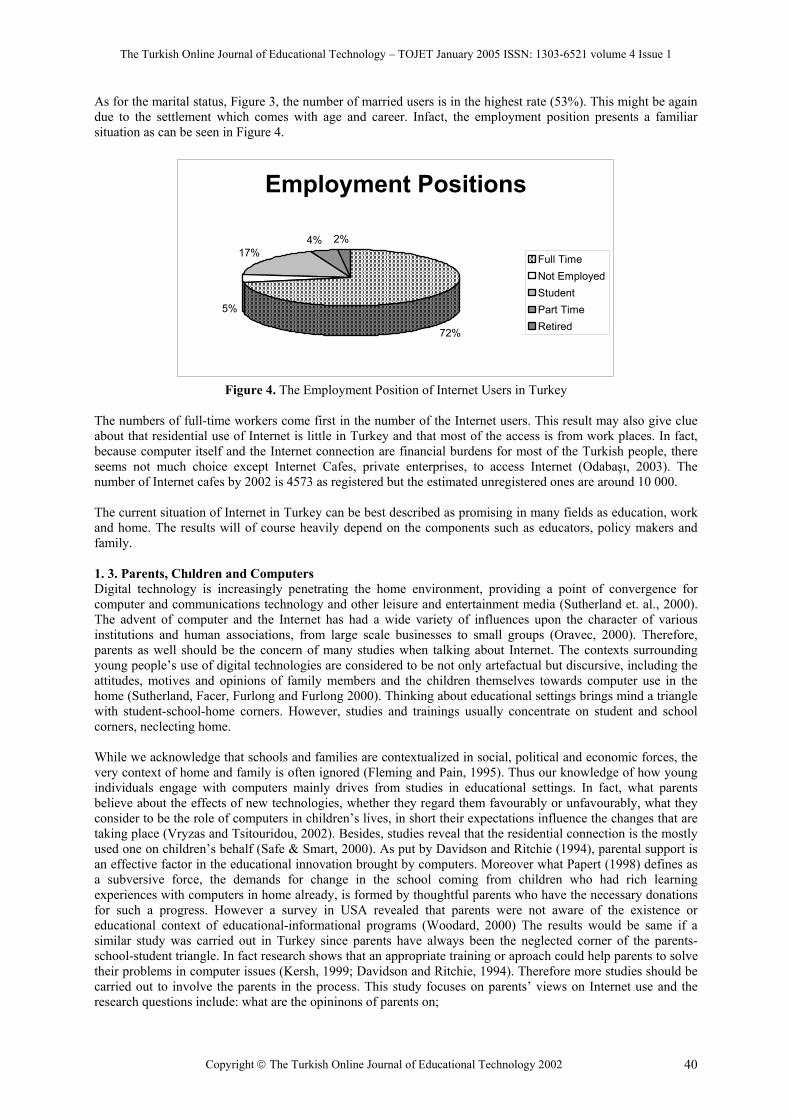
The Turkish Online Journal of Educational Technology – TOJET January 2005 ISSN: 1303-6521 volume 4 Issue 1
Copyright The Turkish Online Journal of Educational Technology 2002 40
As for the marital status, Figure 3, the number of married users is in the highest rate (53%). This might be again due to the settlement which comes with age and career. Infact, the employment position presents a familiar situation as can be seen in Figure 4.
Employment Positions
72%
5%
17%4% 2%
Full TimeNot EmployedStudentPart TimeRetired
Figure 4. The Employment Position of Internet Users in Turkey
The numbers of full-time workers come first in the number of the Internet users. This result may also give clue about that residential use of Internet is little in Turkey and that most of the access is from work places. In fact, because computer itself and the Internet connection are financial burdens for most of the Turkish people, there seems not much choice except Internet Cafes, private enterprises, to access Internet (Odabaşı, 2003). The number of Internet cafes by 2002 is 4573 as registered but the estimated unregistered ones are around 10 000. The current situation of Internet in Turkey can be best described as promising in many fields as education, work and home. The results will of course heavily depend on the components such as educators, policy makers and family. 1. 3. Parents, Chıldren and Computers Digital technology is increasingly penetrating the home environment, providing a point of convergence for computer and communications technology and other leisure and entertainment media (Sutherland et. al., 2000). The advent of computer and the Internet has had a wide variety of influences upon the character of various institutions and human associations, from large scale businesses to small groups (Oravec, 2000). Therefore, parents as well should be the concern of many studies when talking about Internet. The contexts surrounding young people’s use of digital technologies are considered to be not only artefactual but discursive, including the attitudes, motives and opinions of family members and the children themselves towards computer use in the home (Sutherland, Facer, Furlong and Furlong 2000). Thinking about educational settings brings mind a triangle with student-school-home corners. However, studies and trainings usually concentrate on student and school corners, neclecting home. While we acknowledge that schools and families are contextualized in social, political and economic forces, the very context of home and family is often ignored (Fleming and Pain, 1995). Thus our knowledge of how young individuals engage with computers mainly drives from studies in educational settings. In fact, what parents believe about the effects of new technologies, whether they regard them favourably or unfavourably, what they consider to be the role of computers in children’s lives, in short their expectations influence the changes that are taking place (Vryzas and Tsitouridou, 2002). Besides, studies reveal that the residential connection is the mostly used one on children’s behalf (Safe & Smart, 2000). As put by Davidson and Ritchie (1994), parental support is an effective factor in the educational innovation brought by computers. Moreover what Papert (1998) defines as a subversive force, the demands for change in the school coming from children who had rich learning experiences with computers in home already, is formed by thoughtful parents who have the necessary donations for such a progress. However a survey in USA revealed that parents were not aware of the existence or educational context of educational-informational programs (Woodard, 2000) The results would be same if a similar study was carried out in Turkey since parents have always been the neglected corner of the parents-school-student triangle. In fact research shows that an appropriate training or aproach could help parents to solve their problems in computer issues (Kersh, 1999; Davidson and Ritchie, 1994). Therefore more studies should be carried out to involve the parents in the process. This study focuses on parents’ views on Internet use and the research questions include: what are the opininons of parents on;
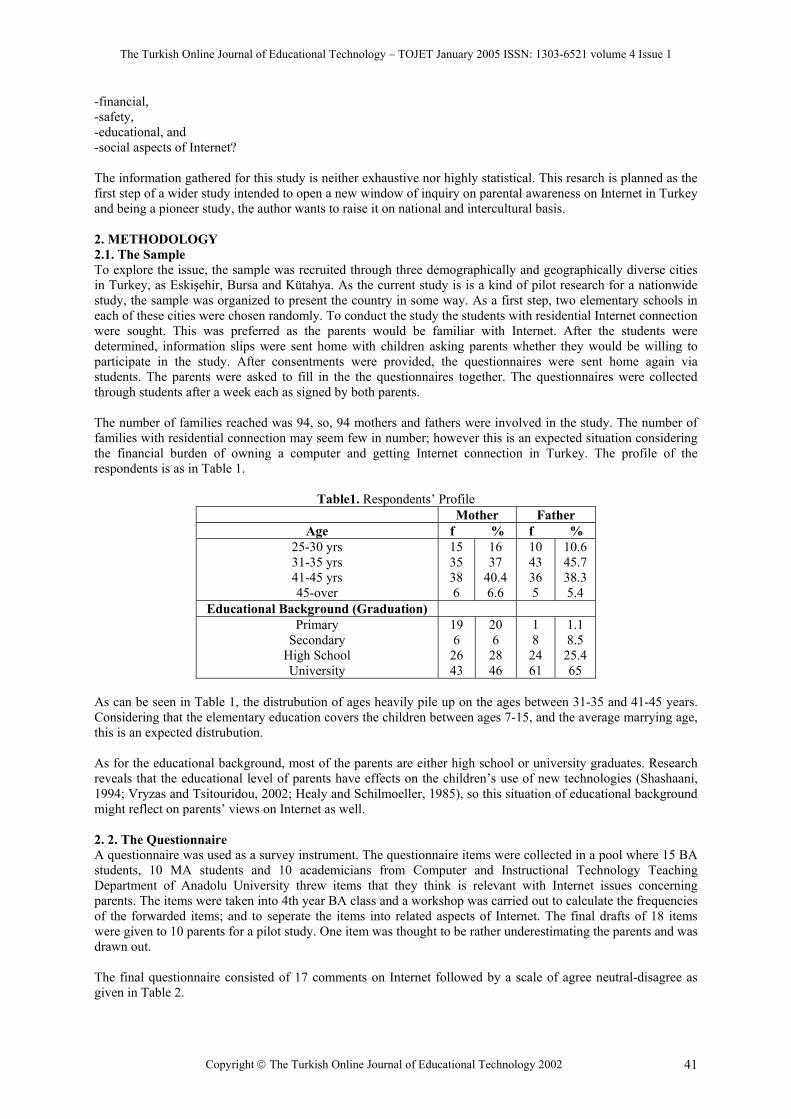
The Turkish Online Journal of Educational Technology – TOJET January 2005 ISSN: 1303-6521 volume 4 Issue 1
Copyright The Turkish Online Journal of Educational Technology 2002 41
-financial, -safety, -educational, and -social aspects of Internet? The information gathered for this study is neither exhaustive nor highly statistical. This resarch is planned as the first step of a wider study intended to open a new window of inquiry on parental awareness on Internet in Turkey and being a pioneer study, the author wants to raise it on national and intercultural basis. 2. METHODOLOGY 2.1. The Sample To explore the issue, the sample was recruited through three demographically and geographically diverse cities in Turkey, as Eskişehir, Bursa and Kütahya. As the current study is is a kind of pilot research for a nationwide study, the sample was organized to present the country in some way. As a first step, two elementary schools in each of these cities were chosen randomly. To conduct the study the students with residential Internet connection were sought. This was preferred as the parents would be familiar with Internet. After the students were determined, information slips were sent home with children asking parents whether they would be willing to participate in the study. After consentments were provided, the questionnaires were sent home again via students. The parents were asked to fill in the the questionnaires together. The questionnaires were collected through students after a week each as signed by both parents. The number of families reached was 94, so, 94 mothers and fathers were involved in the study. The number of families with residential connection may seem few in number; however this is an expected situation considering the financial burden of owning a computer and getting Internet connection in Turkey. The profile of the respondents is as in Table 1.
Table1. Respondents’ Profile Mother Father
Age f % f % 25-30 yrs 31-35 yrs 41-45 yrs 45-over
15 35 38 6
16 37
40.4 6.6
10 43 36 5
10.6 45.7 38.3 5.4
Educational Background (Graduation) Primary
Secondary High School University
19 6
26 43
20 6
28 46
1 8
24 61
1.1 8.5
25.4 65
As can be seen in Table 1, the distrubution of ages heavily pile up on the ages between 31-35 and 41-45 years. Considering that the elementary education covers the children between ages 7-15, and the average marrying age, this is an expected distrubution. As for the educational background, most of the parents are either high school or university graduates. Research reveals that the educational level of parents have effects on the children’s use of new technologies (Shashaani, 1994; Vryzas and Tsitouridou, 2002; Healy and Schilmoeller, 1985), so this situation of educational background might reflect on parents’ views on Internet as well. 2. 2. The Questionnaire A questionnaire was used as a survey instrument. The questionnaire items were collected in a pool where 15 BA students, 10 MA students and 10 academicians from Computer and Instructional Technology Teaching Department of Anadolu University threw items that they think is relevant with Internet issues concerning parents. The items were taken into 4th year BA class and a workshop was carried out to calculate the frequencies of the forwarded items; and to seperate the items into related aspects of Internet. The final drafts of 18 items were given to 10 parents for a pilot study. One item was thought to be rather underestimating the parents and was drawn out. The final questionnaire consisted of 17 comments on Internet followed by a scale of agree neutral-disagree as given in Table 2.
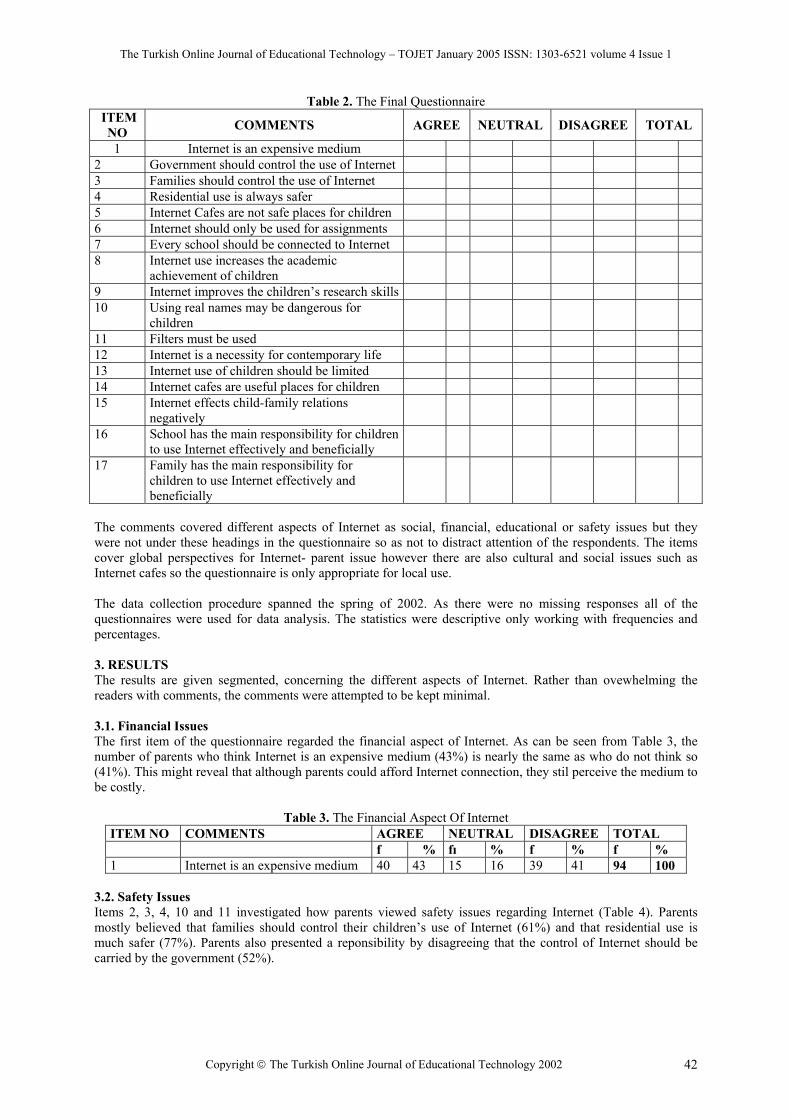
The Turkish Online Journal of Educational Technology – TOJET January 2005 ISSN: 1303-6521 volume 4 Issue 1
Copyright The Turkish Online Journal of Educational Technology 2002 42
Table 2. The Final Questionnaire ITEM
NO COMMENTS AGREE NEUTRAL DISAGREE TOTAL
1 Internet is an expensive medium 2 Government should control the use of Internet 3 Families should control the use of Internet 4 Residential use is always safer 5 Internet Cafes are not safe places for children 6 Internet should only be used for assignments 7 Every school should be connected to Internet 8 Internet use increases the academic
achievement of children
9 Internet improves the children’s research skills 10 Using real names may be dangerous for
children
11 Filters must be used 12 Internet is a necessity for contemporary life 13 Internet use of children should be limited 14 Internet cafes are useful places for children 15 Internet effects child-family relations
negatively
16 School has the main responsibility for children to use Internet effectively and beneficially
17 Family has the main responsibility for children to use Internet effectively and beneficially
The comments covered different aspects of Internet as social, financial, educational or safety issues but they were not under these headings in the questionnaire so as not to distract attention of the respondents. The items cover global perspectives for Internet- parent issue however there are also cultural and social issues such as Internet cafes so the questionnaire is only appropriate for local use. The data collection procedure spanned the spring of 2002. As there were no missing responses all of the questionnaires were used for data analysis. The statistics were descriptive only working with frequencies and percentages. 3. RESULTS The results are given segmented, concerning the different aspects of Internet. Rather than ovewhelming the readers with comments, the comments were attempted to be kept minimal. 3.1. Financial Issues The first item of the questionnaire regarded the financial aspect of Internet. As can be seen from Table 3, the number of parents who think Internet is an expensive medium (43%) is nearly the same as who do not think so (41%). This might reveal that although parents could afford Internet connection, they stil perceive the medium to be costly.
Table 3. The Financial Aspect Of Internet ITEM NO COMMENTS AGREE NEUTRAL DISAGREE TOTAL f % fı % f % f % 1 Internet is an expensive medium 40 43 15 16 39 41 94 100
3.2. Safety Issues Items 2, 3, 4, 10 and 11 investigated how parents viewed safety issues regarding Internet (Table 4). Parents mostly believed that families should control their children’s use of Internet (61%) and that residential use is much safer (77%). Parents also presented a reponsibility by disagreeing that the control of Internet should be carried by the government (52%).

The Turkish Online Journal of Educational Technology – TOJET January 2005 ISSN: 1303-6521 volume 4 Issue 1
Copyright The Turkish Online Journal of Educational Technology 2002 43
More than half of the parents agreed that filters are necessary for children’s Internet use (67%), however not as much concerned about that using real names on Internet may be dangerous. Only 31% of the parents agreed on this safety problem.
Table 4. The Safety Aspects ITEMNO COMMENTS AGREE NEUTRAL DISAGREE TOTAL
f % fı % F % f % 2 Government should control the use
of Internet 29 31 16 17 49 52 94 100
3 Families should control the use of Internet
61 65 7 7,4 26 27,6 94 100
4 Residential use is always safer 77 81,7 13 14 4 4,3 94 10010 Using real names may be
dangerous for children 31 33 37 39 26 28 94 100
11 Filters must be used 67 71 10 11 17 18 94 100 3.3. Educational Issues As can be seen from Table 5, concerning the educational aspects (Items, 6, 8, 9, 13, 16, 17), parents mostly disagree that Internet should only be used for assignments (87%). The distrubution of parents who agree that Internet enhances the academic achievement and who are neutral are the same (45%). On the other hand parents highly agree that Internet improves the research skills of children (93.6%). The reason of this high level of agreement is thought to be that the Turkish word for search is similar to the Turkish word of research and since the the Internet concept has always been assocated with search on media, parent are familiar with this concept and know that Internet means search (or research)! They also mostly agree that children’s time of Internet use should be limited (69%) and as for educational control as well, families mostly, believe that they should be the mechanisms to take the responsibity (59%).
Table 5. The Educational Aspects ITEMNO COMMENTS AGREE NEUTRAL DISAGREE TOTAL f % fı % F % f % 6 Internet should only be used for
assignments 3 3,4 9 9,6 82 87 94 100
8 Internet use increases the academic achievement of children
42 45 42 45 10 10 94 100
9 Internet improves the children’s research skills
88 93,6 5 5,3 1 1,1 94 100
13 Internet use of children should be limited
56 69 10 11 28 30 94 100
16 School has the main responsibility for children to use Internet effectively and beneficially
37 39 31 33 26 28 94 100
17 Family has the main responsibility for children to use Internet effectively and beneficially
59 62 25 27 10 11 94 100
3.4. Social Issues Table 6 covers the social issues (Items, 5,7,12,14,15) . Half of the parents believe that Internet cafes are not safe places (50%). Related with the Internet cafe issue again only 10% of the parents agree that Internet cafes are useful places for children. Parents most highly agree that Internet is a necessity of contemporary life (95.7%) and disagree that Internet effects family relations negatively (62 %).
Table 6. The Social Issues ITEMNO COMMENTS AGREE NEUTRAL DISAGREE TOTAL
f % fı % f % f % 5 Internet Cafes are not safe places
for children 47 50 16 17 31 33 94 100
7 Every school should be connected 87 92,6 5 5,3 2 2,1 94 100

The Turkish Online Journal of Educational Technology – TOJET January 2005 ISSN: 1303-6521 volume 4 Issue 1
Copyright The Turkish Online Journal of Educational Technology 2002 44
to Internet 12 Internet is a necessity for
contemporary life 90 95,7 3 3,2 1 1,1 94 100
14 Internet cafes are useful places for children
14 15 28 30 52 55 94 100
15 Internet effects child-family relations negatively
10 11 25 27 59 62 94 100
4. DISCUSSION Technological changes are occurring at a rapid pace, and parents’ general confusion and lack of knowledge about them may intensify their difficulties.Many of the important changes in home life related to technologies are more subtle, though no less influential and with larger public roles come broader levels of responsibility.However, computing is changing at a rapid pace, and the roles of individuals and families in regard to it have not yet stabilised (Ovarec, 2000). Internet, as the most recent computer technology, offers children many opportunities for learning, constructive environment and personal growth, however, at the same time parents should be aware of Internet issues and thus their children’s use of Internet. This study chose parents as respondents since their role for Internet use for elementary school children is undiscussable. The first finding of the research revealed that the parents’ ideas about the cost of Internet are neither pessimistic nor optimistic. While half of the parents believed Internet is a costly medium the other half does not think so. This finding can be a culturally biased result arising from the local circumstances. Concerning the annual income of an average Turkish family a home computer and an Internet connection is a luxury. Therefore distinction should be made clearly between if one can afford this “luxury”, does it mean the medium is cheap or is it still expensive for the rest? Regarding the safety issues concerning Internet, parents believed that residential use is always safer and that they should control their children’s use of Internet. Infact, many parents and household heads are also dealing with issues of control as aspects of home life change in the advent of everyday computer usage, particularly as they relate to overall family interaction patterns and the behaviour of children (Ovarec, 2000). Parents showed consideration for filter use but they were not much concerned about their children using real names on Internet. This might be due to the fact that parents hear about filters both from schools and commercial media but the dangers of using real names is a more special fact which comes only after an individual experience or an awareness training. With regard to the educational aspect of Internet, parents believe that Internet enhances the academic achievement and research skills of children. This finding is consistent with other research carried out by Vryzas and Tsitouridou (2002). The finding is also supported by the literature which suggest that parents familiar with computers have higher expectations of the educational benefits of computers (Healy and Schilmoeller, 1985; Kristiansen, 1991). This research, carried out in three provinces of Turkey, indicates that parents have an overall positive view of Internet with regard to social life. They believe that Internet is a necessary medium for contemporary life. There are other researches supporting this finding, so far as the parents are familiar with the medium (Healy and Schilmoeller, 1985; Vryzas and Tsitouridou, 2002). As with the adoption of many ‘new technologies’ these home computers are entering an already constituted social space and that many of the patterns of these social spaces are reproduced in the engagement with new technologies in the home (Sutherland, Facer, Furlong and Furlong 2000). Parents do not indicate a pessimistic view about that Internet effects the family relations negatively. However they show consideration for Internet cafes which they they think neither useful nor safe. This might be a clue that parents give credit to their own control An underlying force to carry out this research was to raise some awareness on parental side. The author does not believe that Turkey is unique in neglecting the parental side of the Internet issue and therefore tries to raise some questions on parents’ minds. A future study, where corelations are used, will be beneficial for parents. Bearing in mind that any kind of exposition is part of the learning process, further studies should be carried out in Turkey to investigate whether the proposed views are applied in practice Referring to the caption at the beginning of this paper, so long as Internet and the family are here, we have no choice but to enhance them.
The Turkish Online Journal of Educational Technology – TOJET January 2005 ISSN: 1303-6521 volume 4 Issue 1
Copyright The Turkish Online Journal of Educational Technology 2002 45
REFERENCES Davidson, GV and Ritchie SD (1994) Attitudes toward integrating computers into the classroom: what parents,
teachers and student report, Journal of Computing in Childhood Education, 5:1, 3-27. (Eric Database, No EJ482038)
Fleming, R. and Pain, B. (1995) “Technology, Schools and Families: An Exploratory Study” SSTA Research Centre Report 96-108. Avalable online: http:// www.ssta.sk.ca/research. 08.11.1995.
Gökçöl, O. (2001) “Bilgi Teknolojileri ve İnternet” (Information Technologies and Internet) Available online: http://www.eng.bahcesehir.edu.tr/2001.
http://www.lexmark.com/us/press-releases-details Healy, P. (1985) Parent Attitudes toward computer use by young children, Journal of Research in Rural
Education, 2:4, 135-140. (Eric Database, No EJ328620) Heller, P. (1988) Learning about technology: family vs. peer pairings, Journal of Research in Science Teaching,
25:1, 1-14. (Eric Database, No EJ366651) Kafain, Y.B. and Sutton, S. (1999) Elementary school students’ computer and internet use at home, Journal of
Educational Computing Research, 21:3, 45-62. (Eric Database, No EJ605354) Kersh, P.H. (1999) Tech matters: how computers impact head start children, teachers and parents, Children and
Families, 18:3, 24-26. (Eric Database, No EJ623687) Kristiansen, R. (1991) Consensus on Computers in Education: Do teachers, parents and pupils share the same
expectations and attitudes towards computers? Education and Computing, 7, 199-207. Odabaşı, F.H. (2002) Internet ve Çocuk (Internet and the Child) Kapital Yayınevi, İstanbul Odabaşı, F.H. (2003) “Internet Cafes: A New Model of Information Access in Turkey” Society for Information
Technology Teacher Education International Conference Annual. March 24-29. Albuquerque, New Mexico USA. Editors: Caroline Crawford, Niki Davis, Jerry Price, Roberta Weber Dee Anna Willis (Senior Editor), pp, 1040-1042.
Oravec, JA (2000) Internet and computer technology hazards: perspective for family counseling, British Journal of Guidance & Counseling, 28:3, 309-325.
Papert, S. (1996) The Connected Family: Bridging the Digital Generation Gap. Longstreet Press, Marietta. Papert, S. (1998) Child Power: Keys to New Learning of the Digital Century. Speech delivered at the 11th Colin
Cherry Memorial Lecture Communication, Imperial Colloge, London. Available online: http://www.ConnectedFamily.com/frame4/cf0413seymour/
Safe & Smart. (2000) Available online: http://www.computerbits.com/archive/2001 Shashaani, L. (1994) Socioeconomic status, parents’ sex-role stereotypes, and the gender gap in computing,
Journal of Educational Computing Research, 26:4, 33-51. (Eric Database, No EJ496587) Superonline.com (2003) (Informative newspaper), September,3. Sutherland, R, Facer, K, Furlong, R, and Furlong, J. (2000) A new environment in education? the computer in
the home, Computers and Education, 34, 195-212. Woodard, E. (2000) Media in the Home 2000: The Fith Annual Survey of Parents and Children. (Survey No:7)
Philadelphia, PA: The Annenberg Public Policy Center, University of Pennsylvania. Vryzas, K. and Tsitouridou, M. (2002) Children and computers: Greek parents, Educational Media
International, 39:3/4, 285-297.
The Turkish Online Journal of Educational Technology – TOJET January 2005 ISSN: 1303-6521 volume 4 Issue 1
Copyright The Turkish Online Journal of Educational Technology 2002 46
RECOMMENDATIONS TOWARDS DEVELOPING EDUCATIONAL STANDARDS TO IMPROVE SCIENCE EDUCATION IN TURKEY
Asist. Prof. Dr. Ömer Faruk Keser
[email protected] YYU, Faculty of Education, Department of Science Education, Van/TURKEY
ABSTRACT Obtaining technological and scientific knowledge process change incredibly and rapidly in today’s society as individuals continuously must construct and reconstruct their expertise in a process of lifelong learning. For this reason, scientific literacy is also of increasing importance in individuals’ workplace. So, suggested approaches to promote the quality of human life by the educators should be adopted in the process of accomplishing these goals. In this respect, the United States is known to follow certain standards in the content of National Science Education Standards (NSES) project for all activities aimed at improving science education about fifteen years. This study investigated and presented basic features of the NSES project in terms of objectives, practices, and evaluation criteria. Consequently, some suggestions were made to acquire different approaches to educational research in developing countries such as Turkey. Key words: Science Education Standards, NSES INTRODUCTION Nowadays, individuals feel an increasing need for reaching out and using scientific knowledge to keep up with changing conditions of the world and to direct their life considering faced and possible situation. The recent research point out that students are usually taught to solve well-structured problems in their classrooms despite the fact that most problems in everyday and professional practice are ill-structured (Jonassen, 2003). For this reason, students are generally unable to transfer problem solving skills that need to be applied to novel problems in different context. What a new world expect of individuals is not only a good command of relevant knowledge, but diversified social, communication and cooperation skills, ability to work in different contexts with experts from other fields, and ability to critically select, acquire, reproduce, and use knowledge. Therefore, these requirements pose considerable challenges to educational systems that are expected to produce experts for the world of the future, especially considered Turkey as a developing country. Many studies have been performed to improve scientific literacy of people who are in formal education institutions and naturally affected by the progress. These studies have specifically aimed at solving the conceptual problems encountered in understanding scientific subjects. In examination of these studies, it is seen that majority of comprehensive projects such as Constructing Physics Understanding-CPU, Science, Technology, and Society-STS and Project 2061 have been developed in the United States (CPU, 2004; Bayraktar, Karamustafaoğlu, Keser, Yeşilyurt and Köse 2002; STS, 2004; Kesideu, 2001; P2061, 2004). One of the most important reasons for the above-stated projects was students’ low level in science achievement at secondary level in the U.S. when compared to other countries. Although it was expected that the United States students would be the first in the world in science achievement by the year 2000, data from the Third/Trends International Mathematics and Science Study-TIMSS in 1995 and 1999 showed that the U.S. students were devastatingly far from this goal among participated countries (BITL, 2000; NRCR, 1998). Besides, The National Assessment of Educational Progress-NAEP reported the similar issues about science achievements of 4, 8, and 12 grade students in U.S. scale. The US has focused on an educational reform movement with several projects since 1985 to investigate the reasons for the failure and to improve the existing status of science education (Bayraktar, Karamustafaoğlu, Keser et al. 2002). Project 2061, one of the most extensive developed projects to overcome this trouble situation, was introduced to larger populations with the reform proposal titled Science for All Americans, by which main factors affecting the formation of the skills and the knowledge which will bring success and meet the students’ needs in the 21st century were determined (SFAA, 2004). The Standards apply to all students, regardless of age, gender, cultural or ethnic background, disabilities, aspirations, or interest and motivation in science. Different students will achieve understanding in different ways, and different students will achieve different degrees of depth and breadth of understanding depending on interest, ability, and context. But all students can develop the knowledge and skills described in the Standards, even if some students go well beyond these levels (NSES, 2004). This was followed by Benchmarks for Science Literacy, a study emphasizing the need for integration of science, mathematics, and technology as well as reflecting the qualities that ought to be possessed by science literate people. Moreover, the Benchmarks specify how students should progress toward science literacy,

The Turkish Online Journal of Educational Technology – TOJET January 2005 ISSN: 1303-6521 volume 4 Issue 1
Copyright The Turkish Online Journal of Educational Technology 2002 47
recommending what they should know and be able to do by the time they reach certain grade levels (BSL, 2004). The benchmarks of the study shaped NSES, were published National Research Council (NSES, 2004). OBJECTIVES AND GENERAL SITUATION OF SCIENCE EDUCATION IN TURKEY Most generally, objectives of education in Turkey have been determined with Five-Year Development Plans, the eighth of which is in practice from 2001 to 2005 (EFYDP, 2000). However, science curricula have included more concrete objectives about the needs for the future projections of Turkey in science education at the formal educational institutions. The aim of the current science curricula in Turkey is similar to that of developed countries, but the fundamental implementation of it in many cases still suffer from inadequacies in the implementation process, such as poor teacher preparation, ineffective use of teaching and assessment methods, the lack of teaching aids, crowded classrooms, and regional issues at the school and district level that relate to opportunities for students to learn and opportunities for teachers to teach science. Besides, current science curricula are not much helpful for science teachers and students at the expected level (Ayas et al. 1993; Keser et al. 2003; Keser, 2004). Some of the recent research in Turkey showed that the most affecting factors of science education in today’s classrooms were teachers, students, and parental characteristics, structure of course materials, initial teacher training-ITT, the use of learning/teaching techniques, structural properties of learning environments, and the entrance exams for schools respectively junior and senior high schools and universities (Keser, 2003; Keser and Akdeniz, 2002; Keser and Akdeniz, 2004). Despite all good intentions, Turkish students’ learning of science is often too superficial. Students’ grasp of science as a process of discovery, and of mathematics as a language of science reasoning, is often formulaic, fragile, or absent at all (Keser and Akdeniz, 2002). In fact, these are long-lasting problems in the Turkish context and other societies, particularly developing countries are also familiar with them. Therefore, it may be difficult to reach the stated curricular objectives. Actually, the evaluation of the current science curricula have not been fully carried out so far, not only at the national level, but also at the international level (Keser and Akdeniz, 2004). In this respect, it is seen that the recent studies have been periodically conducted by Ministry of National Education, Department of Education Research and Development-DERD to assess students’ science achievements at national level, named Determining Examination of Students’ Achievements-DESA, in Turkey. These exams are quite important, but they are not sufficient (DERD, 2003). It is believed that the efforts in the coming years will hopefully provide with more evidence about the implementations of science curricula. These evidences and experiences could perhaps be used to redesign or develop a new curriculum based on the public needs and sources (Keser et al. 2003). Research in this paper about the science educational standards point out that the studies for developing vocational education standards are carried out to improve vocational education with a project named ‘reinforcement of vocational education system’ (PRVES, 2004). In addition, some studies have been performed to develop general educational standards concerning physical sources (equipment, hardware, establishment, and building) and human resources (director, teacher, adviser, and inspector) in the schools of curriculum laboratory-SCL that is organized to experiment the new teaching and learning approaches and to try out developed materials (MNE, 2004). As far as present situation is concerned, it is seen that these studies are also insufficient to develop general education standards planned. Furthermore, there are not any significant projects towards developing science education standards among examined ministerial resources. THE ROLE OF NSES IN DESIGNING, IMPLEMENTING AND EVALUATING ACTIVITIES OF SCIENCE EDUCATION The Standards that also provide criteria can be used by people at the local, state, and national levels to judge whether particular actions will serve the vision of a scientifically literate society. NSES also contains science standards and assesses science teaching program studies which aimed at enhancing the quality of science education (Cajas, 2001). In other words, NSES is an assessment system, which consists of standard criteria developed by professionals to develop and improve any materials/activities for science achievement. All developed projects to improve science education in the U.S., before implementing, are assessed in terms of consistency with national standards. Therefore, programs should go through a very careful investigation process from the planning stage to implementation in order to meet the specified criteria. Only those projects that are in accordance with the national standards can be implemented and assessed through national and international assessment systems such as National Assessment of Educational Progress-NAEP and TIMSS. By using the indicators of these studies, the effectiveness of the present projects is assessed firstly by project developers. And then, all implemented science programs are assessed comprehensively by a committee. The committee also determines the national success rate of all the implemented science programs based on the results of assessments, scientific studies, institution and district feedback, and socioeconomic trends. Comprehensive reports are prepared and several stakeholder groups are targeted by commissions (BITL, 2000). For each group, several

The Turkish Online Journal of Educational Technology – TOJET January 2005 ISSN: 1303-6521 volume 4 Issue 1
Copyright The Turkish Online Journal of Educational Technology 2002 48
questions are posed to direct attention to critical issues. A checklist of important steps is then provided to define a comprehensive plan for raising K-12 science student achievement in states, districts, and schools. And then, several wide-ranging intertwined goals in the report are determined at local, state, and federal levels. As an aid to implementation, all of the goals are accompanied by a coordinated set of well-funded project ($5 billion), and action strategies that identify key stakeholders who should take the lead in implementing each strategy are put into practice. Finally, miscellaneous recommendations are made to parents, teachers, administrators, school board members, higher education institutions, state political leaders, business leaders, and the other related institutes (BTIL, 2000). It is seen that the reasons for preparing science education standards and these reports are very important in terms of the planning, implementing, and evaluating approaches employed, and that recommendations for developing countries as much as the U.S. The aim of this paper is to investigate and present basic features of the NSES project in terms of objectives, practices and evaluation criteria and to develop some suggestions to acquire different views for potential educational research that would be undertaken in developing countries such as Turkey. WHY THE PROJECT FOR DEVELOPING SCIENCE EDUCATION STANDARDS NEEDED IN U.S. In these days, people who possess exceptional skills in self-learning, overcoming problems, and making critical decisions require many skills, especially in science related fields. To possess all these skills could be realized through understanding the nature of science in the process of science education (Bayraktar, Karamustafaoğlu, Keser et al., 2002). Other developed countries invest on scientifically and technically literate work forces. To keep pace in global markets, to offer a visible supply for demands of US’ changing economy and workplace, to meet the US’ democracy needs for an educated citizenry, to make sufficient precautions needed for national security interests, and to understand the deeper value of scientific knowledge, the United States needs having an equally capable of population in science (BTIL, 2000; Bayraktar, Karamustafaoğlu, Keser et al., 2002)). The program brought hundreds of people together for the science education, which will constitute future’s vision. Among them, there were teachers, school administrators, parents, curriculum developers, scientists, faculty members, engineers, and government officials. These people are engaged in many studies and research on teaching and learning (Bayraktar, Karamustafaoğlu, Keser et al. 2002). In meeting comprehensively the needs of students, educators, and society, standards were assessed locally and nationally. In 1989, the project is started with the support of the government. The first standards were put forward for mathematicians and mathematics educators in 1989 (NSES, 2004). STRUCTURE OF THE NSES PROJECT National Science Academy was established in the U.S. in order to improve scientific literacy for all students. To achieve its goals, the academy planned NSES project in the second half of the 1980’s. The most general objectives of NSES project for science schools are to acquire students: the experience of understanding the natural world and having knowledge and enthusiast about it, the ability to use appropriate scientific principles and functions in decision-making process, the ability to make sound discussions and research on the importance of scientific and technological materials and, increase of scientific literacy, knowledge, and economical productivity in their careers (Bayraktar, Karamustafaoğlu, Keser et al. 2002). In this respect, the standards, which constituted the NSES program, are organized in seven categories as follows (NSES, 2004): a) Standards for science teaching. b) Standards for professional development for teachers of science. c) Standards for assessment in science education. d) Standards for science content. e) Standards for science education programs. f) Standards for science education systems. These categories will be presented respectively considering basic features in the following sections. a) Standards for Science Teaching The science teaching standards describe what teachers of science at all grade levels should know and be able to do. Teaching standards are divided into six areas: (1) The planning of inquiry-based science programs. (2) The actions taken to guide and facilitate student learning. (3) The assessments made of teaching and student learning.
The Turkish Online Journal of Educational Technology – TOJET January 2005 ISSN: 1303-6521 volume 4 Issue 1
Copyright The Turkish Online Journal of Educational Technology 2002 49
(4) The development of environments that enable student to learn science. (5) The creation of communities of science learners. (6) The planning and development of the school science program. Science teaching standards are presented first since effective teaching is the most crucial element of science education. Effective science teachers possess theoretical and practical knowledge in science learning and teaching. They promote active learning with their students by creating appropriate environments. If teachers to achieve the objectives embodied in standards, they should be provided with necessary resources, such as time and materials. Another critical issue emphasized by science teaching standards is equality. All students are capable of full participation and of making meaningful contributions in science classes. b) Standards for Professional Development for Teachers of Science The professional development standards present a vision for the development of professional knowledge and skill among teachers. They focus on four areas: (1) The learning of science content through inquiry. (2) The integration of knowledge about science with knowledge about learning, pedagogy, and students. (3) The development of the understanding and ability for lifelong learning. (4) The coherence and integration of professional development programs. This standard stresses the need for teachers to engage in professional development experiences through their careers. Teachers must be in contact with master educators and reflect on their teaching practice continually. They should also guide all students with diverse experiences, interest, and abilities in making sense of scientific ideas. A major change in development practices is essential as well as change in teaching practices for reforming science education. Teachers should be provided with opportunities to develop theoretical and practical understanding and ability. c) Standards for Assessment in Science Education The assessment standards provide criteria against which to judge the quality of assessment practices. They cover five areas: (1) The consistency of assessments with the decisions they are designed to inform. (2) The assessment of both achievement and opportunity to learn science. (3) The match between the technical quality of the data collected and the consequences of the actions taken on the basis of those data. (4) The fairness of assessment practices. (5) The soundness of inferences made from assessments about student achievement and opportunity to learn. Assessments provide students, teachers, school districts, and policy makers with feedback on effectiveness of implemented programs. This feedback in turn stimulates changes in policy, guides the professional development of teachers, and encourages students to improve their understanding of science. There have also been changes in ideas about assessments in recent years. According to new approach, assessment and learning are two sides of the same coin. Besides, new assessments have focused on higher-order skills rather than simply checking the memorization of facts. d) Standards for Science Content The science content standards outline what students should know, understand, and be able to do in the natural sciences over the course of K-12 education. They divided into eight categories: (1) Unifying concepts and processes in science (2) Science as inquiry (3) Physical science (4) Life science (5) Earth and space science (6) Science and technology (7) Science in personal and social perspective (8) History and nature of science Each content standard expresses what content to be understood and which abilities need to be gained through activities provided for all students in those grade levels. Each standard is followed by a discussion of how students can learn that material. Similarly, the discussion of each standard concludes with a guide to the fundamental ideas that underlie that standard, but these ideas are designed to be illustrative of the standard, not part of the standard itself. Because each content standard includes the knowledge and skills of other standards, those standards designed to be used as a whole. e) Standards for Science Education Programs The science education program standards describe the conditions necessary for quality school science programs. They focus on six areas: (1) The consistency of the science program with the other standards and across grade levels. (2) The inclusion of all content standards in a variety of curricula that are developmentally appropriate, interesting, relevant to the student’s lives, organized around inquiry, and connected with other school subjects. (3) The coordination of the science program with mathematics education. (4) The provision of appropriate and sufficient resources to all students. (5) The provision of equitable opportunities for all students to the standards. (6) The development of communities that encourage, support, and sustain teachers.

The Turkish Online Journal of Educational Technology – TOJET January 2005 ISSN: 1303-6521 volume 4 Issue 1
Copyright The Turkish Online Journal of Educational Technology 2002 50
Program standards deal with issues at the school and district level that relate to opportunities for students to learn and opportunities for teachers to teach science. The first three standards address individuals and groups responsible for the design, development, selection, and adaptation of science programs including teachers, curriculum directors, administrators, publishers, and school committees. The last three standards describe the necessary conditions if science programs are to provide proper opportunities for all students to learn science. f) Standards for Science Education Systems The science education system standards consist of criteria for judging the performance of the overall science education system. They consider seven areas: (1) The congruency of policies that influence science education with the teaching, professional development, assessment, content, and program standards. (2) The coordination of science education policies within and across agencies, institutions, and organizations. (3) The continuity of science education policies over time. (4) The provision of resources to support science education policies. (5) The equity embodied in science education policies. (6) The possible unanticipated effects of policies on science education. (7) The responsibility of individuals to achieve the new vision of science education portrayed in the standards. Although the school is the central institution for public education, all parts of the extended system such as school districts, state school system, and the national education system have responsibility for improving science literacy. For example, functions generally decided at the state level include the content of the school science curriculum, the characteristics of the science program, the nature of science teaching, and assessment practices. These policies need to be consistent with the vision of science education described in the standards realizing the vision wholly. TOGETHERNESS OF SCIENCE EDUCATION AND EDUCATIONAL TECHNOLOGY IN THE EDUCATIONAL STANDARDS CONTEXT Science and technology are inseparable counterparts of individuals’ life. So, the studies to improve educational technology and to enable the students to develop technological literacy are as important as the studies for science education (Roth, 2001). As stated in the eighth five-year plan adequate developments have not been obtained the pervasive use of new technologies in educational area yet (EFYDP, 2000). Therefore, one of the most fundamental objectives of Turkish educational system according to grade level is to benefit from the technological opportunities such as computer technologies, distance learning, new teaching approaches utilizing advanced technology, computer based guidance in the near future. In U.S., as a developed country, implemented studies about developing standards to improve educational technology have just started, by the years of late 1990s, but has not been completed yet (NETS, 2004). This project has been carried out by International Society for Technology in Education-ISTE that is a nonprofit professional organization with a worldwide membership of leaders and potential leaders in educational technology. The main objectives of this project are to obtain a powerful tool with enormous potential for paving high-speed highways from outdated educational systems to systems capable of providing learning opportunities for all, to serve better the needs of 21st century work, communications, learning, and life. Another primary goal of the NETS project is to enable stakeholders in Pre K-12 education to develop national standards for educational use of technology that facilitate school improvement in the United States. The NETS Project is developing standards to guide educational leaders in recognizing and addressing the essential conditions for effective use of technology to support Pre K-12 education. Completed parts of these standards are Technology Foundation Standards for Students, describing what students should know about technology and be able to do with technology, and Connecting Curriculum and Technology, providing curriculum examples of effective use of technology in teaching and learning. The other parts of these standards are Educational Technology Support Standards, describing standards for professional development, systems, access, and support services which are essential support to effective use of technology, and Standards for Student Assessment and Evaluation of Technology Use, describing various means of assessing student progress and evaluating the use of technology in learning and teaching, which will be developed and refined more on forthcoming days (NETS, 2004). Moreover, Standards for Technological Literacy-STL was developed by International Technology Education Association-ITEA (STL, 2004; Cajas, 2001). The content standards in STL articulate what needs to be taught in K–12 laboratory-classrooms to enable all students to develop technological literacy. Technological literacy is the ability to use, manage, understand, and assess technology (Cajas and Gallagher, 2001). The standards were built around a cognitive base as well as doing/activity base, and they include assessment checkpoints at specific grade levels (K–2, 3–5, 6–8, and 9–12).
The Turkish Online Journal of Educational Technology – TOJET January 2005 ISSN: 1303-6521 volume 4 Issue 1
Copyright The Turkish Online Journal of Educational Technology 2002 51
Regarding the effects of using technology in educational practices in today’s world, it is clearly seen that developments in the field of educational technology have a very significant place during the obtaining process of expected improvements in teaching and learning science. RECOMMENDATIONS Considering the expectations of contemporary world from individuals and rising problems in current science education process, adopted approaches to solve their problems by developed countries are very important especially for a developing country such as Turkey. These approaches comprise (1) developing science education standards, and (2) developing materials according to these standards or criteria, (3) assessing students’ science achievements at national and international level and evaluating the science curricula in implementing process, and (4) carrying out reports about students’ science achievements and factors affecting this process by comprehensive committee with the stakeholders. Although the general objectives of science curriculum development studies performed in the U.S. have similar characteristics, they differ in terms of requirements of meeting the science standards from those in Turkey. However, in Turkey, general and specific objectives of science curricula have been accepted as standards from some official surroundings. Actually, the prepared curricula according to these standards proved that they possessed highly applicable and serviceable properties, since they were assessed locally, and nationally, and met the needs of students, educators, and society’s comprehensively. National standards are also an assessment system consisting standard criteria developed by professionals to develop and to improve any materials/activities for science achievement. Inasmuch as all developed projects to improve science education in the U.S. are assessed in terms of consistency with national standards before implementing, developed projects and programs should go through a very careful study process from the planning stage to implementation in order to meet the specified criteria. As a result, only projects that are in accordance with the national standards can be implemented and assessed through national and international assessment systems. Therefore, it could not be pretended not to see the importance and the role of standards in developing the process of science teaching/learning materials for policy makers, and project/curriculum developers. Determining national and international assessments about students’ science achievements are also extremely significant in the process of improving science teaching/learning because they have been seen as a springboard for all improvement activities. For instance, Turkey only participated in International TIMSS-R 1999, repeating TIMSS 1995, at certain educational levels and ranked 33rd among 38 countries (TIMSS, 1999, DERD, 2003). Hence, Turkey should participate constantly in this type of international assessments to determine the changes of students’ science achievements. At least, next one will be held in 2006 (TIMSS, 2004). So, it is suggested that Turkey should make necessary arrangements to participate in 2006 international assessments at related educational level. On the other hand, the evaluation of the current science curricula have not been fully carried out so far, both at the national and international levels. So, it is seen that the recent studies have been periodically conducted to assess students’ science achievements at national level, named in Turkish ÖBBS, by Ministry of National Education, Department of Education Research and Development-DERD are quite important (DERD, 2003). Indicators of these studies comprise of not only information about students’ science achievements but it also about the effectiveness of the present science curricula. There will be some major contributions to educators and researchers to make inferences about the factors such as teachers, student, and parental characteristics, structure of materials, ITT, the use of learning/teaching techniques, structural properties of learning environments, and the entrance exams for schools the entrance exams for schools respectively secondary, high schools, universities, etc. which are influencing the quality of science education in Turkey. It has to be considered that the developed recommendations in this study to improve the quality of science education and to solve our present problems towards science teaching/learning process in Turkey are so important for decision/policy makers, researchers, higher education institutions, and the other related institutes. As a consequence, they can be stated briefly as follows; • to determine meeting level of objectives stated in eighth five-years development plan, • to assign meeting degree of goals indicated in science curricula, • to improve the science teacher education according to contemporary approaches in pre-service and in-service, • to use the newest instructional and assessment methods effectively, • to develop technology-supported supplementary materials for teachers and students during their science teaching/learning activities,

The Turkish Online Journal of Educational Technology – TOJET January 2005 ISSN: 1303-6521 volume 4 Issue 1
Copyright The Turkish Online Journal of Educational Technology 2002 52
• to benefit from the opportunities such as computer technologies, distance learning, new teaching approaches utilizing advanced technology, computer based guidance, provided by technology at maximum level, • to redesign the science learning environments to perform more effective science education activities in the schools, • to obtain more extensive information about the degree of our students’ national and international science achievements, • and to determine the degree of effectiveness of the current science curricula, research have to be planned extensively, and then the reports have to be performed by committee who will be organised by the participants affected from this process directly. According to Bayraktar, Karamustafaoğlu, Keser et al. (2002) about the indicators of the comprehensive reports, some arrangements stated as follows have to be executed to improve science education in Turkey. • Study groups of teachers, school administrators, parents, and the other stakeholders should be organised. • These study groups should collaborate to develop the science education standards to improve science achievement in light of the findings. • The science education standards should be constructed from subcategories such as instruction, professional development, assessment, content, educational system, and curriculum structure. • The science curriculum implemented in the schools should be developed by those who are experts in this field to check having the consistency of the science curriculum with the determined standards and reorganize with pilot studies. • The best techniques and methods to teach subjects to students well should be determined and transferred to teachers and student teachers during ITT and in-service courses by supporting good technological infrastructure. In summary, suggestions posed regarding the future of science education, which will possibly make important dimensions of progresses are vital for Turkey as a developing country as much as developed countries. In this respect, it is thought that carrying out national assessments periodically and participating in international assessment studies are essential. The general objectives of present science education curricula as well as proposed science standards should be reorganized in line with the findings of these assessments. Restructuring the developed science standards based on the data obtained through participation of international assessments should be among the long-term goals. REFERENCES Ayas, A., Çepni, S., and Akdeniz, A. R. (1993) Development of the Turkish secondary science curriculum,
Science Education 77(4) 433-440. Bayraktar, Ş., Karamustafaoğlu, O., Keser, Ö. F., Yeşilyurt M., Köse, S., (2002) The development of scientific
educational standarts in science education: Recommendations for developing countries, Paper presented at meeting of the Changing Times and Changing Needs, First International Education Conference, Eastern Mediterranean University, Famagusta, North Cyprus.
BSL (2004)Benchmarks for science literacy, Retrieved Feb. 10, 2004, from http://www.project2061.org/tools/benchol/bchin.htm
BITL (2000) Before It’s Too Late, A report to the nation from the National Commission on Mathematics and Science Teaching for the 21st Century, U.S. Department of Education, Education Publications Center, Washington, DC.
Cajas, F. (2001) The science/technology interaction: Implications for science literacy, Journal of Research in Science Teaching, 38 (7), 715-729.
Cajas, F. and Gallagher, J. J. (2001) The independence of scientific and technological literacy, Journal of Research in Science Teaching, 38 (7), 713-714.
CPU (2004) Constructing Physics Understanding Project, Retrieved Feb. 12, 2004, from http://cpuproject.sdsu.edu/CPU/main.html DERD (2003) TIMSS 1999 Turkey Report, Ministry of National Education, Department of Education Research
and Development, Ankara. DESA (2002) Determining Examination of Students’ Achievements, Republic of Turkey, Ministry of National
Education, Department of Education Research and Development, Retrieved April 15, 2004, from http://earged.meb.gov.tr/odbs/icindekiler.htm
EFYDP (2000) Eighth Five-Year Development Plan (2001-2005), Republic of Turkey, Prime Ministry, State Planing Organization of Turkey, Retrieved Feb 5, 2004, from http://plan8.dpt.gov.tr/
Jonassen, D. (2003) Using cognitive tools to represent problems, Journal of Research on Technology in Education, Spring, 35(3), 362-381.
Keser, Ö. F., Akdeniz, A. R. (2002, September 16-18) Examining factors affecting the traditional learning environments, Paper presented at the 5th Science Education Congress, Faculty of Education, Middle East

The Turkish Online Journal of Educational Technology – TOJET January 2005 ISSN: 1303-6521 volume 4 Issue 1
Copyright The Turkish Online Journal of Educational Technology 2002 53
Technical University, Ankara, Proceeding retrieved Feb. 15, 2003, from http://www.fedu.metu.edu.tr/ufbmek-5/b_kitabi/PDF/Fizik/Bildiri/t123DD.pdf
Keser, Ö. F. (2003) Designing and implementing a constructivist learning environments for physics education, Unpublished PhD Thesis, Karadeniz Technical University, Trabzon.
Keser, Ö. F., Özmen, H., Akdeniz, F. (2003) Energy, environment and education relationship in developing countries’ policies: A case study for Turkey, Energy Sources, 25 (2) 123-133, Feb.
Keser, Ö. F., Akdeniz, A.R. (2004, April 17) New trends in education and improving physics education in Turkey, Paper presented at the Symposium of New Trends in Education, Symposium Proceedings [CD], İzmir Özel Tevfik Fikret Okulları, İzmir.
Kesideu, S. ( 2001) Aligning curriculum materials with national science standards: The role of project 2061’s curriculum-materials analysis procedure in professional development, Journal of Science Teacher Education, 12, 47-65.
MNE (2004) Republic of Turkey, Ministry of National Education, Retrieved, Feb. 20, 2004, from http://www.meb.gov.tr
NETS (2004) National Educational Technology Standards, Retrieved, March 17, 2004, from http://cnets.iste.org/ NSES (2004) National Science Education Standards, Retrieved, Jan. 20, 2004, from
http://www.nap.edu/readingroom/books/nses/html/ NRCR (1998) National Research Center Report, TIMSS High School Results Released, No:8, p. 1-2, TIMSS
U.S. PRVES (2004) Project of Reinforcement of Vocational Education System, Retrieved, June 5, 2004, from
http://www.megep.meb.gov.tr/etkinlik/egitim.html P2061 (2004) Project 2061, Retrieved, Feb. 10, 2004, from http://www.project2061.org/about/default.htm Roth, W. M. (2001) Learning science through technological design, Journal of Research in Science Teaching, 38
(7), 768-790. SFAA (2004) Science for All Americans, Retrieved Feb. 5, 2004, from
http://www.project2061.org/tools/sfaaol/sfaatoc.htm STL (2004) Standards for Technology Literacy, Retrieved, March 10, 2004, from
http://www.iteawww.org/TAA/Publications/STL/STLMainPage.htm STS (2004) Science, Technology, and Society Program, Retrieved March 10, 2004, from
http://trochim.human.cornell.edu/gallery/chakane/stsprog.htm TIMSS (1999) Third/Trends International Mathematics and Science Study, Retrieved Feb. 20, 2003, from
http://isc.bc.edu/timss1999.html TIMSS, (2004) Schedule of Third/Trends International Mathematics and Science Study, Retrieved Feb. 20, 2004
http://isc.bc.edu/timss2003i/schdule.html
The Turkish Online Journal of Educational Technology – TOJET January 2005 ISSN: 1303-6521 volume 4 Issue 1
Copyright The Turkish Online Journal of Educational Technology 2002 54
TEACHER-STUDENT INTERACTIONS IN DISTANCE LEARNING
Serdal TERZİ, Abdurrahman ÇELİK
[email protected] Suleyman Demirel University, Computer Sciences Research and Application Center, 32260 Isparta, TURKEY
ABSTRACT Rapidly developing distance learning models which are connected to development of Internet Technology, has brought a lot of easiness for both students and teachers. There are three considerable topics must be taken into consideration for a distance learning study: teacher roles, education goals and student learning. In this study, especially for university students, the importance of teacher-student interaction on knowledge and aptitude improvement by distance learning in isolated environments has researched. As a consequence, not only the solution of this problem for a distance learning practice, but also the problems that will be faced in the future distance learning trainings has been suggested. Key Words: Distance Education, Distance Learning, Internet Aided Learning
UZAKTAN EĞİTİMDE ÖĞRENCİ-ÖĞRETMEN ETKİLEŞİMİ
ÖZET İnternet teknolojisinin gelişimine bağlı olarak son yıllarda oldukça hızlı bir biçimde gelişen uzaktan eğitim modelleri hem öğrenciler hem de öğretmenler için bir çok kolaylığı beraberinde getirmiştir. Bir uzaktan eğitim çalışması için düşünülmesi gereken üç önemli konu vardır: öğretmenin rolü, eğitimin amacı, ve öğrencinin öğrenmesi. Bu çalışmada, özellikle üniversite düzeyindeki öğrencilerin coğrafi olarak tecrit edilmiş bir ortamda uzaktan eğitim ile bilgi ve yeteneklerinin gelişiminde öğrenci-öğretmen etkileşiminin önemi araştırılmıştır. Sonuçta, bir uzaktan eğitim çalışması için bu sorunun sadece çözümü değil aynı zamanda ileride gerçekleştirilecek uzaktan eğitim projelerinde karşılaşabilecek problemler de sunulmuştur. Anahtar Kelimeler: Uzaktan Eğitim, Uzaktan Öğrenim, İnternet Destekli Eğitim 1. INTRODUCTION Internet and World Wide Web (www or WEB) have been having a profound effect on higher education. Undoubtedly, this evolutionary trend will continue to exert a revolutionary influence for years to come. WEB teaching, and its ensuing modifications to teaching methods that currently are common, is evolving at a time of increased pressures on institutions of higher educations to adapt to decrease public funding and simultaneous demands for solutions to global problems having potential for catastrophic ramifications. Internet offers on improved communications capability which may play a significant role in both of these areas (Mann, 1998). 2. DISTANCE LEARNING Distance learning is a new trend of education. One of the reasons that accelerate this trend is Internet. The revolution of Internet technology has changed our daily life. From reading news, sending e-mails, to education as well as entertainment, Internet with multimedia technologies provides a new paradise for information exchange. Among these impacts, distance learning seems to be very important and interesting. One of the attractions of distance learning is its flexibility of instruction. Since students and instructors can be separated spatially and temporally from each other, students are in a remote area (Chang, 2002). Distance learning is generally used in industry, in schools and in the academy in order to reduce cost, reach as large an audience of geographically distanced students as possible, allow students who are unable (physically) to come to the learning institution a change learn, and allow each students to progress at his/her own appropriate individual rate (Frank et all, 2003). 2.1. Advantage of Distance Learning WEB instruction advantage is that student’s trend to communicate more frequently with teachers and classmates than they otherwise would person-to-person or with ever present e-mail systems alone. Several apparent advantages for this include (1) it can be done at any time of day or night, when a questions arises during study or they are having a problem with an assignment, (2) less embarrassment resides in asking the questions in class, and (3) contact is made without fear of bothering the professor because communication will be seen only when they are ready to be “bothered”. An additional advantage for both student and instructor is that WEB courses are teaching students the educational value of the Internet. This is important because Internet presumably will be a
The Turkish Online Journal of Educational Technology – TOJET January 2005 ISSN: 1303-6521 volume 4 Issue 1
Copyright The Turkish Online Journal of Educational Technology 2002 55
major asset during their lifelong learning, or continuing education, after leaving the university. Not only will www be an easy, effective, and rapid method of continuing education, which traditionally has been filled by short courses, extension courses, colloquia, and extended conferences, but it also may be more current and timely (Mann, 1998). 2.2. Disadvantage of Distance Learning A current disadvantage is that not all data, which are available on the WEB, are suitable for some beginning courses. Students may not have acquired sufficient knowledge of a particular field necessary to use available data sets, although these data sets are suitable for many advanced undergraduate courses. Too often, data require professional judgments be made or assume a specialist’s knowledge. Desirable attributes when specialists use data, may become a handicap, however, when beginners are exposed to them. Perhaps, data sets that are more appropriate will appear to fill these gaps as more educators recognize needs in their particular area of specialty (Mann, 1998). One disadvantage that may be encountered when using WEB sources, in any manner for education, is that addresses may change frequently. Presumably, well-established institutions will be less likely to be included in this complaint; nonetheless, currently some fall into this category. Often computers will be upgraded, new local networks established, or administrations altered without new addresses being posted at old sites benefit of visitors (Mann, 1998). 3. TEACHERS ROLE OF DISTANCE LEARNING Some teachers who fear distance-learning courses, however, assert that distance-learning technologies change the role of the professor into a deliverer of corporate values and goals, instead of deliverer of traditional, liberal humanist goals. With the imagined and real collaboration between corporations and academia through distance-learning initiatives, faculty members fear that they will be forced to reshape themselves into the image of corporate trainers. Those who share this fear link distance learning to for-profit, online universities whose goals are controlled by big business and not by a progressive view of education (Peterson, 2001). The role of the teacher in the technology age is not a new issue in the field of rhetoric and composition. In fact, for over a decade now, computers and composition specialist have been claiming that one of the benefits of using computers in the writing classroom is that the teacher is de-centered, thus inviting students to become co-constructors of knowledge in the classroom (Peterson, 2001). 4. STUDENT LEARNING OF DISTANCE LEARNING How is student learning changed, bettered, or damaged by distance learning courses? This issue encompasses the other two key areas discussed here because both teachers’ perceptions of their roles and schools’ assertions about academic goals influence the experience that students have in courses. At the heart of a teacher’s role is a desire to affect certain kinds of learning outcomes for students. This key issue is, like the others, often presented as two-sided debate. On one side are those who argue that because distance provides access to some students who could not go to the “actual” college or university, it benefits students and promotes lifelong learning. These scholars also suggest that the experience of an online course can be as rich and fulfilling as the experience of traditional course. On the other side are those who identify the difficulties that students have with online courses (Peterson, 2001). 5. TEACHER-STUDENT INTERACTIONS IN DISTANCE LEARNING In a distance environment the student’s ability and disposition to self-monitor and accurately evaluate content comprehension and request help accordingly may represent a crucial variable, which affects both learning and teaching processes. In a distance learning environment, instructors lack direct access to verbal and nonverbal feedback from their students. This feedback enables the teacher in a conventional learning environment to use verbal and nonverbal signals to adjust the instructional process in real-time, in order to meet their student’s needs. For example, effective instructors will often re-organize and repeat content in response to student’s confused expressions and off-task behavior. However, distance learning instructors, as opposed to instructors in a conventional learning environment, are unable to simultaneously monitor, decode, and use student feedback to modify instruction “online.” In a synchronous distance learning environment the instructor frequently stops teaching in order to ask students whether they understood the presented content (Offir et al, 2003). The use of communication techniques by students is very important in distance learning. Many of the students have already created, on their own initiative, and use forum, discussion lists and bulletin boards. Of course, the most important means of communication between students and teachers is the e-mail. The majority of students can read e-mails even if they do not have computer at home. It is, however, noticeable that certain students who

The Turkish Online Journal of Educational Technology – TOJET January 2005 ISSN: 1303-6521 volume 4 Issue 1
Copyright The Turkish Online Journal of Educational Technology 2002 56
use both computer and e-mail at home prefer to send their written assignments using regular mail. This is partly due to the fact that submission by post office is considered as more ‘official ’than by e-mail.Fig.1 illustrates the student distribution with regard to the use of e-mail for communicating with the tutor and sending the written assignments and confirms the widespread use of e-mail (Xenos et al, 2002).
Figure 1. Use of e-mail for submission of written assignments.
The quality of interaction in distance learning education has been steadily increasing with the advancements of communication technologies from printing press to radio, television, satellite, and Internet (Motiwalla and Tello, 2000). 6. CONCLUSIONS The importance of teacher-student interaction on knowledge and aptitude improvement by distance learning in isolated environments was researched. The quality of interaction in distance learning education has been steadily increasing with the advancements of communication technologies from printing press to radio, television, satellite, and especially Internet. Teacher interactions data related student data enable to identify specific types of interactions. This data correlated with positive student outcomes. Collation of student related data with teacher-related data represents integrative approach that helps clarifying the complex interrelationships between person, process, and product variables in a distance learning environment. Online collection of data thus helps to solve student’s cognitive and affective difficulties, and formulate operational guidelines for preventing these difficulties in future distance learning projects. 7. REFERENCES Chang, F. C., 2002. “Intelligent Assessment of Distance Learning”, Information Sciences, Vol 140, pp 105-125,
Elsevier Science Ltd. Great Britain Frank, M., Reich, N., Humphreys, K., 2003.“Respecting the Human Needs of Students in the Development of E-
learning”, Computers & Education. Vol. 40, pp 57-70, Elsevier Science Ltd. Great Britain Mann, C. J., 1998, “Teaching on the WEB”, Computers & Geosciences. Vol. 24, No 7, pp 693-697, Elsevier
Science Ltd. Great Britain Motiwalla, L., Tello, S., 2000. “Distance Learning on the Internet: An Exploratory Study”, The Internet and
Higher Education, Vol 2(4), pp 253-264, Elsevier Science Ltd. Great Britain Offir, B., Barth, I., Lev, Y., Shteinbok, A., 2003, “”Teacher-Student Interactions and Learning Outcomes in a
Distance Learning Environment”, The Internet and Higher Education, Vol 6, pp 65-75, Elsevier Science Ltd. Great Britain
Peterson, P. W., 2001, “The Debate About online Learning: Key Issues for Writing Teachers”, Computers and Composition. Vol. 40, pp 57-70, Elsevier Science Ltd. Great Britain
Xenos, M., Pierrakeas, C., Pintelas, P., 2002. “A Survey on Student Dropout Rates and Dropout Causes Concerning the Students in the Course of Informatics of The Hellenic Open University”, Computers & Education. Vol. 39, pp 361-377, Elsevier Science Ltd. Great Britain

The Turkish Online Journal of Educational Technology – TOJET January 2005 ISSN: 1303-6521 volume 4 Issue 1
Copyright The Turkish Online Journal of Educational Technology 2002 57
THE RELATIONS BETWEEN GLOBAL ENVIRONMENTAL AWARENESS AND TECHNOLOGY
Nilgün Seçken
[email protected] Hacettepe University, Faculty of Education, Department of Science and Mathematics for Secondary Education
ABSTRACT The changes in the society related to the developments in science and technology underline the importance of the need for education. Technological developments broaden and accelerate communication, too. The opinion that rapid and unpreventable developments in technology today lead to many environmental problems and contribute to increases in environmental problems is quite widespread. Within the framework of the study, a three-factored, 15 item Likert type “Global Environmental Awareness Scale” that can measure the attitudes of all individuals and mainly students about global environmental awareness was developed firstly. The aim in preparing such a scale is to measure what the individuals especially in educational ages think about global environment, being able to make suggestions for educational programs in line with the findings obtained, and contribute to programs that will free these solutions from being national and make them global. Following the application of the Global Environmental Awareness Scale and the Attitudes towards Technology Scale (Morgil, 2004) on the students as pretest, a 30-hour computer and internet practice was carried out with the students. The relation between the attitudes towards technology and global environmental awareness and whether computer aided education has an influence on global environmental awareness attitudes and technology-related attitudes was found using the pre- and after implementation data. Regression analysis and paired-sample t-test were carried out in the study in order to find out to what level technology awareness contributes to the creation of global environment awareness and the effects of the computer aided education to attitudes towards global environment awareness and the use of technology. It has been found that the researches of the students on the internet led to a statistically significant increase in their scores in attitudes towards technology, and again, as a consequence of the researches that the students carried out on the internet medium about global environment and the homework and activities they prepared, that there was a statistically significant increase in their scores on attitudes towards global environment. Keywords: Globalization, Global Environment, Technology, Attitude, Computer Aided Education
ÖZET Bilim ve teknolojideki gelişmelere bağlı olarak toplumsal hayatta meydana gelen değişmeler, eğitime duyulan ihtiyacın önemini daha da artırmaktadır. Teknolojik gelişmeler iletişimi de yaygınlaştırmakta ve hızlandırmaktadır. Bugün teknolojideki hızlı ve önlenemez gelişmeler pek çok çevre problemini beraberinde getirdiği gibi çevre problemlerinin artmasına da neden olmaktadır görüşü oldukça yaygındır. Çalışma kapsamında öncelikle öğrenciler başta olmak üzere tüm bireylerin global çevre bilinci konusunda tutumlarını ölçebilecek üç faktörlü 15 maddeden oluşan likert tipi “Global Çevre Bilinci Ölçeği” geliştirilmiştir. Böyle bir ölçeğin hazırlanmasındaki amaç özellikle eğitim öğretim çağındaki bireylerin global çevre konusunda ne düşündüklerini ölçmek, elde edilen veriler doğrultusunda eğitim öğretim programlarına öneriler getirebilmek ve bu çözümleri ulusallıktan kurtarıp global hale getirecek çözümlere yardımcı olmaktır. Global Çevre Bilinci Ölçeği ve Teknoloji Tutum Ölçeği (Morgil, 2004) öğrencilere ön test olarak uygulandıktan sonra öğrencilerle bu konuları kapsayan 30 saatlik bilgisayar ve internet uygulaması yapılmıştır. Uygulama öncesi ve sonrası verilerden yararlanarak, teknolojiye yönelik tutumlarla global çevre bilinci arasındaki ilişki belirlenmiş ve bilgisayar destekli eğitimin global çevre bilinci tutumlarına ve teknoloji tutumlarına etkisi olup olmadığı saptanmıştır. Çalışmada global çevre bilincinin oluşturulmasına teknoloji bilincinin ne derece etkisi olduğunu ve bilgisayar destekli eğitimin global çevre bilincine ve teknoloji kullanımına yönelik tutumlara etkisini belirlemek amacıyla regresyon analizi ve paired-sample t-testi yapılmıştır. Öğrencilerin internet ortamında yaptıkları çalışmalar neticesinde teknolojiye yönelik tutum puanlarında istatistiksel olarak anlamlı bir artış olduğu, ayrıca yine öğrencilerin internet ortamında global çevre konusunda yaptıkları araştırmalar ve internet kullanarak hazırladıkları ödevler ve çalışmalar neticesinde global çevreye yönelik tutum puanlarında istatistiksel olarak anlamlı bir artış olduğu belirlenmiştir. Anahtar Kelimeler: Globalleşme, Global Çevre, Teknoloji, Tutum, Bilgisayar Destekli Eğitim

The Turkish Online Journal of Educational Technology – TOJET January 2005 ISSN: 1303-6521 volume 4 Issue 1
Copyright The Turkish Online Journal of Educational Technology 2002 58
INTRODUCTION A common understanding in the scientific world is the rapid change and development we live today. The unprecedented technological developments, computers, the internet, television, the developments in outreach and communications in short, have reduced the dimensions of the world geography and made the individuals in the society informed about everywhere (Cornoy; Courtivron, 2000). Concepts like globalization, new world order, postmodernism, localization, and neo-liberalism are being used to mean each other recently (Mortimore, 2001). The word “globe”, the root of globalization, means a three-dimensional physical shape as well as the earth, the world we live on. When the histories of all the countries are examined, being able to rule the world and the resources can be seen as the – nearly – only aim. Therefore, the history of globalization can be dated back to the emerging of religions and empires. The objective in global education is to free those people from different nations with different cultures from these differences (Van der Wende, 2003). It is to dispose of different stereotypes by giving a universal history awareness and universal culture, thus achieve the aim of creating a “uniform human type”. The biggest hindrance in front of globalization is the nationalistic awareness of people from different cultures. It is inevitable that people educated in different educational institutions have different opinions of life and philosophies of living. The ultimate influence of globalization on education is inevitable (Kell, 1999). Hence, the concept of globalization is a course in graduate and doctorate programs in developed countries. On the other hand, there are serious conflicts of opinions as to how globalization will affect educational systems. The assumption that the differences in educational systems will reduce parallel to the globalization process seems as a natural result of globalization (Lyons, 2000; David, 1999). Educational projects implemented by organizations such as the World Bank and UNICEF can be considered as activities targeted to uniform educational systems. The duty bestowed on institutions of higher education today is the function of bringing up able staff with suitable professions for the labor market. With globalization in place, students that want to study at universities should find a way in the society of knowledge and technology. The educational problems we encounter are mainly based on the failure to fully understand the reflections of globalization and transforming into the society of knowledge as well as the rapid changes in information technologies on education and environment and therefore, taking the required measures (Beerken, 2003). For us, globalization is more production than consuming. This can only be achieved by creating a true national awareness and identity. Therefore, educators have important tasks to accomplish, and based on that, a process that can be realized through education is in question. Accordingly, the human being is in the centre. There are three professions (sciences) that should place the human being in the centre. The first one is medicine that affords health to people; the second is law that bestows rights and draws the framework of these rights; and the profession of teaching that compasses all of these. In his studies on school learning, Bloom (1979) has examined the entry behaviors that cover the past livings and natural and acquired competencies as related to behaviors that the students are desired to acquire in two groups namely cognitive entry behaviors and affective entry characteristics. Affective entry characteristics consist of several convictions related to the attitude that the individual develops against the school and the learning experiences at school, the academic self concept of the individual, that is how competent s/he feels as a result of their comparison of themselves with other individuals carrying out he same activity. The entry behaviors that consist of cognitive and affective entry characteristics are open to change. That is to say that they can be learned, taught, and developed with appropriate methods. The researches indicate that cognitive entry behaviors explain 50 percent of the differences in student success whereas affective entry characteristics explain only 15 percent. Today, the environment has become a main concern for the world. Pollutions in the seas, rivers, the atmosphere, and wherever we can think of are a global problem (Lisowski, 1993; Trisler, 1993). The polluting of a river springing in our lands is not a local problem anymore, but a global one. The atmospheric pollution or nuclear activities harming environment in the USA or anywhere of the world are not problems of the country where they take place but have turned to be the problems of the whole world. The consequences of the disaster in Chernobyl that happened years ago are suffered not only by the country where the explosion took place but also by the rest of the world. When the fact that people from different cultures act with a nationalistic awareness, which is seen as one of the biggest problems of globalization, is taken into consideration, it will be inevitable for us to face the fact that it would not be easy to find a solution to environmental problems. Since hindering technological developments cannot be a matter to consider, looking for global solutions to environmental issues and creating global environmental awareness has become inevitable (Lisowski and Williams, 1993; Lo Presti and Garafalo,
The Turkish Online Journal of Educational Technology – TOJET January 2005 ISSN: 1303-6521 volume 4 Issue 1
Copyright The Turkish Online Journal of Educational Technology 2002 59
1994). On the other hand, technology is a requisite of development, advancement, and facilitating living. Therefore, giving up technology and technological advancements cannot be considered as an option. THE PURPOSE OF THE STUDY Globalization has a direct relation with technological improvements. According to Tozum on this, “globalization is a technology-centered change process; and novelties such as computerization, telecommunication technologies, minimalism, compression technology, and digitalization make technology prevalent on the global scale (Tozum, 2002)”. Technological developments also broaden and accelerate communication. The opinion that rapid and unpreventable developments in technology today lead to many environmental problems and contribute to increases in environmental problems is quite widespread. Within the framework of the study, preparing an attitude scale that can measure the attitudes of all individuals and mainly students about global environmental awareness was planned primarily. The aim in preparing such a scale is to measure what the individuals especially in educational ages think about global environment, being able to make suggestions for educational programs in line with the findings obtained, and contribute to programs that will free these solutions from being national and make them global. The relations between the attitudes towards technology and global environmental awareness and whether computer aided education has an influence on the development of global environmental awareness have been aimed to be identified with the help of the prepared scale. The technological attitudes scale used within the scope of the study was prepared by Yavuz (2004) and analyzed by Morgil and Yucel (2004). When making suggestions or taking measures related to global environmental awareness utilizing such scales, more lasting and more efficient solutions can be explored by thinking globally instead of locally. Because, with the help of such a scale, human profiles in all levels such as the students at schools, people in the street, laborers at workplaces, housewives at homes, people in general from all professions and all educational and socioeconomic levels can be prepared to produce country profiles to identify how people living in a country look at the issue of global environmental awareness and thus, more efficient solution suggestions can be made worldwide. Support can be taken from sections that consider the issue with a higher awareness level. Because, the environment has no more a problem peculiar only to a single country, a continent or a region, but turned to a problem of the global world (Tognacci, L. H., 1972). The solutions to environmental problems will only be possible with global measures. The place and importance of technology in looking at global environmental problems and solution approaches will also be an important factor of the measures to be taken. Mathematics teachers and educators believe that whether the students like mathematics or are interested in mathematics lesson or not affect their success (Suydam and Weaver, 1975). Similarly, that the attitudes towards chemistry have an important role in student success has been proven by research studies (Moneim, Hassan, and Shrigley, 1984). Such a study was planned based on the idea that the same effect also applies to the success in bringing about solutions to global environmental problems, which have turned the most important subject of the world, and technology aided education will provide very important contributions in achieving this and whether computer aided education has a contribution in creating global awareness have been examined. One of the objectives of chemistry and science lessons should be that chemistry teachers and chemistry educators would educate individuals that will develop positive attitudes towards the global environment. Whether such an objective has been achieved will be measurable only with the presence of an attitude scale. In many scientific studies, measuring attitudes is necessary. Direct observation of the attitudes of the individuals is impossible. However, the conviction that the behaviors of individuals are based on their intrinsic attitudes is quite widespread (Koklu, 1995). This will play an important role in the assessment of the global environmental awareness attitude levels of students, who in the future will be at managing positions as grown up adults; in the comparison of the obtained data with the technology awareness scale, in the identification of the changes in approaches to the global environment and global environmental problems issue provided by internet based education, and in the identification of problems. EXPERIMENTAL DETAILS THE SUBJECT The sampling of the study is consisted of a total of 247 students studying at Hacettepe University Faculty of Education Chemistry Education Department. 173 of these students have participated in the study on The Development of the Global Environment Awareness Scale and 64 to internet based education applications. Initial and final “global environment awareness” and “technology attitude” scale tests were applied on these students before and after the global environment education in the internet medium.
The Turkish Online Journal of Educational Technology – TOJET January 2005 ISSN: 1303-6521 volume 4 Issue 1
Copyright The Turkish Online Journal of Educational Technology 2002 60
ATTITUDES SCALE TOWARDS TECHNOLOGY The technology attitude scale prepared by Yavuz (2004) and analyzed by Morgil and Yucel (2004) was used in the study. A Likert type draft form consisting of 50 attitude statements was used to develop the scale and it was applied on 162 students. Factor analysis was done using the data gathered through this activity and a Likert type technology attitude scale was obtained, which consisted of 19 items in its final form and of which validity and dependability studies were made. The dependability coefficient of the scale is 0.867.
GLOBAL ENVIRONMENTAL AWARENESS SCALE (GEAS) Within the scope of this study, the following activities were carried out to develop the “Global Environmental Awareness Scale” to measure global environmental awareness.
The “Global Environmental Awareness Scale” related to global environmental awareness was developed by researchers. A total of 173 students were involved in the study while the scale was being developed. In order to develop a valid and dependable measurement tool to be used to measure the attitudes of students according to their knowledge on global environmental awareness, a draft form consisting of 20 statements of awareness was prepared first. The statements in the form are given below. 1. It is not important that chemistry education curricula create global environmental awareness. 2. It is very important to disseminate the environmental awareness developed in chemistry departments to the society in the global scale. 3. Creating the required financial resources for the dissemination of environmental awareness to the public at the global scale is not necessary. 4. Efficient educational methods on the environment at the global scale should be developed through cooperation in chemistry education. 5. Development of global environment awareness through chemistry education is unnecessary. 6. I believe that chemistry departments would make very important contributions to the creation of a clean environment. 7. Since environmental issues are not a local problem, chemistry educators would not make important contributions to global solutions. 8. The pollution’s surrounding us are a universal problem and a solution cannot be brought about with measures to be taken at the global scale. 9. Environmental problems at the global scale can be solved with the joint efforts of various environment organizations. 10. Global solutions can only be possible if the solution suggestions in various countries are shared with the whole world. 11. Since most education takes place at schools, environmental education cannot be solved through global environmental education policies. 12. Limitation of environmental pollutants can only be possible through global level joint sanctioning decisions. 13. From now on, the slogan for all years should be “Let’s create global environmental awareness”. 14. Looking for global solutions to environmental problems cannot be possible through interdisciplinary interaction. 15. More effective and enduring solutions to environmental problems can be found through global environmental investments. 16. Before looking for solutions to environmental problems, awareness should be created among people on what globalization is. 17. Attempts to find global solutions for environmental issues will not create significant benefits in the financial dimension. 18. I don’t think that it is sufficient that only a few countries in the world are concerned about environmental problems. 19. Global attempts to find solutions will also mobilize urban and country sides considerably. 20. Since attempts to find global solutions for environmental issues will make nations of the world more close to each other, it will also contribute to the creation of more sensitive individuals. When this form was being prepared, a group of students were asked to write compositions explaining their feelings and thoughts about global environmental awareness. Upon the examination of these texts, sentences that can be used as statements of awareness were selected and included in the draft form. These statements accepted to indicate behaviors about global environmental awareness were examined by measurement and evaluation experts, they were grammatically checked and the required corrections were made. Whether the students agreed or disagreed with the affirmative and negative statements of awareness was measured with the 5-level grading scale (Anderson, 1981). In order to test the structural validity, in other words to test whether it measures a single
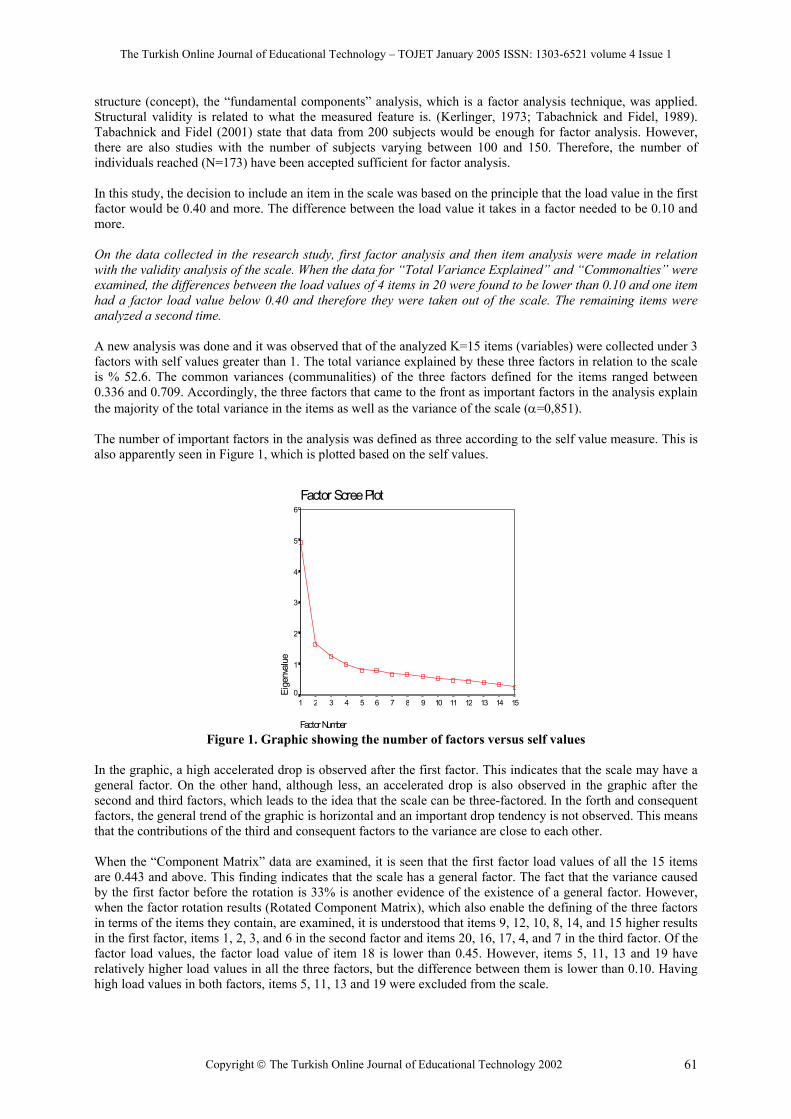
The Turkish Online Journal of Educational Technology – TOJET January 2005 ISSN: 1303-6521 volume 4 Issue 1
Copyright The Turkish Online Journal of Educational Technology 2002 61
structure (concept), the “fundamental components” analysis, which is a factor analysis technique, was applied. Structural validity is related to what the measured feature is. (Kerlinger, 1973; Tabachnick and Fidel, 1989). Tabachnick and Fidel (2001) state that data from 200 subjects would be enough for factor analysis. However, there are also studies with the number of subjects varying between 100 and 150. Therefore, the number of individuals reached (N=173) have been accepted sufficient for factor analysis. In this study, the decision to include an item in the scale was based on the principle that the load value in the first factor would be 0.40 and more. The difference between the load value it takes in a factor needed to be 0.10 and more. On the data collected in the research study, first factor analysis and then item analysis were made in relation with the validity analysis of the scale. When the data for “Total Variance Explained” and “Commonalties” were examined, the differences between the load values of 4 items in 20 were found to be lower than 0.10 and one item had a factor load value below 0.40 and therefore they were taken out of the scale. The remaining items were analyzed a second time. A new analysis was done and it was observed that of the analyzed K=15 items (variables) were collected under 3 factors with self values greater than 1. The total variance explained by these three factors in relation to the scale is % 52.6. The common variances (communalities) of the three factors defined for the items ranged between 0.336 and 0.709. Accordingly, the three factors that came to the front as important factors in the analysis explain the majority of the total variance in the items as well as the variance of the scale (α=0,851). The number of important factors in the analysis was defined as three according to the self value measure. This is also apparently seen in Figure 1, which is plotted based on the self values.
Figure 1. Graphic showing the number of factors versus self values In the graphic, a high accelerated drop is observed after the first factor. This indicates that the scale may have a general factor. On the other hand, although less, an accelerated drop is also observed in the graphic after the second and third factors, which leads to the idea that the scale can be three-factored. In the forth and consequent factors, the general trend of the graphic is horizontal and an important drop tendency is not observed. This means that the contributions of the third and consequent factors to the variance are close to each other. When the “Component Matrix” data are examined, it is seen that the first factor load values of all the 15 items are 0.443 and above. This finding indicates that the scale has a general factor. The fact that the variance caused by the first factor before the rotation is 33% is another evidence of the existence of a general factor. However, when the factor rotation results (Rotated Component Matrix), which also enable the defining of the three factors in terms of the items they contain, are examined, it is understood that items 9, 12, 10, 8, 14, and 15 higher results in the first factor, items 1, 2, 3, and 6 in the second factor and items 20, 16, 17, 4, and 7 in the third factor. Of the factor load values, the factor load value of item 18 is lower than 0.45. However, items 5, 11, 13 and 19 have relatively higher load values in all the three factors, but the difference between them is lower than 0.10. Having high load values in both factors, items 5, 11, 13 and 19 were excluded from the scale.
Factor Scree Plot
Factor Number
151413121110987654321
Eige
nval
ue
6
5
4
3
2
1
0

The Turkish Online Journal of Educational Technology – TOJET January 2005 ISSN: 1303-6521 volume 4 Issue 1
Copyright The Turkish Online Journal of Educational Technology 2002 62
The Global Environmental Awareness Scale is three-factored. of the factors identified important, the first one explains 33% of the total variance related to the scale, the second one 11.1%, and the third one 8.5%. The total variance explained by the three factors is 52.6%. After factor rotation, it was found that the first factor consisted of six items, the second consisted of four items and the third one consisted of five items. The factor load values of the items in the first factor vary between 0.766 and 0.576. The same values vary between 0.837 and 0.590 for the items in the second factor and between 0.729 and 0.406 for the items in the third factor. The factors were tried to be named after the contents of the items. Considering that all the items in the first factor are related to the “Solution of the Global Environmental Problems,” this factor was called the “Attitude Scale on the Solution of Global Environmental Problems”. Considering that all the items in the second factor are related to the “Educational and Training Mediums That can Contribute to the Solution of Environmental Problems,” this factor was called the “Attitude Scale on the Contribution of Chemistry Education to the Solution of Global Environmental Problems”. Considering that all the items in the third factor are related to the “Importance of Cooperation in the Solution of Environmental Problems,” this factor was called the “Attitude Scale on the Solution of the Global Environmental Problems in Cooperation”. The scale is one-factored at the same time. In other words, the fact that the first factor load values of the items before the rotation is high as well as that the variance it explains on its own is high show that the scale also has a general factor. Therefore, the global environmental awareness scale is suitable to be used as one-factored in addition to being three-factored. APPLICATIONS IN COMPUTER ASSISTED CHEMICAL EDUCATION The intensive courses applied 15 hours a week for two weeks on the participating students in the chemistry education internet class can be summarized as follows. The students were first put into teams of four. Then, a working calendar was prepared and the practices that the teams would carry out were explained (Morgil et al., 2004). The students were first shown the PowerPoint Presentation “Green Chemistry” prepared jointly by the “American Chemical Society”, “Royal Society of Chemistry”, and “Gesellschaft Deutscher Chemiker” (www.acs.org), and then researched how technology affects scientific perception and success and the importance of technology on the web. The students researched modular chemistry education examples related to environment. Here, the NOP-Project on sustainable organic chemistry was discussed with the students and each team was asked to learn the arrangements related to environment protection in the experiments (75 experiments) given within the framework of the project (www.OC.Praktikum.de). In the internet research they conducted, the students have found resources on “Green Chemistry Education” prepared by the IUPAC (Tundo et al., 2001). Again through their internet research, the students have learned that The Interuniversity Consortium “Chemistry for the Environment” (INCA) was established in 1993 (Tundo et al. 2002). Being an organization supported by the OECD and IUPAC, INCA makes contributions to the protection of the environment. Internet studies on globalization and global environment-related issues were also carried out with the students using various resources. (http://iied.edfac.usyd.edu.au/iied/teaching/global.html,http://webtools.cityu.edu.hk/news/newslett/globalization.htm, http://ssn.flinders.edu.au, Cornoy M., Higher Education in a Global Innovation Economy, www.chet.org.za/debates/310798c.html, Courtivron I., (2000). Within the scope of this study, when the knowledge levels of economy department students, in whose curriculum the subject of globalization exists, is compared to the chemistry education department students, who has received technology supported education on globalization and the global environment, although these topics are not within their curriculum, it has been found that using technology affects the accumulation of knowledge. Using technology in research affects the global environment awareness of students (Morgil, O., 2004). TEST PROCEDURE The Global Environmental Awareness Scale and the Attitudes towards Technology Attitude Scale were applied to a total of 64 students as a pretest. The students were given 45 minutes for this process. After the students have completed the above mentioned intensive course practice in the chemistry education internet class for two weeks as 15 hours they chose for a week, the same Global Environmental Awareness Scale and the Attitudes towards Technology Scale were given to the students for them to answer as a post test. The objective here is to investigate how and to what degree the use of technology affects Global Environment Analysis.

The Turkish Online Journal of Educational Technology – TOJET January 2005 ISSN: 1303-6521 volume 4 Issue 1
Copyright The Turkish Online Journal of Educational Technology 2002 63
RESULTS Regression analysis and paired-sample t-test were carried out within the scope of this study in order to find out to what level technology use contributes to the development of global environment awareness and identify that computer aided education is related to the formation of global environmental awareness and attitudes towards the use of technology. The results obtained through these analyses are discussed below. The results of the t-test carried out to find the significance of the difference in the mean scores from the pretest and post test of the Global Environmental Awareness Scale are given in Table 1.
Table 1. The Comparison of pretest and post test mean scores of the Global Environmental Awareness Scale Measurement N Mean Standard Deviation df t sig.
Pre Test Post Test
64 64
61.94 67.97
3.29 63 -14.623 0.000
Following the researches of the students about global environment awareness on the internet, it has been found that the use of technology provides a significant increase on attitudes towards global environmental awareness. As a consequence of the researches of the students on the internet about the issue of global environment and the homework they prepared, a significant increase in their scores in attitudes towards global environment has been identified [t(63)= -14.623; p<0.01]. While the average global environment-scale scores of the students were 61.94 before the activity, this figure increased to 67.97 after the internet practice. This finding revealed that internet practices increase global environment awareness and that this increase is statistically significant. The results of the t-test carried out to find the significance of the difference in the scores of the pretest and posttest of the Technology Attitudes Scale are given in Table 2.
Table 2. The Comparison of the Technology Attitudes Scale Pretest and Posttest Average Scores Measurement N Mean Standard Deviation df T sig.
Pre Test Post Test
64 64
74.62 81.63
5.30 63 -10.571 0.000
As a consequence of the researches of the students on the internet, a significant increase in their scores in attitudes towards technology has been identified [t (63) = -10.571; p<0.01]. While the average of the technology attitude scores of the students was 74.62 before the activity, this figure increased to 81.63 after the internet practice. In fact, when it is considered that the maximum score that should be obtained from this scale is 95, it cannot be asserted that the students had negative attitudes towards the use of technology even in the beginning. However, it has been observed that the implemented practices have improved these positive attitudes even more. This finding revealed that internet practices increase attitudes towards technology and that this increase is statistically significant. The pretest regression analysis results on to what level the attitudes of the students towards technology predict their attitudes towards the issue of global environment are shown in Table 3. Table 3. The pretest regression analysis results on to what level the attitudes of the students towards technology
predict their attitudes towards the issue of global environment. Variables B Std. Error β T p
Constant Technology 68.512 -8.8E-02
7.318 0.098
-0.114
9.363 -0.904
0.000 0.370
R= 0.114 R2= 0.013 F(1, 62)= 0.816 p=0.370
When the results of the analysis is examined, it is seen that the pretest scores for attitudes towards technology are not a significant predictor of the pretest scores for global environment awareness [R=0.114; R2=0.013; F=0.816; p>0.01]. There is not a meaningful relation between the pre-attitudes of the students towards technology and their pre-attitudes towards global environment awareness. Table 4 shows the results of the post test regression analysis on to what level the attitudes of the students towards technology predict their attitudes towards the issue of global environment.

The Turkish Online Journal of Educational Technology – TOJET January 2005 ISSN: 1303-6521 volume 4 Issue 1
Copyright The Turkish Online Journal of Educational Technology 2002 64
Table 4. The results of the post test regression analysis on to what level the attitudes of the students towards technology predict their attitudes towards the issue of global environment
Variables B Std. Error β T P Constant Technology
87.407 -0.238
9.700 0.118
-0.247
9.011 -2.011
0.000 0.049
R= 0.247 R2= 0.061 F(1, 62)= 4.043 p=0.000
The results of the analysis show that attitudes towards technology are a meaningful predictor of attitudes towards global environment awareness [R=0.247; R2=0.061; F=4.043; p<0.01]. There is a highly significant relation between the attitudes of the students towards technology and their attitudes towards the global environment. DISCUSSION AND SUGGESTIONS The changes in the society related to the developments in science and technology underline the importance of the need for education. Concepts that have been common in the recent years such as the new world order, globalization, opening to the world and the technology, reconstruction are among the popular definitions used to describe the post industrialization information societies. When the roots of these definitions are examined, it is seen that the concept of knowledge and the use of technology in educational and training environments have an important decisive role. Information’s gaining such a significance forces the structure, functioning, management, programs, and in short, all organization of the educational institutions, which are among the important centers where information is produced and distributed and ones that use various technological opportunities to make this distribution as effective as possible, to change. In order to be able to adapt to the rapid developments in our country and in the world, there is a need to improve the educational system in Turkey to the contemporary level and make it in conformity with the requisites of the time. Awareness should be created among individuals on the educational technologies that are to be used to reach the present-day level and they should be informed about their environment friendly utilization. To do this, how individuals look at the issue of global environment and the use of technology as well as their related feelings and thoughts, and the issue of how the use of technology in educational and training environments will change global environment awareness should be known. The affective properties listed above can only be measured through attitude scales. In the study, the relation between the newly developed global environment scale and the technology attitude scale developed by Yavuz (2004) have been examined to investigate if there is a difference between the pretest and posttest results of the global environment awareness scale and the pretest and posttest results of the technology attitude scale. The activities that the students carried out on the internet medium revealed a statistically significant increase in their scores for attitudes towards technology [t (63) = -10.571, p<0.01]. Computer aided training realized during the pretest/posttest practices of the Global Environment Awareness Scale has made a significant contribution to the enhancement of the global environmental awareness. A statistically significant increase in the students’ scores in attitudes towards global environment awareness was observed at the end of the researches that the students carried out on the internet medium about global environment and the homework and activities they prepared [t(63)= -14.623, p<0.01]. In their study to measure the knowledge on and attitudes towards global environment of the students of chemistry education and the students in administrative and economic sciences, Morgil O. et al. (2004) found that chemistry education department students responded with higher success levels about the subject of globalization than the students in economy department, where the subject of globalization is within the curriculum. The students with higher average responses are those who carry out various research activities about the subject of environment on the internet medium, although globalization is not included in their educational programs as a subject. Attitudes lead to the success or failure of the educational process. Attitudes towards global environment and technology have a role in providing the active participation or pacification of the students in relation to these issues. The achievement of significant increases in the averages of both attitudes show the motivating effect of computer aided education on student attitudes. Because, the students thus obtained information about the global environment, environmental problems, possible measures, and how and in what ways technological improvements can harm the environment and benefited from the ease of access to this information in the computer medium as well as the efficient and effective use of time.
The Turkish Online Journal of Educational Technology – TOJET January 2005 ISSN: 1303-6521 volume 4 Issue 1
Copyright The Turkish Online Journal of Educational Technology 2002 65
Another significant result of the study is that despite the widespread understanding that the utilization of technology harms the environment, as a result of the activities carried out on the internet medium, the students have seen that the conscious use of technology according to rules will not lead to any harm to the environment. Because, as a result of the computer aided activities, the students became more sensitive about the environment, learned more about the topic, and consequently, an increase was obtained in their attitudes towards the global environment. Similarly, as a result of computer aided researches and investigations carried out about technology, on its application areas, application types, interactions with the environment and harms it can give to the environment when wrongly used, the benefits that can be obtained when it is used with conscious, a significant increase have also been achieved in the students’ attitudes towards technology. In fact, the examination of the data show that the average attitude scores of the students towards technology and the use of technology are not low (Xort.= 74.62). The significant increase contributed to this upon the application is an indication of the fact that the activity carried out was in line with the objective. Thirdly, the answer to the question to what level the attitudes towards the use of technology predict global environment awareness was looked for in the study and it has been found that technology attitudes significantly predict the attitudes towards global environment awareness. Attitudes towards the use of technology explain the 6% of the total variance about the global environmental attitudes. The remaining 84% portion is predicted by other factors. The regression equation for the prediction of the global environment attitudes by the technology attitudes as per the results of the regression analysis is given below. Attitudes towards Global Environment = 87,407 – 0.238 technology attitudes From now on, countries have to think more global when they are establishing their educational systems and implementing new policies and raise qualified people that can compete in the global market. The internet technology that emerged parallel to the rapid developments in information technologies has deeply affected economy, education, environment, environment-related consumer behaviors, and our lives. With the dissemination of internet use, people have experienced the opportunity to share their accumulation of knowledge, thoughts, and what they wonder in the virtual environment as well as the comfort of being able to access the right information easily and fast. Thus, in this information age the human being has found the opportunity to learn things and to develop himself/herself to be useful continuously throughout life and to benefit from his/her surrounding. In the information society, the educational opportunities that countries present to their citizens are directly related to the resources and investments in this field. The following suggestions can be made in light of the data obtained through this study: • Obtaining correct and current information must be attached importance to, • Globalization in the fields of education, environment, and technology fields must be attached importance to, as in all other fields, • The developments in the informatics sector should be adapted to and the related developments should be closely monitored, • The awareness of environment protection should be improved via computer aided education, • Since environment and technology are both vital elements of life, these should not be the problem of only those working in the fields of environment and technology and technology workers should support environment and environment protection and environment workers should support technology, the conscious use of technology, and its benefits as well, • Correct and healthy awareness should be created among individuals about environmental and technological issues and the related attitudes of the individuals should be measured to look for ways to change negative attitudes to positive ones, • In a world where learning of correct and current information throughout life is inevitable, computers should be made usable in all fields of education, • Conscious use of technology should be taught to individuals starting from the primary education level and if it is possible that a technology can harm the environment, the students should be made aware of it and be enlightened. Awareness should be created among students by including technology and environment relations in the curricula topics, and the internet should be utilised to obtain information on environment and environment protection, When we consider the fundamental properties of the information society, we see that technology, globalization, and environmental awareness are an undividable trio. When this is considered, the results of the study are striking. Chemistry educators have more important duties in this. The first is that the profession of teaching, which has the human in its center and is among the most important professions in relation to globalization, will play a very important role. The second is that since globalization and global environment awareness is of question in relation to the environment, and since chemistry is one of the most important environment-related sciences, this issue should be of special concern to chemistry educators. Globalization cannot be achieved
The Turkish Online Journal of Educational Technology – TOJET January 2005 ISSN: 1303-6521 volume 4 Issue 1
Copyright The Turkish Online Journal of Educational Technology 2002 66
without having the conscious use of technology implemented and the technological opportunities brought up to a certain level developed. Therefore, when considering globalization as a concept intermingled with technology, the importance of educational services comes to the surface in making them in conformity with the system, as it does in all fields. All sciences have a share within this requirement. When looked at from the angle of the science of chemistry, the consideration and development of environmental awareness within the process of globalization, and acknowledge of the fact that this development can be even further enhanced by computer aided education is a reality that should be accepted by all now. When the creation of some concepts is realized in school environments, the development of related knowledge levels and their implementation become much easier. Because, the school environments’ high possibility of realizing planned, programmed, and required behaviors is accepted by all experts. The ways to utilize computers in all stages of education and training should be found out and educators should be equipped enough to provide computer based education. To put it in a nutshell, the education system in our country should be enhanced to the contemporary level and be implemented as required by the age in order to adapt to the rapid change being experienced in our country and in the world. This study supports this aspiration in that works on the mediums of computer and the internet significantly increase attitudes related to the global environment and attitudes towards the use of technology that supports it. REFERENCES Beerken E., (2003). “Globalization and Higher Education Research”, Journal of Studies in International
Education, v: 7, n: 2, p: 128-148. Bloom, B. S., (1979) “Human Characteristics and School Learning”, Mc Grav-Hill. David, O. W., (1999). “Education for Globalization (Modern Western Education System)”, The Ecologist, v 29
i3 p 166(3). De Courtivron I., (2000). “Education the Global Student, Whose Identity is Always a Matter of Choice”
Chronicle of Higher Education, Issue Dated July 7. Kell, P., (1999). Across Borders and States: Globalising Education, http://www.edoz.com.au/education
australi/edoz/archives/features/glob.htm. Kerlinger, F.N., (1973) “Foundations of Behavioral Research.” (Second edition). New York: Holt, Rinehart and
Winston. Köklü, N., (1995), “Attitude Measurement and Choices used in Likert-Type Measurements”, Education Science
Faculty Journal, 2, 28, 81-93. Lisowski, M. and Williams, R., (1993). “Environmental Education: Some Global and Local Perspectives”
NASSP Bulletin v: 77 n. 556 p: 72-78 Lo Presti, V. and Garafalo, F. (1994). “Global Organizing Themes for Biology Students”, American Biology
Teacher v: 56 n: 6 p: 342-47. Lyons, T., (2000). “Globalization and Education”Survival Guide to a Global World, Lecture 12. Morgil, İ., Yücel, A. S., (2004). “An Analysis of Awareness of Students in the Utilization of Technology”
Conference CBLIS 2005 ,Universty of Zilinada (Accepted Oral Presentation) Bildiri, www. utc.sk. Morgil, I., Arda, S., Seçken, N., Yavuz, S., Özyalçın, Ö. (2004). “The Influence of Computer-Assisted education
on Environmental Knowledge and Environmental Awareness”Chemistry Education: Research and Practice, v: 5, n: 2, p: 99-110.
Morgil, O., Morgil, İ., Seçken, N.,(2004). “Globalization In Higher Education and Forming Global Environmental Awareness”, Local Identity Global Awareness Engineering Education Today, 2004 Fribourg, Switzerland.
Moneim, A., Hassan, A., Shrigley, R. L., (1984). “Designing a Likert Scale to Measure Chemistry Attirtudes”, School Science and Mathematics, v: 84(8), 659-669.
Mortimore, P., (2001). “Globalization, Effectiveness and Improvement” School Effectiveness and School Improvement, v: 12, n: 1, 229-249.
Suydam, M., Weaver, F., (1975). “Research on Mathematics Learning”, Thirty Seventh yearbook, National Council of Teachers of Mathematics, VirginiaPublication
Tabachnick, B.G. and Fidell, L.S., (1989). “Using Multivariate Statistics”, USA: Harper Collins Publischers. Tabachnick, B.G. and Fidell, L.S., (2001). Using Multivariate Statistics (Fourth Edition). Boston: Ally and
Bacon. Tognaccı, L. H., Et.All. (1972). “Environmental Quality: How Universal is Public Concern?” Environment and
Behavior 4: 73-86. Trisler, C. E., (1993). “Global Issue and Environmental Education. ERIC/CSMME Digest” U. S.; Ohio; 1993-
06-00. Tözüm, H., (2002). “Is Globalisation real or is it an option?” East-West Journal, n: 18, p. 151-173, Ankara. Tundo, P., Clemenza, L., Perosa, A., (2001). Green Chemistry Series no.1, Collection of Lectures of the Summer
Schools on Green Chemistry, Venice.

The Turkish Online Journal of Educational Technology – TOJET January 2005 ISSN: 1303-6521 volume 4 Issue 1
Copyright The Turkish Online Journal of Educational Technology 2002 67
Wende, V., Marijk, C., (2003). “Globalization and Access to Higher Education”, Journal of Studies in International Education, v: 7, n: 2, p: 193-206.
Yavuz, S., (2004). “Developing a Technology Attitude Scale for Pre-Service Chemistry Teachers” (Send Journal TOJET for Publication).
The Turkish Online Journal of Educational Technology – TOJET January 2005 ISSN: 1303-6521 volume 4 Issue 1
Copyright The Turkish Online Journal of Educational Technology 2002 68
TOWARD AN EFFECTIVE INTEGRATION OF TECHNOLOGY: MESSAGE BOARDS FOR STRENGTHENING COMMUNICATION
Arif Altun, Ed.D.
Department of Computers and Instructional Technology Education Nigde University & Abant Izzet Baysal University
[email protected] ABSTRACT This paper reports on preliminary findings from a longitudinal study on the integration of multimedia and the internet technologies into language teaching. Phase I of the study included novice computer users’ approaches to multimedia design. Phase II explored the correlations between their attitudes and cognitive styles; and Phase III focused on their attitudes and beliefs about the use of computer-mediated communication (CMC) tools. The current paper discusses and reports the findings from the last phase. A total of 53 students from the department of English Language Teaching (ELT) at Abant Izzet Baysal University (AIBU) voluntarily participated in the study. An integrated message board system was designed and adopted for an elective computer assisted language learning course (CALL) for students in the ELT program. 26 students were enrolled in this course. The data was collected through several sources. One source was an attitude questionnaire toward computer-mediated communication. Students’ asynchronous correspondences constituted the other part of the data. Also, students’ personal reflection journals were gathered as another source of data. The data was analyzed both quantitatively and qualitatively. The findings of the study indicated that students generally tended to develop positive attitudes toward using asynchronous communication tools in their language teaching program. Also, no attitudinal changes in their attitudes toward CMC were observed. Finally, students expressed positive reflections about the use of CMC tools and their integration into teaching. INTRODUCTION This paper reports the findings from the phases about the integration of multimedia and the internet technologies into language teaching. The integration of computer mediated communication tools into language teaching gave impetus to the idea of exploring how language learners would approach these new tools. In addition, as more and more campuses are being wired and initiating attempts to integrate web based instructions into their policy and future accomplishments, it is important to assess learners’ attitudes and reflections and implement those CMC tools for developing sound rationale for such purposes. Although this project is a multi-phased longitudinal study, only students’ attitudes and reflections about the use of CMC tools were reported here. Computer Mediated Communication Computer mediated communication provided asynchronous and synchronous interactivity to participants within the domain of distance education. CMC is a generic term commonly used to refer a variety of systems that enable communication with other people by means of computers and networks (Romizowski & Mason, 1996). CMC can both be synchronous and asynchronous depending on the selected tools. The use of CMC tools led {to the emergence of many online communities} in virtually created environments. These online communities are also defined as communities of practice where the parties “come together around mutual engagement in an endeavor. Ways of doing things, ways of talking, beliefs, values, power relations- in short, practices- emerge in the course of mutual endeavor” (Eckert & McConnel-Ginet, 1992, p. 464). The introduction of those online communities of practices has been explored by many researchers from various standpoints. For example, in a research study, Tyan & Hong (1998) integrated CMC tools into a Business Policy course at National Taiwan University to assess participants’ attitudes toward CMC and their reflections on using CMC tools in their courses. They found that students developed positive attitudes toward using CMC tools in their classrooms. Moreover, students also expressed that the integration of these tools facilitated communication among their peers and instructor after school hours. In another research study, Ross (1996) explored the experiences of 15 practicing teachers in a graduate distance course delivered on an asynchronous electronic conferencing system. The main research question was to analyze how participants’ communication skills affected their participation in a CMC course and the role of prior knowledge of course content as related to their communication skills. Ross (1996) claimed that the level of computer skills in using these tools affected participants’ contribution to the communication process and their ability to solve the given problems within this environment. Ross (1996) went further to suggest that no differences in participation in class discussions were observed regardless of whether the students’ communication skills were weak or strong.
The Turkish Online Journal of Educational Technology – TOJET January 2005 ISSN: 1303-6521 volume 4 Issue 1
Copyright The Turkish Online Journal of Educational Technology 2002 69
In a more recent research study, Stevens & Altun (2002) investigated foreign language learners’ experiences in joining an online community (Webheads) from a distance. In their study, the researchers asked a group of students studying English as a foreign language to join an online community by using synchronous CMC tools. The findings indicated that students showed a keen interest in repeating this event again to meet online. Instead of feeling like a foreigner in the community, they seemed to find something in common to further carry on the conversation. It was concluded that English and the Webheads online community created a purposeful environment for EFL students to join and be part of the community. To conclude, integrating CMC tools into educational settings is new avenue for educators to explore for designing and delivering educational materials through CMC tools. The effectiveness of these emerging communities as community of practice, however, is subject to participants’ approval and/or rejection. Therefore, it is important to explore the participants’ attitudes toward and reflections about using these tools in their learning processes. Message Boards Message boards are web based forums where participants engage in asynchronous discussion with their peers. While current web based communication tools emphasize chat, instant messaging, and desktop video conferencing for real-time communication, message boards allow individuals to become engaged in different settings where they can discuss the same topic at differing times in participation. Consequently, this tool provides instructors an opportunity to integrate asynchronous communication tools in language learning process where communication is extended beyond the classrooms. As reported elsewhere, the use of asynchronous CMC, i.e., message boards, in education is more common than synchronous CMC tools (see, Bagcı-Kılıc, 1999). According to Wiesenberg (1995), the advantages of using asynchronous CMC tools are convenience, promoting interaction, fostering a higher quality of learning, and presenting a number of resources online. Convenience is important in that learners can choose when to participate regardless of geographical barriers, distances and time. Asynchronous tools also foster the thinking process in that participants would have enough time to think before they contribute. Moreover, instructors or participants can deliver resources and links to other related materials via asynchronous CMC tools. In a recent study, Thomas and Hofmeister (2002) investigated the effectiveness of integrated message board systems into teaching. The researchers investigated whether the cognitive complexities of students’ responses by using the message boards would differ according to prompt types. Students were provided various types of prompts to reflect upon. The researchers predicated that the more engaging and interactive the learning activity, the greater the increase in cognitive complexity. Therefore, they concluded, the infusion of message boards into the teaching process would help students develop higher order thinking processes, when designed and moderated effectively. In another research article, Vonderwell (2003) explored the asynchronous communication perspectives and experiences of undergraduate students in an online course from qualitative paradigm. Vonderwell (2003) found that CMC was a drawback in terms of collaboration among students; however, an opportunity to communicate with the instructor for learning interaction. Secondly, she reported that students sought to construct interpersonal relationships with the instructor, rather than asking questions in public. Thirdly, students expected consistent and timely feedback from the instructor. Vonderwell (2003) concluded that online instructors need to carefully utilize the web technologies for collaboration and interaction. Moreover, providing discussion or collaborative activities alone does not necessarily make students active participants in the communities. Purpose of the Study Although the integration and use of message boards in language teaching processes is not a new topic, more studies are needed to better understand the efficacy of technology integration and to establish a knowledge base for effective planning and implementation of successful learning environments. Moreover, most studies emphasize somewhat moderate or expert computer users’ experiences. How first time users would approach this new technology, however, is an important question to be explored. The research questions asked in this study are as follows: 1. What are EFL students’ self-perceived attitudes toward communicating on computers? 2. Does access to computers and networks play a significant role with respect to EFL student’s attitudes toward new information technologies—the message boards?

The Turkish Online Journal of Educational Technology – TOJET January 2005 ISSN: 1303-6521 volume 4 Issue 1
Copyright The Turkish Online Journal of Educational Technology 2002 70
3. Is there a significant difference between EFL students’ attitudes toward communicating on computers after using message boards in their teacher training courses? 4. What are EFL students’ reflections toward using asynchronous CMC tools? METHODOLOGY Participants: The participants in this study were 52 prospective English teachers enrolled in two different courses (Computer Assisted Language Learning, Methods in Language Teaching). Eleven participants were male and 41 of them were female. None of the students had any previous experience using an asynchronous forum messaging system or other electronic conferencing system before. In addition to their departmental courses, all participants had received a formal instruction on a basic computer course (This course included basic concepts in using computers (such as keyboarding and using mouse) and word and math processing office programs. This course was a mandatory for all education students at the college of education). However, none had an earlier experience with using any kind of asynchronous communication tool. Teacher Trainees’ Attitudes toward Communicating on Computers Questionnaire The Teacher Trainees’ attitudes toward communicating on computers questionnaire (ATC) was administered to each participant during the first and last weeks of the semester. The purpose of administering the ATC was to address the participants’ attitudes and perceptions of communicating on computers in education prior to their classes and after completion of their semester. The ATC included 10 items in a Likert type with six categories: Strongly Disagree, Disagree, Barely Disagree, Barely Agree, Agree, and Strongly Agree coded from one to six respectively (See, Appendix A). The ATC was first adopted by Bagci-Kilic (1999) as a subscale in an attitude questionnaire. The reliability of the scale was reported to be .82 for the subscale. Another reliability analysis was calculated for this study, and it was found .69 after excluding one item in the subscale. Content validity for the ATC is believed to be quite high due to the way the instrument was constructed. Web-Based Forum Design Before the classes started, a web based forum system called CALL Forum was developed and placed in the context of course web pages. Students were asked to register with their own username and passwords before they were allowed to participate in forum discussions. The CALL Forum served as an online agora for students and the course instructor. Students’ postings during discussions through the CALL Forum constituted the majority of the qualitative data (Figure 1).
Figure 1: A screenshot from the CALL Forum webpage
1. Group selection; 2. Title of the Message; 3. Sending messages; 4. Sender’s information
Reflection Papers In addition to the questionnaire and web-based discussion forum, students were asked to occasionally write reflection papers. It was explained to students that because this type of communication is new to them, they should reflect upon their experiences. These reflection papers were also collected at the end of the semester to be analyzed. Data Analysis The data was analyzed using SPSS 11.05, and basic descriptive statistics (mean and standard deviations) were computed for the data (Research Question 1). The mean differences among students’ access to computers with respect to their attitudes (Research Question 2) and among their attitudes toward communicating through computers before and after using the message boards in their courses (Research Question 3) were analyzed using Mann-Whitney U statistics.

The Turkish Online Journal of Educational Technology – TOJET January 2005 ISSN: 1303-6521 volume 4 Issue 1
Copyright The Turkish Online Journal of Educational Technology 2002 71
An analysis of the completed reflection papers was included as written data, as well (research question 4). Students’ reflections were collected so as to provide insightful perspectives to our understanding of the efficacy in integrating message boards into the teaching process. Initially, a detailed report for students’ interaction was gathered through the database. Secondly, this data was converted into a word document. Lastly, the data was used depending on the content of interaction. FINDINGS AND DISCUSSION Initial Reflections on Using Web Based Forum The purpose of this study was to investigate EFL students’ attitudes and reflections upon the use of computer-mediated communication (CMC) tools, of message boards in particular. The first research question was designed to explore EFL students’ initial reflections on using message boards integrated into their teacher training courses. Since this was a new medium for all of them, it might shed light upon the issues we need to consider when integrating asynchronous communication tools into language teaching curricula. Firstly, students perceived message boards as a convenient communication environment. Since they communicated with others through writing, they perceived this way of communicating as an advantage. In her reflection paper (RP), for example, Sema wrote: “you can communicate with writing. When you write, you can write at any speed you want. You can also correct yourself while you are writing. However, there is no chance for you to correct yourself at the time of speaking as it was in writing”. Sema (RP # 4) However, the idea of using message boards was pretty vague for some students. Moreover, this new medium also raised some concerns among students. Emel, for example, considers message boards as a discussion arena yet to be seen. She writes in her journal: Discussing something through the Internet is a new expression for me. Since I haven’t entered the webpage yet, it is a bit difficult to understand what the teacher talked about. I will try to enter this page and will see what the teacher means tomorrow (RP # 2). She also raises her concern by saying: “The teacher said that we were going to discuss something about the course through the Internet. But I think that we couldn’t find enough time or enough computer for this” (RP # 2). In the following reflection, Emel follows up on her concern: At the first week, I thought that the discussion through the internet was difficult and we couldn’t do this. But now I see that we can do this. When I sat in front of the computer and wrote something, entered somewhere, it seemed so enjoyable. I think that I can find enough time for going Internet and discussing something through internet (RP # 3) To conclude, initial beliefs tend to signal concerns and anxiety. However, it required some experience to understand and benefit from this tool. Students first considered this activity as an extra burden and time consuming activity. When they used the system, their concerns and anxieties faded away, and they started to enjoy using this tool. Attitudes toward Communicating on Computers Mean scores and standard deviations from the attitudinal Likert-type questionnaire are displayed in Table 1. An examination of these scores reveals that most participants had positive attitudes towards interacting with the Web-based forum.
Table 1: Mean Scores for the Attitudinal Likert-Type Questionnaire (n = 53) Likert Scale: 1 = Strongly Disagree, 6 = Strongly Agree
1. Computers are effective for communicating with other students about class related work Mean = 5,08 SD = .79 2. Computers are effective for communicating with other students about non-course related subjects Mean = 5.11 SD = .70 3. Computers are effective for communicating with instructors about non-course related subjects Mean = 4.7 SD = 1.07
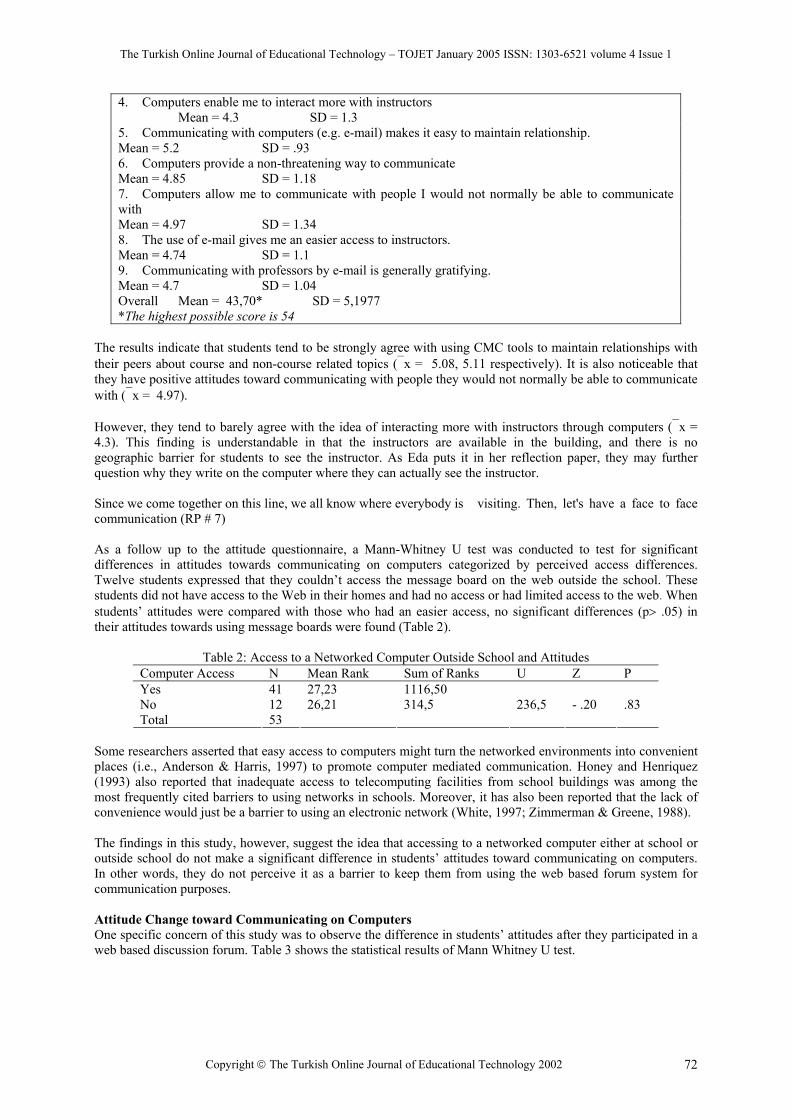
The Turkish Online Journal of Educational Technology – TOJET January 2005 ISSN: 1303-6521 volume 4 Issue 1
Copyright The Turkish Online Journal of Educational Technology 2002 72
4. Computers enable me to interact more with instructors Mean = 4.3 SD = 1.3 5. Communicating with computers (e.g. e-mail) makes it easy to maintain relationship. Mean = 5.2 SD = .93 6. Computers provide a non-threatening way to communicate Mean = 4.85 SD = 1.18 7. Computers allow me to communicate with people I would not normally be able to communicate with Mean = 4.97 SD = 1.34 8. The use of e-mail gives me an easier access to instructors. Mean = 4.74 SD = 1.1 9. Communicating with professors by e-mail is generally gratifying. Mean = 4.7 SD = 1.04 Overall Mean = 43,70* SD = 5,1977 *The highest possible score is 54
The results indicate that students tend to be strongly agree with using CMC tools to maintain relationships with their peers about course and non-course related topics (x = 5.08, 5.11 respectively). It is also noticeable that they have positive attitudes toward communicating with people they would not normally be able to communicate with (x = 4.97). However, they tend to barely agree with the idea of interacting more with instructors through computers (x = 4.3). This finding is understandable in that the instructors are available in the building, and there is no geographic barrier for students to see the instructor. As Eda puts it in her reflection paper, they may further question why they write on the computer where they can actually see the instructor. Since we come together on this line, we all know where everybody is visiting. Then, let's have a face to face communication (RP # 7) As a follow up to the attitude questionnaire, a Mann-Whitney U test was conducted to test for significant differences in attitudes towards communicating on computers categorized by perceived access differences. Twelve students expressed that they couldn’t access the message board on the web outside the school. These students did not have access to the Web in their homes and had no access or had limited access to the web. When students’ attitudes were compared with those who had an easier access, no significant differences (p> .05) in their attitudes towards using message boards were found (Table 2).
Table 2: Access to a Networked Computer Outside School and Attitudes Computer Access N Mean Rank Sum of Ranks U Z P Yes 41 27,23 1116,50 No 12 26,21 314,5 Total 53
236,5
- .20
.83
Some researchers asserted that easy access to computers might turn the networked environments into convenient places (i.e., Anderson & Harris, 1997) to promote computer mediated communication. Honey and Henriquez (1993) also reported that inadequate access to telecomputing facilities from school buildings was among the most frequently cited barriers to using networks in schools. Moreover, it has also been reported that the lack of convenience would just be a barrier to using an electronic network (White, 1997; Zimmerman & Greene, 1988). The findings in this study, however, suggest the idea that accessing to a networked computer either at school or outside school do not make a significant difference in students’ attitudes toward communicating on computers. In other words, they do not perceive it as a barrier to keep them from using the web based forum system for communication purposes. Attitude Change toward Communicating on Computers One specific concern of this study was to observe the difference in students’ attitudes after they participated in a web based discussion forum. Table 3 shows the statistical results of Mann Whitney U test.
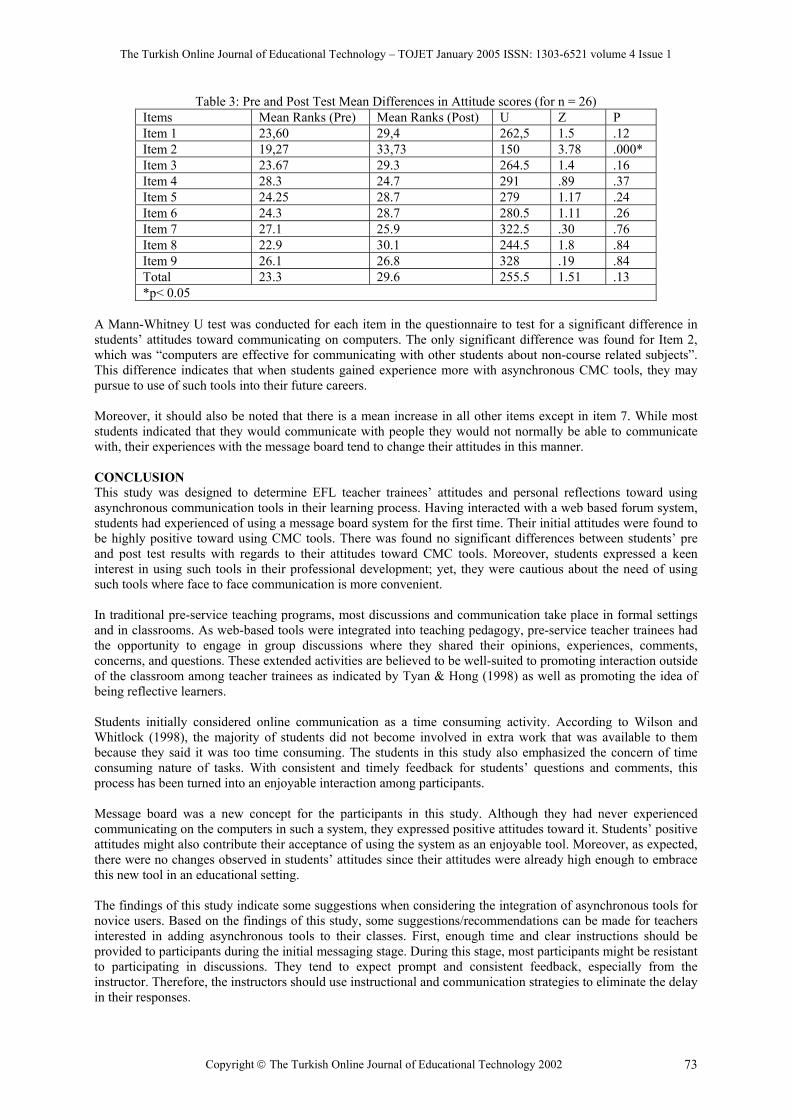
The Turkish Online Journal of Educational Technology – TOJET January 2005 ISSN: 1303-6521 volume 4 Issue 1
Copyright The Turkish Online Journal of Educational Technology 2002 73
Table 3: Pre and Post Test Mean Differences in Attitude scores (for n = 26) Items Mean Ranks (Pre) Mean Ranks (Post) U Z P Item 1 23,60 29,4 262,5 1.5 .12 Item 2 19,27 33,73 150 3.78 .000* Item 3 23.67 29.3 264.5 1.4 .16 Item 4 28.3 24.7 291 .89 .37 Item 5 24.25 28.7 279 1.17 .24 Item 6 24.3 28.7 280.5 1.11 .26 Item 7 27.1 25.9 322.5 .30 .76 Item 8 22.9 30.1 244.5 1.8 .84 Item 9 26.1 26.8 328 .19 .84 Total 23.3 29.6 255.5 1.51 .13 *p< 0.05
A Mann-Whitney U test was conducted for each item in the questionnaire to test for a significant difference in students’ attitudes toward communicating on computers. The only significant difference was found for Item 2, which was “computers are effective for communicating with other students about non-course related subjects”. This difference indicates that when students gained experience more with asynchronous CMC tools, they may pursue to use of such tools into their future careers. Moreover, it should also be noted that there is a mean increase in all other items except in item 7. While most students indicated that they would communicate with people they would not normally be able to communicate with, their experiences with the message board tend to change their attitudes in this manner. CONCLUSION This study was designed to determine EFL teacher trainees’ attitudes and personal reflections toward using asynchronous communication tools in their learning process. Having interacted with a web based forum system, students had experienced of using a message board system for the first time. Their initial attitudes were found to be highly positive toward using CMC tools. There was found no significant differences between students’ pre and post test results with regards to their attitudes toward CMC tools. Moreover, students expressed a keen interest in using such tools in their professional development; yet, they were cautious about the need of using such tools where face to face communication is more convenient. In traditional pre-service teaching programs, most discussions and communication take place in formal settings and in classrooms. As web-based tools were integrated into teaching pedagogy, pre-service teacher trainees had the opportunity to engage in group discussions where they shared their opinions, experiences, comments, concerns, and questions. These extended activities are believed to be well-suited to promoting interaction outside of the classroom among teacher trainees as indicated by Tyan & Hong (1998) as well as promoting the idea of being reflective learners. Students initially considered online communication as a time consuming activity. According to Wilson and Whitlock (1998), the majority of students did not become involved in extra work that was available to them because they said it was too time consuming. The students in this study also emphasized the concern of time consuming nature of tasks. With consistent and timely feedback for students’ questions and comments, this process has been turned into an enjoyable interaction among participants. Message board was a new concept for the participants in this study. Although they had never experienced communicating on the computers in such a system, they expressed positive attitudes toward it. Students’ positive attitudes might also contribute their acceptance of using the system as an enjoyable tool. Moreover, as expected, there were no changes observed in students’ attitudes since their attitudes were already high enough to embrace this new tool in an educational setting. The findings of this study indicate some suggestions when considering the integration of asynchronous tools for novice users. Based on the findings of this study, some suggestions/recommendations can be made for teachers interested in adding asynchronous tools to their classes. First, enough time and clear instructions should be provided to participants during the initial messaging stage. During this stage, most participants might be resistant to participating in discussions. They tend to expect prompt and consistent feedback, especially from the instructor. Therefore, the instructors should use instructional and communication strategies to eliminate the delay in their responses.
The Turkish Online Journal of Educational Technology – TOJET January 2005 ISSN: 1303-6521 volume 4 Issue 1
Copyright The Turkish Online Journal of Educational Technology 2002 74
Secondly, students’ positive attitudes contribute to their acceptance of and participation in such an online learning community. These asynchronous communication systems would definitely contribute to train future teachers to be reflective practitioners and active learners. Having belonged to a professional online community, future teachers will be able to initiate such online communities where they would share their teaching experiences, problems, ideas, and pedagogical resources. Therefore, it is highly recommended to further integrate these tools into pre-service and in-service teacher training programs. In conclusion, the integration of a message board into teaching process was “… both hard, exhausting, laborious and useful, enjoyable and fun” (Ercan, PR # 14). Such integration of multimedia and internet technologies into teaching with novice computer users is always going to be a challenge. However, positive attitudes and students’ willingness and cooperation definitely support instructors and teacher training departments to utilize new technologies in their programs. Future studies including a longer period of time and the use of both synchronous and asynchronous tools are definitely needed to better understand the components of web based instruction. Such research studies will contribute to our understanding of online communication discourses and to help us develop an online community of active and reflective practitioners. REFERENCES Anderson, S.E. & Harris, J.B. (1997). Factors associated with amount of use and benefits obtained by users of a
statewide Educational Telecomputing Network. Educational Technology Research and Development, 45 (1), 19-50.
Bağcı-Kılıç, G. (1999). Attitudes of Pre-service Teachers toward a Technology-Rich Elementary Science Methods Course. Unpublished Doctoral Dissertation. Indiana University, Bloomington, IN.
Eckert, P. & McConnel-Ginet, M. (1992). Think practically and look locally: Languages and gender as community based practice. Annual Review of Anthropology, 21, 461-490.
Honey, M., & Henriquez, A. (1993). Telecommunications and K-12 Educators: Findings from a National Survey. New York: Center for Technology in Education. ED 359 923.
Ross, J. (1996). The influence of computer communication skills on participation in a computer conferencing course. Journal of Educatinal Computing Research, 15(1), 37-52.
Romizowski & Mason (1996). Computer-Mediated Communication. In Handbook of Research for Educational Communications and Technology : A Project of the Association for Educational Communications and Technology. (Ed). David H. Jonassen. New York : Macmillan Library Reference. USA.
Stevens, V. & Altun, A. (2002). The Webheads Community of Language Learners Online. Proceeds from a demonstration given November 7, 2001 at the MLI Teacher to Teacher Conference, Abu Dhabi, UAE. Retrieved May 5, 2003, from: http://sites.hsprofessional.com/vstevens/files/efi/papers/t2t2001/proceeds.htm
Thomas, M. & Hofmeister, D. (2002). Assessing the effectiveness of technology integration: message boards for strengthening literacy, Computers and Education, 38, 233-240.
Tyan, N. N. & Hong, F. M. (1998). When western technology meets oriental culture: Use of computer-mediated communication in a higher education classroom. Paper presented at the Annual Meeting of Association for Educational Communications and Technology. St. Louis, MO, February 18-22, 1998.
Vonderwell, S. (2003). An examination of asynchronous communication experiences and perspectives of students in an online course: A case study, Internet and Higher Education, 6, 77-90.
White, C.S. (1997). Citizen participation and the Internet: Prospects for civic deliberation in the information age, Social Studies, 88, 23–28.
Wilson, T. & Whitlock, D. (1998). What are the perceived benefits of participating in a computer-mediated communication (CMC) environment for distance learning computer science students?, Computers and Education, 30, 259-269
Zimmerman, S.O., & Greene, M.W. (1998). A five-year chronicle: Using technology in a teacher education program. In Technology and Teacher Education Annual, Proceedings of the International Conference of the Society for Information Technology and Teacher Education (SITE). Washington, DC.

The Turkish Online Journal of Educational Technology – TOJET January 2005 ISSN: 1303-6521 volume 4 Issue 1
Copyright The Turkish Online Journal of Educational Technology 2002 75
UNDERSTANDING FACULTY ADOPTION OF TECHNOLOGY USING THE LEARNING/ADOPTION TRAJECTORY MODEL: A QUALITATIVE CASE STUDY
Ismail Sahin
[email protected] Iowa State University
ABSTRACT Using a technology adoption model, the Learning/Adoption Trajectory model, and this study aimed to identify the technology adoption level of a faculty member, Mary. In addition, I examined how Mary arrived at her technology adoption level. Finally, using Mary’s path to technology leadership as a guide, I offered several recommendations about how colleges and departments can encourage faculty members to integrate technology effectively. To be able to get enough data and to strengthen the internal validity and the reliability of this qualitative case study, the triangulation strategy or the multiple data collection method was used. In this basic interpretive qualitative study, the data were collected through interviews, classroom observations, and document analysis. Understanding Faculty Adoption of Technology Using the Learning/Adoption Trajectory Model: A Qualitative Case Study For more than three decades, the wide-ranging impact of computers and technology has significantly changed how we gain, convey, present, and analyze information and provided “the tools, applications, and processes that empower individuals of our information society" (See, 1994, p. 30). Hence, information technology (IT) has become an integral part of schools, colleges, and universities (Wilson, Sherry, Dobrovolny, Batty, & Ryder, 2002). The availability of technology gives higher education a vital role to model the effective and appropriate uses of technology in teaching and learning. To accomplish this goal, there is a need to understand the technology adoption process in greater detail. Using a technology adoption model, the Learning/Adoption Trajectory model, the purpose of this qualitative case study was to identify the technology adoption level of a faculty member, Mary. In addition, I examined how Mary arrived at her technology adoption level. Finally, using Mary’s path to technology leadership as a guide, I offered several recommendations about how colleges and departments can encourage faculty members to integrate technology effectively. Before discussing several adoption models, I will provide the definitions of some terms used in this paper. Carr (1999) defines “adoption” as “the stage in which a technology is selected for use by an individual or an organization.” Also, he defines “innovation” as “a new or innovative technology being adopted.” For Carr (1999), “diffusion” applies to “the stage in which the technology spreads to general use and application” and “integration” refers to “a sense of acceptance, and perhaps transparency, within the user environment.” Several scholars have proposed technology adoption models. As Farguar and Surry (1994) describe, these models are useful because “an analysis of the factors which affect a product’s adoption can play an important role in increasing the utilization of the product” (p. 20). Perceiving the stage of the technology adoption and the factors that shape this stage can lead us to the effective use of technology. Stockdill and Morehouse (1992) describe the factors that influence the adoption of technology as educational need, user characteristics, content characteristics, technology considerations, and organizational capacity. The adoption process of innovations has been studied for over three decades. As the most popular adoption models, Hall and Hord's (1987) Concerns-Based Adoption Model (CBAM) and Rogers' (1995) Diffusion of Innovations, have been used in many studies (Sherry & Gibson, 2002). Since the rapid and continuous changes in technology require using a dynamic and recursive model to evaluate the technology adoption process, Sherry, Billig, Tavalin and Gibson (2000) proposed another adoption model, the Learning/Adoption Trajectory model based on Rogers’ diffusion theory. THEORETICAL FRAMEWORK The Learning/Adoption Trajectory model is a research based model established based on a five-year project with teachers in Colorado in the United States. “Throughout the project’s five years, Boulder Valley Internet Project leaders introduced the use of telecommunications in the classroom to the Boulder Valley School District by training”(Sherry, 1997, p. 68). I will use the Learning/Adoption Trajectory (Sherry et al., 2000) model as a framework to define the level of Mary’s technology use. The stages of this model are described in Table-1:

The Turkish Online Journal of Educational Technology – TOJET January 2005 ISSN: 1303-6521 volume 4 Issue 1
Copyright The Turkish Online Journal of Educational Technology 2002 76
Stage 1. Teacher as Learner: In this information-gathering stage, teachers learn the knowledge and skills necessary for performing instructional tasks using technology. Stage 2. Teacher as Adopter: In this stage, teachers progress through stages of personal and task management concern as they experiment with the technology, begin to try it out in their classrooms, and share their experiences with their peers. Stage 3. Teacher as Co-Learner: In this stage, teachers focus on developing a clear relationship between technology and the curriculum, rather than concentrating on task management aspects. Stage 4. Teacher as Reaffirmer/ Rejecter: In this stage, teachers develop a greater awareness of intermediate learning outcomes (i.e. increased time on tasks and greater student engagement) and begin to create new ways to observe and assess impact on student products and performances, and to disseminate exemplary student work to a larger audience. Stage 5. Teacher as Leader: In this stage, experienced teachers expand their roles to become action researchers who carefully observe their practice, collect data, share the improvements in practice with peers, and teach new members. Their skills become portable.
Table-1. Learning/Adoption Trajectory (adapted from Sherry et al., 2000) As an innovation, technology is changing every day. Thus, adopters have to learn about the innovation in every stage of this model (Sherry et al., 2000). Continuous technical support and mentoring by trusted peers are important factors in the earlier stages of the Learning/Adoption Trajectory model. If we want teachers “to be more willing to move to the next phase at which they become colearners and coexplorers with their students,” we should provide them “adequate training, mentoring, access, and technical support” (Sherry & Gibson, 2002). The “teacher as leader” stage was added later to the current model (Sherry, 1999). METHODS Using this technology adoption model, I would like to identify Mary’s technology adoption level and to examine how Mary arrived at her technology adoption level. Although Mary’s class is about the use of computers in classrooms, teaching about technology or personal use of technology does not predict the integration of technology into the curriculum. Spotts (1999) supports this idea that “knowing the basics of a technology does not ensure effective use in instruction” (p. 96). In my opinion, the experience from the perspective of the faculty can lead us to understand the adoption of technology in teaching. To be able to achieve this goal, qualitative research is very appropriate for this kind of study since “qualitative research attempts to understand and make sense of phenomena from the participant’s perspective” (Merriam (2002a, p. 6). Similarly, Merriam (2002a) contends that “in conducting a basic qualitative study, you seek to discover and understand a phenomenon, a process, the perspectives and worldviews of the people involved, or a combination of these” (p. 6). For Merriam (2002a), a basic interpretive qualitative study includes all the characteristics of qualitative research: • The researcher tries to understand the meaning that participants have constructed about a situation or phenomenon. • The researcher is the main instrument. • The process is inductive. • The finding of a qualitative study is descriptive. In this basic interpretive qualitative study, the data were collected through two interviews, two classroom observations, and the document analysis. To be able to get enough data, I used the triangulation strategy or the multiple data collection method to strengthen the internal validity and the reliability of this study. As Merriam (2002b) states, while internal validity checks whether researchers are viewing or assessing what they are viewing or assessing, reliability ensures whether the outcomes are constant with the data gathered. In addition, Mertens (1998) suggests that peer debriefing contributes to the internal validity (or credibility) of a study. Hence, during this study, I have received feedback from a group of graduate students about the findings, conclusions, analysis, and hypotheses presented in this study. Their questions and recommendations guided me in every step of my study. Moreover, external validity or generalizability, which makes certain that the outcomes of a study can be related to other circumstances or people, should also be considered in qualitative research. I believe the rich and thick description increases the external validity or generalizability of this study since “providing rich, thick description is a major strategy to ensure for external validity or generalizability in the qualitative sense” (Merriam, 2002b, p. 29).

The Turkish Online Journal of Educational Technology – TOJET January 2005 ISSN: 1303-6521 volume 4 Issue 1
Copyright The Turkish Online Journal of Educational Technology 2002 77
DATA ANALYSIS “In qualitative research, data analysis is a process of making meaning” (Esterberg, 2002, p. 152). To analyze the data, I used a qualitative coding method. Coffey and Atkinson (1996) state that qualitative coding involves three steps: 1. noticing relevant phenomena, 2. collecting examples of those phenomena, 3. analyzing those phenomena in order to find commonalities, differences, patterns, and structures (p. 29). In the open coding stage, I worked intensively with the data to identify in which category in the Learning/Adoption Trajectory model the participant best fit. Then, I looked for examples supporting this category and the themes that shape and contribute to this stage. After finding some emerging themes in the open coding stage, I went through the data concentrating only on these themes. This was the focused coding step of analyzing the data. Also, I used memos when analyzing the data. These memos helped me remember how I did my coding and what my ideas and feelings were at the time I was analyzing the data. PARTICIPANT The participant, Mary, is an associate professor in the Department of Curriculum and Instruction at a Midwestern university which has about 25,000 students. Mary’s bachelor’s degree is in computer science and communications and her master’s degree is in curriculum and training technology. She has a doctorate degree in instructional technology from the university at which she is working right now. After getting her doctorate degree, she started to work at this university. She has been teaching in higher education for 10 years and this is her 11th year. Since getting more detailed information about Mary would help me identify her position in terms of technology use, I searched the World Wide Web and the university search engines to learn more about her. Mertens (1998) confirms that Web searches are new, but useful methods for gathering background information: “World Wide Web (WWW) sites are a more recent development in the realm of literature searching” (p.39). Although some Web sites returned in the search were related to another person with the same name, I visited a total of 142 Web sites to gather information about Mary. After reviewing these pages, I briefly found out that she • was the coordinator of an international program in 2003, • served in a committee for the search for a new dean for the College of Education, • was honored with a university award in early achievement in teaching, • is the director of graduate education in the department, • is faculty advisor in a ministry of a local church, • is a financial aid representative of College of Education to university committees, councils, advisory boards and faculty senate, • is currently in the recruitment and retention committee of the College of Education, • worked to explore options for the university’s future academic calendar and worked on the recruitment and retention of women and minority on an academic task force, and • has a faculty position in another department. In the selection of any participants, several biases must be considered. However, in this study, I will explain, rather than completely eliminate any possible bias, as is recommended by Merriam (2002a): “Rather than trying to eliminate these biases or “subjectivities”, it is important to identify them and monitor them as to how they may be shaping the collection and interpretation of data” (p. 5). Although Mary is in my department, I have not taken any course from her so we did not have a student-teacher relationship during this study. She teaches classes at the undergraduate level. Moreover, the selection of the participant was intentional because “in qualitative research a sample is selected on purpose to yield the most information about the phenomenon of interest” (Merriam, 2002b, p. 20). I heard from one of my friends that Mary was using technology in her class and this class was about computer use in classroom. I thought she could give the greatest possible insight into my topic. Indeed, she provided sufficient information for this qualitative study because of her strong background in technology and its use. OBSERVATIONS I observed Mary in her class since “observation--looking in a focused way--is at the heart of qualitative research” (Esterberg, 2002, p. 58). In Mary’s class, she teaches how to adapt computer applications into curriculum, how
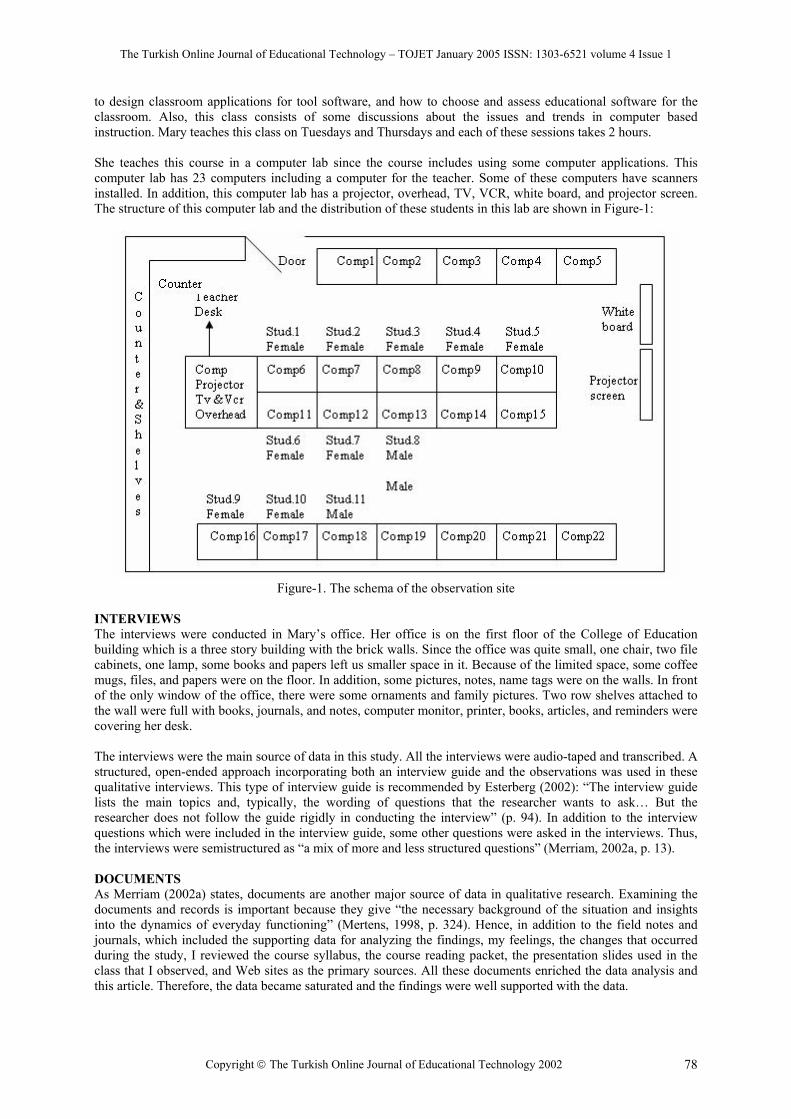
The Turkish Online Journal of Educational Technology – TOJET January 2005 ISSN: 1303-6521 volume 4 Issue 1
Copyright The Turkish Online Journal of Educational Technology 2002 78
to design classroom applications for tool software, and how to choose and assess educational software for the classroom. Also, this class consists of some discussions about the issues and trends in computer based instruction. Mary teaches this class on Tuesdays and Thursdays and each of these sessions takes 2 hours. She teaches this course in a computer lab since the course includes using some computer applications. This computer lab has 23 computers including a computer for the teacher. Some of these computers have scanners installed. In addition, this computer lab has a projector, overhead, TV, VCR, white board, and projector screen. The structure of this computer lab and the distribution of these students in this lab are shown in Figure-1:
Figure-1. The schema of the observation site
INTERVIEWS The interviews were conducted in Mary’s office. Her office is on the first floor of the College of Education building which is a three story building with the brick walls. Since the office was quite small, one chair, two file cabinets, one lamp, some books and papers left us smaller space in it. Because of the limited space, some coffee mugs, files, and papers were on the floor. In addition, some pictures, notes, name tags were on the walls. In front of the only window of the office, there were some ornaments and family pictures. Two row shelves attached to the wall were full with books, journals, and notes, computer monitor, printer, books, articles, and reminders were covering her desk. The interviews were the main source of data in this study. All the interviews were audio-taped and transcribed. A structured, open-ended approach incorporating both an interview guide and the observations was used in these qualitative interviews. This type of interview guide is recommended by Esterberg (2002): “The interview guide lists the main topics and, typically, the wording of questions that the researcher wants to ask… But the researcher does not follow the guide rigidly in conducting the interview” (p. 94). In addition to the interview questions which were included in the interview guide, some other questions were asked in the interviews. Thus, the interviews were semistructured as “a mix of more and less structured questions” (Merriam, 2002a, p. 13). DOCUMENTS As Merriam (2002a) states, documents are another major source of data in qualitative research. Examining the documents and records is important because they give “the necessary background of the situation and insights into the dynamics of everyday functioning” (Mertens, 1998, p. 324). Hence, in addition to the field notes and journals, which included the supporting data for analyzing the findings, my feelings, the changes that occurred during the study, I reviewed the course syllabus, the course reading packet, the presentation slides used in the class that I observed, and Web sites as the primary sources. All these documents enriched the data analysis and this article. Therefore, the data became saturated and the findings were well supported with the data.
The Turkish Online Journal of Educational Technology – TOJET January 2005 ISSN: 1303-6521 volume 4 Issue 1
Copyright The Turkish Online Journal of Educational Technology 2002 79
FINDINGS In the first interview, Mary talks about her role in the department and describes it as a “leadership role in terms of modeling.” She articulates that when her colleagues have any problems or questions, they usually ask her for help and they are very comfortable with that. Why do her colleagues “feel free to come and ask her” for help? I believe this is the result of her leadership role. “Exploring the role of leadership styles in converting knowledge into competitive advantages is important to our understanding of leaders and organizations” (Bryant, 2003, p. 32). All the factors described below shape the leadership role that Mary carries in the department. In the Learning/Adoption Trajectory model, she is definitely in the last stage, teacher as leader. She not only has the knowledge of technology but also uses it in her teaching and shares it with other faculty. Technology Adoption and Expertise In addition to her background in educational technology from her bachelor’s degree to her doctorate degree, she knows about different software and hardware so that she adapts technology effectively and extensively in her classes. As mentioned earlier, her class is about computer use in classroom. In her classroom, she uses technology such as Power Point and different educational software: I definitely use Power Point a ton just to project my ideas and to convey concept to students. It is a way to get all of the class focus on the same point….. it allows me to connect to other, to demonstrate, other information instead of just having static words up there. I can also connect to a Web site. I can also connect to other applications so they can see those things I also use. We use a lot of software in my classrooms. Everything from the whole Office to just different educational applications of software. In the first class that I observed, she showed the students the uses of Excel in math education. The students practiced the spreadsheets in that session. She also integrates other software: We use Inspirations and all kinds of tool software. File Maker Pro, we use. Excel, spreadsheets, we use. Microsoft Word and….. We use Inspirations, we use. We use Inspirations but we use other things like there is some software known as Building Perspective which is a 3-D software to help students develop their special reasoning skills. We use Number Monsters to show how kids can practice their basic math skills. We use Webquests. I mean, we use you name it we use it. Mary adopts all this software into the curriculum. In addition, her use of technology is not limited with the software. She also has knowledge of different hardware: “We (I and the students) all obviously use the Mac,” and “they (the students) use digital cameras for some of their projects. I don’t require them to do any video things but we do use digital cameras sometimes.” Mary sees technology as “a tool or method to solve a problem.” With her expertise, she can easily solve her colleagues’ problems: Sometimes it’ll be out in the hall. And somebody will see me and they’ll have a technical question. And you know, 9 times out of 10, I can fix it because I study the technology so I understand a lot of applications. And they just have a question about Power Point or Netscape or whatever. Sometimes it’s more on how they’re going to use the technology with their class. Mary’s skills become portable since she uses these skills to help others in different places. Mary does not see technology as only computers. For instance, she used the white board to explain an example in her class that I observed. She uses the board to do some calculations or some other tools: “I also use quite often. I just used the dry erase board.” “And so I don’t always have to use computer technology. I use the dry erase board or sometimes I even just recently used the over head because I had some things that the transparency was easier to show.” Sometimes online education is also a part of her classes: “I’ve done some things where we had discussion groups online.” Is her expertise in technology the only reason that her colleagues come for help?
The Turkish Online Journal of Educational Technology – TOJET January 2005 ISSN: 1303-6521 volume 4 Issue 1
Copyright The Turkish Online Journal of Educational Technology 2002 80
Helping and Caring about Other People Mary uses her expertise to help other people. This certainly adds to her leadership role. Furthermore, she is very enthusiastic about helping others because she cares about them: I’ve done extensively in terms of helping other faculty. I’ve been involved in some projects that we helped other faculty but I haven’t lead any projects along this line. I’ve leaded some projects for students teaching them how to incorporate technology. I’ve done some things where I’ve had undergraduate students work with technology and work with K-12 students. So we’ve started the computer clubs and things like that out of the school. Since Mary believes technology can be used to solve problems, she helps her colleagues use technology as tool to find solutions to their problems: I think that what our job is in learning and teaching is to use that, those basic skills and help people go beyond that. They can learn those basic things but in terms of. Technology is kind of revolutionizing how we think about knowledge. And so I think it’s really important that we do use technology as a means to help people learn. They should have some basic technological skills. I think it goes beyond that... So we think about how that couples information. It makes how we use, how we can use the technology different in terms of helping people learn. Mary worked as a manager of an educational programs laboratory. This job may have a positive effect on her caring about and helping others. The laboratory offers teacher workshops in science and mathematics. It has educational programs, including contests, mentoring, and classes that are also available for students. Also, she has been involved in some academic organizations that contribute to this characteristic of her. For instance, she has been in an academic organization which sets up meetings between people who find inspiring and helping others to learn important in higher education. In this organization, the colleagues in higher education “learn about themselves as teachers, explore new methods of teaching, and join a growing network of dedicated professionals who can share resources and offer mutual support” (Wakonse Foundation, n. d.) As Wetzel (1993) states, even the faculty who have technical background may not use technology in teaching if they do not have knowledge of how to use it. Thus, technology is not being used at an expected level (Spotts, 1999). In addition to Spotts’ (1999) and Wetzel’s (1993) findings, Mary shows the importance of helping faculty members each other: “Sometimes they just need little guide. They know what they wanna do, they don’t know how to do it”. Comfort and Accessibility Since Mary is very helpful and an expert in technology and its use, her colleagues “know that I know how to do it so people feel free to come and ask me.” She states, “in this case, technology happens to be something that I have some expertise in so they might feel comfortable asking me that.” If she needs any knowledge or feedback, she is also asking other faculty for help: For example, I’m not going to be expert in child literature. But there is sometimes when I need to know about children literature so I go ask the expert. Their goal is not to make me expert in this but to provide me with the basic information. Mary shares her improvements in practice with her colleagues. Thus, the comfort is created and improved through the sharing and a two-way interaction: When I need to understand content better for what I’m doing. And I might go and talk to some other math people. And they might suggest some articles and things that I need or I’ll ask them about student understanding. Then I go and try something. And we’ll have a follow up conversation about how well all went it. I also feel comfortable asking them in areas where they have expertise and that I need some assistance in. And so it’s just a kind of comfortable environment where everybody helps everybody. And most, a great deal I learn from my colleagues. I believe the interaction and helping each other increase the comfort among them. Since Mary is approachable, her colleagues are more comfortable asking questions:

The Turkish Online Journal of Educational Technology – TOJET January 2005 ISSN: 1303-6521 volume 4 Issue 1
Copyright The Turkish Online Journal of Educational Technology 2002 81
I think that my colleagues feel very comfortable while asking me. In fact, I’ve just had a question earlier today where could I help somebody solve a problem or something they didn’t how to do. That happens a lot. I think it’s probably more in terms of I am accessible. Mary is accessible and approachable for her colleagues so that they can easily reach and ask her, “could you help me with this?” For instance, I believe her willingness to participate in my project was a sign of her openness. Although she was busy with some departmental responsibilities in addition to her researches, she replied to my request and agreed to be part of my project. Time is a limitation to be accessible. However, Mary states that helping her colleagues is not a time consuming job for her. The problems or questions that her colleagues have usually do not require a lot of time or follow-up: A lot of times they’re not, they’re not something that requires me to sit down for two hours with them and to re-meet with them regularly about it. But a lot of times something that I can show them how to do in 20 minutes or 30 minutes. DISCUSSION AND IMPLICATIONS The examination of Mary’s stage in the adoption model suggests that colleges and departments can take several steps to encourage other faculty members to achieve Mary’s level of expertise: administrators should implement faculty-to-faculty mentoring programs and insist upon and model appropriate use of technology. Faculty Mentoring/Modeling In terms of the faculty-to-faculty mentoring program, Mary expresses that we should not expect all faculty to be experts in technology: “They don’t need to know every piece. They’re not studying technology. They’re using.” Actually, “the broad discipline of technology has to do with the use of knowledge and resources to solve the problems.” For this reason, faculty need help to be able to use the knowledge and resources in educational technology. For example, the training in which faculty members help each other can be the next step for faculty development programs: It’s probably the most effective way because faculty’re developing when they have the need… So in that way, I think it is an excellent way of faculty development. It is not as formal as the mentoring program. But it’s probably the next step for the mentoring program. Because after they’ve been mentored by some of our graduate students, then they know the kinds of questions. Sometimes they just need little guide. They know what they wanna do, they don’t know how to do it. They just got stumbled little bit. The mentoring program Mary mentions is a faculty development program in which a graduate student is paired with a faculty member, and the graduate student helps the faculty in terms of her or his instructional technological needs. Although the mentoring programs are successfully implemented in colleges of education (Smith & O’Bannon, 1999; Sprague, Kopfman, & Dorsey, 1999; Gonzales et al., 1997; Gonzales & Thompson, 1998; Beisser, 2000; Chaung, Thompson, & Schmidt, 2002), faculty mentoring can be considered as a next step for integrating technology into curriculum. For instance, a mentoring program having teachers as both mentors and mentees has been used as technology education for teachers. MacArthur et al. (1995) support this idea and state that mentoring helped teachers “to increase the mentors’ knowledge of innovative and effective uses of technology and their awareness of technology resources in their own school district.” This achievement can lead us to create a mentoring program having faculty as both mentors and mentees. As Mary and Wetzel (1993) mention earlier, faculty who have technical background may not use technology in teaching if they do not have knowledge of how to use it. Also, Sherry et al. (2000) state that “teachers as learners” need ongoing professional development by colleagues rather than one-shot workshops by outside experts and “teachers as adopters” need mentoring with care and comfort as well as information so “teachers as leaders” play an important role in improving faculty in earlier stages. In addition, colleagues have a very important effect on whether their fellow instructors adopt an innovation or not: “While information about a new innovation is usually available from outside experts and scientific evaluations, teachers usually seek it from trusted friends and colleagues whose subjective opinions of a new innovation are most convincing” (Sherry, 1997, p. 70). For these reasons, I believe the faculty-to faculty mentoring and modeling should be considered in faculty development programs. As Spotts (1999) states, training programs need to show faculty members how the technology can be effectively used to enhance their instruction and learning:

The Turkish Online Journal of Educational Technology – TOJET January 2005 ISSN: 1303-6521 volume 4 Issue 1
Copyright The Turkish Online Journal of Educational Technology 2002 82
Faculty development programs and training should not only focus on the equipment or software, but also on helping faculty members develop materials and effectively use the technology. Programs need to show faculty members how they can potentially benefit from using instructional technology. (p. 97) Modeling the technology use is an effective way to meet this goal since “leaders play a central role at virtually every stage of the innovation process, from initiation to implementation, particularly in deploying the resources that carry innovation forward” (Light, 1998, p. 19). Moreover, Carr (1999) talks about the on-going peer support and expresses that “live peer support not only serves as assistance and encouragement; it contributes to the person-to-person communication that promotes diffusion throughout an educational community.” To improve the faculty use of technology on campuses, colleges and universities may use this modeling in the faculty training. Hence, I believe the faculty modeling should be included in training programs. In this way, universities can become learning communities since “learning communities can also be more easily formed at later stages” of the Learning/Adoption Trajectory model (Sherry et al., 2000). Appropriate Use of Technology Modeling for faculty development should consist of the appropriate uses of technology. In the interviews, Mary states that the uses of technology in teaching and learning should be based on the research and gives the use of Palm Pilots as an example: So for example, Palm Pilot. Using Palms in the classroom. That’s something that at this point, in my perspective, it’s pretty, umm, there is not much data out on that. We don’t know a lot from the research. There hasn’t been a lot research done on that. So maybe using it in an exploratory and a, in a means trying to figure out what is the best way to use it. Sort of a development trying to understand this technology. That makes some sense on a limited basis… I think a bad use’s trying to figure out how to use Palm Pilot for everybody. Maybe we should do that in a laboratory situation and in a more research driven situation and not give it out there just because we have the palm technology. Maybe we should not just be doing until we understand from a research point of view how best to use it and what kinds of learning opportunities it can consistently and reliability afford us. In addition, to integrate technology in teaching, faculty members need time. Mary sees this issue as very important when she talks about the needs and problems of faculty in her college in terms of technology use: Time. Time is always a need for everybody. Probably time and in that opportunity is to think about the way technology can be used most effectively to expand the curriculum and not just do what we’re already doing. And probably time to think very carefully about what we’re building by increasing our use of technology: what are we saying and what are we getting into. To make learning technology possible for faculty member, administration leaders should take the lead on using technology responsibly. Although “the primary role of administration is one to help facilitate access,” technology brings more responsibility to administration: I think another area of responsibility that people don’t think about for administration. I think that’s providing leadership so we’re using responsible and efficient use of technology. In one sense, email is one of the most inefficient uses because sometimes students all email me and ask me question. And it would take me far a longer to type out my answer that for me than that for them to stop by my office. And so, umm, and sometimes I think administratively I get bombarded by emails from department chairs, leaders, and administrators. Be selective, don’t send me everything. So part of their job is to lead in the responsible and thoughtful use of technology so we don’t get carried, so consumed by technology that we forget what we’re here for. We don’t have time to do what we’re really here to do. Administrative support and “thoughtful use of technology” provide sufficient time to faculty with the integration of technology in the curriculum. The responsible use of technology is not limited to the administration. Faculty members especially should think about the appropriate uses of technology: There’s a lot of support for it. I think that maybe what we need to focus on next is making sure that it’s not overshadowing what we’re trying to do. The reason’s what we’re really here which our research, which is teaching so we don’t get so caught up that the technology takes over.
The Turkish Online Journal of Educational Technology – TOJET January 2005 ISSN: 1303-6521 volume 4 Issue 1
Copyright The Turkish Online Journal of Educational Technology 2002 83
I think the technology is really going to push us make some decisions about the priorities. And we’re either going to make decisions about the priorities or we’re going to get run over by the technology. Mary gives the email example several times to show how technology consumes the time of faculty: It certainly uses one that sucks your time. You know, I would say that I use 25 percentage of my day on email. Just on communication where somebody sent me something so I’ve responsibility to get back to that. In part of that because I am the DOGE (Director of Graduate Education) so I get a lot of email from graduate students. But I’ve got to handle and respond to those individually, each one. So easily, easily, 25 percentage of my day is on communicating with people through email. The expectation is that I am keeping up with my email. So that definitely affects my level of freedom. And it would what I can do because it’s expected. It’s part of the culture… All I’m trying do is to read my email and get the information. So there’s just lots of, lots of, lots of conversations that are going on. Sometimes we get overlapped in the conversations… And you gotta be able to all keep up. And if you miss a half a day, you’re out of league. Email is only one of the examples using faculty’s time. Availability of time is a key factor that influences the adoption and integration of technology in teaching and learning. To increase the utilization of technology in higher education, technology should be used carefully and appropriately by faculty, administration and students. Limitation Although I believe using the rich and thick description in this study increases external validity or generalizability, this study may be conducted with more participants in different schools so that the outcomes of the research may become more transferable to other situations. Conducting multisite designs or maximizing variation in the intentionally selected sample is another strategy to enhance the generalizability of a study (Merriam, 2002b). However, Miles and Huberman (1994) comment differently: Thus there is a danger that multiple cases will be analyzed at high levels of inference, aggregating out the vocal webs of causality and ending with a smoothed set of generalizations that may not apply to any single case. This happens more often than we care to remember. (p. 435) Therefore, as Mertens (1998) states, conclusions across the multiple cases should be done carefully and the uniqueness of each case should be considered. CONCLUSION This basic interpretative qualitative study shows that Mary has expertise in the instructional technology. Also, she adopts it effectively into her curriculum. In addition to these factors, she cares about other faculty members and helps them in the integration of technology into teaching. Since she is accessible and approachable to her colleagues, they feel comfortable to come and ask for help. Then, she shares the knowledge of educational technology with them. All these aspects form the leadership role that she carries in the department. Certainly, other factors may affect this leadership role but the themes described in this paper are the ones that are emerged from the data and support Mary’s leadership in technology. However, as future research, a similar study can be conducted based on a leadership theory. In the Learning/Adoption Trajectory model (Sherry et al., 2000), Mary is certainly in the leadership phase since she describes her position as a “leadership role in terms of modeling” and the themes discussed in this paper support this position. As Spotts (1999) affirms, faculty need help in how to use the technology effectively in teaching. Thus, they may need other faculty’s leadership in technology. To develop faculty into leaders, faculty-to-faculty mentoring and modeling, and the themes that shape Mary’s leadership role can be considered in faculty development programs. Moreover, it is essential that faculty who use technology effectively in their curriculum and have the leadership in technology should be good role models to their colleagues and students in terms of right and responsible uses of technology. REFERENCES Beisser, S. (2000). Technology mentorships in higher education: An optimal match for expanding educational
computing skills. In B. Gillan & K. McFerrin (Eds.), Faculty Development (pp. 441–447). Bryant, S. E. (2003). The role of transformational and transactional leadership in creating, sharing and exploiting
organizational knowledge. Journal of Leadership & Organizational Studies, 9(Spring), 32-55.
The Turkish Online Journal of Educational Technology – TOJET January 2005 ISSN: 1303-6521 volume 4 Issue 1
Copyright The Turkish Online Journal of Educational Technology 2002 84
Carr, V.H. (1999). Technology Adoption and Diffusion. Retrieved April 20, 2004, from United States Air Force, Air War College, Gateway to Internet Resources Web site: http://www.au.af.mil/au/awc/awcgate/innovation/adoptiondiffusion.htm.
Chaung, H., Thompson, A., & Schmidt, D. (2002). Faculty technology mentoring program: major trends in the literature. Technology and Teacher Education Annual, 2002. Charlottesville, VA: Association for the Advancement of Computing in Education.
Coffey, A., & Atkinson, P. (1996). Making sense of qualitative data: complementary research strategies. Thousand Oaks, CA: Sage.
Esterberg, K. G. (2002). Qualitative methods in social research. Boston: McGraw-Hill. Farquhar, J.D., & Surry, D.W. (1994). Adoption analysis: an additional tool for instructional developers. Educational Training Technology International, 31 (1), 19-25. Gonzales, C., Hill, M., Leon, S., Orrantia, J., Saxton, M. & Sujo de Montes, L. (1997) Faculty from Mars,
technology from Venus: mentoring is the link, in J. Willis, J. D. Price, S. McNeal, B. Robin & D. A. Willis (Eds.) Technology and Teacher Education Annual 1997. Charlottesville: AACE.
Gonzales, C. & Thompson, V. (1998). Reciprocal mentoring in technology use: Reflecting with a literacy educator. Journal of Information Technology for Teacher Education, 7 (2), 163-176.
Hall, G. E., & Hord, S. M. (1987). Change in schools: Facilitating the process. New York: State University of New York Press.
Light, P.C. (1998). Sustaining innovation. San Francisco: Jossey-Bass. McArthur, C. A., Pilato, V., Kercher, M., Peterson, D., Malouf, D., & Jamison, P. (1995). Mentoring: An
approach to technology education for teachers. Journal of Research on Computing in Education, 28(1), 46–61.
Merriam, S. B. (2002a). Introduction to qualitative research. In S. B. Merriam (Ed.), Qualitative research in practice (pp. 3-17). San Francisco, CA: Jossey-Bass.
Merriam, S. B. (2002b). Assessing and evaluating qualitative research. In S. B. Merriam (Ed.), Qualitative research in practice (pp. 18-33). San Francisco, CA: Jossey-Bass.
Mertens, D. M. (1998). Research methods in education and psychology: integrating diversity with quantitative & qualitative approaches. Thousand Oaks, CA: Sage.
Miles, M. B., & Huberman, A. M. (1994). Qualitative data analysis (2nd ed.). Newbury Park, CA: Sage. Rogers, E. M. (2003). Diffusion of innovations (5th edition). New York: Free Press. See, J. (1994). Technology and outcome-based education: Connections in concept and practice. The Computing
Teacher, 17 (3), 30-31. Sherry, L. (1997). The boulder valley internet project: lessons learned. THE (Technological Horizons In
Education) Journal, 25(2), 68-73. Sherry, L. (1999). Using the internet to enhance standards-based instruction. Texas Study of secondary
Education, 8(2), 19-22. Sherry, L., Billig, S., Tavalin, F. & Gibson, D. (2000). New insights on technology adoption in communities of
learners. SITE (Society for Information Technology and Teacher Education) International Conference, 1, 2044-2049
Sherry, L., & Gibson, D. (2002). The path to teacher leadership in educational technology. Contemporary Issues in Technology and Teacher Education [Online serial], 2(2).
Smith, S. J., & O'Bannon, B. (1999). Faculty members infusing technology across teacher education: A mentorship model. Teacher Education and Special Education, 22 (2), 123-135.
Spotts, T. H. (1999). Discriminating factors in faculty use of instructional technology in higher education. Educational Technology & Society, 2(4), 92-99.
Sprague, D., Kopfman, K., & Dorsey, S. (1999). Faculty development in the integration of technology in teacher education courses. Journal of Computing in Teacher Education, 14 (2), 24-28.
Stockdill, S. H., & Morehouse, D. L. (1992). Critical factors in the successful adoption of technology: A checklist based on TDC findings. Educational Technology, 32(1), 57-8.
Wakonse Foundation (n. d.). Retrieved April 30, 2004, from http://www.wakonse.org/ Wetzel, K. (1993). Teacher educators’ uses of computing in teaching. Journal of Technology and Teacher
Education, 1 (4), 335-352. Wilson, B., Sherry, L., Dobrovolny, J., Batty, M., & Ryder, M. (2002). Adoption of learning technologies in
schools and universities. In H. H. Adelsberger, B. Collis, & J. M. Pawlowski (Eds.), Handbook on information technologies for education & training (pp. 293-307). New York: Springer-Verlag.

The Turkish Online Journal of Educational Technology – TOJET January 2005 ISSN: 1303-6521 volume 4 Issue 1
Copyright The Turkish Online Journal of Educational Technology 2002 85
USER SATISFACTION EVALUATION OF AN EDUCATIONAL WEBSITE
Goknur Kaplan Akıllı Middle East Technical University
Author note: Goknur Kaplan Akıllı, Computer Education and Instructional Technology Department, Faculty of Education. Correspondence should be addressed to, Department of Computer Education and Instructional Technologies, Middle East Technical University, İnönü Bulvarı 06531, Ankara/Turkey. e-mail: [email protected]. INTRODUCTION World changes, so do people. From the time that man-computer symbiosis began, both of them have unrecognizably changed. Who could have guessed that the ideas that rooted in 1930s, 1940s and 1960s would blossom as today’s technology. Who could have guessed that, when Nelson (Baecker. et al., 1995) first coined the term ‘hypertext’, it would be the key that opens up gates of the “Wide World of Wonders”? As one can predict, the bricks that are used to build the new fantastic places of this world are very important. That is why what was once shaped in the hands of the designer, is now sculptured according to users. That is why ‘usability’ is now recognized as a vital determining factor in the success of any new computer system or computer-based service (Carvalho, 2001). Since building a website, whether for distribution over the Internet or over an intranet, can and should be viewed as a major software development effort and one of the factors that affect the acceptability of software is its usability, it is obvious that usability does matter. Moreover, educational researchers should not overlook usability testing, if they want to develop educational software that is efficient, effective and satisfactory for the user. For achieving such specific, aims it is worthwhile to know about usability methods, techniques, evaluators, when to apply usability tests, and how to plan and conduct a test, as well as the usability itself. However, this study focuses on one particular aspect of usability, namely, user satisfaction, for an educational website used as a supportive tool for various courses by employing only one specific usability testing technique, a questionnaire. DEFINITION OF TERMS Usability Definition(s) Human-Computer-Interaction (HCI) is the area where usability is planted. Several books or papers about HCI present a definition or characterization of usability. For instance, Hix and Hartson (1993) consider usability as it is related to the interface efficacy and efficiency and to user reaction to the interface. Nielsen (1993) asserts usability as one of the parameters associated with the acceptability of any system. He articulates the acceptability of a computer system as a combination of its social acceptability and its practical acceptability. If the system is socially acceptable, it is necessary to analyze its practical acceptability within categories such as cost, compatibility with existing systems, reliability, etc., as well as the category of usefulness and employs usefulness to define usability. He defines usefulness as the issue of whether the system can be used to achieve some desired goal and further claims that it can be divided in two categories as ‘utility’ (whether the functionality of the system can do what is needed or in an educational hypermedia students learn from using it) and ‘usability’ (how well users can use that functionality). He associates five attributes to usability: easy to learn (learnability), efficient to use (efficiency), easy to remember (memorability), the relevance of prevention of catastrophic errors for applications such as process control or medical applications (few errors), and pleasant to use (satisfaction). Shackel (1990) refers to four aspects of interest in usability testing: effectiveness, learnability (ease of learn), flexibility, and attitude. Rubin (1994) accepts that usability includes one or more of the four factors: usefulness, effectiveness (ease of use), learnability, and attitude (likebility). For Smith and Mayes (1996) usability focuses on three aspects: easy to learn, easy to use and user satisfaction in using the system (cited in Carvalho, 2001). In international standards, usability refers to effectiveness and efficiency to achieve specified goals and users satisfaction. According to Bevan (2001)’s article, "Usability: the extent to which a product can be used by specified users to achieve a specified goals with effectiveness, efficiency and satisfaction in a specified context of use" (ISO 9241-11)(p.536). Moreover, since in the software engineering community the term usability has been more narrowly associated with user interface design, ISO/IEC 9126, developed separately as a software engineering standard, defined usability as one relatively independent contribution to software quality associated with the design and evaluation of the user interface and interaction: “Usability: a set of attributes that bear on the
The Turkish Online Journal of Educational Technology – TOJET January 2005 ISSN: 1303-6521 volume 4 Issue 1
Copyright The Turkish Online Journal of Educational Technology 2002 86
effort needed for use, and on the individual assessment of such use, by a stated or implied set of users (Bevan, 2001, p.537).” Usability testing Methodologies for building usable systems have been introduced and refined over the past fifteen or so years under the discipline of Human-Computer Interaction (HCI). HCI principles include an early and consistent focus on end users and their tasks, empirical measurements of system usage, and iterative development. Much effort has been put into exploring cognitive models of human behavior as it relates to computer usage, and developing guidelines for screen layout and system dialogues. These are predictive endeavors whose purpose is to assist the software developer in the initial task analysis and system design. But, just as comprehensive functional requirements and a detailed design document do not by themselves guarantee that a programmer's final product will be correct, so up-front usability guidelines do not by themselves guarantee a usable end product. In both cases a distinct validation process is required. Usability testing is the process by which the human-computer interaction characteristics of a system are measured, and weaknesses are identified for correction. Such testing can range from rigorously structured to highly informal, from quite expensive to virtually free, and from time-consuming to quick. While the amount of improvement is related to the effort invested in usability testing, all of these approaches lead to better systems. As mentioned above, there are various methods and techniques that are used to test and measure usability. Preece (1993) articulates four usability evaluation methods that imply different types of evaluators, different number of users, and different types of data to be collected. These are expert evaluation (also known as heuristic evaluation), observational evaluation, survey evaluation and experimental evaluation. Table 1 shows the method, techniques and above-mentioned issues: ‘Expert evaluation’, also known as heuristic evaluation, is normally carried out by experienced people in interface design and human factors research who are asked to describe the potential problems they foresee for less experienced users. ‘Observational evaluation’ implies collecting data that provide information about what users do when interacting with educational software. Several data collection techniques may be used. ‘Surveys’ are employed to know users' opinions or to understand their preferences about an existing or potential product through the use of interviews or questionnaires. In ‘experimental evaluation’ an evaluator can manipulate a number of factors associated with the interface and study their effect on user performance.
Table 1 Usability Testing Methods, Techniques and Evaluators (Preece, 1993) Method Techniques Type of Evaluator Expert / Heuristic Walk-through
Questionnaires
Experts
Observation Direct Observation Video recording Software logging Verbal protocols (Think aloud)
Experts / Users
Survey Interviews Questionnaires
Experts / Users
Experimental Software logging Questionnaires Interviews
Experts / Users
Other methods can also be applied such as: focus group, walk-through, paper-and pencil evaluations, usability audit, field studies, and follow-up studies (Rubin, 1994).

The Turkish Online Journal of Educational Technology – TOJET January 2005 ISSN: 1303-6521 volume 4 Issue 1
Copyright The Turkish Online Journal of Educational Technology 2002 87
There are two important points here: Firstly, the researcher should always keep in his or her mind that the selection of a method has to take into account the appropriate techniques for data collection. Secondly, virtually any kind of usability test, whatever method(s) and technique(s) are utilized, will improve the product, as long as its results are fed back to the development group and acted on (Levi & Conrad, 2001). Moreover, the researcher believes that usability testing, like most methodological process improvements, will gain attention and devotees as its benefits emerge through use. User Satisfaction As can be seen from Table 1, the observational, survey and experimental methods imply the presence of users. In addition, users' individual characteristics and differences are important issues for usability. ‘User satisfaction’ is mentioned as preference data represent measures of participant opinion or thought process, whereas user’s ‘performance data’ correspond to measures of participant behavior, focusing on aspects such as ‘efficiency and efficacy of use.’ User satisfaction includes participant rankings, answers to questions, and so forth. Rubin (1994) points out some aspects to measure, for example, usefulness of the product, how well product matched expectations, ease of use overall, ease of learning overall, ease of set up and installation, ease of accessibility, usefulness of the index, table of contents, help, graphics, and so on. User satisfaction can also be measured through a comparison between two products or two versions of the same product. There are several tests for evaluating the user satisfaction. Examples of these are SUMI (Software Usability Measurement Inventory) and QUIS (Questionnaire for User Interface Satisfaction) (Kirakowski, 1996). More recently and due to the rapidly changing patterns and technology of computing today, two new questionnaires are being developed, MUMMS (Measuring the Usability of Multi-Media) to assess multimedia software and WAMMI (Website Analysis and Measurement Inventory) to assess web sites (Levi & Conrad, 2001). PURPOSE OF THE STUDY The researcher aimed to find out whether eighth semester undergraduate students of Computer Education and Instructional Technologies (CEIT) Department at the Middle East Technical University (METU) Ankara, Turkey, are satisfied with the website that is used as a supportive tool for a traditional classroom. Based on the findings from this study researcher hopes to provide web interface designers with some empirical support, especially about the powerful and weak attributes, in case of designing a website with similar facilities and properties. Research Questions and Subquestions The study addressed the following research questions related to students’ use of website of the course as a supportive tool. 1. How are the overall reaction of users towards the website? 1.1 To what extend are they impressed by the website? 1.2 To what extend are they satisfied with the website? 1.3 To what extend are they stimulated by the website? 1.4 Is the website easy to use for them? 1.5 Do they perceive website as ‘powerful’? 1.6 Do they find the website flexible? 1.7 Which of the duples of the above-mentioned overall reaction issues are users more concerned with? 1.8 Are there any relationships among these properties of the website? METHOD Procedure Students enrolled in “CEIT 419 Internet for Teachers” undergraduate course in the Computer Education and Instructional Technologies (CEIT) Department at the Middle East Technical University (METU), Ankara, Turkey, were invited to participate in a study designed to understand the user satisfaction levels of a website used as a supportive tool for a course in a traditional classroom. The researcher administered questionnaire during two hours on the ninth week of the semester due to the nature of the questionnaire, since the questionnaire is typically offered to users after they have completed a session of work with a particular system or program. Students were informed verbally and briefly on the research topic and the questionnaire. Participation of the students was voluntary since confidentiality was guaranteed (i.e., students did not place their name on any of the materials in the study), and by returning the survey they were giving their informed consent to allow the researcher to use their data as part of the study.

The Turkish Online Journal of Educational Technology – TOJET January 2005 ISSN: 1303-6521 volume 4 Issue 1
Copyright The Turkish Online Journal of Educational Technology 2002 88
Participants Participants consisted of 33 out of 37 (30% female, 70% male) students enrolled in “CEIT 419 Internet for Teachers” undergraduate course of CEIT department at METU. Ages of the participants ranged from 20 to 24 with a mean age of 22 (SD =.92). Table 2 illustrates the participants’ profile, that includes their experience with the website, such as duration of time they are working, average time that they spend working; and their past experiences, such as number of operating systems that they worked with. Figure 1 shows the frequencies of various devices, software and systems that participants have used or been familiar with. Materials Researcher employed the Questionnaire for User Interaction Satisfaction (QUIS) based on OAI (Object-Action Interface) model, developed by Shneiderman in the Human-Computer Interaction Laboratory at the University of Maryland and refined by Norman and Chin (Schneiderman, 1998). Since the evaluation of a system's accuracy is fairly straightforward, the assessment of the user's satisfaction with the human-computer interface is a subjective and complex question, the Questionnaire for User Interaction Satisfaction (QUIS) was created to gauge the satisfaction aspect of software usability in a standard, reliable, and valid way. The QUIS was first implemented as a standard paper and pencil form using a nine point Likert scale (Chin, Diehl, & Norman, 1988).
Table 2 Participants’ profiles System Experience Duration of time they are working Frequency Percentile
1 hour to less than 1 day 1 3,0 1 hour to less than 1 day 1 3,0 1 day to less than 1 week 3 9,1 1 week to less than 1 month 1 3,0 1 month to less than 6 months 24 72,7 6 months to less than 1 year 1 3,0 3 years or more 3 9,1 Average time spent on the system per week less than one hour 4 12,5 one to less than 4 hours 23 71,9 1 day to less than 1 week 5 15,6 Past Experience Number of Previously Worked Operating Systems 1 6 18,2 2 13 39,4 3-4 11 33,3 5-6 2 6,1
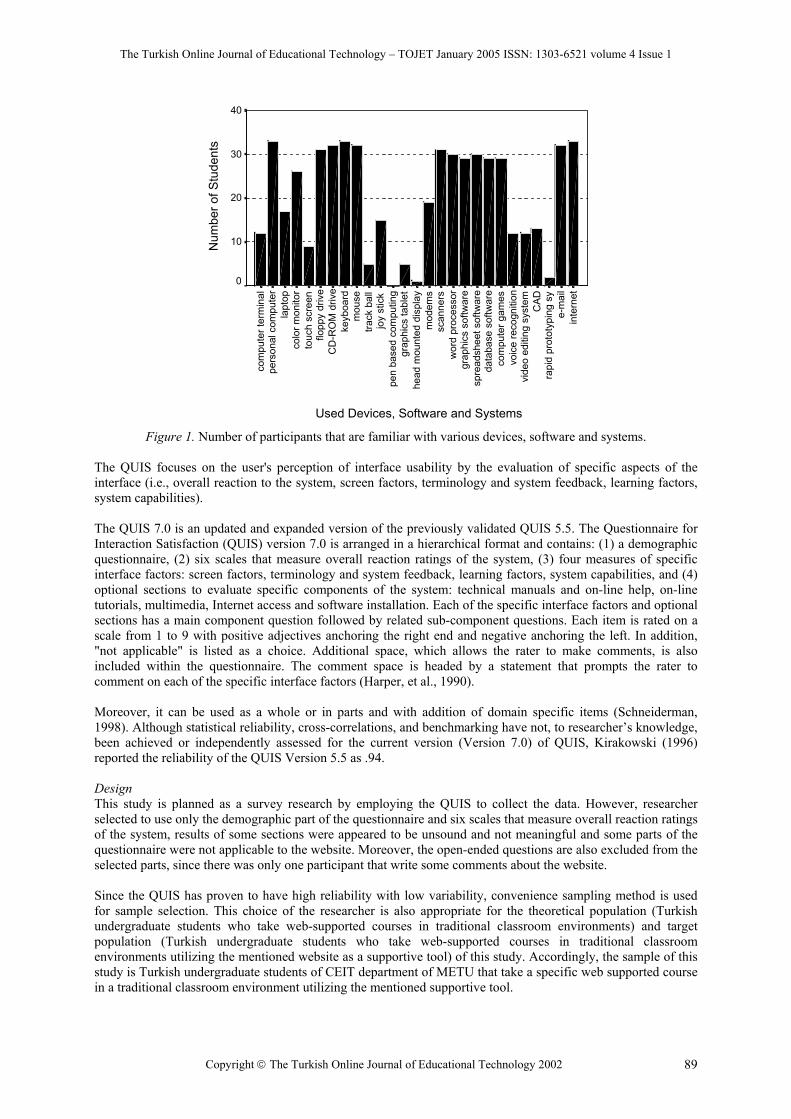
The Turkish Online Journal of Educational Technology – TOJET January 2005 ISSN: 1303-6521 volume 4 Issue 1
Copyright The Turkish Online Journal of Educational Technology 2002 89
Used Devices, Software and Systems
inte
rnet
e-m
ail
rapi
d pr
otot
ypin
g sy
CA
Dvi
deo
editi
ng s
yste
mvo
ice
reco
gniti
onco
mpu
ter g
ames
data
base
sof
twar
esp
read
shee
t sof
twar
egr
aphi
cs s
oftw
are
wor
d pr
oces
sor
scan
ners
mod
ems
head
mou
nted
dis
play
grap
hics
tabl
etpe
n ba
sed
com
putin
gjo
y st
ick
track
bal
lm
ouse
keyb
oard
CD
-RO
M d
rive
flopp
y dr
ive
touc
h sc
reen
colo
r mon
itor
lapt
oppe
rson
al c
ompu
ter
com
pute
r ter
min
al
Num
ber o
f Stu
dent
s
40
30
20
10
0
Figure 1. Number of participants that are familiar with various devices, software and systems.
The QUIS focuses on the user's perception of interface usability by the evaluation of specific aspects of the interface (i.e., overall reaction to the system, screen factors, terminology and system feedback, learning factors, system capabilities). The QUIS 7.0 is an updated and expanded version of the previously validated QUIS 5.5. The Questionnaire for Interaction Satisfaction (QUIS) version 7.0 is arranged in a hierarchical format and contains: (1) a demographic questionnaire, (2) six scales that measure overall reaction ratings of the system, (3) four measures of specific interface factors: screen factors, terminology and system feedback, learning factors, system capabilities, and (4) optional sections to evaluate specific components of the system: technical manuals and on-line help, on-line tutorials, multimedia, Internet access and software installation. Each of the specific interface factors and optional sections has a main component question followed by related sub-component questions. Each item is rated on a scale from 1 to 9 with positive adjectives anchoring the right end and negative anchoring the left. In addition, "not applicable" is listed as a choice. Additional space, which allows the rater to make comments, is also included within the questionnaire. The comment space is headed by a statement that prompts the rater to comment on each of the specific interface factors (Harper, et al., 1990). Moreover, it can be used as a whole or in parts and with addition of domain specific items (Schneiderman, 1998). Although statistical reliability, cross-correlations, and benchmarking have not, to researcher’s knowledge, been achieved or independently assessed for the current version (Version 7.0) of QUIS, Kirakowski (1996) reported the reliability of the QUIS Version 5.5 as .94. Design This study is planned as a survey research by employing the QUIS to collect the data. However, researcher selected to use only the demographic part of the questionnaire and six scales that measure overall reaction ratings of the system, results of some sections were appeared to be unsound and not meaningful and some parts of the questionnaire were not applicable to the website. Moreover, the open-ended questions are also excluded from the selected parts, since there was only one participant that write some comments about the website. Since the QUIS has proven to have high reliability with low variability, convenience sampling method is used for sample selection. This choice of the researcher is also appropriate for the theoretical population (Turkish undergraduate students who take web-supported courses in traditional classroom environments) and target population (Turkish undergraduate students who take web-supported courses in traditional classroom environments utilizing the mentioned website as a supportive tool) of this study. Accordingly, the sample of this study is Turkish undergraduate students of CEIT department of METU that take a specific web supported course in a traditional classroom environment utilizing the mentioned supportive tool.

The Turkish Online Journal of Educational Technology – TOJET January 2005 ISSN: 1303-6521 volume 4 Issue 1
Copyright The Turkish Online Journal of Educational Technology 2002 90
The study has various dependent variables. For analysis, six scales that measure overall reaction ratings of the system, are assigned as dependent variables. Moreover, before the statistical analysis was conducted by employing the Statistical Package for the Social Sciences (SPSS), the researcher utilized SPSS to have the missing values completed. DISCUSSION Results and Analysis of Results Due to the nature of this study less emphasis will be placed upon inferential statistics, as there is no system to which the current system is being compared. Simple error bar charts were created to display a confidence interval around each item mean related to ‘overall reaction rating part of the QUIS in order to determine its reliability, since the statistical reliability, cross-correlations, and benchmarking have not, to researcher’s knowledge, been achieved or independently assessed for the current version (Version 7.0) of QUIS. Moreover, these bar charts also indicated whether the mean of an item is significantly above or below the criterion, selected as the overall mean of the related part. Paired samples t tests were conducted for items that measure users’ overall reaction to evaluate the degree of the users’ concern about impressiveness of the site, satisfaction, the feeling of being stimulated, ease of use, perceived powerfulness and the flexibility of the website. Overall Reaction Ratings. Two of the six scales that measure overall reaction to the system were rated lower than the mean response (M = 6.17). These factors were website’s stimulating attributes and flexibility indicating that these areas are subject to additional scrutiny. The other four overall ratings, namely, impressiveness, satisfaction, ease of use and perceived powerfulness of the website were not less than the user response level. Depending on the above mentioned results the researcher concluded that users found the website somewhat rigid and lack of stimuli. The most outstanding property of the system was the ease of use with the highest mean (M =6.52). Table 3 presents the means and the standard deviations of each item in overall reaction rating part.
Table 3 Means and Standard Deviations for Items in Overall Reaction 3. Overall Reaction M SD Item 3.1. Impression 6,21 1,19 Item 3.2. Satisfaction 6,29 1,33 Item 3.3. Being stimulated 6,03 1,40 Item 3.4. Ease of use 6,52 1,97 Item 3.5. Perceived‘powerfulness’
6,26 1,82
Item 3.6. Flexibility 5,68 1,72
A simple error bar chart was created to determine the reliability of the items in overall reaction rating part. The plotted 95% confidence interval that included the overall mean of 6.17 within its boundaries indicated that the means of each particular item was not significantly different from 6.17 at the .05 level of significance (Figure 2). Distinct paired samples t tests were conducted to evaluate the degree of users’ concern for each duple of impressiveness of the website, satisfaction of the users, the feeling of being stimulated, ease of use, perceived powerfulness and the flexibility of the website. The results indicated that the mean concern for satisfaction (M = 6.29, SD = 1.33), mean concern for ease of use (M = 6.52, SD = 1.97), and mean concern for perceived powerfulness (M = 6.26, SD = 1.82) were significantly greater than the mean concern for flexibility (M = 5.68, SD = 1.72), t(32) = 2.11, p = .04; t(32) = 2.62, p = .01; t(32) = 2.49, p = .02 respectively. The standardized effect size indexes (d) were .37, .46 and .43, respectively, indicating medium values of effect size. The mean difference was .61 between the two 9 point Likert ratings for satisfaction and flexibility; .83 points between the two 9 point Likert ratings for ease of use and flexibility; and .58 points between the two 9 point Likert ratings for perceived powerfulness and flexibility. Let alone considerable overlapping, the distributions of ease of use and perceived powerfulness encompassed the distribution of flexibility, whereas vice versa was true for the distributions of satisfaction and flexibility, as shown in Figure 3.

The Turkish Online Journal of Educational Technology – TOJET January 2005 ISSN: 1303-6521 volume 4 Issue 1
Copyright The Turkish Online Journal of Educational Technology 2002 91
Item 3.6Item 3.5Item 3.4Item 3.3Item 3.2Item 3.1
9
8
7
6
5
4
3
2
1
0
Figure 2. Distributions of six scales that measure overall reaction ratings of the system in a 95% confidence interval.
FlexibilityPerceived 'power'Ease of UseSatisfaction
10
8
6
4
2
0
Figure 3. Boxplots of satisfaction, ease of use, perceived powerfulness and the flexibility ratings. LIMITATIONS AND DELIMITATIONS OF THE STUDY The use of convenience sampling method and homogeneous structure of the sample made the obtained results difficult to generalize to a larger population. Additionally, participants were familiar to various kinds of researches, which might give birth to threads to internal validity of the study due to ‘subject characteristics’ and ‘location.’ Nevertheless, conducting the analysis of data two weeks after the collection and avoiding leading instructions or questions kept threads of data collector characteristics and data collector bias away. Another limitation was the duration and the course of the study. Time was the biggest limitation to conduct efficiency and effectiveness tasks to complete the usability evaluation of the website. One delimitation of the study was the familiarity of researcher to participants. It would have been better to utilize administers trained for this purpose, but again due to lack of time, this could not have been possible. SUGGESTIONS FOR FURTHER RESEARCH Some suggestions for extending this study might be utilizing the same user satisfaction questionnaire with additional tasks for efficiency and effectiveness to complete the puzzle of the designated website’s usability
The Turkish Online Journal of Educational Technology – TOJET January 2005 ISSN: 1303-6521 volume 4 Issue 1
Copyright The Turkish Online Journal of Educational Technology 2002 92
evaluation. Moreover, a comparative study of the designated website and another educational website, the usability of which was evaluated, might be conducted to diagnose lacking parts of the former. The same study or the extended version may be conducted with larger sample, different groups of users or interfaces designed for different courses. Eventually, another study might be conducted that covers some special challenges of the web, such as wide disparity in connectivity speed, deployment environment which blurs the distinction between the site content and the browser used to access the content, etc. (Levi & Conrad, 2001) to clarify the usability picture of the websites. CONCLUSION The results of the study indicated that the users were initially impressed and satisfied with the website. Additionally, they found the website easy to use and powerful, in spite of the lack of flexibility and stimulating attributes of the website. Moreover, experience of the researcher showed that usability testing is time consuming and demands a meticulous planning. The researcher recognized from the results of this study that there are still many questions, which are unanswered and open to further investigation by researchers and careful consideration by website designers. However, achieved results compensate greatly! REFERENCES Baecker, R. et al. (1995). A Historical and Intellectual Perspective. In Baecker, R., Grudin, J. Buxton, W. and
Greenberg, S. (eds.), Readings in Human-Computer Interaction, Toward the Year 2000, NY: Morgan-Kaufman, 35-47.
Bevan, N. (2001). International Standards for HCI and Usability. International Journal of Human- Computer Studies, 55, p. 533-552.
Carvalho, A. A. A. Usability Testing of Educational Software: Methods Techniques and Evaluators. Retrieved on December 29 2002 from http://www.esev.ipv.pt/3siie/actas/actas/doc15.pdf
Chin, J.P., Diehl, V.A., & Norman, K.L.(1988). Development of an instrument measuring user satisfaction of the human-computer interface. In CHI `88 Conference Proceedings: Human Factors in Computing Systems (New York, 1988), ACM Press, pp. 213-218.
Harper, B., Slaughter L. & Norman K. (1990). Questionnaire administration via the WWW: A validation & reliability study for a user satisfaction questionnaire. Retrieved on December 22 2002 from http://www.lap.umd.edu/webnet/paper.html
Hix, D. & Hartson, H.R. (1993). Developing User Interfaces: Ensuring Usability Through Product and Process. New York: John Wiley & Sons.
Human Computer Interaction Laboratories of University of Maryland. New System Evaluates Human-Computer Interface. Retrieved on December 22 2002 from http://lap.umd.edu/quis/publications/newspaper1.html
Kirakowski, J. (1996) The Use of Questionnaire Methods for Usability Assesment. Retrieved on December 30 2002 from http://www.ucc.ie/hfrg/questionnaires/sumi/sumipapp.htm
Levi M. D. & Conrad F. G. (2001). Usability Testing of World Wide Web Sites. Retrieved on January 2 2002 from http://www.bls.gov/ore/htm_papers/st9601050.htm
Nielsen, J. (1993). What is Usability? In 'Usability Engineering', New Jersey. Academic Press. Preece, J. (1993). A Guide to Usability: Human Factors in Computing. Addison Wesley, the Open University. Rubin, J. (1994). Handbook of Usability Testing. New York: John Wiley and Sons. Schneiderman, B. (1998). Designing the User Interface. 3rd Edition. Addison Wesley Inc., California. Shackel, B. (1991). Usability - Context, Framework, Definition, Design and Evaluation. In Shackel, B. and S.
Richardson (eds.), 'Human Factors for Informatics Usability,' Cambridge: Cambridge University Press.
The Turkish Online Journal of Educational Technology – TOJET January 2005 ISSN: 1303-6521 volume 4 Issue 1
Copyright The Turkish Online Journal of Educational Technology 2002 93
FEN BİLGİSİ DERSİNDE EĞİTİM TEKNOLOJİSİ KULLANILMASINA İLİŞKİN ÖĞRENCİ GÖRÜŞLERİ
Araş. Gör. Ercan AKPINAR, Araş. Gör. Hilal AKTAMIŞ, Prof. Dr. Ömer ERGİN
Dokuz Eylül Üniversitesi, Buca Eğitim Fakültesi, İlköğretim Bölümü Fen Bilgisi Eğitimi A. B. D.
ÖZET Bilgi ve teknoloji çağını yaşadığımız günümüzde öğrencilerin bilgiye ulaşma ve problem çözme becerilerini kazanmaları önemlidir. Bunun eğitim teknolojisinin derslerde ağırlıklı bir şekilde kullanılması ile gerçekleşeceği düşünülmektedir. Öğretim ortamları hazırlanmasında, öğretim materyallerinin çeşitlendirilmesinde eğitim teknolojisinin kullanılması önemli bir yer tutar. Bu bağlamda, 2002 yılında uygulanmaya başlanan Yeni (2001) Fen Bilgisi programı öğrencilerin yaparak-yaşayarak ve zihinsel becerilerini kullanarak bilgiye ulaşmalarına yardımcı olacak öğretim ortamlarının hazırlanmasını ve öğrencilerin kullanımına sunulmasını önermektedir. Bu çalışmada, İlköğretim Fen Bilgisi dersinde teknoloji kullanımına ilişkin (öğrenmeye destek, ilgiyi arttırma, araştırma imkanlarını genişletme, bilgisayarın öğrenmeye etkisi ve başarıyı arttırma) öğrenci görüşleri alınmış ve öğretmenlerin eğitim teknolojisi araç-gereçlerini Fen Bilgisi derslerinde kullanma sıklıkları belirlenmeye çalışılmıştır. Bu amaç doğrultusunda 26 maddelik Fen dersinde teknoloji kullanımı ve 12 maddelik öğretmenlerin eğitim teknolojisi kullanma sıklığı ile ilgili anket özel okul ve devlet okulundaki 8. sınıfa devam eden 485 öğrenciye uygulanmıştır. Sonuç olarak, özel ve devlet okulları arasında anlamlı farklılıklar bulunmuş ve okul türlerine göre teknolojinin kullanım sıklığı hakkındaki öğrenci görüşleri arasında da anlamlı bir fark olduğu görülmüştür. Anahtar Kelimeler: Eğitim Teknolojisi, Fen Bilgisi Öğretimi. ABSTRACT In the information and technology century, it is important to have the skills of reaching the knowledge and problem solving. It is believed that this could be achieved by using educational technology as a teaching material. Using educational technology has an important role for preparing teaching medium in terms of using various teaching techniques. In this context, New Science Curriculum (2001), it has been suggested that, teaching methods which help students to construct their own knowledge by doing, living and using their cognitive skills should be used. In this study, it is aimed to find the students ideas about using technology in primary science lessons (in terms of learning support, motivation, improving research facilities, affects of computer and increasing success) and it was also aimed to determine the using frequency of educational technology equipment of science teachers as a teaching materials. The 26 item questionnaire about using technology and 12 items questionnaire about frequency of using educational technology were filled in by 485 class 8 students from some private and public schools. As a result, there is a significant difference between students who continue private and public schools and there is a significant difference between students’ opinions about frequency of usage of technology according to sort of school. Key Words: Education Technology, Science Teaching 1.GİRİŞ İletişimde, bilgi alış verişinde ve teknolojide küresel boyutlarda çok hızlı değişimin olduğu, bilginin katlanarak arttığı ve her geçen gün yeni teknolojilerin üretildiği ve ülkeler arasında çok yönlü rekabet ortamının olduğu bir çağda yaşıyoruz (MEB:2000;1001). Bu çağda ülkeler, insanlarının daha mutlu bir yaşam sürmeleri ve diğer ülkelerle yarışabilmeleri için, eğitimin en önemli unsur olduğunu kavramışlar ve bu alanda birbirleriyle yarışmaktadırlar. Bu yarışta ülkemizin ön sıralarda yer alması, düşünen, araştıran, problem çözebilen, yaratıcı ve üretken, teknoloji ve bilimdeki gelişmelere ve yeniliklere ayak uydurabilen ve yaşam boyu öğrenen bireylerin yetiştirilmesiyle sağlanabilir. Bu bireylerin yetiştirilmesinde bilindiği gibi ilköğretim temel teşkil etmektedir. 6-14 yaşları çocukların en meraklı, en araştırıcı olduğu yaşlardır ve çocukların en çok merak ettikleri, en çok soru sordukları konular fen konularıdır (Gürdal,1992:185). İlköğretimde fen konuları yaparak yaşayarak öğrenildiği için hem öğrenci hem de öğretmenler için, fen bilgisi dersi en çok ilgi çeken, merak ve öğrenme isteği uyandıran derslerin başında gelir (Howe, Jones,1998:2). Fen bilgisi dersinde öğretmen, öğrencilerin okulun ve çevrenin olanaklarına göre eğitsel değeri olan her türlü araç-gereç ve etkinliği kullanarak ünite içeriğini ve kazanımlarını öğrencilere edindirmelidir. Bunun için, çağdaş öğretim yöntem ve teknikleri ile birlikte öğrencilerin yaratıcılıklarını ortaya çıkaracak ve bilimsel yöntemi kullanmaya fırsat tanıyacak, yeterli düzeyde kaynak, araç-gereç, deney, gezi-gözlem, araştırma, inceleme, proje ve uygulamalardan yararlanılmalıdır. Ayrıca öğrenciler, internet dahil her türlü teknolojik kaynaklardan fen ile ilgili bilgilere
The Turkish Online Journal of Educational Technology – TOJET January 2005 ISSN: 1303-6521 volume 4 Issue 1
Copyright The Turkish Online Journal of Educational Technology 2002 94
ulaşmak için gerekli becerilerle donanmalı, bunun gerekliliğine inanmalı ve çalışmalarında daha değişik kaynaklardan etkin olarak yararlanmalıdır (MEB,2000:1012). Eğitim Teknolojisinin “Değişik bilimlerin verilerini, özel hedefler, yöntem, araç-gereç, ölçme, değerlendirme gibi eğitimin geniş alanlarında uygulamaya koyan, uygun maddi ve manevi ortamlarda insan gücünü en iyi şekilde kullanmasını, eğitimin sorunlarının çözülmesini, kalitenin yükseltilmesini sağlayan bir sistemler bütünü” olarak (Rıza,2000) tanımladığımızda, yukarıda belirttiğimiz özelliklerin tamamının eğitim teknolojisiyle ilgili olduğunu söyleyebiliriz. Fen bilgisi derslerinde belirtilen genel ve özel amaçlara varabilmek için eğitim teknolojisinin her türlü öğesinin fen derslerinde verimli ve etkili bir şekilde kullanılması gerekmektedir. Fen bilgisi dersinde yakın çevreden elde edilen araç-gereçlerin, çeşitli öğretim materyallerinin (maket, model, vb.) ve teknolojinin kullanılması, hem öğrencilerin öğrendikleri bilgilerin günlük hayatla ilişkisini kurmalarına yardımcı olacak, hem de teknolojiyi öğrenme imkanı sağlayacaktır. Eğitim teknolojisinin fen derslerinde çok yönlü kullanılması ile birlikte öğrencilerin fene karşı var olan ilgi ve merakları daha da artacak ve birçoğu birer buluşçu olmaya yönelik olumlu tutum sergilemeye başlayacaklardır. Fen eğitimi, olabildiğince deneye dayalı öğrenme şeklinde verilmezse, öğrencilerin canlıyı, fiziksel ve kimyasal olayları, hayatın biyolojik temelini anlamaları zor olacaktır. Bugün olduğu gibi biyoloji, hatta kimya ve fizik dersleri öğrenciler tarafından ezber ders olarak algılanacaktır (Çakmak,1999:117). Özellikle ilköğretim çağındaki öğrencilerin soyut kavramları öğrenmede zorlandıkları düşünüldüğünde, bu kavramların öğrenci seviyesine uygun bir şekilde somutlaştırılmasında ve adeta canlı bir şekilde sunulmasında, derinlemesine öğrenilmesinde ve tekrar tekrar olayların gözlemlenmesinde eğitim teknolojisi araçları ve bu araçlardan özellikle bilgisayarlar çok önemli bir rol oynamaktadırlar. Bununla birlikte bilgisayarlar, fen derslerinde laboratuvarda yapılması tehlikeli deneylerin yapılmasında, verilerin doğru, hızlı şekilde elde edilmesinde, işlenmesinde ve anında geri bildirim sağlamada da önemli bir rol oynamaktadır. Cartier ve Stewart, bilgisayar simulasyonları ve araçlarının, öğrencilere birer bilim adamı gibi düşünmelerine olanak sağlayabileceğini belirtmişlerdir (Soderberg, Price, 2003:36). Ayrıca kaynak çeşitliliği, kaynaklara hızlı erişim, bilgi paylaşımı gibi durumlarda internet ve multimedya araçları çok önemli bir yer tutmaktadır. Eğitim teknolojisinin değişik boyutlarının öğretimde uygulanması ile ilgili yapılan araştırmalar, eğitim teknolojisi uygulamalarının öğrenci başarılarında çok yönlü olumlu bir etkiye sahip olduğunu göstermektedir. Bununla ilgili olarak; çeşitli öğretim materyallerinin (oyun, analoji, örnek olay, deney, model) (Aktamış, Akpınar, Ergin, 2002), model yoluyla öğretimin (Şahin, Öztuna ve Sağlamer, 2001), bilgisayar destekli materyallerin (Akdeniz ve Yiğit, 2001; Kibos, 2002; Yumuşak ve Aycan, 2002) öğrencilerin başarılarını arttırdığı tespit edilmiştir. Öğretim ortamını, öğrencilerin yaparak-yaşayarak bilgiye ulaşmalarına yardımcı olacak şekilde öğrenci ihtiyaçlarına uygun hale getirmek, kaynak çeşitliliğini ve bunlara ulaşımı kolaylaştırmak, ilk elden bilgi elde etmeye olanak sağlamak, bilgileri değerlendirmek ve teknolojiden yararlanan yaratıcı bireyler yetiştirmek için eğitim teknolojisinin bir çok öğesinin fen bilgisi derslerinde kullanılması önemlidir. Aynı zamanda öğrencilerin, olay ve nesneleri çok yönlü algılaması, yorumlaması, yaratıcı özelliklerinin gelişmesi ve derse olan ilgilerinin canlı tutulması için eğitim teknolojisi araç gereçlerinden fen derslerinde önemli ölçüde yararlanılması gerekmektedir. Bu Araştırmanın amacı, ilköğretim 8. sınıf öğrencilerinin fen bilgisi dersinde eğitim teknolojisi kullanılmasına ilişkin görüşlerini belirlemek ve öğrenci görüşlerine göre fen bilgisi öğretmenlerinin eğitim teknolojisi araç-gereçlerini kullanma sıklıklarını ortaya çıkarmaktır. 1.1. ARAŞTIRMANIN PROBLEMİ Fen bilgisi öğretmenlerinin araç gereç kullanma sıklıklarına ve eğitim teknolojisine ilişkin öğrenci görüşleri nelerdir? 1.Alt Problem: Fen bilgisi öğretmenlerinin araç-gereç kullanma sıklıklarına ilişkin öğrenci görüşleri okul türüne göre anlamlı bir farklılık göstermekte midir? 2.Alt Problem: Öğrencilerin, fen bilgisi derslerinde eğitim teknolojisi kullanılmasının öğrenmeye destek olmasına yönelik görüşleri arasında okul türüne göre anlamlı farklılıklar var mıdır? 3. Alt Problem:
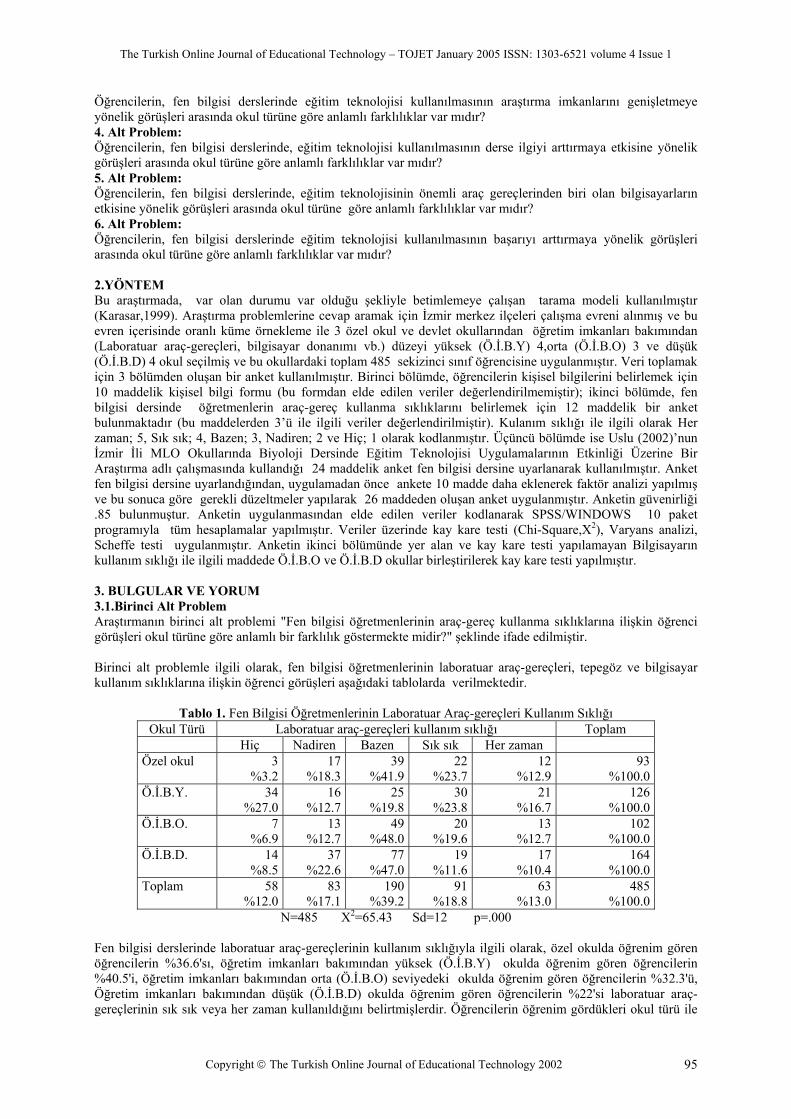
The Turkish Online Journal of Educational Technology – TOJET January 2005 ISSN: 1303-6521 volume 4 Issue 1
Copyright The Turkish Online Journal of Educational Technology 2002 95
Öğrencilerin, fen bilgisi derslerinde eğitim teknolojisi kullanılmasının araştırma imkanlarını genişletmeye yönelik görüşleri arasında okul türüne göre anlamlı farklılıklar var mıdır? 4. Alt Problem: Öğrencilerin, fen bilgisi derslerinde, eğitim teknolojisi kullanılmasının derse ilgiyi arttırmaya etkisine yönelik görüşleri arasında okul türüne göre anlamlı farklılıklar var mıdır? 5. Alt Problem: Öğrencilerin, fen bilgisi derslerinde, eğitim teknolojisinin önemli araç gereçlerinden biri olan bilgisayarların etkisine yönelik görüşleri arasında okul türüne göre anlamlı farklılıklar var mıdır? 6. Alt Problem: Öğrencilerin, fen bilgisi derslerinde eğitim teknolojisi kullanılmasının başarıyı arttırmaya yönelik görüşleri arasında okul türüne göre anlamlı farklılıklar var mıdır? 2.YÖNTEM Bu araştırmada, var olan durumu var olduğu şekliyle betimlemeye çalışan tarama modeli kullanılmıştır (Karasar,1999). Araştırma problemlerine cevap aramak için İzmir merkez ilçeleri çalışma evreni alınmış ve bu evren içerisinde oranlı küme örnekleme ile 3 özel okul ve devlet okullarından öğretim imkanları bakımından (Laboratuar araç-gereçleri, bilgisayar donanımı vb.) düzeyi yüksek (Ö.İ.B.Y) 4,orta (Ö.İ.B.O) 3 ve düşük (Ö.İ.B.D) 4 okul seçilmiş ve bu okullardaki toplam 485 sekizinci sınıf öğrencisine uygulanmıştır. Veri toplamak için 3 bölümden oluşan bir anket kullanılmıştır. Birinci bölümde, öğrencilerin kişisel bilgilerini belirlemek için 10 maddelik kişisel bilgi formu (bu formdan elde edilen veriler değerlendirilmemiştir); ikinci bölümde, fen bilgisi dersinde öğretmenlerin araç-gereç kullanma sıklıklarını belirlemek için 12 maddelik bir anket bulunmaktadır (bu maddelerden 3’ü ile ilgili veriler değerlendirilmiştir). Kulanım sıklığı ile ilgili olarak Her zaman; 5, Sık sık; 4, Bazen; 3, Nadiren; 2 ve Hiç; 1 olarak kodlanmıştır. Üçüncü bölümde ise Uslu (2002)’nun İzmir İli MLO Okullarında Biyoloji Dersinde Eğitim Teknolojisi Uygulamalarının Etkinliği Üzerine Bir Araştırma adlı çalışmasında kullandığı 24 maddelik anket fen bilgisi dersine uyarlanarak kullanılmıştır. Anket fen bilgisi dersine uyarlandığından, uygulamadan önce ankete 10 madde daha eklenerek faktör analizi yapılmış ve bu sonuca göre gerekli düzeltmeler yapılarak 26 maddeden oluşan anket uygulanmıştır. Anketin güvenirliği .85 bulunmuştur. Anketin uygulanmasından elde edilen veriler kodlanarak SPSS/WINDOWS 10 paket programıyla tüm hesaplamalar yapılmıştır. Veriler üzerinde kay kare testi (Chi-Square,X2), Varyans analizi, Scheffe testi uygulanmıştır. Anketin ikinci bölümünde yer alan ve kay kare testi yapılamayan Bilgisayarın kullanım sıklığı ile ilgili maddede Ö.İ.B.O ve Ö.İ.B.D okullar birleştirilerek kay kare testi yapılmıştır. 3. BULGULAR VE YORUM 3.1.Birinci Alt Problem Araştırmanın birinci alt problemi "Fen bilgisi öğretmenlerinin araç-gereç kullanma sıklıklarına ilişkin öğrenci görüşleri okul türüne göre anlamlı bir farklılık göstermekte midir?" şeklinde ifade edilmiştir. Birinci alt problemle ilgili olarak, fen bilgisi öğretmenlerinin laboratuar araç-gereçleri, tepegöz ve bilgisayar kullanım sıklıklarına ilişkin öğrenci görüşleri aşağıdaki tablolarda verilmektedir.
Tablo 1. Fen Bilgisi Öğretmenlerinin Laboratuar Araç-gereçleri Kullanım Sıklığı Okul Türü Laboratuar araç-gereçleri kullanım sıklığı Toplam
Hiç Nadiren Bazen Sık sık Her zaman Özel okul
3 %3.2
17%18.3
39%41.9
22%23.7
12%12.9
93 %100.0
Ö.İ.B.Y. 34 %27.0
16%12.7
25%19.8
30%23.8
21%16.7
126 %100.0
Ö.İ.B.O. 7 %6.9
13%12.7
49%48.0
20%19.6
13%12.7
102 %100.0
Ö.İ.B.D. 14 %8.5
37%22.6
77%47.0
19%11.6
17%10.4
164 %100.0
Toplam
58 %12.0
83%17.1
190%39.2
91%18.8
63%13.0
485 %100.0
N=485 X2=65.43 Sd=12 p=.000 Fen bilgisi derslerinde laboratuar araç-gereçlerinin kullanım sıklığıyla ilgili olarak, özel okulda öğrenim gören öğrencilerin %36.6'sı, öğretim imkanları bakımından yüksek (Ö.İ.B.Y) okulda öğrenim gören öğrencilerin %40.5'i, öğretim imkanları bakımından orta (Ö.İ.B.O) seviyedeki okulda öğrenim gören öğrencilerin %32.3'ü, Öğretim imkanları bakımından düşük (Ö.İ.B.D) okulda öğrenim gören öğrencilerin %22'si laboratuar araç-gereçlerinin sık sık veya her zaman kullanıldığını belirtmişlerdir. Öğrencilerin öğrenim gördükleri okul türü ile
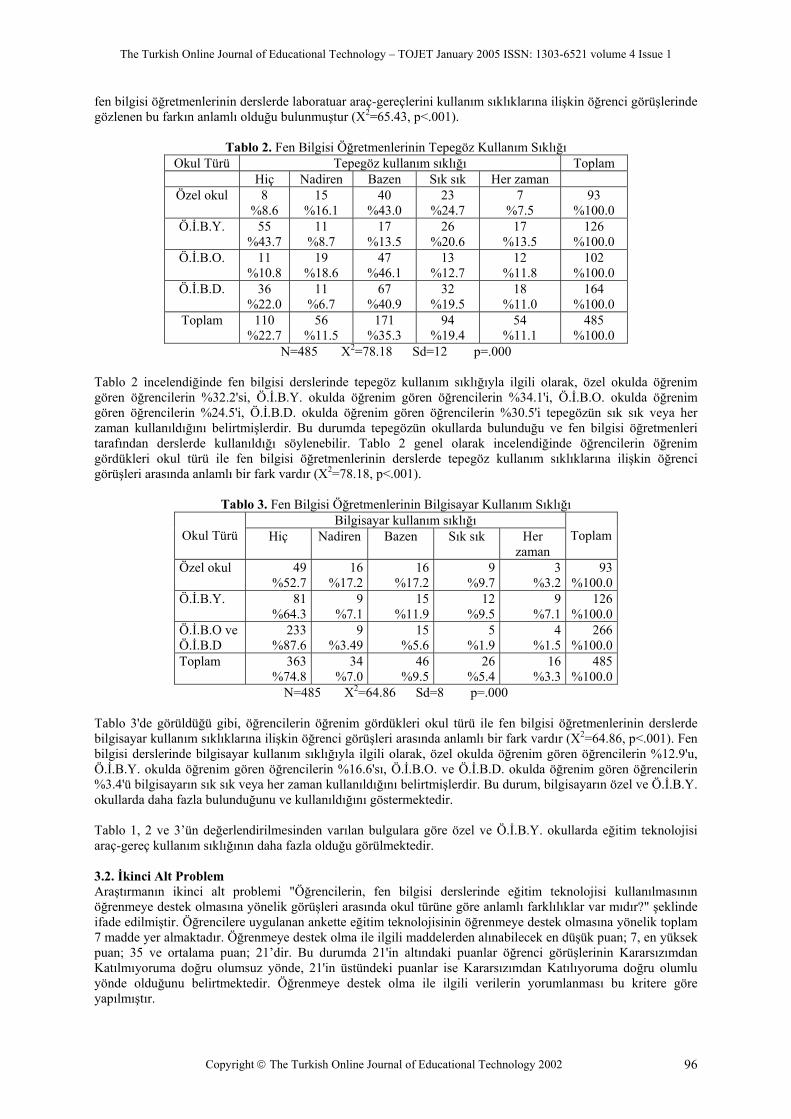
The Turkish Online Journal of Educational Technology – TOJET January 2005 ISSN: 1303-6521 volume 4 Issue 1
Copyright The Turkish Online Journal of Educational Technology 2002 96
fen bilgisi öğretmenlerinin derslerde laboratuar araç-gereçlerini kullanım sıklıklarına ilişkin öğrenci görüşlerinde gözlenen bu farkın anlamlı olduğu bulunmuştur (X2=65.43, p<.001).
Tablo 2. Fen Bilgisi Öğretmenlerinin Tepegöz Kullanım Sıklığı Okul Türü Tepegöz kullanım sıklığı Toplam
Hiç Nadiren Bazen Sık sık Her zaman Özel okul
8
%8.6 15
%16.1 40
%43.0 23
%24.7 7
%7.5 93
%100.0 Ö.İ.B.Y. 55
%43.7 11
%8.7 17
%13.5 26
%20.6 17
%13.5 126
%100.0 Ö.İ.B.O. 11
%10.8 19
%18.6 47
%46.1 13
%12.7 12
%11.8 102
%100.0 Ö.İ.B.D. 36
%22.0 11
%6.7 67
%40.9 32
%19.5 18
%11.0 164
%100.0 Toplam
110
%22.7 56
%11.5 171
%35.3 94
%19.4 54
%11.1 485
%100.0 N=485 X2=78.18 Sd=12 p=.000
Tablo 2 incelendiğinde fen bilgisi derslerinde tepegöz kullanım sıklığıyla ilgili olarak, özel okulda öğrenim gören öğrencilerin %32.2'si, Ö.İ.B.Y. okulda öğrenim gören öğrencilerin %34.1'i, Ö.İ.B.O. okulda öğrenim gören öğrencilerin %24.5'i, Ö.İ.B.D. okulda öğrenim gören öğrencilerin %30.5'i tepegözün sık sık veya her zaman kullanıldığını belirtmişlerdir. Bu durumda tepegözün okullarda bulunduğu ve fen bilgisi öğretmenleri tarafından derslerde kullanıldığı söylenebilir. Tablo 2 genel olarak incelendiğinde öğrencilerin öğrenim gördükleri okul türü ile fen bilgisi öğretmenlerinin derslerde tepegöz kullanım sıklıklarına ilişkin öğrenci görüşleri arasında anlamlı bir fark vardır (X2=78.18, p<.001).
Tablo 3. Fen Bilgisi Öğretmenlerinin Bilgisayar Kullanım Sıklığı Bilgisayar kullanım sıklığı
Okul Türü Hiç Nadiren Bazen Sık sık Her zaman
Toplam
Özel okul
49 %52.7
16%17.2
16%17.2
9%9.7
3 %3.2
93 %100.0
Ö.İ.B.Y. 81 %64.3
9%7.1
15%11.9
12%9.5
9 %7.1
126 %100.0
Ö.İ.B.O ve Ö.İ.B.D
233 %87.6
9%3.49
15%5.6
5%1.9
4 %1.5
266 %100.0
Toplam
363 %74.8
34%7.0
46%9.5
26%5.4
16 %3.3
485 %100.0
N=485 X2=64.86 Sd=8 p=.000 Tablo 3'de görüldüğü gibi, öğrencilerin öğrenim gördükleri okul türü ile fen bilgisi öğretmenlerinin derslerde bilgisayar kullanım sıklıklarına ilişkin öğrenci görüşleri arasında anlamlı bir fark vardır (X2=64.86, p<.001). Fen bilgisi derslerinde bilgisayar kullanım sıklığıyla ilgili olarak, özel okulda öğrenim gören öğrencilerin %12.9'u, Ö.İ.B.Y. okulda öğrenim gören öğrencilerin %16.6'sı, Ö.İ.B.O. ve Ö.İ.B.D. okulda öğrenim gören öğrencilerin %3.4'ü bilgisayarın sık sık veya her zaman kullanıldığını belirtmişlerdir. Bu durum, bilgisayarın özel ve Ö.İ.B.Y. okullarda daha fazla bulunduğunu ve kullanıldığını göstermektedir. Tablo 1, 2 ve 3’ün değerlendirilmesinden varılan bulgulara göre özel ve Ö.İ.B.Y. okullarda eğitim teknolojisi araç-gereç kullanım sıklığının daha fazla olduğu görülmektedir. 3.2. İkinci Alt Problem Araştırmanın ikinci alt problemi "Öğrencilerin, fen bilgisi derslerinde eğitim teknolojisi kullanılmasının öğrenmeye destek olmasına yönelik görüşleri arasında okul türüne göre anlamlı farklılıklar var mıdır?" şeklinde ifade edilmiştir. Öğrencilere uygulanan ankette eğitim teknolojisinin öğrenmeye destek olmasına yönelik toplam 7 madde yer almaktadır. Öğrenmeye destek olma ile ilgili maddelerden alınabilecek en düşük puan; 7, en yüksek puan; 35 ve ortalama puan; 21’dir. Bu durumda 21'in altındaki puanlar öğrenci görüşlerinin Kararsızımdan Katılmıyoruma doğru olumsuz yönde, 21'in üstündeki puanlar ise Kararsızımdan Katılıyoruma doğru olumlu yönde olduğunu belirtmektedir. Öğrenmeye destek olma ile ilgili verilerin yorumlanması bu kritere göre yapılmıştır.

The Turkish Online Journal of Educational Technology – TOJET January 2005 ISSN: 1303-6521 volume 4 Issue 1
Copyright The Turkish Online Journal of Educational Technology 2002 97
Tablo 4. Öğrencilerin Okul Türüne Göre Eğitim Teknolojisinin Öğrenmeye Destek Olmasına Yönelik Görüşlerine İlişkin Aritmetik Ortalama ve Standart Sapmaları Okul Türü N Χ Ss
Özel okul 93 28.4946 4.5769 Ö.İ.B.Y. 126 29.2619 4.8119 Ö.İ.B.O. 102 28.2745 4.6526 Ö.İ.B.D. 164 26.5427 5.2907 Toplam 485 27.9876 5.0103
Tablo 4'de görüldüğü gibi, aritmetik ortalamalar arasında farklılıklar bulunmaktadır. Bu farklılığın istatistiksel açıdan anlamlılığını belirlemek için tek yönlü varyans analizi uygulanmış ve sonuçlar Tablo 5'de verilmiştir.
Tablo 5. Öğrencilerin Eğitim Teknolojisinin Öğrenmeye Destek Olmasına Yönelik Görüşlerinde Okul Türüne Göre Farklılıklara İlişkin Varyans Analizi Sonuçları
Gruplar K.T. Sd K.O. F p G.A. 579.306 3 193.102 G.İ. 11570.619 481 24.055 T 12149.926 484
8.027 .000*
*p<.05 düzeyinde anlamlı Tablo 5 incelendiğinde öğrencilerin fen bilgisi dersinde eğitim teknolojisinin öğrenmeye destek olmasına yönelik görüşleri arasında okul türüne göre anlamlı fark bulunmuştur (p<.05). Görüşler arasındaki bu anlamlı farklılığın hangi okul türünden kaynaklandığını bulmak üzere Scheffe testi uygulanmıştır. Elde edilen sonuçlara göre, özel okul ve Ö.İ.B.Y. okullarda öğrenim gören öğrencilerle Ö.İ.B.D.okullarda öğrenim gören öğrenciler arasında, özel okulda ve Ö.İ.B.Y. okulda öğrenim gören öğrencilerin lehine anlamlı fark bulunmuştur. Bu durum özel okullar ile Ö.İ.B.Y. olan okullarda eğitim teknolojisin fen derslerinde kullanılmasının öğrencilerin öğrenmelerine yardımcı olduğunu düşündürmektedir. 3.3.Üçüncü Alt Problem Araştırmanın üçüncü alt problemi "Öğrencilerin, fen bilgisi derslerinde eğitim teknolojisi kullanılmasının araştırma imkanlarını genişletmeye yönelik görüşleri arasında okul türüne göre anlamlı farklılıklar var mıdır?" şeklinde ifade edilmiştir. Ankette bu bölüme yönelik toplam 3 madde yer almaktadır. Araştırma imkanlarını genişletme ile ilgili maddelerden alınabilecek en düşük puan 3, en yüksek puan 15 ve ortalama puan 9’dur. Araştırma imkanlarını genişletme ile ilgili verilerin yorumlanmasında bu kriter esas alınmıştır.
Tablo 6. Öğrencilerin Okul Türüne Göre Eğitim Teknolojisinin Araştırma İmkanlarını Genişletmeye Yönelik Görüşlerine İlişkin Aritmetik Ortalama ve Standart Sapmaları Okul Türü N Χ Ss
Özel okul 93 10.6344 3.2430 Ö.İ.B.Y. 126 11.3810 2.9417 Ö.İ.B.O. 102 10.6471 2.5549 Ö.İ.B.D. 164 10.3963 2.9194 Toplam 485 10.7505 2.9355
Tablo 6'da görüldüğü gibi, aritmetik ortalamalar arasında farklılıklar bulunmaktadır. Bu farklılığın istatistiksel açıdan anlamlılığını belirlemek için tek yönlü varyans analizi uygulanmış ve sonuçlar Tablo 7'de verilmiştir.
Tablo 7. Öğrencilerin Eğitim Teknolojisinin Araştırma İmkanlarını Genişletmeye Yönelik Görüşlerinde Okul Türüne Göre Farklılıklara İlişkin Varyans Analizi Sonuçları
Gruplar K.T. Sd K.O. F p G.A. 72.996 3 24.332 G.İ. 4097.816 481 8.519 T 4170.812 484
2.856 .037*
*p<.05 düzeyinde anlamlı Tablo 7 incelendiğinde öğrencilerin fen bilgisi dersinde eğitim teknolojisinin araştırma imkanlarını genişletmeye yönelik görüşleri arasında okul türüne göre anlamlı fark bulunmuştur (p<.05). Görüşler arasındaki bu anlamlı

The Turkish Online Journal of Educational Technology – TOJET January 2005 ISSN: 1303-6521 volume 4 Issue 1
Copyright The Turkish Online Journal of Educational Technology 2002 98
farklılığın hangi okul türünden kaynaklandığını bulmak üzere Scheffe testi uygulanmıştır. Elde edilen sonuçlara göre Ö.İ.B.Y. okullarda öğrenim gören öğrencilerle Ö.İ.B.D. okullarda öğrenim gören öğrenciler arasında, Ö.İ.B.Y. okullarda öğrenim gören öğrencilerin lehine anlamlı fark bulunmuştur. Tablo 7,9 ve 11'de Ö.İ.B.Y. okullarla Ö.İ.B.D. olan okullarda öğrenim gören öğrencilerin, fen bilgisi dersinde bilgisayarın etkisi, eğitim teknolojisinin ilgiyi artırması ve araştırma imkanlarını genişletmesine yönelik görüşleri arasında anlamlı farklılığın çıkması, Ö.İ.B.Y. okullarda birçok bakımdan eğitim teknolojisi imkanlarından daha fazla yararlanıldığını düşündürmektedir. 3.4. Dördüncü Alt Problem Araştırmanın dördüncü alt problemi "Öğrencilerin, fen bilgisi derslerinde, eğitim teknolojisi kullanılmasının derse ilgiyi arttırmaya etkisine yönelik görüşleri arasında okul türüne göre anlamlı farklılıklar var mıdır?" şeklinde ifade edilmiştir. Öğrencilere uygulanan ankette bu bölüme yönelik toplam 7 madde yer almaktadır. Verilerin yorumlanması İkinci alt problemdeki kritere göre yapılmıştır.
Tablo 8. Öğrencilerin Okul Türüne Göre Eğitim Teknolojisinin Derse İlgiyi Arttırmaya Etkisine Yönelik Görüşlerine İlişkin Aritmetik Ortalama ve Standart Sapmaları Okul Türü N Χ Ss
Özel okul 93 30.2043 4.6311 Ö.İ.B.Y. 126 30.5600 5.1500 Ö.İ.B.O. 102 29.3529 4.9365 Ö.İ.B.D. 164 28.7073 5.5007 Toplam 485 29.6095 5.1762
Tablo 8'de görüldüğü gibi, aritmetik ortalamalar arasında farklılıklar bulunmaktadır. Bu farklılığın istatistiksel açıdan anlamlılığını belirlemek için tek yönlü varyans analizi uygulanmış ve sonuçlar Tablo 9'da verilmiştir. Tablo 9. Öğrencilerin Eğitim Teknolojisinin Derse İlgiyi Artırmaya Etkisine Yönelik Görüşlerinde Okul Türüne
Göre Farklılıklara İlişkin Varyans Analizi Sonuçları Gruplar K.T. Sd K.O. F p
G.A. 286.033 3 95.344 G.İ. 12655.164 480 26.365 T 12941.196 483
3.616 .013*
*p<.05 düzeyinde anlamlı Tablo 9 incelendiğinde öğrencilerin fen bilgisi dersinde eğitim teknolojisi kullanılmasının derse ilgiyi arttırmasına yönelik görüşleri arasında okul türüne göre anlamlı fark bulunmuştur (p<.05). Görüşler arasındaki bu anlamlı farklılığın hangi okul türünden kaynaklandığını bulmak üzere Scheffe testi uygulanmıştır. Elde edilen sonuçlara göre Ö.İ.B.Y. okullarda öğrenim gören öğrencilerle Ö.İ.B.D. okullarda öğrenim gören öğrenciler arasında, Ö.İ.B.Y. okullarda öğrenim gören öğrencilerin lehine anlamlı fark bulunduğu görülmektedir. 3.5. Beşinci Alt Problem Araştırmanın beşinci alt problemi "Öğrencilerin, fen bilgisi derslerinde, eğitim teknolojisinin önemli araç gereçlerinden biri olan bilgisayarların öğrenmeye etkisine yönelik görüşleri arasında okul türüne göre anlamlı farklılıklar var mıdır?" şeklinde ifade edilmiştir. Öğrencilere uygulanan anketin bu bölümüne yönelik toplam 6 madde yer almaktadır. Bu durumda ilgili maddelerden alınabilecek en düşük puan 6, en yüksek puan 30 ve ortalama puan 18’dir.
Tablo 10. Öğrencilerin Okul Türüne Göre Fen Derslerinde Bilgisayarın Etkisine Yönelik Görüşlerine İlişkin Aritmetik Ortalama ve Standart Sapmaları
Okul Türü N Χ Ss Özel okul 93 23.1613 5.7978 Ö.İ.B.Y. 126 24.4841 6.0236 Ö.İ.B.O. 102 23.5098 5.6809 Ö.İ.B.D. 164 22.4512 5.9624 Toplam 485 23.3381 5.9235
Tablo 10'da görüldüğü gibi, aritmetik ortalamalar arasında farklılıklar bulunmaktadır. Bu farklılığın istatistiksel açıdan anlamlılığını belirlemek için tek yönlü varyans analizi uygulanmış ve sonuçlar Tablo 11'de verilmiştir.

The Turkish Online Journal of Educational Technology – TOJET January 2005 ISSN: 1303-6521 volume 4 Issue 1
Copyright The Turkish Online Journal of Educational Technology 2002 99
Tablo 11. Öğrencilerin Fen Derslerinde Bilgisayarın Etkisine Yönelik Görüşlerinde Okul Türüne Göre
Farklılıklara İlişkin Varyans Analizi Sonuçları Gruplar K.T. Sd K.O. F p
G.A. 300.395 3 100.132 G.İ. 16682.149 481 34.682 T 16982.544 484
2.887 .035*
*p<.05 düzeyinde anlamlı Tablo 11 incelendiğinde, öğrencilerin fen bilgisi dersinde bilgisayarın etkisine yönelik görüşleri arasında okul türüne göre anlamlı fark bulunmuştur (p<.05). Görüşler arasındaki bu anlamlı farklılığın hangi okul türünden kaynaklandığını bulmak üzere Scheffe testi uygulanmıştır. Elde edilen sonuçlara göre Ö.İ.B.Y. okullarda öğrenim gören öğrencilerle Ö.İ.B.D. okullarda öğrenim gören öğrenciler arasında, Ö.İ.B.Y. okullarda öğrenim gören öğrencilerin lehine anlamlı fark bulunmuştur. Tablo 7, 9 ve 11'de Ö.İ.B.Y. okullarla Ö.İ.B.D. olan okullarda öğrenim gören öğrencilerin, fen bilgisi dersinde bilgisayarın etkisi, eğitim teknolojisinin ilgiyi artırması ve araştırma imkanlarını genişletmesine yönelik görüşleri arasında anlamlı farklılığın çıkması, Ö.İ.B.Y. okullarda birçok bakımdan eğitim teknolojisi imkanlarından daha fazla yararlanıldığını düşündürmektedir. 3.6. Altıncı Alt Problem Araştırmanın altıncı alt problemi "Öğrencilerin, fen bilgisi derslerinde eğitim teknolojisi kullanılmasının başarıyı arttırmaya yönelik görüşleri arasında okul türüne göre anlamlı farklılıklar var mıdır?" şeklinde ifade edilmiştir. Ankette bu bölüme yönelik toplam 3 madde yer almaktadır. Araştırma imkanlarını genişletme ile ilgili maddelerden alınabilecek en düşük puan 3, en yüksek puan 15'dir. Ankette bu bölüme verilebilecek ortalama puanın 9 olduğu görülmektedir. Başarıyı arttırma ile ilgili verilerin yorumlanması bu kritere göre yapılmıştır. Tablo 12. Öğrencilerin Okul Türüne Göre Eğitim Teknolojisinin Başarıyı Artırmaya Yönelik Görüşlerine İlişkin
Aritmetik Ortalama ve Standart Sapmaları Okul Türü N Χ Ss
Özel okul 93 12.6667 2.3000 Ö.İ.B.Y. 126 12.7460 2.5673 Ö.İ.B.D. 102 12.2255 2.4572 Ö.İ.B.O. 164 12.1220 2.6580 Toplam 485 12.4103 2.5346
Tablo 12 incelendiğinde, aritmetik ortalamaların birbirine çok yakın olduğu görülmektedir. Uygulanan tek yönlü varyans analizinde okul türüne göre eğitim teknolojisinin başarıyı artırmaya yönelik öğrenci görüşleri arasında anlamlı fark bulunmamıştır. Öğrenciler eğitim teknolojisinin başarıyı artırmasına yönelik görüşleri Katılıyorumdan, Tamamen Katılıyoruma doğru olumlu yöndedir. 4. YORUM, YARGI VE ÖNERİLER Öğrencilerin öğrenim gördükleri okul türüne göre, fen bilgisi öğretmenlerinin derslerde laboratuar araç-gereçleri, tepegöz ve bilgisayar kullanım sıklıklarına ilişkin görüşleri arasında anlamlı farkın olduğu bulunmuştur. Bu sonuç, Özel ve Ö.İ.B.Y okullarda eğitim teknolojisi araç ve gereçlerinin daha fazla sıklıkla kullanıldığını düşündürmektedir. Ö.İ.B.Y. okullarla düşük olan okullarda öğrenim gören öğrencilerin fen bilgisi dersinde bilgisayarın öğrenmeye etkisine, eğitim teknolojisinin ilgiyi artırması ve araştırma imkanlarını genişletmesine yönelik görüşleri arasında anlamlı fark olduğu görülmektedir. Bu sonuç, Ö.İ.B.Y. okullarda eğitim teknolojisinin Ö.İ.B.O. ve Ö.İ.B.D. okullarda daha fazla kullanılması sonucu öğrencilerin bir çok bakımdan eğitim teknolojisine yönelik görüşlerinin daha olumlu yönde olduğunu göstermektedir. Öğrencilerin eğitim teknolojisinin başarıyı artırmaya yönelik görüşleri arasında okul türüne göre anlamlı fark bulunmamıştır. Öğrenciler eğitim teknolojisi derslerde kullanıldığında, başarılarına olumlu katkı yapacağını düşünmektedirler. Fen Bilgisi derslerinde eğitim teknolojisinin kullanılması öğrenmeye destek, derse ilgiyi arttırma, araştırma imkanlarını genişletme ve başarıyı arttırmaya olumlu katkı yapmaktadır. Özel ve Ö.İ.B.Y. okullarda eğitim teknolojisi araç-gereçleri daha fazla sıklıkla kullanılmaktadır.
The Turkish Online Journal of Educational Technology – TOJET January 2005 ISSN: 1303-6521 volume 4 Issue 1
Copyright The Turkish Online Journal of Educational Technology 2002 100
Eğitim Teknolojisi araç-gereçlerinin fen bilgisi derslerinde daha çok sıklıkla kullanılması, ilköğretim okullarında eğitim teknolojisi araç-gereç imkanları arttırılması ve her türlü teknolojik araç-gereçle donatılması önerilmektedir. KAYNAKÇA Akdeniz, A.R., Yiğit, N (2001) “Fen Bilimleri Öğretiminde Bilgisayar Destekli Materyallerin Öğrenci Başarısı
Üzerine Etkisi”. Yeni Bin yılın Başında Türkiye'de Fen Bilimleri Eğitimi Sempozyumu Bildirileri. Maltepe Üniversitesi İstanbul.s:229-234
Aktamış, H., Akpınar, E. ve Ergin, Ö. (2002) “Yapısalcı Kurama Örnek Bir Uygulama”. V. Ulusal Fen Bilimleri ve Matematik Eğitim Kongresi’nde bildiri olarak sunulmuştur. Orta Doğu Teknik Üniversitesi. 6-8 Eylül, Ankara
Çakmak, O. (1999) “Fen Eğitiminin Yeni Boyutu: Bilgisayar-Multimedya-İnternet Destekli Eğitim”. D.E.Ü. Buca Eğitim Fakültesi Dergisi, Özel sayı, 11:116-125
Gürdal, A. (1992) “İlköğretim Okullarında Fen Bilgisinin Önemi”. H.Ü. Eğitim Fakültesi Dergisi,8:185-288 Howe, Jones (1998). Engaging Children in Science. Columbus, Ohia. 2nd edition Karasar, N. (1999) Bilimsel Araştırma Yötemleri, Nobel Yayın Dağıtım,Ankara Kibos, K. J. (2002). “Impact of A Computer-Based Physics Instruction Program on Pupils’ Understanding of
Measurement Concepts and Methods Associated with School Science” Journal of Science Education and Technology, 11(2), 193-198
M.E.B. (2000) "İlköğretim Okulu Fen Bilgisi Dersi (4,5,6,7,8. sınıf) Öğretim Programı", MEB Tebliğler Dergisi, 63, 2518, Kasım 2000.
Uslu, F. (2002) “İzmir İli MLO Okullarında Biyoloji Dersinde Eğitim Teknolojisi Uygulamalarının Etkinliği Üzerine Bir Araştırma”. Yayınlanmamış Yüksek Lisans Tezi, Dokuz Eylül Üniversitesi, İzmir.
Rıza, E. T. (2000) Eğitim Teknolojisi Uygulamaları ve Materyal Geliştirme. İzmir:Anadolu Mat.5.Baskı. Soderberg, P., Price, F. (2003) “An examination of problem-based teaching and learning in population genetics
and evolution using evolve, A computer simulation”. İnternational Journal of Science Education, 25, (1),35-55.
Şahin, F., Öztuna, A. ve Sağlamer, B. (2001) “İlköğretim II. Kademe Fen Bilgisi Dersinde 'Sinir Hücresi'nin Model Yoluyla Öğretiminin Başarıya Etkisi”. Yeni Binyılın Başında Türkiye'de Fen Bilimleri Eğitimi Sempozyumu Bildirileri. Maltepe Üniversitesi, İstanbul.
Yumuşak, A., Aycan, Ş. (2002). “Fen bilgisi eğitiminde bilgisayar destekli çalışmanın faydaları”. Uluslar Arası katılımlı 2000'li Yıllarda 1. Öğrenme ve Öğretme Sempozyumu. Bildiri Özetleri Kitabı, Marmara Üniversitesi Atatürk Eğitim Fakültesi, İstanbul

The Turkish Online Journal of Educational Technology – TOJET January 2005 ISSN: 1303-6521 volume 4 Issue 1
Copyright The Turkish Online Journal of Educational Technology 2002 101
FEN EĞİTİMİNDE ÖĞRENCİLERİN GELİŞİMİNİ DEĞERLENDİRMEK İÇİN ELEKTRONİK PORTFOLYO KULLANIMI ÜZERİNE BİR İNCELEME
Dr. Hünkar KORKMAZ, Doç. Dr. Fitnat KAPTAN
Hacettepe Üniversitesi, Eğitim Fakültesi, İlköğretim Bölümü, Fen Bilgisi Eğitimi Anabilim Dalı [email protected], [email protected]
ÖZET Bu çalışmanın amacı, fen eğitimine özgü bir elektronik portfolyo yöntemi geliştirmektir. Bu çalışmada, elektronik portfolyonun amaçlarını ve öğrencilerin eğitim programı içerisinde gelişimlerindeki değişiklikleri göstermek için gerekli veri araçları oluşturulmuştur. Öğrenciler tarafından kullanılan performans kriterleri, örnek formlar, kayıt tutma stratejileri araştırmacılar tarafından geliştirilmiştir. Geliştirilmiş elektronik doküman, öğrenciler için onların kendi ilerlemeleriyle belirlenmiş olan standartları karşılaştırmak ve yansıtmak amacıyla bazı yansıtıcı formları içermektedir. Bu kriterleri karşılamak amacıyla, öğrenciler kendi portfolyolarını oluşturmak için gerçek öğrenmeleri açısından ne toplamaları gerektiğine karar vermişlerdir. Bu çalışma, 2002-2003 Güz döneminde Hacettepe Üniversitesi Eğitim Fakültesi Fen Bilgisi Eğitimi Ana Bilim Dalında Bilgisayar Destekli Fen Eğitimi dersinde uygulanmıştır. Bu derste öğretmen adayları (n=6) hem kendileri için fen eğitimine yönelik kişisel mesleki gelişimlerini yansıtan, hem de Ankara ili Çankaya ilçesi Beytepe İlköğretim okulunda uygulama yaptıkları 5. sınıf öğrencilerinden oluşan 36 ilköğretim öğrencisinin fen gelişimlerini elektronik portfolyolar yoluyla izlemişlerdir. Bu çalışmada niteliksel ve niceliksel metot kullanılmıştır. Çalışmanın sonuçları, elektronik portfolyo değerlendirme yönteminin fen eğitiminde öğrenci niteliklerini belirlemek, öğrenme ve öğretme sürecini geliştirmek ve bilimsel gelişmeyi izlemek amacıyla kullanılabileceğini göstermiştir.
AN INVESTIGATION ON USING ELECTRONIC PORTFOLIO FOR ASSESSING STUDENTS’ DEVELOPMENT IN SCIENCE EDUCATION
ABSTRACT The purpose of this study is to develop an electronic portfolio technique specific for science education. In this study, some data instruments necessary to demonstrate the aims of electronic portfolio and the changes in the development of students in an education program were formed. Performance criteria, sample forms and strategies for keeping records which are all used by the students were developed by the researchers. Developed electronic file included some reflector forms for students in order to compare and reflect the progress of students by themselves and predescribed standards. To compansate these criteria, students decided by themselves what they would collect for their portfolio for their real learning. This study was applied in 2002-2003 fall semester in Hacettepe University, Faculty of Education, Division of Science Education in the lecture Computer Assisted Science Education. In this lecture preservice teachers use electronic portfolio both for reflecting their personel development in science education and following scientific developments of their 36 application students from grade 5 attending to Beytepe Elementary School. In this study both qualitative and quantitiave methods were used. The results of the study demonstrated that electronic portfolio assessment technique can be used to determine the quality of students, to develop teaching and learning process and to follow the scientific development. GİRİŞ Değerlendirme, eğitimin ayrılmaz bir parçasıdır. Bütün öğretmenler öğrencilerinin ne öğrendiğiyle ilgilidir ve onların gelişimlerini takip edebilmek için uygun değerlendirme yöntemlerini bilmek ve bulmak zorundadırlar. 1980 sonları, 1990 başlarında öğrencilerin okuldaki başarılarını ve performanslarını değerlendirme konusu değerlendirme reformu içinde genel bir düşünce olarak ortaya çıkmıştır. Yeni değerlendirme anlayışı; güvenilir, performans temelli, işbirliğine dayalı, etkin ve gerçek yaşama ilişkin öğrenmeleri yansıtan, gerçekçi ve uygulanabilir özelliklere sahiptir (Spady & Marshall, 1991). Dünyadaki çağdaş eğitim kuramlarını benimseyen ve uygulayan öncü okullar tek başına klasik kağıt kalem testlerine dayalı değerlendirme sistemlerini terk etmişlerdir. Çoklu zeka kuramı, etkin öğrenme, yapısalcılık, yaratıcılık, probleme dayalı öğrenme, proje tabanlı öğrenme gibi çağdaş eğitim yaklaşımlarına dayalı öğrenme-öğretme süreçlerinde kazandırılan beceriler kağıt kalem testleri ile ölçülemez. Değerlendirme yaklaşımlarındaki bu değişen tutumlar performans temelli değerlendirme yaklaşımlarından özellikle portfolyolara rehberlik etmektedir. Portfolyoların özellikle sanat, mimarlık, gazetecilik gibi mesleklerde kullanımı uzun bir geçmişe sahipken eğitimde kullanımı oldukça yenidir. Bazı sınıf öğretmenleri 1960’lı yılların başında öğrenci çalışmalarını portfolyolar yoluyla değerlendirdiklerini ifade etseler de eğitim
The Turkish Online Journal of Educational Technology – TOJET January 2005 ISSN: 1303-6521 volume 4 Issue 1
Copyright The Turkish Online Journal of Educational Technology 2002 102
literatüründe 1980’li yılların ortasına kadar portfolyolar hakkında makale yayımlanmamıştır (e.g., Burnham, 1986; Camp, 1985; Elbow & Belanoff, 1986). Arter ve Spandell’e (1991) göre portfolyo, öğrenciye ve başkalarına öğrencinin bir veya daha fazla alandaki başarılarını sunmak amaçlı olarak öğrenci çalışmalarının toplanmasıdır. Stinggins (1994) portfolyoları öğrencilerin gelişimini ya da başarılarını göstermek için bir araya getirilen öğrenci çalışmalarının bir koleksiyonu olarak tanımlar. Ayrıca Stinggins (1994)’ e göre, portfolyolar bir değerlendirme şekli değildir, öğrencilerin gelişimi ve başarısı hakkında bilgi verir. Meisels ve Steele’e (1991) göre portfolyolar, öğrencilerin kendi çalışmalarını, değerlendirmeye katılımlarını her bir öğrencinin kendi ilerleyişini izlemesini sağlar ve bireysel olarak öğrencilerin performanslarının değerlendirilmesi için bir temel oluşturur. Portfolyo kullanımı sınıf içi uygulamalarda, öğrencilerin ihtiyaçlarını daha fazla karşılayabilecek olan bir eğitime geçişi sağlar. Eğitim literatüründe yer alan makaleler daha çok öğrenci portfolyolarına yöneliktir. Bu çalışmada öğretmen portfolyoları (öğretmen tarafından hazırlanan öğrenciye ve kendisine ait ) irdelenecektir. Wolf (1999) öğretmen portfolyolarını üçe ayırır. a) Öğrenme Portfolyoları: Öğretmenlerin kendi öğrenmelerinin ve çalışmalarının kişisel koleksiyonundan oluşur. Öğrenme portfolyolarının temel amacı, öğretmenlerin kendi öğrenmelerini göstermelerine, paylaşmalarına ve yansıtmalarına fırsat sağlamaktır (p.12). b) Değerlendirme Portfolyoları: Öğretmenlerin çalışmalarının seçilmiş koleksiyonudur ve önceden belirlenmiş durum tespitine dönük ürünlerden oluşur. Bu tür portfolyoların birincil amacı, öğretmenlerin mesleki ilerlemeleri ve sertifika alabilmeleri için bir kanıt sağlamaktır (p.13). c) Çalışma Portfolyoları: Bu tür portfolyolar öğretmenlerin bir iş başvurusu için kullanabilecekleri ve işverene öğretmen hakkında bilgi veren portfolyolardır (p.14). Öğretmen yetiştiren kurumlardaki öğretim elemanları daha çok öğrenme ve değerlendirme portfolyolarının kullanımını vurgularken, öğrenciler iş başvurusunda kullanabilecekleri çalışma portfolyolarını nasıl kullanabilecekleriyle daha çok ilgilidirler (Breault, 2000). Son yıllarda teknolojinin her alana getirdiği kolaylıklar öğretmenlerin çalışmalarını daha kolay biriktirebilecekleri ve düzenleyebilecekleri portfolyoları bilgisayar ortamında hazırlayabilecekleri düşüncesini doğurmuştur. Elizabeth (1998) elektronik portfolyolarla geleneksel portfolyoları şu şekilde karşılaştırmaktadır: (akt. Barlett, 2002). Bir elektronik portfolyo geleneksel portfolyoya benzemektedir fakat elektronik portfolyolar özellikle teknoloji bilgisini ve becerisini gerektirir. Ayrıca elektronik portfolyolar geleneksel portfolyolardan farklı olarak hipermedya programları, veri tabanı, kelime işlemci yazılımları, web tasarım programları, gibi elektronik medya kaynaklarının bir bileşimini kullanmayı gerektirir. Elektronik portfolyolar bir bilgisayar diskinde saklanır, bir CD-ROM ya da Home Page’ de ’da toplanır, gerektiğinde ve istenildiğinde üzerinde kolayca düzeltme yapılabilir, taşınması kolaydır (p.4). Fen derslerinde öğrenci başarısını ölçmede güçlükler vardır. Yeni fen programlarındaki üniteler, içeriğe bilimsel süreçler (gözlem, deney, araştırma, hipotez kurma, vb.) yoluyla varılması esasına göre düzenlenmiştir. Ayrıca ünitelerde bilimsel tutumların geliştirilmesine büyük önem verilmiştir. Güçlü bir fen programı öğrencilere herhangi bir deneyim kazandırmak yerine onların fen ilkelerini öğrenmelerine yardım edecek deneyimleri dikkatle seçer. Hazır bilgiyi aktaran program yerine bilgiye ulaşma becerisine yönelik problem çözme becerilerini geliştirici, çok konu yerine birkaç konuyu daha derinden işleyen bir fen programının daha etkili olduğunu gösteren bir çok araştırma vardır ( 4). Doğayı sistemli bir biçimde gözlem ve incelemeye tabi tutmak, doğal olayları laboratuvara getirip denemeye konu etmek, fen bilimlerinin kendi yönteminin bir parçasıdır. Fen bilimlerinde laboratuvar çalışmaları diğer deneysel yöntemler, doğa olaylarını yerinde ve zamanında gözlemleme gibi etkinlikler önemli yer tutar. Ayrıca, ölçü araçlarını kullanabilmek, bazı laboratuvar araçlarını onarmak veya yapmak, temizliğine dikkat etmek, ekonomik davranmak, kazalara karşı tedbirli olmak gibi beceriler fen programlarının hedefleri arasında yer alır. Bu hedef davranışların gerçekleşip gerçekleşmediğini kağıt kalem testleri ile ölçmek mümkün değildir. Bu davranışları ölçmenin en iyi yolu, öğrenciyi süreç içerisinde gözlemek, öğrencinin bu süreç içerisindeki faaliyetleri ile ilgili tuttuğu notları değerlendirmektir. Bu kağıt ve dökümanlar bir süre taşınamaz, zaman içerisinde kaybolur, istenilen çalışmalara kağıt yığınları içerisinde dönmek mümkün olmayabilir. Klasik portfolyolar bu açıdan bazı dezavantajlara sahiptir. Bu dezavantajları gidermek için elektronik portfolyolar tercih edilir.
Eğitim literatüründe öğrencilerin ve öğretmenlerin süreç içerisindeki gelişimlerini, elektronik araçlarla çoklu ortamlar kullanılarak yapılan gerçek (authentic assessment) değerlendirmelere ilişkin yapılan araştırma sayısı sınırlıdır (Bonk, Medary, & Reynolds, 1994). Sheingold (1992) elektronik portfolyo kullanmanın nedenlerini şöyle açıklamaktadır. Elektronik portfolyolar;
The Turkish Online Journal of Educational Technology – TOJET January 2005 ISSN: 1303-6521 volume 4 Issue 1
Copyright The Turkish Online Journal of Educational Technology 2002 103
• Kolay ulaşılabilir, taşınabilir, bölünebilir, denetlenebilir, geniş bir kitleyle paylaşılabilir. • Performans, tekrar gözden geçirilebilir . • İstenildiğinde daha kolay ve daha kısa sürede düzeltme yapılabilir, organize edilebilir. Bu çalışmanın amacı, fen eğitimine özgü bir elektronik portfolyo yöntemi geliştirmektir. Bu yolla fen eğitimi için elektronik portfolyoların, bileşenlerinin geliştirilebilirliği ve uygulanabilirliğini araştırmaktır. Bu çalışmaya yön veren temel sorular şunlardır: 1. İlköğretim öğrencilerinin, kendi kişisel gelişimlerini izlemeye ve değerlendirmeye yönelik hazırlanan elektronik portfolyoları hakkındaki düşünceleri nedir? 2. Hizmet öncesi öğretmenlerin, kendi kişisel gelişimlerini izlemeye ve değerlendirmeye yönelik hazırladıkları elektronik portfolyoları hakkındaki düşünceleri nedir? YÖNTEM Bu araştırmada alt problemlere bağlı olarak değişik yöntemlerden yararlanılmıştır. Birinci alt problemle ilgili olarak gözlem ve görüşlerden yararlanan tarama yöntemi kullanılmıştır. Katılımcılar Bu çalışma, 2002-2003 Güz döneminde Hacettepe Üniversitesi Eğitim Fakültesi Fen Bilgisi Eğitimi Ana Bilim Dalında Bilgisayar Destekli Fen Eğitimi dersinde uygulanmıştır. Bu derste öğretmen adayları (n=6) hem kendileri için fen eğitimine yönelik kişisel mesleki gelişimlerini yansıtan, hem de Ankara ili Çankaya ilçesi Beytepe İlköğretim okulunda uygulama yaptıkları 5. sınıf öğrencilerinden oluşan 36 ilköğretim öğrencisinin fen gelişimlerini elektronik portfolyolar yoluyla izlemişlerdir. Her öğretmen adayı 6 öğrencinin gelişimini izlemekten sorumlu olmuştur. Beytepe İlköğretim Okulundaki 36 öğrenci Hacettepe Üniversitesi Eğitim Fakültesi Fen Bilgisi Eğitimi Ana Bilim Dalı ve Milli Eğitim Bakanlığı Eğitim Araştırma Geliştirme Dairesi tarafından yürütülen uzunlamasına (5 yıllık) bir araştırma süresince gelişimleri takip edilen öğrencilerdir. Bu öğrencilerin bilimsel kavramları öğrenme ve kullanma yolları takip edilmektedir. İlköğretim öğrencileri 1. sınıftan itibaren haftada 1 saat bilgisayar dersi almaktadırlar. 24(%67)öğrencilerin evinde bilgisayar vardır ve aileleri (anne ya da babadan biri veya her ikisi de) de bilgisayar kullanmaktadır. Portfolyoları hazırlayan 6 öğretmen adayı Bilgisayar ve Öğretim Teknolojileri Eğitimi Ana bilim dalında okuyan son sınıf öğrencileridir. Bu öğrenciler bilgisayar kullanma, web sayfası hazırlama konusunda ön bilgilere sahiptiler. Fen bilgisi öğretmeni değillerdir. Bu öğretmen adayları Bilgisayar Destekli Fen eğitimi dersini almışlardır. Mezun olduklarında, alanda fen eğitimine yönelik bilgisayar ve öğretim teknolojileri konusunda da hizmet edeceklerdir. Bu yüzden fen eğitimi de onların alanlarının bir parçasıdır. VERİ TOPLAMA ARAÇLARI Araştırmanın verileri aşağıda verilen araçlar kullanılarak elde edilmiştir. Elektronik Portfolyolar: Aşağıda detaylı olarak kapsamı hakkında bilgi verilen elektronik portfolyolar görüşmeler ve anket formlardan elde edilen verileri desteklemek amacıyla kullanılmıştır. Görüşme-Röportaj Tutanakları: Öğrenciler ve öğretmen adayları açısından programın avantajları ve dezavantajlarını incelemek amacıyla araştırmacılar programın sonunda geribildirim röportajı yapmışlardır. Bu şekilde sınıftaki süreç ve programın öğrenciler ve öğretmen adayları üzerindeki etkisiyle ilgili doğrudan ve güvenilir bilgi toplanmıştır. VERİLERİN ANALİZİ Bu çalışmada nitel araştırma yöntemlerinden “örnek olay” yöntemi kullanılmıştır. Örnek olay çalışması için, veriler tüm gruptan (öğrenci (n=36) ve öğretmen adaylarından(n=6)) toplanmıştır ve bu grup içerisinden altı öğrenci, altı öğretmen adayı portfolyosu daha kapsamlı bir analiz için seçilmiştir. Geriye kalan 27 öğrenci portfolyosundan elde edilen bilgiler örnek olay çalışmasında elde edilen bulguları yorumlamak için kullanılmıştır. Bu çalışmada bir öğretmen, bir öğrenciden oluşan iki katılımcının çalışmalarına ayrıntılı olarak yer verilmiştir. Elektronik Portfolyoların Oluşturulması Bu çalışma, 6 öğretmen adayı tarafından geliştirilen mesleki gelişim portfolyolarını ve bu 6 öğretmen adayı tarafından 36 ilköğretim öğrencisi için hazırlanan fen portfolyolarını kapsamaktadır. Bu 6 öğretmen adayı ders
The Turkish Online Journal of Educational Technology – TOJET January 2005 ISSN: 1303-6521 volume 4 Issue 1
Copyright The Turkish Online Journal of Educational Technology 2002 104
sorumlusu tarafından yapacakları çalışma ve eğitimde elektronik portfolyoların kullanımı üzerine bilgilendirilmişlerdir. Her öğretmen adayının sorumluluğuna random olarak sınıfta 6 öğrenciden oluşan gruplar verilmiştir. Öğretmen adayları bu öğrencilerle tanıştırılmıştır. Öğretmen adayları ders dışında öğrencilerle birlikte olmuş ve portfolyo tasarımlarını öğrencilerle birlikte hazırlamışlardır. Öğrencilerle birlikte ve ders öğretmeninin de görüşü alınarak portfolyolara konulacak öğrenci ürünleri seçilmiştir. Aileler süreç hakkında bilgilendirilmiştir. Çünkü önümüzdeki yıllarda öğrencilerin kendi web sayfalarını kendilerinin oluşturması ve geliştirmesi sağlanacaktır. Okulun Bilgisayar öğretmeninden de yardım alınarak web sayfalarına öğrencilerin koyacakları basit ürünleri (Kelime işlemcisi kullanılarak fen günlüklerini yazma, Resim hazırlama programları –paint- kullanılarak fenle ilgili resimler çizme, kavram haritası hazırlama ya da hazırlanmış bir kavram haritasını doldurma, geliştirme veya değiştirme etkinlikleri gibi.) hazırlamaları sağlanmıştır. Ayrıca öğrencilerin portfolyosuna dönüt alabilmelerini sağlamak için Yahoo’dan her öğrenci için bir elektronik Posta adresi alınmış ve öğrencilere şifreleriyle birlikte bunlar verilmiştir. Öğrenciler şifre değiştirme konusunda bilgilendirilmiştir. Öğrenci dosyaları; sınıf etkinliklerine paralel olarak “Fen Günlüğüm, Çalışma Kağıtlarım, Deney Raporlarım, Bilim Saati etkinliklerim, Sınavlarım, Proje Dosyam, Okuduğum Kitaplar, Kavram Haritalarım ve Çizimlerim, Portfolyomu İnceleyenler İçin mektup, Öneriler” butonlarından oluşmaktadır. Öğretmen adayları, ders sorumlusunun rehberliğinde kendi öğrenmeleri ve öğretim süreçleri hakkında bilgi toplamışlar, ürünlerini hazırlamışlardır. Hazırlanan elektronik portfolyoların nerede, nasıl ve hangi amaçlarla kullanılabileceği hakkında Öğretmen adayları bilgilendirilmiştir.Öğretmen adayları portfolyoları için oluşturulan butonlar aynı olmamıştır. Öğretmen adayları portfolyo tasarımlarını bağımsız olarak hazırlamışlardır. Öğretmen adaylarının portfolyoları, ders sorumlusu tarafından hazırlanan ve öğretmen adaylarının da bilgi sahibi oldukları “Elektronik Portfolyo Rubriği” yoluyla değerlendirilmiştir. Ayrıca Bilgisayar ve Öğretim Teknolojileri Eğitimi Ana Bilim Dalı’nda okuyan öğrenciler Fen bilgisi Öğretmenliği Ana Bilim Dalı’nda okuyan öğrencilerle kollektif çalışmışlar ve birbirlerinin deneyimlerinden yararlanmışlardır. BULGULAR VE YORUM Araştırmanın bulguları, örnek olay analizi için seçilen bir öğretmen ve bir öğrencinin elktronik portfolyosundan elde edilen veriler ve onlarla yapılan görüşme kasetinin çözümlenmesi ve betimlenmesi yoluyla yapılan incelemelerden elde edilerek yorumlanmıştır. Örnek Olay İncelemesine Alınan Öğretmen Adayı Öğretmen adaylarıyla yapılan görüşmede, öğretmen adaylarından bazıları adlarının araştırma raporunda verilmesini istemedikleri için bilimsel etik gereği isme yer verilmemiştir.Öğretmen adayı A olarak adlandırılmıştır. Sürece Giriş Özellikleri Sürecin başında A’ya göre fen eğitiminin temel amacı ilköğretim öğrencilerinde iyi bir bilimsel anlayış geliştirmekti. A, okullarda verilen fen eğitiminin öğretmen merkezli olduğunu düşünüyordu. A, okullarda öğrencinin bilgiyi, öğretmen ve ders kitaplarından aldığını ve öğrencilerin öğretmenin verdiği bilgiler doğrultusunda bilimsel anlayış kazanmaları gerektiğini düşünüyordu. A’nın, fen eğitiminin değerlendirme boyutuyla ilgili görüşleri bizim için önemliydi, çünkü bu durum A’nın elektronik portfolyo için öğrencileriyle birlikte seçeceği ürünlerin niteliğini de etkileyecekti. A, sürecin başında fen eğitimindeki kazanımların kağıt kalem testleriyle(kısa cevaplı testler, doğru-yanlış testleri, sözlü sınavlar vb.) değerlendirilebileceğini söylemiştir. A, sürece başaladığında alternatif değerlendirme yaklaşımlarıyla ilgili bir eğitim almamıştı. Rubrik, portfolyo ve elektronik portfolyoların ne olduğu hakkında bilgi sahibi değildi. Öğretmen adaylarından 2’si portfolyonun adını duymuş ama tanımını yapamamıştır. Diğer 3 öğretmen adayı A ile aynı durumdaydı. Fakat A, web sayfası hazırlama ve bilgisayar kullanma konusunda kendini yeterli hissediyordu. Elektronik portfolyonun teorik olarak ne olduğunu bilmemesine rağmen teknik olarak bunu hazırlayabilme yeterliliğine sahipti. A, sürecin başında ders sorumlusundan aldığı kuramsal bilgiyi kütüphaneden ve internetten topladığı materyallerle geliştirmiştir. Ayrıca A, eğitim programını incelemesinin ona bilimsel kavramlara uygun açıklamalar yapmada yardımcı olduğunu ifade etmiştir. Süreç İçerisinde ve Sonunda Gözlenen Özellikler Öğretmen adaylarıyla yapılan röportajlardan elde edilen verilere dayalı olarak, elektronik portfolyoların geliştirdikleri özellikler dört grupta kategorize edilmiştir.

The Turkish Online Journal of Educational Technology – TOJET January 2005 ISSN: 1303-6521 volume 4 Issue 1
Copyright The Turkish Online Journal of Educational Technology 2002 105
1. Program Bilgisi ve Öğretim Yöntemlerindeki Gelişim A, özellikle bilimsel içerik ve program bilgisini geliştirdikçe, fen konularının ilköğretim seviyesinde nasıl öğretilmesi ve değerlendirilmesi gerektiğini de dikkate almaya başlamıştır. A ve diğer öğretmen adayları tarafından oluşturulan elektronik portfolyolardaki butonlar incelendiğinde, fenin doğasını ve iyi bir fen dersinde yer alması gereken etkinlikleri kapsayan butonlar yer almıştır ve öğrencilerin kendi bilimsel bilgilerini yapılandırmasına olanak tanınacak şekilde oluşturmuştur. 2. Teknoloji Hakkındaki Bilgi ve Becerilerini Geliştirme A, elektronik portfolyo çalışmasının “Dreamveawer” programında ilerlemesine katkıda bulunduğunu söylwemiş ve elektronik portfolyosunda bu programı kullandığı gözlenmiştir. 3 öğretmen adayı Flash programında daha da ilerlediklerini, daha önce bilgi sahibi olmadıkları portfolyolar hakkında bilgi sahibi olduklarını ifade etmişlerdir. 3. Değerlendirmede Teknolojiyi Kullanma A, görüşme sürecinde yaptığı yorumda, “Bu portfolyo çalışması bana elimdekileri görme şansı verdi. Kendimi hangi konular da geliştirdiğimi hangi konularda geliştirmem gerektiğini gösterdi.” demiştir. A, süreci tamamladıktan sonra, kendi performansını ve öğrencilerin öğrenmelerini değerlendirmiştir. A’nın mesleki gelişim portfolyosunda alternatif değerlendirme tekniklerine yer vermesi, değerlendirme yaklaşımındaki değişikliğin bir kanıtıydı. 4 öğretmen adayı da eğiitmde değerlendirme aracı olarak teknolojiyi etkin kullanabildiklerine sevinmişlerdir. 4. Motivasyon A, kendi mesleki gelişim portfolyosunu hazırlarken sıkıntı yaşadığını ifade etmiştir. A, elektronik portfolyo ve kendi mesleki gelişimiyle ilgili çok önemli dökümanlarını, belgelerini, ödevlerini üniversite yılları boyunca koruyamadığını, kaybettiğini belirtmiştir. I. sınıftan itibaren -belki Öğretmenlik Mesleğine Giriş dersinde- bu konudan haberdar edilmiş olsaydı daha bilinçli olarak portfolyosunu oluşturabileceğini ve portfolyosunu bundan sonra geliştireceğini vurgulamıştır. A, gelecekte elektronik portfolyoları kendisi ve öğrencileri için kullanacağını ve meslektaşlarıyla paylaşacağını ifade etmiştir. Bu sürece katılmaktan dolayı ve kazandığı deneyimden dolayı kendini şanslı hissettiğini ve tüm öğretmenlerin de elektronik portfolyo kullanımını bilmesini gerektiğini belirtmiştir. Diğer 5 öğretmen adayı da çalışmaya katılmaktan ve bu deneyimi kazanmaktan dolayı mutlu olduklarını ifade etmişlerdir. A, ileride fen eğitimine yönelik programlar ve materyaller geliştirmek istediğini ifade ederek fen eğitimine artık daha farklı bir bakış açısıyla baktığını ifade etmişitr. Örnek Olay İncelemesine Alınan Öğrenci Öğrenci B olarak adlandırılmıştır. Sürece Giriş Özellikleri B, evinde bilgisayara sahiptir. Fakat bilgisayarı genellikle oyun amaçlı kullandığını ifade etmiştir. Bilgisayarda yazı yazma, resim çizme gibi etkinlikleri okulda aldığı bir saatlik bilgisayar dersinde yapmıştır. Elektronik portfolyo hakkında sürecin başında bilgi aldığında, elektronik portfolyoyu bir web sayfasına benzetti ve “İnternette kendi sayfamı görebilir miyim?” şeklinde bir soru yöneltmiştir. Fen dersini çok sevdiğini söylemiştir. Okulda fen dersinde proje sınıfı olmaları nedeniyle çok sık laboratuvara gittiklerini deney yaptıklarını, fen günlüğü tuttuklarını, bilim saati etkinlikleri yaptıklarını ifade etmiştir. B, elektronik portfolyo hakkında bir bilgiye sahip değildi ve hiç elektronik portfolyo görmemişti. Fakat klasik fen portfolyosu vardı ve portfolyosunu hangi amaçla tuttuğunu biliyordu. B, portfolyolar yoluyla kendi kendini değerlendirme becerisi kazandığını Süreç İçerisinde ve Sonunda Gözlenen Özellikler Öğrencilerle yapılan röportajlarda, elektronik portfolyoların gelişitrdikleri özellikler üç grupta kategorize edilmiştir. 1. Teknoloji Hakkındaki Bilgi ve Becerilerini Geliştirme B, elektronik portfolyosunun tasarımında ve ürün seçiminde aktif görev almdı. Bilgisayar dersinde elektronik portfolyosu için resimler yaptı, günlüğünü yazdı. 16 öğrenci (%44) Front Page programını öğretmenlerinden alarak, evdeki bilgisayarlarına yüklemek istemiştir. Bu durum, öğrencilerin Elektronik Portfolyolarını oluşturmak için çaba gösterdiklerini ve web sayfası (elektronik portfolyo tasarımı için) tasarımı konusunda hangi programı kullanması gerektiğini öğrendiklerini, öğretmenleriyle bu konuda etkileşim içerisinde olduklarını öğretmenlerinden bu konuda bilgi aldıklarını göstermektedir.

The Turkish Online Journal of Educational Technology – TOJET January 2005 ISSN: 1303-6521 volume 4 Issue 1
Copyright The Turkish Online Journal of Educational Technology 2002 106
2. Motivasyon Rehber öğretmeniyle (elektronik portfolyosunu hazırlayan öğretmen adayı) birlikte sık sık bir araya geldi. Elektronik portfolyosunu sahiplendi (“Portfolyomu bir an önce kendim öğrenerek hazırlamak istiyorum.”). “Portfolyoma ilerde kendimi daha iyi gösterebileceğim ürünler hazırlayıp koyacağım. Fen dersinde yapmayı düşündüğüm bazı ilginç projeler var.” yorumuyla B, elektronik portfolyo hazırlayabilmek için gerekli bilgi ve becerileri kazanma konusunda da istekli davranmıştır. 26 öğrenci (%72) elektronik portfolyo oluşturmanın çok önemli ve değerli olduğunu ifade etmiştir. 4 öğrenci (%11) bu çalışmanın çok zaman aldığını ve yorucu olduğunu, elektronik portfolyo gelişitrmek istemediklerini ifade etmiştir. Bu öğrencilerin evde bilgisayarlarının olmaması sadece okulda bilgisayarla çalışıyor olmaları bu isteksizliklerinin nedeni olabilir. 3. Özdeğerlendirme Elektronik portfolyom sayesinde çalışmalarımı yeniden gözden geçirdim. Eksikliklerimi gördüm ve tamamladım. Bu çalışmaları bir daha yaparsam daha güzel yapacağım. SONUÇ Öğretmen adaylarının mesleki gelişim portfolyoları ve öğrencilerin fen portfolyolarını oluşturdukları bu süreç yoluyla, hem kendi mesleki gelişimlerini hem de öğrencilerin öğrenmelerini değerlendirme yetenekleri büyük ölçüde artmıştır. İlköğretim fen eğitiminin temel amacı öğrenciye bilgiye ulaşma yollarını, bilgiyi kullanma yollarını, bilimsel süreç becerilerini ve fen okur yazarlığını kazandırmaktır. Bu özelliklerin kazanılıp kazanılmadığı kağıt kalem testleriyle test edilemez. Portfolyolar eğitim ortamlarında; öğretici materyaller ve değerlendirme araçları olarak kullanılır. Portfolyo değerlendirme, öğrencilerin çalışmalarından örnekler toplamayı ve yansıtmayı içerir, böylece hem yetişeğe yol gösterici rol oynar hem de gerçekçi değerlendirmeler için elverişli olanaklar önerir. Eğer dikkatlice organize edilirse, değerlendirme ve yol gösterme açısından bir kesişim oluşturur. Portfolyolar ne sadece yol gösterici ne de sadece değerlendirme işlevi görür. Bazı öğretmenler, portfolyoların aynı zamanda hem öğretici hem de değerlendirme aracı olduğunu kabullenmekte güçlük çekerler. Test alışkanlığı ülkemizde çok kökleşmiştir. Not verme işlemi eğitim sisteminin ayrılmaz bir parçası olarak görülmektedir. Fakat gerçekte iyi öğretmenler, öğrencilerinin başarılarını, ilerleyişlerini her zaman değerlendirirler. Performans değerlendirmesini kullanmak, öğrencinin öğrendiklerine büyüteç tutmak gibidir. Böylece öğrenme, öğrenene zarar vermeden gerçekleştirilebilmektedir. Dorris (1991) öğrencilerin bilimsel kavramları anlama ve kullanma becerilerini anlayabilmek için, öğrenci etkinliklerinin bir çok açıdan incelenmesi gerektiğini vurgulamaktadır. Dorris (1991) ayrıca, öğrencilerin bilimsel deneyimlerine bakış açılarını gözlemleyebilmeli, onların diğer arkadaşlarıyla olan ve ürettikleri ürünlerle olan etkileşimlerinin nasıl olduğunu anlamak gerektiğini ifade etmektedir. Portfolyo değerlendirme süreci bu olanağı sağlamaktadır.
KAYNAKÇA Arter, J., and Spandel(1991) V. Using Portfolios of Student Work in Instruction and Assessment. Portland, OR:
Northwest Regional Educational Laboratory,. Bartlett, A.(2002). Preparing preservice teachers to implement performance assessment and technology through
electronic portfolios. Action in Teacher Education v. 24:1, 90-7. Bonk, C., J., Medary, P., V., & Reynolds, T., H. (1994). Cooperative hypermedia: The marriage of collaborative
writing and mediated environments. In Reed, W. M. Burnham, C. (1986). Portfolio evaluation: Room to breathe and grow. In C.W. Bridges (Ed.), Training the new
teachers of college composition (pp. 125-138). Urbana, IL: NCTECamp. Camp, R. (1985). The writing folder in post-secondary assessment. In P.J.A. Evans (Ed.), Directions and
misdirections in English education (pp. 91-99). Ottawa, Canada: Canadian Council of Teachers of English.
Doris, E. (1991) Doing What Scientist Do. Children Learn to Investigate Their World. Portsmouth, NH: Heinemann.
Elbow, P., & Belanoff, P. (1986). SUNY: Portfolio-based evaluation program. In P. Elbow & P. Belanoff (Eds.), New methods in college writing programs: Theory into practice (pp. 3-16). Portsmouth, NH: Heinemann.
Meisels, S., and Steele, D. (1991). The Early Childhood Portfolio Collection Process. Ann Arbor, MI: Center for Human Growth and Development, University of Michigan, 1991.
Sheingold, K. (1992). Presentation at a conference on Technology & School Reform, Dallas, June, 1992 Spady, W., & Marshall, K. (1991). Beyond traditional outcomes-based education. Educational Leadership, 49,
67-72 Stiggins, Richard J. (1994) Student-Centered Classroom Assessment. New York: Merrill Publishing Co. Wolf, K. (1999). Leading the professional portfolio process for change. Arlington Heights, IL: Skylight
Professional Development.
The Turkish Online Journal of Educational Technology – TOJET January 2005 ISSN: 1303-6521 volume 4 Issue 1
Copyright The Turkish Online Journal of Educational Technology 2002 107
GAZİ ÜNİVERSİTESİ’NİN UZAKTAN EĞİTİM POTANSİYELİ
Prof. Dr. İrfan SÜER Prof. Dr. Zeki KAYA
Yrd. Doç. Dr. H. İbrahim BÜLBÜL Öğ. Gör. Dr. Hatice KARAÇANTA
Öğ. Gör. Zihni KOÇ Öğ. Gör. Şaban ÇETİN
Gazi Üniversitesi Endüstriyel Sanatlar Eğitim Fakültesi
(Bu proje Gazi Üniversitesi Bilimsel Araştırma Projeleri Komisyonu tarafından desteklenmektedir.) ABSTRACT In this study, potential of distance education in Gazi University was investigated. The research was conducted by scanning and description methods. The level of distance education and human source availability of Gazi University was identified. At the next stage it was realise that courses were needed within the Gazi University. In this research the questionnaire were used as a scale in which were used to collect data from head of departments and faculty research assistants, instructors and lecturers from all faculties in Gazi University. After completion of this work collected data was analysed by computer and current situation is evaluated. The reliability and validity of the studies and the scale has been conducted by the researchers. Keywords: Gazi University, Distance education, Educational potential. ÖZET Bu bildiride Gazi Üniversitesi’nin uzaktan eğitim potansiyelini belirlemeye yönelik bir çalışmaya yer verilmektedir. Araştırma tarama modelindedir ve betimsel bir nitelik taşımaktadır. Gazi Üniversitesi’nin tüm eğitim birimlerindeki insan gücü kaynakları bakımından uzaktan eğitime hazır oluş düzeyleri belirlenmiştir. Bir sonraki aşamada ise Gazi Üniversitesi’nin hangi alanda ve ne tür uzaktan eğitim derslerine gereksinimi olduğu araştırılmıştır. Eş deyişle, bu aşamada Gazi Üniversitesi tarafından sunucu olarak verilebilecek derslerin hangi alanlarda, ne tür dersler olabileceği belirlenmiştir. Araştırmada veri toplama aracı olarak Gazi Üniversitesi’ne bağlı fakültelerin değişik bölümlerinde görevli yönetici ve öğretim elemanlarının görüşlerini almak üzere iki ayrı anket kullanılmıştır. Uygulama sonucunda toplanan veriler bilgisayar ortamına aktarılmış ve var olan durum değerlendirilmiştir. GİRİŞ Gazi Üniversitesi, tarihi Cumhuriyet dönemine kadar uzanan bir kaç üniversiteden birisidir. Kuruluşu 1926 yılında "Orta Muallim Mektebi ve Terbiye Enstitüsü"nün açılmasına dayanan ve 1982 yılında da 2809 sayılı kanunla üniversite olarak yapılandırılan Gazi Üniversitesi, 60.000’i aşan öğrencisi ve 3000'i geçen öğretim elemanı ile öğrenci başına düşen öğretim elemanı sayısında dünya ortalamasını yakalayabilmiştir. Eğitimden, iletişime, güzel sanatlardan mühendisliğe, spordan ormancılığa, tıptan eczacılığa, diş hekimliğinden fen edebiyata, iktisattan ilahiyata kadar dört vilayete dağılmış 22 fakülte, 22 yüksekokul ve 5 enstitü ile Gazi Üniversitesi Türkiye'nin en büyük üniversitelerinden birisidir. Üniversitede uzaktan eğitim (UE) uygulamalarına yönelik alt yapı çalışmaları da başlatılmıştır. Uzaktan eğitimin, yüz yüze yapılan eğitime eşit ve yanında yer alan bir eğitim olduğu söylenebilir. Uzaktan eğitim; örgün eğitim dönemi dışında çalışan ya da çalışmayan tüm yetişkinlere ve ayrıca da örgün eğitime devam etmekte olan tüm bireylere açıktır. Bu eğitim yüz yüze görüşmelerden, sınıflardan ve genel yer ve zaman bağımsızlığından, kitle iletişimi ve bireyselleşme kombinasyonundan, öğrenci bağımsızlığıyla ilgili potansiyellerinden ve özgün yönteminden dolayı, geleneksel yüz yüze eğitimin bir yedeği kabul edilemeyecek kadar ayrı bir eğitim türüdür (Holmberg,1989). Uzaktan eğitimde öğrenciler ve öğretmenler farklı yerlerdedirler. Bu eğitimde öğrenciler kendi hızlarında öğrenebilirler. Öğrenciler; öğrenme yöntemlerini, öğrendiklerinin içeriğini ve ağırlığını, amaçları ve ölçütleri kontrol edebilirler ya da şekillendirebilirler ve öğrendiklerini değerlendirebilirler. Ayrıca, uzaktan eğitim uygulamalarında öğretmenler ayrıntılı düşünmek için zaman bulur ve sınıfta ulaşılamayan kaynakları kullanabilirler (Kaya, 2002). Uzaktan eğitimde öğretmen ile öğrenci arasındaki iletişimi ve grup çalışmasını uygun zamanlara ayarlamak kolay değildir. Bu durum; öğrenme sürecinde istenmeyen ertelenmelere neden olabilmekte; öğrenim sürecinin gözlemini olanaksız kılabilmekte; öğretmen öğrenci ilişkisini engelleyebilmekte ve toplu etkinliğe engel olabilmektedir. Bunlar, mesafeden çok açıklığın sonuçlarıdır. Uzaktan eğitim öğrencisi ile bağlantılı olarak bu

The Turkish Online Journal of Educational Technology – TOJET January 2005 ISSN: 1303-6521 volume 4 Issue 1
Copyright The Turkish Online Journal of Educational Technology 2002 108
tür olası aksaklıkları belirlerken; öğrencilerin gereksinimleri, mesafe biçiminin gücü, karşılanamayacak gereksinimleri ve gereksinimlerin karşılanan bölümleri arasındaki boşluklarla mücadele etmenin olanaklı yolları göz önünde tutulur ve dengelenirse, uzaktan eğitim, açıklığı nedeniyle statükoyu ortadan kaldırmanın da bir yolu olabilir. ARAŞTIRMANIN AMACI Bu araştırmanın amacı, Gazi Üniversitesi’nin uzaktan eğitim potansiyelini ortaya koymaktır. Araştırma iki aşamadan oluşmaktadır. Birinci aşamada, öğretim elemanlarının uzaktan eğitim yaklaşımına yönelik tutumları ve öğretim elemanlarının bu yöndeki katkılarının belirlenmesi ve ikinci aşamada da Üniversitenin uzaktan eğitime hazır bulunuşluluk düzeyinin insangücü ve insangücü dışı kaynaklar açısından nasıl bir yapı oluşturduğu ortaya konulmaya çalışılmıştır. Burada sadece birinci bölümle ilgili bulgulara yer verilecektir. Araştırma kapsamında aşağıdaki sorulara cevap aranmıştır; 1. Öğretim elemanlarının uzaktan eğitime yönelik tutumları nasıldır? 2. Öğretim elemanlarının uzaktan eğitime yönelik tutumları unvanlarına göre farklılık göstermekte midir? 3. Öğretim elemanlarının uzaktan eğitim uygulamalarına katkı getirebilecekleri boyutlara ilişkin görüşleri nelerdir? YÖNTEM Araştırma, tarama modelinde betimsel bir nitelik taşımaktadır. Araştırmayla öğretim elemanlarının uzaktan eğitime yönelik tutumları ve uzaktan eğitim uygulamalarına ilişkin katkı getirebilecekleri çalışma boyutları belirlenmeye çalışılmıştır. Araştırmanın evrenini Gazi Üniversitesi’ne bağlı tüm fakülte ve yüksek okullardaki öğretim elemanları oluşturmaktadır. Araştırmada örneklem alma yoluna gidilmemiş tüm evrene ulaşılmaya çalışılmıştır. Bu doğrultuda Gazi Üniversitesi bünyesindeki tüm fakültelerde görevli toplam 3753 öğretim elemanına veri toplama aracı gönderilmiştir. Ancak gönderilen veri toplama araçlarından 1379 tanesi geri dönmüş ve değerlendirmeler bu veriler üzerinde yapılmıştır. Araştırmada öğretim elemanlarının uzaktan eğitime yönelik tutumlarını tespit etmek amacıyla likert tipi tutum ölçeği, öğretim elemanlarının uzaktan eğitim uygulamalarında katkı getirebilecekleri çalışma boyutlarını belirlemek amacıyla da 18 maddelik anket kullanılmıştır. Araştırmada kullanılan uzaktan eğitim tutum ölçeği araştırmacılar tarafından geliştirilmiştir. Öncelikle bir tutum ölçeği hazırlanacağı zaman, ölçülmek istenilen belli bir tutumla ilişkili olduğu düşünülen çok sayıda olumlu ve olumsuz biçimde ifade edilmiş tutum cümlesine ihtiyaç olacağından hareketle, araştırmacılar tarafından öncelikle benzer türdeki ölçekler incelenerek ilgili yayınlar taranmış ve konuyla ilgili 15 tutum cümlesi belirlenmiştir. 9’u olumlu 6’sı olumsuz olan cümleler 5’li likert ölçeğinde “Asla Katılmam”, “Katılmam”, “Kararsızım”, “Katılırım”, “Kuvvetle Katılırım”, şeklinde derecelendirilmiştir. Daha sonra, belirlenen tutum cümleleriyle hazırlanan ölçek, cümlelerin analizi açısından uzman görüşüne sunulmuş ve gerekli düzenlemelerden sonra bir ön deneme mahiyetinde 200 kişilik bir gruba uygulanmıştır. Uygulama sonucunda elde edilen veriler bilgisayar ortamına (SPSS’e) aktarılırken olumlu cümleler “Kuvvetle Katılırım” seçeneğinden “Asla Katılmam” seçeneğine doğru 5,4,3,2,1 şeklinde puanlanmış, olumsuz cümlelerde ise bunun tam tersi bir yol izlenerek “Kuvvetle Katılırım” seçeneğinden “Asla Katılmam” seçeneğine doğru 1,2,3,4,5 şeklinde puanlanmıştır. Aracın yapı geçerliği faktör analizi ile incelenmiştir. Faktör analizi uygulaması ile 15 maddeden oluşan "Uzaktan Eğitim Tutum Ölçeği"nin tek ya da çok faktörlü olup olmadığı saptanmaya çalışılmıştır. Bu amaçla toplanan veriler üzerinde bir faktör analizi tekniği olan Temel Bileşenler Analizi ve bununla birlikte, ölçeğin birbirinden bağımsız alt faktörlerini belirlemek için varimax dik döndürme yöntemi kullanılmıştır. Alt kesme noktası olarak .45 alınmıştır. Yapılan analiz sonucunda Eigen değeri 1 ve üstünde iki faktör belirlenmiştir. Bu durumun ölçeğin hazırlanmasında dikkate alınan iki temel yapıyı (uzaktan eğitime güven duyma, uzaktan eğitime ilgi duyma) yansıttığı düşünülmüştür. Yapılan analiz sonucunda faktör yük değerlerinin, iki faktör için de .55 ile .76 arasında yüksek düzeyde değiştiği görülmektedir. İki faktörlü olarak saptanan "Uzaktan Eğitime Yönelik Tutum Ölçeği"nin, her bir alt faktör için güvenirliğin bir göstergesi olarak, alfa iç tutarlık katsayısı ve bu kapsamda madde toplam korelasyonları hesaplanmıştır. Madde toplam korelasyonları I. Faktör için .51 ile .69; II. Faktör için .28 ile .70 arasında değişmektedir. Bu değerlere

The Turkish Online Journal of Educational Technology – TOJET January 2005 ISSN: 1303-6521 volume 4 Issue 1
Copyright The Turkish Online Journal of Educational Technology 2002 109
göre, her bir maddenin, katılımcıların uzaktan eğitime yönelik tutumlarını iyi ayırt ettiği söylenebilir. Diğer taraftan her bir faktörün açıkladığı varyans oranı da sırasıyla % 26.8, % 25.2 ve toplam olarak %52'dir. I. Faktör için alfa katsayısı .78 olarak hesaplanırken, aynı katsayı II. Faktör için .81'dir. Ölçeğin toplamından elde edilen alfa katsayısı ise .87’dir. Bu yapısıyla ölçeğin oldukça güvenilir bir ölçek olduğu söylenebilir. Geliştirilen ölçek ve anketin uygulanması sonucunda elde edilen verilerin analizinde SPSS paket programı kullanılmıştır. Her bir davranışa yönelik tutum düzeylerini belirlemede ortalama ve standart sapma, gruplar arasındaki karşılaştırmalarda t-testi ve tek yönlü varyans analizi kullanılmıştır. Görüşler arasında anlamlı bir farklılık olmadığı α= 0.05 düzeyinde test edilmiştir. BULGULAR VE YORUMLAR Bu bölümde araştırma verilerinden elde edilen bulgulara ve bulgular ile ilgili yorumlara yer verilmiştir. A. Kişisel Bilgiler Bu kesimde araştırmaya katılan öğretim elemanlarıyla ilgili kişisel bilgilere yer verilmiştir. 1. Öğretim Elemanlarının Görev Yaptıkları Fakültelere ve Unvanlarına Göre Dağılımları Araştırmaya katılan öğretim elemanlarının görev yaptıkları kurum ve unvanlarına göre dağılımları tablo 1’de verilmektedir. Tablo 1. Öğretim Elemanlarının Görev Yaptıkları Fakültelere ve Unvanlarına Göre Dağılımları
ÜNVAN Prof Doç Yrd.Doç. Öğ.Gör. Okutman Araş.Gör. TOPLAM GÖREV
YAPILAN KURUM f % f % f % f % f % f % f %
Çorum İk.İd.Bil.F. 1 7.1 1 7.1 2 14.3 2 14.3 1 7.1 7 50.0 14 100.0
Tıp Fak. 43 44.8 26 27.1 19 19.8 8 8.3 - - - - 96 100.0
Müh.Mi.F. 40 26.7 23 15.3 25 16.7 26 17.3 1 0.7 35 23.3 150 100.0
İk.İd.Bil.F. 12 30.8 10 25.6 10 25.6 2 5.1 - - 5 12.8 39 100.0
Ecz.Fak. 27 55.1 4 8.2 10 20.4 2 4.1 - - 6 12.2 49 100.0
Diş Hek.F. 14 31.8 12 27.3 5 11.4 4 9.1 1 2.3 8 18.2 44 100.0
Fen Ed.F. 18 30.5 11 18.6 20 33.9 1 1.7 3 5.1 6 10.2 59 100.0
Tek.Eğ.Fa. 8 6.4 14 11.2 20 16.0 45 36.0 4 3.2 34 27.2 125 100.0
Gazi Eğ.F. 27 15.6 17 9.8 55 31.8 39 22.5 10 5.8 25 14.5 173 100.0
Ticaret T.F. 1 4.2 4 16.7 4 16.7 7 29.2 - - 8 33.3 24 100.0
İletişim F. 4 8.2 4 8.2 9 18.4 4 8.2 3 6.1 25 51.0 49 100.0
Hukuk F. 2 22.2 3 33.3 4 44.4 - - - - - - 9 100.0
Mes.Eğ.F. 10 9.1 8 7.3 46 41.8 30 27.3 - - 16 14.5 110 100.0 En.Sa.Eğ.F. 1 2.1 3 6.3 12 25.0 16 33.3 - - 16 33.3 48 100.0 Kır.Eğ.F. 1 1.4 2 2.9 20 29.0 28 40.6 13 18.8 5 7.2 69 100.0 Kas.Eğ.F. - - 1 1.8 15 27.3 33 60.0 3 5.5 3 5.5 55 100.0
Çorum İl.F. - - 6 16.2 12 32.4 6 16.2 - - 13 35.1 37 100.0
Kas.Or.F. 1 16.7 - - 5 83.3 - - - - - - 6 100.0 Çor. M.F - - - - 6 60.0 2 20.0 - - 2 20.0 10 100.0 Kır.Fen.Ed. 1 6.7 1 6.7 8 53.3 5 33.3 - - - - 15 100.0 S.H.M.Y.O. - - - - 1 16.7 5 83.3 - - - - 6 100.0 Hem.Y.O. 1 14.3 - - 3 42.9 - - - - 3 42.9 7 100.0 Ço.S.H.M.Y.O. - - - - - - 9 100.0 - - - - 9 100.0
Kas.S.H.M.Y.O
- - - - - - 7 100.0 - - - - 7 100.0
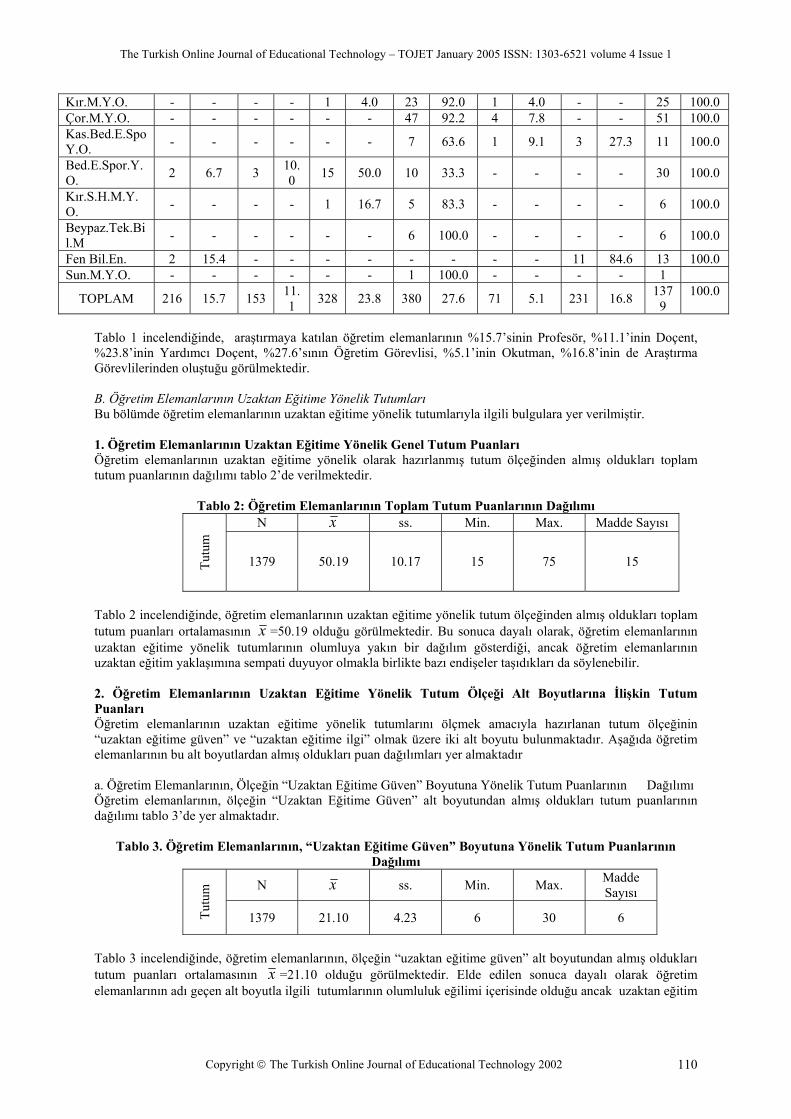
The Turkish Online Journal of Educational Technology – TOJET January 2005 ISSN: 1303-6521 volume 4 Issue 1
Copyright The Turkish Online Journal of Educational Technology 2002 110
Kır.M.Y.O. - - - - 1 4.0 23 92.0 1 4.0 - - 25 100.0 Çor.M.Y.O. - - - - - - 47 92.2 4 7.8 - - 51 100.0 Kas.Bed.E.SpoY.O. - - - - - - 7 63.6 1 9.1 3 27.3 11 100.0
Bed.E.Spor.Y.O. 2 6.7 3 10.
0 15 50.0 10 33.3 - - - - 30 100.0
Kır.S.H.M.Y.O. - - - - 1 16.7 5 83.3 - - - - 6 100.0
Beypaz.Tek.Bil.M - - - - - - 6 100.0 - - - - 6 100.0
Fen Bil.En. 2 15.4 - - - - - - - - 11 84.6 13 100.0 Sun.M.Y.O. - - - - - - 1 100.0 - - - - 1
TOPLAM 216 15.7 153 11.1 328 23.8 380 27.6 71 5.1 231 16.8 137
9 100.0
Tablo 1 incelendiğinde, araştırmaya katılan öğretim elemanlarının %15.7’sinin Profesör, %11.1’inin Doçent, %23.8’inin Yardımcı Doçent, %27.6’sının Öğretim Görevlisi, %5.1’inin Okutman, %16.8’inin de Araştırma Görevlilerinden oluştuğu görülmektedir. B. Öğretim Elemanlarının Uzaktan Eğitime Yönelik Tutumları Bu bölümde öğretim elemanlarının uzaktan eğitime yönelik tutumlarıyla ilgili bulgulara yer verilmiştir. 1. Öğretim Elemanlarının Uzaktan Eğitime Yönelik Genel Tutum Puanları Öğretim elemanlarının uzaktan eğitime yönelik olarak hazırlanmış tutum ölçeğinden almış oldukları toplam tutum puanlarının dağılımı tablo 2’de verilmektedir.
Tablo 2: Öğretim Elemanlarının Toplam Tutum Puanlarının Dağılımı N x ss. Min. Max. Madde Sayısı
Tutu
m
1379 50.19 10.17 15 75 15
Tablo 2 incelendiğinde, öğretim elemanlarının uzaktan eğitime yönelik tutum ölçeğinden almış oldukları toplam tutum puanları ortalamasının x =50.19 olduğu görülmektedir. Bu sonuca dayalı olarak, öğretim elemanlarının uzaktan eğitime yönelik tutumlarının olumluya yakın bir dağılım gösterdiği, ancak öğretim elemanlarının uzaktan eğitim yaklaşımına sempati duyuyor olmakla birlikte bazı endişeler taşıdıkları da söylenebilir. 2. Öğretim Elemanlarının Uzaktan Eğitime Yönelik Tutum Ölçeği Alt Boyutlarına İlişkin Tutum Puanları Öğretim elemanlarının uzaktan eğitime yönelik tutumlarını ölçmek amacıyla hazırlanan tutum ölçeğinin “uzaktan eğitime güven” ve “uzaktan eğitime ilgi” olmak üzere iki alt boyutu bulunmaktadır. Aşağıda öğretim elemanlarının bu alt boyutlardan almış oldukları puan dağılımları yer almaktadır a. Öğretim Elemanlarının, Ölçeğin “Uzaktan Eğitime Güven” Boyutuna Yönelik Tutum Puanlarının Dağılımı Öğretim elemanlarının, ölçeğin “Uzaktan Eğitime Güven” alt boyutundan almış oldukları tutum puanlarının dağılımı tablo 3’de yer almaktadır.
Tablo 3. Öğretim Elemanlarının, “Uzaktan Eğitime Güven” Boyutuna Yönelik Tutum Puanlarının
Dağılımı
N x ss. Min. Max. Madde Sayısı
Tutu
m
1379 21.10 4.23 6 30 6
Tablo 3 incelendiğinde, öğretim elemanlarının, ölçeğin “uzaktan eğitime güven” alt boyutundan almış oldukları tutum puanları ortalamasının x =21.10 olduğu görülmektedir. Elde edilen sonuca dayalı olarak öğretim elemanlarının adı geçen alt boyutla ilgili tutumlarının olumluluk eğilimi içerisinde olduğu ancak uzaktan eğitim
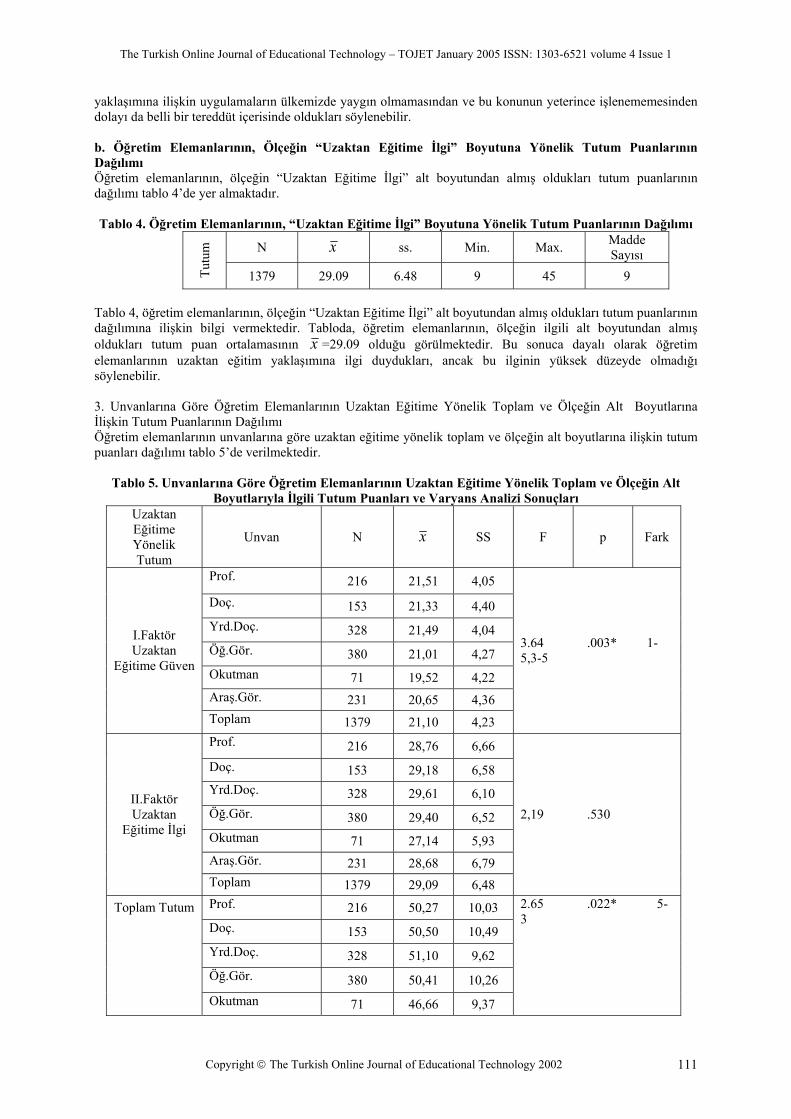
The Turkish Online Journal of Educational Technology – TOJET January 2005 ISSN: 1303-6521 volume 4 Issue 1
Copyright The Turkish Online Journal of Educational Technology 2002 111
yaklaşımına ilişkin uygulamaların ülkemizde yaygın olmamasından ve bu konunun yeterince işlenememesinden dolayı da belli bir tereddüt içerisinde oldukları söylenebilir. b. Öğretim Elemanlarının, Ölçeğin “Uzaktan Eğitime İlgi” Boyutuna Yönelik Tutum Puanlarının Dağılımı Öğretim elemanlarının, ölçeğin “Uzaktan Eğitime İlgi” alt boyutundan almış oldukları tutum puanlarının dağılımı tablo 4’de yer almaktadır. Tablo 4. Öğretim Elemanlarının, “Uzaktan Eğitime İlgi” Boyutuna Yönelik Tutum Puanlarının Dağılımı
N x ss. Min. Max. Madde Sayısı
Tutu
m
1379 29.09 6.48 9 45 9 Tablo 4, öğretim elemanlarının, ölçeğin “Uzaktan Eğitime İlgi” alt boyutundan almış oldukları tutum puanlarının dağılımına ilişkin bilgi vermektedir. Tabloda, öğretim elemanlarının, ölçeğin ilgili alt boyutundan almış oldukları tutum puan ortalamasının x =29.09 olduğu görülmektedir. Bu sonuca dayalı olarak öğretim elemanlarının uzaktan eğitim yaklaşımına ilgi duydukları, ancak bu ilginin yüksek düzeyde olmadığı söylenebilir. 3. Unvanlarına Göre Öğretim Elemanlarının Uzaktan Eğitime Yönelik Toplam ve Ölçeğin Alt Boyutlarına İlişkin Tutum Puanlarının Dağılımı Öğretim elemanlarının unvanlarına göre uzaktan eğitime yönelik toplam ve ölçeğin alt boyutlarına ilişkin tutum puanları dağılımı tablo 5’de verilmektedir.
Tablo 5. Unvanlarına Göre Öğretim Elemanlarının Uzaktan Eğitime Yönelik Toplam ve Ölçeğin Alt
Boyutlarıyla İlgili Tutum Puanları ve Varyans Analizi Sonuçları Uzaktan Eğitime Yönelik Tutum
Unvan N x SS F p Fark
Prof. 216 21,51 4,05 Doç. 153 21,33 4,40 Yrd.Doç. 328 21,49 4,04 Öğ.Gör. 380 21,01 4,27 Okutman 71 19,52 4,22 Araş.Gör. 231 20,65 4,36
I.Faktör Uzaktan
Eğitime Güven
Toplam 1379 21,10 4,23
3.64 .003* 1-5,3-5
Prof. 216 28,76 6,66 Doç. 153 29,18 6,58 Yrd.Doç. 328 29,61 6,10 Öğ.Gör. 380 29,40 6,52 Okutman 71 27,14 5,93 Araş.Gör. 231 28,68 6,79
II.Faktör Uzaktan
Eğitime İlgi
Toplam 1379 29,09 6,48
2,19 .530
Prof. 216 50,27 10,03 Doç. 153 50,50 10,49 Yrd.Doç. 328 51,10 9,62 Öğ.Gör. 380 50,41 10,26
Toplam Tutum
Okutman 71 46,66 9,37
2.65 .022* 5-3
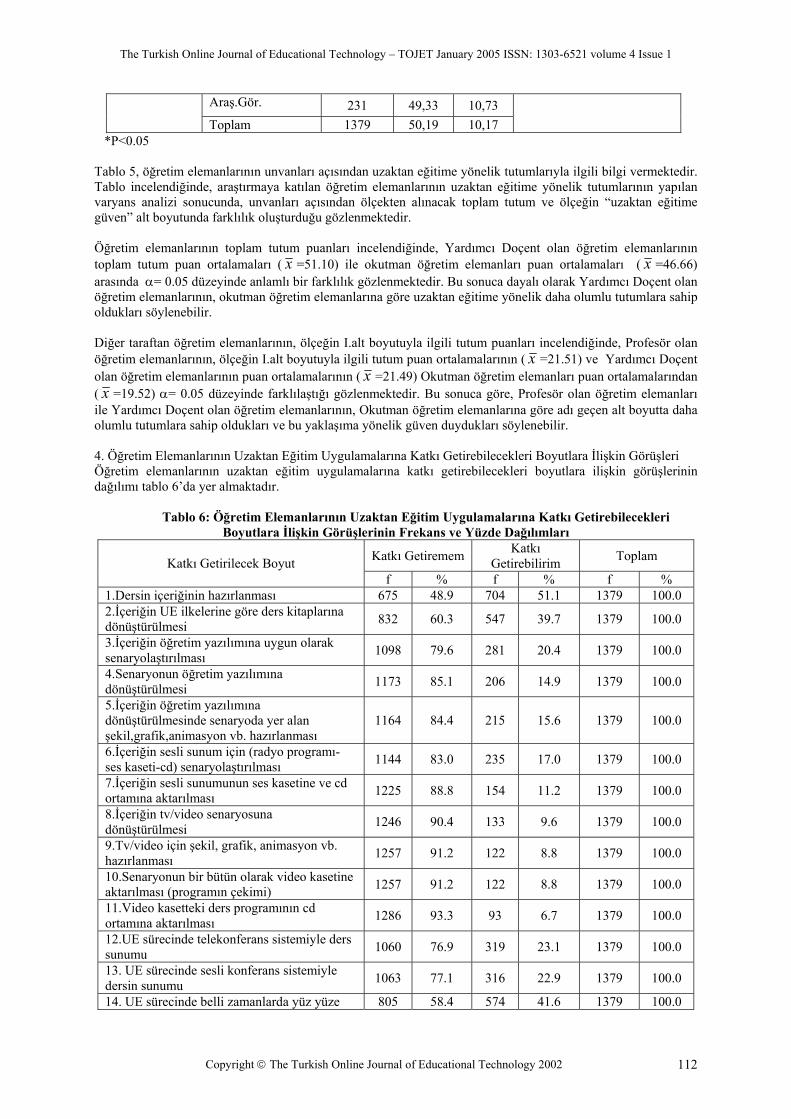
The Turkish Online Journal of Educational Technology – TOJET January 2005 ISSN: 1303-6521 volume 4 Issue 1
Copyright The Turkish Online Journal of Educational Technology 2002 112
Araş.Gör. 231 49,33 10,73
Toplam 1379 50,19 10,17
*P<0.05 Tablo 5, öğretim elemanlarının unvanları açısından uzaktan eğitime yönelik tutumlarıyla ilgili bilgi vermektedir. Tablo incelendiğinde, araştırmaya katılan öğretim elemanlarının uzaktan eğitime yönelik tutumlarının yapılan varyans analizi sonucunda, unvanları açısından ölçekten alınacak toplam tutum ve ölçeğin “uzaktan eğitime güven” alt boyutunda farklılık oluşturduğu gözlenmektedir. Öğretim elemanlarının toplam tutum puanları incelendiğinde, Yardımcı Doçent olan öğretim elemanlarının toplam tutum puan ortalamaları ( x =51.10) ile okutman öğretim elemanları puan ortalamaları ( x =46.66) arasında α= 0.05 düzeyinde anlamlı bir farklılık gözlenmektedir. Bu sonuca dayalı olarak Yardımcı Doçent olan öğretim elemanlarının, okutman öğretim elemanlarına göre uzaktan eğitime yönelik daha olumlu tutumlara sahip oldukları söylenebilir. Diğer taraftan öğretim elemanlarının, ölçeğin I.alt boyutuyla ilgili tutum puanları incelendiğinde, Profesör olan öğretim elemanlarının, ölçeğin I.alt boyutuyla ilgili tutum puan ortalamalarının ( x =21.51) ve Yardımcı Doçent olan öğretim elemanlarının puan ortalamalarının ( x =21.49) Okutman öğretim elemanları puan ortalamalarından ( x =19.52) α= 0.05 düzeyinde farklılaştığı gözlenmektedir. Bu sonuca göre, Profesör olan öğretim elemanları ile Yardımcı Doçent olan öğretim elemanlarının, Okutman öğretim elemanlarına göre adı geçen alt boyutta daha olumlu tutumlara sahip oldukları ve bu yaklaşıma yönelik güven duydukları söylenebilir. 4. Öğretim Elemanlarının Uzaktan Eğitim Uygulamalarına Katkı Getirebilecekleri Boyutlara İlişkin Görüşleri Öğretim elemanlarının uzaktan eğitim uygulamalarına katkı getirebilecekleri boyutlara ilişkin görüşlerinin dağılımı tablo 6’da yer almaktadır.
Tablo 6: Öğretim Elemanlarının Uzaktan Eğitim Uygulamalarına Katkı Getirebilecekleri Boyutlara İlişkin Görüşlerinin Frekans ve Yüzde Dağılımları
Katkı Getiremem Katkı Getirebilirim Toplam Katkı Getirilecek Boyut
f % f % f % 1.Dersin içeriğinin hazırlanması 675 48.9 704 51.1 1379 100.0 2.İçeriğin UE ilkelerine göre ders kitaplarına dönüştürülmesi 832 60.3 547 39.7 1379 100.0
3.İçeriğin öğretim yazılımına uygun olarak senaryolaştırılması 1098 79.6 281 20.4 1379 100.0
4.Senaryonun öğretim yazılımına dönüştürülmesi 1173 85.1 206 14.9 1379 100.0
5.İçeriğin öğretim yazılımına dönüştürülmesinde senaryoda yer alan şekil,grafik,animasyon vb. hazırlanması
1164 84.4 215 15.6 1379 100.0
6.İçeriğin sesli sunum için (radyo programı- ses kaseti-cd) senaryolaştırılması 1144 83.0 235 17.0 1379 100.0
7.İçeriğin sesli sunumunun ses kasetine ve cd ortamına aktarılması 1225 88.8 154 11.2 1379 100.0
8.İçeriğin tv/video senaryosuna dönüştürülmesi 1246 90.4 133 9.6 1379 100.0
9.Tv/video için şekil, grafik, animasyon vb. hazırlanması 1257 91.2 122 8.8 1379 100.0
10.Senaryonun bir bütün olarak video kasetine aktarılması (programın çekimi) 1257 91.2 122 8.8 1379 100.0
11.Video kasetteki ders programının cd ortamına aktarılması 1286 93.3 93 6.7 1379 100.0
12.UE sürecinde telekonferans sistemiyle ders sunumu 1060 76.9 319 23.1 1379 100.0
13. UE sürecinde sesli konferans sistemiyle dersin sunumu 1063 77.1 316 22.9 1379 100.0
14. UE sürecinde belli zamanlarda yüz yüze 805 58.4 574 41.6 1379 100.0
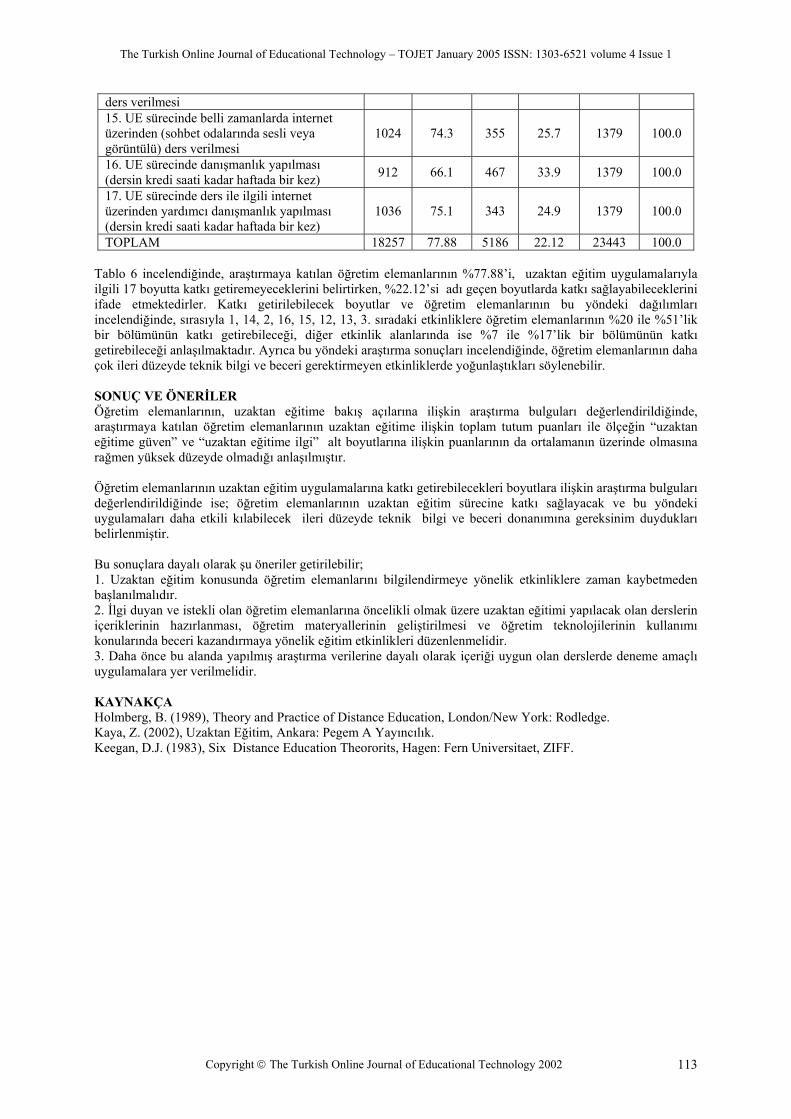
The Turkish Online Journal of Educational Technology – TOJET January 2005 ISSN: 1303-6521 volume 4 Issue 1
Copyright The Turkish Online Journal of Educational Technology 2002 113
ders verilmesi 15. UE sürecinde belli zamanlarda internet üzerinden (sohbet odalarında sesli veya görüntülü) ders verilmesi
1024 74.3 355 25.7 1379 100.0
16. UE sürecinde danışmanlık yapılması (dersin kredi saati kadar haftada bir kez) 912 66.1 467 33.9 1379 100.0
17. UE sürecinde ders ile ilgili internet üzerinden yardımcı danışmanlık yapılması (dersin kredi saati kadar haftada bir kez)
1036 75.1 343 24.9 1379 100.0
TOPLAM 18257 77.88 5186 22.12 23443 100.0
Tablo 6 incelendiğinde, araştırmaya katılan öğretim elemanlarının %77.88’i, uzaktan eğitim uygulamalarıyla ilgili 17 boyutta katkı getiremeyeceklerini belirtirken, %22.12’si adı geçen boyutlarda katkı sağlayabileceklerini ifade etmektedirler. Katkı getirilebilecek boyutlar ve öğretim elemanlarının bu yöndeki dağılımları incelendiğinde, sırasıyla 1, 14, 2, 16, 15, 12, 13, 3. sıradaki etkinliklere öğretim elemanlarının %20 ile %51’lik bir bölümünün katkı getirebileceği, diğer etkinlik alanlarında ise %7 ile %17’lik bir bölümünün katkı getirebileceği anlaşılmaktadır. Ayrıca bu yöndeki araştırma sonuçları incelendiğinde, öğretim elemanlarının daha çok ileri düzeyde teknik bilgi ve beceri gerektirmeyen etkinliklerde yoğunlaştıkları söylenebilir. SONUÇ VE ÖNERİLER Öğretim elemanlarının, uzaktan eğitime bakış açılarına ilişkin araştırma bulguları değerlendirildiğinde, araştırmaya katılan öğretim elemanlarının uzaktan eğitime ilişkin toplam tutum puanları ile ölçeğin “uzaktan eğitime güven” ve “uzaktan eğitime ilgi” alt boyutlarına ilişkin puanlarının da ortalamanın üzerinde olmasına rağmen yüksek düzeyde olmadığı anlaşılmıştır. Öğretim elemanlarının uzaktan eğitim uygulamalarına katkı getirebilecekleri boyutlara ilişkin araştırma bulguları değerlendirildiğinde ise; öğretim elemanlarının uzaktan eğitim sürecine katkı sağlayacak ve bu yöndeki uygulamaları daha etkili kılabilecek ileri düzeyde teknik bilgi ve beceri donanımına gereksinim duydukları belirlenmiştir. Bu sonuçlara dayalı olarak şu öneriler getirilebilir; 1. Uzaktan eğitim konusunda öğretim elemanlarını bilgilendirmeye yönelik etkinliklere zaman kaybetmeden başlanılmalıdır. 2. İlgi duyan ve istekli olan öğretim elemanlarına öncelikli olmak üzere uzaktan eğitimi yapılacak olan derslerin içeriklerinin hazırlanması, öğretim materyallerinin geliştirilmesi ve öğretim teknolojilerinin kullanımı konularında beceri kazandırmaya yönelik eğitim etkinlikleri düzenlenmelidir. 3. Daha önce bu alanda yapılmış araştırma verilerine dayalı olarak içeriği uygun olan derslerde deneme amaçlı uygulamalara yer verilmelidir.
KAYNAKÇA Holmberg, B. (1989), Theory and Practice of Distance Education, London/New York: Rodledge. Kaya, Z. (2002), Uzaktan Eğitim, Ankara: Pegem A Yayıncılık. Keegan, D.J. (1983), Six Distance Education Theororits, Hagen: Fern Universitaet, ZIFF.
The Turkish Online Journal of Educational Technology – TOJET January 2005 ISSN: 1303-6521 volume 4 Issue 1
Copyright The Turkish Online Journal of Educational Technology 2002 114
GÖÇMEN TÜRKLERE YÖNELİK UZAKTAN ÖĞRETİM UYGULAMASI (F.Almanya’daki Türklerin Eğitim Sorunları ve Anadolu Üniversitesi’nin Batı Avrupa Programları)
Yrd.Doç.Dr.Ahmet Atillâ DOĞAN
Açıköğretim Fakültesi [email protected]
GİRİŞ Batı Avrupa Türkiye Cumhuriyeti vatandaşlarının yurtdışı göçünde önemli bir merkezdir. İkili anlaşmalardan çok daha önce, ikinci Dünya Savaşı sonunda ticari gemiler ile Hamburg’a gelen Türk denizcilerinin çeşitli nedenler ile bu şehirde kalarak resmi olmayan bir işçi göçü başlattıkları söylenir. Türk işgücü göçü zaman içinde Türkiye Cumhuriyeti ve F. Almanya Cumhuriyeti’nin anlaşması ile kitlesel hale dönüşmüştür. Çalışma ve Sosyal Güvenlik Bakanlığı verilerine göre Batı Avrupa ülkelerindeki Türkiye Cumhuriyeti vatandaşlarının sayısı üç milyonun biraz üzerindedir. Bu sayının içinde Almanya’daki göçmenlerimizin sayısı ise iki milyonun biraz üzerindedir. Bu verilere göre Almanya dışındaki 14 ülkede yerleşik göçmen sayımız yaklaşık bir milyon iken, Almanya’da bunun iki katı göçmenimiz yaşamaktadır. Bu nedenle Türkiye’nin yurtdışı göçü bir anlamda Almanya göçüdür ve göçmen Türkler denildiğinde Almanya’daki Türkler akla gelmektedir. (Bkz. Çalışma ve Sosyal Güvenlik Bakanlığı Web Sitesi) Başlangıcından bu yana Türklerin yurtdışına göçü ve bu göçün getirdiği sorunlar dönemler içinde değerlendirilmiş ve çözümler aranmıştır. Özellikle ailelerin birleşmesi ve Avrupa doğumlu çocukların artmasıyla Türk çocuklarının her düzeydeki eğitim ve öğretimi özel bir durum arz etmiştir. Resmi rakamlara göre sayıları iki milyonun biraz üzerinde görünen Almanya göçmenlerimizin sayısı Alman vatandaşlığına geçenlerin, Alman nüfusu içinde gösterilmeleri nedeniyle giderek düşmektedir. Ancak kağıt üzerindeki bu düşüşe karşı doğum ve Türkiye’den evlilik yoluyla Almanya’da sayıları giderek artan Türklerin, resmi kayıtlardaki azalmaları, onların sorunlarının ve Türkiye ile bağlarının azaldığı anlamına gelmemektedir. Bu bağlamda Almanya; göçmen Türklerin eğitim sorunları kapsamında da önde gelen bir ülke durumundadır. ALMANYA’DAKİ GÖÇMEN TÜRKLERİN SAYISAL DAĞILIMI Türk göçmenlerin yaş gruplarına göre dağılımını incelediğimizde 0-29 yaş arası grubun toplam Türk nüfusunun yaklaşık % 60’ını oluşturduğunu görüyoruz. İstatistiklerin ayrıntılarına baktığımızda, erkek sayımızın,(1.147.178) kadın sayımızdan (960.248) yaklaşık 200 bin fazla olduğu ve nüfus yoğunluğunda 15-29 yaş arası grubun ilk sırayı aldığı dikkati çekmektedir. Anaokulu (Kindergarten) çağındaki çocuk nüfusumuzu dışarda bırakmak kaydıyla yapılan hesapta 25 yaşına kadar olan ilk, orta ve yükseköğrenim çağındaki nüfusumuzun genel nüfusa oranı yaklaşık % 40'a ulaşmış durumdadır. (T.C.Berlin Çalışma ve Sosyal Güvenlik Müşavirliği, 2000) ALMANYA’DA OKUL SİSTEMİ Almanya’da eyalet sistemine dayalı bir yönetim biçiminin gereği olarak eğitim-öğretim işleri doğrudan eyaletlerin yetki ve sorumluluklarına bırakılmıştır. Bu nedenle eyaletlerin eğitim sistemleri arasında bazı farklılıklar vardır. Ancak genel ilkeler ve amaçlarla zorunlu eğitim, okul kademeleri, yönlendirme sınıfları, mesleki eğitim gibi temel konularda eyaletler arasında büyük ölçüde işbirliktelik sağlanmıştır. Bu konuda eşgüdümü Eğitim Bakanları Konseyi gerçekleştirir. Almanya’da zorunlu eğitim süresi 10 yıldır. Alman okul sistemine Kuzey Ren Vestfalya Eyaleti örneğinde baktığımızda, ilkokul (Grundschule) eğitiminin dört yıl sürdüğünü görmekteyiz. İlkokulda başarı düzeyi ne olursa olsun, bütün öğrenciler aynı sınıfa devam ederler. Dördüncü sınıfın sonunda çocuğun bütün hayatını etkileyecek bir okul seçimi yapılır. Ancak 10 yaşında bir çocuğun belli bir okul seçmeye zorlanması eğitim-cilerin tepkisine yol açmıştır. Bu nedenle "Orientierungsstufe" (yönlendirme sınıfları) diye adlandırılan bir geçiş basamağı ortaya çıkmıştır. Bununla dördüncü sınıfın sonunda verilebilecek kararın altıncı sınıfın sonuna kadar düzeltilebilmesi söz konusudur. ( Sağlam, 1994) Böylece öğrenim düzeyi düşük öğrencilere iki yıl daha şans tanınmaktadır. Zorunlu eğitimin dört yıllık bölümünü oluşturan ilkokulu bitiren öğrencinin önünde dört okuldan birini seçme imkanı bulunmaktadır. Bunlar Hauptschule, Realschule, Gesamtschule ve Gymnasium’dur. Zorunlu eğitim süresi bu okul türlerinde altı yıl okuyarak doldurulabilir. (Stadt Köln, 2000) İlkokulun dördüncü sınıfından başarı düzeyi en yüksek olan öğrenciler Gymnasium’a gider burada öğretim beşinci sınıfta başlar ve onüçüncü sınıfın sonuna kadar sürer. Gymnasium’u bitiren öğrenciler, "Abitur" alırlar ve

The Turkish Online Journal of Educational Technology – TOJET January 2005 ISSN: 1303-6521 volume 4 Issue 1
Copyright The Turkish Online Journal of Educational Technology 2002 115
not ortalamalarına göre istedikleri üniversiteye veya meslek yüksekokuluna girebilirler. Ancak onüçüncü sınıf lise bitirme dönemidir. Liseyi bitiren öğrencinin not ortalaması üniversiteye girmede çok büyük rol oynar. Örneğin Gynasium’u 1 veya 2 not ortalaması ile bitiren bir öğrenci doğrudan üniversitelerin her bölümüne girebileceği halde, not ortalaması 3 olan bir öğrenci istediği bölüme giremeyebilir ve beklemek zorunda kalabilir. (NRW Rehberi, 2000) Meslek Okulları: Almanya’da meslek eğitimi için bir işyeri bulamayan öğrenciler 18 yaşını doldurana kadar meslek okullarına giderler. Meslek eğitim yeri bulanlar ise çıraklık eğitimi süresince haftanın belirli günlerinde meslek okullarında kendi branşı çerçevesinde eğitim görür. Tanımlanan tüm okul türleri, öğrencilerin başarı durumuna göre birbirlerine yatay geçiş olanağı tanır. Bu olanak akşam liselerine, meslek kolejlerine gitmek suretiyle de sağlanabilir. Bu tür okullara girme koşulları, meslek eğitimi yapmış ve 18 yaşı doldurmuş olmaktır. (Özsınmaz, 2000) ALMAN OKUL SİSTEMİ İÇİNDEKİ SORUNLAR 1998/1999 yılı verilerine göre Almanya’da 12 milyon 709 bini Alman, 1 Milyon 178 bini yabancı olmak üzere yaklaşık 13 Milyon 887 bin öğrenci öğrenim görmektedir. Aynı verilere göre Almanya’da eğitim gören 1.178.848 yabancı öğrencinin yarısına yakınını (500.764) Türk çocukları oluşturmaktadır. Çeşitli araştırmalar bu öğrencilerin çoğunun gelecekte kendi ülkelerine geri dönmeyecekleri ve Alman toplumu tarafından asimilasyona zorlanacakları doğrultusunda bulgular ortaya koymaktadır. Diğer taraftan Türk öğrencilerin çeşitli okul tiplerine göre dağılımını incelediğimizde, çoğunluğun geleceğin işçilerini yetiştiren okullara yönlendiği görülmektedir. (Daten Report, 1999) Almanya’da çeşitli okullarda okuyan Türk - Alman ve diğer yabancı öğrencileri toplam öğrenci sayısına göre karşılaştırdığımızda ise; Türklerin, diğerlerine göre, başarı düzeyleri düşük öğrencilerin devam ettikleri okullarda yoğunlaştıklarını, bu durumdan daha da kötüsü, Türk öğrencilerin Hauptschule’de dahi başarılı olamadıklarını görüyoruz. Öğrencilerimizin başarısız olmalarının nedenleri, Berlin Türk Veliler Birliği Başkanı tarafından; Alman eğitim sisteminin tek kültürlü yapıya sahip olması, Türk çocuklarının yeterli almanca bilmemesi, velilerin ilgisizliği ve Türkiye’nin Almanya’nın gerçeklerine uygun program geliştirememeleri biçiminde özetlemektedir. (Aydın, 2000) Almanya Türk Öğretmen Dernekleri Federasyonu Başkanı ise, "Alman Okullarındaki Türk Çocukları" başlıklı yazısında; "Almanya’da yaklaşık 2 milyon 200 bin Türk yaşıyor. Bunlardan aşağı, yukarı yarım milyonu, bir şekilde Almanya’daki bir eğitim kurumuna devam ediyor. Sayısal olarak düşünüldüğü zaman çok büyük bir potansiyel olduğu ortada. Yalnız bu öğrencilerin başarı durumları ve gittikleri okullar incelendiği zaman durum maalesef hiç iç açıçı değil. Gymnasium ve Realschule olarak adlandırılan okullara giden Türk öğrencilerin sayısı az. Hauptschule ve Sonderschule’ye giden çocukların sayıları Alman arkadaşlarına göre daha fazla. Okullardaki başarısızlık oranı da Alman arkadaşlarına göre çok daha yüksek. Çoğu diploma almadan, bir meslek sahibi olmadan iş piyasasına atılmak zorunda kalıyor. Eğitimsiz, mesleksiz olarak katıldıkları bu piyasada hayal kırıklıkları ve bir yığın olumsuzluklarla karşılaşıp, yaşamları süresince dışlanmışlık duygusu içinde mutsuz oluyorlar." demektedir. (Atay, 2000) Tüm bu bilgi ve veriler biraraya getirildiğinde ortaya çıkan tablo şudur. Almanya’da yaşayan Türk öğrencilerin çoğu diğer yabancılara ve Almanlara göre en düşük eğitim derecesi veren okullara gidebilmekte, bu okul türlerinde dahi bir çoğu diploma alamamakta, bitirebilenler ise bu eğitimin amaçladığı mesleki yetiştirme sisteminde yerlerini bulamamaktadır. Öğrencilerimizin başarısızlığı, sistemin dışında özel nedenlere de dayanmaktadır. Aileler, çocuklarının daha başarılı olmasını isterken, bunu gerektiren şartların hazırlanmasını çoğunlukla gözardı etmektedir. Aile içi ilişkiler, bağımsız çalışma odası, sağlıklı beslenme ve spor, çevre ilişkileri ve kültürel beslenme gibi kriterlere önem veren ailelerde yetişen çocukların, seçici Alman eğitim sisteminde dahi başarılı olduğu görülmektedir. Ancak ne yazıktır ki, Almanya’daki ailelerimizin büyük bir çoğunluğunun bugüne değin çocuğun başarısını sağlayan alt yapıya gereken önemi vermediği görülmektedir. Almanya’da temel eğitim, meslek eğitimi, lise eğitimi ve yükseköğretim seviyelerinde olan gençlerimizin yıllardır çözülemeyen sorunları, her yıl yeniden tazelenmektedir. Göçmenlerimizin eğitim konusundaki bazı
The Turkish Online Journal of Educational Technology – TOJET January 2005 ISSN: 1303-6521 volume 4 Issue 1
Copyright The Turkish Online Journal of Educational Technology 2002 116
talepleri neden çözümsüzdür? Özellikle Almanya’da yaşamakta iken, kendisini iki kültürde yetiştirmek isteyen gençlerimizin bu isteği nasıl çözümlenecektir? Türk dilini en iyi düzeyde bilme isteğine nasıl cevap verilecektir? Yılların birikimi bu sorunlar bugün için çözülemediği gibi, mevcut sistemle yakın bir gelecekte dahi çözümsüz görünmektedir. Bunun bir nedeni iki ülke arasında kalan bir toplum olmanın getirdiği sıkıntıların yanısıra, sorunların çözümü yönünde kullanılan geleneksel yöntemlerden de kaynaklanmaktadır. Geleneksel yöntemi zaman içinde verimsiz kılan üç önemli değişiklik olmuştur. Bunlardan birincisi insanlar için aynı mekanda bir araya gelmenin maliyetindeki büyük artış, ikincisi ise öğrenci olmak yani biraraya gelmek isteyenlerin sayısındaki artıştır. Bu iki değişiklik, artan sayıdaki isteklilerin öğretimden yararlanamaz, kamu kurumlarını da bu hizmeti gereğince sunamaz hale getirmiştir. Bu arada gelişen üçüncü büyük değişiklik ise öncekilerin yarattığı soruna çözüm teşkil etmiştir: Bu değişiklik, kitle iletişim araçlarındaki büyük teknolojik gelişmedir. Bu teknolojik gelişme, vazgeçilmez koşullarda yüz yüze gelmek de dahil olarak, iletişim araçlarının en uygun karışımla kullanılması yoluyla çağımızın eğitim sorununa uzaktan öğretim çözümünü kazandırmıştır. Eğitim ve öğretim hizmetleri bu sayede geniş kitlelerin yararına açılmıştır. Bugün Türkiye’de ve Almanya’da çözemediğimiz eğitim sorunlarına çözüm için geleneksel eğitimin yanına, çağdaş yöntemleri de ekleyerek çözme gayreti gösterilmektedir. İçinde yaşadığımız çağın sınırsız ve sınıfsız bir eğitim ortamı yaratılması için sunduğu olanakları dikkate alan Anadolu Üniversitesi, Batı Avrupa eğitim hizmetlerini de uzaktan öğretim teknolojisini kullanarak gerçekleştirmektedir. Genel kabul görmüş uygulama başarısı dikkate alındığında Anadolu Üniversitesi bu gayreti 1982’den beri Türkiye’de, 1987’den beri de Batı Avrupa ülkelerinde kitlesel bir talebe cevap vermek üzere yürütmektedir. (Doğan, 1999) SINIR TANIMAYAN ÜNİVERSİTE Amerika, İngiltere, Fransa, Almanya, İtalya, Avusturalya, Japonya gibi pek çok gelişmiş ülkede uzaktan öğretim modelleri uygulanmakta ve binlerce kişiye öğrenim olanağı sağlanmaktadır. Bugün Anadolu Üniversitesi tarafından uygulanan sistem batılı modeller ile eşdeğerde sürdürülmektedir. Anadolu Üniversitesi modelinde; ders kitaplarının yanı sıra radyo, video, televizyon, bilgisayar, internet ve gibi teknolojinin sağladığı olanakların bir arada kullanımı mümkün olabilmektedir. Ayrıca yüz yüze eğitim, deneme sınavları, internette tartışma grupları ve online danışmanlık hizmetleri uygulanmaktadır. Anadolu Üniversitesi Almanya’nın Köln kentinde, kurduğu büro aracılığı ile Avrupa’da yükseköğretim ve ortaöğretim hizmeti vermektedir. Üniversitenin Batı Avrupa Programlarında işletme, iktisat, kamu yönetimi, dış ticaret, turizm ve otelcilik, halkla ilişkiler ve bilgi yönetimi alanlarında lisans ve önlisans programları bulunmakta, ayrıca Milli Eğitim Bakanlığı ile işbirliği içinde Açıköğretim Lisesi Yurtdışı Programı ve Açık İlköğretim Okulu Batı Avrupa Programı yürütülmektedir. 1987-2002 yılları arasında yükseköğretim programlarından iki binin üzerinde mezun veren, Anadolu Üniversitesi’nin Batı Avrupa programlarında halen yaklaşık üçbin öğrencisi bulunmaktadır.( Anadolu Üniversitesi Baum ve Bap Koor. Kayıtları) Anadolu Üniversitesi’nin Almanya, Avusturya, Belçika, Danimarka, Lüksenburg, Fransa, İsviçre, İtalya ve Hollanda’da öğrencileri bulunmaktadır. Almanya’da Köln, Berlin, Frankfurt, Stuttgart, Münih ve Hamburg’da; Almanya dışında Viyana, Brüksel, Paris, Bern ve Den-Haag’da ve askerlik yapanlar için Burdur’da sınav merkezleri bulunmaktadır. Öğrenci dağılımı yoğun merkezlerde ise beş ay süre ile hafta sonlarında yüz yüze eğitim hizmetleri yürütülmektedir. Ayrıca cezaevleri ile yapılan işbirliği ile Türk mahkumlara da eğitim hizmeti verilmektedir. Anadolu Üniversitesi tüm bu hizmeti uzaktan öğretim teknolojisini kullanarak; İşletme, İktisat ve Açıköğretim Fakültesi üzerinden yürütmektedir. Bilişim ve iletişim dönemini yaşadığımız zaman diliminde eğitimin değişen fiziki koşullarını kullanarak ülkesinden binlerce kilometre uzakta olan Türklere ana dillerinde sınıfsız ve sınırsız bir eğitim ortamı yaratmaktadır.
BATI AVRUPA PROGRAMLARINDA UYGULANAN AÇIK YÜKSEKÖĞRETİM SÜRECİ Batı Avrupa Programlarında uzaktan öğretim tekniğine göre yazılmış ders kitapları, kitaplarda yer alan konuların içeriğini destekleyen video programları, CD-Romlar, internet destekli danışmanlık ile yüzyüze eğitim olanağı sağlayan akademik danışmanlıklar bir paket olarak öğrencinin hizmetine sunulmaktadır. Programların içerikleri

The Turkish Online Journal of Educational Technology – TOJET January 2005 ISSN: 1303-6521 volume 4 Issue 1
Copyright The Turkish Online Journal of Educational Technology 2002 117
Türkiye’den farklı olmamakla birlikte, bu programlar, üniversitenin Türkiye’deki Açıköğretim Fakültesi öğrencilerine sağlanan kimi olanaklara ek bir takım eğitim materyalleriyle desteklenmekte, yurtdışının gerektirdiği bazı uygulama farklılıkları içermektedir. Ancak bununla beraber, Batı Avrupa Yükseköğretim Programları, Türkiye’deki yasa ve sistemden bağımsız bir uygulama değildir. (Hakan, 1996) DERS KİTAPLARI Örgün eğitimde olduğu gibi, uzaktan eğitimde de öğrencinin bilgisini sistematik olarak geliştiren ders kitapları kullanılmaktadır. Bu kitaplar, örgün eğitimde kullanılan kitaplardan farklı bir içerik ve görsel düzenleme ile hazırlanmaktadır. Kitapların hazırlanması dört aşamalı bir süreçten geçmektedir. Bu süreç içinde ilk olarak, söz konusu programda yer alacak ders için içerik belirlenmesi çalışmaları yapılır; alan uzmanlarınca bu içeriğe göre oluşturulan üniteler yazılır; kitabın editörü, uzmanların yazdığı ünitelerin metinlerinin görsel düzenlemesi ve kullanılan dildeki anlatım birliği üzerinde çalışır ve son olarak da kitabı baskıya verir. Öğrenciler bu kitaplar aracılığı ile alanla ilgili bilgilere ulaşmakta, ünite sonlarındaki örnek test soruları ile kendilerini ölçmekte ve önerilen kitaplara ulaştıkları takdirde senteze ulaşabilecek bilgiler edinmektedir. TELEVİZYON PROGRAMLARI Uzaktan öğretim sisteminde yer alan bir diğer unsur da ders kitaplarını içerik olarak destekleyen televizyon programlarıdır. Görsel-işitsel nitelikteki bu eğitim programları da dört aşamalı bir süreçten geçmektedir. Bu süreç içinde kitabın yazarı veya yazarları, editörü, televizyon programının yapımcısı birlikte kitapta yer alan hangi ünitelerin program çekimi için gerekli olduğuna karar verirler. Daha sonra, seçilen ünitelerin televizyona uyarlanması için uzmanlar tarafından senaryo çalışması yapılır; televizyon programının çekilebilmesi için gerekli teknik ekip oluşturulur ve hazırlanan senaryoya göre çekimler gerçekleştirilir. Son olarak kurgu ünitesinde çalışılır ve televizyonda yayımlanabilecek bir eğitim programı ortaya çıkarılır. Türkiye’de, TRT tarafından yayınlanan bu eğitim programları, Batı Avrupa’daki öğrencilere video kasetlere kayıt edilmiş olarak gönderilmektedir. Bu yöntemle öğrenciler, kendilerine uygun zaman dilimlerinde bu programları izlemekte, saklayabilmekte ve önemli bölümleri tekrar izleyerek, takip kolaylığı sağlayabilmektedir. AKADEMİK DANIŞMANLIK HİZMETLERİ VE STAJ UYGULAMALARI Türkiye’de akşamları veya hafta sonlarında orta ve yükseköğretim kurumlarının binalarının kullanılmasıyla gerçekleştirilen bu hizmetin amacı, öğrencilere yardımcı olmaktır. Bu yardım onların öğrenme becerilerini içinde bulundukları bireysel koşullara uygun olarak etkili bir şekilde geliştirmeye ve böylece ders içeriğini etkili bir şekilde öğrenmelerine yöneliktir. Avrupa’nın değişik ülkelerinde yaşayan öğrencilere yönelik olarak da 1987 yılından bu yana Almanya, Belçika, Hollanda ve İsviçre’de dersler açılmış ve iki ayrı dönem halinde akademik danışmanlık ve yüz yüze eğitim hizmetleri verilmektedir Almanya’da altı şehirde, Hollanda’da Den-Haag, Belçika’da Brüksel ve İsviçre’de Bern kentlerinde çoğu üniversite binalarında yapılan bu dersler her öğretim yılı tekrar edilmektedir. Uygulamaya yönelik bazı programlarda ise akademik danışmanlık hizmetlerinden başka staj uygulaması zorunluluğu bulunmaktadır. Örneğin Turizm ve Otelcilik Önlisans Programında, öğrenciler diplomalarını almadan önce öğrenimleri sırasında Anadolu Üniversitesi’nin denetimi altında staj uygulamasına katılmaktadır. İNTERNET DESTEKLİ DANIŞMANLIK İnternet destekli danışmanlık son yıllarda en fazla üzerinde çalışılan konular arasında yer almaktadır. Bunun sonucu olarak günlük yaşamda bilgisayarın eğitimde kullanılması ve öğrenmeyi kolaylaştırıcı etkileri üzerinde değişik tezler tartışılmaktadır. Batı Avrupa Programları çerçevesinde, internet aracılığı ile bilgilendirme, danışmanlık ve ölçme hizmetleri 1999-2000 öğretim yılında başlatılmıştır. İnternet aracılığı ile bilgi edinmek isteyen Batı Avrupa Programı öğrencileri, kitap editörü ve ünite yazarı olan öğretim üyelerinin elektronik posta adresine doğrudan ulaşmakta ve sorularının cevaplarını yazılı olarak alabilmektedir. Ancak en yoğun kullanılan hizmet, deneme sınavları olmaktadır. Öğrenciler bu yolla sınavlar
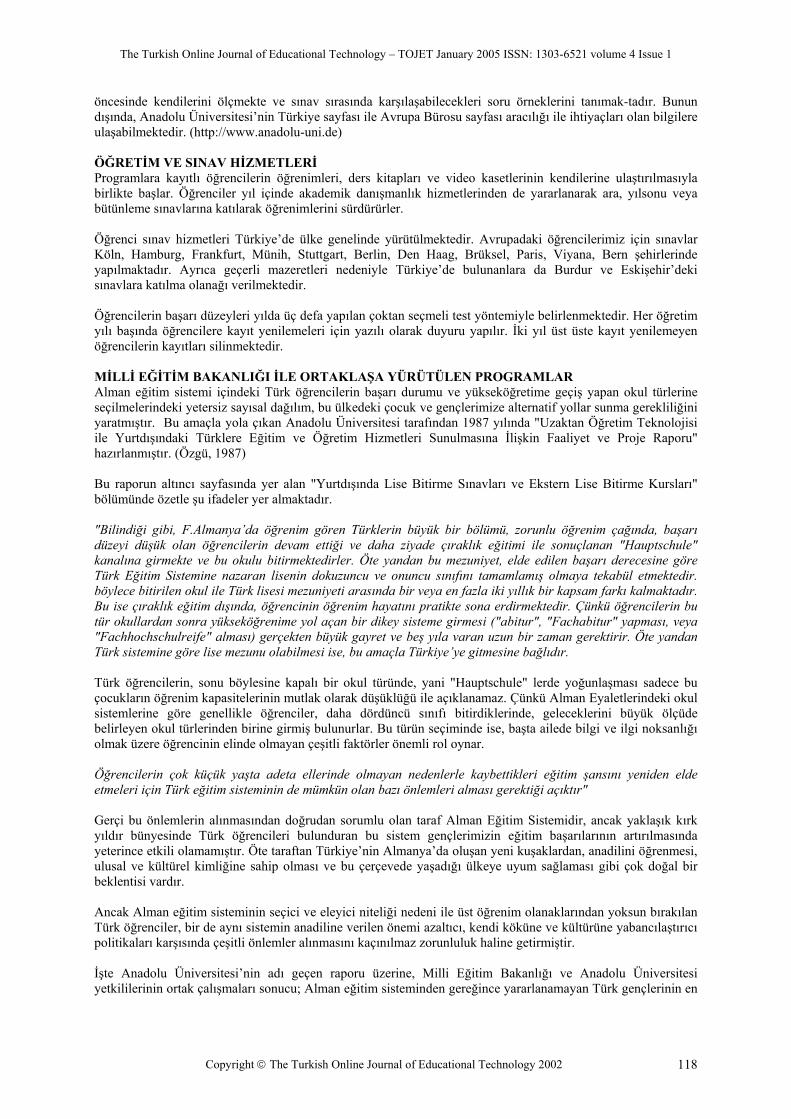
The Turkish Online Journal of Educational Technology – TOJET January 2005 ISSN: 1303-6521 volume 4 Issue 1
Copyright The Turkish Online Journal of Educational Technology 2002 118
öncesinde kendilerini ölçmekte ve sınav sırasında karşılaşabilecekleri soru örneklerini tanımak-tadır. Bunun dışında, Anadolu Üniversitesi’nin Türkiye sayfası ile Avrupa Bürosu sayfası aracılığı ile ihtiyaçları olan bilgilere ulaşabilmektedir. (http://www.anadolu-uni.de) ÖĞRETİM VE SINAV HİZMETLERİ Programlara kayıtlı öğrencilerin öğrenimleri, ders kitapları ve video kasetlerinin kendilerine ulaştırılmasıyla birlikte başlar. Öğrenciler yıl içinde akademik danışmanlık hizmetlerinden de yararlanarak ara, yılsonu veya bütünleme sınavlarına katılarak öğrenimlerini sürdürürler. Öğrenci sınav hizmetleri Türkiye’de ülke genelinde yürütülmektedir. Avrupadaki öğrencilerimiz için sınavlar Köln, Hamburg, Frankfurt, Münih, Stuttgart, Berlin, Den Haag, Brüksel, Paris, Viyana, Bern şehirlerinde yapılmaktadır. Ayrıca geçerli mazeretleri nedeniyle Türkiye’de bulunanlara da Burdur ve Eskişehir’deki sınavlara katılma olanağı verilmektedir. Öğrencilerin başarı düzeyleri yılda üç defa yapılan çoktan seçmeli test yöntemiyle belirlenmektedir. Her öğretim yılı başında öğrencilere kayıt yenilemeleri için yazılı olarak duyuru yapılır. İki yıl üst üste kayıt yenilemeyen öğrencilerin kayıtları silinmektedir. MİLLİ EĞİTİM BAKANLIĞI İLE ORTAKLAŞA YÜRÜTÜLEN PROGRAMLAR Alman eğitim sistemi içindeki Türk öğrencilerin başarı durumu ve yükseköğretime geçiş yapan okul türlerine seçilmelerindeki yetersiz sayısal dağılım, bu ülkedeki çocuk ve gençlerimize alternatif yollar sunma gerekliliğini yaratmıştır. Bu amaçla yola çıkan Anadolu Üniversitesi tarafından 1987 yılında "Uzaktan Öğretim Teknolojisi ile Yurtdışındaki Türklere Eğitim ve Öğretim Hizmetleri Sunulmasına İlişkin Faaliyet ve Proje Raporu" hazırlanmıştır. (Özgü, 1987) Bu raporun altıncı sayfasında yer alan "Yurtdışında Lise Bitirme Sınavları ve Ekstern Lise Bitirme Kursları" bölümünde özetle şu ifadeler yer almaktadır. "Bilindiği gibi, F.Almanya’da öğrenim gören Türklerin büyük bir bölümü, zorunlu öğrenim çağında, başarı düzeyi düşük olan öğrencilerin devam ettiği ve daha ziyade çıraklık eğitimi ile sonuçlanan "Hauptschule" kanalına girmekte ve bu okulu bitirmektedirler. Öte yandan bu mezuniyet, elde edilen başarı derecesine göre Türk Eğitim Sistemine nazaran lisenin dokuzuncu ve onuncu sınıfını tamamlamış olmaya tekabül etmektedir. böylece bitirilen okul ile Türk lisesi mezuniyeti arasında bir veya en fazla iki yıllık bir kapsam farkı kalmaktadır. Bu ise çıraklık eğitim dışında, öğrencinin öğrenim hayatını pratikte sona erdirmektedir. Çünkü öğrencilerin bu tür okullardan sonra yükseköğrenime yol açan bir dikey sisteme girmesi ("abitur", "Fachabitur" yapması, veya "Fachhochschulreife" alması) gerçekten büyük gayret ve beş yıla varan uzun bir zaman gerektirir. Öte yandan Türk sistemine göre lise mezunu olabilmesi ise, bu amaçla Türkiye’ye gitmesine bağlıdır. Türk öğrencilerin, sonu böylesine kapalı bir okul türünde, yani "Hauptschule" lerde yoğunlaşması sadece bu çocukların öğrenim kapasitelerinin mutlak olarak düşüklüğü ile açıklanamaz. Çünkü Alman Eyaletlerindeki okul sistemlerine göre genellikle öğrenciler, daha dördüncü sınıfı bitirdiklerinde, geleceklerini büyük ölçüde belirleyen okul türlerinden birine girmiş bulunurlar. Bu türün seçiminde ise, başta ailede bilgi ve ilgi noksanlığı olmak üzere öğrencinin elinde olmayan çeşitli faktörler önemli rol oynar. Öğrencilerin çok küçük yaşta adeta ellerinde olmayan nedenlerle kaybettikleri eğitim şansını yeniden elde etmeleri için Türk eğitim sisteminin de mümkün olan bazı önlemleri alması gerektiği açıktır" Gerçi bu önlemlerin alınmasından doğrudan sorumlu olan taraf Alman Eğitim Sistemidir, ancak yaklaşık kırk yıldır bünyesinde Türk öğrencileri bulunduran bu sistem gençlerimizin eğitim başarılarının artırılmasında yeterince etkili olamamıştır. Öte taraftan Türkiye’nin Almanya’da oluşan yeni kuşaklardan, anadilini öğrenmesi, ulusal ve kültürel kimliğine sahip olması ve bu çerçevede yaşadığı ülkeye uyum sağlaması gibi çok doğal bir beklentisi vardır. Ancak Alman eğitim sisteminin seçici ve eleyici niteliği nedeni ile üst öğrenim olanaklarından yoksun bırakılan Türk öğrenciler, bir de aynı sistemin anadiline verilen önemi azaltıcı, kendi köküne ve kültürüne yabancılaştırıcı politikaları karşısında çeşitli önlemler alınmasını kaçınılmaz zorunluluk haline getirmiştir. İşte Anadolu Üniversitesi’nin adı geçen raporu üzerine, Milli Eğitim Bakanlığı ve Anadolu Üniversitesi yetkililerinin ortak çalışmaları sonucu; Alman eğitim sisteminden gereğince yararlanamayan Türk gençlerinin en

The Turkish Online Journal of Educational Technology – TOJET January 2005 ISSN: 1303-6521 volume 4 Issue 1
Copyright The Turkish Online Journal of Educational Technology 2002 119
azından Türk eğitim sistemi içine alınmaları ve onlara yeni eğitim yollarının açılmasına yönelik bir proje uygulanmaya konulmuştur. Gerçekleştirilen protokol gereğince 1990-1991 öğretim yılından itibaren yurtdışında dışarıdan lise bitirme programı başlatılmıştır. Bu ilk protokol gereği, programın yürütülmesi önceleri MEB adına Ankara Aydınlıkevler Lisesi’ne Anadolu Üni-versitesi adına da Açıköğretim Fakültesi Batı Avrupa Bürosu’na verilmiştir. Bu proje dışarıdan lise bitirme yönetmeliğine göre yürütülürken; 1992-1993 öğretim yılından itibaren Türkiye’de Açıköğretim Lisesi, diğer liselere denk bir öğretime başlamıştır. 1990-1991 öğretim yılından beri yurtdışında da uygulanmakta olan Aydınlıkevler Lisesi, Yurdışında Dışarıdan Lise Bitirme Sınavları da bu değişiklik gereğince kaldırılmış, yerine 1995-1996 öğretim yılından itibaren, ek bir protokol ile Açıköğretim Lisesi Yurtdışı Programı uygulamaya konulmuştur. Bu ek protokole göre, Yurtdışında uygulanan programın yürütülmesinden MEB adına Açıköğretim Lisesi Müdürlüğü, Anadolu Üniversitesi adına da Açıköğretim Fakültesi Batı Avrupa Bürosu sorumludur. Bu iki protokol çerçevesinde yürütülen eğitim hizmeti sonucu 1990-2002 yılları arasında Yurtdışında Lise Bitirme Programlarında; 1999-2000 öğretim yılı ikinci dönemine kadar 533’ü Ankara Aydınlıkevler Lisesi, 746’sı AÖL Programı olmak üzere toplam 1279 öğrenci mezun olmuştur. “Açıköğretim Lisesi Yurtdışı Programı” adıyla yürütülen hizmetin adı, Milli Eğitim Bakanlığı’nın isteği üzerine 2001-2002 öğretim yılından itibaren “Açıköğretim Lisesi Batı Avrupa Programı” olarak değiştirilmiştir. AÖL BATI AVRUPA PROGRAMI UYGULAMASI Açıköğretim Lisesi Batı Avrupa Programına Türkiye' de ortaokulu bitirenler, genel liselerin veya meslek liselerinin ara sınıflarından ayrılanlar veya yurtdışında bunların dengi bir öğrenim görmüş olanlar katılabilirler. (AÖL-YP Kayıt Başvuru Formu, 1999) Örneğin Almanya' da Hauptschule' nin 9., Realschule ve Gymnasium' un 8. sınıfını bitirenler ortaokul mezunu sayılırlar. Açıköğretim Lisesinden mezun olabilmek için, zorunlu derslerin tümünü başarmak ve toplam kredinin en az 144 olması gereklidir. Buna göre ortaokul mezunu bir kişi 1. dönemden başlar ve normal koşullarda ( her dönem girdiği sınavlardan başarılı oldukları takdirde ) 5 dönem ( 2,5 yıl ) 144 krediyi tamamlayarak lise diploması alabilir. Açıköğretim Lisesi Batı Avrupa Programında yer alan zorunlu ve seçmeli derslerin kitapları öğrencilere Köln Bürosu tarafından gönderilir. Öğrenciler bu kitapları çalışarak sınavlara hazırlanırlar. Kitaplar Milli Eğitim Bakanlığı tarafından öngörülen içeriğe göre liselerde kullanılan kitapların uzaktan öğretim tekniğine göre yeniden düzenlenmiş halidir. Daha önce yurtdışında dışarıdan lise bitirme sınavları için hazırlanmış olan bu kitaplar, Açıköğretim Lisesi’nin programında yer alan zorunlu ve seçmeli derslere göre düzenlenmiştir. Programa ilk kez kayıt yaptıran öğrencilere, ilk iki dönemde sorumlu oldukları tüm derslerin kitapları toplu olarak gönderilir. Daha sonraki yıllarda öğrenci kayıt yenileme sırasında ihtiyacı olan kitapları alır. AÖL Batı Avrupa Programına kayıt yaptıran öğrenciler her dönemin sonunda belirtilen tarihlerde sınava girerler. Sınavlar merkezi sistemle bir hafta sonunda iki gün arka arkaya (Cumartesi-Pazar) altı oturumda ve çoktan seçmeli test şeklinde yapılır. Sınavlar bilgisayarla 100 üzerinden değerlendirilir, daha sonra bu puanlar nota dönüştürülür. Sınavların yapılacağı bina ve salonlar ile hangi gün, hangi derslerden sınava girileceğini gösteren sınava giriş belgeleri sınavlardan yaklaşık iki hafta önce öğrencilerin adreslerine posta ile gönderilir. Öğrenciler bu belgede belirtilen yerde, tarihte ve belirtilen derslerden sınava girmek zorundadırlar. Herhangi bir nedenle sınava giremeyen öğrencilere ayrıca ek bir sınav yapılmaz. (Doğan, 2000) AÇIK İLKÖĞRETİM OKULU BATI AVRUPA PROGRAMI Uzaktan öğretim teknolojisi ile yurtdışındaki Türklere eğitim ve öğretim hizmetleri sunulmasına ilişkin faaliyetlerin diğer bir örneği olan Açık İlköğretim Okulu Batı Avrupa Programı; Milli Eğitim Bakanlığı ile Anadolu Üniversitesi arasında imzalanan işbirliği protokolü çerçevesinde 2000-2001 öğretim yılından itibaren uygulanmaya başlamıştır. Program, Batı Avrupa ülkelerinde yaşayan, ilköğretim ikinci kademe düzeyinde diploması olmayan ve bulundukları ülkenin eğitim sistemine devam etme imkanı kalmayan göçmenlerimize eğitimlerini sürdürme fırsatı sağlamaktadır.
The Turkish Online Journal of Educational Technology – TOJET January 2005 ISSN: 1303-6521 volume 4 Issue 1
Copyright The Turkish Online Journal of Educational Technology 2002 120
Programa 15 yaşından gün almak kaydıyla ilköğretim birinci kademe düzeyinde veya ikinci kademe okur-yazarlık belgesi olanlar ile ortaokul dışarıdan bitirme sınavlarına devam ederken yarım bırakanlar katılabilmektedir. Açık İlköğretim Okuluna kayıt yaptıran öğrencilerin ders kitapları posta ile adreslerine gönderilmekte, öğrenciler bu kitaplar üzerinden çalışarak her öğretim yılında I. Ve II. Dönem sınavlarına girmekte. başarısız olunan dersler için Not Yükseltme Sınavları yapılmaktadır. Dönem sınavları ve not yükseltme sınavları, Anadolu Üniversitesi’nin Batı Avrupa sınav merkezlerinde hafta sonunda birbirini izleyen iki günde yapılır. Üç yıl süren eğitimin sonunda başarılı olanlar “Açık İlköğretim Okulu Diploması” alırlar. Bu diplomaya sahip olanlar bir üst eğitim kurumu olan lise ve dengi okullara devam edebilirler. Batı Avrupa’da bu diplomaya sahip olan öğrencilerin büyük bir kısmı, Açıköğretim Lisesi Batı Avrupa Programı’na kayıt yaptırmaktadır. SONUÇ Kitle iletişim araçları sayesinde bugün değişik mekanda ve çok sayıda insana en karmaşık şeyleri dahi anlatmak mümkündür. İletişim kurmak amacıyla yüz yüze gelmek, ancak çok ender durumlarda vazgeçilmez bir koşul olmaktadır. Teknolojinin bu imkanlarından eğitim alanında yararlanmak insanlığın doğal bir hakkı, çağdaş akılcılığın açık bir yoludur. Uzaktan öğretim yöntemi, bugün özellikle yükseköğrenim talebinin yüksek, kontenjanların az olduğu ülkeler ile gelişmiş pek çok ülkede başarı ile uygulanmaktadır. Bu amaçla öğrenimlerine devam etmek isteyen kişilere değişik alanlarda uzaktan öğretim olanağı sunulmaktadır. İletişim teknolojisinin gelişmesi, eğitim olanaklarının yaygınlaşması da bu hizmetin yaygınlaştırılmasını kolaylaştırmaktadır. Yeterli sayıda yetişmiş öğretim elemanı eksikliğini hisseden, sınırlı sayıda yükseköğretim kontenjanı ve araştırma olanağına sahip Türk yükseköğretim sistemi içinde yer alan uzaktan öğretim modeli Batı Avrupa’daki göçmenlerimiz açısından da önemli bir gereksinimi karşılamaktadır. Çünkü bulundukları ülke eğitim sisteminden yeterince yararlanma imkanına sahip olmayan soydaşlarımız ve vatandaşlarımız 1990’lı yıllarda, Avrupa’da kalıcı olma kararı vermişlerdir. Bu kararı tespit eden birçok araştırma bulunmaktadır. Ayrıca 1987 yılında öğretime başlayan Anadolu Üniversitesi Batı Avrupa Programları ile 28 Şubat 1990’da yayına başlayan TRT-INT yayınları misafir işçi olarak görülen insanlarımızın kalıcı olduğunun, diğer bir tespiti olmuştur. Kalıcı hale gelen göçmenlerimizin, Avrupa’da kendi dillerinde ilköğretim, lise ve yükseköğretim görme imkanına kavuşmaları; zorunlu nedenlerle öğretim sürecinden ayrılan birinci kuşak ile onların çocuk ve torunlarının niteliğinin artırılmasına yönelik önemli bir katkı olarak değerlendirilmelidir. Anadolu Üniversitesi tarafından Avrupa ülkelerini kapsayan, ancak nüfus yoğunluğu bakımından Almanya modeli de denilebilen, Batı Avrupa Programları; bu ülkelerde eğitim çağındaki genç nüfusun Türk Eğitim Sistemi’nden yararlanmasına olanak tanıyan bir uygulamadır. 1987 yılında yalnızca yükseköğretim programları adıyla başlayan ve bugün Açıköğretim Lisesi ve Açık İlköğretim Okulu Batı Avrupa Programları ile Türk Yükseköğretim Sistemini, Avrupa’ya taşıyan bu uygulama sonuçları bakımından çok önemlidir. Bu çalışmada çok genel düzeyde açıklanan bu model, Almanya’daki eğitim süreci çerçevesinde ele alındığında, göçmenlerimize karşı, çoğu zaman ayırıcı, eleyici ve de hükmedici uygulamalara karşı, alternatif bir eğitim şansıdır. Dışişleri Bakanlığı, Anadolu Üniversitesi Rektörlüğü, Açıköğretim Fakültesi Dekanlığı, Milli Eğitim Bakanlığı, Eğitim Teknolojileri Genel Müdürlüğü ve Açıköğretim Lisesi ve Açık İlköğretim Okulu Müdürlüklerinin işbirliği sonucunda oluşan karar ve katkılar ile yürütülen bu modelin, uygulanması ile şu faydalar elde edilmiştir. 1-Gerek Türkiye’de öğretimini yarıda bırakarak yurtdışına gelen, gerekse halen bulundukları ülkede çeşitli nedenlerle eğitim olanaklarından yeterince yararlanamayan Türk göçmenler için, yarım kalan öğrenimlerini tamamlama ve eğitim düzeylerini yükseltme yönünden iyi bir fırsat olarak görülmüştür. 2-Almanya örneğinde olduğu gibi, aile ve toplumsal ortam yetersizliği, Almanca eksikliği, sosyal uyumsuzluk vb. olumsuz koşullar nedeniyle, Alman eğitim sistemi içinde yeterince başarılı olamayan, dolayısıyle bir üst öğrenime gitme yolları kapalı veya kısıtlı olan göçmenlere, yüksek öğrenime devam edebilme olanağı sağlanmıştır.
The Turkish Online Journal of Educational Technology – TOJET January 2005 ISSN: 1303-6521 volume 4 Issue 1
Copyright The Turkish Online Journal of Educational Technology 2002 121
3-Açıköğretim Fakültesi ve Açıköğretim Lisesi öğrencilerine çok kültürlü Avrupa toplumunda Avrupa kültürleri yanında ait olduğu Türk kültürünü de yakından takip etme olanağı sağlanmıştır. 4-Açıköğretim Lisesi Yurtdışı Programı sınavları sonucunda mezun olup, diploma almaya hak kazanan öğrencilere, önceleri başvuru hakkı bile tanımayan Avrupa Üniversitelerinin kapıları açılmış ve öğrencilerin bir bölümü bu sınavların sonucunda Avrupa’nın değişik ülkelerinde üniversite eğitimine devam etme olanağını bulmuşlardır. 5-Yine bu sınavların sonucunda mezun olup ÖSYM sınavlarına müracaat eden öğrencilerin başarı yüzdeleri %95 olup, (Eğitim Fakülteleri yabancı dil bölümlerine kayıt olmalarından dolayı) gerek Türk, gerekse Avrupa Üniversitelerinde eğitimlerini başarı ile devam ettirmektedirler. Anadolu Üniversitesi, Açıköğretim Fakültesi aracılığı ile yurtdışında yaşayan Türk göçmenlerine uzaktan öğretim yoluyla çeşitli eğitim-öğretim hizmetlerinin sunulması amacıyla hizmet vermektedir. Üniversitenin Almanya’nın Köln şehrinde kurulu Bürosu, Türkiye’den gönderilen ve mahallinden temin edilen öğretim üyeleri, Akademik danışmanlık merkezleri, Internet ve bilgi-işlem sistemi ve sınav organizasyonu ile Türkiye Cumhuriyeti’nin Avrupa ülkelerindeki yerleşik başarılı kurumlarından biridir. KAYNAKÇA Anadolu Üniversitesi Batı Avrupa Bürosu (1999): “ AÖL-YP 1999/2000 Öğretim Yılı Kayıt Başvuru Formu
Açıklamaları” Atay, Mete “Alman Okullarındaki Türk Çocukları” www. tikla.com/ egitim/meldung5.html Aydın, Kazım (2000): “Türk Öğrencilerin Almanya’daki Genel Konumu” www. tikla.com/ egitim/meldung6.html Çalışma ve Sosyal Güvenlik Bakanlığı Web Sitesi, “Dış Ülkelerdeki İşçilerimizi, ülkelere göre vatandaş, işçi ve
işsiz sayıları” http://www.calisma.gov.tr/ NRW Rehberi (2000): “Yurttaşlık Bilgileri” Ses media und communications GmbH, Bonnerstr. 211, 50968 Köln Doğan, A. Atilla (1999): “Almanya’da Türk Üniversitesi Tartışması: Sınır Tanımayan Üniversite”. Sabah
Gazetesi Avrupa Baskısı. 18.12.1999. Doğan, A.Atilla (2000): “Almanya’daki Gençlerimizin Eğitim Beklentileri ve Açıköğretim Lisesi Yurtdışı
Programı” Anadolu Üniversitesi Eğitim Fakültesi Dergisi Cilt 10, Sayı, 1, Bahar 2000 Hakan, Ayhan (1996): Uzaktan Öğretim Yöntemiyle Eğitim Veren Anadolu Üniversitesi Fakültelerinin Tanıtımı
ve Batı Avrupa Açıköğretim Programlarının Değerlendirilmesi. Eskişehir: Anadolu Ün. Yay. No: 915, AÖF Yay. No: 494.
Özgü, Tahir (1987): “Uzaktan Öğretim Teknolojisi ile Yurtdışındaki Türklere Eğitim ve Öğretim Hizmetleri Sunulmasına İlişkin Faaliyet ve Proje Raporu”
Özsınmaz, Metin (2000): "Alman Okul Sistemi ve Türk Öğrencilerin Başarıları için Koşullar" Seminer- 26.3..2000, Türk Alman İşverenler Derneği (TDU), Köln .
Sağlam Mustafa, Yurtdışında Dışarıdan Lise Bitirme Programının Değerlendirilmesi. AÖF yayınları No: 391 Eskişehir: 1994
Statistisches Bundesamt (2000): Datenreport 1999 Bundeszentrale für politische Bildung, Bonn. Stadt Köln (2000): Schule 1, Anmeldung 2000 (Hauptschule, Realschule, Gymnasium, Gesamtschule), Stadt
Köln, Der Oberbürgermeister – Schulverwaltungsamt, Köln T.C Berlin Büyükelçiliği Çalışma ve Sosyal Güvenlik Müşavirliği (2000) Almanya’da Yaşayan Vatandaşlarımız
Hakkında Bilgiler (Yayına Hazırlanan 2000 Yılı Raporu)

The Turkish Online Journal of Educational Technology – TOJET January 2005 ISSN: 1303-6521 volume 4 Issue 1
Copyright The Turkish Online Journal of Educational Technology 2002 122
İNTERNET DESTEKLİ ÖĞRETİM SİSTEMLERİNDE BİLİŞİM GEREKSİNİMLERİNİN BELİRLENMESİ
Orhan TORKUL*, Cemal SEZER**, Tijen ÖVER***
{torkul, csezer, [email protected]} * Doç. Dr. Orhan TORKUL, Sakarya Üniversitesi Enformatik Bölüm Başkanı
** Yrd. Doç. Dr. Cemal SEZER, Sakarya Üniversitesi İİBF İşletme Bölümü *** Arş. Gör. Tijen ÖVER, Sakarya Üniversitesi Enformatik Bölümü
ÖZET Bilişim teknolojileri, özellikle internet, üretimden ticarete, sağlıktan eğlenceye, turizmden yayıncılığa tüm ekonomiyi, eğitimin tüm aşamalarını, siyaset ve kamu yönetimini, kısaca, yaşamın tüm boyutlarını değiştirmeye başlamıştır [1,6,13,20,21]. Bilişim gereksinimlerinin belirlenmesi, bilişim sistemlerinin geliştirilmesinde çok kritik bir safhadır [2]. Söz konusu gereksinimler, tam olarak belirlenen kısıtlar ve özellikler kümesidir. Bir diğer anlatımla, sistem gereksinimi, kullanıcılar, tasarımcılar, uygulayıcılar ve sistemi test edenlerle ilgili bilgileri içerir [3]. Bilişim sistemleri alanında çalışan bir çok bilim adamı ve araştırmacı bu konu üzerine yoğunlaşmış bilişim gereksinimlerini belirlemeyle ilgili çeşitli stratejiler, teknikler, metotlar ve araçlar geliştirmişlerdir [4,14]. Bu makale İnternet Destekli Öğretim Sistemi geliştirmede bilişim gereksinimlerinin belirlenmesini ve bunun bir örnek olayla açıklanmasını içermektedir. Anahtar kelimeler; İnternet Destekli Öğretim, Sistem Tasarımı, Bilişim Sistemi, Bilişim Gereksinimlerinin Belirlenmesi I. GİRİŞ Dünyamızın artan bir oranda bilgi tabanlı olması ile bilginin önemi gün geçtikçe artmakta ve doğru bilgiye doğru zamanda ulaşmak bireyler ve toplumlar açısından büyük avantajlar sağlamaktadır [5,9,28]. Özellikle küreselleşen dünyada bilgi önemli bir rekabet unsurudur. Bu rekabet ortamında ayakta kalabilmek ve bilgiden gereğince faydalanabilmek ancak teknolojik gelişmeleri izleyerek ve uygun teknolojiyi kullanarak gerçekleşebilmektedir [8,14,15]. Unutmamalıyız ki bilginin üretilip saklanması kadar iletilmesi de önemlidir. Bilginin mesafe kavramı olmaksızın iletilmesi bilişim araçları ile daha etkin olmaktadır. Teknolojinin hızlı gelişiminin en önemli göstergelerinden biri internetin etkin kullanımıdır [6,10,11].Bu sayede zaman ve mekân farklılıklarının etkisi ortadan kalkmakta; çalışma, ticaret, eğitim ve eğlence biçimleri daha önce düşünülemeyen boyutlarda değişmektedir. Tüm bu gelişmelerin sonucunda bilişim teknolojileri aracılığı ile alternatif eğitim hizmetlerinin sunulması bir yöntem olarak benimsenmektedir [7,12,16]. İnternetin etkin kullanımıyla eğitim; uzaktan eğitim, e-öğrenme (e-learning ) ya da elektronik eğitim adı altında, klasik öğretmen, öğrenci ve sınıf ortamından alınıp web tabanlı olarak kişilere sunulmaktadır [16]. “Uzaktan eğitim; öğretmen ve öğrencinin farklı yerlerde, farklı zamanlarda öğrenme-öğretme ilişkilerini iletişim teknolojileri veya posta ile gerçekleştirdikleri bir eğitim sistemi olarak tanımlanır”. [24] Bir cümle ile özetlenebilen bu sistem gerçekte bir çok alt sistemden oluşmaktadır. II. UZAKTAN EĞİTİM YÖNTEMİ OLARAK İNTERNET DESTEKLİ ÖĞRETİM (İDÖ) Uzaktan eğitim, bir örgün öğretim kurumunun mevcut ders programının ve içeriklerinin kampus dışına (ev, iş yeri, vb.) iletişim araçları vasıtasıyla taşınmasını ifade etmektedir. Bilişim teknolojilerinin önemli bir bölümünü kapsayan bilgisayarlar ve iletişim ağları, özellikle bireysel öğrenmeyi teşvik etmesi ve görsel-işitsel iletişimden tümüyle yararlanmayı olanaklı hale getirmesi önemli avantajlar sağlamaktadır,[25]. Bilişim teknolojisinin hızlı gelişimi ve internetin her alana girmesi ile bu eğitim türünün cazibesi gün geçtikçe artmaktadır. Bu hızlı gelişim sayesinde insanların eğitim almak amacıyla uzaklara gitmesine gerek kalmayacak, tam tersi eğitim insanlara gelecektir [26]. Gilbert, bunu bilişim teknolojisi kullanımı yoluyla öğrenci ve öğretmenlerin bilgi ve düşünceye bağlanması olarak tanımlamakta ve ‘bağlı eğitim’ (connected education) olarak adlandırmaktadır [23]. Collis ise, bu tür eğitimin tercih nedenlerini: iyi öğretme ve öğrenmenin bazı temel ilkelerini doğrulama, öğrenci demografisinin değişmesi ve daha fazla esneklik olarak açıklamaktadır [22]. Bu tanımlamalardan da anlaşılacağı gibi, uzaktan eğitim sistemleri, geleneksel eğitim sistemlerinin en büyük kısıtlarından, zaman ve mekan problemlerini ortadan kaldırmaktadır. Eğitim-öğretim sorunlarının başında gelen mekan, zaman ve eğitici yetersizliği, geleneksel eğitim yöntemleri yanında bu tür yöntemlerin gerekliliğini açıkça ortaya çıkarmaktadır. İnternet teknolojisine dayalı öğrenme kişilerin belirli zaman ve sınıf ortamı zorunluluğu olmaksızın bilgiye ulaşmasını, formal ve yaşamboyu (life long) eğitim olanağına kavuşması yanında, bilginin güncel kalmasını sağlayarak genel eğitim düzeyini de olumlu yönde etkilemektedir. Bu nedenle ve özellikle sanal üniversitelerin
The Turkish Online Journal of Educational Technology – TOJET January 2005 ISSN: 1303-6521 volume 4 Issue 1
Copyright The Turkish Online Journal of Educational Technology 2002 123
sayısının hızla artmakta, dünya çapında web tabanlı eğitim projelerinin uzun zamandır yürütüldüğü ve tamamıyla Internet üzerinden eğitim veren üniversitelerin ortaya çıktığı görülmektedir,[27,38]. III. İNTERNET DESTEKLİ ÖĞRETİM SİSTEMİNİN GENEL ÇERÇEVESİ İnternet destekli öğretim , uzaktan öğretimin yaygın olarak kullanılan bir yöntemidir. İnternet destekli öğretim, eşzamanlı (senkron) ve eşzamanlı olmayan (asenkron) öğretim olmak üzere iki kısımda incelenmektedir. Bu çalışmada eşzamanlı olmayan İDÖ sisteminin genel çerçevesi bir model yoluyla tanımlanmaya çalışılmıştır. Şekil 1 İDÖ sisteminin genel çerçevesini göstermektedir.
Burada sisteminin girdileri; öğrenci bilgileri, ders bilgileri ve ders içerikleridir. Süreç safhasında, öğrenci işlerine gelen öğrenci bilgileri, sisteme girilerek öğrencinin kaydı gerçekleştirilmekte, kaydı yapılan öğrenciyi otomatik olarak derslere de kaydedilmektedir. Bu amaçla süzülen öğrenci bilgileri Öğrenme Yönetim Sistemindeki veri tabanına aktarılmaktadır. Bu veri tabanında öğrenci bilgilerinin dışında ders bilgileri, öğrenci ve yönetici ara yüzlerini sağlayan mekanizmalarda bulunmaktadır. Sistemin bir diğer girdisi olarak gözüken ders içerikleri de web sunucusuna yerleştirilir. Sistemin çıktıları, kaydı yapılan öğrenciye verilen öğrenci kimliği ve öğrencinin internet ortamında web sunucusu aracılığı ile ulaştığı ders içerikleridir.
Şekil 1. İnternet Destekli Öğretim Sisteminin Genel Çerçevesi
Bilişim sistemi, organizasyonun gereksinimlerini yerine getirmeyi ve operasyonları desteklemeyi amaçlayan bütünleşik bileşenler topluluğu (veri, insan, teknoloji) olarak tanımlanabilir[31]. Bilişim sistemi geliştirmek karmaşık bir problemi çözmek gibidir. Özellikle dinamik organizasyonel çevrelerde veri ve gereksinimler hızla değişmektedir. Bir bilişim sisteminin gerçek başarısı problemin açık bir şekilde ve tam manasıyla anlaşılarak çözülmesine ve kullanıcıların gereksinimlerinin ve beklentilerinin belirlenmesine bağlıdır[29,34]. IV. BİLİŞİM SİSTEMİ GELİŞTİRME Sistem geliştirme sürecinde, geleneksel sistem geliştirme yaklaşımından faydalanılabilir. Bu yaklaşım sürecinin alt bileşenleri: gereksinimlerin belirlenmesi ve analiz, mantıksal tasarım, fiziksel tasarım, uygulama ve bakım olarak sıralanabilir [3]. i)gereksinimlerin belirlenmesi ve analiz safhası; Bu safhada problemi tanımlama, yapılabilirlik çalışması, gereksinimlerin çıkartılması, gereksinimlerin modellenmesi süreçleri bulunmaktadır. Modelleme, kavramsal, dışsal ve içsel seviyelerde olmak üzere üç seviyeden oluşmaktadır. Problemin Tanımlanması: Bir sistemi kurmak için karar vermede başlangıç noktası, mevcut sistemdeki problemin belirlenmesidir. Mevcut sistemde kullanıcıların hissettikleri problemler bilgisayara dayalı bilişim sistemleriyle azaltılabilir. Ancak diğer bir sebep organizasyonun bazı yönlerinin de geliştirilmek zorunda kalınmasıdır. Örnek olarak öğrenci hizmetlerinin hızlandırılması organizasyonu rekabette öne geçirebilecektir. Bu safhada amaç arzu edilen bilişim sisteminin işleyişini tanımlamaktır. Problemin tanımı genellikle kullanıcının bağlı bulunduğu yönetim tarafından yapılır. Bu tanım yapılırken yönetim tarafından bir bilgisayar uzmanına danışılabilir.
The Turkish Online Journal of Educational Technology – TOJET January 2005 ISSN: 1303-6521 volume 4 Issue 1
Copyright The Turkish Online Journal of Educational Technology 2002 124
Yapılabilirlik Çalışması: Yapılabilirlik çalışması problem tanımıyla başlar ve arzu edilen sistem için farklı alternatifleri inceler. Çok daha tipik olarak insan ve bilgisayar faaliyetleri arasındaki sınırı çizmek için çeşitli alternatifler olabilir. Bu faaliyet önerilen sistemin gerçekte belirlenen avantajları sağlayıp sağlamadığını belirlemeye çalışarak bu farklı alternatiflerin fayda maliyet analizlerini de içerir. Bunun önemli bir yönü sistem maliyetinin yönetim tarafından bütçe içinden karşılanıp karşılanmayacağının da belirlenmesidir. Yapılabilirlik çalışması genellikle sistem analistleri tarafından gerçekleştirilir ve önerilen bir sistem için farklı tercihleri içeren bir raporla sonuçlandırılır. Gereksinimlerin Çıkartılması: Yapılabilirlik çalışmasının ihtiyaç duyulan sistem tipini belirlediği varsayılarak bir sonraki adım daha çok detaylı sistem gereksinimlerini ortaya çıkarmaktadır. Gereksinimleri belirleme metotları kullanıcıların sistem hakkında ki istek ve gereksinimlerinin belirlenmesi için kullanılır. Sistem gereksinimlerini ortaya çıkarmak için dört geleneksel metot vardır. Bunlar;Gözlem, mevcut durum analizi, arzu edilen sistemin dokümanlarının analizi, anket ve karşılıklı görüşmelerdir. Gereksinimleri Modelleme: Daha yapısal şekilde ihtiyaçların ortaya çıkmasıyla sonuçlanan olayları organize etmek için genellikle bir model kullanılır. Bu model sistem analistinin sistem özelliklerini geliştirmek için gereksinimleri kontrol etmesini kolaylaştırır. Modellemenin üç seviyesi aşağıda verilmiştir: Kavramsal Modelleme ve Prensipleri: Organizasyon modeli, özet seviyede organizasyon modeli; yani temsili sunum veya bilgisayar uygulama detaylarını içermeyen organizasyon modeli, tabii organizasyon modeli, organizasyonun bileşenlerinin kullanıcı kavramlarıyla birebir karşılık gelen modelleme dili veya metodun kurulması anlamına gelir. Kavramsal model üç bileşenden oluşur; bunlar: yapı bileşeni, süreç bileşeni ve kural bileşenidir. Yapı bileşeni: Yapı bileşeni tipik olarak varlıklar, özellikler ve ilişkilerden oluşur. Genellikle varlık modelleme gibi bir metot kullanılarak diyagramsal olarak gösterilir. Yapı ifadesi kullanılmasının nedeni, bu elemanların kavramsal modelin diğer diğer parçaları içinde temel olmasındandır. Kural bileşeni: Kurallar; organizasyonda varlıklar, özellikler ve ilişkilerle sınırlandırılarak modellenen kısıtlardır. Süreç Bileşeni: Süreçler, ihtiyaçların özelliklerinden daha detaylı olarak belirlenir. Yapısal bileşenin elemanları üzerinde çalışılarak, başlangıç süreçlerinin seviyelerine indirilir. Tüm olaylar belirlenerek süreç kontrol yapısı çalışan yapı elemanları gibi modellenir. ii) Mantıksal Tasarım: Mantıksal tasarım safhasının amacı, arzu edilen sistemin bir tasarımını üretmektir. Analiz safhası ile üretilen özellikler kullanılarak gerçekleştirilen mantıksal tasarımın iki önemli safhası vardır. • Bilgisayar sistemi için tasarımı kavramsal modele dönüştürme, • Dış çevresel seviyeden, insan bilgisayar sistemi tasarımı. iii) Fiziksel Tasarım: Fiziksel tasarım, tasarım safhasının son safhasıdır ve üç bileşenden oluşur. • Donanım • Yazılım • İnsan-bilgisayar sistemi iv) Uygulama ve Test Etme: Uygulama ve test etme safhasının ana çıktısı bir fiziksel bilişim sistemidir. Ana görevleri, ilk olarak donanımı bütünleştirme, yazılım üretme, veri tabanları için veri üretme ve insan-bilgisayar sistemi üretmeyi içerir. İkinci olarak, sistem test edilir, kullanıcı yorumları değerlendirilir. Üçüncü olarak, ileri uygulama olarak adlandırılan bu safhada kullanıcı organizasyonunda uygulanan sistemin işlemesi sınırlı bir periyot için yakından izlenir. v) Bakım : Kaçınılmaz olarak, bazı hatalar sistemde mevcut olacaktır veya insan-bilgisayar sistemi pratik deneyimden sonra yeniden ayarlama ihtiyacı duyacaktır. Ancak gerçek uygulama değişimleri ortaya çıkaracaktır. Bu şu anlama gelir, amaçlar veya süreçler dahi değişim ihtiyacı duyulabilir. Değişimin diğer bir kaynağı teknolojidir. Donanımın bir üst dereceye geçmesi veya yazılımın yeni sürümünün ortaya çıkması radikal sistem değişimlerini gerekli kılabilir. Bakım, uygulanan sistemin parçaları için sürecin önceki safhalarını yeniden gerçekleştirilmesidir. Bu safha geleneksel olarak onu geliştirenlerin çok az dikkat gösterdiği bir safhadır. Bunun
The Turkish Online Journal of Educational Technology – TOJET January 2005 ISSN: 1303-6521 volume 4 Issue 1
Copyright The Turkish Online Journal of Educational Technology 2002 125
bir nedeni eski uygulamalarla ilgilenmek olabilir. Oysa yeni uygulamalar daha çekicidir. Diğer bir sebep uzmanlar, eski programları değiştirmeyi çok güç bulabilirler. Genellikle bunlar hakkında dokümanlar yoktur. [3]. V. BİLİŞİM GEREKSİNİMLERİNİN BELİRLENMESİ Bilişim gereksinimlerinin belirlenmesi, bilişim sistemlerinin geliştirilmesinde çok kritik bir safha olarak belirtilmekte ve gereksinim, sistem gereksinimleri ve bilişim gereksinimleri aşağıdaki şekilde tanımlanmaktadır [35]. Yeh’e göre; bir sistem gereksinimi, tam olarak belirlenen kısıtlar ve özellikler kümesidir. Bir gereksinim, bir problemin çözüm uzayını belirlemek zorundadır. Çözüm uzayının sınırları, önerilen çözümün gerçekte uygun olup olmadığını test etmek amacıyla kullanılan kısıtlar ve elemanlar kümesidir [35]. Yadav, Bravoco, Chatfield ve Rajkumar’a göre ise; gereksinim, kullanıcılar, tasarımcılar, uygulayıcılar ve sistemi test edenlerle ilgili bilgileri içerir. Whetherbe gereksinimler kelimesinin kendi başına biraz belirsiz olduğunu ancak ihtiyacın seviyesiyle ilgili olarak belirlenmeye çalışılması gerektiğini savunmaktadır. Seviyelerine göre gereksinimleri ise; performans gereksinimleri, bilişim gereksinimleri, ekonomik gereksinimler, kontrol ve güvenlik gereksinimleri,etkinlik gereksinimleri ve servis gereksinimleri olarak sınıflandırmıştır [37]. Bilişim sistemleri alanında çalışan bir çok bilim adamı ve araştırmacı bu konu üzerine yoğunlaşmış bilişim sistemlerinin geliştirilmesinde en önemli faktör olarak gösterilen bilişim gereksinimlerini belirlemeyle ilgili çeşitli stratejiler, teknikler, metotlar ve araçlar geliştirmişlerdir [4,31,32,33]. Browne ve Ramesh, bu safhaları; bilişimin toplanması, bilişimin sunulması, (modellenmesi) ve doğrulanması şeklinde tanımlamışlar[4,36], bilişim gereksinimlerini belirlerken ise; ön belirleme, doğrudan belirleme,dolaylı belirleme ve gösterim tekniklerini kullanmışlardır [4]. Bu teknikler içinde birçok farklı araç bulunmaktadır. Bu teknikleri kullanırken her bir teknik için; doğrudan sorular, what-if analizi, senaryolar, tersten düşünme, akış şemaları, bilgi haritaları,etki diyagramı, karar haritası, yakınlık diyagramı ve not tahtası gibi araçlardan da yararlanmışlardır [4]. Davis ise; bilişim gereksinimlerinin belirlenmesinde dört strateji olduğundan bahsetmiş ve bunların; soru sorma, mevcut bir bilişim sisteminden türetme,kullanışlı bir sistemin özelliklerinden sentezleme ve bir bilişim sisteminin gelişim süreci ile ilgili deneylerden keşfetme olduğunu söylemiştir [36]. Bilişim gereksinimlerinin, yukarıdaki stratejiler aracılığı ile elde edilmesinde kullanılan metotlar; kapalı sorular, açık sorular, beyin fırtınası, yönlendirilmiş beyin fırtınası, grup kararları, normal analiz, dönüşüm küme stratejisi, kritik faktör analizi, süreç analizi, karar analizi, sosyo-teknik analiz ve girdi-işlem-çıktı analizidir [36]. Bir organizasyonda gereksinim kümesinin doğru ve eksiksiz olarak belirlenmesi etkin bir bilişim sisteminin tasarımında hayati önem taşır. Bu nedenle belirlemeyi yapanların öncelikle organizasyonu ve gereksinimlerini çok iyi anlaması ve tanımlanması gerekmektedir. VI. ÖRNEK OLAY: İDÖ BİLİŞİM GEREKSİNİMLERİNİN BELİRLENMESİ Bilişim teknolojilerinin çok hızlı bir şekilde gelişmesi ve özellikle internetin öğretim alanında yoğun bir şekilde kullanılması üniversiteleri de öğretimde bu teknolojiyi kullanmaya yöneltmiştir. Bu örnek olayımızda çeşitli fakülte, enstitü ve yüksek okullarda 25.000 öğrencisi bulunan bir üniversite de internet destekli öğretim sisteminin bilişim gereksinimlerinin belirlemesi çalışmaları özetlenecektir. Ön Çalışmalar: Üniversite yönetimi öğretim üyeleri arasından bir grup öğretim üyesini konunun araştırılması için görevlendirmiştir. Seçilen bu öğretim üyeleri bir proje ekibi oluşturmuşlardır. Proje timi ilk önce üniversitede “Niçin bir uzaktan öğrenmeye ihtiyaç vardır?” sorusunu cevaplamaya çalışmışlar ve bu soruyu cevaplarken önce vizyonu belirlemişlerdir. Belirlenen vizyona göre üniversite, fakülte, yüksek okul ve enstitülerde verilen derslerin bir bölümünü internet ortamından öğrencilere verecek ve aynı zamanda bu dersleri diğer üniversitelerin öğrencileri de internet ortamından alabilmelidir. Öğrenciler kendi bilgisayarlarından veya internete erişebildikleri herhangi bir bilgisayardan bu derslere erişebilmelidir. Problemin Tanımı : Öğrenciler yalnız başına, öğrenme materyaline etkileşimli olarak yerel veya uzaktan erişebilmeli, farklı alanlardaki öğretim elemanlarıyla eş zamanlı veya eş zamansız olarak ortaklaşa çalışabilmelidir. Öğrenciler çoklu kaynaklardan bilgiye erişebilecek, seçebilecek, depolayabilecek ve gerektiğinde yeniden elde edebileceklerdir. Öğretim elemanlarıyla ve diğer öğrenci arkadaşlarıyla doğrudan iletişimde olabilecekler, bilgileri, dokümanları ve projeleri ortaklaşa paylaşabileceklerdir. Yapılabilirlilik Çalışması Mevcut durumun analizi : Mevcut durum, bilişim teknolojileri, yönetim, internet destekli öğretime katılacak öğretim elemanları ve diğer destek verecek birimler açısından araştırılmıştır. Araştırma süreci, derslerin tasarımı ve geliştirilmesini, dersler ve öğrencilerin kayıtlarını içerir.
The Turkish Online Journal of Educational Technology – TOJET January 2005 ISSN: 1303-6521 volume 4 Issue 1
Copyright The Turkish Online Journal of Educational Technology 2002 126
Mevcut durumun güçlü yönleri : • Vizyon; uzun dönem amaçlar tüm proje üyeleri tarafından paylaşılmaktadır. • Mükemmel kültürel ortam; projeye katılan anahtar üyeler, yeni öğretim gerçeğini kabullenmektedir (öğrenme merkezli herhangi bir zamanda herhangi bir yerde öğrenmeyi). • Üniversite yönetimi ve proje elemanları bunu başarmada çok kararlıdır. • Proje üyeleri arasında çok sıkı işbirliği vardır. • Verilecek ve geliştirilecek derslerin seçiminde çok dikkatli davranılmaktadır. • Mevcut problemler çok çabuk bir şekilde çözülmektedir. Mevcut durumun zayıf yönleri: • Bilişim Teknolojisi Alt Yapısı - Öğrencilerin öğrenme veya ders kaynaklarına erişebilmesi için kampüste yeterli sayıda bilgisayarın bulunmaması, - Öğrenciler için evden internete bağlanma maliyetlerinin yüksek olması, - Evden modemle internete bağlanma kalitesinin çok iyi olmaması, - İnternet bant genişliğinin 512 Kbps olması ve bu bant genişliğinin tam kullanılamaması, - Bilişim güvenlik sistemlerinin yetersiz olması, - Öğrenciler için gerekli standart bilişim hizmetlerinin yeterince verilememesi. • Ders İçerikleri Bazı ders içerikleri dijital ortamda bulunmakta fakat içeriklerinin geliştirilmesi gerekmektedir. İçeriklere, benzetimler, animasyonlar ve etkileşim eklenmelidir. Ders içeriklerinin çok iyi olması için yeterli zaman yoktur. • Organizasyon Bilişim teknolojisi kaynak kullanımı destekleme süreçlerinin, standartların ve prosedürlerin, yardım masası desteğinin ve ders geliştirmek için teknik/ tasarım desteğinin eksikliği. • Riskler Üniversite öğretim modeline bağlı olarak yeni modelin risklerini arttıracak veya azaltacaktır. Yukarıda sayılan problemler nedeniyle teknolojiyi uyarlamada bazı sıkıntılar oluşabilecektir. Bu sıkıntıların bir kısmı şöyle özetlenebilir, Uzaktan öğretim hizmetleri gerçekten bir öğrenci için yeterli değildir (Eğer öğrenci yalnızca bir derse
kaydolursa o kampüse gelmek zorunda olacaktır. Bu nedenle öğrenci İDÖ ‘ den ders seçmeyebilecektir). Öğrenciye verilecek hizmetler yeterli olmazsa yine İDÖ derslerini seçmeyecektir. İlk uygulama başarısız olduğu takdirde İDÖ ‘ e karşı güven sarsılacaktır. Üniversitenin sunucu üniversite olma isteği gecikebilecektir.
Gereksinimlerin Çıkartılması • Öğretim Yönetim Sistemi (ÖYS) Eş zamanlı ve eş zamansız, öğretim elemanı-öğrencilerle, öğrencilerden-öğrencilere etkileşim sağlayan, ders içeriklerinin dağıtımı, öğrenci ve ders kayıtlarını yapabilen bir sınıftaki tipik tüm faaliyetlerin yönetimini sağlayan bir öğretim yönetim sisteminin seçimidir. • Öğretim Modeli Üniversite riski minimize etmek için öğrencileri hem İDÖ sınıflarına hem de geleneksel sınıflara kaydedecek, öğrenciler her iki sınıfa da devam edebildiği için riskler azalacaktır. Fakat bir sonra ki öğretim döneminde bu şekilde ders alan öğrenciler yalnızca İDÖ sınıflarına kaydedilecek ve uygulama başarılı olarak devam edecektir. • İDÖ Derslerinin Seçimi Bu derslerin adlarını dersleri verecek öğretim elemanlarının ve bu derslere kayıtlı olacak öğrencilerin sayılarının seçimi, İDÖ sınıflarında öğrenci sayısı 50 kişiyle sınırlandırılmıştır. • Bilişim Teknolojileri Alt Yapısı Sunucular
İDÖ sınıflarına dersleri ulaştırmak için iki yeni sunucuya gereksinim vardır. Sunuculardan birine öğretim
sisteminin çekirdek kısmı kurulacaktır. İkinci sunucuya Öğretim Yönetim Sisteminin (ÖYS) ortaklaşa etkileşimini sağlayan kısmıyla, ders içerikleri
konacaktır. Bu iki sunucunun gücü aynı anda 250 öğrencinin sisteme bağlanmasına olanak tanıyacaktır.
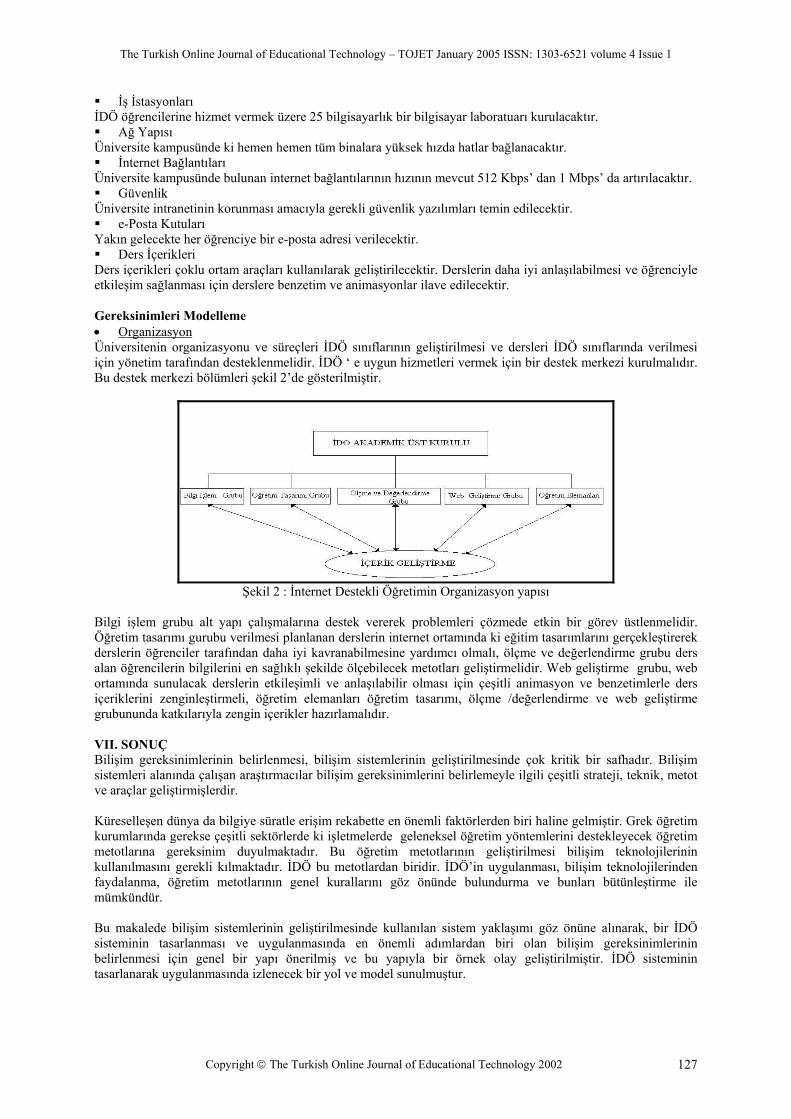
The Turkish Online Journal of Educational Technology – TOJET January 2005 ISSN: 1303-6521 volume 4 Issue 1
Copyright The Turkish Online Journal of Educational Technology 2002 127
İş İstasyonları İDÖ öğrencilerine hizmet vermek üzere 25 bilgisayarlık bir bilgisayar laboratuarı kurulacaktır. Ağ Yapısı
Üniversite kampusünde ki hemen hemen tüm binalara yüksek hızda hatlar bağlanacaktır. İnternet Bağlantıları
Üniversite kampusünde bulunan internet bağlantılarının hızının mevcut 512 Kbps’ dan 1 Mbps’ da artırılacaktır. Güvenlik
Üniversite intranetinin korunması amacıyla gerekli güvenlik yazılımları temin edilecektir. e-Posta Kutuları
Yakın gelecekte her öğrenciye bir e-posta adresi verilecektir. Ders İçerikleri
Ders içerikleri çoklu ortam araçları kullanılarak geliştirilecektir. Derslerin daha iyi anlaşılabilmesi ve öğrenciyle etkileşim sağlanması için derslere benzetim ve animasyonlar ilave edilecektir. Gereksinimleri Modelleme • Organizasyon Üniversitenin organizasyonu ve süreçleri İDÖ sınıflarının geliştirilmesi ve dersleri İDÖ sınıflarında verilmesi için yönetim tarafından desteklenmelidir. İDÖ ‘ e uygun hizmetleri vermek için bir destek merkezi kurulmalıdır. Bu destek merkezi bölümleri şekil 2’de gösterilmiştir.
Şekil 2 : İnternet Destekli Öğretimin Organizasyon yapısı
Bilgi işlem grubu alt yapı çalışmalarına destek vererek problemleri çözmede etkin bir görev üstlenmelidir. Öğretim tasarımı gurubu verilmesi planlanan derslerin internet ortamında ki eğitim tasarımlarını gerçekleştirerek derslerin öğrenciler tarafından daha iyi kavranabilmesine yardımcı olmalı, ölçme ve değerlendirme grubu ders alan öğrencilerin bilgilerini en sağlıklı şekilde ölçebilecek metotları geliştirmelidir. Web geliştirme grubu, web ortamında sunulacak derslerin etkileşimli ve anlaşılabilir olması için çeşitli animasyon ve benzetimlerle ders içeriklerini zenginleştirmeli, öğretim elemanları öğretim tasarımı, ölçme /değerlendirme ve web geliştirme grubununda katkılarıyla zengin içerikler hazırlamalıdır. VII. SONUÇ Bilişim gereksinimlerinin belirlenmesi, bilişim sistemlerinin geliştirilmesinde çok kritik bir safhadır. Bilişim sistemleri alanında çalışan araştırmacılar bilişim gereksinimlerini belirlemeyle ilgili çeşitli strateji, teknik, metot ve araçlar geliştirmişlerdir. Küreselleşen dünya da bilgiye süratle erişim rekabette en önemli faktörlerden biri haline gelmiştir. Grek öğretim kurumlarında gerekse çeşitli sektörlerde ki işletmelerde geleneksel öğretim yöntemlerini destekleyecek öğretim metotlarına gereksinim duyulmaktadır. Bu öğretim metotlarının geliştirilmesi bilişim teknolojilerinin kullanılmasını gerekli kılmaktadır. İDÖ bu metotlardan biridir. İDÖ’in uygulanması, bilişim teknolojilerinden faydalanma, öğretim metotlarının genel kurallarını göz önünde bulundurma ve bunları bütünleştirme ile mümkündür. Bu makalede bilişim sistemlerinin geliştirilmesinde kullanılan sistem yaklaşımı göz önüne alınarak, bir İDÖ sisteminin tasarlanması ve uygulanmasında en önemli adımlardan biri olan bilişim gereksinimlerinin belirlenmesi için genel bir yapı önerilmiş ve bu yapıyla bir örnek olay geliştirilmiştir. İDÖ sisteminin tasarlanarak uygulanmasında izlenecek bir yol ve model sunulmuştur.
The Turkish Online Journal of Educational Technology – TOJET January 2005 ISSN: 1303-6521 volume 4 Issue 1
Copyright The Turkish Online Journal of Educational Technology 2002 128
KAYNAKÇA 1. Üney, T., Ulusal Birey Bilgi Sistemi, Kamu Bilişim Uygulamalarına Farklı Bir Bakış, 2000, Web : www.tbv.org.tr 2. Ashyr N. Y., Taylor W. A., Requirement Analysis Strategy fo the Development of an Integrated Hospital Information Support System, Proceedings of the 33rd Hawaii International Conference on System Sciences – 2000 3. Flynn D. J., Information System Requirements: Determination & Analysis The McGraw – Hill Companies, 1998 4. Browne, G. J., Ramesh, V., Improving information requirements determination: a cognitive perspective, Information&Management, 1994, 2002, (1-21) 5. Sarıhan, H.İ.,Teknolojik işbirliği Dergisi 6. ([email protected], [email protected], [email protected]), e-Türkiye Durum Analizi ve Çözüm Önerileri, Telekomünikasyon kurumu – Ankara, 7. Alkan, M.,([email protected]), Tekedere,H.,([email protected]), Bilişim toplumuna Doğru Bilişimci Eğitim 8. Bir, B.B., İşletmelerde Yöneticilerin Karar Vermesinde Bilginin Rolü ve Önemi, Doktora Tezi, 2000, İstanbul 9. Yılmaz, C., Özdil, T., Akdoğan, G., “Kobiler için Elektronik Ticaret ne ifade ediyor?” 10. “Sekizinci Beş Yıllık Kalkınma Planı” Bilişim Teknolojileri ve Politikaları Özel İhtisas Komisyonu Raporu, Ankara, 2001 11. T.C. Ulaştırma Bakanlığı Tuena Kamu Kuruluşları Bilgi İşlem Eğilimi Çalışma Belgesi, Ocak, 1998 12. İnce, N.M.,“Elektronik Devlet” Kamu Hizmetlerinin Sunulmasında Yeni İmkanlar, Mayıs, 2001 13. Gunesekaran A., Mc Gaughey R., Information technology information systems in 21st century manufacturing, International Journal of Production Economics, V.7S, Issues 1-2, January 2002, P.1-6 14. Eva, M., Requirements acquisition for rapid applications development, Information&Management 39(2001) 101-107 15. Bakos J. Y:, Treacy M. E., Information Technology and Corporate Strategy : A research Perspective, MIS Quartely, June 1986, pp. 107 - 119 16. Dewett T., Jones G. R., The role of information technology in the organization: a review, model and assessment, journal of Management 27 (2001) 3313-346 17. Kamu Net Teknik Kurulu e-Devlet Çalışmaları Nisan, 2002, Başbakanlık Devlet Planlama Teşkilatı Müsteşarlığı 18. Bensghir, T.K.,Devlet - Vatandaş iletişiminde e-Posta, Amme İdaresi Dergisi, CİH 33 Sayı 4 Aralık 2000, S. 49-61 19. I-C Internet Üzerinde Çalışan Devlet (e-devlet),www.enoter_hukuk.tripod.com/ic-edevlet.htm 20. Koru, N., e-devlet Yöntem Arayışlarında “Dışişleri Bakanlığı Modeli” Dışişleri Başkanlığı, Bilgi Sistemleri ve İletişim Dairesi 21. Lal K., E-business and manufacturing sector : a study of small and medium – sized enterprises India, Research Policy 1371 (2002) 1-13 22. Collis, B.,New Didactics For University Instriction: Why and How? Computer Education, 1998 23. Gilbert, W. C., Connected Education and Collaborative Change: Improving Teaching and Learning With Technology, January 2000,[www.campuscomputing.net] 24. İşman, A., Uzaktan Eğitim, Değişim Yayınları, 1998 25. Bayam,Y., Urin, M., Uzaktan Eğitimde Öğrenci Takibi ve Değerlendirilmesi, Açık ve Uzaktan Eğitim Senpozyumu,2002, Eskişehir 26. İşman, A., Baytekin, Ç., Kıyıcı, M., Horzum, M.B.,Uzaktan Öğretimde İnternet Destekli Eğitim Tasarımı 27. Çallı, F., Kocabıçak, Ü., Uzaktan Eğitimin İncelenmesi ve Sakarya Üniversitesinde Lisansüstü Programlarda Uygulama Düşüncesi, 28. Taşbaşı, N., Aydın, A., Uzaktan Eğitimde Sakarya Üniversitesi Çözümleri, Açık ve Uzaktan Eğitim Senpozyumu,2002, Eskişehir 29. Browne, G. J., Rogich, M. B., An empirical investigation of user requirements elicitation: comparing the effectiveness of prompting techniques, Journal of Management Information Systems, Journal of Management Information Systems v. 17 no4 (Spring 2001) 30. Torkul, O., Karadoğan, İ.C., Sakarya Üniversitesi Uzaktan Öğretim Önlisans Projesi, Akademik Bilişim, 2003, Adana 31. Pitts,M.G., PhD Thesis, Investigating Evaluative Stopping Rules in Information Requirements Determination, 1999 32. Montazemi, A.R., Contath, D.W., The use of cognitive mapping for information requirements analysis, MIS Quarterly, March1986

The Turkish Online Journal of Educational Technology – TOJET January 2005 ISSN: 1303-6521 volume 4 Issue 1
Copyright The Turkish Online Journal of Educational Technology 2002 129
33. Ross,D.T., Schoman, K.E., Structured Analysis for Requirement Definition, IEEE Trans. Softw. Eng. Se-3,1 (Jan.1977) 34. Haag,S., Cummings, M., Dawkins, J., Management Information Systems for the Information Age, McGraw-Hill,1998 35. Yadav, S.B., Bravoco, R.R., Chatfield, A.T., Rajkumar, T.M., Comparison of analysis techniques for information requirements determination, Communications of the ACM, September 1998 volume 31 number 9 36. Davis, G.B., Strategies for Information Requirements Determination, IBM Sys.J.,Vol.21, No. 1,1982 37. Bahn, D.L., PhD Thesis, Validating Information Systems Requirements with Prototypes and Scenarios 38. [www.bilgiemba.net/],[www.firat.edu.tr/fuzem/],[www.ido.sakarya.edu.tr/],[www.amercoll.edu],[www.caldwell.edu],[www.uiowa.edu/~ccp],[ www.mit.edu/], [ www.unisa.ac.za]
The Turkish Online Journal of Educational Technology – TOJET January 2005 ISSN: 1303-6521 volume 4 Issue 1
Copyright The Turkish Online Journal of Educational Technology 2002 130
İNTERNET TEMELLİ ÖLÇMELERİN GEÇERLİĞİNİ SAĞLAMADA YENİ YAKLAŞIMLAR
Yard.Doç.Dr. Çetin SEMERCİ
Fırat Üniversitesi, Eğitim Fakültesi, BÖTÖ Bölüm Başkanı Cem BEKTAŞ
Bilgisayar Öğretmeni, Yüksek Lisans Öğrencisi
ÖZET Eğitimde ölçmenin önemli bir rolü vardır. Eğitimde yapılan ölçmelerin internet ortamına aktarılmasıyla öneminin daha da arttığı gözlenmektedir. Bu incelemede, internet temelli ölçmelerin geçerliğini sağlamada yeni yaklaşımlar irdelenmiştir. İnternet temelli ölçmelerde geçerliği sağlamak büyük problem olarak görülmektedir. Bunlara çözüm olarak yeni yaklaşımlar ortaya konmaya çalışılmıştır. Yeni yaklaşımların başında araştırma ve proje geliştirme, dijital kimlik v.b. bulunmaktadır. Anahtar Kelimeler: İnternet, ölçme, geçerlik ve yeni yaklaşımlar. THE NEW APPROACHES FOR PROVİDİNG VALİDİTY İN INTERNET-BASED MEASUREMENTS ABSTRACT Measurement has an important role in education. Since it move on internet its vitality was increased. In this study, “New Approaches for Providing Validity in Internet-based Measurements” was investigated. To provide validity in internet-based measurements seem as a big problem. As solution for these tried to reveal new approaches. As some follows: Research and Project development, digital identity. Keywords: Internet, measurement, validity and new approaches.
GİRİŞ Dünya üzerindeki tüm kişisel bilgisayarların ve bilgisayar ağlarının birbirine bağlanmasına olanak veren internet, eğitim ve öğretim amaçlı faaliyetlerde de başrol oynamaya başlamıştır. Aynı fiziksel ortamda bulunmayan öğrenen-öğreten ikilisinin en hızlı ve en gerçekçi şekilde bir araya gelmesini sağlayan sanal ortam internettir. İnternet üzerinden yazılı, sesli ve görüntülü iletişim ve etkileşim mümkündür (Kaya, 2002, 235). Bu sayılanlar, günümüzde ve gelecekte uzaktan eğitimde temel teknolojinin internet olmasını gerektirmektedir. İnternet temelli eğitimde de tıpkı klasik eğitim yöntemlerinde olduğu gibi ölçmeye ihtiyaç duyulmaktadır. Ölçme, bir niteliğin gözlenip, gözlem sonuçlarının sayı veya sembollerle gösterilmesidir. Ölçme, başlangıçtaki hedeflerle ulaşılan somut durum ilişkisini doğru şekilde değerlendirebilmek amacıyla yapılmaktadır. İnternet temelli ölçmelerde geçerliğin sağlanması çok önemlidir ve günümüzde bunun tam olarak gerçekleştirilebildiğini söylemek güçtür. Bu nedenle geçerliğin sağlanması ve kontrolünde yeni yaklaşımlara ihtiyaç duyulmaktadır. İNTERNET TEMELLİ ÖLÇME (İTÖ) Bilgisayar kullanımı henüz günümüzdeki kadar yaygınlaşmadan önce bile kağıt-kalem testleri ve bilgisayar temelli ölçmelerin karşılaştırılması ile ilgili araştırmalar yapılıyor ve sonuçlar hep bilgisayar temelli ölçme lehine çıkıyordu (Olsen, Maynos, Slawson and Ho, 1986; Calvert and Waterfall, 1982; Bunderson, Inovye and Olsen, 1989, 374-375). Microsoft yazılım şirketinin ürettiği Windows 95 işletim sistemi ile birlikte internet bağlantısının yaygınlaştığı ve bu teknolojik gelişmenin internet temelli ölçmelere (İTÖ) yönelme açısından bir milat oluşturduğu görülmektedir. İTÖ, herhangi bir ölçme sisteminde ortam aracı olarak internetin kullanılması anlamına gelmektedir. İTÖ yapılarak, internet ortamında sınav sorusu hazırlanabilmekte, sınav soruları cevaplanabilmekte, sınav değerlendirmelerine temel teşkil edebilmekte, sınav sonuçları ilan edilebilmekte, sonuçlar öğrenilebilmektedir (Önal, 2001).
The Turkish Online Journal of Educational Technology – TOJET January 2005 ISSN: 1303-6521 volume 4 Issue 1
Copyright The Turkish Online Journal of Educational Technology 2002 131
İTÖ’ler ilk başta akla geldiği gibi sadece öğretim sürecinin sonunda yer alan bir aşama değil o süreçle paralel gelişmesi gereken bir temel öğedir. Yüzyüze eğitimin gerçekleştiği bir fiziksel ortamda öğretmen ders esnasında öğrencilerin derse olan ilgileri ve katılımlarına göre istemli ya da istemsiz olarak bir ölçme yapabilmektedir. Yüzyüze eğitimde gerçekleşebilen bu olgu İTÖ’ lerin bir süreç olarak ele alınması ve geçerliğinin sağlanması ile internet temelli öğrenmelerde de sağlanabilecektir. İTÖ’ LERİN GEÇERLİĞİ Ölçülmek istenen değişkenin ölçülebilme derecesine geçerlik denilmektedir. İTÖ’ lerin geçerliğini sağlamada öncelikle aşağıdaki dört ana geçerlik türünün göz önüne alınması gerekmektedir. (Turgut, 1989; Yılmaz, 1996): 1. Kapsam geçerliği: Sınav sorularının dağılım dengesinin ders konularının önemine göre belirlenmesidir. Kapsam geçerliğinde ipucu kelime ölçme matrisidir. 2. Yapı geçerliği: Soruların ve maddelerin anlatım ve imla yönüyle uygun olmasıdır. Burada önemli olan öğrencilerin soru ve maddeleri farklı şekilde anlamalarını önleyecek derecede açıklıktır. 3. Görünüş geçerliği: Sınavda sorulan bir maddenin hangi alanla ilgili göründüğüdür. 4. Yordama geçerliği:Öğrencilerin test puanlarına göre belli bir programdaki veya işteki başarılarını önceden tahmin edebilme işidir. İTÖ’ lerde geçerliğin sağlanabilmesi için mutlaka sağlanması gereken bazı şartlar vardır (Semerci, 2002; Varol ve Karabatak, 2002; Tekin, 1993; Tan ve Erdoğan, 2001): 1. Ölçmelerde geçerliğin sağlanması için temel şart olarak güvenirliğin bulunması gerekmektedir. 2. Öğrencinin kopya çekmesi önlenmelidir. 3. Sınava giren kişinin, girmesi gereken kişi olduğundan emin olunmalıdır. 4. Kapsam geçerliğinin yani madde-konu dengesinin sağlanması gerekmektedir. 5. Sınav sorularının sürekli madde analizi yapılarak güncellenebilir olması gerekmektedir. 6. Öğrenciye gürültü, aşırı sıcak-soğuk gibi olumsuzluklardan arındırılmış uygun bir ortam oluşturulmalıdır. 7. İstemci bilgisayarlarda kesintisiz güç kaynakları oluşturulmalıdır. Geçerliği sağlamak için yukarıda bahsedilen etkenlerin oluşturulmasının gerekliliği herkes tarafından ne kadar açık şekilde biliniyorsa da bunların nasıl oluşturulabileceği konusunda çok fazla fikir ortaya atılamamıştır. İTÖ’ lerin geçerliğini sağlayabilmek için yeni yaklaşımların ortaya konulması ve geliştirilmesi gerekmektedir. AMAÇ Araştırmada, internet temelli ölçmelerin geçerliğini sağlamada yeni yaklaşımlar irdelenmiştir. Bu bağlamda şu sorulara yer verilmiştir. 1. İTÖ’lerde geçerliği sağlamada mevcut yaklaşımlar nelerdir? 2. İTÖ’lerde geçerliği sağlamada yeni yaklaşımlar nelerdir? YÖNTEM Araştırmada, survey yöntemi kullanılmıştır. Bu kapsamda ilgili üniversite ve kurumlardan, internet temelli ölçmelerde geçerliği sağlamada mevcut ve yeni yaklaşımlarla ilgili bilgi istenmiştir. Evren ve Örneklem Araştırmanın evreni, internet temelli ölçmeleri yapan dört üniversite (Anadolu, Fırat, ODTÜ ve Sakarya) ve ilgili kuruluşlardır. Araştırmanın örneklemi ise şu şekilde belirlenmiştir: İlgili üniversite ve kuruluşlarda bulunan 45 kişiye mail gönderilmiştir. Bu 45 kişiden 33’üçünden (%73.3) cevap alınmıştır. Veriler, kişi maillerinden, belgelerden ve makalelerden toplanmış ve analiz edilmiştir. BULGULAR Aşağıda, internet temelli ölçmelerin geçerliğini sağlamada mevcut yaklaşımlar ile yeni yaklaşımlara ilişkin bulgulara yer verilmiştir.
The Turkish Online Journal of Educational Technology – TOJET January 2005 ISSN: 1303-6521 volume 4 Issue 1
Copyright The Turkish Online Journal of Educational Technology 2002 132
İTÖ’lerde Geçerliğini Sağlamada Mevcut Yaklaşımlara İlişkin Bulgular İnternet temelli ölçmelerde,Yüksek Öğretim Kurumu (YÖK) ara sınavın %20’sini kabul ettiği görülmektedir. %80’lik kısım için ise ödev ve projeler oluşturmaktadır. Bunun yanında YÖK genel sınavı okulda yüz yüze yapılmasını öngörmektedir. Bu yaklaşıma, “yüz yüze yapılan ölçmeye yakın yaklaşım” adı verilebilir. İTÖ’lerde Geçerliğini Sağlamada Yeni Yaklaşımlara İlişkin Bulgular Yeni yaklaşımları ortaya koyarken her zaman mevcut sistem, teknolojik alt yapı ve modernizasyon için gerekli zaman öğeleri göz önünde bulundurulmalıdır. Aşağıda sıralanacak yeni yaklaşım modelleri mevcut imkanların değiştirilmesi veya geliştirilmesi ile kolaylıkla gerçekleşebilecek olan önerilerden oluşmaktadır: 1. Öğretirken Ölçme Yaklaşımı: Bir değerlendirme aşamasında öğrencilerin ilerlemesi (gelişimi), sorulara verdikleri beklenen (normal) ve beklenmeyen (anormal) yanıtlar kaydedilerek izlenmelidir. Bu bir dersin her bölümünün ardından sorulacak sürpriz sorularla gerçekleştirilebilir. Şu anda bazı sertifikasyon kurslarında benzer bir uygulama mevcutsa da verilen cevapların ve bu cevaplar sonucunda alınan konu notlarının kaydı tutulmamaktadır. Bu notların, öğrenciler için oluşturulmuş kişisel ver tabanlarında kaydedilmesi ve geçme notuna etki etmesi olumlu etkiler oluşturacaktır. Böylelikle öğrenciler dersi mutlaka öğrenmeye çalışacak ve kopya çekerek dersi geçebilecekleri düşüncesinden uzaklaşacaklardır. Çünkü bu şekilde ölçme tüm eğitim sürecini kapsar ve öğrencinin kendi yerine bir başkasını sınava dahil etmesi hemen hemen olanaksızlaşır. 2. Araştırma ve Proje Geliştirmeye Teşvik Yaklaşımı: Öğrencilerin hedeflenen teorik bilgi seviyesine ulaşmalarının yanı sıra pratik yetenekler de kazanmalarını sağlayabilmek amacıyla proje ve ödevler verilmelidir. Unutulmamalıdır ki benzeşme, gerçek bir tecrübenin tam bir alternatifi değildir. Örneğin bir öğrencinin Pascal programlama dersini öğrendiği bir dersin sonunda tüm komutların ne işe yaradığını bilmesi ve bu komutları yan yana getirerek yeni bir program yazma yeteneğine ulaşması gerekir. Bu amaçların ikincisi en geçerli şekilde proje geliştirmeye teşvik ve ev ödevleri ile gerçekleştirilebilir. Bu projelerin öğrencilerin ders geçmelerine mutlak katkılarının olması da gerekmektedir. Türkiye’ de internet temelli eğitim veren tüm üniversitelerde benzer bir uygulama mevcuttur fakat Microsoft ve CISCO gibi sertifikasyon programlarında öğrencilerin pratik yeteneklerine hiç dikkat edilmemektedir. Ev ödevleri ve proje çalışmalarını teslim eden öğrencilere mutlaka sözlü mülakat da gerçekleştirilmelidir. Böylelikle öğrencinin çalışmalarını başkasına yaptırması gibi geçerliği olumsuz yönde etkileyecek bir faktörün önüne geçilmiş olunur. 3. Dijital Kimlik Yaklaşımı: Son dönemlerde bu kavram bir çok alanda duyulmaya başlandı. Dijital kimlik elektronik ortamda iletilen bilgilerin kesinlikle bunları gönderen kuruma veya kişiye ait olduğunu doğrulayacak, verinin başkası tarafından yollanmadığını garanti edecek teknolojik uygulamanın adıdır. Eğitim alanında dijital kimliğin kullanılması İTÖ’ lerin geçerlik ve güvenirliğini sağlama amaçlı olarak kullanılabilir. Bu ölçmeye tabi tutulan kişinin hedeflenen kişi olduğundan emin olmak anlamına gelmektedir. Kendi evinde sınava giren bir öğrencinin yanında kimlerin olduğu, kimlerden ve hangi kaynaklardan illegal olarak yararlandığı bilinememektedir. Dijital kimlik yaklaşımının alt basamaklarında bununla ilgili çözümler sunulmaya çalışılmaktadır: a) Ses kimliği: Öğrencilerin internet üzerinden sesli konferans yöntemiyle mülakat ya da sözlü sınava alındığını varsaydığımız bir modelde böyle bir kimliğe ihtiyaç duyulmaktadır. Bu şu anda mevcut olan bir teknolojinin amaca uygun olarak düzenlenmesi ile gerçekleştirilebilir. Bir çok mobil telefonda bulunan sesli arama özelliğinin yanı sıra Microsoft Office XP’ nin İngilizce (ABD), Basit Çince ve Japonca sürümlerinde bu özellik kullanılmaktadır. b) Parmak izi kimliği: Öğrencilerin parmak izleri ve tuşlara basma şekilleri de dijital bir kimlik oluşturabilmektedir. İngiltere'deki Southampton Üniversitesi'nde görevli bilim adamı Neil White ve ekibi, kişilerin tuşlara basma şeklini algılayan bir sistem geliştirmiştir. Bu sistemin, bir tuşa basıldığında oluşan hareket biçimini algılayarak, hafızasındaki bilgiyle karşılaştırdığını belirten White, her insanın kendine özgü tuşlara basma şeklinin olduğunu kaydetmektedir. 4. Video Konferans Yaklaşımı: 2 veya daha fazla noktada bulunan insanların çeşitli cihazları kullanarak sesli ve görüntü olarak, gerçek zamanlı haberleşme yöntemine video konferans denmektedir. Video konferans, farklı noktalardaki öğretmen ve öğrencinin bir araya gelerek yüz yüze görüşmek için bir sürü soruna katlanması yerine, ev ortamındaki öğrencinin okuldaki öğretmenle gerçek zamanlı olarak toplantı, eğitim, rehberlik, konferans yapabilmesine imkan sağlamaktadır. İnternet üzerinden video konferans yapılabilmesi için mikrofon, hoparlör, Web kamerası ve ses kartına ihtiyaç duyulur. Günümüzde satın alınan bilgisayarlar mikrofon, hoparlör ve ses kartı birlikte gelmektedir. Dolayısıyla

The Turkish Online Journal of Educational Technology – TOJET January 2005 ISSN: 1303-6521 volume 4 Issue 1
Copyright The Turkish Online Journal of Educational Technology 2002 133
internet üzerinden video konferans için öğrencilerin sadece basit bir Web kamerası almaları yeterli olabilmektedir. Netmeeting, CU-SeeMe Pro gibi yazılımların kullanımı ile gerçek zamanlı yazışabilme, veri alışverişi yapabilme, uygulama paylaşabilme, white board özelliğini destekleyebilme, whiteboard özelliği sayesinde bir resim programı üzerinde karşılıklı olarak çizim yapabilme veya ortak projeler gerçekleştirebilme gibi imkanlara sahip olunmaktadır. Yüzyüze iletişim ve etkileşimin, geçerlik ve güvenirlik bakımından çok olumlu getirileri olacağı bilinmektedir. İTÖ’ lerde de aynı getirilerden yararlanma adına Video konferans yaklaşımının çok önemli olduğu açıktır. 5. Merkezi Sınav-Sınav Merkezi Yaklaşımı: Şu anda özellikle profesyonel sertifikasyon programlarında uygulanan bu geçerlik yaklaşımı sertifika öğrencilerini tüm dünya ile aynı anda sınava tabi tutabilme olanağı sağlayabilmektedir. Dünyadaki teknik sertifikasyon sınavları, teknoloji geliştiren ve sertifikasyon programları düzenleyen firmalardan bağımsız olarak merkezi sistemle yapılmaktadır. Bu nedenle dünyanın neresinde sınava girilirse girilsin, hep aynı standartlarla karşılaşılmaktadır. Dünya çapında teknoloji tabanlı sınavları ve yeterlilik testlerini sağlayan sayılı firma vardır. Bunlardan en bilinenleri ise VUE ve Prometric’ dir. 2001 Yılı itibariyle VUE ve Prometric şirketleri 2.400 farklı sınavı, 141 ülkede 25 dilde gerçekleştirebilmiştir. Sınavlarda çoktan seçmeli yani test usulü şıklı sorular sorulmaktadır. Ayrıca doldurmanız istenilen boşluklar gibi soru-cevap şeklinde sınav yöntemleri de kullanılmaktadır. Yani sınavlar simülasyonlar da içermektedir. Bunun dışında (İngilizce olarak) bir örnek durum (case study) anlatılıp bu durum üzerinde de sorular sorulmaktadır. Sesten ve gürültüden izole edilmiş bir sınav odasında (Testing Room), kamera veya gözetmen eşliğinde en yalıtılmış özel sınav merkezlerinde bilgisayar başında yapılmaktadır. Sınav programı ve bilgisayarı özeldir ve sınavın yapıldığı bilgisayarlara müdahale edilmesine izin vermemektedir. Sınav soruları söz konusu firmalardan online bağlantı ile kişiye özel olarak sınavın yapıldığı bilgisayara gelir. 6. İç Disiplin Yaklaşımı: Öğrencilerde okulöncesinden itibaren iç disiplin olayının geliştirilmesi gereklidir. İç disiplini geliştirilmiş bir öğrenci her ne sebeple olursa olsun kopya çekmeye yönelmez. Bu konuda, veli, öğretmen ve yöneticilere büyük görevler düşmektedir. SONUÇ Eğitimde yapılan ölçmelerin internet ortamına aktarılmasıyla öneminin daha da arttığı gözlenmektedir. Bu incelemede, internet temelli ölçmelerin geçerliğini sağlamada mevcut ve yeni yaklaşımlar irdelenmiştir. İnternet temelli ölçmelerde geçerliği sağlamak büyük problem olarak görülmektedir. Bunlara çözüm olarak yeni yaklaşımlar önerilmiştir: 1.Öğretirken Ölçme Yaklaşımı 2.Araştırma ve Proje Geliştirmeye Teşvik Yaklaşımı 3.Dijital Kimlik Yaklaşımı 4.Video Konferans Yaklaşımı 5.Merkezi Sınav-Sınav Merkezi Yaklaşımı 6.İç Disiplin Yaklaşımı. KAYNAKÇA Bunderson, C. V. ; Inovye, D. K. ; Olsen, J. B. (1989). The Four Generations of Computerized Educational
Measurement, Educational Measurement, New York: Macmillan. Calvert, E. S.; Waterfall, R. C. (1982). A Comparison of Convertional and Automated Administration of
Raven’s Standard Progressive Matrices. International Journal of Man-Machine Studies, 17, 305-310. Kaya, Z. (2002). Uzaktan Eğitim, Ankara: Pegem A Yayıncılık. Olsen, J. B. ; Maynes, D. M. Slawson, D. A. And Ho, K. (1986). Comparison and Equating of Paper-
administered, Computer-administered and Computerized Adaptive Tests of Achievement, paper presented at the meeeting of the American educational Research Association, San Francisco.
Önal, A. (2002). Çevrimiçi Sınav Sistemi (ÇSS), Açık ve Uzaktan Eğitim Sempozyumu (Bildiri CD ROM’u, 23-25 Mayıs 2002), Eskişehir.
Semerci, Ç. (2002). İnternet Temelli Ölçmelerin Geçerliği ve Güvenirliği, II. Uluslararası Eğitim Teknolojileri Sempozyumu ve Fuarı (16-18 Ekim 2002), Sakarya Üniversitesi, MEB Eğitim Teknolojileri, Ohio University ve Iowa State University İşbirliği İle., Sakarya.
Tan, Ş. ve Erdoğan, A. (2001). Öğretimi Planlama ve Değerlendirme. Ankara: ANI Yayıncılık.
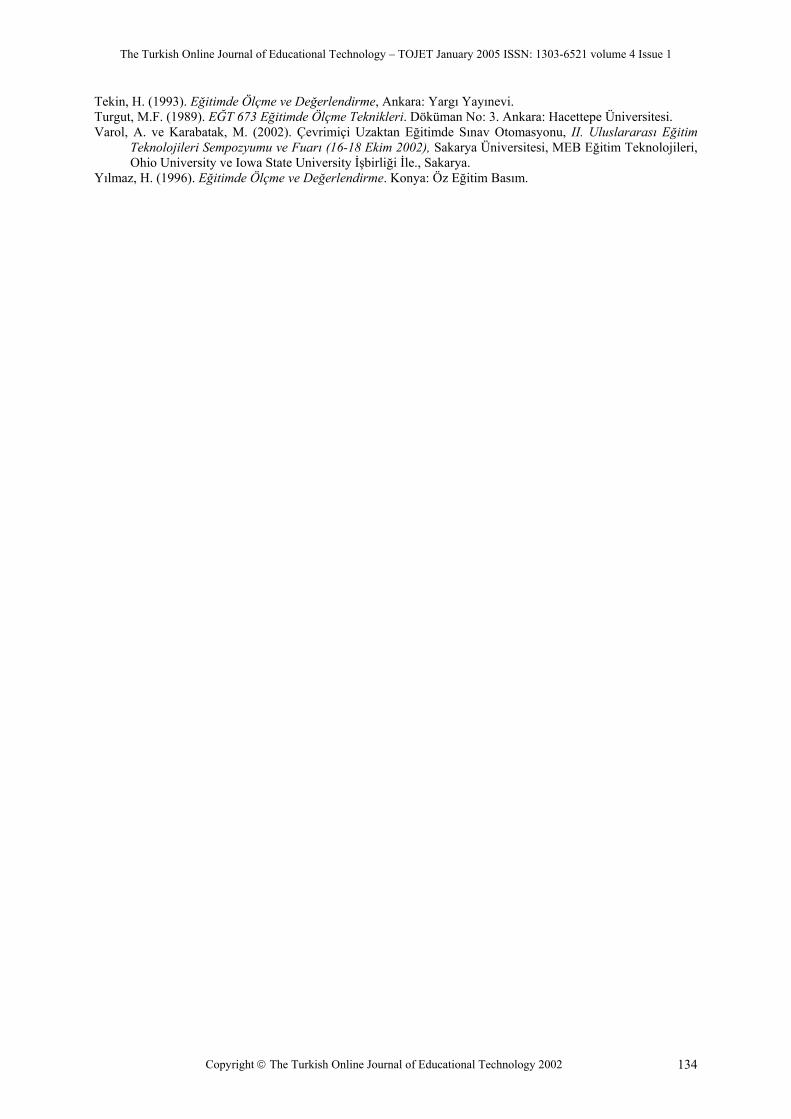
The Turkish Online Journal of Educational Technology – TOJET January 2005 ISSN: 1303-6521 volume 4 Issue 1
Copyright The Turkish Online Journal of Educational Technology 2002 134
Tekin, H. (1993). Eğitimde Ölçme ve Değerlendirme, Ankara: Yargı Yayınevi. Turgut, M.F. (1989). EĞT 673 Eğitimde Ölçme Teknikleri. Döküman No: 3. Ankara: Hacettepe Üniversitesi. Varol, A. ve Karabatak, M. (2002). Çevrimiçi Uzaktan Eğitimde Sınav Otomasyonu, II. Uluslararası Eğitim
Teknolojileri Sempozyumu ve Fuarı (16-18 Ekim 2002), Sakarya Üniversitesi, MEB Eğitim Teknolojileri, Ohio University ve Iowa State University İşbirliği İle., Sakarya.
Yılmaz, H. (1996). Eğitimde Ölçme ve Değerlendirme. Konya: Öz Eğitim Basım.
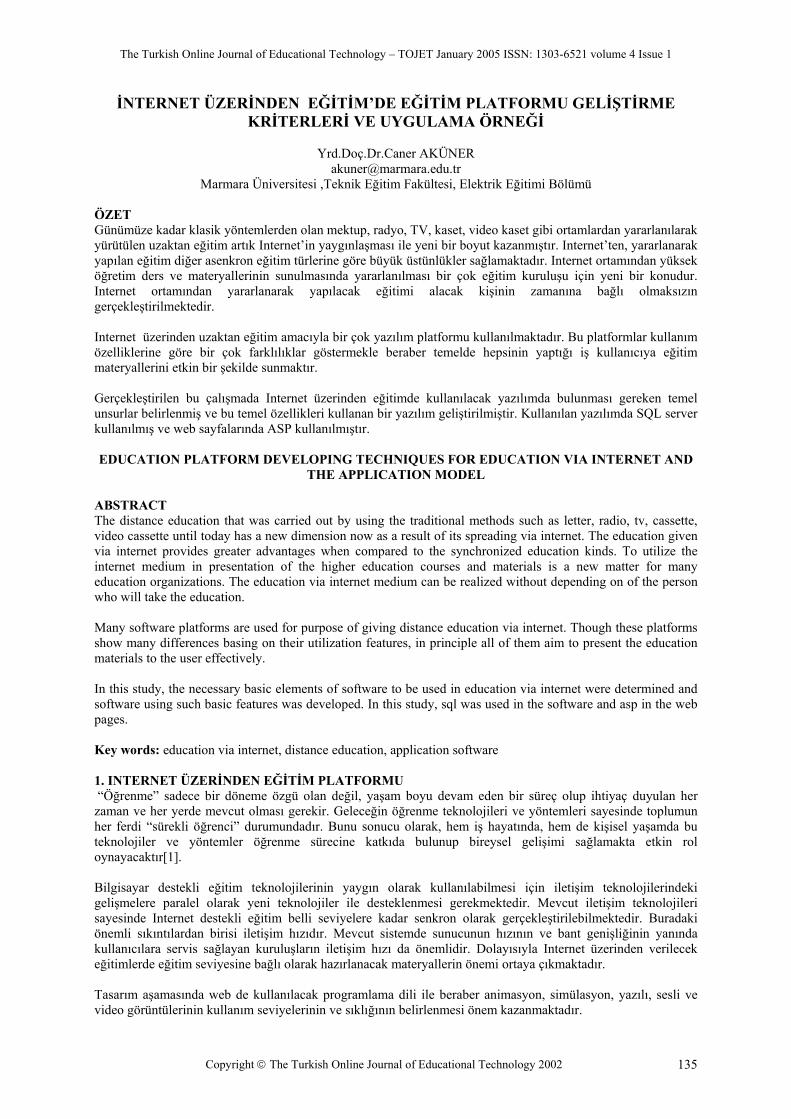
The Turkish Online Journal of Educational Technology – TOJET January 2005 ISSN: 1303-6521 volume 4 Issue 1
Copyright The Turkish Online Journal of Educational Technology 2002 135
İNTERNET ÜZERİNDEN EĞİTİM’DE EĞİTİM PLATFORMU GELİŞTİRME KRİTERLERİ VE UYGULAMA ÖRNEĞİ
Yrd.Doç.Dr.Caner AKÜNER
[email protected] Marmara Üniversitesi ,Teknik Eğitim Fakültesi, Elektrik Eğitimi Bölümü
ÖZET Günümüze kadar klasik yöntemlerden olan mektup, radyo, TV, kaset, video kaset gibi ortamlardan yararlanılarak yürütülen uzaktan eğitim artık Internet’in yaygınlaşması ile yeni bir boyut kazanmıştır. Internet’ten, yararlanarak yapılan eğitim diğer asenkron eğitim türlerine göre büyük üstünlükler sağlamaktadır. Internet ortamından yüksek öğretim ders ve materyallerinin sunulmasında yararlanılması bir çok eğitim kuruluşu için yeni bir konudur. Internet ortamından yararlanarak yapılacak eğitimi alacak kişinin zamanına bağlı olmaksızın gerçekleştirilmektedir. Internet üzerinden uzaktan eğitim amacıyla bir çok yazılım platformu kullanılmaktadır. Bu platformlar kullanım özelliklerine göre bir çok farklılıklar göstermekle beraber temelde hepsinin yaptığı iş kullanıcıya eğitim materyallerini etkin bir şekilde sunmaktır. Gerçekleştirilen bu çalışmada Internet üzerinden eğitimde kullanılacak yazılımda bulunması gereken temel unsurlar belirlenmiş ve bu temel özellikleri kullanan bir yazılım geliştirilmiştir. Kullanılan yazılımda SQL server kullanılmış ve web sayfalarında ASP kullanılmıştır. EDUCATION PLATFORM DEVELOPING TECHNIQUES FOR EDUCATION VIA INTERNET AND
THE APPLICATION MODEL ABSTRACT The distance education that was carried out by using the traditional methods such as letter, radio, tv, cassette, video cassette until today has a new dimension now as a result of its spreading via internet. The education given via internet provides greater advantages when compared to the synchronized education kinds. To utilize the internet medium in presentation of the higher education courses and materials is a new matter for many education organizations. The education via internet medium can be realized without depending on of the person who will take the education. Many software platforms are used for purpose of giving distance education via internet. Though these platforms show many differences basing on their utilization features, in principle all of them aim to present the education materials to the user effectively. In this study, the necessary basic elements of software to be used in education via internet were determined and software using such basic features was developed. In this study, sql was used in the software and asp in the web pages. Key words: education via internet, distance education, application software 1. INTERNET ÜZERİNDEN EĞİTİM PLATFORMU “Öğrenme” sadece bir döneme özgü olan değil, yaşam boyu devam eden bir süreç olup ihtiyaç duyulan her zaman ve her yerde mevcut olması gerekir. Geleceğin öğrenme teknolojileri ve yöntemleri sayesinde toplumun her ferdi “sürekli öğrenci” durumundadır. Bunu sonucu olarak, hem iş hayatında, hem de kişisel yaşamda bu teknolojiler ve yöntemler öğrenme sürecine katkıda bulunup bireysel gelişimi sağlamakta etkin rol oynayacaktır[1]. Bilgisayar destekli eğitim teknolojilerinin yaygın olarak kullanılabilmesi için iletişim teknolojilerindeki gelişmelere paralel olarak yeni teknolojiler ile desteklenmesi gerekmektedir. Mevcut iletişim teknolojileri sayesinde Internet destekli eğitim belli seviyelere kadar senkron olarak gerçekleştirilebilmektedir. Buradaki önemli sıkıntılardan birisi iletişim hızıdır. Mevcut sistemde sunucunun hızının ve bant genişliğinin yanında kullanıcılara servis sağlayan kuruluşların iletişim hızı da önemlidir. Dolayısıyla Internet üzerinden verilecek eğitimlerde eğitim seviyesine bağlı olarak hazırlanacak materyallerin önemi ortaya çıkmaktadır. Tasarım aşamasında web de kullanılacak programlama dili ile beraber animasyon, simülasyon, yazılı, sesli ve video görüntülerinin kullanım seviyelerinin ve sıklığının belirlenmesi önem kazanmaktadır.

The Turkish Online Journal of Educational Technology – TOJET January 2005 ISSN: 1303-6521 volume 4 Issue 1
Copyright The Turkish Online Journal of Educational Technology 2002 136
Eğitim platformu tasarımı gerçekleştirilirken verilen derslerin web sayfalarında ilk seviyelerde ortak ve olabildiğince az grafik içeren bir ara yüz kullanmaya çalışılmıştır. Derslerin üst seviye sayfalarının tasarımı ortak yapılmıştır. 2. EĞİTİM PLATFORMU TASARIMI Web üzerinde asenkron eğitim verilirken derslerin hazırlanmasında aşağıdaki kriterlere dikkat edilmesi gerekmektedir[2]. a Grafik Tasarımı ve Stil b Genel Yapı ve Format Grafik tasarım yönünden: Dersi oluşturan web sayfaları rahat gezinmeyi sağlayacak bir yapı izlemeli ve bunu oluşturacak grafik araçlarla desteklenmelidir. Ders metninin satırları ekran boyutunun %70 - %75'ni kaplayacak şekilde düzenlenmeli, sayfaların konu bütünlüğünü bozmamak kaydıyla çok uzun olmamasına özen gösterilmeli, ekran çözünürlüğünün 600´800 olmasına dikkat edilmelidir. Çok fazla renk kullanılmamalı ve belli renk kombinasyonlarından kaçınılmalıdır. (Örneğin sarı+beyaz, kırmızı+siyah, mavi+yeşil..) Ders genelinde mümkün olduğunca "şerifsiz" font kullanılmalı, ana başlıklar ve alt başlıklardaki font büyüklüğü ve bütünlüğüne dikkat edilmeli ve bu bütünlük ders genelinde korunmalıdır. Çok küçük ya da çok büyük fontlardan kaçınılmalı, uzun bir metnin tamamı büyük harfle yazılmamalıdır. Ders notları içerisinde akılda kalıcılığı artırmak açısından resimlerle ya da diğer çoklu-ortam araçlarıyla kolayca anlatılabilecek bir nesneyi metinlerle açıklamaktan kaçınılmalıdır. Ancak gereksiz ve konuyla ilgisiz süslemeler kullanılmamalıdır. Resimler için uygun çözünürlük ve boyut kullanılmalıdır. Grafik tasarımı yapılırken erişim hızı önemle göz önünde bulundurulmalıdır. Birden fazla ders içeren paketlerde ekran tasarımı açısından bütünlük ve tutarlılık sağlanması gerekmektedir[2]. Genel Yapı yönünden: Bir web tabanlı derste tarayıcı ile ulaşılabilen aşağıdaki sayfalar bulunmalıdır. Dersin izlenmesini kolaylaştırmak açısından bu sayfalar arasında düzgün bir yapı kurulması önemlidir[2]. Kapak sayfası Ders içeriği sayfası Ders sayfaları Tartışma grubu sayfaları Öğrenci listeleri/notlama sayfaları Ödev/alıştırma sayfaları (Ders malzemesi içerisinde de yer alabilir) Sıkça sorulan sorular (Dersin birden fazla kere verilmesi durumunda) Ek bağlantı sayfaları Web tabanlı derslerin izlenmesi ile ilgili bilgi sayfası 3. EĞİTİM PLATFORMUNUN KATMANLARI Tasarlanan sistem temel olarak iki kısımdan meydana gelmektedir. Bunlar sırasıyla : a. Yönetici katmanı b. Öğrenci katmanı Yönetici Katmanı: Ana giriş ekranından yönetici parolasıyla girildiğinde şekil 1’deki ara yüz kullanılarak sisteme giriş yapıldığında şekil 2’deki ara yüz kullanıma açılmaktadır.
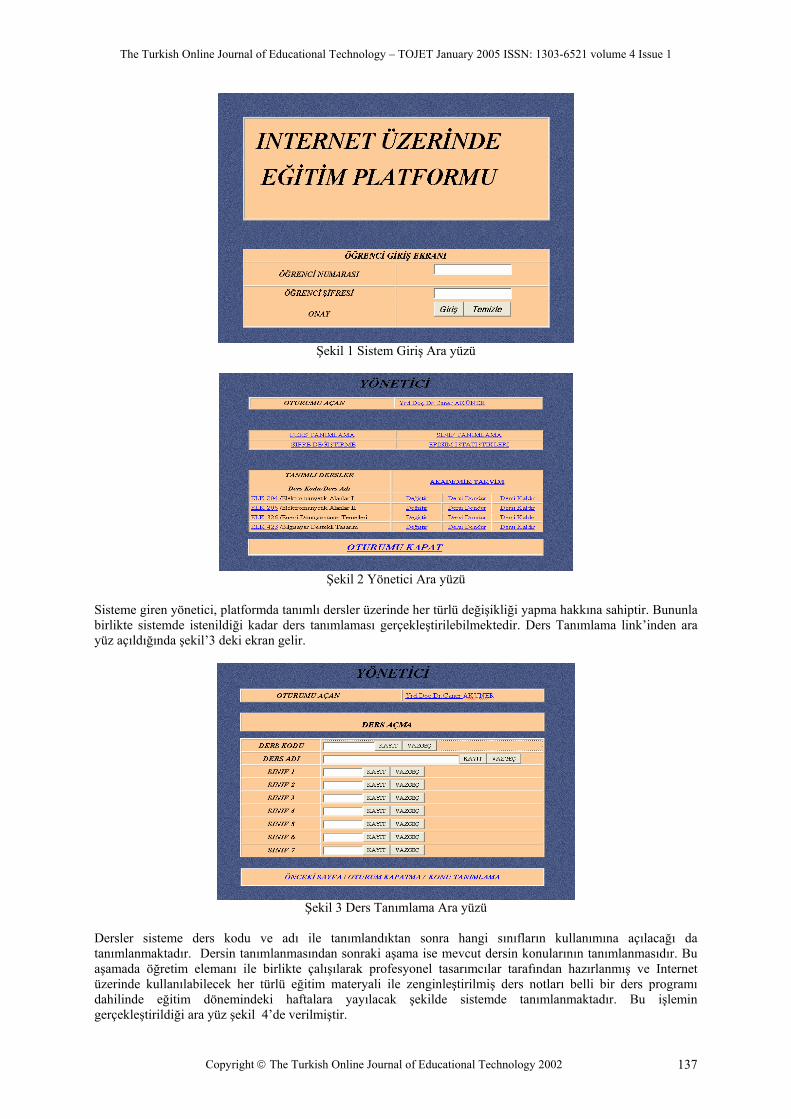
The Turkish Online Journal of Educational Technology – TOJET January 2005 ISSN: 1303-6521 volume 4 Issue 1
Copyright The Turkish Online Journal of Educational Technology 2002 137
Şekil 1 Sistem Giriş Ara yüzü
Şekil 2 Yönetici Ara yüzü
Sisteme giren yönetici, platformda tanımlı dersler üzerinde her türlü değişikliği yapma hakkına sahiptir. Bununla birlikte sistemde istenildiği kadar ders tanımlaması gerçekleştirilebilmektedir. Ders Tanımlama link’inden ara yüz açıldığında şekil’3 deki ekran gelir.
Şekil 3 Ders Tanımlama Ara yüzü
Dersler sisteme ders kodu ve adı ile tanımlandıktan sonra hangi sınıfların kullanımına açılacağı da tanımlanmaktadır. Dersin tanımlanmasından sonraki aşama ise mevcut dersin konularının tanımlanmasıdır. Bu aşamada öğretim elemanı ile birlikte çalışılarak profesyonel tasarımcılar tarafından hazırlanmış ve Internet üzerinde kullanılabilecek her türlü eğitim materyali ile zenginleştirilmiş ders notları belli bir ders programı dahilinde eğitim dönemindeki haftalara yayılacak şekilde sistemde tanımlanmaktadır. Bu işlemin gerçekleştirildiği ara yüz şekil 4’de verilmiştir.
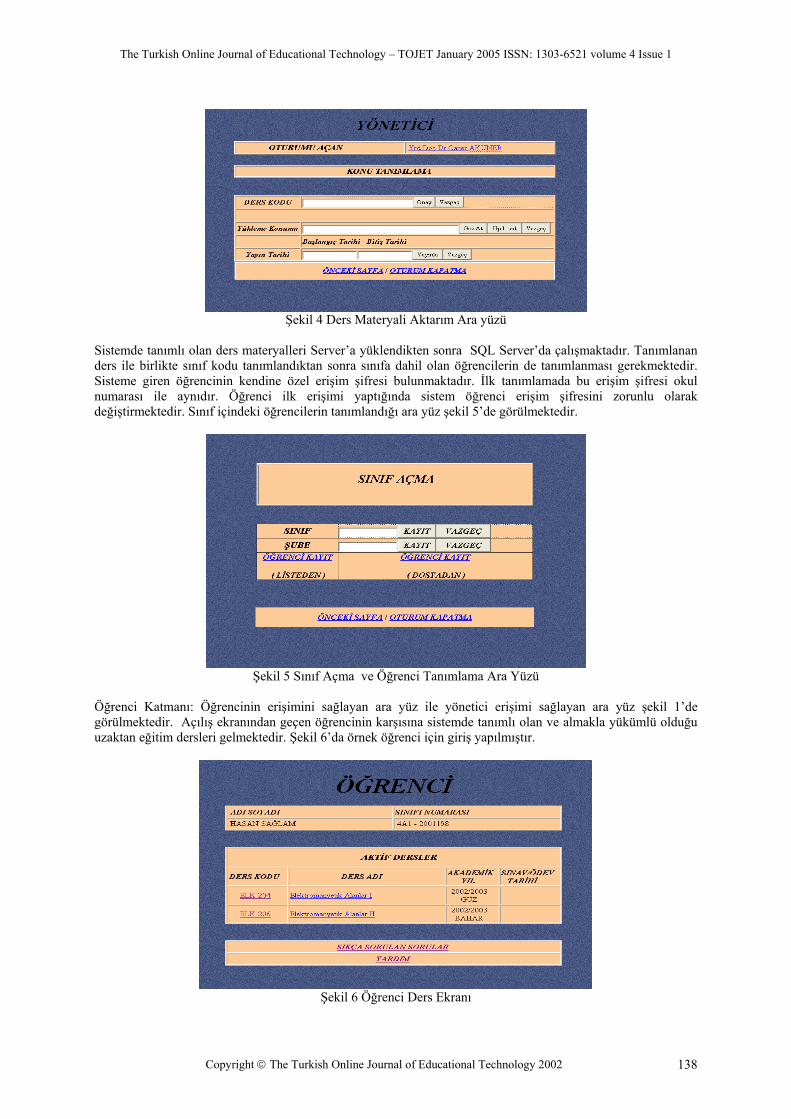
The Turkish Online Journal of Educational Technology – TOJET January 2005 ISSN: 1303-6521 volume 4 Issue 1
Copyright The Turkish Online Journal of Educational Technology 2002 138
Şekil 4 Ders Materyali Aktarım Ara yüzü
Sistemde tanımlı olan ders materyalleri Server’a yüklendikten sonra SQL Server’da çalışmaktadır. Tanımlanan ders ile birlikte sınıf kodu tanımlandıktan sonra sınıfa dahil olan öğrencilerin de tanımlanması gerekmektedir. Sisteme giren öğrencinin kendine özel erişim şifresi bulunmaktadır. İlk tanımlamada bu erişim şifresi okul numarası ile aynıdır. Öğrenci ilk erişimi yaptığında sistem öğrenci erişim şifresini zorunlu olarak değiştirmektedir. Sınıf içindeki öğrencilerin tanımlandığı ara yüz şekil 5’de görülmektedir.
Şekil 5 Sınıf Açma ve Öğrenci Tanımlama Ara Yüzü
Öğrenci Katmanı: Öğrencinin erişimini sağlayan ara yüz ile yönetici erişimi sağlayan ara yüz şekil 1’de görülmektedir. Açılış ekranından geçen öğrencinin karşısına sistemde tanımlı olan ve almakla yükümlü olduğu uzaktan eğitim dersleri gelmektedir. Şekil 6’da örnek öğrenci için giriş yapılmıştır.
Şekil 6 Öğrenci Ders Ekranı

The Turkish Online Journal of Educational Technology – TOJET January 2005 ISSN: 1303-6521 volume 4 Issue 1
Copyright The Turkish Online Journal of Educational Technology 2002 139
Şekil’6 daki derslerden ELK 204 kodu ile tanımlanan örnek derse giriş yapıldığında şekil 7’de verilen ders içerikleri ekrana gelecektir. Öğrenci aktif tarihli dersi seçerek konuları takip edebilecektir. Ders materyalleri dersin ve konunun özelliğine göre farklı yapıda olabilmektedir. Sistem mevcut bütün materyalleri destekleyecek şekilde tasarlanmıştır.
Şekil 7 Örnek ders Ekranı
Uygulama platformu tasarımı gerçekleştirilirken öğrencinin kolay erişebileceği, sayfalar arasında dolaşırken zorluk çekmeyeceği, bir yapı kurulmaya çalışılmıştır. 4. SONUÇ Yapılan çalışma sonucunda esnek bir kullanım sağlayan Internet üzerinden eğitim platformu gerçekleştirilmiştir. Böylelikle; 1. İstenildiği kadar ders akademik program dahilinde zaman ve mekandan bağımsız olarak istenilen yerde ve zamanda verilmesi sağlanabilmektedir. 2. Enformatik Milli Komitesinin belirlediği genel çerçeve esasları dikkate alınarak gerçekleştirilen ara yüzlerde öğrencilerin kullanım kolaylığı ve bilgiye en kısa sürede ulaşmaları amaçlanmıştır. 3. Öğretim elemanı açılan derslerdeki sunulan eğitim materyallerinin sürekli geliştirilebilmesi için yapılacak olan değişiklikleri kolay ve hızlı olarak gerçekleştirebilmektedir 4. Hazırlanan eğitim platformunda asenkron eğitimin yanı sıra Ülkemizde geniş bant uygulaması gerçekleştirildiği tam anlamıyla Senkron eğitim imkanı sunulabilecektir. Bugün sadece şirketlerin özel hat kiralayarak sunabildikleri bu yapı, e-öğrenim’in sınırlarını teşkil etmektedir. 5. Öğrenciler dersin tanımlandığı zaman dilimi içerisinde arzu ettikleri tekrar sayılarında konuları izleyebilmekte böylece dinlenmek için verdikleri molalara kendileri karar verebilmektedir. 6. Öğretmenler arasında değişen öğretimin niteliği yüksek düzeylere çıkarılabilmektedir. 7. Her Öğrenci kendi öğrenme hızında bir eğitim alır. Öğrencilere öğrenme sürelerini düzenleme olanakları verilmektedir[8]. 8.Öğrenci kendine ait kişisel bir öğrenme ortamında rahatlıkla çalışabilir[8]. KAYNAKLAR [1] “Uzaktan Eğitim Programlarına Genel Bakış”, Ö.Erişen,Ü.,Kılıç, N., Pelit, H., Vural, Açık ve Uzaktan
Eğitim Sempozyumu 23-25 mayıs 2002 Anadolu Üniversitesi, Eskişehir. [2] Enformatik Milli Komitesinin “Uzaktan Yükseköğretim Kapsamında Açılacak Dersler/Programlara İlişkin
Genel İlkeler” [3] Penfield P, Larson R.C., Education Via Advanced Technologies, IEEE Transactions on Education, vol 39,
No3, August 1999
The Turkish Online Journal of Educational Technology – TOJET January 2005 ISSN: 1303-6521 volume 4 Issue 1
Copyright The Turkish Online Journal of Educational Technology 2002 140
[4] Aküner,M.C., Boynak, F.;"Üniversitelerde Internet Üzerinden Uzaktan Eğitim Uygulaması",Bilgi Teknolojileri Kongresi, Pamukkale Üniversitesi, 06/08- Mayıs 2002, Denizli.
[5] Canoğlu, S., Aküner M.C.,”İnternet Üzerinden Eğitim Uygulaması”, II. Uluslar Arası Eğitim Teknolojileri Sempozyumu ve Fuarı 16-17-18 Ekim 2002 Sakarya
[6] “Türkiye’de Uzaktan Eğitimin geleceği ve E-Üniversite” Çallı,İ., Açık ve Uzaktan Eğitim Sempozyumu 23-25 mayıs 2002 Anadolu Üniversitesi, Eskişehir.
[7] ”Web tabanlı kurumsal eğitim yaklaşımı”, http://www.tes.com.tr/e-learning/ [8] “Öğretme Sanatı”, Demirel, Ö., Pegem A Yayınları,2002, Sayfa166-171

The Turkish Online Journal of Educational Technology – TOJET January 2005 ISSN: 1303-6521 volume 4 Issue 1
Copyright The Turkish Online Journal of Educational Technology 2002 141
OLUŞTURMACI ÖĞRENME YAKLAŞIMININ UZMANLAŞMAYA ETKİSİ
Doç.Dr. Mehmet GÜROL Fırat Üniversitesi, Teknik Eğitim Fakültesi
[email protected], [email protected] ÖZET Uzmanlar takım çalışması yapar, bilgilerini paylaşır ve iletir, araştırır, uygular ve yeni durumlar için biçimlendirir. Ancak, okullarımız bireyselliği öne çıkarmakta, paylaşımı sınavlarda olduğu gibi engellemektedir. Tynjala’ya göre (1999) bugünün öğretiminin en önemli eksikliği, alan bilgisini uygulamaya yönelik becerilerin genel bilimsel bilgilerle bütünleştirileceği bir öğretim uygulamasının geliştirilmemiş olmasıdır. Böyle bir uygulamanın oluşturmacı öğrenme yaklaşımı ile gerçekleştirilebileceği vurgulanmaktadır. Bu bildiride Dreyfus ve Dreyfus (1986), Chi, Glaser ve Farr (1988), Ericsson ve Lehman (1996), Sternberg (1997), Etelapello ve Light (1999) ve Tynjala (1999) gibi bilim adamların uzmanlığa ilişkin görüşleri incelendikten sonra Jonassen ve arkadaşlarının (2003) oluşturmacı yaklaşımı esas alan bilgi edinim aşamaları tartışılmaktadır. Özellikle, yükseköğretimde oluşturmacı öğrenme yaklaşımının uzmanlaşmada nasıl kullanıldığı örneklerle sorgulanmaktadır. 1. OLUŞTURMACI YAKLAŞIM Oluşturmacılık, bilginin dolayısıyla öğrenme ve öğretimin doğası konusundaki temel oluşturacak bir akımdır. Oluşturmacılık, kökeni Kant’a ve 18. yy.daki Granbattista Vico’nun düşüncesine, William James ve John Dewey gibi Amerikan pragmatislerine ve F.C. Bartlett, Piaget ve Wygutsky gibi bilişsel ve sosyal psikolojinin güçlü isimlerine kadar uzanan bir bilgi teorisidir. Radikal veya bilişsel, sosyal, sosyo-kültürel sembolik etkileşimci oluşturmacılık gibi kolları olsa da hepsinin ortak vurgusu bilginin bireyler ya da sosyal olarak aktif olarak oluşturulduğu, anlam verildiği bir süreçtir (Derrey, 1996, Ernest, 1995, Gergen, 1995, Richard, 1995, von Glascerstald, 1995). Oluşturmacılığa göre öğrenme, bilginin pasif bir şekilde ele alımı değil, öğrenenin fenomonolojik kavramlarının oluşturulması ya da yeniden oluşturulmasının aktif olarak devamlılık gösteren bir süreçtir. Yani, ezberleme ve bilginin yeniden üretimi yerine anlamayı vurgulamak ve anlam oluşturmada sosyal etkileşim ve işbirliği önemli olmaktadır. Oluşturmacılığın birkaç önemli işaretleri vardır. Bunlar: - Öğrenenin eski bilgisi, inançları, anlayışları ve yanlış algılamanın önemi - Öğrencilerin metabiliş ve öz düzenleyici yetenekleri ile bilgisinin önemi - Tartışma ve işbirliğinin farklı biçimleriyle anlamın paylaşımının önemi - Kavramların ve bilginin çok yönlü sunularının-anlatımlarının kullanılması - Öğrenmenin durumsal doğasını dikkate alan öğretimsel yöntemleri geliştirme ihtiyacı ve böylece bilgi edinimini ve kullanımını bütünleştirme - Öğrenme süreçlerine yerleştirilen, otantik görevlere odaklanan öğrenenlerin bireysel uyumlarını dikkate alan ve metabiliş yeteneklerini teşvik eden değerlendirme biçimlerini geliştirme ihtiyacı 2. UZMANLAŞMA VE UZMANLIK BİLGİSİ Bugünün toplumundaki hızlı değişme, bireylerin yaşam boyu öğrenme stratejisini uygulayarak edindiği bilgileri tekrar tekrar oluşturmasını ve eğitim sistemlerinin geleceğin çalışma yaşamının uzmanlarını yetiştirmesini gerektirmektedir. mevcut eğitim uygulamaları öğrencilere gerçek dünyada uzmanlardan bekleneni vermemektedir. Çünkü uzmanlar takım çalışması yapmakta, bilgileri paylaşmakta, araştırmakta, uygulamakta ve yeni durumlar için uyarlamaktadır. Bu durum eğitim sistemlerinin sorgulanmasını ve amaçların yeniden gözden geçirilmesine neden olmuştur (Atasoy, 2002: 1-2). Uzmanlaşma “uzmanlık bilgisine sahip olma ve onu organize etme” olarak tanımlanmakta ve özellikleri zamana, yere ve alana göre değişebilmektedir (Chi, Glaser ve Farr, 1988; Ericson ve Lehman, 1996). Yine, son yıllarda yapılan çalışmalarda uzmanlık bilgisi 1. Formal, 2. uygulama bilgisi i ve 3. öz düzenleme bilgisi olmak üzere üç ana bilgide ele alınmaktadır (Tynjâlâ, 1999; Etelägelta ve light, 1999). Formal (soyut) bilgi, bilişselci psikologların belirttiği gibi olaylara dayalı ve anlaşılırdır. Eğitimde temel role sahip olup mesleki yeterliğin özünü oluşturmaktadır. Uygulama bilgisi (işlevsel) ise “nasıl’ın bilgisi” olarak kendini göstermektedir. Formal bilgi evrensel ve gözlenebilir olarak nitelendirilirken, uygulamalı bilgi sezgiye benzemekte, açıklanması zor, kişisel ve kapalıdır. Öz düzenleme bilgi ise bireylerin kendi eylemlerini yansıtmak ve değerlendirmek için
The Turkish Online Journal of Educational Technology – TOJET January 2005 ISSN: 1303-6521 volume 4 Issue 1
Copyright The Turkish Online Journal of Educational Technology 2002 142
kullandıkları metabiliş ve yansıtmacı yetenekten oluşmaktadır. Eğitim kuramları formal bilginin kazanımı üzerine odaklaşırken, uygulamalı bilginin gelişimi çalışma yaşamında test edilmektedir. Öz düzenleme bilgi her ikisini de kapsamaktadır. Tynjala (1999), bu üç bileşenin entegre edilmesini ve öğretimde uygulanması için çalışılması gerektiğini vurgulamaktadır. Uzmanlık konusunda Sternberg’in (1997) görüşleri de önemli yer tutmaktadır. Sternberg’e göre uzmanlık çok boyutlu bir modeldir. Yedi özelliği bulunmaktadır. 1. İleri düzey problem çözme, 2. İleri düzeyde bilgi düzenlemesi, 3. Çok miktarda bilgi, 4. Bilgiyi etkili olarak kullanma yeteneği, 5. Ön bilginin üzerinde yeni bilgiler oluşturma, 6. Otomatikleştirilmiş eylemler, 7. Pratik yeteneği. Bu modelin nitelikleri zaman ve yere göre değişebildiği gibi bir alandan diğerine de değişmektedir. Yani, uzmanlık alana özgüdür. Doğal olarak bu basamaklar uzmanlığa nasıl gelindiğini, öğrenmenin nasıl oluştuğunu açıklayamamaktadır. Bunun için de Kolb’un geliştirdiği “Deneysel Öğrenme Modeli” kullanılmaktadır. Temelini yetişkin eğitimindeki pedagojik uygulamalardan alır. Deneysel öğrenme, bireyin çevresiyle ilgili deneyimine dayanan sürekli öğrenme sürecidir. Metabiliş ve yansıtmacı etkinliklerin önemine vurgu yapılmaktadır. Dreylus ve Dreylus ile Kolb, zihinsel etkinliklere önem verirken; Brown ve diğerleri (1989), Lave ve Wenger (1991), Mandl ve diğerleri (1996) ise uzmanlığın öğrenilmesi ve gelişimi için araç olarak durumlu, otantik etkinlik ve çıraklığın önemini vurgulamışlardır. Çıraklık, öğrenenlere uzman kişilerin davranışlarını, gözlem ve uygulama, ilgili terminolojiye hakim olma ve bir mesleki gruba katılım fırsatını vermektedir. Uzmanlığın gelişimi de öğrenenlerin bir uygulama topluluğu içinde kültürel olarak uyumlu hale gelmesidir. Mandl ve diğerleri (1966) bu modelin yükseköğretim için çok uygun olduğunu belirtmişlerdir. Kısaca uzmanlığın gelişimi, uzman bilginin farklı boyutlarının tutarlı bir bütünlük içinde gerçekleşmesidir. Bunun için teori ile pratik bilginin bütünleştirilmesi gerekmektedir. Önemli olan bu bütünleşmenin nasıl gerçekleşeceğidir. Örneğin Leinhartle ve diğerleri (1995), uygulamada elde edilen bilginin bildirimsel-aktarımsal, soyut ve kavramsal olduğunu belirtmişlerdir. Bundan dolayı uygulamayı kuramsallaştırma ve kurumda ayrıntılaştırma uzmanlık bilgisinin gelişiminde önemlidir. Çünkü, öğrenme, “ne” ve “nasıl” olduğu konusu bunların etkileşime bağlıdır. Buna ise çok a kişi ulaşabilmektedir. Bu etkileşimin en iyi gerçekleşebildiği yer yükseköğretimdir. Jonassen v arkadaşları buna yönelik çalışmalar yapmıştır. Bunun için bilgisizlikten uzmanlığa geçişi sağlayacak bilgi ediniminin devamlılığını ortaya koymuştur. Öğrenmenin aşamalarını giriş, tanıtıcı, ileri düzey ve uzmanlık olarak sıralamıştır. Tanıtıcı öğrenme, öğrenenlerin ön bilgilerini bir yeteneğe veya içerik alanına doğrudan aktarmada yetersiz kaldıkları düzeydir. Şemanın özümsenmesi ve düzenlenmesinin birinci aşamasını oluşturmaktadır. İleri düzey bilgi edinimi, daha karmaşık, alana veya bağlama (context) dayalı problemleri çözmeyi içerir. Uzmanlık ayrıntılı olarak açıklanmaktadır (Jonassen ve diğerleri, 2003). Bilgi ediniminin her bir aşaması farklı öğrenme türlerini gerektirdiği için her biri farklı yaklaşımları önermektedir. Tanıtıcı bilgi edinimi aşaması, klasik öğretim tasarımı tekniklerine dayanan öğretimsel tekniklerce daha iyi yerine getirmektedir. Klasik öğretim tasarımı, önceden belirlenen öğrenme sonuçlarıyla, sınırlı ve ardışık öğretim etkileşimleri ve ölçüte dayalı değerlendirmeyi esas almaktadır. İleri düzey bilgi ediniminde oluşturmacı öğrenme çevreleri (öğretim tasarımı) kullanılabilir. Öğrenme sürecinin sonunda uzmanlar çok az öğretimsel desteğe ihtiyaç duyarlar ve bu da oluşturmacı çevrelerce sağlanabilir. Bununla birlikte, Jonassen ve diğerlerinin de (2003) belirttiği gibi, oluşturmacı yaklaşımı tavsiye etmeden önce bu yaklaşımların her öğrenme bağlamında geçerli olamayacağını bilmek gerekir. Üniversiteler ve liseler ileri bilgi ediminde yoğunlaşabilmektedirler. Tanıtıcı bilgi aşaması ise genellikle lise öğrenimi esnasında veya üniversiteye hazırlıkta daha çok etkili olmaktadır. Ancak, çoğu üniversitelerin programları, özellikle öğrencilerin öğrenim gördükleri alanda, oluşturmacı öğrenme süreçlerini ve çevrelerini destekler niteliktedir. 3. YÜKSEKÖĞRETİMDE UZMANLIK Bilgi toplumunda, meslekler çeşitli taleplerle yüz yüzedir. Uluslar arası ilişkilerin artması, yoğun bilgiye dayalı çalışmalardaki artış, bilgi teknolojisinin artan kullanımı, ağlara ve takımlara dayanan yeni bir çalışma biçimi, mesleki çalışmada ihtiyaç duyulan yeteneklerin oranını artırmıştır. Artık çalışanlarda beklenen sadece bilgiye hakim olmakla değil, aynı zamanda diğer alanlardan uzmanlarla çalışma yeteneği; sosyal, iletişim ve işbirliği becerileri; eleştirel olarak bilgiyi seçme, elde etme ve kullanma yeteneğini kullanmaktır. Yükseköğretimin amaçlarında bu gelişimlere paralel olarak değişmeler yapılmaktadır. Alkins (1995). Yükseköğretimin genel amaçlarını şu şekilde belirlemiştir: 1. Genel bir eğitim deneyimi sağlama 2. Bilginin yayımı, uygulanması ve oluşturulması için hazırlama 3. Özel bir alan için hazırlama

The Turkish Online Journal of Educational Technology – TOJET January 2005 ISSN: 1303-6521 volume 4 Issue 1
Copyright The Turkish Online Journal of Educational Technology 2002 143
4. Genel bir görev için hazırlama Bu genel amaçları, daha alt bileşenlere ayırmak mümkündür. Örneğin, genel eğitim uzmanlığı, zihinsel gelişimi içerir. Yani, yaşam boyu öğrenme esasına dayalı kritik düşünme becerilerini ve yeteneğini içerir. Bilginin yayımı uygulanması ve oluşturulması ise uzmanlaşılan alanın kavramsal temelinin kazanılmasını, derin bir bilgi edinilmesini, yöntemlerinin kavranılmasını bilgi oluşturmayla ilgili deneyimi içerir. Bir mesleğe hazırlanmak, kavramsal ve uygulamalı bilginin bütünleştirilmesini, yeteneklerin geliştirilmesini ve müşterilerle etkileşime girme yeteneklerini içerir. Genel bir göreve (istihdam) hazırlama ise uygulamalı deneyimlerinden, sözel anlatım ve rapor yazmayı içeren iletişim yeteneklerinin gelişimini, iletişim teknolojileri ve yabancı dillerin kullanımı gibi teknik becerilerin öğrenme ve uygulama yeteneğini kapsamaktadır (Tynjala, 1999). Diğer taraftan, Mandl ve diğerleri (1993), üniversite öğretiminin geleneksel formlarında öğrencilerin genellikle yararsız bilgi edindiklerini belirtmiştir. Bu tür bilgilerin (aktarıma dayalı) yaşamın karmaşık sorunlarına aktarılmasının zor olduğunu belirtmişlerdir. Yine Geisler (1994), yükseköğretimde kullanılan öğretimsel sistem tasarımının (davranışsal yaklaşımı esas alan) uzmanlar yetiştirmekten çok, uzman tüketiciler ürettiğini savunmuştur. Bu eleştirilerin temel noktasını, eğitsel uygulamaların öğrencilerin hazırlanacağı varsayılan gerçek çevrelere uygun olmadığıdır. Öğrenciler genellikle bireysel çalışır, bilgisini paylaşmakta zorlanır, ezbere yönlendirilir, sınavlarda da buna göre şekillenir. Artık, kişisel olarak aktarılabilir ve geniş kapsamlı akademik yeteneklerle alana özgü bilgiyi bütünleştirecek öğretimsel uygulamalara ihtiyaç vardır. Bunun için oluşturmacı yaklaşım çıkış noktası gibi görünmektedir. Doğal olarak, uzmanlığın gelişimi açısından bakıldığında eğitim sisteminin eleştirilmesi kaçınılmazdır. Örneğin Geisler (1994) eğitimin zıt iki fonksiyona sahip olduğunu belirtmiştir; uzmanlar yetiştirme ve uzmanlığın tüketicilerini yetiştirme. Geistler, eğitimin “alan içeriği ve retorik süreç”ten oluşan bilginin iki farklı boyutunda uzmanlığı ayrımlaştırmıştır. Formal eğitim, bütün öğrenenlere alan içeriğinin formal olarak, gözlenebilen bilginin deneyimsiz bir biçimde kazanılmasını sağlar, fakat profesyonel uzmanların üretimini de gerçekleştirir. Bunu yaparken retorik süreci de kısıtlamaktadır. Buna rağmen Berciter ve Scardamalia (1993), öğretimin, herkeste uzmanlığı destekleyen biçimde düzenlenebileceğini ileri sürmüştür. Özellikle ilerici problem çözme sürecinde uzmanlığı kendini açma olarak nitelerler. Yeni bir uzman, sürekli ve gittikçe artan düzeylerde görevlerini, problemler olarak betimler ve yeniden tanımlar. Örneğin bilimsel topluluklar buna iyi bir örnektir. Çünkü, ilerici problem çözmeye uyum için araştırmacıları ve uzmanları gerektiren bir çalışma çevresidir. Aslında bilimsel topluluklar, ilerlemeci problem çözme sürecini sürdürerek ayakta kalmaya çalışırlar (Tynjala, 1993, 363). Bilgi topluluklarının üyeleri bilgi oluşturmada birbirlerini destekleyerek ve ortak bir bilgi temeli oluşturarak bilgilerini paylaşırlar. Bilimsel topluluk, uzmanları eğitmek için bir model olarak sunulmasına rağmen üniversiteler daha ileri bir boyutta ele alınmalıdır. Çünkü bilgi toplulukları belli bir süre sonra geleneksel bilgi aktarımı modelleriyle benzemeye başladıkları belirtilmektedir (Duffy ve diğerleri, 1993; Vermut, 1995). Bu ileriye sürülen görüş ve gelişmeler bilgi ediniminin oluşturmacı görüşüne ve pedagojik işaretlerine dayandırılmaktadır (Tynjala, 1993; 363). Buna göre üniversitelerde bilgi topluluklarının dinamik olması oluşturmacı yaklaşımla mümkün olabilecektir. Üniversitelerde uzmanlık bilgisinin (expert knowledge) desteklemek için Tynjala’nın görüşleri (1999; 424) önemli görülmektedir. Tynjana’ya göre üniversite eğitimi dört boyutta ele alınabilir: 1. Disiplin, 2. Çalışma yaşamına bakış açısı, 3. Uzmanlık konusunda araştırma ve 4. Öğrenmeye ilişkin araştırmalar. Disiplin, özel bir alanın içeriğiyle ilgilenir. Çalışma yaşamında temel konular, farklı alanlarda işgücü ihtiyacına uygun olmaya çalışılacaktır. Uzmanlığa ilişkin temel düşünceler özel alanlarda, uzmanlığın doğasına uygun hale getirilir. Öğrenmeye ilişkin olarak da bilginin üzerinde odaklaşır. Yükseköğretimde genellikle birinci bakış açısı (disiplin) ağır basar. Önemli olan bu dört boyutun hepsinin de dikkate alınmasıdır. Bunun için oluşturmacı ilkeler uygulanmalıdır. Gerçi oluşturmacı ilkeleri uygulamak kolay değildir. Bu hem öğretmenlere hem de öğrencilerin gayretlerine bağlıdır. Konu alanının uzmanlığının yan ısıra öğretmenler öğrenme süresi konusunda da bilgi sahibi olmaları gerekir. Diğer taraftan, geleneksel eğitimde (davranışçı görüşlerin hakim olduğu sistemde) farklı oluşturmacı yaklaşımları benimsemek ve uygulamak zor ve yavaş olacaktır. Örneğin kitaplardan geleneksel sınavlar yapmak hala çok yaygındır. Öğrenciler sınavlara bireysel olarak “inekleyerek” ve yüzeysel öğrenme stratejileri kullanarak hazırlanırlar. Amaç testi geçene kadar konuyu bireyin beynine doldurmaktır. Günümüzdeki üniversitelerde yapılan sınavların çoğu, ÜDS, KPDS gibi sınavlar buna örnek gösterilebilir. Testler ve sınavlarla başa çıkmaya çalışmak yerine öğrenciler alan bilgisinin yararlı yönlerini kendi kişisel birikimini oluşturmaya odaklanmalıdırlar. Bunun için makaleler, dönemlik ödevler, proje çalışmaları, araştırma raporları, video

The Turkish Online Journal of Educational Technology – TOJET January 2005 ISSN: 1303-6521 volume 4 Issue 1
Copyright The Turkish Online Journal of Educational Technology 2002 144
kayıtları, posterler, slaytlar, dosyalar formunda ya da öğrencilerin kendilerinin geliştirdikleri ürünler formunda olabilir. Öğrenciler bu ürünleri o kadar değerli bulurlar ki, mezuniyetten sonraki iş yaşamında da kullanırlar. Bunlar birer kişisel kütüphane olur ve internette depolanarak paylaşıma da sunarlar. Doğal olarak bu ürünlerin geçerliliği ortadan kalkabilecektir. Ancak, onları üretme biçimleri, süreci yaşam boyu devam edebilecektir. Sonuç olarak, üniversite öğretiminde teorik, pratik ve ön düzenleyici bilgilerin bütünleştirilmesi önemlidir. Bir programın geleneksel formunda, bilginin bu farklı türleri ayrı ayrı olarak sunulmaktadır. Öğrencilere temel kavramlar, bu alanın teorik temellerini içeren teorik dersler ile bir disiplin ya da mesleğin gerektirdiği becerilere öğrencilerin katılımının sağlandığı uygulamalı dersler/kurslar bulunmaktadır. Ayrıca, öğrencilere etkili öğrenme stratejilerini öğretmek ve metabiliş ya da öz düzenleyici bilgisini artırmak için kurslar da teklif edilmektedir. Aslında teori, uygulama ve öz düzenlemenin ayrı ayrı ele alınmasının uzman bilgisinin temel bileşimlerini desteklemediği kanısı bulunmaktadır (Tynjala, 1999; 427). Bunun için üniversite öğretimine yönelik olarak, metabiliş ve öz düzelimci bilginin başarıldığının yanı sıra format, teorik bilgi ile uygulamalı bilginin de bütünleştirilmesi gerekmektedir. KAYNAKLAR Atasoy, B. (2002). Fen Öğrenimi ve Öğretimi. Ankara: Gündüz Eğitim ve Yayıncılık Bereiter, C., &
Scardamalia, M. (1993). Surpassing ourselves: An inquiry into the nature of expertise. Chicago: Open Court.
Atkins, M. (1995). What should we be assessing. In P. Knight, Assessment for learning in higher education. pp. 25-33. London: Kogan Page.
Brown, J. S., Collins, A., & Duguid, P. (1989). Situated cognition and the culture of learning. Educational Researcher, 18, 32}42.
Chi, M.T.H. Glaser, R. And Farr, M.J. (1988). The Nature of Expertise. Erlbaum, Hillsdale, NJ. Derry, S.J. (1996). Cognitive schema theory in the constructivist debate. Educational Psyçhologyist. Volume 31,
pp. 163-174. Dreyfus, H. and Dreyfus, S. (1986). Mind over Machine. Basil Blackwell, Oxford. Duffy, T.M. Lowyck, J. and Jonassen, D. (1993). Designing environments for constructive learning, NATO ASI
Series. Series F: Computer and Systems Sciences, 105. Berlin: Springer. Erickson, K.A. and Lehman, A.C. (1996). Expert and exceptional performance: Evidence of maximal
adaptation to task constrains. Annual Review of Psychology, 47, pp. 273-305. Ernest, P. (1995). The one and the many. Constructivism in Education. Erlbaum, Hillsdale, NJ, pp. 459-486. Etelapello, A. and Light, P. (1999). Contextual knowledge in the development of design expertise. In J. Bliss,
P. Light and R. Saljo, Learning sites: Social and technological contexts for learning. Geisler, C. (1994). Academic literacy and the nature of expertise: Reading, writing and knowing in academic
philosophy. Hillsdale, NJ: Erlbaum. Gergen, K.J. (1995). Social construction and the educational process. Constructivism in Education. Erlbaum,
Hillsdale, NJ, pp. 17-39. Gergen, K. J. (1995). Social construction and the educational process. In P. Ste!e, & J. Gale, Constructivism in
education pp. 17-39). Hillsdale, NJ: Erlbaum. Lave, J., & Wenger, E. (1991). Situated learning. Legitimate peripheral participation. Cambridge: Cambridge
University Press. Leinhardt, G., McCarthy Young, K., & Merriman, J. (1995). Integrating professional knowledge: The theory of
practice and the practice of theory. Learning and Instruction, 5, 401}408. Jonassen, D. and Others. (2000). A manifesto for a constructivist approach to technology in higher education.
http://led.gcal.ac.uk/clti/papers/TMPaper11.html Mandl, H., Gruber, H., & Renkl, A. (1996). Communities of practice toward expertise: Social foundation
ofuniversity instruction. In P. B. Baltes, & U. M. Staudinger, Interactive minds. Life-span perspectives onthe social foundation of cognition (pp. 394}412).
Cambridge: Cambridge University Press. Richards, J. (1995). Construc(ion-iv)ism. Pick one of the above. Constructivism in Education. Erlbaum,
Hillsdale, NJ, pp. 57-63. Sternberg, R.J. (1997). Cognitive conceptions of expertise. Human and Machine AAAI Press/The MIT Press,
Menlo Park, CA, pp. 149-162. Sternberg, R. J. (1997). Cognitive conceptions of expertise. In P. J. Feltovich, K. M. Ford, & R. R
Ho!man.Expertise in context. Human and machine (pp. 149}162). Menlo Park, CA: AAAI Press/The MIT Press.
Tynjala, P. (1999). Towards expert knowledge? A comparison between a constructivist and a traditional learning environment in the university. International Journal of Educational Research , Volume 31 , Issue 5.
pp. 357- 442.
The Turkish Online Journal of Educational Technology – TOJET January 2005 ISSN: 1303-6521 volume 4 Issue 1
Copyright The Turkish Online Journal of Educational Technology 2002 145
Vermunt, J. (1995). Process-oriented instruction in learning and thinking strategies. European Journal of Psychology of Education, 10, 325}349.
Von Glasersfeld, E. (1995). An constructivist approach to teaching. Constructivism in Education. Erlbaum, Hillsdale, NJ, pp. 3-15.

The Turkish Online Journal of Educational Technology – TOJET January 2005 ISSN: 1303-6521 volume 4 Issue 1
Copyright The Turkish Online Journal of Educational Technology 2002 146
ORGANİZASYONEL DEĞİŞMEDE EĞİTİM TEKNOLOJİLERİNİN ROLÜ VE ÖNEMİ
Yrd.Doç.Dr. Ayşen Wolff
Sakarya Üniversitesi, Lefke Avrupa Üniversitesi Misafir Öğretim Üyesi GİRİŞ Günümüzde küreselleşme, bilgi ve iletişimdeki teknolojik hızlı gelişmeler, toplam kalite uygulamaları ve işgücündeki farklılıklar organizasyonları değişmeye zorlamaktadır. Organizasyonel değişim, organizasyonda iş yapma alışkanlıklarının daha farklı bir şekle dönüştürülerek verimliliğin arttırılmasıdır. Sürekli iyileştirme ve geliştirme amaçlanır. İşlerin daha hızlı, daha kaliteli ve daha az maliyetli olması arzulanır. Bu iyileştirmenin yavaş yavaş sürekli yapılacağı gibi radikal bir şekilde değiştirilmesi de söz konusu olabilir. Organizasyonda değişimi isteyen ve değişime karşı olan güçler vardır. Kurt Lewin (1951) değişim üzerinde yaptığı araştırmalarda bu güçler arasındaki dengenin değişimi isteyen güçler lehine bozulması ve değişimi engelleyen güçlerin azaltılmasıyla değişimin başlayabileceğini belirtmiştir. Organizasyonda yer alan çalışanların değişime karşı koymak yerine kendilerini bu değişikliklere hazırlamaları ve değişime ayak uydurmaları istenir. Organizasyon çalışanın bireysel gelişimine olanak sağlayarak değişime ivme kazandırır. Eğitim teknolojilerindeki yenilikler bireysel gelişimde önemli rol oynamaktadır. Bilgisayarlı eğitim, intenet aracılığıyla uzaktan eğitim veya sanal eğitim gibi eğitimlerin yaygınlaşmış olması dikkat çekicidir. İşletmeler de teknolojinin sunduğu bu olanaklardan yeterince faydalandığında kişisel ve organizasyonel değişimin hızlı ve başarılı bir şekilde gerçekleşmesini mümkün kılacaktır. Başarılı bir değişimin kaliteli insan kaynağıyla olacağı şüphesizdir. Burada kaliteli insan kaynağı eğitilmiş ve kişisel gelişimini sürekli kılan teknolojiden faydalanan kişilerdir. Bu çalışmanın amacı kişilerin ve organizasyonların değişmesini etkileyen faktörler ve bu faktörlerden biri olan eğitimdeki teknolojik gelişmelerin rolü ve önemi üzerinde durulmuştur. Literatür taraması yapılmış ve bazı örneklere yer verilmiştir. DEĞİŞİMİN TARİFİ, KİŞİSEL VE ORGANİZASYONEL DEĞİŞİM Değişim genel olarak eski durumdan yeni bir duruma geçiş olarak anlaşılmakta ve mevcut durumun korunmaması, yeni çevre koşullarına göre uyumun sağlanmasıdır. Mevcut durumun muhafazası satatik (Durağan) olmak anlamına gelir ki zaman içinde böyle bir özelliğin sürdürülmesi güçtür. Çünkü değişme kaçınılmaz hükmünü varlıklar üzerinde göstermektedir. Bu çerçevede değişme kişisel, organizasyonel ve toplum bazda görülür ve hissedilir. Değişime uğramayan bir canlı, değişmenin olmadığı bir insan topluluğu düşünmek mümkün değildir (Doğan, 1996 ). Değişim, herhangi bir şeyi bir düzeyden başka bir düzeye getirmeyi ifade eder. Sürekli değişim de kişi veya organizasyonlarla ilgili her konuda devamlı bir farklı hale getirme, yeni konum ve durumlara getirme, eskisinden farklı kılma anlamındadır (Koçel, 1999 s:510). Bu çalışmada değişim kişisel ve organizasyonel düzeyde ele alınmıştır.Kişisel düzeyde oluşan değişim kişinin fiziksel olarak yer değiştirmesi, bilgisini geliştirmesi ve yaratıcılığını ortaya çıkarmasıdır. Kişinin olumlu gelişmesi olumlu değişmeyi gösterir. Olumlu gelişmeler gösteren bir kişinin organizasyonda yer alması organizasyonuda olumlu bir şekilde etkiler. Değişim her zaman olumlu olmayabilir veya istenilen derecede olmaz. Bu nedenle, yöneticiler personelinin yaratıcılığını geliştirmek için aşağıdaki hususları yerine getirmelidir: - yaratıcı davranışları destekleyen ve özendiren bir çalışma ortamı yaratmalı - otokratik yönetim tarzından uzaklaşılmalı - çalışanlara kişisel olarak geliştiklerini hissedecekleri işler verilmeli - savunmacı davranışlardan uzak, açık ve samimi iletişimin bulunduğu bir çaılşma ortamı geliştirilmeli - çalışanların sadece “kriz”leri çözen ve daima kısa vadeli sorularla uğraşan kişiler olmaları önlenmeli - çalışanları, karşılaştıkları her sorunu, yaratıcılıklarını gösterebilecekleri bir fırsat olarak değerlemeleri sağlanmalı, - yaratıcı davranış ödüllendirilmeli - çalışanların yeni fikirleri denemelerine imkan verilerek belli bir hata payı kabul edilmeli - çalışanların hata yapma korkuları giderilmeli - yeni fikirlere olumsuz yaklaşılmamalı (Koçel,1999 s:510-511)
The Turkish Online Journal of Educational Technology – TOJET January 2005 ISSN: 1303-6521 volume 4 Issue 1
Copyright The Turkish Online Journal of Educational Technology 2002 147
Modern yönetim yaklaşımında organizasyonel değişim organizasyonel gelişim olarak yer almaktadır. Bir başka deyişle organizasyonel gelişimin olması için değişimin olması gerekir. Organizasyonel gelişim, organizasyon yapılarında meydana gelen değişiklikler sonucunda iyileştirilmesi, karar verme kültürünün değişmesi, problem çözmede daha gayretli olup çözüm alternatiflerinin düşünülmesi, geleceğe uyum sağlayacak bir yapıya sahip olunması, gelişen teknolojiye ayak uydurması, “insan” faktörünün organizasyondaki etkilerinin araştırılması, insanın gelişimini ve organizasyona katılımının sağlanması, takım kültürünün geliştirilmesi ve verimliliğinin arttırılmasıdır (Luthans,1995). Organizasyonel gelişim sürekli olarak adım adım ilerleyerek ve her seferinde küçük bir ilerleme ve iyileştirme kaydederek elde edilebilineceği gibi radikal değişikliklerle gerçekleştirilebilinir. İlk yaklaşımda Japonca “kaizen” olarak literatüre geçen “sürekli iyileştirme” dir. İşletmenin performansını etkileyen sürekli iyileştirme kaliteyi bilincini oluşturur ve her süreçte hatalar düzeltilerek “sıfır hata”ya yaklaşılır. Önde gelen Japon şirketleri Toplam Kalite Yönetiminden (TKY) Sıfır Hata Yönetimine geçerek yönetimde özgün bir yenilik kazandırmışlardır (Drucker,2000). İşletmelere rekabet avantajı kazandıracak küçük ama orjinal değişikler önemlidir. H&P mürekkepli yazıcıdan laserli yazıcıya geçmesini sağlayan küçük buluşu ile bilgisayar sektöründe liderliğini korumuştur . İkinci yaklaşımda ise değişim ani ve sancılı olacağından daha streslidir dolayısıyla çalışanlar tarafından değişime karşı direnç gösterilir. Değişim çalışanın isteği ve katılımıyla olursa daha çok verim elde edilir. Değişimin planlı olması ise istenilen hedefe ulaşmada kolaylık sağlar. Organizasyonda değişim üst yönetim tarafından desteklenir. Ancak sadece üst yönetimin desteği yeterli değildir. Bunun için çalışanın katılımı sağlanmalıdır. Değişim, değişim lideri tarafından yönetilir. Değişim lideri akıl hocasıdır ve çalışanları eğitir, kariyerlerinde, yaşamlarında önemli bir rol oynar. Organizasyonda değişim liderine değişim ajanları (change agent) yardım eder. Değişim ajanları, değişimi hızlandırmak amacıyla gönüllü olarak görev alan personeldir (Luthans,1995). Değişim ajanları değişime karşı direnci kırar ve organizasyonun kaosa sürüklenmesini önler. Organizasyonda kaos, değişim tarafları ile değişime karşı olanların organizasyonu ikiye bölmesidir. Bu ise iç çatışmaların yaşanması ve sonucunda organizasyonun parçalanmasıdır. Değişime direnenler yeni beceriler geliştirmek, yeni şeyler öğrenmekten korkarlar. Gelişen teknolojiyi kullanmak istemezler. Değişimi sabote ederler, şikayet ederler veya işe devamsızlık yaparak işlerini aksatırlar. Bu durum değişimi yavaşlatır hatta değişimden vazgeçilir. Sonuç olarak hem kişisel hem de organizasyonel gelişim durur. Böyle bir durumda işletmelerin geleceğe yönelik yatırım planları yapmaları beklenmez. İşletmeler geleneksel içe-dönük yönetim anlayışıyla uzun süre ayakta kalmaları mümkün değildir. Çünkü işletmelerin çevresinde değişimi zorlayan iç ve dış faktörler vardır. DEĞİŞİMİ ZORLAYAN FAKTÖRLER İşletmeler iç ve dış çevrenin etkisi altındadırlar. Değişimi zorlayan iç ve dış çevrede yer alan birçok faktör vardır. Ancak konu başlığımız gereği önemli gördüğümüz faktörleri ele alacağız. Bu önemli faktörlerin başında gelen küreselleşme olgusuyla şekillenen yeni ekonomik düzen, gene küreselleşme ile rekabetin yoğunlaşması ve yeni iş tekniklerinin ortaya çıkması “e-business” veya “m-business” (mobile-business), internet ile bilgi toplumuna geçiş ve eğitim de, öğrenme de gelişen yeni bir tarz olan “e-learning” gibi değişimi etkileyen faktörleri sıralıyabiliriz. YENİ EKONOMİK DÜZEN Yeni ekonomik düzen, 1970’li yılların sonu ve 1980’li yılların başında Amerika Birleşik Devleri (ABD) de ‘muhafazakarlar’ın ‘piyasa ekonomisini kamu müdahalelerinden arındırma’ (deregulation) eylemi ile başlamıştır. Reaganomics, Başkan Reagan dönemini tanımlayan ve daha serbestleştirilmiş bir dünya ekonomisi yaratmak amacına dönük politikalar demetini oluşturan bu yeni ekonominin ilk adı olmuştur. Eski ekonomik düzen yani tutucu, kapalı ekonomiden yeni ekonomik düzene yani serbest piyasa ekonomisine geçişte bazı krizler ve devrimler yaşanmıştır. Serbestleşme rüzgarı 1980’li yılların ortasında Gorbaçov’un SSCB de iktidara gelmesiyle Doğu bloku parçalanmakla kalmayıp komünist rejimler yerini demokrasi-serbest piyasa ekonomisi hedeflerine bırakmıştır. İkinci Dünya savaş sonrası ABD ve SSCB arasındaki Soğuk Savaş dönemi kapanarak serbestleşme-küreselleşme akımı başlamıştır. Çin, Mao’dan sonra (1979) ekonomisini Kültür Devrimi’nin yıkıcı etkilerinde kurtarabilmek için yeni arayışlara girmiştir. Çin tehlikesi de biraz olsun ortadan kalkmıştır. Böylece küreselleşme ile dünyaya bu yoldan barış sağlanacağı görüşü savunulmuş ve küreselleşme akımı dünyanın büyük bir kısmına yayılarak bunun dışında kalan ülkeler ise dışlanma tehlikesi ile karşı karşıya bırakılmıştır (Kazgan, 2002). Yeni ekonomik düzenin temeldeki öğretisi, evrensel düzeyde serbest piyasa ekonomisine geçişteki bütün ülkelerin tek pazar oluşturmak üzere dünya pazarıyla bütünleşmesi ve mal-hizmet-semaye hareketlerinin tam serbestleşmesiyle küreselleşmenin gerçekleştirilmesidir.Bu amaçla, ithalat-ihracat dış ticareti koruma politikalarının etkisinden arındırılması, fiyat sübvansiyonların kaldırılması, paraların konvertibilitesi sağlanması, devlet tekellerinin kaldırılması, kamu teşebbüslerinin özelleştirilmesi, kamu müdahalelerinin kaldırılması,
The Turkish Online Journal of Educational Technology – TOJET January 2005 ISSN: 1303-6521 volume 4 Issue 1
Copyright The Turkish Online Journal of Educational Technology 2002 148
bürokratik müdahalelerin kalkarak özel girişimcilerin kendi rekabet güçlerine göre kazanmasıdır (Kazgan,2002 S.95,96). Bu görüşe göre ne kadar çok serbestlik olursa rekabette o kadar çok yoğunlaşacak ve müşteri istekleri daha iyi karşılanacaktır. Mal ve hizmetler daha ucuz, daha hızlı ve daha kaliteli olacaktır. Yoğun rekabet koşulları verimliliği ve karlılığı artıracaktır. Girişimcilerin yaratıcılık güçlerini geliştirmesini ve kullanmasını sağlayacaktır. Girişimciler yeni ekonomik düzende büyük rol oynacaktır (Sahlman, 1999). İngiltere’nin hazineden sorumlu olan Gordon Brown 2000 yazında vermiş olduğu konferansta “son otuz yıl içinde dünya ticareti 15 kat , uluslararası semayenin 13 kat, yabancı yatırımın 50 kat arttığını ” söylemiştir (www.21learn.org). Ülkelerarası ticaretin bu kadar çok artışında bilgi teknolojisinindeki yenilikler, e-business(elektronik ticaretin) yaygınlaşması gibi nedenlerin olmasıdır. e-business kalite ve hızı yaratmıştır. Müşteri ile işletme arasında doğrudan ilişkiyi sağlar.Daha çok ve daha farklı müşteriler yaratır. Bu farklılık kalitede yeni görüşler getirir. Tüm müşteriler birbirine benzer görüş ise kaliteyi sınırlı tutar. Kalite, yeniliktir ve müşterinin beklentilerini karşılamaktır (Prahalad and Krishnan, 1999). Uluslararsı ticaretin artışında bir başka önemli neden ise 1947 de 23 ülkeyle kurulan Gümrük Tarifeleri ve Ticaret Anlaşması (GATT) ticareti engelleyeci tüm gümrükleri, kotaları zaman içinde kaldırmış ülkelerarası ticaretin serbestleşmesini sağlamıştır. Daha sonra 1995 de üye ülkeler arasında imzalanan“Uruguay Round ”anlaşmasıyla GATT de üye olan 100 yakın üye Dünya Ticaret Örgütü (WTO) ne geçerek daha çok serbest ticaretin yapılması kararını almışlardır. Amerika Birleşik Devletleri Hazineden sorumlu Alan Greenspan, Amerika’daki durumu tasvir ederken teknolojideki yenilikler ve gelişmeler ekonomiyi şekillendirdiğini ifade etmiştir (www.21learn.org). Teknolojik gelişmelere bağlı olarak şirketlerdeki değişiklikler ise daha yalın ve daha esnek hale gelmiştir. Geleneksel bürokratik ve hiyerarşik kademelerin fazla olan sivri, hantal yapılar organizasyonel küçülmeye (downsizing) giderek rekabet güçlerini arttırmayı hedeflemişlerdir (Zehir, Keskin, Akgün, 2002). Downsizing sonrasında organizasyonda kademelerin azalacağı, iletişim artacağı, süreçlerin azalmasıyla iş akışının hızlanacağı ve bütün bunlara bağlı olarak örgütün verimlilik ve etkinliğinin artacağına işaret edilmektedir (R. Coşkun, Kutaniş, Coşkun, 2002). Bir başka deyişle daha az çalışan ile daha çok üretimin gerçekleşmesidir. Bilgiye dayalı ekonomiye geçişte vasıfsız personele ihtiyaç duyulmaması işletmelerin personel eğitimine daha çok önem vermeleri gerektiğini göstermiştir. Yeni ekonominin vatandaşları daha aktif, daha yenilikçi ve girişimci olmuşlar, ticarette engellerini ortadan kaldırmışlar dolayısıyla daha açık ve dinamik toplum haline gelmişlerdir. Çevredeki bu değişiklik büyümenin anahtarıdır. Ancak bu gerçeklere tarafsız bir şekilde yaklaşırsak; bu devrimin kara tablosu ise zengin daha çok zengin olduğu ve fakirleşmenin de devam ettiği gözlenmiştir. Dünya Bankası Başkanı James Wolfensohn, dünyada 3 milyar insanın günde 2 dolardan daha az, 500 milyonunda 1 dolardan daha az bir gelirle yaşadığını ve bunun tamamen fakirliğin göstergesi olduğunu söylemiştir (www.21learn.org). Sanayi bazlı ekonomiden bilgisayar bazlı ekonomiye geçişte dedelerimizin tarım ekonomisinden sanayi bazlı ekonomoyi geçişten daha kötüdür. Sanayi devrimine geçişte insan ve kurumlar üzerindeki etkiler daha zamana yayılarak uyum sağlanmıştır. Halbuki bilgisayar devrimi ise daha dramatik olmuştur. Burada tarım ürünlerinin değerinin düştüğü veya ihtiyaç duyulmadığı söz konusu değildir. Yemek–içmek her zaman insaların temel ihtiyaçlarıdır. Ancak daha ucuz üretilmektedir. Vasıfsız elemanlar çok düşük ücret karşılığında ya tarımda yer almış ya da bilgiyi kullanmasını gerektirmeyecek işlerde çalıştırılmaktadırlar. Bilgiyi ve bilgisayarı kullacak veya yaratıcılığını ortaya çıkaran işlerde çalışanlarla vasıfsız işçiler arasında büyük gelir farklılıkları zengin ve fakir arasındaki uçurumu daha da arttırmıştır. YENİ EĞİTİM TEKNOLOJİLERİ Teknolojideki en önemli değişim “Bilgi Teknolojilerin”deki (Information Technology) yeniliklerdir. Temelde elektronik ortamda “İnternet” i bilgisayarda kullanarak tüm dünyaya açılma ve bilgi paylaşımıdır. “İnternet çağ”ını yakalayan toplumlara “Bilgi Toplumu” veya “Enformasyon Toplumu”(Information Society) denmektetir. İnternet tüm dünyaya yayılmış çeşitli büyüklükteki bilgisayarlardan oluşan büyük bir ağdır. İnternet, 1970 sonlarında Pentagon’un kurduğu bilgisayar ağının 1986 da eğitim kurumlarına, araştırma kurumlarına 1990 yılında da ticari kuruluşların kullanıma açılarak ticari hale gelmiştir. ABD de bilgisayar ve modemdeki ucuzluk İnternet kullanımını hızlandırmıştır. Ayrıca eğitim sektöründe kullanımın arttırılması için ilkokuldan başlanması uygun görülmüştür. İnternet kullanımı öğrencilere çok katkı sağlayacağı düşünülmektedir. Özellikle başka kaynaklardan faydalanmak, dünyadaki gelişen olaylardan haberdar olmak, araştırma zevkini tatmak ve geliştirmek, öğrenmeyi öğrenmek, yeteneklerini geliştirmak, daha hızlı bilgiye ulaşmak gibidir. Yeni teknolojiyi kullanan işletmeler alt yapılarını kurarak organizasyonel değişime uğramaları söz konusudur. Bu tip organizasyonlar (IT Organizations) kalite ve hızı yaratmışlardır. Bilişim bazlı organizasyonlar sadece bilgileri toplamak ve onu bir kutu içinde saklamak değildir. Rekabet avantajı sağlayacak doğru bilgilere ulaşmak
The Turkish Online Journal of Educational Technology – TOJET January 2005 ISSN: 1303-6521 volume 4 Issue 1
Copyright The Turkish Online Journal of Educational Technology 2002 149
ve iyi bir veri tabanı ile bu verileri kullanacak sistemi oluşturmaktır (Prahalad and Krishnan, 1999). Bilgiye ulaşmak artık kolaydır ancak önemli olan bu yeni teknolojiyi verimli bir şekilde kullanacak yetişmiş insan unsurudur. ABD dahil diğer ülkelerde de bilişimde yetişmiş, eğitimli çalışana ihtiyaç vardır, bu durum global bir problemdir.Üniversite mezunları artmaktadır buna karşın teknolojiyi kullanan azdır. Bilgisayar mühendislik bölümlerinden mezun olanlara ihtiyaç vardır. Bilgi, işletme için bir kaynak ise eğitimin devamlı olması gerekmektetir. Bilişim teknolojileri kullanan organizasyonların insan kaynakları departmanları “sürekli öğrenme” (continuous learning), “hayat boyu öğrenme”, “kendi kendine öğrenme”, “öğrenmeyi öğrenme” gibi eğitim stratejileri geliştirmektedirler. Verimliliğin artması için sürekli öğrenme gereklidir (Drucker, 2000). Bu stratejilerin geliştirilmesinde “e-Learning” (elektronik ortamda öğrenme veya İnternet ortamında eğitim) eğitim teknolojisinden faydalanmaktadırlar. E-LEARNING Dünyada ve Türkiyede “e-Learning” gelişmekte olan bir eğitim teknolojisidir. Amerikan Toplumunu Geliştirme ve Eğitim Derneği (American Society of Training and Development-ASTD) ye göre e-Learning yıldan yıla artmakta ve hızla büyüyen bir eğitim endüstri dalı olduğunu açıklamıştır. Amerikan işletmelerin üçte ikisi eğitimde e-Learning kullanmaktadır buna yüksek performanslı işletmelerde dahildir. Eğitimin daha çok %33 oranında bilgi teknolojilerini öğreniminde, %67 oranında ise tepe ve orta kademe yöneticilerine yönelik kalite iyileştirme ve yönetici geliştirme konularında kullanılmaktadır . Geleneksel eğitimden yani sınıfta yüz-yüze eğitimden internet bazlı elektronik ortamda eğitime “e-Learning”e geçiş işletmeler hız kazandırmış ve eğitim maliyetlerini düşürmüştür. E-Learning ile zamandan tasarruf edildiği gibi çalışan işyerinde veya evde veya haftasonları istediği zaman eğitimini yapabilmektedir. Geleneksel şekilde sınıfta eğitim sırasında ofis dışında olacağından arayan müşteriler beklemek zorunda kalacaktır. e-Learning bir çok kişiye aynı anda eğitim verebilir ama geleneksel bir sınıfta eğitim 1-20 kişi arasında sınırlıdır. IBM 30.000 yakın üst-orta-ilk kademede yer alan yöneticilere altı aylık bir e-Learning programı uygulamıştır. Program öncesi yapmış olduğu bir araştırmada yöneticiler geleneksel eğitimden yani yüzyüze, sınıfta yapılan eğitimden yana olduklarını belirtmişler ancak e-Learning programından sonra bu yeni metodu benimsediklerini açıklamışlardır. IBM’in Dünya çapında Gelişme Departmanı Direktörü Nancy Lewis “e-learning ile 5 misli daha fazla memnuniyet sağladıklarını ve ayrıca maliyetlerde düşüş görüldüğünü belirtmiştir. e-Learning eğitim programından önce yöneticilerin seyahat etmek zorunda kaldıklarını şimdi ise on-line ile istedikleri zaman ve yerde bu eğitimleri alabilmekte ve dolayısıyla eğitimlerin artık can sıkıcı olmaktan çıktığı belirtilmiştir Başlangıç aşamasında şirket içi tüm kişisel gelişim eğitimlerinde e-learning kullanabilinir. İkinci adımda ise özellikle dış müşterilerle olan ilişkilerde, satış ve bayi kanalına kadar çok geniş bir alanda kullanılır. Müşteri ilişkileri ve entegre tedarik yönetiminde, kampanya bilgilerin güncellenmesinde, şirketlerin yeniden yapılanma projelerinde ve yeni ürün tanıtımlarında e-learning en verimli araçtır (Behar, 2002). Daha çok eğitim sektöründe kullanılan “e-Learning” veya “uzaktan eğitim”yaygınlaşmıştır. Bütün gelişmiş ülkelerde yükseköğretimin maliyeti yüksektir. Bu maliyeti kontrol altına alabilmek için e-Learning kullanılmaktadır veya 10 bin öğrenciye ulaşmak ancak elektronik ortamda gerçekleşebilmektedir (Drucker, 2000). Türkiye’de de İnternet bazlı uzaktan eğitim programları gerçekleştirilmektedir, Sakarya Üniversitesi eğitimde teknolojik yenilikleri kullanmada öncülük yapmıştır ve her dönem artan öğrenci sayısıyla eğitim programları yaygınlaşmaktadır. SONUÇ Yoğun rekabet ortamında işletmeler faaliyetlerini sürdürebilmek, verimliliklerini arttırmak, maliyetlerini düşürmek, kaliteli mal ve hizmet üretmek zorundadırlar. Yeni ekonomik düzen ve eğitim teknolojilerin rolü ve önemi işletmelere yeni fırsatlar tanımaktadır. Organizasyonel değişimini gerçekleştiren işletmeler yeni fırsatları yakalarlar. Yenilikleri yaratan ve/veya yenilikleri takip eden işletmeler ekonomik ve organizasyonel değer kazanarak rekabet üstünlüğü elde ederler (Drucker, 2000). KAYNAKÇA Baysal C. ve Tekarslan E., 1996, İşletmeler için Davranış Bilimleri,Avcıol Yayın,İst. Behar E., 2002. “Size İstemediğim Bir Elbiseyi Giydirmeyiz”, Hayat Yayıncılık ,İst. Erdorğan İlhan, 1997, İşletmelerde Davranış, Dönence Basım ve yayın, İstanbul Coşkun R., Kutaniş R. Ö., Coşkun S., 2002, Küçülmenin İşten Çıkarılması ve Çıkarılmayan Çalışanlar
Üzerindeki Etkileri , 10.Ulusal Yön.Org.Kongeresi Bildiri Kitabı,Akdeniz Üni.İİBF No.4 Daniels D. John, ve Radebaugh H. Lee, 2000, International Business, Addison Wesley Longman(Singapore) Dereli T.,1981, Organizasyonlarda Davranış, Ar Yayın,İst.
The Turkish Online Journal of Educational Technology – TOJET January 2005 ISSN: 1303-6521 volume 4 Issue 1
Copyright The Turkish Online Journal of Educational Technology 2002 150
Doğan İsmail, 1996, Sosyoloji, Kurtiş Matbaacılık,İstanbul Drucker F. Peter, 1998, Fırtınalı Dönemlerde Yönetim,İnkilap Kitabevi Drucker F. Peter, 2002, Gelecek İçin Yönetim, Minpa Matbaacılık,(Çeviren Fikret Uçkan) Hirschhorn L., 2002,
“Campaigning For Change ”, Harvard Business Review Kağıtçıbaşı Çiğdem , 1998, İnsan ve İnsanlar, Evrim Basım Yayım,İstanbul Koçel Tamer, 1999, İşletme Yöneticiliği, Beta Basım yayım Dağıtım A.Ş ,İstanbul Kaynak Tuğray, 1990, Organizasyonel Davranış,İşletme Fakültesi Yayın 223 Kazgan G., Ekim 2002, Küreselleşme ve Ulus-Devlet, Yeni Ekonomik Düzen, İst.Bilgi Üni.Yayın,İst. Luthans Fred, 1995, Organizational Behavior, McGraw Hill International Edition Martin R., 1999, Şirketin Aklını Değiştirmek, Harvard Business Review, Mess Yayınları 291 Meyerson D.E., 2003,Sessiz Sedasız Radikal Değişim, Harvard Business Review, Mess yayınları 402 Prahalad C.K. and Krishnan M.S., 1999, The new meaning of quality in the information Age, Harvard Business
Review Sahlman A.W., 1999, The New Economy is Stronger Than You Think, Harvard Business Review Ulrich D., 2000, From eBusiness to eHR, Human Resource Planning, Vol 23.2 Werther B. Willam, ve Davis Keith, 1993, Human Resources And Personnel Management, McGraw Hill
International Edition Zehir C., Keskin H., Akgün A.E., 2002, Organizasyonel Küçülme Stratejisi ve Türkiye’deki Büyük İşletmeler
Üzerinde Bir Araştırma, 10.Ulusal Yön.Org.Kongeresi Bildiri Kitabı,Akdeniz Üni.İİBF No.4
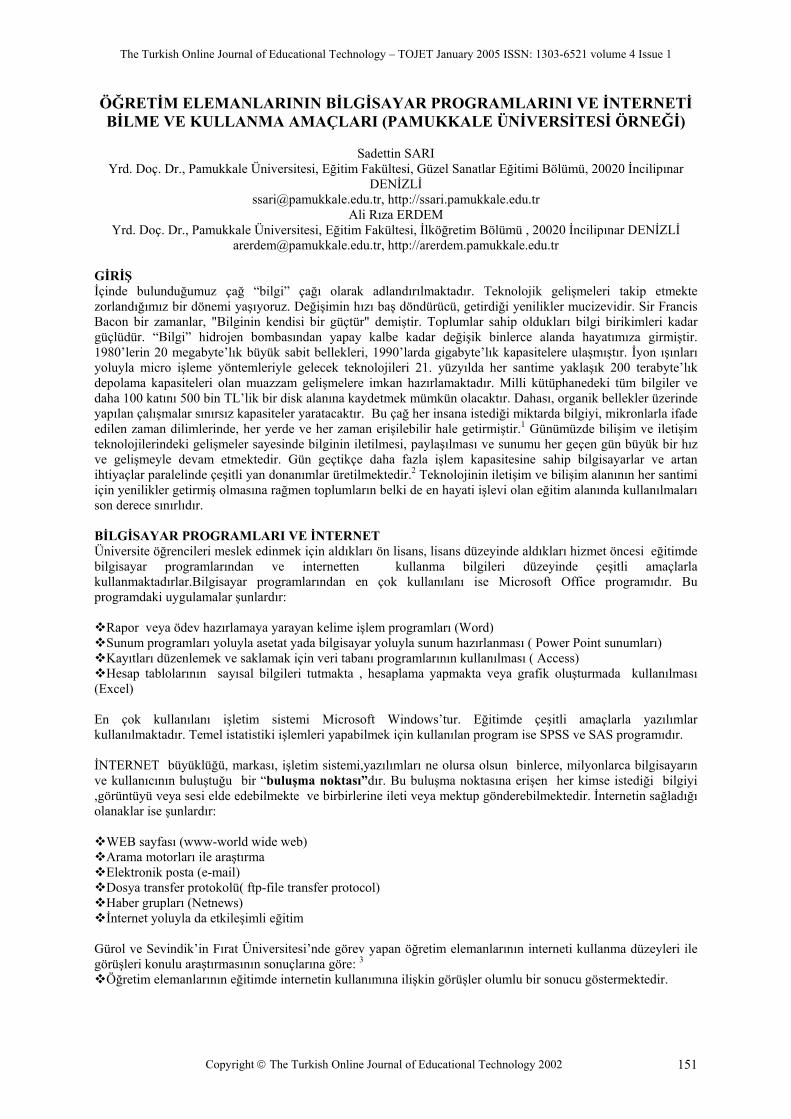
The Turkish Online Journal of Educational Technology – TOJET January 2005 ISSN: 1303-6521 volume 4 Issue 1
Copyright The Turkish Online Journal of Educational Technology 2002 151
ÖĞRETİM ELEMANLARININ BİLGİSAYAR PROGRAMLARINI VE İNTERNETİ BİLME VE KULLANMA AMAÇLARI (PAMUKKALE ÜNİVERSİTESİ ÖRNEĞİ)
Sadettin SARI
Yrd. Doç. Dr., Pamukkale Üniversitesi, Eğitim Fakültesi, Güzel Sanatlar Eğitimi Bölümü, 20020 İncilipınar DENİZLİ
[email protected], http://ssari.pamukkale.edu.tr Ali Rıza ERDEM
Yrd. Doç. Dr., Pamukkale Üniversitesi, Eğitim Fakültesi, İlköğretim Bölümü , 20020 İncilipınar DENİZLİ [email protected], http://arerdem.pamukkale.edu.tr
GİRİŞ İçinde bulunduğumuz çağ “bilgi” çağı olarak adlandırılmaktadır. Teknolojik gelişmeleri takip etmekte zorlandığımız bir dönemi yaşıyoruz. Değişimin hızı baş döndürücü, getirdiği yenilikler mucizevidir. Sir Francis Bacon bir zamanlar, "Bilginin kendisi bir güçtür" demiştir. Toplumlar sahip oldukları bilgi birikimleri kadar güçlüdür. “Bilgi” hidrojen bombasından yapay kalbe kadar değişik binlerce alanda hayatımıza girmiştir. 1980’lerin 20 megabyte’lık büyük sabit bellekleri, 1990’larda gigabyte’lık kapasitelere ulaşmıştır. İyon ışınları yoluyla micro işleme yöntemleriyle gelecek teknolojileri 21. yüzyılda her santime yaklaşık 200 terabyte’lık depolama kapasiteleri olan muazzam gelişmelere imkan hazırlamaktadır. Milli kütüphanedeki tüm bilgiler ve daha 100 katını 500 bin TL’lik bir disk alanına kaydetmek mümkün olacaktır. Dahası, organik bellekler üzerinde yapılan çalışmalar sınırsız kapasiteler yaratacaktır. Bu çağ her insana istediği miktarda bilgiyi, mikronlarla ifade edilen zaman dilimlerinde, her yerde ve her zaman erişilebilir hale getirmiştir.1 Günümüzde bilişim ve iletişim teknolojilerindeki gelişmeler sayesinde bilginin iletilmesi, paylaşılması ve sunumu her geçen gün büyük bir hız ve gelişmeyle devam etmektedir. Gün geçtikçe daha fazla işlem kapasitesine sahip bilgisayarlar ve artan ihtiyaçlar paralelinde çeşitli yan donanımlar üretilmektedir.2 Teknolojinin iletişim ve bilişim alanının her santimi için yenilikler getirmiş olmasına rağmen toplumların belki de en hayati işlevi olan eğitim alanında kullanılmaları son derece sınırlıdır. BİLGİSAYAR PROGRAMLARI VE İNTERNET Üniversite öğrencileri meslek edinmek için aldıkları ön lisans, lisans düzeyinde aldıkları hizmet öncesi eğitimde bilgisayar programlarından ve internetten kullanma bilgileri düzeyinde çeşitli amaçlarla kullanmaktadırlar.Bilgisayar programlarından en çok kullanılanı ise Microsoft Office programıdır. Bu programdaki uygulamalar şunlardır:
Rapor veya ödev hazırlamaya yarayan kelime işlem programları (Word) Sunum programları yoluyla asetat yada bilgisayar yoluyla sunum hazırlanması ( Power Point sunumları) Kayıtları düzenlemek ve saklamak için veri tabanı programlarının kullanılması ( Access) Hesap tablolarının sayısal bilgileri tutmakta , hesaplama yapmakta veya grafik oluşturmada kullanılması
(Excel) En çok kullanılanı işletim sistemi Microsoft Windows’tur. Eğitimde çeşitli amaçlarla yazılımlar kullanılmaktadır. Temel istatistiki işlemleri yapabilmek için kullanılan program ise SPSS ve SAS programıdır. İNTERNET büyüklüğü, markası, işletim sistemi,yazılımları ne olursa olsun binlerce, milyonlarca bilgisayarın ve kullanıcının buluştuğu bir “buluşma noktası”dır. Bu buluşma noktasına erişen her kimse istediği bilgiyi ,görüntüyü veya sesi elde edebilmekte ve birbirlerine ileti veya mektup gönderebilmektedir. İnternetin sağladığı olanaklar ise şunlardır:
WEB sayfası (www-world wide web) Arama motorları ile araştırma Elektronik posta (e-mail) Dosya transfer protokolü( ftp-file transfer protocol) Haber grupları (Netnews) İnternet yoluyla da etkileşimli eğitim
Gürol ve Sevindik’in Fırat Üniversitesi’nde görev yapan öğretim elemanlarının interneti kullanma düzeyleri ile görüşleri konulu araştırmasının sonuçlarına göre: 3
Öğretim elemanlarının eğitimde internetin kullanımına ilişkin görüşler olumlu bir sonucu göstermektedir.
The Turkish Online Journal of Educational Technology – TOJET January 2005 ISSN: 1303-6521 volume 4 Issue 1
Copyright The Turkish Online Journal of Educational Technology 2002 152
Öğretim elemanlarının tamamına yakını erkektir; tamamına yakınının bürosunda bilgisayar bulunmaktadır; çoğunluğunun idari görevi bulunmamaktadır; yarısına yakını öğretim üyesidir; Çoğunluğu ortalama üç yıldır internete bağlanmaktadır; çoğunluğu günde 1-4 arası internete bağlanmaktadır
Öğretim elemanların çoğunluğu, sırasıyla interneti akademik araştırmalar, e-mail ve medyayı takip etmek için kullanmaktadır.
Öğretim elemanları en çok e-mail, internetten dosya transferi ve bu dosyaları kullanmayı bilmektedir. En çok da web sayfası oluşturmayı bilmemektedirler. Bununla birlikte, öğretim elemanların bir kısmı interneti iyi kullanırken, bir kısmı da hiç bilmemektedir.
İnternetin teknik terimlerine ilişkin olarak öğretim elemanları en çok mail, arama motorları ve download kavramlarını bilmektedirler. Bununla birlikte, öğretim elemanların bir kısmı terimleri iyi düzeyde bilirken, bir kısmı da hiç bilmemektedir.
Öğretim elemanları en çok sohbet yapmakta uzman iken, en çok da web tasarımı konusunda eğitime ihtiyaç duymaktadırlar.
Öğretim elemanlarının çoğunluğu internetin eğitimde kullanımına ilişkin görüşlere katılım göstermişlerdir. Problem Cümlesi Araştırmada ele alınan problem “Öğretim Elemanlarının Bilgisayar Programlarını ve İnterneti Bilme ve Kullanma Amaçları (Pamukkale Üniversitesi Örneği)” dır. Bu çerçevede ele alınan alt problemler ise şunlardır. 1. Pamukkale Üniversitesi öğretim elemanlarının a. Bilgisayar programlarını bilme düzeyi b. Bilgisayar programlarını kullanma amaçları 2. Pamukkale Üniversitesi öğretim elemanlarının a. İnterneti bilme düzeyi b. İnterneti kullanma amaçları YÖNTEM Bu araştırma Pamukkale Üniversitesi öğretim elemanlarının bilgisayar ve interneti kullanma düzeyleri ve amaçlarının ne olduğunu belirlemeye yönelik bir araştırma olduğu için “betimsel” bir araştırmadır. Bu araştırmada durum tespiti yapılmıştır. Evren ve Örneklem Araştırma yapılan konuda evreni Pamukkale Üniversitesinde görev yapan öğretim elemanları oluşturmaktadır. Evrende toplamda 31 Mart 2003 itibarıyla 1171 öğretim elemanı bulunmaktadır.
Tablo 1 Evrendekilerin Listesi Birim Prof Doç. Yrd Doç Öğ.Gör. Okutman Araş.Gör. Uzman TOPLAM Fakülteler 45 63 212 103 502 8 933Yüksekokullar 1 1 1 18 21Meslek Yüksekokulları 2 7 53 5 67Enstitüler 7 7Ortak Zorunlu Dersler Birimi 7 70 25 102TOPLAM 48 64 220 181 70 514 33 1130
Evrendekilerin tamamına erişmek mümkün olmadığından evreni temsil eden örneklem seçilerek veriler bu örneklemden toplanmıştır. Evrenden seçilen örneklem .5 manidarlık düzeyi esas alınarak seçilmiştir. Birimlerdeki öğretim elemanı sayısının %25’i random yoluyla seçilerek örnekleme alınmıştır.
Tablo 2 Örneklemlerin Listesi Birim Prof Doç. Yrd.Doç Öğ.Gör Okutman Araş.Gör. Uzman TOPLAM Fakülteler 16 19 63 30 115 2 245Yüksekokullar 6 5 11Meslek Yüksekokulları 1 16 1 18Enstitüler 1 1Ortak Zorunlu Dersler Birimi 2 12 5 19
The Turkish Online Journal of Educational Technology – TOJET January 2005 ISSN: 1303-6521 volume 4 Issue 1
Copyright The Turkish Online Journal of Educational Technology 2002 153
TOPLAM 16 19 64 54 12 122 7 294
Verilerin Toplanması Araştırmada elde edilen veriler geliştirilen anket aracılığıyla toplanmıştır. Anket ODTUde YÖK /Dünya Bankası Milli Eğitimi Geliştirme Projesi çerçevesinde eğitim fakülteleri “Bilgisayar ve Öğretim Teknolojileri Bölümü” ne öğretim üyesi yetiştirme amacıyla düzenlenen “Eğiticilerin Eğitimi Sertifika Programı” nda kullanılan dokümanlardan yararlanılarak geliştirilmiştir. Anket genel bilgiler hariç 4 bölümden oluşmaktadır.
Anketin Bölümleri Soru sayısı Bilgisayar kullanımını bilme düzeyi 25 İnternet kullanımını bilme düzeyi 11 Bilgisayar kullanma amaçları 9 İnternet kullanma amaçları 10
Anket soruları 4 seçeneklidir. Bilgisayar ve internet kullanımını bilme düzeyi ile ilgili anket sorularının seçenekleri şunlardır:
Aşina Değilim - Öyle bir işlevin var olduğunu bilmiyorsunuz veya biliyor olsanız bile nasıl yapılacağı
konusunda bir bilginiz yok. Biraz Aşinayım - Öyle bir işlevin var olduğunu biliyorsunuz, bir kaç kere yaptınız veya birisini yaparken
gördünüz ve o işlevi kullanmaya ihtiyacınız olursa onu "çözebileceğiniz/yapabileceğiniz" konusunda kendinize güveniyorsunuz. Bunu yaparken "yardım" menüsüne veya sizi "yönlendirecek" birine ihtiyacınız olabilir.
Biraz Biliyorum - İşlev(ler)i daha önce kullandınız ve bazen hata yapsanız bile, dışarıdan yardım almadan yapabilirsiniz. Yanlış yapsanız bile, deneme-yanılma yoluyla "çözebileceğinizi/yapabileceğinizi" biliyorsunuz.
Biliyorum - İşlev(ler)i hiçbir sorunla karşılaşmadan çabukça yapabiliyorsunuz ve başka birine söz konusu işlevi yerine getirmede yardımcı olabilirsiniz. Bilgisayar ve internet kullanma amaçları ile ilgili anket sorularının seçenekleri şunlardır:
Bazen: haftada bir kereden az; Sıklıkla: haftada en az bir kere, ancak günlük olarak değil; Günlük: günde yaklaşık bir kere; Günlük+: günde bir kereden fazla.
Anket oluşturulurken uzman görüşünden yararlanılmıştır. Ayrıca pilot uygulama yapılarak anket sorularının anlaşılırlığı istatistiki olarak gözden geçirilmiştir. Örneklem grubuna uygulanan anketin SPSS ile yapılan alfa güvenilirlik düzeyi . 97 dir. Verilerin çözümlenmesi Uygulanan anket optik okuyucu formu şeklinde düzenlenmiştir. Optik anket formları doldurulduktan sonra optik okuyucu tarafından okunmuş ve elde edilen sonuçlar SPSS programı kullanılarak çözümlenmiştir. Alt problemlere cevap aramak için
Frekans Yüzde Aritmetik ortalama kullanılmıştır.
Çözümlenen veriler geliştirilen yeni bir ölçekle yorumlanmıştır. Yeni ölçekle anketteki süreksiz seçenekler sürekli hale getirilmiştir.Anketteki seçenek aralık sayısı seçenek sayısına bölünmüştür.
3:4=0.75 Çıkan sayı seçeneklere ilave edilerek yeni ölçek geliştirilmiş ve sonuçlar buna göre yorumlanmıştır. Buna göre bilgisayar ve internet kullanımını bilme düzeyi ile ilgili anket sorularının sonuçları aşağıdaki gibi yorumlanmıştır. 1.00-1.75 Aşina Değilim 1.76-2.50 Biraz Aşinayım 2.51-3.25 Biraz Biliyorum 3.26-4.00 Biliyorum Bilgisayar ve internet kullanma amaçları ile ilgili anket sorularının sonuçları aşağıdaki gibi yorumlanmıştır. 1.00-1.75 Bazen:
The Turkish Online Journal of Educational Technology – TOJET January 2005 ISSN: 1303-6521 volume 4 Issue 1
Copyright The Turkish Online Journal of Educational Technology 2002 154
1.76-2.50 Sıklıkla 2.51-3.25 Günlük 3.26-4.00 Günlük+ BULGULAR VE YORUM Araştırmanın bulguları genel bilgiler ve araştırmada ele alınan alt problemlere gör3e düzenlenmiş ve yorumlanmıştır. Genel bilgiler Örnekleme alınan 294 deneğin 110’u kadın , 184’ü erkektir.
Tablo 3 Örneklemdekilerin Cinsiyete Göre Dağılımı Cinsiyet F %
Kadın 110 37.4 Erkek 184 62.6 TOPLAM 294 100.0
Örnekleme alınan 294 deneğin 16’sı profesör, 19’u doçent, 64’ü yardımcı doçent, 54’ü öğretim görevlisi, 12’si okutman, 7’si uzman ve 122’si araştırma görevlisidir.
Tablo 4 Örneklemdekilerin Unvana Göre Dağılımı Unvan F %
Profesör 16 5.4 Doçent 19 6.5 Yardımcı Doçent 64 21.8 Öğretim Görevlisi 54 18.4 Okutman 12 4.1 Uzman 7 2.4 Araştırma Görevlisi 122 41.5 TOPLAM 294 100.0
Örnekleme alınan 294 deneğin 251’ fakültelerde, 16’sı yüksekokullarda, 10’ meslek yüksekokullarında, 1’i enstitüde, 16’sı ortak zorunlu dersler biriminde görev yapmaktadır.
Tablo 5 Örneklemdekilerin Görev Yerlerine Göre Dağılımı Görev Yeri F %
Fakülte 251 85.4 Yüksekokul 16 5.4 Meslek Yüksekokulu 10 3.4 Enstitü 1 .3 Ortak Zorunlu Dersler Birimi
16 5.4
TOPLAM 294 100.0
Örnekleme alınan 294 deneğin 123’ü lisans, 62’si yüksek lisans, 97 ‘si doktora, 11’i post-doktora mezunudur. 1’i cevap vermemiştir.
Tablo 6 Örneklemdekilerin Mezuniyetlerine Göre Dağılımı Mezuniyet F %
Cevap yok 1 .3 Lisans 123 41.8 Yüksek Lisans 62 21.1 Doktora 97 33.0 Post-doktora 11 3.7 TOPLAM 294 100.0
Örnekleme alınan 294 deneğin, 4’nün bilgisayarı yok, 44’nün evde bilgisayarı var, 51’nin üniversitede sadece kendi kullanımında bilgisayarı var, 35’i üniversitede bilgisayarı ortak olarak kullanmaktadır, 1’i internet-kafedeki bilgisayarlardan yararlanmaktadır, 84’ünün hem evde hem de üniversitede sadece kendi kullanımında

The Turkish Online Journal of Educational Technology – TOJET January 2005 ISSN: 1303-6521 volume 4 Issue 1
Copyright The Turkish Online Journal of Educational Technology 2002 155
bilgisayarı vardır, 64’nün hem evde hem de üniversitede ortak kullandığı bilgisayarı var, 2’si üniversitede ortak ve internet kafelerdeki bilgisayarları kullanmaktadır, 4’nün hem evde, hem üniversitede kendi kullanımında hem de üniversitede ortak kullanımda olan bilgisayarları kullanmaktadır, 1’i de hem evde, hem üniversitede ortak kullanımda hem de internet kafelerdeki bilgisayarlardan yararlanmaktadır. 4’ü cevap vermemiştir.
Tablo 7 Örneklemdekilerin Bilgisayardan Yararlanmaya Göre Dağılımı Bilgisayar Kullanma F %
Cevap yok 4 1.4 Bilgisayarı kullanmıyor 4 1.4 Bilgisayarı evde kullanıyor 44 15.0 Üniversitede sadece kendi kullanımında 51 17.3 Üniversitede ortak kullanımda 35 11.9 Bilgisayarı İnternet-kafelerde kullanıyor 1 .3 Hem evde hem de üniversitede sadece kendi kullanımında 84 28.6 Hem evde hem de üniversitede ortak kullanımda 64 21.8 Üniversitedeki ortak ve internet kafelerde kullanıyor 2 .6 Hem evde, hem üniversitede kendi kullanımında hem de üniversitede ortak kullanımda 4 1.4 Hem evde, hem üniversitede ortak hem de internet kafelerde kullanıyor 1 .3 TOPLAM 294 100.0
Örnekleme alınan 294 deneğin, 9’unun bilgisayar programlarını kullanma hakkında hiçbir bilgisi yok, 225’i bilgisayar programlarını kullanabilmeyi kendi kendine öğrenmiş, 49’u bilgisayar programlarını kullanabilme konusunda temel düzeyde kurs almış, 11’i bilgisayar programlarını kullanabilme konusunda ileri düzeyde kurs almıştır.
Tablo 8 Örneklemdekilerin Bilgisayar Programlarını Kullanmayı Öğrenme Durumuna Göre Dağılımı Bilgisayar Programlarını Kullanmayı Öğrenme Durumu F %
Bilgisayar programlarını kullanma hakkında hiçbir bilgisi yok 9 3.1 Bilgisayar programlarını kullanabilmeyi kendi kendine öğrenmiş 225 76.5 Bilgisayar programlarını kullanabilme konusunda temel düzeyde kurs almış 49 16.7 Bilgisayar programlarını kullanabilme konusunda ileri düzeyde kurs almış 11 3.7 TOPLAM 294 100.0
Örnekleme alınan 294 deneğin 5’i internete bağlanmamaktadır, 40’ı internete evinden , 141’i internete üniversiteden, 1’i internet kafalerden, 101’i internete hem evinden hem de üniversiteden, 5’i internete hem evinden hem üniversiteden hem de internet kafelerden, 1’i internete hem üniversiteden hem de internet kafelerden bağlanmaktadır.
Tablo 9 Örneklemdekilerin İnternete Bağlandığı Yere Göre Dağılımı İnternete Bağlandığı Yer F %
Bağlanmıyor 5 1.7 Evinden bağlanıyor 40 13.6 Üniversiteden bağlanıyor 141 48.0 Kafalerden bağlanıyor 1 .3 Hem evinden hem de üniversiteden bağlanıyor 101 34.4 Hem evinden hem üniversiteden hem de internet kafelerden bağlanıyor 5 1.7 Hem üniversiteden hem de internet kafelerden bağlanıyor 1 .3 TOPLAM 294 100.0
Örnekleme alınan 294 deneğin 28’i internete 1 yıldır, 52’si 2 yıldır, 52’si 3 yıldır, 60’ı 4 yıldır, 98’si 5+ yıl internete bağlanmaktadır. 4’ü cevap vermemiştir.
Tablo 10 Örneklemdekilerin İnternete Bağlandığı Yıla Göre Dağılımı İnternete Bağlandığı Yıl F %
Cevap yok 4 1.4 1 yıldır 5 1.7 2 yıldır 52 17.7 3 yıldır 52 17.7 4 yıldır 60 20.4

The Turkish Online Journal of Educational Technology – TOJET January 2005 ISSN: 1303-6521 volume 4 Issue 1
Copyright The Turkish Online Journal of Educational Technology 2002 156
5+ yıldır 98 33.3 TOPLAM 294 100.0
Örnekleme alınan 294 deneğin 75’i günde ortalama internete 1 saatten az, 132’si 1-2 saat arası, 23’ü 3-4 saat arası, 40’ı 5-6 saat arası, 18’i 7 + saat bağlanmaktadır.6’sı cevap vermemiştir.
Tablo 11 Örneklemdekilerin Günde Ortalama İnternete Bağlandığı Süreye Göre Dağılımı İnternete Günde Ortalama Bağlandığı Süre F % Cevap yok 6 2.0 1 saatten az 75 25.5 1-2 saat arası 132 44.9 3-4 saat arası 23 7.8 5-6 saat arası 40 13.6 7 + saat 18 6.1 TOPLAM 294 100.0
Alt Problemlere İlişkin Bulgular
Araştırmada ele alınan alt problemlere ilişkin bulgular ve yorumu aşağıda verilmiştir.
1. Alt Probleme İlişkin Bulgular Araştırmada ele alınan birinci alt problem Pamukkale Üniversitesi öğretim elemanlarının a. Bilgisayar programlarını bilme düzeyi b. Bilgisayar programlarını kullanma amaçlarıdır. Pamukkale Üniversitesi öğretim elemanlarının yaygın olarak kullandıkları bilgisayar programlarından Microsoft Ofis (Word, Access, Excell, PowerPoint), işletim sistemleri, eğitim yazılımları ve istatistik programlarını bilme düzeylerine ilişkin bulgular tablo 12 da gösterilmiştir.
Tablo 12 Pamukkale Üniversitesi Öğretim Elemanlarının Bilgisayar Programlarını Bilme Düzeyleri
Word Seçenekler Aşina değilim
Biraz aşinayım
Biraz biliyorum
Biliyorum Cevap lamayan
So ru no
Anket soruları
f % f % f % f % f %
Aritmetik ortalama
Anlamı
1 Bir doküman oluşturabilir veya açabilirim
15 5.1 30. 10.2 48 16.3
201
68.4 3.47 Biliyo rum
2 Kes, kopyala, yapıştır gibi basit komutları kullanabilirim
8 2.7 15 5.1 29 9.9 242
82.3 3.71 Biliyo rum
3 Koyu, italik, altı çizgili, yazı karakteri değiştirme, yazı rengini değiştirme gibi basit formatlama işlemlerini yapabilirim
9 3.1 19 6.5 26 8.8 237
80.6 3 1.0 3.68 Biliyo rum
4 Nesne ekleme, nesne boyutunu değiştirme ve nesnenin yerini değiştirme gibi biraz daha karmaşık işlemleri yapabilirim
16 5.4 29 9.9 38 12.9
210
71.4 1 .3 3.50 Biliyo rum
Accsess
Seçenekler
Aşina değilim
Biraz aşinayım
Biraz biliyorum
Biliyorum
Cevap lama yan
So ru no
Anket soruları
f % f % f % f % f %
Aritmetik ortalama
Anlamı
5 Bir veritabanı dosyası oluşturabilir veya açabilirim
40 13.6
52 17.7 50 17.0 148
50.3 4 1.4 3.05 Biraz biliyo rum
6 Veritabanımda alan oluşturabilir veya varolan alanda düzeltme
47 16.0
56 19.0 41 13.9 146
49.7 4 1.4 2.98 Biraz biliyo rum
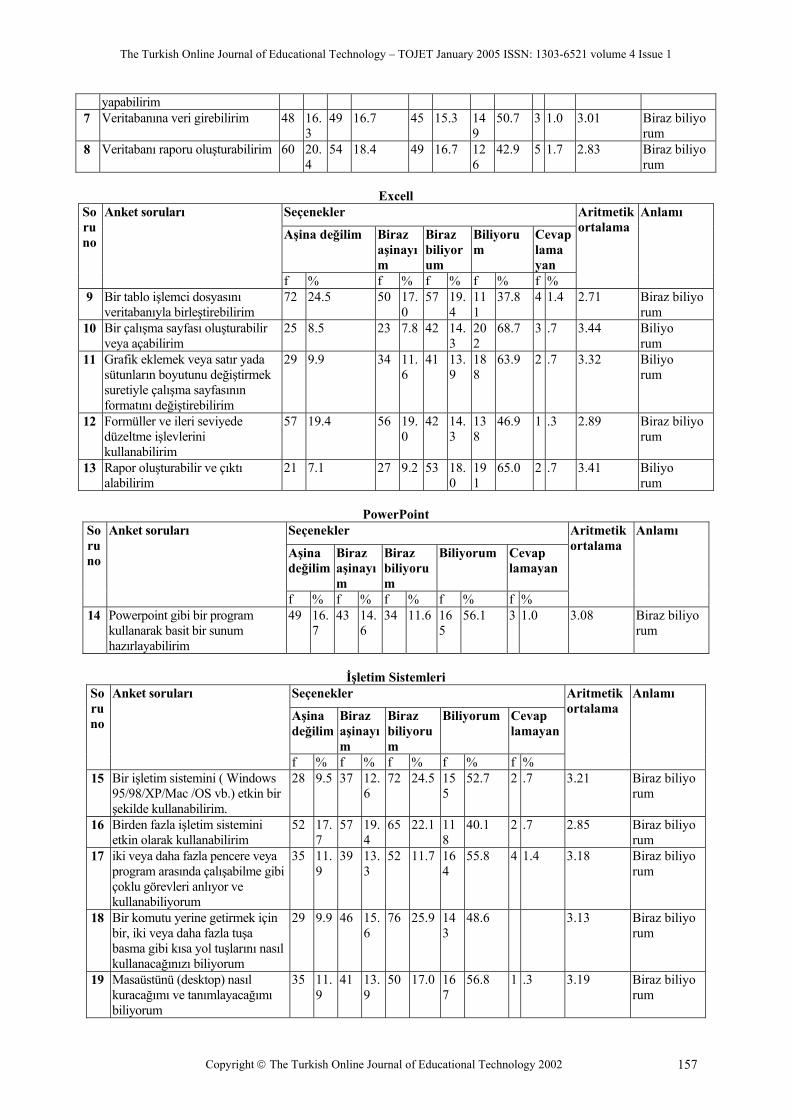
The Turkish Online Journal of Educational Technology – TOJET January 2005 ISSN: 1303-6521 volume 4 Issue 1
Copyright The Turkish Online Journal of Educational Technology 2002 157
yapabilirim 7 Veritabanına veri girebilirim 48 16.
3 49 16.7 45 15.3 14
9 50.7 3 1.0 3.01 Biraz biliyo
rum 8 Veritabanı raporu oluşturabilirim 60 20.
4 54 18.4 49 16.7 12
6 42.9 5 1.7 2.83 Biraz biliyo
rum
Excell Seçenekler
Aşina değilim Biraz aşinayım
Biraz biliyorum
Biliyorum
Cevap lama yan
Soru no
Anket soruları
f % f % f % f % f %
Aritmetik ortalama
Anlamı
9 Bir tablo işlemci dosyasını veritabanıyla birleştirebilirim
72 24.5 50 17.0
57 19.4
111
37.8 4 1.4 2.71 Biraz biliyo rum
10 Bir çalışma sayfası oluşturabilir veya açabilirim
25 8.5 23 7.8 42 14.3
202
68.7 3 .7 3.44 Biliyo rum
11 Grafik eklemek veya satır yada sütunların boyutunu değiştirmek suretiyle çalışma sayfasının formatını değiştirebilirim
29 9.9 34 11.6
41 13.9
188
63.9 2 .7 3.32 Biliyo rum
12 Formüller ve ileri seviyede düzeltme işlevlerini kullanabilirim
57 19.4 56 19.0
42 14.3
138
46.9 1 .3 2.89 Biraz biliyo rum
13 Rapor oluşturabilir ve çıktı alabilirim
21 7.1 27 9.2 53 18.0
191
65.0 2 .7 3.41 Biliyo rum
PowerPoint
Seçenekler
Aşina değilim
Biraz aşinayım
Biraz biliyorum
Biliyorum Cevap lamayan
So ru no
Anket soruları
f % f % f % f % f %
Aritmetik ortalama
Anlamı
14 Powerpoint gibi bir program kullanarak basit bir sunum hazırlayabilirim
49 16.7
43 14.6
34 11.6 165
56.1 3 1.0 3.08 Biraz biliyo rum
İşletim Sistemleri
Seçenekler
Aşina değilim
Biraz aşinayım
Biraz biliyorum
Biliyorum Cevap lamayan
So ru no
Anket soruları
f % f % f % f % f %
Aritmetik ortalama
Anlamı
15 Bir işletim sistemini ( Windows 95/98/XP/Mac /OS vb.) etkin bir şekilde kullanabilirim.
28 9.5 37 12.6
72 24.5 155
52.7 2 .7 3.21 Biraz biliyo rum
16 Birden fazla işletim sistemini etkin olarak kullanabilirim
52 17.7
57 19.4
65 22.1 118
40.1 2 .7 2.85 Biraz biliyo rum
17 iki veya daha fazla pencere veya program arasında çalışabilme gibi çoklu görevleri anlıyor ve kullanabiliyorum
35 11.9
39 13.3
52 11.7 164
55.8 4 1.4 3.18 Biraz biliyo rum
18 Bir komutu yerine getirmek için bir, iki veya daha fazla tuşa basma gibi kısa yol tuşlarını nasıl kullanacağınızı biliyorum
29 9.9 46 15.6
76 25.9 143
48.6 3.13 Biraz biliyo rum
19 Masaüstünü (desktop) nasıl kuracağımı ve tanımlayacağımı biliyorum
35 11.9
41 13.9
50 17.0 167
56.8 1 .3 3.19 Biraz biliyo rum
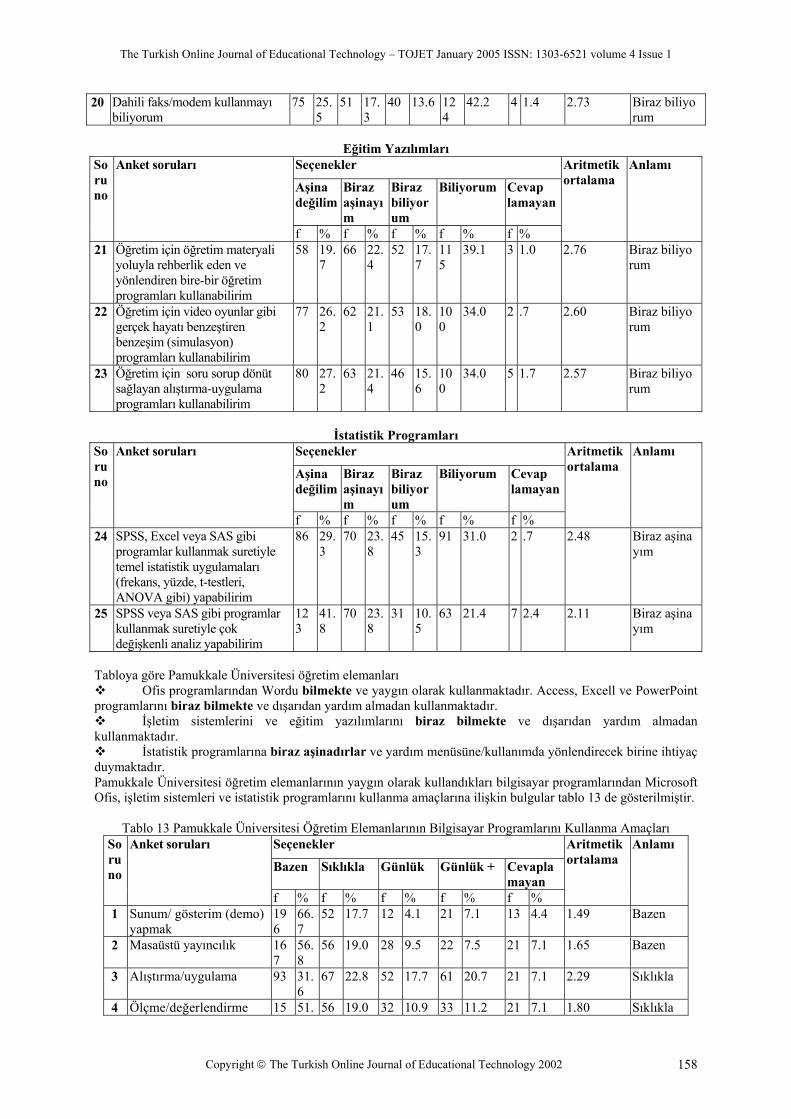
The Turkish Online Journal of Educational Technology – TOJET January 2005 ISSN: 1303-6521 volume 4 Issue 1
Copyright The Turkish Online Journal of Educational Technology 2002 158
20 Dahili faks/modem kullanmayı biliyorum
75 25.5
51 17.3
40 13.6 124
42.2 4 1.4 2.73 Biraz biliyo rum
Eğitim Yazılımları
Seçenekler
Aşina değilim
Biraz aşinayım
Biraz biliyorum
Biliyorum Cevap lamayan
So ru no
Anket soruları
f % f % f % f % f %
Aritmetik ortalama
Anlamı
21 Öğretim için öğretim materyali yoluyla rehberlik eden ve yönlendiren bire-bir öğretim programları kullanabilirim
58 19.7
66 22.4
52 17.7
115
39.1 3 1.0 2.76 Biraz biliyo rum
22 Öğretim için video oyunlar gibi gerçek hayatı benzeştiren benzeşim (simulasyon) programları kullanabilirim
77 26.2
62 21.1
53 18.0
100
34.0 2 .7 2.60 Biraz biliyo rum
23 Öğretim için soru sorup dönüt sağlayan alıştırma-uygulama programları kullanabilirim
80 27.2
63 21.4
46 15.6
100
34.0 5 1.7 2.57 Biraz biliyo rum
İstatistik Programları
Seçenekler
Aşina değilim
Biraz aşinayım
Biraz biliyorum
Biliyorum Cevap lamayan
So ru no
Anket soruları
f % f % f % f % f %
Aritmetik ortalama
Anlamı
24 SPSS, Excel veya SAS gibi programlar kullanmak suretiyle temel istatistik uygulamaları (frekans, yüzde, t-testleri, ANOVA gibi) yapabilirim
86 29.3
70 23.8
45 15.3
91 31.0 2 .7 2.48 Biraz aşina yım
25 SPSS veya SAS gibi programlar kullanmak suretiyle çok değişkenli analiz yapabilirim
123
41.8
70 23.8
31 10.5
63 21.4 7 2.4 2.11 Biraz aşina yım
Tabloya göre Pamukkale Üniversitesi öğretim elemanları
Ofis programlarından Wordu bilmekte ve yaygın olarak kullanmaktadır. Access, Excell ve PowerPoint programlarını biraz bilmekte ve dışarıdan yardım almadan kullanmaktadır.
İşletim sistemlerini ve eğitim yazılımlarını biraz bilmekte ve dışarıdan yardım almadan kullanmaktadır.
İstatistik programlarına biraz aşinadırlar ve yardım menüsüne/kullanımda yönlendirecek birine ihtiyaç duymaktadır. Pamukkale Üniversitesi öğretim elemanlarının yaygın olarak kullandıkları bilgisayar programlarından Microsoft Ofis, işletim sistemleri ve istatistik programlarını kullanma amaçlarına ilişkin bulgular tablo 13 de gösterilmiştir.
Tablo 13 Pamukkale Üniversitesi Öğretim Elemanlarının Bilgisayar Programlarını Kullanma Amaçları Seçenekler
Bazen Sıklıkla Günlük Günlük + Cevapla mayan
So ru no
Anket soruları f % f % f % f % f %
Aritmetik ortalama
Anlamı
1 Sunum/ gösterim (demo) yapmak
196
66.7
52 17.7 12 4.1 21 7.1 13 4.4 1.49 Bazen
2 Masaüstü yayıncılık 167
56.8
56 19.0 28 9.5 22 7.5 21 7.1 1.65 Bazen
3 Alıştırma/uygulama 93 31.6
67 22.8 52 17.7 61 20.7 21 7.1 2.29 Sıklıkla
4 Ölçme/değerlendirme 15 51. 56 19.0 32 10.9 33 11.2 21 7.1 1.80 Sıklıkla

The Turkish Online Journal of Educational Technology – TOJET January 2005 ISSN: 1303-6521 volume 4 Issue 1
Copyright The Turkish Online Journal of Educational Technology 2002 159
2 7 5 Bire-bir öğretim 16
5 56.1
64 21.8 19 6.5 22 7.5 24 8.2 1.62 Bazen
6 Telekomünikasyon 104
35.4
69 23.5 39 13.3 64 21.8 18 6.1 2.22 Sıklıkla
7 Web sayfası oluşturma 205
69.7
34 11.6 16 5.4 12 4.1 27 9.2 1.38 Bazen
8 Internet’te araştırma 31 10.5
46 15.6 52 17.7 163
55.4 2 .7 3.18 Günlük
9 Diğer öğretimsel amaçlar 79 26.9
63 21.4 57 19.4 75 25.5 20 6.8 2.46 Sıklıkla
Tabloya göre Pamukkale Üniversitesi öğretim elemanları bilgisayar programlarını
Internet’te araştırma için her gün kullanmaktadır. Alıştırma/uygulama, ölçme/değerlendirme, telekomünikasyon ve diğer öğretimsel amaçlar için
haftada en az bir kere kullanmaktadır. Sunum/gösterim (demo) yapmak, masaüstü yayıncılık, bire-bir öğretim, web sayfası oluşturma
amaçları için haftada bir kere bile kullanmamaktadır.
2. Alt Probleme İlişkin Bulgular Araştırmada ele alınan birinci alt problem Pamukkale Üniversitesi öğretim elemanlarının a. İnterneti bilme düzeyi b. İnterneti kullanma amaçlarıdır. Pamukkale Üniversitesi öğretim elemanlarının interneti bilme düzeylerine ilişkin bulgular tablo 14 de gösterilmiştir.
Tablo 14 Pamukkale Üniversitesi Öğretim Elemanlarının İnterneti Bilme Düzeyleri
Seçenekler
Aşina değilim
Biraz aşinayım
Biraz biliyorum
Biliyorum Cevap lamayan
So ru no
Anket soruları
f % f % f % f % f %
Aritmetik ortalama
Anlamı
26 E-posta göndermeyi ve almayı biliyorum
5 1.7 13 4.4 21 7.1 253
86.1 2 .7 3.78 Biliyo rum
27 Internet'ten dosya yüklemeyi ve açmayı biliyor
8 2.7 18 6.1 36 12.2
229
77.9 3 1.0 3.67 Biliyo rum
28 Dosya eklemeyi veya FTP (Dosya Transfer Protokolü) yoluyla dosya transfer etmeyi biliyorum
32 10.9
41 13.9
37 12.6
176
59.9 8 2.7 3.24 Biraz biliyo rum
29 internet üzerinde canlı-etkileşimli görsel veya işitsel iletişim araçlarını kullanmayı biliyorum
46 15.6
57 19.4
57 19.4
132
44.9 2 .7 2.94 Biraz biliyo rum
30 Bir internet Servis Sağlayıcının (ISP) nasıl seçildiğini biliyorum
68 23.1
48 16.3
54 18.4
118
40.1 6 2.0 2.77 Biraz biliyo rum
31 Internete nasıl erişildiğini biliyorum
20 6.8 22 7.5 38 12.9
212
72.1 2 .7 3.51 Biliyo rum
32 Hyperlink, arama motoru, gopher ve benzeri internet araçlarının nasıl kullanıldığını biliyorum
45 15.3
34 11.6
49 16.7
163
55.4 3 1.0 3.13 Biraz biliyo rum
33 Sık kullanılanların nasıl oluşturulduğunu ve bunları kullanmayı biliyorum
28 9.5 34 11.6
41 13.9
187
63.6 4 1.4 3.33 Biliyo rum
34 Göz Gezdirici (Browser) seçeneklerinizi değiştirebilirim
68 23.1
60 20.4
46 15.6
116
39.5 4 1.4 2.72 Biraz biliyo rum
35 Görsel veya işitsel plug-in'leri 95 32. 64 21. 36 12. 93 31.6 6 2.0 2.44 Biraz aşina

The Turkish Online Journal of Educational Technology – TOJET January 2005 ISSN: 1303-6521 volume 4 Issue 1
Copyright The Turkish Online Journal of Educational Technology 2002 160
yükleyip kullanabilirim 3 8 2 yım 36 Dosya birleştirme, dosya
transfer etme, tablo oluşturma veya düzeltme gibi ileri düzey kelime işlemci fonksiyonlarını anlayabiliyorum
59 20.1
44 15.0
46 15.6
137
46.6 8 2.7 2.91 Biraz biliyo rum
Tabloya göre Pamukkale Üniversitesi öğretim elemanları:
E-posta göndermeyi ve almayı, Internet'ten dosya yüklemeyi ve açmayı, Internete nasıl erişildiğini bilmekte ve yaygın olarak kullanmaktadır.
Dosya eklemeyi veya FTP (Dosya Transfer Protokolü) yoluyla dosya transfer etmeyi, internet üzerinde canlı-etkileşimli görsel veya işitsel iletişim araçlarını kullanmayı, Bir internet Servis Sağlayıcının (ISP) nasıl seçildiğini, internet araçlarının nasıl kullanıldığını, Göz Gezdirici (Browser) kullanmasını, dosya işlemlerini biraz bilmekte ve dışarıdan yardım almadan kullanmaktadır.
Görsel veya işitsel plug-in'leri yükleyip kullanabilmeye biraz aşinadır ve yardım menüsüne/kullanımda yönlendirecek birine ihtiyaç duymaktadır. Pamukkale Üniversitesi öğretim elemanlarının interneti kullanma amaçlarına ilişkin bulgular tablo 15 de gösterilmiştir.
Tablo 15 Pamukkale Üniversitesi Öğretim Elemanlarının İnterneti Kullanma Amaçları
Seçenekler
Bazen Sıklıkla Günlük Günlük + Cevapla mayan
So ru no
Anket soruları f % f % f % f % f %
Aritmetik ortalama
Anlamı
10 Internet’te araştırma
21 7.1 43 14.6 55 18.7 172
58.5 3 1.0 3.29 Günlük +
11 E-Posta 25 8.5 36 12.2 58 19.7 170
57.8 5 1.7 3.29 Günlük +
12 Web Sayfası yayınlama
196
66.7
35 11.9 17 5.8 16 5.4 30 10.2 1.44 Bazen
13 Çoklu ortam Oluşturma
185
62.9
40 13.6 22 7.5 19 6.5 28 9.5 1.53 Bazen
14 Sohbet 186
63.3
47 16.0 16 5.4 14 4.8 31 10.5 1.46 Bazen
15 Oyun eğlence 193
65.6
41 13.9 23 7.8 12 4.1 25 8.5 1.45 Bazen
16 Tartışmalara katılım
183
62.2
44 15.0 21 7.1 11 3.7 35 11.9 1.45 Bazen
17 Öğretim 94 32.0
59 20.1 63 21.4 58 19.7 20 6.8 2.31 Günlük
18 Medyayı izleme 57 19.4
46 15.6 88 29.9 96 32.7 7 2.4 2.77 Günlük
19 E-ticaret 209
71.1
24 8.2 15 5.1 8 2.7 38 12.9 1.30 Bazen
Tabloya göre Pamukkale Üniversitesi öğretim elemanları İnterneti:
Internet’te araştırma ve E-Posta amacıyla günde bir kereden fazla kullanmaktadır. Öğretim ve Medyayı izleme amacıyla her gün kullanmaktadır. Web Sayfası yayınlama, çoklu ortam oluşturma, sohbet, oyun eğlence, tartışmalara katılım ve E-ticaret
için haftada bir kere bile kullanmamaktadır.
SONUÇ VE ÖNERİLER Araştırmanın sonuçlarına göre Pamukkale Üniversitesi öğretim elemanları: 1. Ofis programlarını, işletim sistemlerini ve eğitim yazılımlarını bilmekte ve kullanmaktadırlar. %76.5 ‘i bu programları kendi kendine öğrenmiştir. 2. İstatistik programlarına biraz aşinadırlar ve yardım menüsüne/kullanımda yönlendirecek birine ihtiyaç duymaktadır. 3. Bilgisayar programlarıyla Internet’te araştırma, alıştırma/uygulama, ölçme/değerlendirme, telekomünikasyon ve diğer öğretimsel amaçlar için yaygın olarak kullanılmaktadır.
The Turkish Online Journal of Educational Technology – TOJET January 2005 ISSN: 1303-6521 volume 4 Issue 1
Copyright The Turkish Online Journal of Educational Technology 2002 161
4. Bilgisayar programlarıyla sunum/gösterim (demo) yapmak, masaüstü yayıncılık, bire-bir öğretim, web sayfası oluşturma amaçları için pek kullanılmamaktadır. 5. İnternette E-posta göndermeyi ve almayı, Internet'ten dosya yüklemeyi ve açmayı, internet araçlarının nasıl kullanıldığını bilmekte ve kullanmaktadır. 6. İnternette görsel veya işitsel plug-in'leri yükleyip kullanabilmeye biraz aşinadır ve yardım menüsüne/kullanımda yönlendirecek birine ihtiyaç duymaktadır. 7. İnterneti Internet’te araştırma ve E-Posta amacıyla yaygın olarak kullanmaktadır. 8. İnterneti Web Sayfası yayınlama, çoklu ortam oluşturma, sohbet, oyun eğlence, tartışmalara katılım ve E-ticaret için pek kullanılmamaktadır. 9. Araştırmanın sonuçlarına göre olası öneriler şunlar olabilir: 1. Pamukkale Üniversitesi öğretim elemanlarına istatistik programlarını kullanabilme konusunda gerekli rehberlik ve ortam sağlanmalıdır. 2. Pamukkale Üniversitesi öğretim elemanlarının bilgisayar programlarını sunum/gösterim (demo) yapmak, masaüstü yayıncılık, bire-bir öğretim, web sayfası oluşturma amaçları için kullanmaları özendirilmelidir.
KAYNAKLAR ALKAN. Mustafa & Hakan TEKEDERE “Bilişim Toplumuna Doğru Bilişimci Eğitim”
http://www.ef.sakarya.edu.tr/sayfa/bildiri/sayi_3/42.doc 12.01.2003 GÜROL, Mehmet & Tuncay SEVİNDİK “Fırat Üniversitesi Öğretim Elemanlarının İnternet Kullanım Düzeyleri
Ve Görüşlerinin Belirlenmesi” http://www.ef.sakarya.edu.tr/sayfa/bildiri/sayi_3/38.doc 12.01.2003 ŞAHİN İsmet “Bilişim Teknolojileri ve Öğretim’de Alternatif Yaklaşımlar”
http://www.ef.sakarya.edu.tr/sayfa/bildiri/sayi_3/35.doc 12.01.2003 DİP NOTLAR 1- İsmet ŞAHİN “Bilişim Teknolojileri ve Öğretim’de Alternatif Yaklaşımlar”
http://www.ef.sakarya.edu.tr/sayfa/bildiri/sayi_3/35.doc 12.01.2003 2- Mustafa ALKAN, Hakan TEKEDERE “Bilişim Toplumuna Doğru Bilişimci Eğitim”
http://www.ef.sakarya.edu.tr/sayfa/bildiri/sayi_3/42.doc 12.01.2003 3- Mehmet GÜROL, Tuncay SEVİNDİK “Fırat Üniversitesi Öğretim Elemanlarının İnternet Kullanım Düzeyleri
ve Görüşlerinin Belirlenmesi” http://www.ef.sakarya.edu.tr/sayfa/bildiri/sayi_3/38.doc 12.01.2003