

The troubleshooting features for golang
15
-
Upload
satoru-takeuchi -
Category
Technology
-
view
1.374 -
download
2
Transcript of The troubleshooting features for golang

2
Introduction
● Purpose
– Introduce the troubleshooting features for golang
● Motivation
– There are few documents about the troubleshooting features(e.g. debugger) for golang
– The available documents are scattered on the many webpages
– I consider it's nice to gather these information in the one place
● Software version
● Golang: 1.5.1
● OS: fedora22/x86_64

3
Table of Contents
● gdb
● Race Detector
● godebug
● Heapdump
● pprof
● Conclusion

4
gdb: Capture core dump
● Settings
– Environment variable● GOTRACEBACK=crash # Capture core dump when user program
aborts
● Tips: Prevent variables from disappearing by optimization
– Append `-gcflags “-N -l“` option to “go build”
● How to capture
– Terminate program abnormally, for example by segmentationfault
– Send SIGABRT

5
gdb: Analyze
● Load the following script to use extended gdb commandsfor golang
● (gdb) source $GOROOT/src/runtime/runtime-gdb.py● Note: On golang 1.4.2, this script failed to load and doesn't work
● Analyze program with the extended command written inthe following URL
● https://golang.org/doc/gdb– Note: Currently it can only analyze running process
● Analyzing core dump doesn't work– Process is stopped at unsure point– “bt” doesn't work properly– “goroutine” fails with error

6
gdb: Future prospects
● It won't be better in the near future
● Please refer to the official document
– https://golang.org/doc/gdb
…As a consequence, although GDB can be useful in some situations, it is not areliable debugger for Go programs, particularly heavily concurrent ones.Moreover, it is not a priority for the Go project to address these issues,which are difficult. In short, the instructions below should be taken only as aguide to how to use GDB when it works, not as a guarantee of success.
In time, a more Go-centric debugging architecture may be required.…

7
Race Detector: Summary
● A tool for detecting problems coming from race condition
– https://golang.org/doc/articles/race_detector.html
● Show warning messages if your program has a racecondition
● Usage
– Build your program with “-race” option and run it● $ go run –race foo.go
● $ go build –race && ./foo

8
Race Detector: Example
$ go run -race race.go==================WARNING: DATA RACEWrite by goroutine 4: main.func·001() /home/sat/gopath/src/test/race/race.go:7 +0x43
Previous write by main goroutine: main.main() /home/sat/gopath/src/test/race/race.go:10 +0x176
Goroutine 4 (running) created at: main.main() /home/sat/gopath/src/test/race/race.go:9 +0x166==================Found 1 data race(s)exit status 66
1 package main 2 3 func main() { 4 c := make(chan bool) 5 i := 0 6 go func() { 7 i = 1 8 c <- true 9 }()10 i = 211 <- c12}
At this time, whether “i” is 1 or 2 is not sure.In other word, there is a racebetween line 7 and line 10.
Detected the race

9
godebug: Summary
● A debugger for golang– https://github.com/mailgun/godebug
● Usage is written in “README.md” at the above mentionedURL
– Although there is only “go get” in “Installation” section, thefollowing commands should be run to use “godebug”program
1. go get github.com/mailgun/godebug
2. cd $GOPATH/src/github.com/mailgun/godebug
3. go install # Install godebug under $GOPATH/bin
● Currently there few (less than gdb) features
● It would be better since this project is brand new and underdevelopment

10
godebug: Compare features with gdb
godebug gdb
Setting breakpoint Should be embedded in source code x
Analyze core dump
Commands forgoroutine
x
Step/next x x
Continue x x
Show source code x x
Show variables x x

11
Heapdump
● WriteHeapDump() function in “runtime/debug” package
– https://golang.org/pkg/runtime/debug
● Dump the contents of heap
● Although it will be a nice feature in the future, it's difficultto use for now
– Output is binary format and there is no tool to read it ashuman readable text format
– Output format is not documented yet (Only version 1.3 and1.4 has such document)
● https://github.com/golang/go/wiki/heapdump13
● https://github.com/golang/go/wiki/heapdump14

12
pprof: Summary
● A profiling tool for golang program● Capture and analyze CPU/memory profiling information● The package contains the profiling APIs
– https://golang.org/pkg/runtime/pprof/
● Description– http://blog.golang.org/profiling-go-programs
● Usage1. Call profiling APIs from your program and capture profiling
information● There is no build option such as gcc's “-pg”. It's a bit inconvenient ;-(
2. Visualize and analyze the profiling information● $ go tool pprof <program name> <the file contains the profiling
information>
13
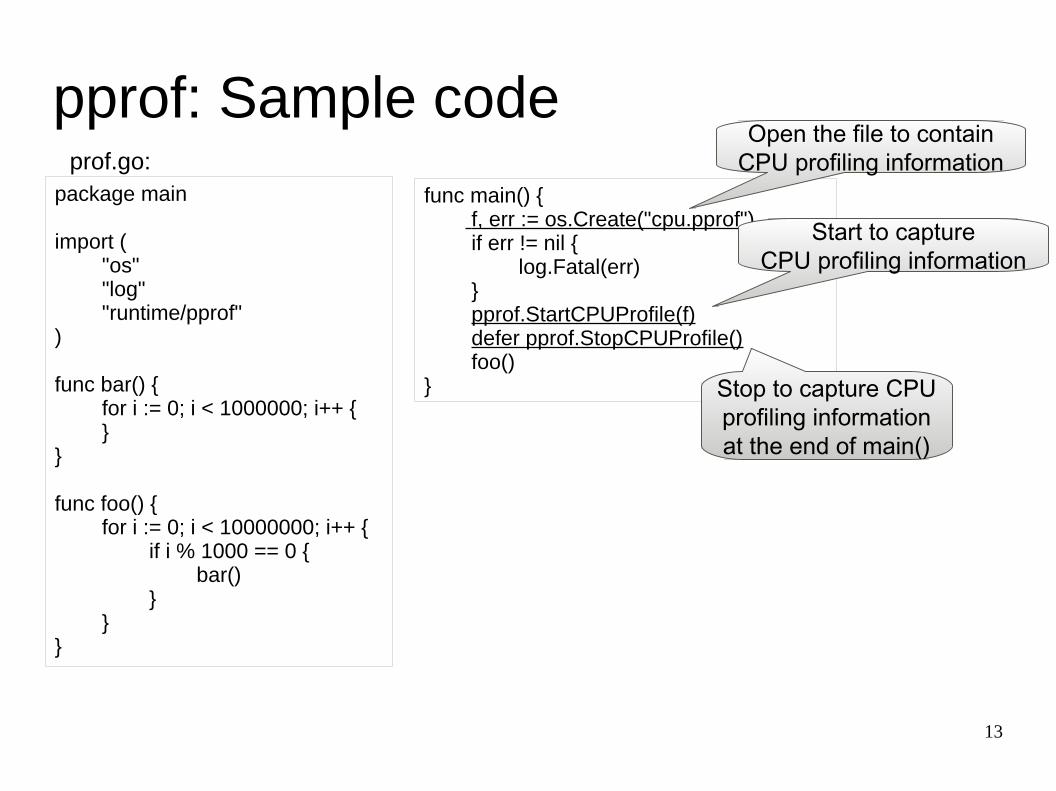
pprof: Sample code
package main
import ( "os" "log" "runtime/pprof")
func bar() { for i := 0; i < 1000000; i++ { }}
func foo() { for i := 0; i < 10000000; i++ { if i % 1000 == 0 { bar() } }}
func main() { f, err := os.Create("cpu.pprof") if err != nil { log.Fatal(err) } pprof.StartCPUProfile(f) defer pprof.StopCPUProfile() foo()}
Start to captureCPU profiling information
Stop to capture CPUprofiling informationat the end of main()
prof.go:Open the file to contain
CPU profiling information

14
pprof: Run & profiling$ lsprof.go$ go build$ ./pprof$ lscpu.pprof prof prof.go # cpu.pprof contains the CPU profiling information$ go tool pprof prof cpu.pprof Entering interactive mode (type "help" for commands)(pprof) top9.79s of 9.80s total (99.90%)Dropped 2 nodes (cum <= 0.05s) flat flat% sum% cum cum% 9.74s 99.39% 99.39% 9.74s 99.39% main.bar 0.05s 0.51% 99.90% 9.79s 99.90% main.foo 0 0% 99.90% 9.79s 99.90% main.main 0 0% 99.90% 9.79s 99.90% runtime.goexit 0 0% 99.90% 9.79s 99.90% runtime.main
Spend most of the time(99.39%) in main.bar()
Spend a little time(0.51%)In main.foo()
Spend almost 0%In other functions

15
Conclusion
● There are many nice troubleshooting featuresfor golang
● However, there is no way to analyze core dump– I consider it's one of the biggest weak point of
golang
– How to find root cause if your program crashes in aimportant system? Stack trace is insufficient inmany case


![[2015.07.04] NodeJS & Golang](https://static.fdocuments.us/doc/165x107/55cae582bb61eb3e788b4785/20150704-nodejs-golang.jpg)


