The Trend of Cargo and Container Movements Between · PDF filein ASEAN Countries and Pacific...
30
Soteri Gatera Senior Economic Affairs Officer [email protected] Seminar on Development of an Integrated Transport and Logistics System in ASEAN Countries and Pacific Sub-region. Bangkok, 21 – 23 November 2012 The Trend of Cargo and Container Movements Between ASEAN Countries and Africa: An overview
Transcript of The Trend of Cargo and Container Movements Between · PDF filein ASEAN Countries and Pacific...

Soteri GateraSenior Economic Affairs Officer
Seminar on Development of an Integrated Transport and Logistics System in ASEAN Countries and Pacific Sub-region.
Bangkok, 21 – 23 November 2012
The Trend of Cargo and Container Movements Between ASEAN Countries and Africa:
An overview

Presentation Outline
• SSA’s Macroeconomic Conditions• Asia – Africa Trade Trends• World Seaborne Trade: Forecast Trend• Shipping Containers in Africa• Eastern & Southern Africa: Ports and
Market coverage• Regional approach to Challenges
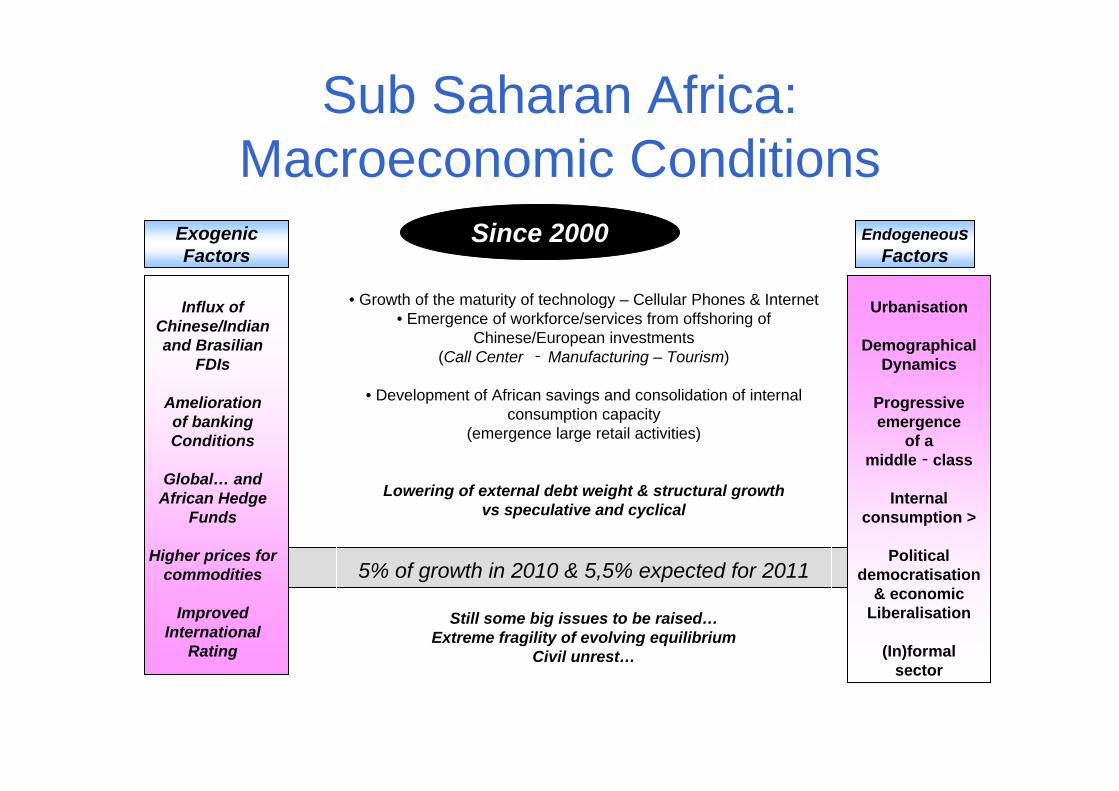
Sub Saharan Africa: Macroeconomic Conditions
EndogeneousFactors
Influx ofChinese/Indianand Brasilian
FDIs
Ameliorationof bankingConditions
Global… andAfrican Hedge
Funds
Higher prices forcommodities
ImprovedInternational
Rating
• Growth of the maturity of technology – Cellular Phones & Internet • Emergence of workforce/services from offshoring of
Chinese/European investments(Call Center ‐ Manufacturing – Tourism)
• Development of African savings and consolidation of internalconsumption capacity
(emergence large retail activities)
Lowering of external debt weight & structural growthvs speculative and cyclical
5% of growth in 2010 & 5,5% expected for 2011
Still some big issues to be raised…Extreme fragility of evolving equilibrium
Civil unrest…
Urbanisation
DemographicalDynamics
Progressiveemergence
of a middle‐class
Internalconsumption >
Politicaldemocratisation
& economicLiberalisation
(In)formalsector
ExogenicFactors
Since 2000

• The recent boom in commerce between Africa and Asia epitomizes the explosion of South-South trade:
Burgeoning middle classes in ASEANRising Economic growth in SSASSA’s increasing demand for ASEAN manufactured goods
• The traditional Africa’s N-S commerce with EU and USA: Preferential Arrangements
• S-S complementarities between developing nations – likely sustainability
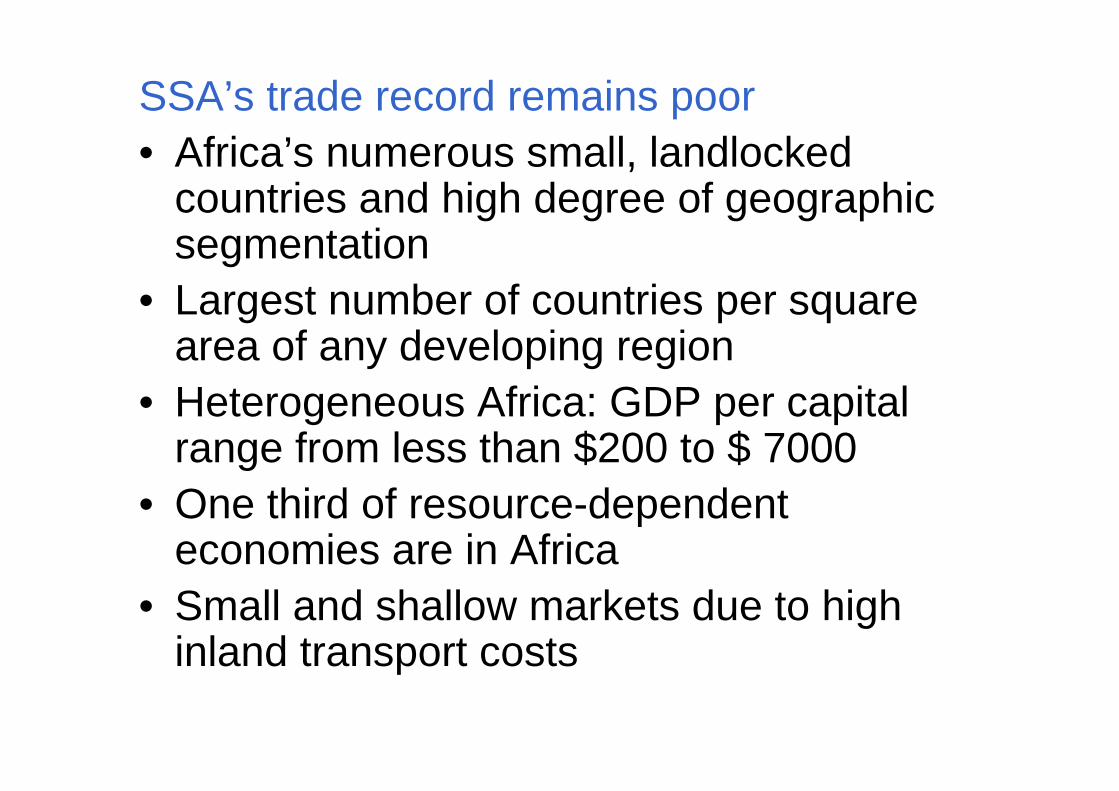
SSA’s trade record remains poor• Africa’s numerous small, landlocked
countries and high degree of geographic segmentation
• Largest number of countries per square area of any developing region
• Heterogeneous Africa: GDP per capital range from less than $200 to $ 7000
• One third of resource-dependent economies are in Africa
• Small and shallow markets due to high inland transport costs

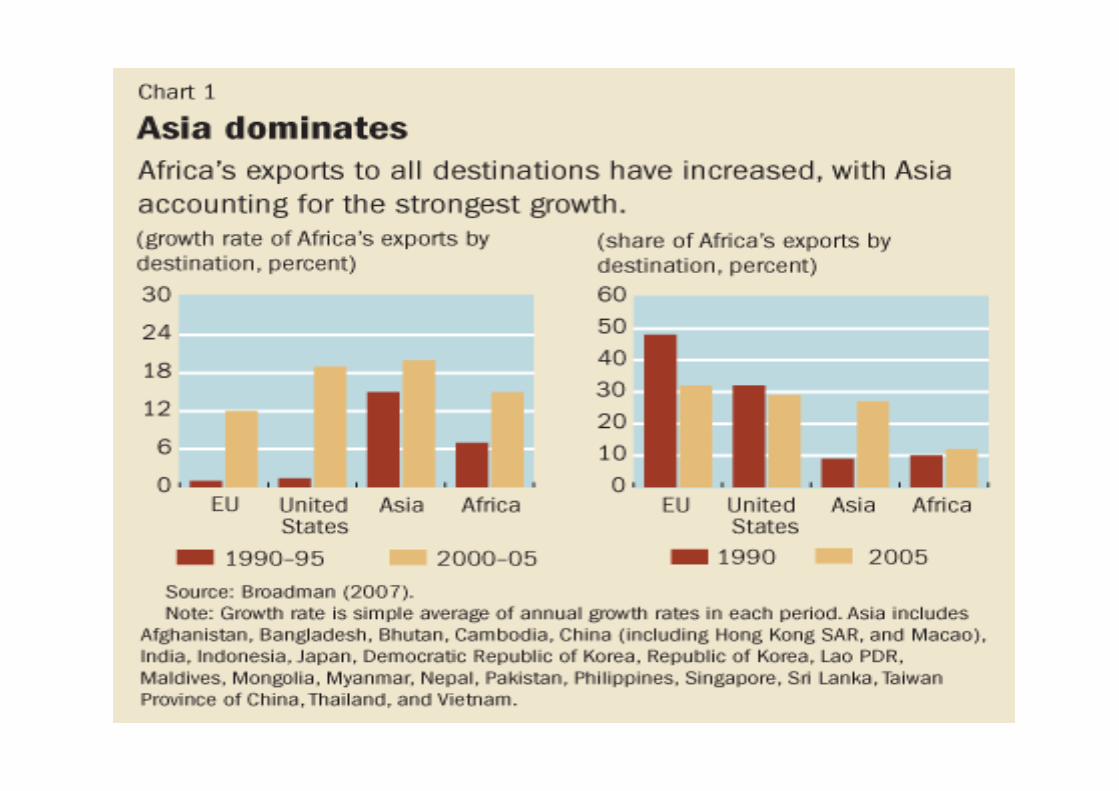
Asia – Africa trade patterns• Increased trade flows: the hallmark of South-
South cooperation and trade• Asia is Africa’s third most important export
destination after EU and US• Commodities accounts for 86 % of SSA’s
exports to Asia• Manufactured goods accounts for 80% of SSA’s
imports from Asia• Africa’s exports to China and India accounts for
half of SSA’s exports to Asia


Exports of merchandise products of world and regions by destination, 2011 (Note: Value ranges differ by region.)

Exports of merchandise products of world and regions by destination, 2011 (Note: Value ranges differ by region.)

Exports of merchandise products of world and regions by destination, 2011 (Note: Value ranges differ by region.)

Value of World Seaborne Trade (US$)
• 52% Container
• 22% Tanker
• 20% General Cargo
• 6% Dry Bulk
• Liner Shipping is the most efficient mode of Transportation
• Shipping is the most carbon-efficient mode of Transportation
• The Value of the liner shipping industry to Global economy exceeds 400 bn a year
• A large container ship can carry 11,000 containers of cargo == 77 km or 44 miles long train
• Source: Lloyd’s Maritime Intelligence Unit

Container Port Volume: World and ESCAP Region
• Study Forecast: Total volume of world container handling to increase to 795 million TEU by 2015, implying 7.9 %/ annual growth
• Total volume of international container handling in ESCAP Ports to increase from 152 million TEU in 2005 to 383 in 2015 ….9.7 % annual average growth
• China’s share of total port throughput will account for 44% of total ESCAP Ports throughput in 2015

Total Container Throughput of ESCAP Economies – 2015 (million TEU)

Total Container Throughput Annual Growth of ESCAP Economies (2005 – 2015)

Shipping containers handled in Ports by Country in 2008(prior to the global crisis)
0
2 000 000
4 000 000
6 000 000
8 000 000
10 000 000
12 000 000
14 000 000
16 000 000
18 000 000
1980
1982
1984
1986
1988
1990
1992
1994
1996
1998
2000
2002
2004
2006
Gatew ay Transhipment
Shipping containers handled in Africa
1980 ‐ 2008 (prior to the global crisis)

KENYA UGANDA
MOZAMBIQUE
MADAGASCAR
COMOROS
TANZANIA
REUNION
MAURITIUS
ZAMBIA
NAMIBIA
SOUTH AFRICA
BOTSWANA
ZIMBABWE
RWANDA
BURUNDI
SEYCHELLES
Mombasa
Dar‐es‐Salaam
Nacala
Toamasina
Port Reunion
Port Louis
Maputo
Durban
East London Ngqura
Port Elizabeth Cape Town
WalvisBay
Dr. Yann ALIX & Jean‐François PELLETIER
Nov 2011
Eastern & Southern Countries & major ports Market coverage

Shipping Lines Connectivity& Capacity deployed on Eastern & Southern Ports
Situation reported Sept 2011
3,800,000Teu’s Trade Capacity
350 Vessels
50 Weeklyservices
20 Portsweeklycalled
Source : Dynam
ar2011, D
rewry
2011, Con
tainerisation Internationa
l 2011, Alpha
liner
2011
2222
Shipping Lines Connectivity& Capacity deployed on Eastern & Southern Ports
Situation reported Sept 2011
3,800,000Teu’s Trade Capacity
350 Vessels
50 Weeklyservices
20 Portsweeklycalled
Source : Dynam
ar2011, D
rewry
2011, Con
tainerisation Internationa
l 2011, Alpha
liner
2011
2222

Annual Trade Capacity deployed by Major areas of marketsSituation reported Sept 2011
In TEU’s
Southern, Eastern& Indian OceanMarkets
Far EastAsia
MidEast& India
Europe & Med
Africa
NorthAmerica
100,000
250,000
500,000
1,000,000
Source : Dynam
ar2011, D
rewry
2011, Con
tainerisation Internationa
l 2011,
Alpha
liner
2011, Port A
utho
ritie
s 45 %
25 %
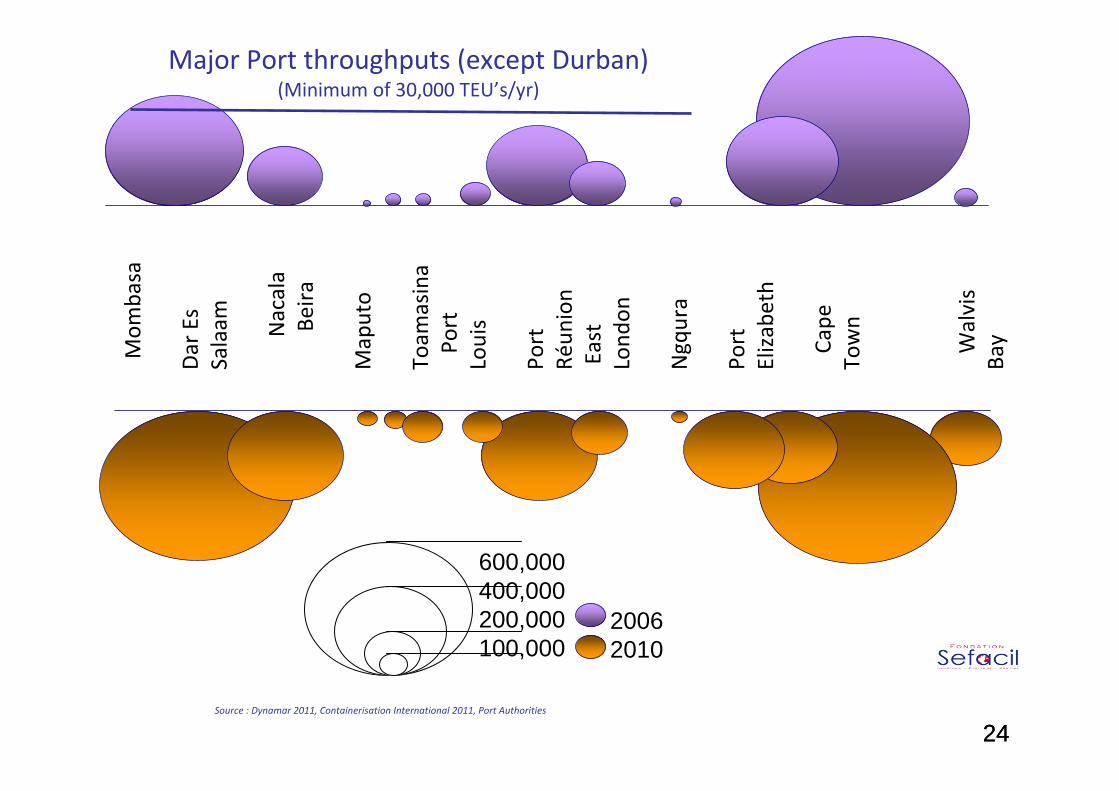
Major Port throughputs (except Durban) (Minimum of 30,000 TEU’s/yr)
Mom
basa
Dar Es
Salaam Nacala
Beira
Maputo
Toam
asina
Port
Louis
Port
Réun
ion
East
Lond
on
Ngqura
Port
Elizabeth
Cape
Town
Walvis
Bay
Source : Dynamar 2011, Containerisation International 2011, Port Authorities
600,000 400,000 200,000100,000
20062010
2424

Sketch on Ports configuration ‐ Yesterday ! •Milk Run System with« national single port gateway »serving mainly « domestic markets »
• Cross‐trading liner system based on interlinking Regional & Intercontinental loops
• Feedering network not enough reliable(size of the markets, productivityof handling activities, terminal costsfor thanshipments, dwell time for small ships, etc.)
• Economies of scale not sufficient• Lack of Regional Customs facilitation & integration
• Very few transnational freight railwayopportunities
• Few paved roads connecting gateway• Very few Logistic value added services
on Imp/Exp products(FTZ & services added)
South‐AfricanRange
SouthW
est
Range
SouthEastRange
Land
locked
markets
Inland boundaries
National Port Gateway & hinterland
Transcontinental direct call services
National direct call services
Regional feedering services Regional Hub

Toward a new subregionalPort hierarchy based on :
• Forecasted increase of Imp/Exp volumes • New generation of motherships(6,000 and +) & feederships (1500 and +)
• Hub & Spoke opportunities• Improvment of Terminal global performances
• Trades imbalances & empty strategicmanagement
• Regional Port Reform& GTO investments• Inland investments & Multimodal Corridors solutions
• Overlapping of hinterland coverage& competitiveness to control landlocked markets stimulated
Sketch on Ports configuration ‐ tomorrow ?
South‐AfricanRange
SouthW
est
Rang
e
SouthEastRange
Land
locked
markets
Inland boundaries
National Port Gateway & hinterland
Transcontinental direct call services
National direct call services
Regional feedering services
Inland multimodal corridors
Regional Hub
Hub & Spoke terminal


The African Port System: Fundamental Challenges
Major Traffic Growth• Port Container traffic demand is expected to quadruple by 2020 and
has already triggered the need for substantive Terminal Development
Capacity Limitations• The rapid growth is already putting pressure on the port system• Shipping lines have serious concerns about condition, capability
and future reliability of ports, road and rail services and infrastructure
• What are the Infrastructure priorities and how can African portsattract private sector funding?
Port Customers Demand Competitive Services and Prices
• Strong competition exists among global supply chains

Facilitating African Ports to Responding to opportunities/Challenges
• Increase inter/intra African Trade
• Regional economic integration through Transport Corridor
Development
• Intermodal harmonisation to improve regional Supply Chain and
reduce logistics costs
• Capacity Expansion: scale-up infrastructure and inland networks in
place to meet growth opportunities
• Patnerships between developed and developing ports – a regional
approach is required to build economies of scale and drive transport
system efficiencies

Thank you for your attention!