THE TRANS-TASMAN CONNECTION: Facts and Implications of Australia-New Zealand Migration
14
THE TRANS-TASMAN CONNECTION: Facts and Implications of Australia-New Zealand Migration Author(s): David Pope Source: Journal of the Australian Population Association, Vol. 2, No. 1 (May 1985), pp. 55-67 Published by: Springer Stable URL: http://www.jstor.org/stable/41110488 . Accessed: 14/06/2014 20:14 Your use of the JSTOR archive indicates your acceptance of the Terms & Conditions of Use, available at . http://www.jstor.org/page/info/about/policies/terms.jsp . JSTOR is a not-for-profit service that helps scholars, researchers, and students discover, use, and build upon a wide range of content in a trusted digital archive. We use information technology and tools to increase productivity and facilitate new forms of scholarship. For more information about JSTOR, please contact [email protected]. . Springer is collaborating with JSTOR to digitize, preserve and extend access to Journal of the Australian Population Association. http://www.jstor.org This content downloaded from 195.34.79.174 on Sat, 14 Jun 2014 20:14:06 PM All use subject to JSTOR Terms and Conditions
-
Upload
david-pope -
Category
Documents
-
view
215 -
download
0
Transcript of THE TRANS-TASMAN CONNECTION: Facts and Implications of Australia-New Zealand Migration

THE TRANS-TASMAN CONNECTION: Facts and Implications of Australia-New ZealandMigrationAuthor(s): David PopeSource: Journal of the Australian Population Association, Vol. 2, No. 1 (May 1985), pp. 55-67Published by: SpringerStable URL: http://www.jstor.org/stable/41110488 .
Accessed: 14/06/2014 20:14
Your use of the JSTOR archive indicates your acceptance of the Terms & Conditions of Use, available at .http://www.jstor.org/page/info/about/policies/terms.jsp
.JSTOR is a not-for-profit service that helps scholars, researchers, and students discover, use, and build upon a wide range ofcontent in a trusted digital archive. We use information technology and tools to increase productivity and facilitate new formsof scholarship. For more information about JSTOR, please contact [email protected].
.
Springer is collaborating with JSTOR to digitize, preserve and extend access to Journal of the AustralianPopulation Association.
http://www.jstor.org
This content downloaded from 195.34.79.174 on Sat, 14 Jun 2014 20:14:06 PMAll use subject to JSTOR Terms and Conditions

THE TRANS-TASMAN CONNECTION:
Facts and Implications of Âustralia-New Zealand Migration
David Pope
Introduction
Not very long ago there were some who questioned the uncontrolled and rising tide of New Zealanders • entering Australia, Kiwis were portrayed as threatening Australians1 jobs or, where they did not, as dole bludgers pushing up Australian taxes (Sydney Morning Herald, 16 December 1982). In short, New Zealand was seen as exporting her unemployed. Worse still, some reports pointed to a criminal element among the arrivals and to the tendency of young New Zealanders to crowd into ghettos, especially into one or two beach-side suburbs of Sydney ( Australian , 9-10 July, 1933). The question of trans-Tasmsn migration has however been eclipsed of late by the Blainey debate on Asian immigration, and the markedly reduced net inflow from New Zealand (Blaincry, 1984). Nonetheless it is clear that the trans- Tasman migration can significantly affect the composition and volume of migrant streams to Australia and that these movements in turn hold important implications for Australian demography and economy.
This paper investigates the recent history of trans-Tasman migration from the Australian viewpoint. Particular attention is paid to the economic position of New Zealand migrants in Australia with respect to their earnings and job market experience. The value of renewed and increased net migration from New Zealand is then assessed in terms of the likely effects on the Australian labour market and on Australian productivity and living standards. The final section of the paper looks at some of the factors that arc likely to determine the size and direction of future flows*
Facts
Pattern of Movements
Table 1 sets out the pattern of exchange of population between Australia and New Zealand since the beginning of the 1980s. In che table "resident" refers to persons who reported that they normally resided in Australia regardless of birthplace or citizenship, "Arrivals" refers to persons arriving from New Zealand and "departures" to those leaving Australia for New Zealand. For "arrivals", New Zealand was recorded as the country where persons regarded themselves as living or as last having lived. In the case of "short-term residents". New Zealand was where these people intended to spend, or had spent, most of their time whilst outside Australia. Finally, "permanent and long-term" relates to permanent settlement or stays of more than 12 months, and "short-term" relates to stays of less than a year. Our interest in this paper lies less in the short-term than in the longer-term permanent movements and their associated effects on the labour market and the economy.
55
This content downloaded from 195.34.79.174 on Sat, 14 Jun 2014 20:14:06 PMAll use subject to JSTOR Terms and Conditions

TABLE 1 Australia: Arrivals from and Departures to New Zealand
Financial Years
Category 1979/80 1980/81 1981/82 1982/83
ARRIVALS:
1. Total permanent 15,513 20,778 13,042 7,874
2. Long-term resident 3,768 3,919 2,865 2,443
3. Long-term visitor 13,446 14,626 11,152 6,828
4. Total permanent & long-term 32,727 39,323 27,059 17,145
5. Short-term resident 216,002 211,308 206,175 206,484
6. Short-term visitor 296,291 303,955 252,908 225,292
7. Total arrivals 545,020 554,586 486,142 448,921
DEPARTURES:
8. Total permanent 6,225 6,714 8,197 9,871
9. Long-term resident 2,153 2,036 1,802 2,152
10. Long-term visitor 5,844 6,101 5,987 6,311
11. Total permanent & long-term 14,222 14,851 15,986 18,334
12. Short-term resident 220,657 214,305 209,414 212,761
13. Short-term visitors 282,841 297,414 251,567 221,583
14. Total departures 517,720 526,570 476,967 452,678
NET BALANCES:
15. Net long-term & permanent (4-11) 18,505 24,472 11,073 -1,189
16. Aggregate net migration (7-14) 27,300 28,016 9,175 -3,757
Source: Data supplied by the Department of Immigration and Ethnic Affairs.
56
This content downloaded from 195.34.79.174 on Sat, 14 Jun 2014 20:14:06 PMAll use subject to JSTOR Terms and Conditions

What general story do the data tell? To begin, the total stream of people moving across the Tasman is very considerable, of the order of half a million persons each way each year. The overwhelming bulk of these are, however, "short-termers", mostly tourists (categories 5, 6 and 12, 13). In the late 1970s and early 1980s Australia enjoyed a small net gain from this source (presumably through the effects of category jumping and lags), but more recently this has changed to a net loss: from 8,795 in financial year 1980 to -2,568 in financial year 1983. The "permanent and long-term" movement has also fallen sharply over the same period. Most recently Australia has experienced a net loss to New Zealand of this category: from a net gain of nearly 25,000 in 1981 the tide has changed to a net loss of 1,189 (the 1983 calendar year data show a net loss of 4,300). The aggregate net migration figures tell a like tale (category 16 in Table 1),
The decline in Australia's net population exchange with New Zealand, especially long-term movers, owes more to the reduction in arrivals from New Zealand than to an increase in departures to it. Total "permanent and long-term" arrivals have declined at an average annual rate of 35 per cent since financial year 1980, while equivalent departures have increased at 11 per cent. Long-term visitor arrivals, a sub-set of the above, have declined by just over 30 per cent a year while departures in the same period grew at less than two per cent a year, albeit quickening to five per cent in 1983.
There is, however, nothing unique about this recent pattern, for Australia has in the past experienced other phases where the net balance of migration with New Zealand has been negative (Figure 1). We shall return to the question of the determinants of migration patterns later.
Economic position of New Zealand migrants
The 1947 Census showed New Zeaiand-born to be 0.6 per cent of the total Australian population. At the 1961 Census the figure had dropped to 0.4, but 10 years later had returned to its 1947 level. By June 1981, the proportion had doubled to 1.2 per cent. During the 1970s New Zealand was next to the United Kingdom as a supplier of settlers to Australia • In fact the New Zealand inflow may have post- poned the Blainey debate. As Price (1980: 94) pointed out, without the New Zealand influx "... the non-European racial proportion would be nearly 55 per cent of the intake instead of the recent 36 per cent or so".
What has been the economic position of these migrants? First, they have been typically younger than other migrant groups. Their age distribution shows a pronounced peak at the 20-24 age group with lesser peaks at ages 15-19 and 25-29 years; There is also a peak at the 0-4 years age group representing the children of young families (Goddard et al, 1984). It is this youthfulness that explains the first economic characteristic, namely the high workforce participation rates of New Zealand males in Australia (Table 2).
It perhaps needs to be pointed out that on an age-adjusted basis the difference between male New Zealanders, other male migrant groups,
57
This content downloaded from 195.34.79.174 on Sat, 14 Jun 2014 20:14:06 PMAll use subject to JSTOR Terms and Conditions

FIG, 1: Trans-Tasman Migration (calendar years)
thousands [
l' net permanent / ' and long term / •
(' : :
aggregate net I ' I ' migration |' | / ||
■10 ! ' '
s s s s s s a> o> « a> £> »
and Australians are insignificant. Indeed, New Zealand males have marginally lower age-corrected participation rates (Miller, 1982). However, in judging the impact of migration on labour supply (and production) it is the aggregate and not the age-specific rate which is pertinent, for we are interested in the aggregate numbers added to the workforce.
Second, the distribution of occupations of New Zealanders in Australia is not dissimilar to that of Australian and UK-born, but markedly different from that of Southern Europeans (Table 3), and more recently, Vietnamese. Australia has drawn a number of professionally trained people like lawyers, doctors, engineers, and scientists, though more numerous are professionals in teaching and nursing. Greater numbers are to be found in clerical and commercial occupations including among the females, stenographers and punchcard operators. A similar pattern of occupations is found among Australian-born permanent and long-term departures to New Zealand (NZ Government; Price, 1980: 87-93).
58
This content downloaded from 195.34.79.174 on Sat, 14 Jun 2014 20:14:06 PMAll use subject to JSTOR Terms and Conditions

TABLE 2: Participation (P) and Unemployment (U) Rates at 1981 Census
Period of Birthplace
residence UK and Eire New Zealand Other Countries
years (P) (U) (P) (U) (P) (U)
MALES Less than 1 89.5 11.8 100.0 21.1 Ó5.3 10.2 1-2 98.8 2.4 98.6 5.6 88.7 9.5 3-4 97.0 4.7 95.8 11.6 93.6 8.5 5-6 100.0 0.0 86.1 6.5 93.7 3.8 7-9 96.1 3.2 100.0 10.2 93.3 5.0
10-14 98.4 2.2 97-1 2.9 92.7 4.9 15-19 96.5 6.0 93,1 3.7 93.3 3.6 20 or more 96.1 3.4 100.0 0.0 95.0 3.4
FEMALES less than 1 53.Ó 26.7 50.0 45.5 39.3 41.7 i-2 56.0 2.0 54.8 8.8 53.2 17.0 3-4 67.9 5.6 74.5 10.5 55.1 11.7 5-6 65.7 4.5 57.6 5.3 53.6 5.3 7-9 69.7 6.9 66.7 6.7 60.5 5.0
10-14 62.6 6.0 64.5 2.5 58.5 5.3 15-19 54.6 5.6 69.2 0.0 58.3 4.9 20 or Bore 57.7 3.2 61.9 0.0 57.5 4.3
Source: Paul A- Tnglis and Thorsten Stromback, "A Descriptive Analysis of Migrants' Labotir Market Experience", Bureau of Labour Market Research, Working Paper 35, February 1984. The data are drawn from a sample of the 25-44 age groups in the 1981 Census.
P * persons in the workforce per 100 population.
U « unemployed per 100 in the workforce.
59
This content downloaded from 195.34.79.174 on Sat, 14 Jun 2014 20:14:06 PMAll use subject to JSTOR Terms and Conditions
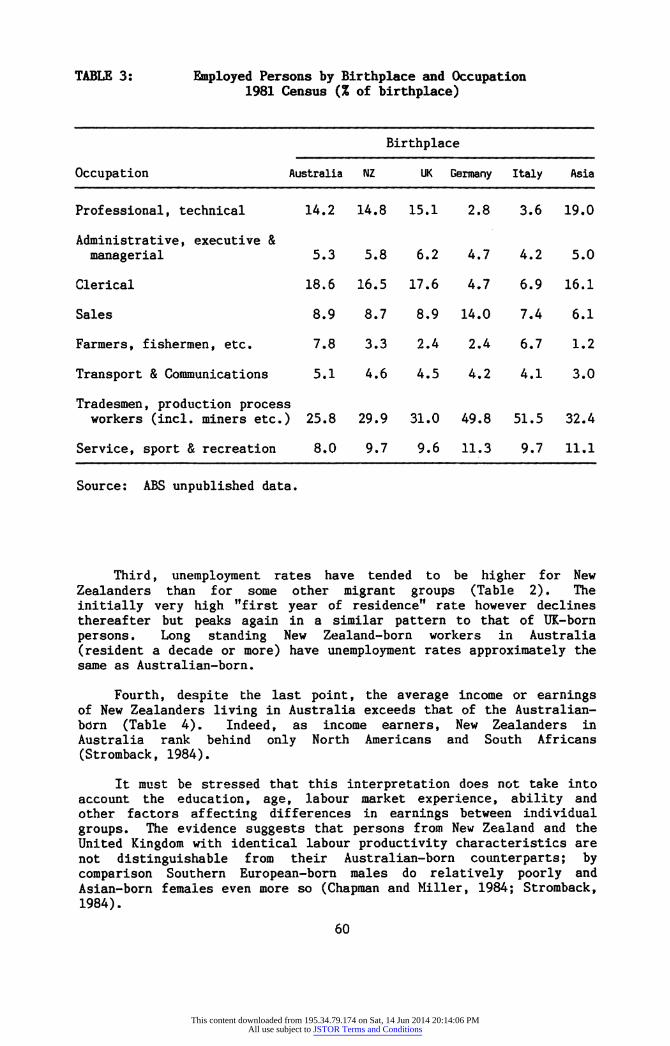
TABLE 3: Employed Persons by Birthplace and Occupation 1981 Census (% of birthplace)
Birthplace
Occupation Australia NZ UK Germany Italy Asia
Professional, technical 14.2 14.8 15.1 2.8 3.6 19.0
Administrative, executive & managerial 5.3 5.8 6.2 4.7 4.2 5.0
Clerical 18.6 16.5 17.6 4.7 6.9 16.1
Sales 8.9 8.7 8.9 14.0 7.4 6.1
Farmers, fishermen, etc. 7.8 3.3 2.4 2.4 6.7 1.2
Transport & Communications 5.1 4.6 4.5 4.2 4.1 3.0
Tradesmen, production process workers (incl. miners etc.) 25.8 29.9 31.0 49.8 51.5 32.4
Service, sport & recreation 8.0 9.7 9.6 11.3 9.7 11.1
Source: ABS unpublished data.
Third, unemployment rates have tended to be higher for New Zealanders than for some other migrant groups (Table 2). The initially very high "first year of residence" rate however declines thereafter but peaks again in a similar pattern to that of UK-born persons. Long standing New Zealand-born workers in Australia (resident a decade or more) have unemployment rates approximately the same as Australian-born.
Fourth, despite the last point, the average income or earnings of New Zealanders living in Australia exceeds that of the Australian- born (Table 4). Indeed, as income earners, New Zealanders in Australia rank behind only North Americans and South Africans (Stromback, 1984).
It must be stressed that this interpretation does not take into account the education, age, labour market experience, ability and other factors affecting differences in earnings between individual groups. The evidence suggests that persons from New Zealand and the United Kingdom with identical labour productivity characteristics are not distinguishable from their Australian-born counter parts; by comparison Southern European-born males do relatively poorly and Asian-born females even more so (Chapman and Miller, 1984; Stromback, 1984).
60
This content downloaded from 195.34.79.174 on Sat, 14 Jun 2014 20:14:06 PMAll use subject to JSTOR Terms and Conditions

TABLE 4: Earnings Levels at 1981 Census
Annual Earnings
Birth place $10,000 or more $15,000 or more Mean*
per cent
Australia 52.8 24.3 10,713
Total overseas 55.7 23.4 10,926
New Zealand 62.8 31.5 12,294
* Includes "zero income", excludes "not stated".
Source: ABS.
Implications
In this section we draw out briefly some of the ramifications of New Zealand migration for the Australian labour market and economy, and discuss future trends in population transfers across the Tasman.
Australian labour market and economy
The recent influx of New Zealanders produced concern over unemployment and job competition. The popular view is that during a recession migration adds to unemployment, either directly through migrants being une ble to find jobs or indirectly by migrants, in our case Nev7 Zealanders, displacing existing Australian-born workers in employment. Against this, it is important to realise that immigration represents not only an addition to the workforce, but also to actual expenditure by virtue of the migrants1 own expenditures and expenditures undertaken because of them. In order words, although immigrants increase the labour force, they also increase the demand for consumer goods, government services and public investment goods, as well as increasing private investment through their demand for housing and their effects on aggregate output (by what economists call the accelerator mechanism) and on business expectations (which affect the expected marginal rate of return on investment). These demands are translated back into an increased demand for labeur.
We have no evidence of how these opposing effects on the labour market specifically work in the case of trans-Tasman migration. It is interesting to note however, that two recent studies of the effect of postwar migration on unemployment suggest that the impetus of labour supply and demand roughly balanced each other and that the
61
This content downloaded from 195.34.79.174 on Sat, 14 Jun 2014 20:14:06 PMAll use subject to JSTOR Terms and Conditions

aggregate unemployment rate was no higher as a result of the inflows (Withers and Pope, 1984; Harrison, 1983) • Unemployment rates are higher among recent arrivals, but this is because most Australian jobs are not reassigned or thrown open annually for competition: migrants do not necessarily get the jobs that their presence helps to create or maintain!
While no detailed study has been made of the specific effects of New Zealand migration on the aggregate Australian unemployment rate, one observation can be made. Although the higher-than-average work- force participation rates of New Zealanders suggest that new arrivals increase the Australian labour supply curve proportionally more than in the case of other groups, their higher-than-average earnings and expenditure' pattern at least makes it possible that they shift Australian product and labour demand similarly more than other groups. Certainly we cannot presume that the return of high levels of migration from New Zealand would mean higher unemployment rates in Australia.
A separate issue concerns the impact of migration on real income per head in Australia, Productivity per worker is considered to be a key factor in the standard of living of a country, at least defined in terms of per capita income. Migrants can affect Australian productivity in a variety of ways. They can reduce average product- ivity (output per employed worker) by reducing or diluting the capital (machinery, tools, equipment) available to each worker - though this effect is weakened or offset where migrants bring in savings which filter through the banks and the capital market into new investment in capital goods. Migrants increase the demand for housing and public infrastructure investment, but this also acts to reduce the proportion of investment going directly into "efficiency-creating" business investment and in this way adversely affects Australian productivity, diluting productive capital per employed worker. Regrettably, we have insufficient information to assess the productivity effects of New Zealand migration via these routes but our presumption is that the productive capital/labour ratio has fallen.
Another way migrants might affect productivity is through increasing the size of the market for goods and services - via the greater division of labour in production and other economies of size. On the other hand, while economies exist for some industries it is obscure whether they exist at the more aggregative level; there are also those negative externalities with which we are well familiar, pollution and congestion. In any event the size of the New Zealand inflow relative to the total net inflow since the beginning of the postwar migration programmes suggests that New Zealanders are not a prime source of economies or diseconomies.
At least two further possibilities exist. New Zealanders might assist Australian productivity by promoting technological change or by introducing skills in short supply. The first is perhaps more likely to be associated with the migration to Australia of business executives and the upper professional groups. On the other hand production decision-makers in both countries probably have access to a good deal of the same technical information in the first place, so
62
This content downloaded from 195.34.79.174 on Sat, 14 Jun 2014 20:14:06 PMAll use subject to JSTOR Terms and Conditions

the effect is unlikely to be substantial. As for skills there is some evidence that New Zealanders are on average more educated than Australians, at least in terms of years of education: against Australian-born males and females with 10.9 years, New Zealand males living in Australia have 11.9 years and females 11.6 years. Having more New Zealanders presumably helps improve the quality of the total Australian workforce, though again the aggregate effect on the economy as a whole is most probably slight given their present numbers (Miller, 1982; Chapman et al, 1984).
Taking a somewhat different tack - namely abstracting from productivity effects - it has been suggested that as migrants tend to be more mobile than the Australian-born, existing job vacancies and job seekers are more readily matched, resulting in lower unemployment rates and higher average incomes among the migrants. While we cannot comment on New Zealanders in this regard, some recent research on migrants in general fails to support this conjecture at the economy-wide level.
One likely economic route to higher productivity and improved living standards concerns the movement not of population but of goods. Reducing tariffs and other barriers to trans-Tasman trade would remove in the long run the deleterious effects on resource allocation that such constraints impose, and increase efficiency and Australian income per capita. This is not to deny that short run structural unemployment might rise and incomes of some producers, in particular meat and dairy producers, fall sharply. In the last year the two countries have in fact moved their economies a little closer towards a single market with the signing of the Closer Economic Relations Treaty. In this context freedom of movement of population across the Tasman is, politically speaking, difficult to argue against. This is the view put by the Hawke government (Australian Financial Review, 19 May 1983).
Predicting future trends
If trans-Tasman migration is left essentially unregulated, then it is obviously important to know what will determine its magnitude. Figure 1 shows that trans-Tasman migration has see-sawed and that the net balance to Australia has been negative on other occasions. Many factors come into play in determining migratory patterns. We shall be concerned with seeing how powerful the economic ones have been.
In analysing the historical record it is hypothesized that the net movement depends upon two things: the state of the labour markets in the two economies and the difference in real wages to be earned from moving. Data availability and comparability limited the sample to years 1960-81. The observations on the independent variables are financial years (June to June), and calendar years for migration. Migration data used are from Price (1980); New Zealand labour force, registered unemployed, wages and consumer prices are from New Zealand Year Books ; Australian sources are Butlin (1977), and Norton and Garmston (1984).
63
This content downloaded from 195.34.79.174 on Sat, 14 Jun 2014 20:14:06 PMAll use subject to JSTOR Terms and Conditions
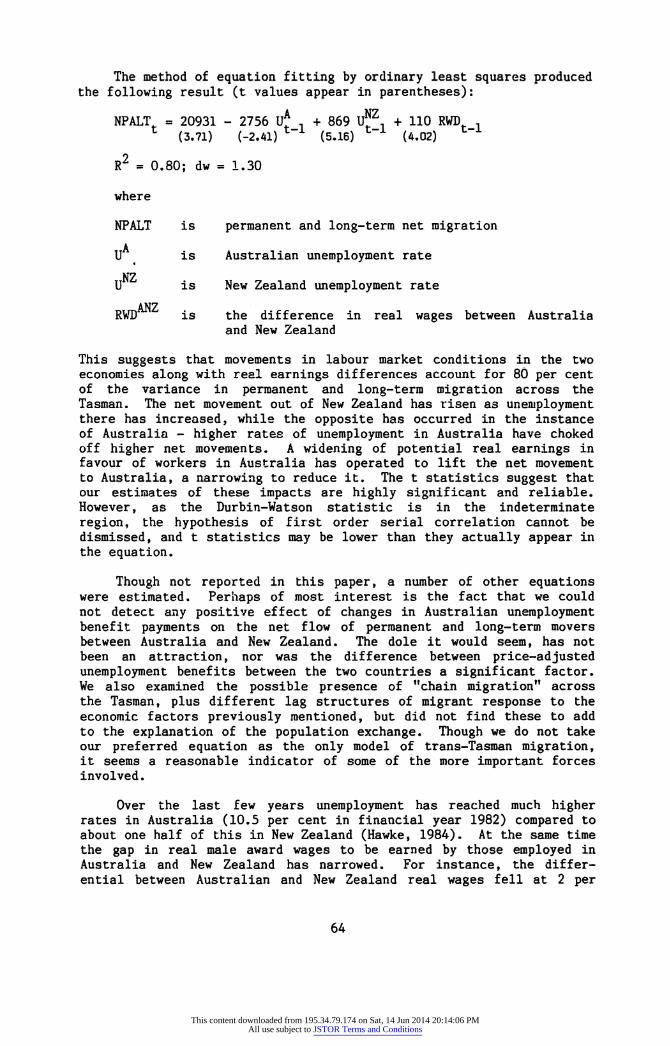
The method of equation fitting by ordinary least squares produced the following result (t values appear in parentheses):
NPALT Z - 20931 - 2756 U* Z l
. + 869 ufZ, W + 110 RWD Z .
Z (3.71) (-2.41)
Z l (5.16)
W (4.02)
Z
R2 = 0.80; dw = 1.30
where
NPALT is permanent and long-term net migration
U is Australian unemployment rate
NZ U is New Zealand unemployment rate
RWD is the difference in real wages between Australia and New Zealand
This suggests that movements in labour market conditions in the two economies along with real earnings differences account for 80 per cent of the variance in permanent and long-term migration across the Tasman. The net movement out of New Zealand has risen as unemployment there has increased, while the opposite has occurred in the instance of Australia - higher rates of unemployment in Australia have choked off higher net movements. A widening of potential real earnings in favour of workers in Australia has operated to lift the net movement to Australia, a narrowing to reduce it. The t statistics suggest that our estimates of these impacts are highly significant and reliable. However, as the Durbin-Watson statistic is in the indeterminate region, the hypothesis of first order serial correlation cannot be dismissed, and t statistics may be lov/er than they actually appear in the equation.
Though not reported in this paper, a number of other equations were estimated. Perhaps of most interest is the fact that we could not detect any positive effect of changes in Australian unemployment benefit payments on the net flow of permanent and long-term movers between Australia and New Zealand. The dole it would seem, has not been an attraction, nor was the difference between price-adjusted unemployment benefits between the two countries a significant factor. We also examined the possible presence of "chain migration" across the Tasman, plus different lag structures of migrant response to the economic factors previously mentioned, but did not find these to add to the explanation of the population exchange. Though we do not take our preferred equation as the only model of trans-Tasman migration, it seems a reasonable indicator of some of the more important forces involved.
Over the last few years unemployment has reached much higher rates in Australia (10.5 per cent in financial year 1982) compared to about one half of this in New Zealand (Hawke, 1984). At the same time the gap in real male award wages to be earned by those employed in Australia and New Zealand has narrowed. For instance, the differ- ential between Australian and New Zealand real wages fell at 2 per
64
This content downloaded from 195.34.79.174 on Sat, 14 Jun 2014 20:14:06 PMAll use subject to JSTOR Terms and Conditions

cent a year from 1977 to 1980. If Australian unemployment rates continue to drift up (or New Zealand rates fall) and if the real-wage difference continues to contract, then we can expect the negative net balance of the permanent and long-term movement into Australia to grow further .
The present Australian government is attempting to combat inflation and unemployment by a number of policies, though principally by two: a consensual incomes policy and a "slow ahead" public expenditure budget deficit - supported by cautious monetary policy. The former is intended to hold real-wage growth down (which could adversely affect net migration) in order to encourage employers to hire labour (which could favourably affect migration). There has also been some talk of restructuring the economy - partly by lowering protection and creating "freer" markets all round - which would increase efficiency and in time incomes (which could indirectly encourage labour flows into Australia).
Across the Tasman where some economists are rather more cynical of consensual incomes policy, they are equally supportive of the need for economic restructuring. As a recent body reported:
"The restructured economy would be a much more market- oriented economy, reflecting and responsive to overseas price signals. Economic activities in New Zealand would be valued at their international worth, either as exports competing on world markets, or as import competing indust- ries. With the distortions due to discriminatory assistance and protection removed, enterprise and investors could choose the internationally most profitable activities in which to employ people." (NZ Planning Council Monitoring Group, 1984: 3.)
The hope is that higher employment rates would be restored: this could decrease the outflow of labour and population to Australia, depending on relative worker gains and the time distribution of these.
It remains to be seen which policies are adopted and their actual efficiency. Nor are purely domestic policy stances likely to be most important. Much will depend on the international economy, in particular the economic health cf the United States. After two years of growth to 1984, that country's economy is showing some signs of a relapse into recession. How this affects the health of the two Tasman economies remains to be seen.
ACKNOWLEDGEMENT
Lucia Carrozzi is thanked for research assistance.
65
This content downloaded from 195.34.79.174 on Sat, 14 Jun 2014 20:14:06 PMAll use subject to JSTOR Terms and Conditions
REFERENCES
BLAINEY, G. (1984) All For Australia, Methuen Haynes, Sydney.
BUTLIN, M.W. (1977) "A Preliminary Annual Database 1900/01 to 1973/74". In Reserve Bank of Australia, Research Discussion Paper 7701, Sydney .
CHAPMAN, B. and P. MILLER (1984) "An Appraisal of Immigrants' Labour Market Performance in Australia". In Centre for Economic Policy Research, Discussion Paper 107 . Australian National University, Canberra .
CHAPMAN, B., D. POPE and G. WITHERS (1984) "Immigration and the Labour Market". Committee for the Economic Development of Australia/ Department of Immigration and Ethnic Affairs Project on the Economics of Immigration, November. Canberra.
GODDARD, R.F., L.H. .. SPARKES and J.A. HAYDON (1984) "Demographic Consequences of Immigration". Committee for the Economic Development of Australia Study. Melbourne .
HAWKE, G.R. (1984) "New Zealand in the 1930s and 1970s with Some Australian Comparisons". Victoria University of Wellington Paper in Economic History. Wellington.
HARRISON, D. (1983) The Impact of Recent Immigration on the South Australian Labour Market: A Report to the Committee for the Economic Development of Australia . National Institute of Labour Studies Incorporated, Adelaide.
INGLIS, P.A. and T. STROMBACK (1984) "A Descriptive Analysis of Migrants1 Labour Market Experience". In Bureau of Labour Market Research, Working Paper 38. Canberra.
MILLER, P. (1982) "The Economic Position of Migrants". Australian Bulletin of Labour« 8 (4), September.
NEW ZEALAND GOVERNMENT DEPARTMENT OF STATISTICS.
NEW ZEALAND PLANNING COUNCIL MONITORING GROUP REPORT (1984) Strategy for Growth. Wellington.
NEW ZEALAND YEAR BOOKS.
NORTON, W.E. and P.M. GARMSTON (1984) "Australian Economic Statistics 1949-50 to 1982-83: I Tables". In Reserve Bank of Australia, Occasional Paper N0.8A. Sydney.
PRICE, C.A. 1980) "Trans-Tasman Migration: An Australian Viewpoint". In I. POOL (ed.), Trans-Tasman Migration. Report for the Australian- New Zealand Foundation, Population Studies Centre, University of Waikato, Hamilton, New Zealand.
66
This content downloaded from 195.34.79.174 on Sat, 14 Jun 2014 20:14:06 PMAll use subject to JSTOR Terms and Conditions
STROMBACK, T. (1984) "The Earnings of Migrants in Australia". In Bureau of Labour Market Research, Conference Paper 46 . Canberra.
WITHERS, G. and D. POPE (1984) "Postwar Immigration and Australian Unemployment". Working Paper in Economic History, 24. Australian National University, Canberra. (A version of which is forthcoming in Economic Record.)
67
This content downloaded from 195.34.79.174 on Sat, 14 Jun 2014 20:14:06 PMAll use subject to JSTOR Terms and Conditions