The Trans-Pacific Partnership: Trade's Prosperous Potential for San ...
15
1 The Trans-Pacific Partnership: Trade’s Prosperous Potential for San Diego Thomas Baranga and Peter Cowhey * School of Global Policy and Strategy, UCSD March 13, 2016 Abstract We survey the impact of the recently negotiated TPP on the US economy, and explore its likely effects on the local San Diego economy. San Diego’s strong existing trade links with the region, as well as its specialisation in sub-sectors such as research and development that are singled out for strengthened international protection under the agreement, make it likely that the San Diego region would enjoy a disproportionate share of the gains enjoyed by the US economy as a whole. Keywords: Trade 1 Introduction In this paper we explore the likely impact of the recently negotiated Trans-Pacific Partnership (TPP) on the San Diego region. If ratified and fully implemented, the TPP will be one of the most ambitious trade agreements ever negotiated, deepening economic and political ties between twelve diverse economies around the Pacific Rim. The agreement goes beyond slashing tariffs (which are taxes of imports). It reduces non-tariff barriers, such as regulations that discriminate against foreign competitors and encourages foreign direct investment. It includes extensive safeguards for intellectual property, a key competitive asset of San Diego firms. At the same time, it innovates by using trade rules to enforce international environmental and labor standards. Nevertheless, the proposals remain a source of concern and uncertainty for many. One natural question is the impact on US workers of closer economic ties with economies with much lower labor costs. Others fear that the attempt to harmonize standards and regulations risks the imposition of a one-size-fits-all approach that may be inappropriate for economies at diffe r e n t stages of development, or which could neuter the authority of democratic decision-making processes. The unprecedented scope of the TPP makes it impossible to resolve these concerns entirely - quite simply, nothing this ambitious has been attempted before, and it is impossible * Baranga is Assistant Professor of Economics, and Cowhey is Dean and Qualcomm Professor of the UCSD School of Global Policy and Strategy. Correspondence to Baranga: GPS 0519, University of California - San Diego, 9500 Gilman Drive, La Jolla, CA 92093 (email: [email protected]; 858 822 2877). Our thanks to Melissa Floca for generously sharing her data on location quotients and input-output table for the San Diego region.
Transcript of The Trans-Pacific Partnership: Trade's Prosperous Potential for San ...
1
The Trans-Pacific Partnership: Trade’s
Prosperous Potential for San Diego
Thomas Baranga and Peter Cowhey*
School of Global Policy and Strategy, UCSD
March 13, 2016
Abstract
We survey the impact of the recently negotiated TPP on the US economy, and explore its likely effects on the local San Diego economy. San Diego’s strong existing trade links with the region, as well as its specialisation in sub-sectors such as research and development that are singled out for strengthened international protection under the
agreement, make it likely that the San Diego region would enjoy a disproportionate share of the gains enjoyed by the US economy as a whole.
Keywords: Trade
1 Introduction
In this paper we explore the likely impact of the recently negotiated Trans-Pacific
Partnership (TPP) on the San Diego region. If ratified and fully implemented, the TPP
will be one of the most ambitious trade agreements ever negotiated, deepening economic
and political ties between twelve diverse economies around the Pacific Rim.
The agreement goes beyond slashing tariffs (which are taxes of imports). It reduces
non-tariff barriers, such as regulations that discriminate against foreign
competitors and encourages foreign direct investment. It includes extensive safeguards
for intellectual property, a key competitive asset of San Diego firms. At the same time, it
innovates by using trade rules to enforce international environmental and labor standards.
Nevertheless, the proposals remain a source of concern and uncertainty for many. One
natural question is the impact on US workers of closer economic ties with economies with
much lower labor costs. Others fear that the attempt to harmonize standards and
regulations risks the imposition of a one-size-fits-all approach that may be inappropriate for
economies at diffe r e n t stages of development, or which could neuter the authority of
democratic decision-making processes.
The unprecedented scope of the TPP makes it impossible to resolve these concerns
entirely - quite simply, nothing this ambitious has been attempted before, and it is impossible
* Baranga is Assistant Professor of Economics, and Cowhey is Dean and Qualcomm Professor of the UCSD School of Global Policy and Strategy. Correspondence to Baranga: GPS 0519, University of California - San Diego, 9500 Gilman Drive, La Jolla, CA 92093 (email: [email protected]; 858 822 2877). Our thanks to Melissa Floca for generously sharing her data on location quotients and input-output table for the San Diego region.
2
to foresee with certainty exactly how the agreement will be implemented in every respect. In
any event, the arguments about the national opportunities and risks for the United States from TPP are
extensive. So, we leave this field to others. (See, for example, Plummer and Petri, 2016, or Scott and Glass,
2016) Instead, we believe that it is useful to add texture to the debate over the TPP’s economic impact by
looking at a major metropolitan area, San Diego. Moreover, we believe that local leaders have to make
important decisions about their positions on this national policy issue, and thus we want to demonstrate how
a deep dive into available economic data can provide fresh insight on the trade debate at the regional level.
While this is a San Diego centric analysis similar exercises could be undertaken in other regions.
Our analysis leads us to conclude that San Diego stands to benefit disproportionately
from the opportunities that the TPP presents for two reasons.
First, San Diego has a geographic advantage.
Despite notions that the world economy is highly integrated, international trade
remains overwhelmingly determined by geographical considerations. Physical distance is by
far the most important factor driving the intensity of trade links between economies1. San
Diego’s prime location, on the edge of the Pacific Rim, facing both Latin America, the
southern Pacific and Asia, means that it is a natural trading partner for TPP members.
San Diego already conducts a disproportionate amount of trade with the region, and the
reduction in trade costs that the TPP promises suggests that San Diego will reap a
disproportionate share of the benefits.
Second, San Diego’s existing pattern of industrial specialization is well aligned with
the sectors that could expect to gain most from the TPP. San Diego is highly specialized in
scientific research and development (such as biotech), services, and high-tech manufacturing,
particularly with application to telecommunications and information technology. These
sectors have historically successfully appealed for protection to policymakers, who have sought
to promote strategic local companies at the expense of foreign partners. The TPP embodies
commitments by members not to discriminate against one another in this way, and includes
Chapters dedicated to the strengthening of intellectual property rights among members,
and ensuring fair competition and equality of market access in telecommunications. Since
San Diego enjoys a strong comparative advantage in these sectors, it is likely to benefit from
the commitment by TPP partners not to handicap US firms in the future.
San Diego also boasts a large service sector, in part thanks to its exceptional climate
which supports extensive tourist-related activities. The jobs supported in this sector are
insulated from competition with foreign workers, being in essentially non-traded activities.
This suggests that downward pressures on wages from potential labor market competition
will be very limited. In fact, the prospects of strong growth in export sectors promises to
deliver rising real wages for local workers.
2 Potential Benefits of the TPP to San Diego
We begin by briefly putting San Diego into the context of the impact of TPP on the
overall U.S. economy. Our purpose is not to resolve the dispute on its total impact on the
national economy. Instead, we want to clarify an important asymmetry in the existing trade
system that disadvantages the US and which the TPP corrects.
The mos t soph is t i c a ted e conomic mode l o f the impac t o f the TPP
1 Consensus estimates from gravity equation regressions are that the value of trade falls by about 1% for every 1% increase in bilateral distance (See Chaney (2015)). Distance also makes the largest contribution of any conventional trade barrier to
the R2, or fit, of standard empirical gravity equations.
3
was pub l i shed by Petri & Plummer (2016). (The computable general equilibrium model
that underpins their forecast is a sophisticated analysis of 19 sectors across 29 regions.). Their
headline estimate is that by 2030 the TPP would raise annual US real income by $131
billion, or 0.5% of GDP, and annual exports by $357 billion, or 9.1%. They forecast that
world income would rise by $492 billion, so that while the US would be the largest single
beneficiary, the gains would be shared widely among other members, contributing to the
likely political durability of the arrangement.
Such forecasts are necessarily uncertain for many reasons. Implementation of previous
Preferential Trade Agreements has not always adhered to agreed schedules. Quantifying the
impact of changes in non-tariff barriers, such as quotas, arbitrary standards and regulations
that discriminate against foreign companies, or unpredictable customs procedures, is as
much an art as a science. Or U.S. labor markets may not adjust in the way that the model
projects. As a result, even such sophisticated estimates are best regarded as an upper-bound
on the likely gains. But the key point is that many of the gains projected in the model
come from correcting a current asymmetry between the openness of the U.S. market
compared to those of the other TPP countries. In other words, the status quo (no TPP)
works significantly against the United States
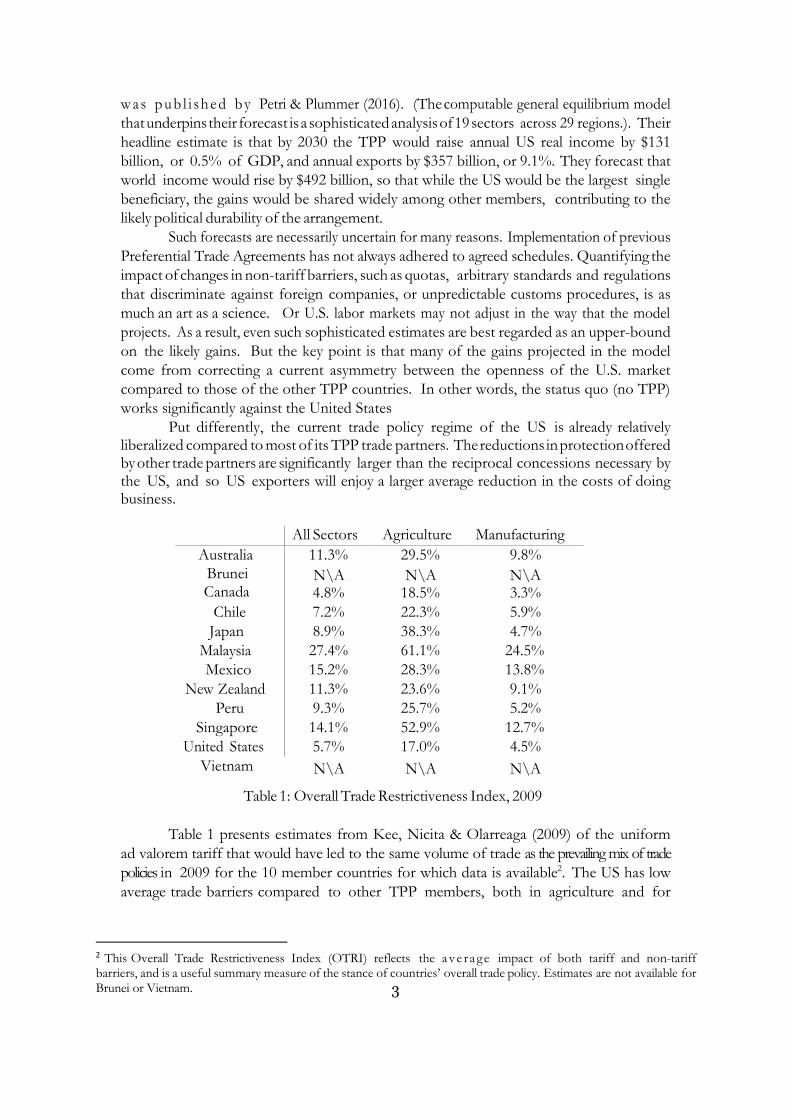
Put differently, the current trade policy regime of the US is already relatively liberalized compared to most of its TPP trade partners. The reductions in protection offered by other trade partners are significantly larger than the reciprocal concessions necessary by the US, and so US exporters will enjoy a larger average reduction in the costs of doing business.
All Sectors Agriculture Manufacturing
Australia 11.3% 29.5% 9.8%
Brunei Canada
N\A 4.8%
N\A 18.5%
N\A 3.3%
Chile 7.2% 22.3% 5.9%
Japan 8.9% 38.3% 4.7%
Malaysia 27.4% 61.1% 24.5%
Mexico 15.2% 28.3% 13.8%
New Zealand 11.3% 23.6% 9.1%
Peru 9.3% 25.7% 5.2%
Singapore 14.1% 52.9% 12.7%
United States 5.7% 17.0% 4.5%
Vietnam N\A N\A N\A
Table 1: Overall Trade Restrictiveness Index, 2009
Table 1 presents estimates from Kee, Nicita & Olarreaga (2009) of the uniform
ad valorem tariff that would have led to the same volume of trade as the prevailing mix of trade
policies in 2009 for the 10 member countries for which data is available2. The US has low
average trade barriers compared to other TPP members, both in agriculture and for
2 This Overall Trade Restrictiveness Index (OTRI) reflects the ave rage impact of both tariff and non-tariff barriers, and is a useful summary measure of the stance of countries’ overall trade policy. Estimates are not available for Brunei or Vietnam.
4
manufactured goods. This is particularly true for relative tariff levels3
. Kee et al. (2009)
estimate that the US maintains comparable non-tariff barriers to other partner countries.
Since there is much greater certainty about the implementation of the reductions in tariffs,
significant reductions in the relative costs facing US exporters are likely to be achieved
despite possible uncertainty about the speed with which non-tariff barriers will be
dismantled.
The other asymmetry between the US and many TPP countries is in the treatment
of intellectual property protection and the liberalization of services tied to a high tech
economy. In both respects TPP significantly narrows the gap between US arrangements
for its domestic market and the practices of other countries.
Chapter 18 of the TPP requires that members ratify or accede to a series of additional
international agreements upholding international intellectual property rights: the Madrid
Protocol4; the Budapest Treaty5; the Singapore Treaty6; the International Union for the
Protection of New Varieties of Plants7; the WIPO Copyright Treaty8; and the WIPO
Performances and Phonograms Treaty9. Since only the US, Australia, Mexico and
Singapore among TPP members are already signatories to all of these conventions, this
represents a significant strengthening of the intellectual property rights of US-based
inventors and researchers.
As the next section shows high tech services are growing in significance in the San
Diego economy, partly because U.S. rules have provided a supportive environment for
innovators in these services. Yet, numerous barriers to these services have crept up in
recent years. Two examples illustrate the problems. One is growing restrictions on the
use of global cloud computing networks (like Amazon’s AWS) to drastically reduce the
cost and improve the reliability of information technology that is essential to advanced
services (and many goods). The second is the restriction on the movement of data across
national borders so that a service (like engineering or cyber security support, to name two
San Diego specialties) can be supplied remotely10. TPP creates the first rules to limit these
restrictions on international commerce while acknowledging the right to regulate in a non-
discriminatory and transparent manner in order to protect privacy and security. These and
other rules on services and non-tariff barriers, including curbs on regulations designed to
favor local over U.S. technologies, are significant for the U.S. economy as a whole but
especially for San Diego, as we now explain.
3 The tariff-based OTRI for the US is 1.3%, while the unweighted average across the nine other TPP members with data is double that at 2.6%. 4 International Registration of Marks: Brunei, Canada, Chile, Malaysia and Peru are not yet signatories. 5 Patent protection for microorganisms: Malaysia, New Zealand and Vietnam are not yet signatories. 6 Trademark registration and communication technologies: Brunei, Canada, Chile, Japan, Malaysia, Peru and Vietnam are not yet signatories. 7 Brunei and Malaysia are not yet signatories. 8 Strengthening copyright protection for software and databases: Brunei, Vietnam and New Zealand are not yet signatories. 9 Brunei, Vietnam and New Zealand are not yet signatories. 10 The most comprehensive summary of restrictions is: Anupam Chander and Ulyen P. Le, “Breaking the Web: Data Localization vs. The Global Internet,” April 2014. Available at: http://papers.ssrn.com/sol3/papers.cfm?abstract_id=2407858.
5
2.1 Significant Sectors in San Diego’s Economy
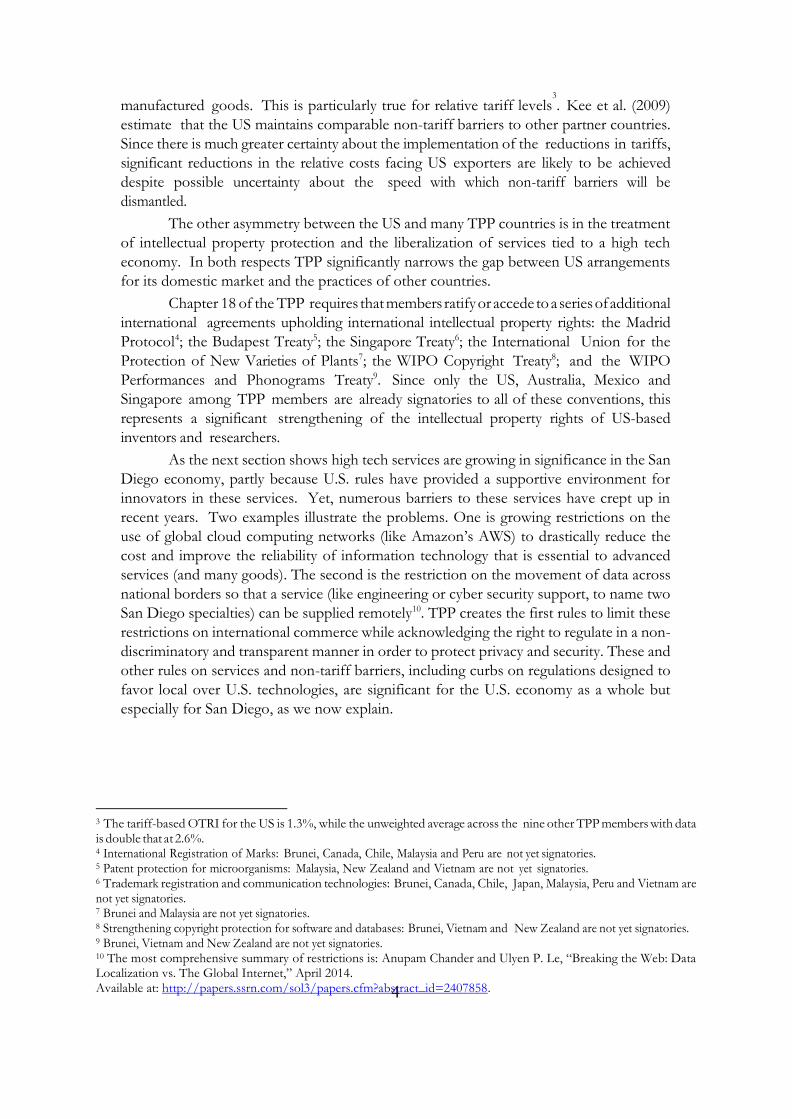
San Diego’s economy is heavily oriented towards service sectors. Table 2 reports
employment levels in San Diego in 2013 across the 11 NAICS super-sectors, and compares them to the US as whole.
NAICS
Super-Sector
Employment Level
Employment Share
San Diego
US SD (%)
US (%)
Location
Quotient
Unclassified 3,906 165,321 0.36% 0.15% 2.5
Professional and business services 222,969 18,478,164 20.48% 16.36% 1.3
Leisure and hospitality 167,164 14,195,179 15.35% 12.57% 1.2
Other services 45,615 4,149,819 4.19% 3.67% 1.1
Construction 60,619 5,819,950 5.57% 5.15% 1.1
Financial activities 71,124 7,616,922 6.53% 6.74% 1
Information 23,928 2,703,250 2.2% 2.39% 0.9
Education and health services 177,380 20,204,352 16.29% 17.89% 0.9
Trade, transportation, and utilities 211,558 25,606,723 19.43% 22.67% 0.9
Manufacturing 94,507 11,994,922 8.68% 10.62% 0.8
Natural resources and mining 10,105 2,023,732 0.93% 1.79% 0.5
Total Employment 1,088,875 112,958,334
Table 2: San Diego Employment and Location Quotients by NAICS Super-Sector
The sectors are ordered by their Location Quotients. This metric provides a measure of
the relative specialization of the San Diego economy compared to the wider US economy.
Location Quotients are calculated as the fraction of local employment in a given sector, relative to that sector’s
employment share in the wider economy. When this measure of relative specialization in employment exceeds
one, it indicates an underlying comparative advantage in productivity11. Ignoring the Unclassified sector, which represents a small fraction of both the San Diego
and wider US economy, San Diego’s economy is heavily concentrated in service sectors.
Professional and business services represent the largest single group, employing over 20% of the workforce,
which is 1.3 times larger than this sector’s share in the rest of the US. Other service categories,
such as Leisure and Hospitality, and Other Services are also over-represented, while
Manufacturing, Natural resources and Mining employ a much lower share of workers than
average.
Table 3 explores San Diego’s labor market in more detail, presenting the 10 4-digit
NAICS (North American Industry Classification System) sectors with highest local
employment. The top five employers are service sectors that reflect San Diego’s strengths
in tourism and professional services.
Of course the US economy as a whole is heavily dependent on services, and several of
11 For more discussion of Location Quotients, see (Brugues, Combs, Cox, Bautista, Flyte, Fuentes, Luhn, Mason, Shirk &
Wright 2014).

6
these locally significant sectors are major employers throughout the US. To tease out the
sectors in which San Diego enjoys unusually high employment and underlying productivity
advantages, Table 4 presents the 10 4-digit NAICS sectors in which San Diego has the highest
Location Quotients, or relatively concentrated local employment.
NAICS
code
NAICS
category
Employment
Level
Employment
Share
San Diego
US SD (%)
US (%)
7225 Restaurants 104,499 9,361,504 9.79% 8.29%
5417 Scientific research and development services 30,178 632,261 2.83% 0.56%
7211 Traveler accommodation 27,559 1,780,096 2.58% 1.58%
6241 Individual and family services 27,497 1,884,110
2.58% 1.67%
5613 Employment services 27,139 3,257,194
2.54% 2.88%
6211 Offices of physicians 26,647 2,430,043 2.5% 2.15%
4451 Grocery stores 24,887 2,564,403 2.33% 2.27%
5413 Architectural and engineering services 24,356 1,341,770
2.28% 1.19%
5511 Management of companies and enterprises 20,509 2,087,081 1.92% 1.85%
6221 General medical and surgical hospitals 20,264 4,437,590 1.9% 3.93%
Table 3: The 10 Largest 4-digit NAICS Sectors by Employment in San Diego
NAICS code
NAICS category
San Diego
US SD (%)
US (%)
Location Quotient
3343 Audio and video 1,984 19,115 0.19% 0.02% 11 equipment manufacturing
5417 Scientific research and 30,178 632,261 2.83% 0.56% 5.1 development services
3366 Ship and boat building 5,973 131,543 0.56% 0.12% 4.8
3342 Communications equipment 4,397 101,898 0.41% 0.09% 4.6 manufacturing
4872 Scenic and sightseeing 508 14,575 0.05% 0.01% 3.7 transportation, water
1114 Greenhouse and 4,795 143,331 0.45% 0.13% 3.5 nursery production
7131 Amusement parks and 5,536 184,293 0.52% 0.16% 3.2 arcades
3345 Electronic instrument 10,126 392,459 0.95% 0.35% 2.7 manufacturing
7121 Museums, historical sites, 3,601 141,242 0.34% 0.13% 2.7 zoos, and parks
9999 Unclassified 3,906 165,321 0.37% 0.15% 2.5
Table 4: Top 10 4-digit NAICS Sectors in San Diego by Location Quotient
7
2.2 San Diego’s Exposure to Trade with the TPP
Highly concentrated sectors are typically associated with exporting sectors. When a
region produces a disproportionately large quantity of a good or service, it trades it with
other regions or countries. Since many services are personal (e.g. hair cutting), they are
usually locally produced. In contrast, manufacturing, commodities like vegetables, and
tradable services (such as scientific research, or tourism, where the consumer travels to the
service provider) can be supercharged by trade. These sectors are much more highly represented in
the list of San Diego’s sectors with unusually high concentrations of employment. Out of
the 304 4-digit NAICS sub-sectors, these 10 most highly concentrated sub-sectors employed
over 70,000 people in 2013, or about 6.5% of San Diego’s workforce.
Of the 10 sub-sectors with highest LQs listed in Table 4, half involve trade in
physical goods that are recorded by US Customs. Table 5 reports the exports leaving the
San Diego customs district in 2015 for these sub- sectors, and compares San Diego’s
exports to total US exports.
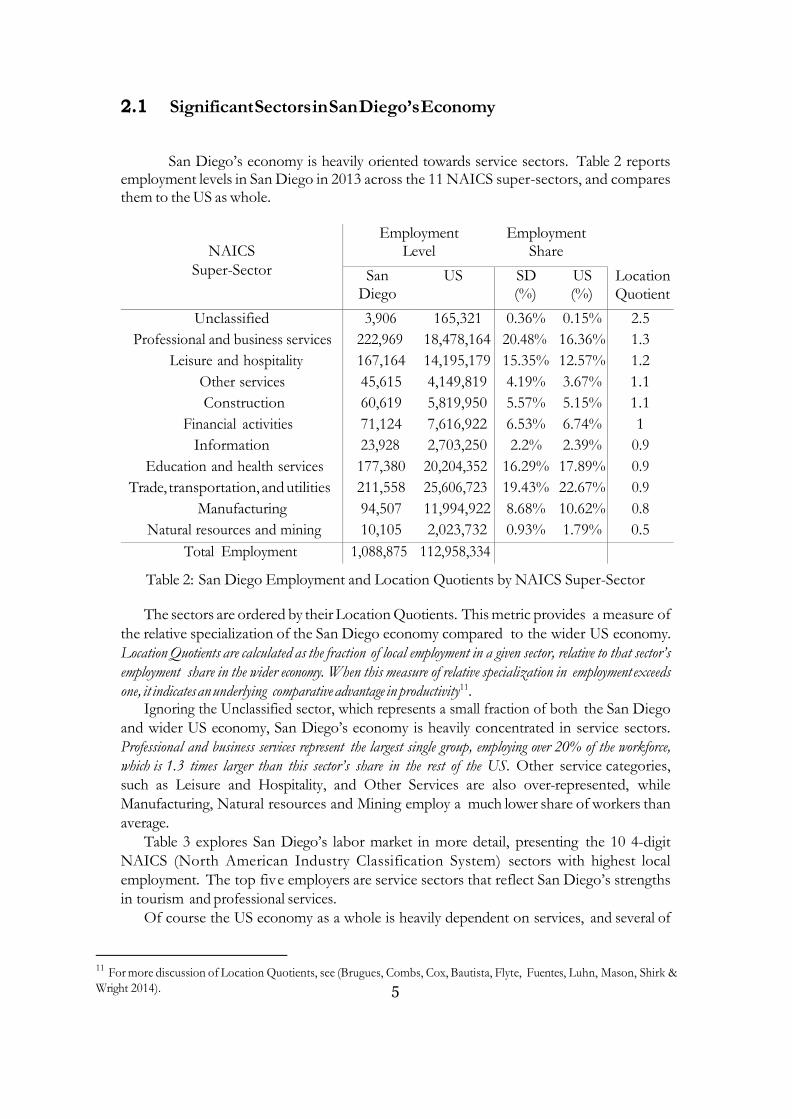
Table 5 also reports the fraction of these sectors’ exports that are sold to TPP member
countries. A strikingly high fraction of San Diego’s exports is sold into the TPP market. For four of the
fiv e sectors the TPP purchases over 90%, and for all five San Diego’s exposure to the TPP is much higher
than for the US as a whole.
Figure 1: TPP Market Share in San Diego and US Exports
These strong trade links between San Diego and the TPP markets are not an anomaly,
manifest only in San Diego’s high comparative advantage sectors. Figure 1 illustrates the
fraction of both San Diego’s and the US’s exports destined for TPP markets, across the
range of 97 HS2 Chapters tracked by US Customs. For every goods category, San Diego
exports a disproportionately larger fraction of its sales to the TPP than the US does as a
whole. The lowest proportion of San Diegan exports destined for the TPP is 63.4% (HS
38, Miscellaneous Chemical Products); for 85 of the 97 Chapters the fraction already
exceeds 90%; and for 17 Chapters 100% of San Diego’s exports are sold to the TPP.
0
10
20
30
40
50
60
70
80
90
100
1 4 7 10 13 16 19 22 25 28 31 34 37 40 43 46 49 52 55 58 61 64 67 70 73 76 80 83 86 89 92 95 99
% E
xpo
rts
to T
PP
Mem
ber
s
HS2 Chapter
San Diego US
8
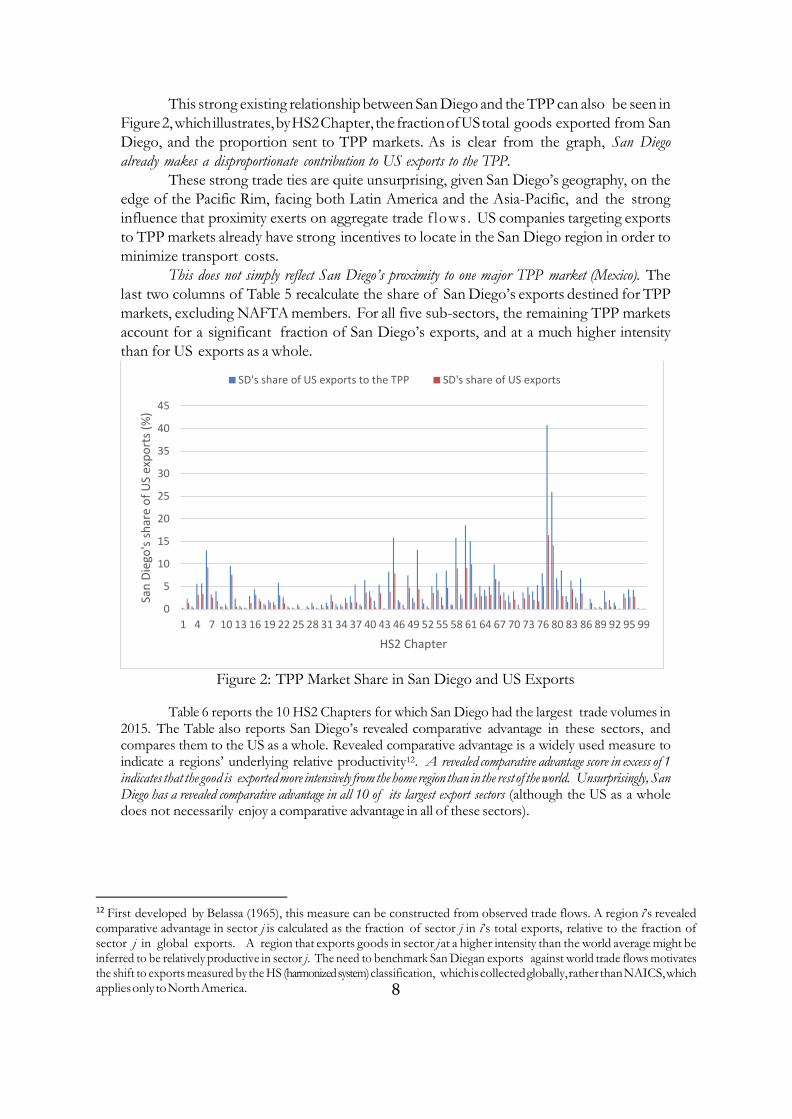
This strong existing relationship between San Diego and the TPP can also be seen in
Figure 2, which illustrates, by HS2 Chapter, the fraction of US total goods exported from San
Diego, and the proportion sent to TPP markets. As is clear from the graph, San Diego
already makes a disproportionate contribution to US exports to the TPP.
These strong trade ties are quite unsurprising, given San Diego’s geography, on the
edge of the Pacific Rim, facing both Latin America and the Asia-Pacific, and the strong
influence that proximity exerts on aggregate trade f lows . US companies targeting exports
to TPP markets already have strong incentives to locate in the San Diego region in order to
minimize transport costs.
This does not simply reflect San Diego’s proximity to one major TPP market (Mexico). The
last two columns of Table 5 recalculate the share of San Diego’s exports destined for TPP
markets, excluding NAFTA members. For all five sub-sectors, the remaining TPP markets
account for a significant fraction of San Diego’s exports, and at a much higher intensity
than for US exports as a whole.
Figure 2: TPP Market Share in San Diego and US Exports
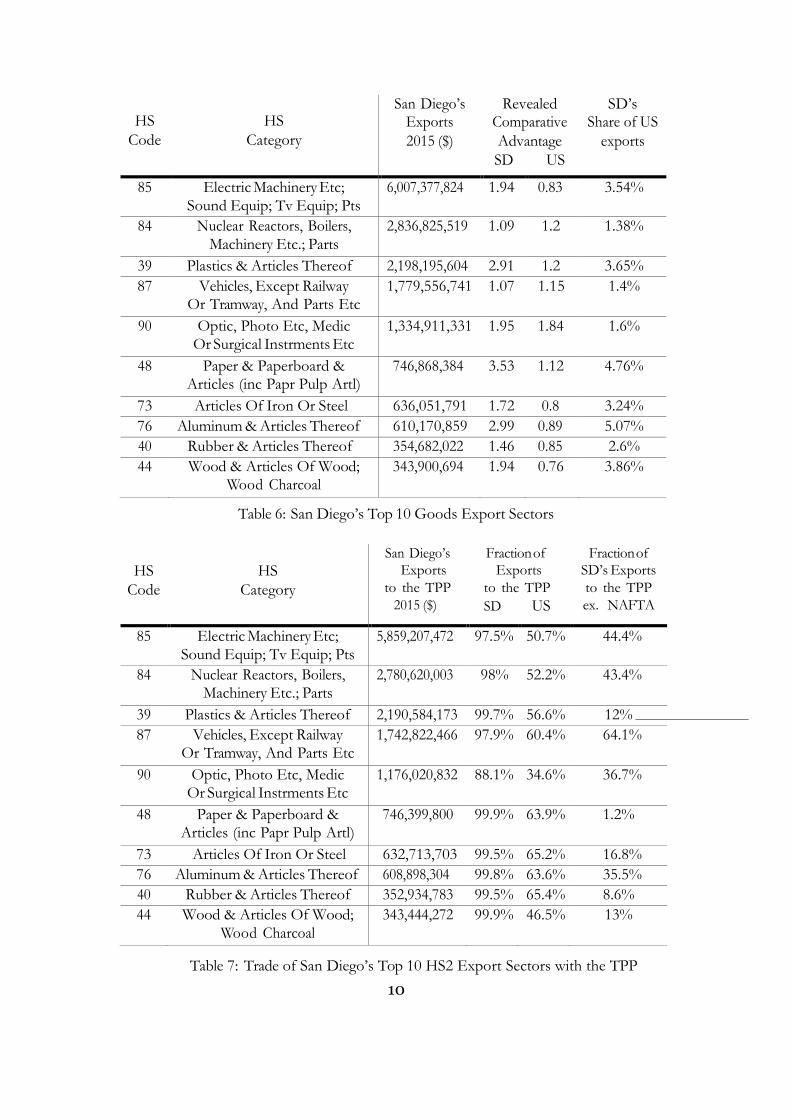
Table 6 reports the 10 HS2 Chapters for which San Diego had the largest trade volumes in 2015. The Table also reports San Diego’s revealed comparative advantage in these sectors, and compares them to the US as a whole. Revealed comparative advantage is a widely used measure to indicate a regions’ underlying relative productivity12. A revealed comparative advantage score in excess of 1 indicates that the good is exported more intensively from the home region than in the rest of the world. Unsurprisingly, San Diego has a revealed comparative advantage in all 10 of its largest export sectors (although the US as a whole does not necessarily enjoy a comparative advantage in all of these sectors).
12 First developed by Belassa (1965), this measure can be constructed from observed trade flows. A region i’s revealed comparative advantage in sector j is calculated as the fraction of sector j in i’s total exports, relative to the fraction of sector j in global exports. A region that exports goods in sector j at a higher intensity than the world average might be inferred to be relatively productive in sector j. The need to benchmark San Diegan exports against world trade flows motivates the shift to exports measured by the HS (harmonized system) classification, which is collected globally, rather than NAICS, which applies only to North America.
0
5
10
15
20
25
30
35
40
45
1 4 7 10 13 16 19 22 25 28 31 34 37 40 43 46 49 52 55 58 61 64 67 70 73 76 80 83 86 89 92 95 99
San
Die
go's
sh
are
of
US
exp
ort
s (%
)
HS2 Chapter
SD's share of US exports to the TPP SD's share of US exports

NAICS
code
NAICS
category
Exports TPP (%) TPP (%)
ex. NAFTA
San Diego US San Diego US San Diego US
3343 Audio & Video 565,378,491 9,593,436,456 99.8 76.5 70.3 20.6 Equipment
3366 Ships & Boats 7,824,999 2,954,162,744 92.4 80.9 43.8 24
3342 Communications 827,835,521 42,169,363,187 98.2 57.3 38.7 14.3 Equipment
1114 Mushrooms, Nursery & 38,306,328 484,303,966 99.9 43.2 70.5 16 Related Products
3345 Navigational/measuring/ 608,232,201 48,855,046,171 83.4 28.1 36.1 19.5
medical/control Instrument
Table 5: Trade with the TPP for San Diego’s highest LQ sectors
10
HS
Code
HS
Category
San Diego’s Exports
2015 ($)
Revealed Comparative
Advantage
SD US
SD’s Share of US
exports
85 Electric Machinery Etc;
Sound Equip; Tv Equip; Pts
6,007,377,824 1.94 0.83 3.54%
84 Nuclear Reactors, Boilers,
Machinery Etc.; Parts
2,836,825,519 1.09 1.2 1.38%
39 Plastics & Articles Thereof 2,198,195,604 2.91 1.2 3.65%
87 Vehicles, Except Railway Or Tramway, And Parts Etc
1,779,556,741 1.07 1.15 1.4%
90 Optic, Photo Etc, Medic Or Surgical Instrments Etc
1,334,911,331 1.95 1.84 1.6%
48 Paper & Paperboard & Articles (inc Papr Pulp Artl)
746,868,384 3.53 1.12 4.76%
73 Articles Of Iron Or Steel 636,051,791 1.72 0.8 3.24%
76 Aluminum & Articles Thereof 610,170,859 2.99 0.89 5.07%
40 Rubber & Articles Thereof 354,682,022 1.46 0.85 2.6%
44 Wood & Articles Of Wood; Wood Charcoal
343,900,694 1.94 0.76 3.86%
Table 6: San Diego’s Top 10 Goods Export Sectors
HS
Code
HS
Category
San Diego’s
Exports
to the TPP
2015 ($)
Fraction of
Exports
to the TPP
SD US
Fraction of
SD’s Exports
to the TPP
ex. NAFTA
85 Electric Machinery Etc;
Sound Equip; Tv Equip; Pts
5,859,207,472 97.5% 50.7% 44.4%
84 Nuclear Reactors, Boilers, Machinery Etc.; Parts
2,780,620,003 98% 52.2% 43.4%
39 Plastics & Articles Thereof 2,190,584,173 99.7% 56.6% 12%
87 Vehicles, Except Railway Or Tramway, And Parts Etc
1,742,822,466 97.9% 60.4% 64.1%
90 Optic, Photo Etc, Medic Or Surgical Instrments Etc
1,176,020,832 88.1% 34.6% 36.7%
48 Paper & Paperboard & Articles (inc Papr Pulp Artl)
746,399,800 99.9% 63.9% 1.2%
73 Articles Of Iron Or Steel 632,713,703 99.5% 65.2% 16.8%
76 Aluminum & Articles Thereof 608,898,304 99.8% 63.6% 35.5%
40 Rubber & Articles Thereof 352,934,783 99.5% 65.4% 8.6%
44 Wood & Articles Of Wood;
Wood Charcoal
343,444,272 99.9% 46.5% 13%
Table 7: Trade of San Diego’s Top 10 HS2 Export Sectors with the TPP
11
As reported in Table 7, the TPP is the dominant market for San Diegan exports
for all of these sectors, accounting for a much higher fraction of export sales than for
US exports as a whole. Even excluding exports to Mexico and Canada, the TPP remains a
very significant market for San Diego, as reported in the final column of Table 7.
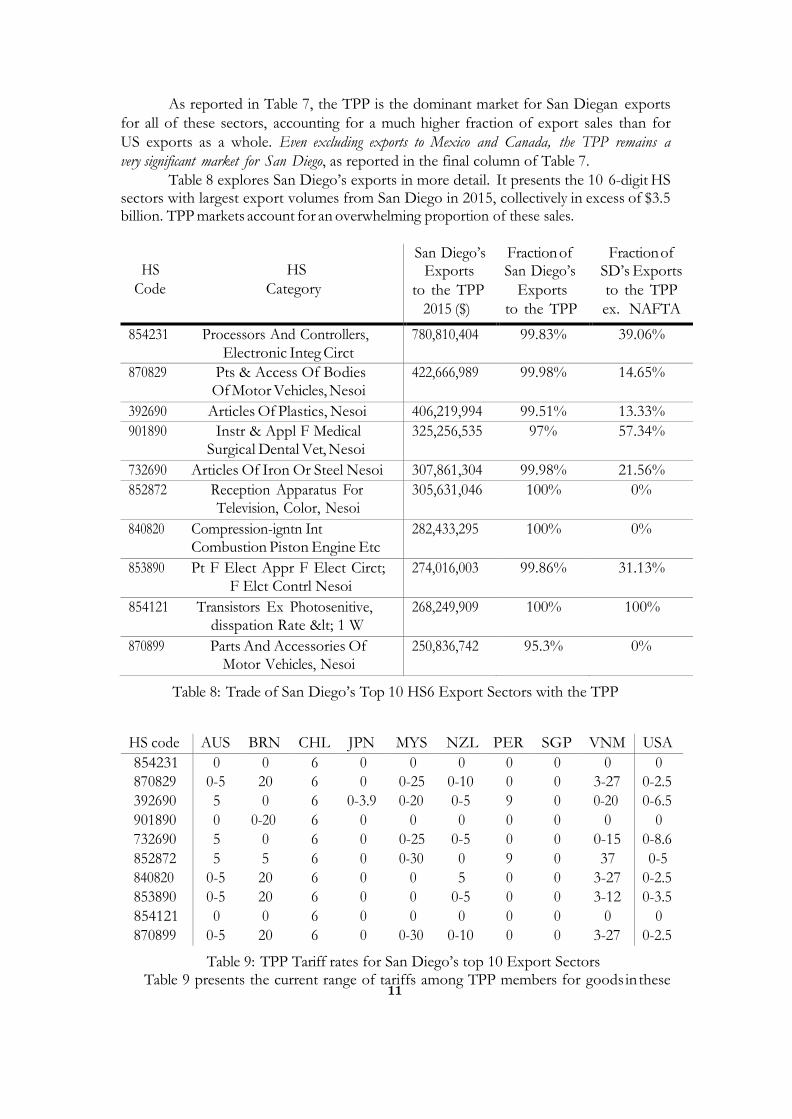
Table 8 explores San Diego’s exports in more detail. It presents the 10 6-digit HS sectors with largest export volumes from San Diego in 2015, collectively in excess of $3.5 billion. TPP markets account for an overwhelming proportion of these sales.
HS HS
Code Category
San Diego’s Exports
to the TPP
2015 ($)
Fraction of San Diego’s
Exports
to the TPP
Fraction of SD’s Exports
to the TPP
ex. NAFTA
854231 Processors And Controllers,
Electronic Integ Circt
780,810,404 99.83% 39.06%
870829 Pts & Access Of Bodies Of Motor Vehicles, Nesoi
422,666,989 99.98% 14.65%
392690 Articles Of Plastics, Nesoi 406,219,994 99.51% 13.33%
901890 Instr & Appl F Medical Surgical Dental Vet, Nesoi
325,256,535 97% 57.34%
732690 Articles Of Iron Or Steel Nesoi 307,861,304 99.98% 21.56%
852872 Reception Apparatus For Television, Color, Nesoi
305,631,046 100% 0%
840820 Compression-igntn Int Combustion Piston Engine Etc
282,433,295 100% 0%
853890 Pt F Elect Appr F Elect Circt;
F Elct Contrl Nesoi
274,016,003 99.86% 31.13%
854121 Transistors Ex Photosenitive, disspation Rate < 1 W
268,249,909 100% 100%
870899 Parts And Accessories Of Motor Vehicles, Nesoi
250,836,742 95.3% 0%
Table 8: Trade of San Diego’s Top 10 HS6 Export Sectors with the TPP
HS code AUS BRN CHL JPN MYS NZL PER SGP VNM USA
854231 0 0 6 0 0 0 0 0 0 0
870829 0-5 20 6 0 0-25 0-10 0 0 3-27 0-2.5
392690 5 0 6 0-3.9 0-20 0-5 9 0 0-20 0-6.5
901890 0 0-20 6 0 0 0 0 0 0 0
732690 5 0 6 0 0-25 0-5 0 0 0-15 0-8.6
852872 5 5 6 0 0-30 0 9 0 37 0-5
840820 0-5 20 6 0 0 5 0 0 3-27 0-2.5
853890 0-5 20 6 0 0 0-5 0 0 3-12 0-3.5
854121 0 0 6 0 0 0 0 0 0 0
870899 0-5 20 6 0 0-30 0-10 0 0 3-27 0-2.5
Table 9: TPP Tariff rates for San Diego’s top 10 Export Sectors Table 9 presents the current range of tariffs among TPP members for goods in these
12
HS6 categories. Where a range of tariff rates is indicated, these represent the minimum and
maximum tariffs on goods in these categories. A single number implies that all goods in the
category face the same rate. For the sake of space, Canada and Mexico are omitted, since
they are members of NAFTA and so current MFN tariffs do not apply to US exporters.
Most of San Diego’s leading export sectors face moderate tariffs in TPP export markets,
particularly in Brunei, Malaysia and Vietnam. Current US tariffs in these sectors are
relatively low, compared to TPP members. This suggests that US based firms will enjoy a
disproportionate reduction in trade costs as a result of the TPP, allowing San Diego’s
exporters to lower their relative price and expand their market share.
OLS probit
tariff rate -2,270,006 (1,247,699*)
-0.045 (0.014***)
Observations 110 110
Standard errors in parentheses Statistical significance: * 10%; ** 5%; *** 1%
Probit: marginal effect
Table 10: Influence of TPP members’ tariffs on San Diego’s exports
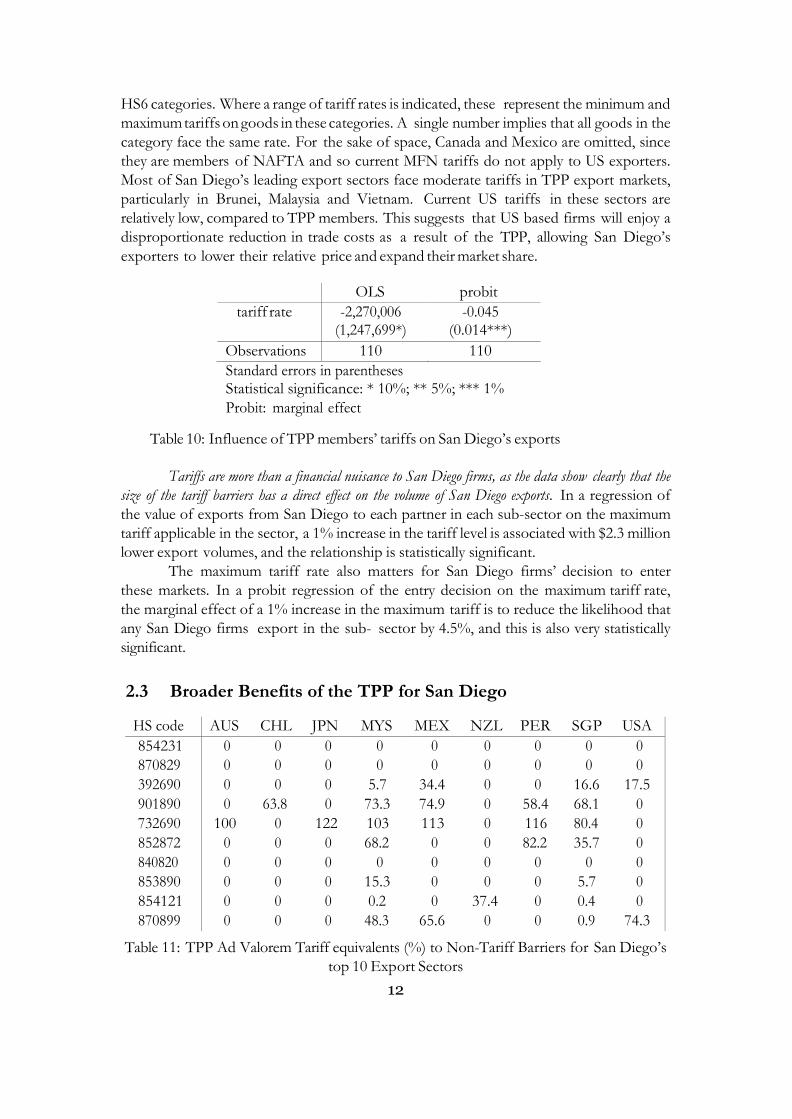
Tariffs are more than a financial nuisance to San Diego firms, as the data show clearly that the
size of the tariff barriers has a direct effect on the volume of San Diego exports. In a regression of
the value of exports from San Diego to each partner in each sub-sector on the maximum
tariff applicable in the sector, a 1% increase in the tariff level is associated with $2.3 million
lower export volumes, and the relationship is statistically significant.
The maximum tariff rate also matters for San Diego firms’ decision to enter
these markets. In a probit regression of the entry decision on the maximum tariff rate,
the marginal effect of a 1% increase in the maximum tariff is to reduce the likelihood that
any San Diego firms export in the sub- sector by 4.5%, and this is also very statistically
significant.
2.3 Broader Benefits of the TPP for San Diego
HS code AUS CHL JPN MYS MEX NZL PER SGP USA
854231 0 0 0 0 0 0 0 0 0
870829 0 0 0 0 0 0 0 0 0
392690 0 0 0 5.7 34.4 0 0 16.6 17.5
901890 0 63.8 0 73.3 74.9 0 58.4 68.1 0
732690 100 0 122 103 113 0 116 80.4 0
852872 0 0 0 68.2 0 0 82.2 35.7 0
840820 0 0 0 0 0 0 0 0 0
853890 0 0 0 15.3 0 0 0 5.7 0
854121 0 0 0 0.2 0 37.4 0 0.4 0
870899 0 0 0 48.3 65.6 0 0 0.9 74.3
Table 11: TPP Ad Valorem Tariff equivalents (%) to Non-Tariff Barriers for San Diego’s
top 10 Export Sectors
13
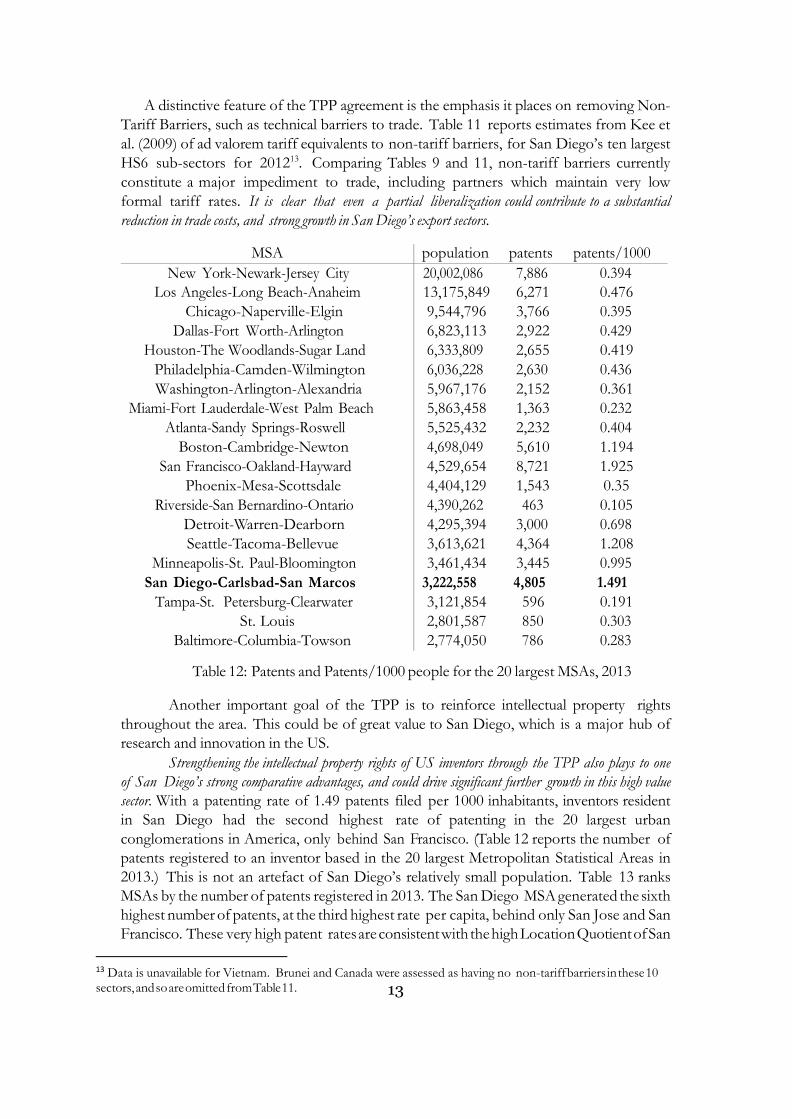
A distinctive feature of the TPP agreement is the emphasis it places on removing Non-
Tariff Barriers, such as technical barriers to trade. Table 11 reports estimates from Kee et
al. (2009) of ad valorem tariff equivalents to non-tariff barriers, for San Diego’s ten largest
HS6 sub-sectors for 201213. Comparing Tables 9 and 11, non-tariff barriers currently
constitute a major impediment to trade, including partners which maintain very low
formal tariff rates. It is clear that even a partial liberalization could contribute to a substantial
reduction in trade costs, and strong growth in San Diego’s export sectors.
MSA population patents patents/1000
New York-Newark-Jersey City 20,002,086 7,886 0.394
Los Angeles-Long Beach-Anaheim 13,175,849 6,271 0.476
Chicago-Naperville-Elgin 9,544,796 3,766 0.395
Dallas-Fort Worth-Arlington 6,823,113 2,922 0.429
Houston-The Woodlands-Sugar Land 6,333,809 2,655 0.419
Philadelphia-Camden-Wilmington 6,036,228 2,630 0.436
Washington-Arlington-Alexandria 5,967,176 2,152 0.361
Miami-Fort Lauderdale-West Palm Beach 5,863,458 1,363 0.232
Atlanta-Sandy Springs-Roswell 5,525,432 2,232 0.404
Boston-Cambridge-Newton 4,698,049 5,610 1.194
San Francisco-Oakland-Hayward 4,529,654 8,721 1.925
Phoenix-Mesa-Scottsdale 4,404,129 1,543 0.35
Riverside-San Bernardino-Ontario 4,390,262 463 0.105
Detroit-Warren-Dearborn 4,295,394 3,000 0.698
Seattle-Tacoma-Bellevue 3,613,621 4,364 1.208
Minneapolis-St. Paul-Bloomington 3,461,434 3,445 0.995
San Diego-Carlsbad-San Marcos 3,222,558 4,805 1.491
Tampa-St. Petersburg-Clearwater 3,121,854 596 0.191
St. Louis 2,801,587 850 0.303
Baltimore-Columbia-Towson 2,774,050 786 0.283
Table 12: Patents and Patents/1000 people for the 20 largest MSAs, 2013
Another important goal of the TPP is to reinforce intellectual property rights
throughout the area. This could be of great value to San Diego, which is a major hub of
research and innovation in the US.
Strengthening the intellectual property rights of US inventors through the TPP also plays to one
of San Diego’s strong comparative advantages, and could drive significant further growth in this high value
sector. With a patenting rate of 1.49 patents filed per 1000 inhabitants, inventors resident
in San Diego had the second highest rate of patenting in the 20 largest urban
conglomerations in America, only behind San Francisco. (Table 12 reports the number of
patents registered to an inventor based in the 20 largest Metropolitan Statistical Areas in
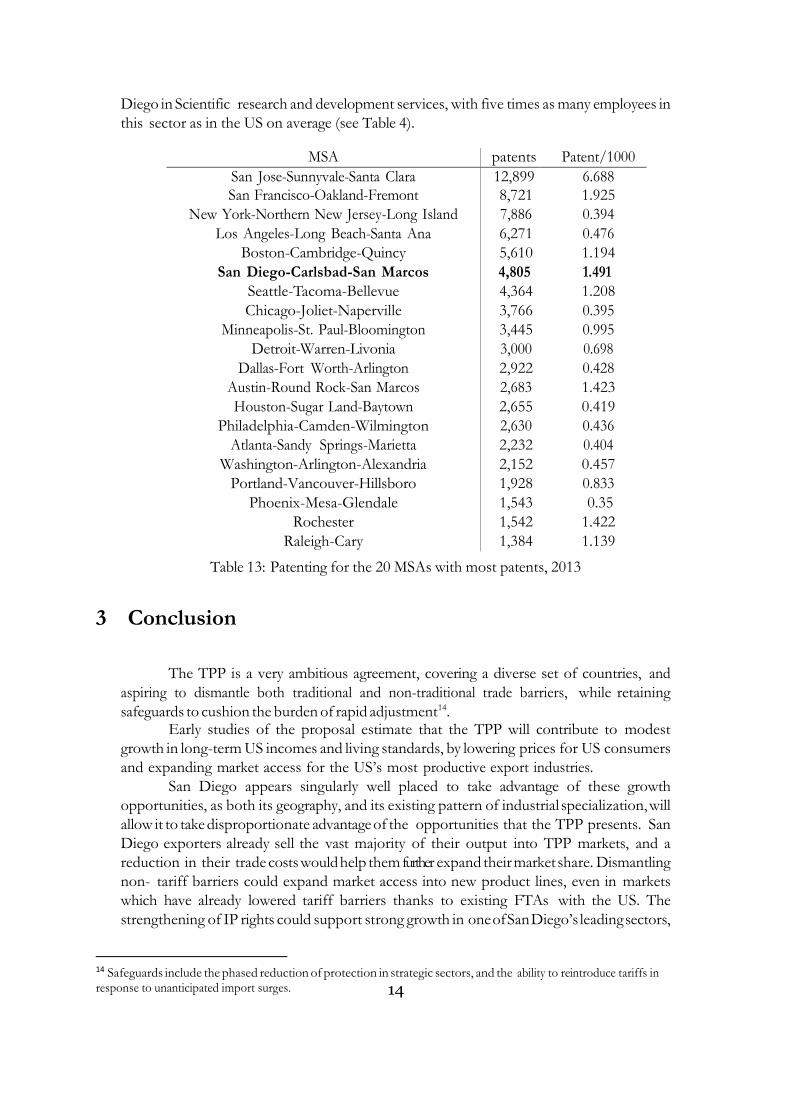
2013.) This is not an artefact of San Diego’s relatively small population. Table 13 ranks
MSAs by the number of patents registered in 2013. The San Diego MSA generated the sixth
highest number of patents, at the third highest rate per capita, behind only San Jose and San
Francisco. These very high patent rates are consistent with the high Location Quotient of San
13 Data is unavailable for Vietnam. Brunei and Canada were assessed as having no non-tariff barriers in these 10 sectors, and so are omitted from Table 11.
14
Diego in Scientific research and development services, with five times as many employees in
this sector as in the US on average (see Table 4).
MSA patents Patent/1000
San Jose-Sunnyvale-Santa Clara 12,899 6.688
San Francisco-Oakland-Fremont 8,721 1.925
New York-Northern New Jersey-Long Island 7,886 0.394
Los Angeles-Long Beach-Santa Ana 6,271 0.476
Boston-Cambridge-Quincy 5,610 1.194
San Diego-Carlsbad-San Marcos 4,805 1.491
Seattle-Tacoma-Bellevue 4,364 1.208
Chicago-Joliet-Naperville 3,766 0.395
Minneapolis-St. Paul-Bloomington 3,445 0.995
Detroit-Warren-Livonia 3,000 0.698
Dallas-Fort Worth-Arlington 2,922 0.428
Austin-Round Rock-San Marcos 2,683 1.423
Houston-Sugar Land-Baytown 2,655 0.419
Philadelphia-Camden-Wilmington 2,630 0.436
Atlanta-Sandy Springs-Marietta 2,232 0.404
Washington-Arlington-Alexandria 2,152 0.457
Portland-Vancouver-Hillsboro 1,928 0.833
Phoenix-Mesa-Glendale 1,543 0.35
Rochester 1,542 1.422
Raleigh-Cary 1,384 1.139
Table 13: Patenting for the 20 MSAs with most patents, 2013
3 Conclusion
The TPP is a very ambitious agreement, covering a diverse set of countries, and
aspiring to dismantle both traditional and non-traditional trade barriers, while retaining
safeguards to cushion the burden of rapid adjustment14. Early studies of the proposal estimate that the TPP will contribute to modest
growth in long-term US incomes and living standards, by lowering prices for US consumers
and expanding market access for the US’s most productive export industries.
San Diego appears singularly well placed to take advantage of these growth
opportunities, as both its geography, and its existing pattern of industrial specialization, will
allow it to take disproportionate advantage of the opportunities that the TPP presents. San
Diego exporters already sell the vast majority of their output into TPP markets, and a
reduction in their trade costs would help them further expand their market share. Dismantling
non- tariff barriers could expand market access into new product lines, even in markets
which have already lowered tariff barriers thanks to existing FTAs with the US. The
strengthening of IP rights could support strong growth in one of San Diego’s leading sectors,
14 Safeguards include the phased reduction of protection in strategic sectors, and the ability to reintroduce tariffs in response to unanticipated import surges.
15
scientific research and development.
At the same time, the potential downsides to San Diego seem very limited. The large
number of jobs in non-traded services will be insulated from competitive pressure from
lower wage economies, while households will benefit from any reductions in US prices
arising from lower import tariffs.
If implemented as planned, the TPP appears to offer prosperous potential for the San
Diego economy.
References
Belassa, B. (1965). Trade liberalisation and revealed comparative advantage,
The Manchester School 33: 99–123.
Brugues, A., Combs, M., Cox, M., Bautista, A. D., Flyte, D., Fuentes, N. A., Luhn, C.,
Mason, C., Shirk, D. A. & Wright, T. (2014). Jobs without borders: Employment,
industry concentrations, and comparative ad- vantage in the CaliBaja region.
Chander, A and Le, U. P., Breaking the Web: Data Localization vs. the Global Internet,
UC Davis Legal Studies Research Paper No.378
Chaney, T. (2015). The gravity equation in international trade: An explanation.
Kee, H. L., Nicita, A. & Olarreaga, M. (2009). Estimating trade restrictive- ness indices,
Economic Journal 119: 172–199.
Petri, P. A. & Plummer, M. G. (2016). The economic effects of the Trans- Pacific
Partnership: New estimates. Peterson Institute for International Economics Working
Paper 16-2.
Scott, R.E. & Glass, E., Trans-Pacific Partnership, Currency Manipulation, Trade and Jobs
(Economic Policy Institute 2016)


![CartemotoneigeSagLac2014-15 [Unlocked by ] sentier lac st-jean.pdf · 6.6 trans-quÉbec 83 trans-quÉbec 93 trans-quÉbec 93 trans-quÉbec 93 trans-quÉbec 93 trans-quÉbec 93 trans-quÉbec](https://static.fdocuments.us/doc/165x107/5b2cb5eb7f8b9ac06e8b5a01/cartemotoneigesaglac2014-15-unlocked-by-sentier-lac-st-jeanpdf-66-trans-quebec.jpg)