The Total Economic Impact™ Of The Microsoft Sales ... · Microsoft commissioned Forrester...
27
A Forrester Total Economic Impact™ Study Commissioned By Microsoft Project Director: Henry Huang March 2016 The Total Economic Impact™ Of The Microsoft Sales Productivity Solution
Transcript of The Total Economic Impact™ Of The Microsoft Sales ... · Microsoft commissioned Forrester...
A Forrester Total Economic
Impact™ Study
Commissioned By
Microsoft
Project Director:
Henry Huang
March 2016
The Total Economic
Impact™ Of The
Microsoft Sales
Productivity Solution

Table Of Contents
Executive Summary .................................................................................... 3
Disclosures .................................................................................................. 5
TEI Framework And Methodology ............................................................ 6
Analysis ........................................................................................................ 8
Financial Summary ................................................................................... 21
Microsoft Sales Productivity Solution: Overview ................................. 22
Appendix A: Total Economic Impact™ Overview ................................. 24
Appendix B: Forrester And The Age Of The Customer ....................... 25
Appendix C: Glossary ............................................................................... 26
Appendix D: Supplemental Material ....................................................... 27
Appendix E: Endnotes .............................................................................. 27
ABOUT FORRESTER CONSULTING
Forrester Consulting provides independent and objective research-based
consulting to help leaders succeed in their organizations. Ranging in scope from a
short strategy session to custom projects, Forrester’s Consulting services connect
you directly with research analysts who apply expert insight to your specific
business challenges. For more information, visit forrester.com/consulting.
© 2016, Forrester Research, Inc. All rights reserved. Unauthorized reproduction is strictly prohibited.
Information is based on best available resources. Opinions reflect judgment at the time and are subject to
change. Forrester®, Technographics
®, Forrester Wave, RoleView, TechRadar, and Total Economic Impact
are trademarks of Forrester Research, Inc. All other trademarks are the property of their respective
companies. For additional information, go to www.forrester.com.
3
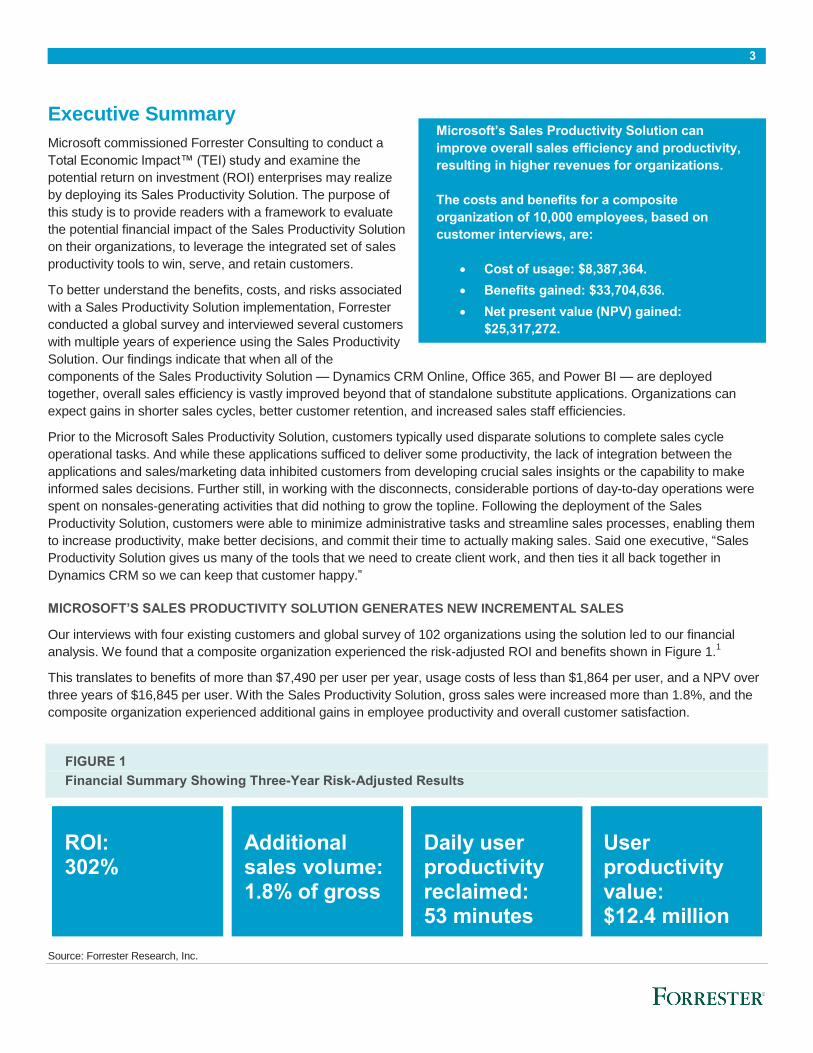
Executive Summary
Microsoft commissioned Forrester Consulting to conduct a
Total Economic Impact™ (TEI) study and examine the
potential return on investment (ROI) enterprises may realize
by deploying its Sales Productivity Solution. The purpose of
this study is to provide readers with a framework to evaluate
the potential financial impact of the Sales Productivity Solution
on their organizations, to leverage the integrated set of sales
productivity tools to win, serve, and retain customers.
To better understand the benefits, costs, and risks associated
with a Sales Productivity Solution implementation, Forrester
conducted a global survey and interviewed several customers
with multiple years of experience using the Sales Productivity
Solution. Our findings indicate that when all of the
components of the Sales Productivity Solution — Dynamics CRM Online, Office 365, and Power BI — are deployed
together, overall sales efficiency is vastly improved beyond that of standalone substitute applications. Organizations can
expect gains in shorter sales cycles, better customer retention, and increased sales staff efficiencies.
Prior to the Microsoft Sales Productivity Solution, customers typically used disparate solutions to complete sales cycle
operational tasks. And while these applications sufficed to deliver some productivity, the lack of integration between the
applications and sales/marketing data inhibited customers from developing crucial sales insights or the capability to make
informed sales decisions. Further still, in working with the disconnects, considerable portions of day-to-day operations were
spent on nonsales-generating activities that did nothing to grow the topline. Following the deployment of the Sales
Productivity Solution, customers were able to minimize administrative tasks and streamline sales processes, enabling them
to increase productivity, make better decisions, and commit their time to actually making sales. Said one executive, “Sales
Productivity Solution gives us many of the tools that we need to create client work, and then ties it all back together in
Dynamics CRM so we can keep that customer happy.”
MICROSOFT’S SALES PRODUCTIVITY SOLUTION GENERATES NEW INCREMENTAL SALES
Our interviews with four existing customers and global survey of 102 organizations using the solution led to our financial
analysis. We found that a composite organization experienced the risk-adjusted ROI and benefits shown in Figure 1.1
This translates to benefits of more than $7,490 per user per year, usage costs of less than $1,864 per user, and a NPV over
three years of $16,845 per user. With the Sales Productivity Solution, gross sales were increased more than 1.8%, and the
composite organization experienced additional gains in employee productivity and overall customer satisfaction.
FIGURE 1
Financial Summary Showing Three-Year Risk-Adjusted Results
ROI: 302%
Additional sales volume: 1.8% of gross
Daily user productivity reclaimed: 53 minutes
User productivity value: $12.4 million
Source: Forrester Research, Inc.
Microsoft’s Sales Productivity Solution can
improve overall sales efficiency and productivity,
resulting in higher revenues for organizations.
The costs and benefits for a composite
organization of 10,000 employees, based on
customer interviews, are:
Cost of usage: $8,387,364.
Benefits gained: $33,704,636.
Net present value (NPV) gained:
$25,317,272.
4
› Benefits. The composite organization experienced the following risk-adjusted benefits that represent those experienced by
the interviewed companies:
• An improvement in full-time equivalent (FTE) productivity output, resulting in a captured benefit of
$12,370,437, over three years. Sales professionals saved an average of 53 minutes and managers saved 77
minutes daily following the adoption of the Sales Productivity Solution. Drivers of the time savings include: live
integrations between applications in the solution package, data linkages, cross embedment of applications with the
solution, and removal of the VPN requirement. The reduced need to switch between applications and the ability to
better track data directly translated to a reduction in time wasted, enabling the sales unit to concentrate on making
sales.
• Revenue uplift from the improved sales unit efficiencies, amounting to $17,435,312, PV, over three years.
Interviewed and surveyed organizations reported improvements in sales cycle times, customer retention rates, and
overall gains in being able to meet the needs of customers. The result of these improvements at the composite
organization brought a 1% to 2.7% increase to topline revenue when using the Sales Productivity Solution rather
than standalone sales productivity applications.
• Easier and more accessible reporting and forecasting with active dashboarding. In providing ease of data
visualization to more individuals, the sales organization was better able to stay on track and develop valuable
insights. In all, with the use of active dashboards, natural queries, and numerous data linkages, the composite
organization saved $3,290,105, PV, over three years.
• Reduced ongoing application and CRM maintenance and support costs to the tune of $608,781. Included in
the Sales Productivity Solution is a support plan for the applications, including maintenance and update procedures.
Major and minor patches were auto-updated with greater frequency and kept the organization from needing to
expand its support personnel.
› Costs. The composite organization experienced the following risk-adjusted costs:
• Software licensing fees of $4,628,370 over three years (PV), or $3,086 per user over that time period. As the
Microsoft solution is a software-as-a-service (SaaS) product, these are recurring fees paid to Microsoft for access to
the software solutions, service, and support. Yearly costs of this segment ranged from $1,776,600 to $1,958,702.
Troubleshooting and support are included and alleviate some support functions, as noted in the Benefits section.
• Functionality training costs of $2,584,994, PV, over a three-year horizon. As new features are pushed out by
Microsoft, maximized utilization and integration require process updates and training. On average, we expect 6
hours of training twice a year for the entire solution.
• Data migration and integration costs of $1,174,000 in the initial phase of adoption. This is a one-time cost that
utilized internal resources and external providers to move across existing customer data and then stitch together any
additional data repositories with the Sales Productivity Solution. No additional costs were incurred following the initial
deployment.
5
Disclosures
The reader should be aware of the following:
› The study is commissioned by Microsoft and delivered by Forrester Consulting. It is not meant to be used as a competitive
analysis.
› Forrester makes no assumptions as to the potential ROI that other organizations will receive. Forrester strongly advises
that readers use their own estimates within the framework provided in the report to determine the appropriateness of an
investment in Microsoft/Sales Productivity Solution.
› Microsoft reviewed and provided feedback to Forrester, but Forrester maintains editorial control over the study and its
findings and does not accept changes to the study that contradict Forrester's findings or obscure the meaning of the study.
› Microsoft provided the customer names for the interviews but did not participate in the interviews.
6
TEI Framework And Methodology
INTRODUCTION
From the information provided in the interviews, Forrester has constructed a Total Economic Impact (TEI) framework for
those organizations considering implementing Microsoft’s Sales Productivity Solution. The objective of the framework is to
identify the cost, benefit, flexibility, and risk factors that affect the investment decision, to help organizations understand how
to take advantage of specific benefits, reduce costs, and improve the overall business goals of winning, serving, and
retaining customers.
APPROACH AND METHODOLOGY
Forrester took a multistep approach to evaluate the impact that Microsoft’s Sales Productivity Solution can have on an
organization (see Figure 2). Specifically, we:
› Interviewed Microsoft marketing, sales, and/or consulting personnel, along with Forrester analysts, to gather data relative
to the Sales Productivity Solution and the marketplace for the Sales Productivity Solution.
› Interviewed four organizations currently using Microsoft’s Sales Productivity Solution to obtain data with respect to costs,
benefits, and risks.
› Conducted a global survey with over 100 respondents encompassing Europe, APAC, North America, and Latin America to
collect additional data points and add granularity to the study’s findings.
› Designed a composite organization based on characteristics of the interviewed organizations
› Constructed a financial model representative of the interviews using the TEI methodology. The financial model is
populated with the cost and benefit data obtained from the interviews and survey as applied to the composite organization.
› Risk-adjusted the financial model based on issues and concerns the interviewed organizations highlighted in interviews.
Risk adjustment is a key part of the TEI methodology. While interviewed organizations provided cost and benefit
estimates, some categories included a broad range of responses or had a number of outside forces that might have
affected the results. For that reason, some cost and benefit totals have been risk-adjusted and are detailed in each
relevant section.
Forrester employed four fundamental elements of TEI in modeling the Microsoft Sales Productivity Solution’s service:
benefits, costs, flexibility, and risks.
Given the increasing sophistication that enterprises have regarding ROI analyses related to IT investments, Forrester’s TEI
methodology serves to provide a complete picture of the total economic impact of purchase decisions. Please see Appendix
A for additional information on the TEI methodology.
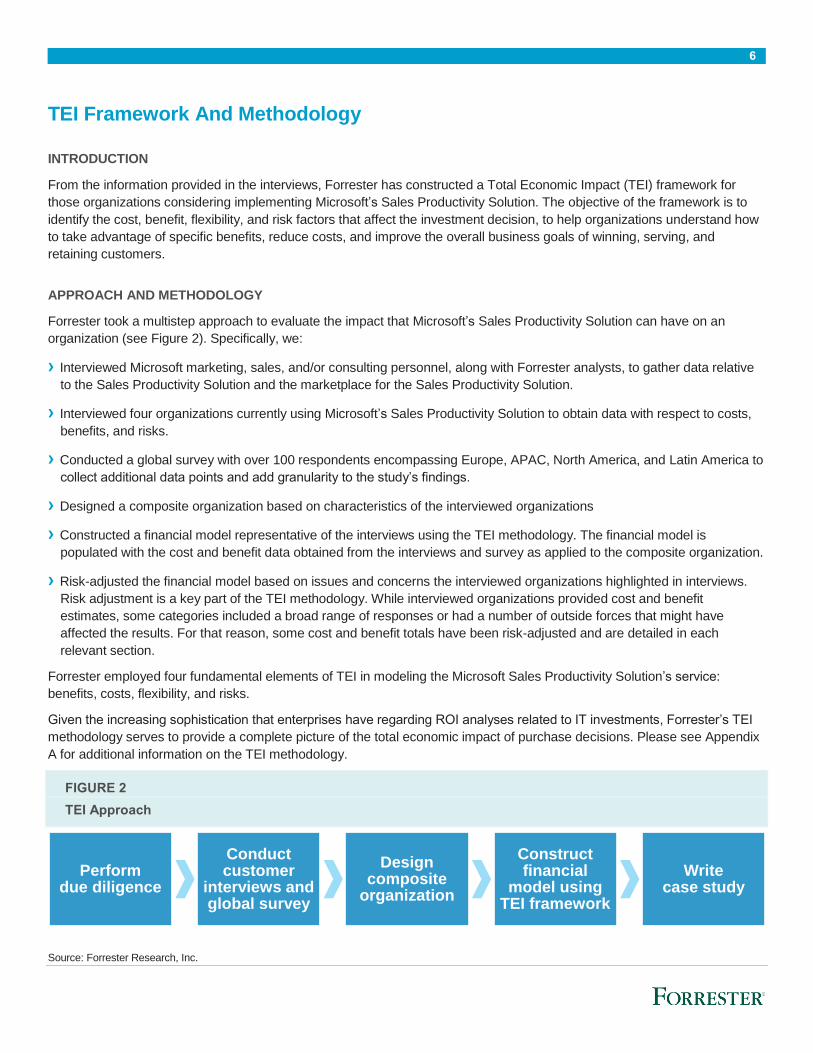
FIGURE 2
TEI Approach
Source: Forrester Research, Inc.
Perform due diligence
Conduct customer
interviews and global survey
Design composite
organization
Construct financial
model using TEI framework
Write case study
7
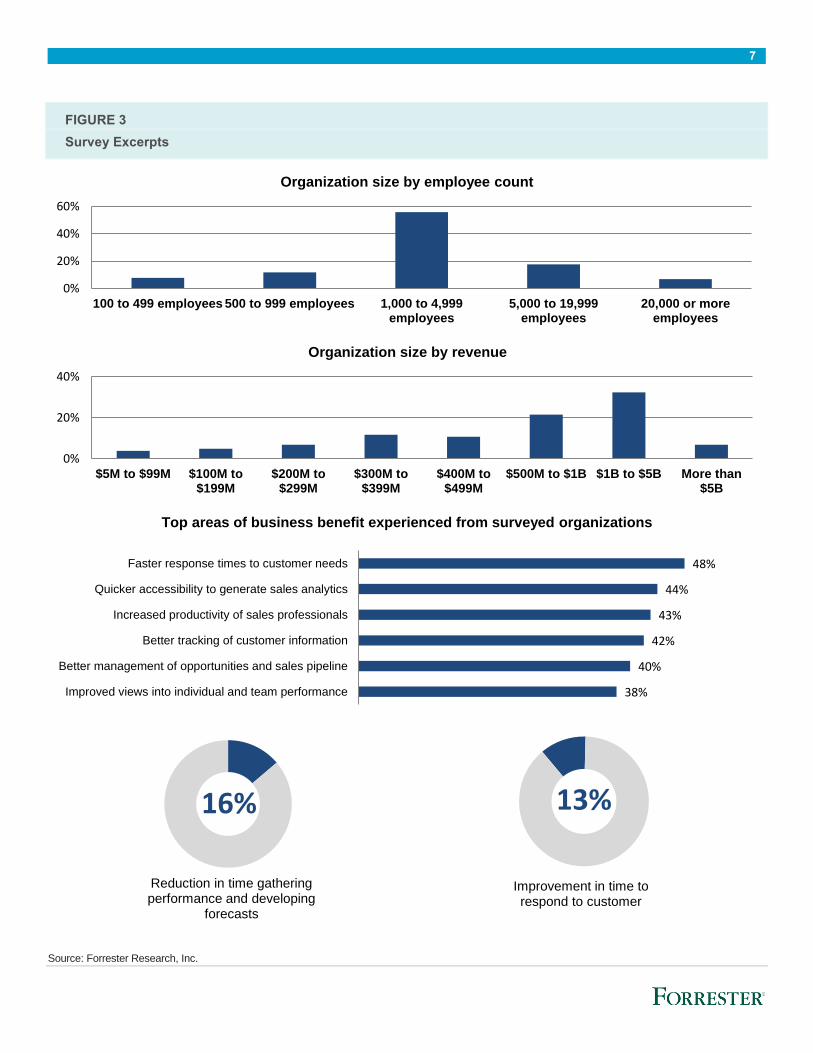
FIGURE 3
Survey Excerpts
Source: Forrester Research, Inc.
0%
20%
40%
60%
100 to 499 employees 500 to 999 employees 1,000 to 4,999employees
5,000 to 19,999employees
20,000 or moreemployees
Organization size by employee count
0%
20%
40%
$5M to $99M $100M to$199M
$200M to$299M
$300M to$399M
$400M to$499M
$500M to $1B $1B to $5B More than$5B
Organization size by revenue
38%
40%
42%
43%
44%
48%
Improved views into individual and team performance
Better management of opportunities and sales pipeline
Better tracking of customer information
Increased productivity of sales professionals
Quicker accessibility to generate sales analytics
Faster response times to customer needs
Top areas of business benefit experienced from surveyed organizations
16%
Reduction in time gathering performance and developing
forecasts
13%
Improvement in time to respond to customer
8
Analysis
COMPOSITE ORGANIZATION
For this study, Forrester conducted a total of four interviews with representatives from the following companies, which are
global Microsoft customers:
› A US-headquartered international material science and manufacturing company operating in over 60 countries with over
$3 billion in annual revenue. The organization relies on Microsoft Dynamics CRM Online and Office 365 to tie together its
global sales operation.
› A European bank chain using the Microsoft Sales Productivity Solution to deliver a seamlessly integrated banking
experience. Its entire workforce utilizes Dynamics CRM Online as
the backbone of their operations.
› A large Asia Pacific life insurer with over 800 physical branches
that depends on reliable and widespread geographical access to
customer data on the Microsoft Sales Productivity Solution. Its
process flows are built around productivity synergies found within
the integrated Microsoft stack.
› A European engineering firm that specializes in fire safety. This
organization predominantly serves international clients and uses
the Microsoft cloud stack to connect engineers and clients across
entire project life cycles.
In addition, Forrester fielded a global survey to 102 Microsoft Sales
Productivity Solution customers, asking them of their experience
and how multiple financially impactful levers were moved with their
use of the Sales Productivity Solution. Survey respondents included
managers, directors, and senior-most leaders in business- and IT-
representing organizations from a wide spectrum of verticals and
often with global offices.
Based on the interviews, Forrester constructed a TEI framework, a
composite company, and an associated ROI analysis that
illustrates the areas financially affected. The composite
organization that Forrester synthesized from these results
represents an organization with the following characteristics:
› It is a multinational corporation (MNC) with offices throughout the
world. EMEA and APAC are regions that are growing at a rapid pace for this organization.
› Continued growth of its international footprint is expected in coming years.
› It has 6,000 employees, 1,500 of whom are active users of CRM, Power BI, and Office 365.
› Annual revenues total $800 million.
› It holds a strong focus on customer experience and is interested in delivering it with the latest solutions in a concerted and
integrated manner.
After an extensive RFP and business case process evaluating multiple vendors, the composite organization chose Microsoft
and began deployment of the Sales Productivity Solution:
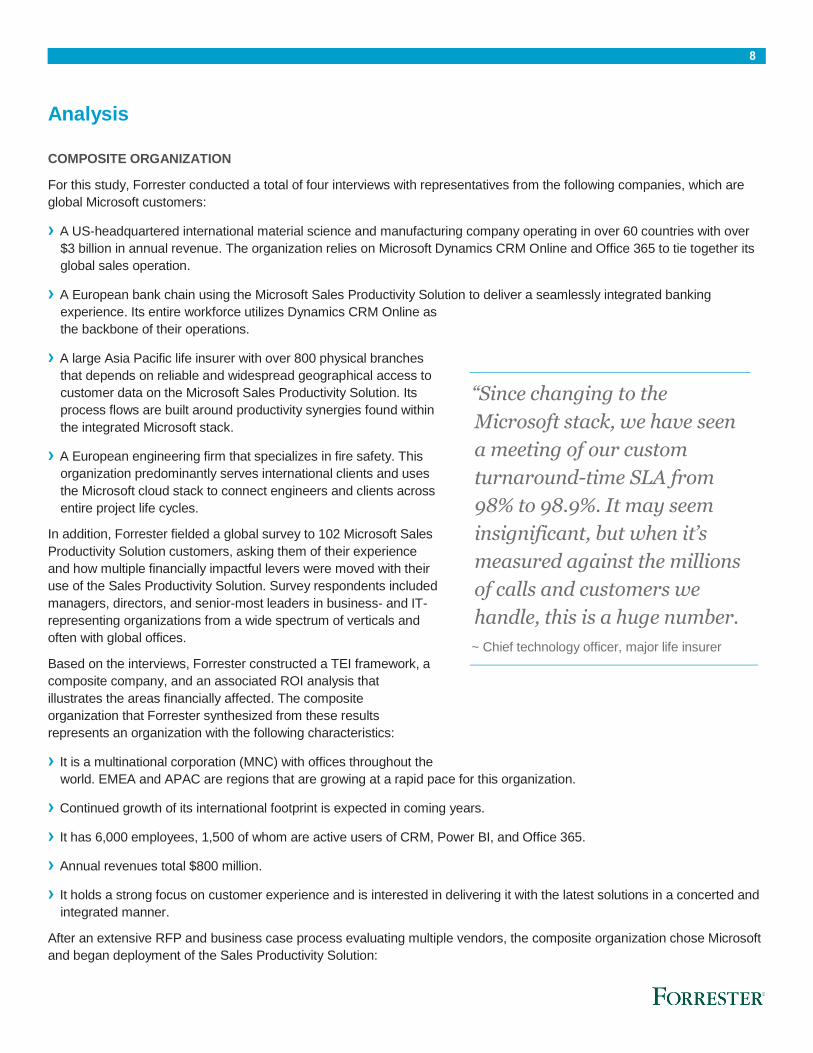
“Since changing to the
Microsoft stack, we have seen
a meeting of our custom
turnaround-time SLA from
98% to 98.9%. It may seem
insignificant, but when it’s
measured against the millions
of calls and customers we
handle, this is a huge number.
~ Chief technology officer, major life insurer

9
› The decision was made to move this segment of its application
stack to the cloud, in alignment with its overarching
rationalization of both the hardware and software infrastructure.
› A primary objective during the selection process was to test the
synergies present between applications for maximized sales
performance. The composite organization tested various other
products in these capacities with the objective of delivering
maximum bottom-line gain in sales and customer experience.
› Initial concerns revolved around functionality and whether
increased productivity could be attained versus the existing set
of applications. This was put to test with a pilot group of users
over a proof-of-concept (POC) period of two months.
› Following the successful initial POC process, the Microsoft
solution was rolled out into the production environment at global
offices with 1,500 user licenses. Ninety-percent of these users
were sales professionals, and the other 10% were managers or
executives.
› The expectation was to scale the solution as necessary, should growth or contraction occur in various territories.
Situation
The composite organization, like many organizations, desired to trim down on IT bloat and an application stack that over-
utilized and underperformed in the past years. After syndicating a number of consulting engagements on how to tackle this
problem, the organization had made the decision to move a portion of its architecture to the cloud. In doing so, it hoped to
reduce the strain on internal IT resources and become a more agile organization.
The second and more important part of the composite organization’s initiative was to improve integration between
applications; in other words, it wanted to have an application stack working in sync to tie data together and provide a
competitive advantage — or at least match the capabilities of agile- and technologically enabled newcomers in its space.
With the organization’s rapidly growing repositories of data, the business leaders recognized it as a shortfall if it could not
leverage this data and democratize it for collaboration.
In reviewing organization wide process flows, the organization saw positives in the way that it was collaborating, with the use
of central repositories and intranets to deliver that. Yet collaboration on client delivery was only one part of the sales cycle.
The tools given to the sales organization seemed disconnected from the rest of the organization’s business applications, as
evident in its communication tools and CRM software: “It seemed silly, but shouldn’t my sent email automatically link to an
event in my CRM?” said a corporate executive. Additionally, data that was present in other repositories like the ERP software
was never visible to salespeople until reports were pulled at the end of the month. Sales cycles had grown more complex,
and the composite organization sought to streamline the processes, making more information available without
overburdening sales professionals with a long list of disconnected applications. In a new sales solution, the organization
sought the following:
› Full sales cycle workflows with live integrations to productivity/client delivery software. If the solution included the office
productivity piece, even better.
› A solution that provided some form of support and maintenance plan, reducing the strain on IT resources.
› Reporting functionality with integration to a multitude of data repositories, including SQL databases and ERP software.
› Scalability, should the need to enter or exit a region become necessary.
“Microsoft gives us a tool set so
that we can successfully
complete the entire sales cycle,
with extremely deep
integrations both front end and
back end between the apps.
That’s how Microsoft wins for
us.”
~ Managing partner, engineering firm
10
Solution
Ultimately, the composite organization selected the Microsoft Sales Productivity Solution for its ability to provide a fully
integrated sales productivity tool that handles the entire sales cycle. The Sales Productivity Solution offered out-of-the-box
capabilities that surpassed the composite organization’s sales productivity applications and added the level of deep
integration that the organization sought. And while there were several strong competitors in the market, few had the ability to
integrate and embed data in a very usable live manner. Testers immediately spoke highly of the embedding of applications
such as Excel within the new CRM tool and the immediate linkages between Outlook and Dynamics; these features made a
sizeable difference in the time saved by sales professionals. By choosing the Sales Productivity Solution, the composite
organization gained business agility with its sales professionals and greatly increased their efficiency.
Results
The interview revealed that:
› Efficiency of sales professionals improved significantly, with less time spent on administrative tasks and more
time spent actually engaging with customers. The level of integration between programs and live linkages enabled
sales professionals to work faster and spend more time actually selling. As the entire platform lives in the Microsoft cloud,
salespeople also found that accessibility was easier. Efficiency gains were found in the follow manners:
• Less application switching, with application embedding (such as Excel in Dynamics) and live data linkages (like
Dynamics showing Outlook events). Sales professionals could view linked data directly in Dynamics CRM to make
informed decisions on how to sell to the customer best and ultimately satisfy the customer’s needs.
• Decreased human errors due to having accurate linkages and information became the norm. Rather than CTRL-C,
ALT-TAB, and finally CTRL-V, the complete picture was in front of the sales professional with easily accessible links.
• Increased visibility and sharing to promote collaboration. With active dashboards made possible by Power BI, sales
professionals knew what to expect and how to better address needs. A combination of CRM and reporting data from
Power BI made for a sales unit that was more acutely aware of where attention was necessary.
› Revenues went up, as a result of shorter sales cycles and better sales focus. By effectively giving more time back to
the sales professionals, the organization saw higher sales. Additionally, customers were more satisfied with the increased
touchpoints, making for a longer and more profitable relationship.
› Reporting and forecasting became faster and more available.
Power BI brought active dashboarding for better data visualization
at the composite organization. Additionally, the presence of the
dashboarding reduced the need to pull some reports from legacy
systems, reducing strain on the organization’s system resources
and saving sales managers’ time.
› Upfront infrastructure costs were avoided and some legacy
systems retired. No additional servers or data centers were
required in deploying the Sales Productivity Solution. In fact, zero
capex dollars were spent, and some of the infrastructure stack was
retired.
› Sales and office productivity applications required far less
maintenance and support costs. With support and maintenance
included in a plan from Microsoft, the organization did not need to
increase its staff to support the new sales solution. Instead, updates
and patches came with more regularity, decreasing risk exposure.
As an added bonus, the organization benefitted from new features twice a year from Microsoft updates.
“Our sales guys spent 40% of
their time doing
administrative work. That
just doesn’t work for us. With
the Microsoft suite of tools,
we are working our way
toward 10%.”
~ CIO, material science manufacturer
11
BENEFITS
The composite organization experienced a number of quantified benefits in this case study:
› Sales FTE incremental output improvement.
› Revenue uplift over existing standalone sales productivity applications.
› Reporting and forecasting time savings with active dashboarding and natural queries.
› Reduced ongoing sales and office productivity application maintenance and support costs.
Another important benefit noted was the effects of Power BI on sales and business processes after deployment. Several
interviewed organizations democratized information and enabled sales professionals to make additional incremental sales —
such as just-in-time orders, based on live or near-live information from disparate (and not just Microsoft) data sources. While
the decreased reliance on traditional BI tools is quantified below, we have not assigned a quantified value to the additional
benefit of the ability to enable new and improved business models. For more information, please refer to the Flexibility
section.
Sales FTE Incremental Output Improvement
The composite organization indicated that a key benefit from the Sales Productivity Solution implementation was
a drastic improvement in sales personnel efficiency. Prior to the Sales Productivity Solution, the composite
organization had standalone applications that handled various segments of the sales cycle. This made for a less-
than-ideal situation, as sales professionals would be responsible for the stitching together of the data between
applications. With Dynamics CRM Online, Office 365, and Power BI, there was continuity in the data between all
the applications, making for a much more seamless sales process. Unlike with the composite organization’s
legacy systems, all work done and contact made with clients was recorded and shared between the Sales
Productivity Solution applications, without the need for repetitive manual entry. Beyond the live linkages,
embedded Excel and Outlook emails were also available from within Dynamics CRM Online.
Several observations were made at the composite organization following deployment of the Sales Productivity
Solution:
› Sales professionals drastically reduced switching between applications.
› Redundant entries were no longer necessary.
› Human errors from copying and pasting of client information were reduced by over 11%.
› Internal collaboration increased with the ease of task sharing and tracking.
› Client issues were resolved 13% faster.
Following the Sales Productivity Solution implementation, sales professionals realized a gain of 53 minutes per
day, leaving them with more time to perform more sales-related tasks rather than administrative tasks.
Accounting for the underutilization of this newfound time, we discounted the time savings by 40% and came to an
annual savings of $5.8 million for the composite organization. Over the course of three years, the organization
saved approximately $14.5 million.
Interviewed organizations provided a range in overall gains in efficiencies. Some organizations may have
captured the saved time more effectively than others. Additionally, some organizations may have had more
mature and developed sales processes that would have capitalized the time savings more effectively. To
compensate, this benefit was risk-adjusted and reduced by 15%. The risk-adjusted total benefit resulting from

12
improved sales FTE efficiency over the three years was $12,370,437, PV. See the section on Risks for more
detail.
TABLE 1
Sales FTE Incremental Output Improvement
Ref. Metric Calculation Initial Year 1 Year 2 Year 3
A1 Number of sales professionals 1,500 1,500 1,500
A2 Hourly rate per salesperson
$40 $40 $40
A3 Number of days worked per
year 240 240 240
A4 Hours on average saved per
day, per salesperson 0.88 0.88 0.88
A5 Hourly rate per sales manager $70 $70 $70
A6 Hours on average saved per
day, per sales manager 1.28 1.28 1.28
A7 Time value saved by sales
professionals annually (90%*A1*A2*A3*A4) $11,404,800 $11,404,800 $11,404,800
A8 Time value saved by sales
managers annually (10%*A1*A3*A5*A6)
$3,225,600 $3,225,600 $3,225,600
A9 Percent of saved time captured
as productive usage 40% 40% 40%
At
Sales FTE incremental output
improvement, in dollars
annually
(A7+A8)*A9 $0 $5,852,160 $5,852,160 $5,852,160
Risk adjustment ↓15%
Atr
Sales FTE incremental output
improvement, in dollars
annually (risk-adjusted) $0 $4,974,336 $4,974,336 $4,974,336
Source: Forrester Research, Inc.
Revenue Uplift Over Existing Standalone Sales Productivity Applications
A direct result of the increased sales staff efficiencies at the composite organization was a marked increase in
topline revenue. Sales cycles became shorter, customer relationships were retained longer, and customer
satisfaction improved — all due to the improved sales efficiencies brought upon by the Sales Productivity
Solution.
13
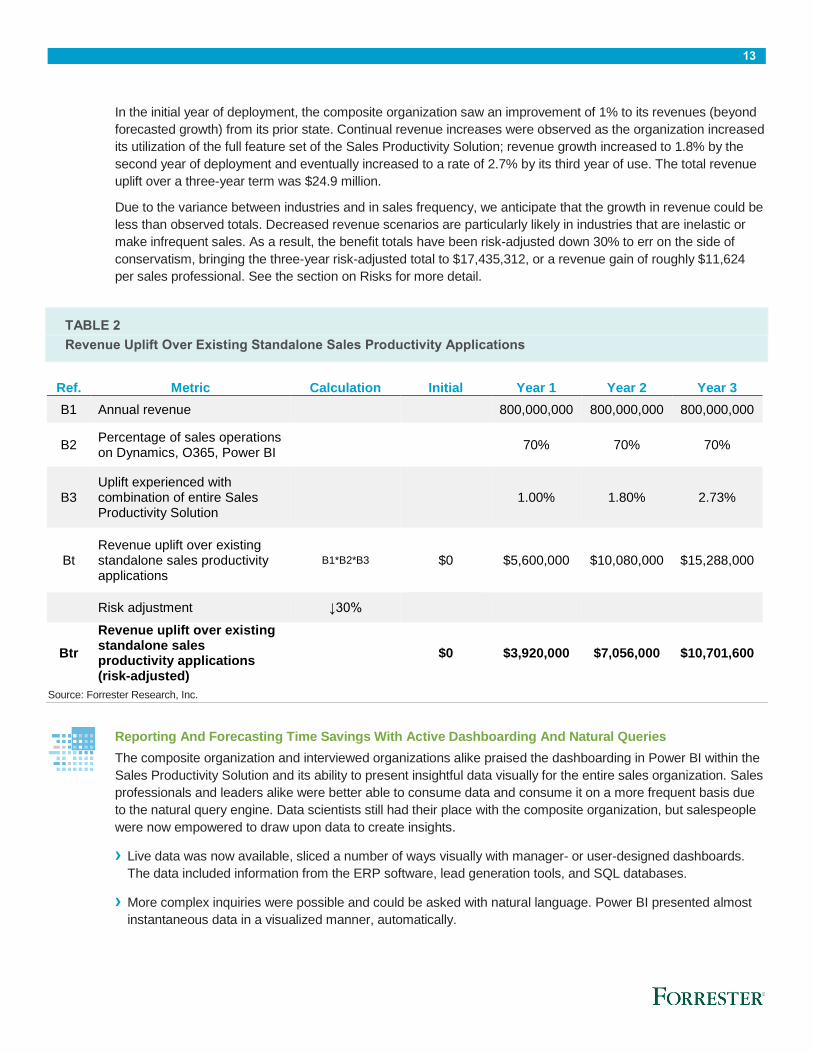
In the initial year of deployment, the composite organization saw an improvement of 1% to its revenues (beyond
forecasted growth) from its prior state. Continual revenue increases were observed as the organization increased
its utilization of the full feature set of the Sales Productivity Solution; revenue growth increased to 1.8% by the
second year of deployment and eventually increased to a rate of 2.7% by its third year of use. The total revenue
uplift over a three-year term was $24.9 million.
Due to the variance between industries and in sales frequency, we anticipate that the growth in revenue could be
less than observed totals. Decreased revenue scenarios are particularly likely in industries that are inelastic or
make infrequent sales. As a result, the benefit totals have been risk-adjusted down 30% to err on the side of
conservatism, bringing the three-year risk-adjusted total to $17,435,312, or a revenue gain of roughly $11,624
per sales professional. See the section on Risks for more detail.
TABLE 2
Revenue Uplift Over Existing Standalone Sales Productivity Applications
Ref. Metric Calculation Initial Year 1 Year 2 Year 3
B1 Annual revenue 800,000,000 800,000,000 800,000,000
B2 Percentage of sales operations on Dynamics, O365, Power BI
70% 70% 70%
B3 Uplift experienced with combination of entire Sales Productivity Solution
1.00% 1.80% 2.73%
Bt Revenue uplift over existing standalone sales productivity applications
B1*B2*B3 $0 $5,600,000 $10,080,000 $15,288,000
Risk adjustment ↓30%
Btr
Revenue uplift over existing standalone sales productivity applications (risk-adjusted)
$0 $3,920,000 $7,056,000 $10,701,600
Source: Forrester Research, Inc.
Reporting And Forecasting Time Savings With Active Dashboarding And Natural Queries
The composite organization and interviewed organizations alike praised the dashboarding in Power BI within the
Sales Productivity Solution and its ability to present insightful data visually for the entire sales organization. Sales
professionals and leaders alike were better able to consume data and consume it on a more frequent basis due
to the natural query engine. Data scientists still had their place with the composite organization, but salespeople
were now empowered to draw upon data to create insights.
› Live data was now available, sliced a number of ways visually with manager- or user-designed dashboards.
The data included information from the ERP software, lead generation tools, and SQL databases.
› More complex inquiries were possible and could be asked with natural language. Power BI presented almost
instantaneous data in a visualized manner, automatically.

14
The amount of time needed for managers to produce reports and perform forecasting was greatly reduced, as
the live dashboards could immediately present data. Dependency on traditional BI tools by sales leaders was
reduced after the implementation of the Sales Productivity Solution. On an annual basis, the time savings for
managers amounted to $1,323,000, or $3,290,105, PV, over three years.
TABLE 3
Reporting And Forecasting Time Savings With Active Dashboarding And Natural Queries
Ref. Metric Calculation Initial Year 1 Year 2 Year 3
C1 Manager compensation, hourly calculation, fully loaded
$70 $70 $70
C2 Hours worked per year, per manager
1,920 1,920 1,920
C3 Number of managers generating and developing insights from reports
300 300 300
C4 Average time to pull reports, in smaller increments via dashboards, in hours
0.25 0.25 0.25
C5 Average number of reports pulled now, per annum
360 360 360
C6 Total cost of reporting on BI solution, in hours
C1*C3*C4*C5
$1,890,000 $1,890,000 $1,890,000
C7 Amount of reporting and analysis reduced from move to Power BI dashboarding
70% 70% 70%
Ctr
Reporting and forecasting time savings with active dashboarding and natural queries
C6*C7 $0 $1,323,000 $1,323,000 $1,323,000
Source: Forrester Research, Inc.
Reduced Ongoing Sales And Office Productivity Application Maintenance And Support Costs
Prior to the implementation of the Sales Productivity Solution, the composite organization led all efforts to
maintain and support the applications for the sales unit. As with several of our interviewed organizations, updates
and patches were done sporadically and only when the IT personnel had extra time. With the Sales Productivity
Solution, the composite organization regularly benefited from patches for bugs and security threats. Additionally,
direct support was available to the end users from Microsoft, relieving the organization of some help desk duties.
The most important part of having the maintenance performed by Microsoft was that the entire suite was updated
while maintaining integration, unlike many standalone products.
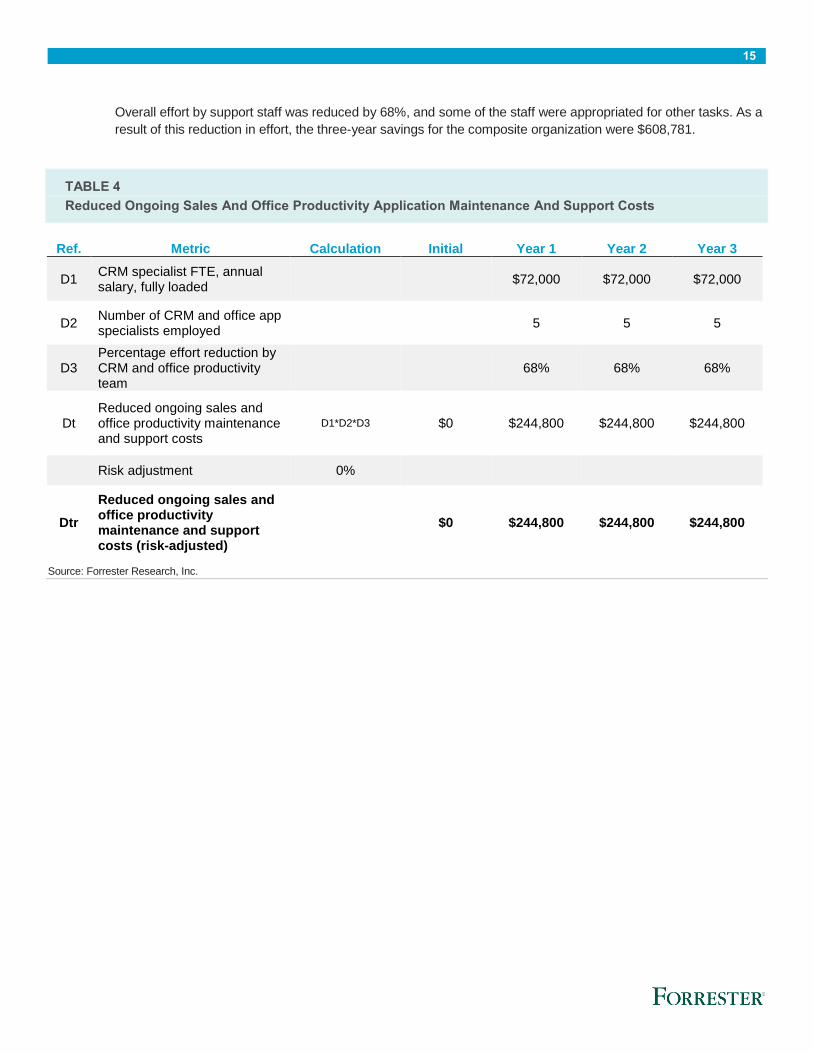
15
Overall effort by support staff was reduced by 68%, and some of the staff were appropriated for other tasks. As a
result of this reduction in effort, the three-year savings for the composite organization were $608,781.
TABLE 4
Reduced Ongoing Sales And Office Productivity Application Maintenance And Support Costs
Ref. Metric Calculation Initial Year 1 Year 2 Year 3
D1 CRM specialist FTE, annual salary, fully loaded
$72,000 $72,000 $72,000
D2 Number of CRM and office app specialists employed
5 5 5
D3 Percentage effort reduction by CRM and office productivity team
68% 68% 68%
Dt Reduced ongoing sales and office productivity maintenance and support costs
D1*D2*D3 $0 $244,800 $244,800 $244,800
Risk adjustment 0%
Dtr
Reduced ongoing sales and office productivity maintenance and support costs (risk-adjusted)
$0 $244,800 $244,800 $244,800
Source: Forrester Research, Inc.
16
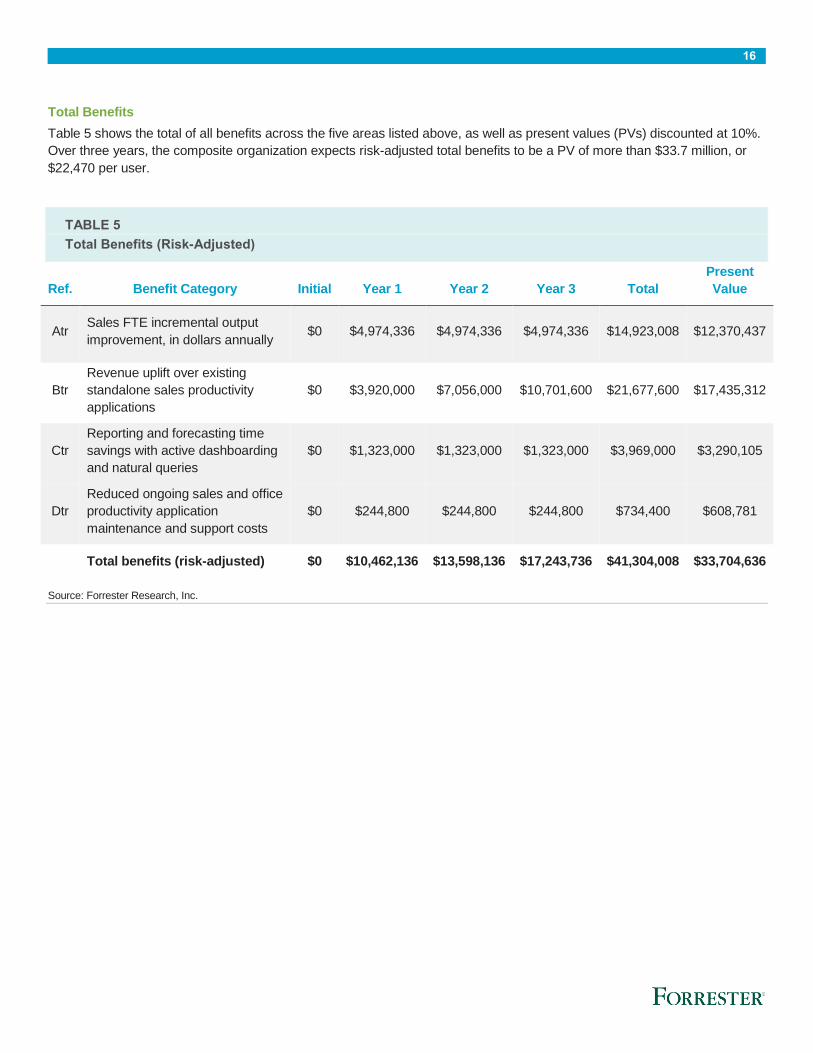
Total Benefits
Table 5 shows the total of all benefits across the five areas listed above, as well as present values (PVs) discounted at 10%.
Over three years, the composite organization expects risk-adjusted total benefits to be a PV of more than $33.7 million, or
$22,470 per user.
TABLE 5
Total Benefits (Risk-Adjusted)
Ref. Benefit Category Initial Year 1 Year 2 Year 3 Total
Present
Value
Atr Sales FTE incremental output
improvement, in dollars annually $0 $4,974,336 $4,974,336 $4,974,336 $14,923,008 $12,370,437
Btr
Revenue uplift over existing
standalone sales productivity
applications
$0 $3,920,000 $7,056,000 $10,701,600 $21,677,600 $17,435,312
Ctr
Reporting and forecasting time
savings with active dashboarding
and natural queries
$0 $1,323,000 $1,323,000 $1,323,000 $3,969,000 $3,290,105
Dtr
Reduced ongoing sales and office
productivity application
maintenance and support costs
$0 $244,800 $244,800 $244,800 $734,400 $608,781
Total benefits (risk-adjusted) $0 $10,462,136 $13,598,136 $17,243,736 $41,304,008 $33,704,636
Source: Forrester Research, Inc.
17
COSTS
The composite organization experienced a number of costs associated with the Sales Productivity Solution:
› Software and support license fees.
› Training costs of new features.
› Data migration and integration costs.
These represent the mix of internal and external costs experienced by the composite organization for initial planning,
implementation, and ongoing maintenance associated with the solution.
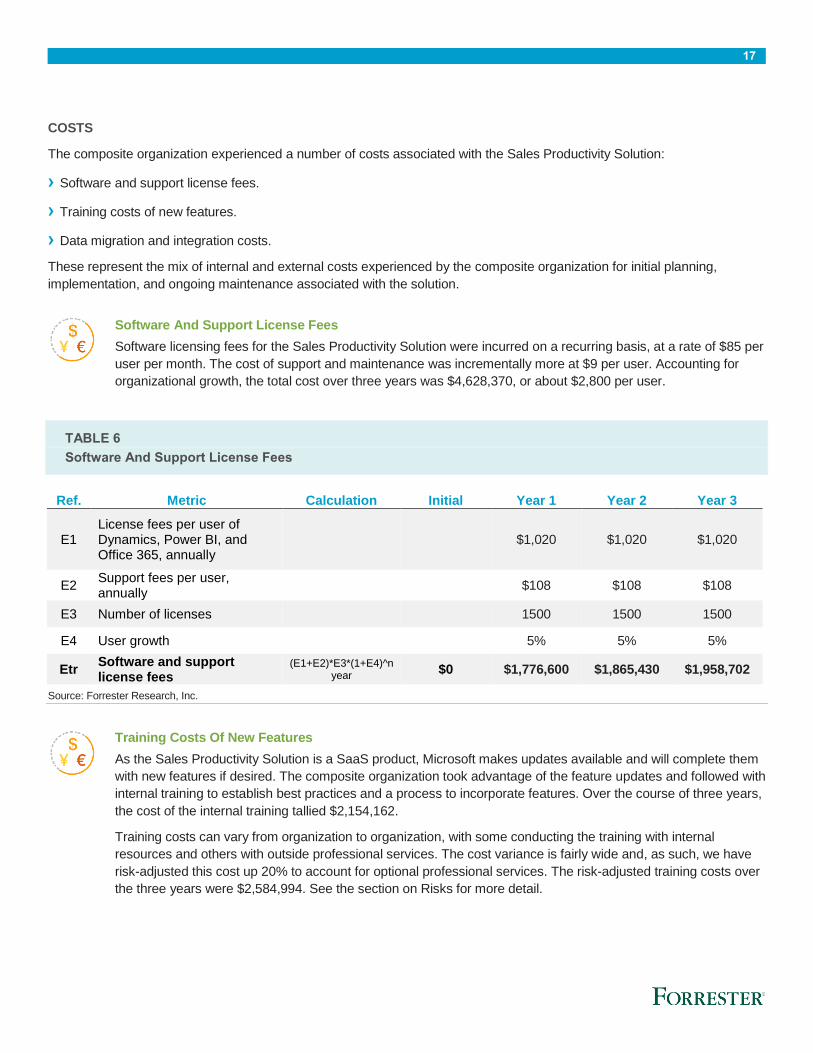
Software And Support License Fees
Software licensing fees for the Sales Productivity Solution were incurred on a recurring basis, at a rate of $85 per
user per month. The cost of support and maintenance was incrementally more at $9 per user. Accounting for
organizational growth, the total cost over three years was $4,628,370, or about $2,800 per user.
TABLE 6
Software And Support License Fees
Ref. Metric Calculation Initial Year 1 Year 2 Year 3
E1 License fees per user of Dynamics, Power BI, and Office 365, annually
$1,020 $1,020 $1,020
E2 Support fees per user, annually
$108 $108 $108
E3 Number of licenses 1500 1500 1500
E4 User growth
5% 5% 5%
Etr Software and support license fees
(E1+E2)*E3*(1+E4)^n year
$0 $1,776,600 $1,865,430 $1,958,702
Source: Forrester Research, Inc.
Training Costs Of New Features
As the Sales Productivity Solution is a SaaS product, Microsoft makes updates available and will complete them
with new features if desired. The composite organization took advantage of the feature updates and followed with
internal training to establish best practices and a process to incorporate features. Over the course of three years,
the cost of the internal training tallied $2,154,162.
Training costs can vary from organization to organization, with some conducting the training with internal
resources and others with outside professional services. The cost variance is fairly wide and, as such, we have
risk-adjusted this cost up 20% to account for optional professional services. The risk-adjusted training costs over
the three years were $2,584,994. See the section on Risks for more detail.

18
TABLE 7
Training Costs Of New Features
Ref. Metric Calculation Initial Year 1 Year 2 Year 3
F1 Feature rollout frequency, per year
2 2 2
F2 Training time, in hours per FTE, per rollout
6 6 6
F3 FTE hourly wage, per sales professional on average, fully loaded
$43.75 $43.75 $43.75
F4 Sales Productivity Solution users
1,500 1,500 1,500
F5 User growth 5% 5% 5%
Ft Training costs of new features F1*F2*F3*F4*(F5+1^n
year) $0 $826,875 $868,219 $911,630
Risk adjustment ↑20%
Ftr Training costs of new features (risk-adjusted)
$0 $992,250 $1,041,863 $1,093,956
Source: Forrester Research, Inc.
Data Migration And Integration Costs
As with many other applications that house client data, the deployment of Microsoft’s Sales Productivity Solution
required a migration of data from existing sources. Most common CRMs can be imported through the included
import tool. The composite organization also had various other sources of data, and some were non-Microsoft
products without a direct importation or integration tool. Using a professional services organization, the
composite organization was able to complete the integration without complications and utilize the CRM data as a
part of its reporting capability.
TABLE 8
Data Migration And Integration Costs
Ref. Metric Calculation Initial Year 1 Year 2 Year 3
G1 Non-Microsoft data repository integrations
2 0 0 0
G2 Cost per non-Microsoft technical integration $512,000
G3 Microsoft data migration (SharePoint, Dynamics CRM)
$150,000
Gtr Data migration and integration costs
G1*G2+G3 $1,174,000 $0 $0 $0
Source: Forrester Research, Inc.
19
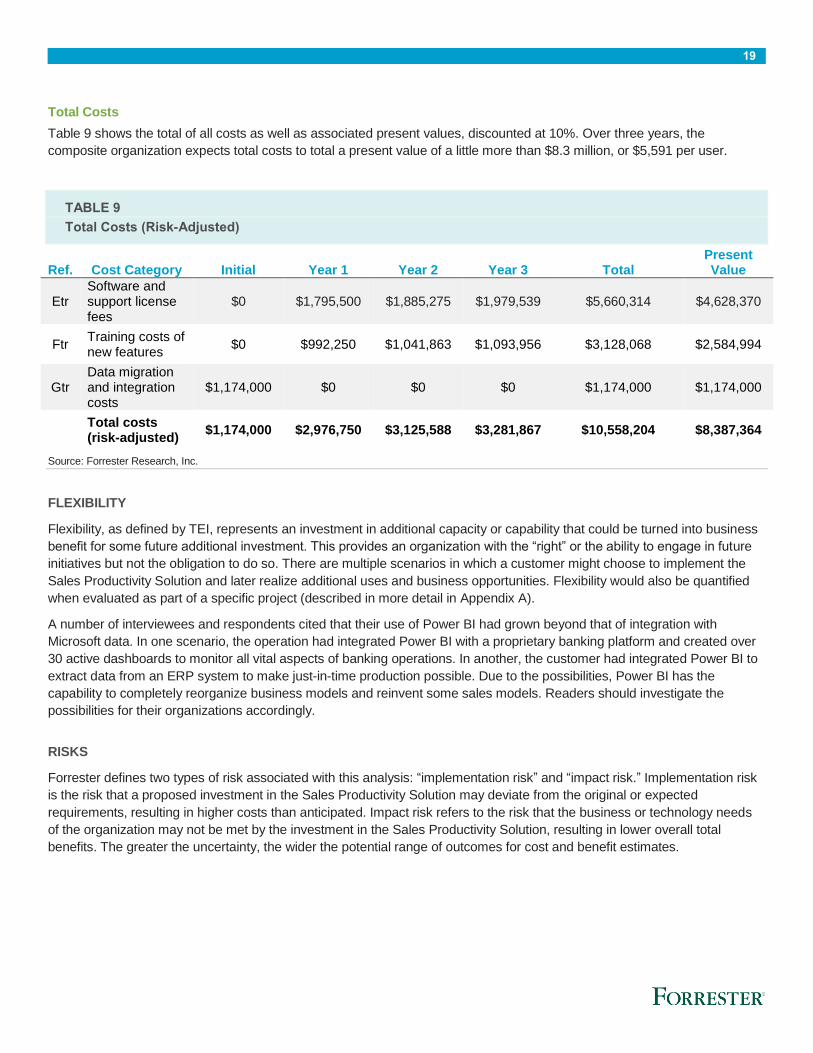
Total Costs
Table 9 shows the total of all costs as well as associated present values, discounted at 10%. Over three years, the
composite organization expects total costs to total a present value of a little more than $8.3 million, or $5,591 per user.
TABLE 9
Total Costs (Risk-Adjusted)
Ref. Cost Category Initial Year 1 Year 2 Year 3 Total Present Value
Etr Software and support license fees
$0 $1,795,500 $1,885,275 $1,979,539 $5,660,314 $4,628,370
Ftr Training costs of new features
$0 $992,250 $1,041,863 $1,093,956 $3,128,068 $2,584,994
Gtr Data migration and integration costs
$1,174,000 $0 $0 $0 $1,174,000 $1,174,000
Total costs (risk-adjusted)
$1,174,000 $2,976,750 $3,125,588 $3,281,867 $10,558,204 $8,387,364
Source: Forrester Research, Inc.
FLEXIBILITY
Flexibility, as defined by TEI, represents an investment in additional capacity or capability that could be turned into business
benefit for some future additional investment. This provides an organization with the “right” or the ability to engage in future
initiatives but not the obligation to do so. There are multiple scenarios in which a customer might choose to implement the
Sales Productivity Solution and later realize additional uses and business opportunities. Flexibility would also be quantified
when evaluated as part of a specific project (described in more detail in Appendix A).
A number of interviewees and respondents cited that their use of Power BI had grown beyond that of integration with
Microsoft data. In one scenario, the operation had integrated Power BI with a proprietary banking platform and created over
30 active dashboards to monitor all vital aspects of banking operations. In another, the customer had integrated Power BI to
extract data from an ERP system to make just-in-time production possible. Due to the possibilities, Power BI has the
capability to completely reorganize business models and reinvent some sales models. Readers should investigate the
possibilities for their organizations accordingly.
RISKS
Forrester defines two types of risk associated with this analysis: “implementation risk” and “impact risk.” Implementation risk
is the risk that a proposed investment in the Sales Productivity Solution may deviate from the original or expected
requirements, resulting in higher costs than anticipated. Impact risk refers to the risk that the business or technology needs
of the organization may not be met by the investment in the Sales Productivity Solution, resulting in lower overall total
benefits. The greater the uncertainty, the wider the potential range of outcomes for cost and benefit estimates.

20
TABLE 10
Benefit And Cost Risk Adjustments
Benefits Adjustment
Sales FTE incremental output improvement 15%
Revenue uplift over existing standalone sales productivity applications 30%
Costs Adjustment
Training costs of new features 20%
Source: Forrester Research, Inc.
Quantitatively capturing implementation risk and impact risk by directly adjusting the financial estimates results provides
more meaningful and accurate estimates and a more accurate projection of the ROI. In general, risks affect costs by raising
the original estimates, and they affect benefits by reducing the original estimates. The risk-adjusted numbers should be taken
as “realistic” expectations since they represent the expected values considering risk.
The following impact risks that affect benefits are identified as part of the analysis:
› Sales FTE incremental output improvement can be affected by the effectiveness of training and how comprehensively
organizations use the solution features. Furthermore, not all saved time is translated back into productive use. And while
we’ve already reduced that capture, some organizations may have more lax policies and/or timekeeping. Overall, it is not
uncommon for organizations to not fully utilize the platform; thus, we have reduced this benefit by 15%.
› Revenue uplift as a result of the improved sales efficiencies has been reduced by 30% due to the possibility of some
organizations needing less process-intensive sales or client deliverables. Having extremely periodic sales (and protracted
periods of inactivity) due to industry characteristics can also affect the revenue uplift at an organization.
The following implementation risk that affects costs is identified as part of this analysis:
› Training costs can be more at some organizations than others, depending on the thoroughness of the training and the cost
of the professional services, if used. Therefore, we have increased this cost by 20%.
Table 10 shows the values used to adjust for risk and uncertainty in the cost and benefit estimates for the composite
organization. Readers are urged to apply their own risk ranges based on their own degree of confidence in the cost and
benefit estimates.
21
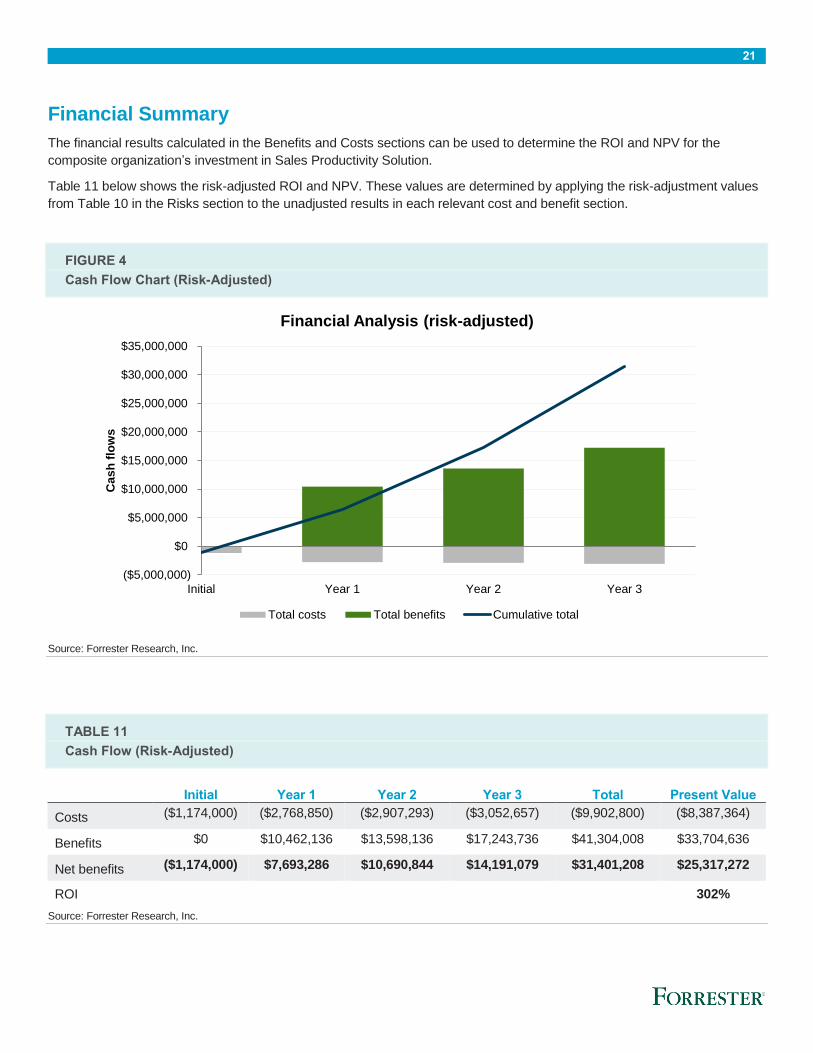
Financial Summary
The financial results calculated in the Benefits and Costs sections can be used to determine the ROI and NPV for the
composite organization’s investment in Sales Productivity Solution.
Table 11 below shows the risk-adjusted ROI and NPV. These values are determined by applying the risk-adjustment values
from Table 10 in the Risks section to the unadjusted results in each relevant cost and benefit section.
FIGURE 4
Cash Flow Chart (Risk-Adjusted)
Source: Forrester Research, Inc.
TABLE 11
Cash Flow (Risk-Adjusted)
Initial Year 1 Year 2 Year 3 Total Present Value
Costs ($1,174,000) ($2,768,850) ($2,907,293) ($3,052,657) ($9,902,800) ($8,387,364)
Benefits $0 $10,462,136 $13,598,136 $17,243,736 $41,304,008 $33,704,636
Net benefits ($1,174,000) $7,693,286 $10,690,844 $14,191,079 $31,401,208 $25,317,272
ROI
302%
Source: Forrester Research, Inc.
($5,000,000)
$0
$5,000,000
$10,000,000
$15,000,000
$20,000,000
$25,000,000
$30,000,000
$35,000,000
Initial Year 1 Year 2 Year 3
Cas
h f
low
s
Financial Analysis (risk-adjusted)
Total costs Total benefits Cumulative total
22
Microsoft Sales Productivity Solution: Overview
The following information is provided by Microsoft. Forrester has not validated any claims and does not endorse Microsoft or
its offerings.
The Microsoft Sales Productivity Solution helps salespeople be more productive so they can focus on what's most important
— delivering amazing customer experiences. With the combination of sales force automation tools in Microsoft Dynamics
CRM and deep integration with Office 365 and Power BI, sales teams can sell more effectively in this new era. The solution
provides the essential insight, guidance, and intuitive tools that salespeople need so they can focus on the right customers
and priorities, win faster by collaborating with colleagues, and build a trusted relationship with customers through
personalized and relevant engagements.
KEY CAPABILITIES
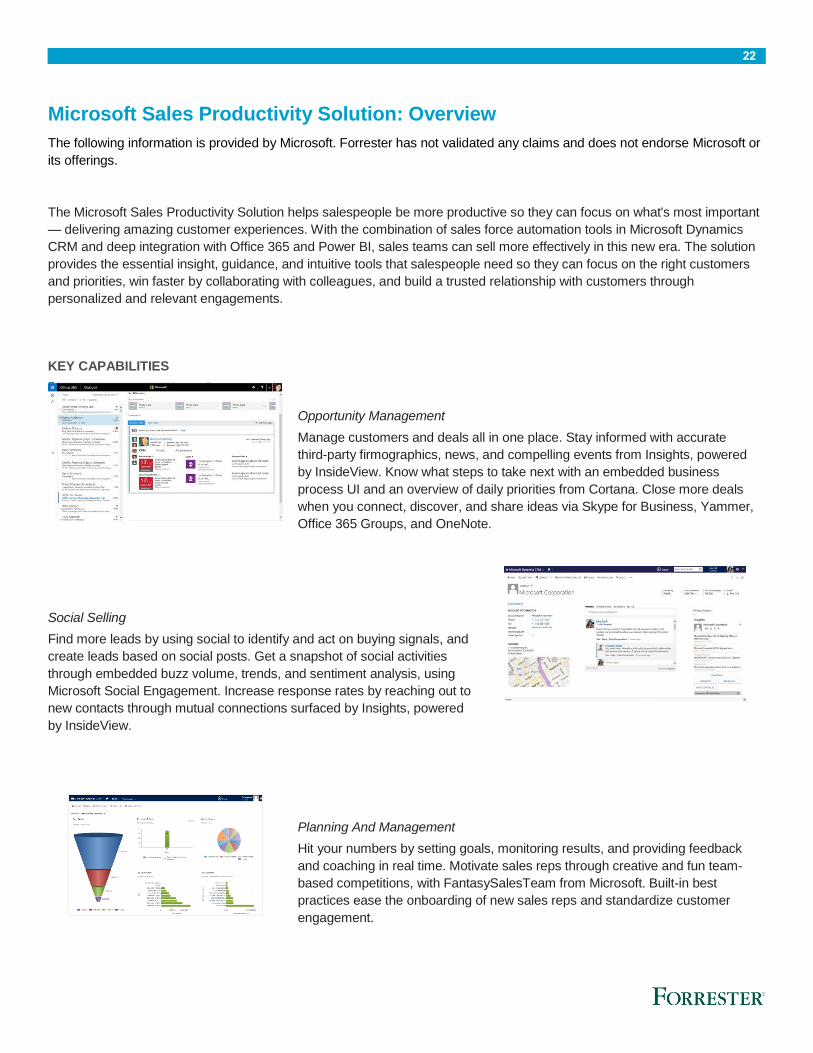
Opportunity Management
Manage customers and deals all in one place. Stay informed with accurate
third-party firmographics, news, and compelling events from Insights, powered
by InsideView. Know what steps to take next with an embedded business
process UI and an overview of daily priorities from Cortana. Close more deals
when you connect, discover, and share ideas via Skype for Business, Yammer,
Office 365 Groups, and OneNote.
Social Selling
Find more leads by using social to identify and act on buying signals, and
create leads based on social posts. Get a snapshot of social activities
through embedded buzz volume, trends, and sentiment analysis, using
Microsoft Social Engagement. Increase response rates by reaching out to
new contacts through mutual connections surfaced by Insights, powered
by InsideView.
Planning And Management
Hit your numbers by setting goals, monitoring results, and providing feedback
and coaching in real time. Motivate sales reps through creative and fun team-
based competitions, with FantasySalesTeam from Microsoft. Built-in best
practices ease the onboarding of new sales reps and standardize customer
engagement.
23
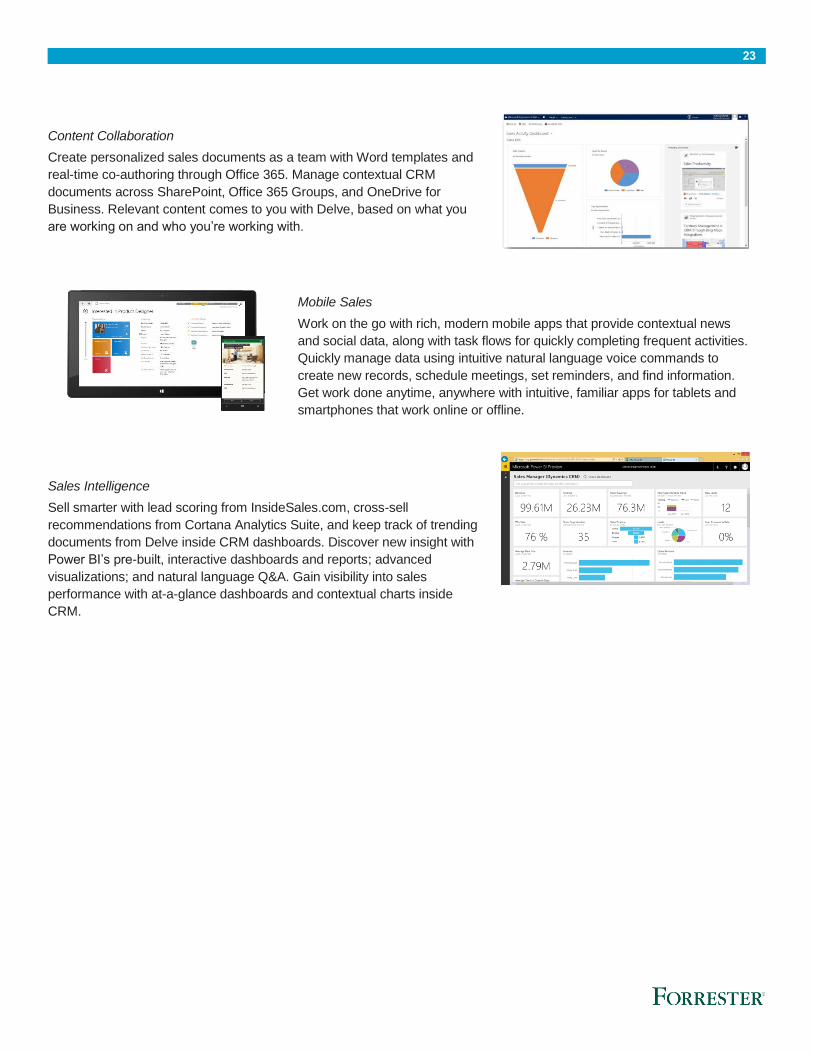
Content Collaboration
Create personalized sales documents as a team with Word templates and
real-time co-authoring through Office 365. Manage contextual CRM
documents across SharePoint, Office 365 Groups, and OneDrive for
Business. Relevant content comes to you with Delve, based on what you
are working on and who you’re working with.
Mobile Sales
Work on the go with rich, modern mobile apps that provide contextual news
and social data, along with task flows for quickly completing frequent activities.
Quickly manage data using intuitive natural language voice commands to
create new records, schedule meetings, set reminders, and find information.
Get work done anytime, anywhere with intuitive, familiar apps for tablets and
smartphones that work online or offline.
Sales Intelligence
Sell smarter with lead scoring from InsideSales.com, cross-sell
recommendations from Cortana Analytics Suite, and keep track of trending
documents from Delve inside CRM dashboards. Discover new insight with
Power BI’s pre-built, interactive dashboards and reports; advanced
visualizations; and natural language Q&A. Gain visibility into sales
performance with at-a-glance dashboards and contextual charts inside
CRM.

24
Appendix A: Total Economic Impact™ Overview
Total Economic Impact is a methodology developed by Forrester Research that enhances a company’s technology decision-
making processes and assists vendors in communicating the value proposition of their products and services to clients. The
TEI methodology helps companies demonstrate, justify, and realize the tangible value of IT initiatives to both senior
management and other key business stakeholders. TEI assists technology vendors in winning, serving, and retaining
customers.
The TEI methodology consists of four components to evaluate investment value: benefits, costs, flexibility, and risks.
BENEFITS
Benefits represent the value delivered to the user organization — IT and/or business units — by the proposed product or
project. Often, product or project justification exercises focus just on IT cost and cost reduction, leaving little room to analyze
the effect of the technology on the entire organization. The TEI methodology and the resulting financial model place equal
weight on the measure of benefits and the measure of costs, allowing for a full examination of the effect of the technology on
the entire organization. Calculation of benefit estimates involves a clear dialogue with the user organization to understand
the specific value that is created. In addition, Forrester also requires that there be a clear line of accountability established
between the measurement and justification of benefit estimates after the project has been completed. This ensures that
benefit estimates tie back directly to the bottom line.
COSTS
Costs represent the investment necessary to capture the value, or benefits, of the proposed project. IT or the business units
may incur costs in the form of fully burdened labor, subcontractors, or materials. Costs consider all the investments and
expenses necessary to deliver the proposed value. In addition, the cost category within TEI captures any incremental costs
over the existing environment for ongoing costs associated with the solution. All costs must be tied to the benefits that are
created.
FLEXIBILITY
Within the TEI methodology, direct benefits represent one part of the investment value. While direct benefits can typically be
the primary way to justify a project, Forrester believes that organizations should be able to measure the strategic value of an
investment. Flexibility represents the value that can be obtained for some future additional investment building on top of the
initial investment already made. For instance, an investment in an enterprisewide upgrade of an office Productivity Solution
can potentially increase standardization (to increase efficiency) and reduce licensing costs. However, an embedded
collaboration feature may translate to greater worker productivity if activated. The collaboration can only be used with
additional investment in training at some future point. However, having the ability to capture that benefit has a PV that can be
estimated. The flexibility component of TEI captures that value.
RISKS
Risks measure the uncertainty of benefit and cost estimates contained within the investment. Uncertainty is measured in two
ways: 1) the likelihood that the cost and benefit estimates will meet the original projections and 2) the likelihood that the
estimates will be measured and tracked over time. TEI risk factors are based on a probability density function known as
“triangular distribution” to the values entered. At a minimum, three values are calculated to estimate the risk factor around
each cost and benefit.
25
Appendix B: Forrester And The Age Of The Customer
Your technology-empowered customers now know more than you do about your products and services, pricing, and
reputation. Your competitors can copy or undermine the moves you take to compete. The only way to win, serve, and retain
customers is to become customer-obsessed.
A customer-obsessed enterprise focuses its strategy, energy, and budget on processes that enhance knowledge of and
engagement with customers and prioritizes these over maintaining traditional competitive barriers.
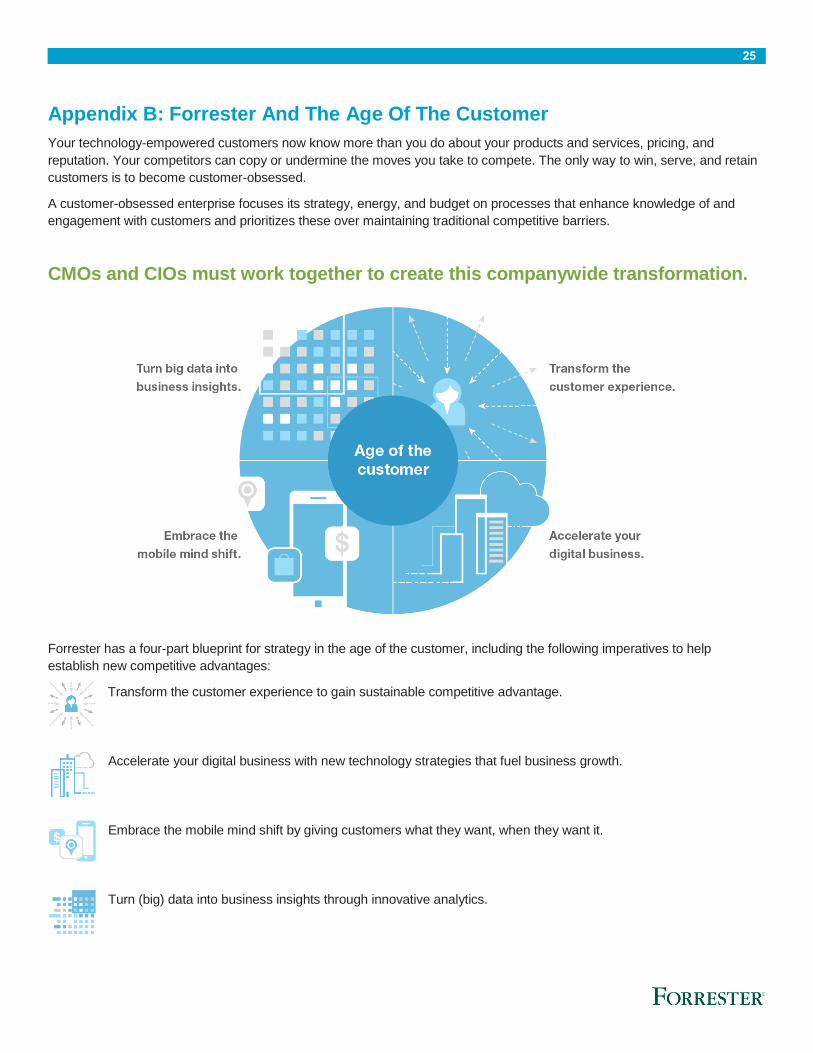
CMOs and CIOs must work together to create this companywide transformation.
Forrester has a four-part blueprint for strategy in the age of the customer, including the following imperatives to help
establish new competitive advantages:
Transform the customer experience to gain sustainable competitive advantage.
Accelerate your digital business with new technology strategies that fuel business growth.
Embrace the mobile mind shift by giving customers what they want, when they want it.
Turn (big) data into business insights through innovative analytics.
26
Appendix C: Glossary
Discount rate: The interest rate used in cash flow analysis to take into account the time value of money. Companies set
their own discount rate based on their business and investment environment. Forrester assumes a yearly discount rate of
10% for this analysis. Organizations typically use discount rates between 8% and 16% based on their current environment.
Readers are urged to consult their respective organizations to determine the most appropriate discount rate to use in their
own environment.
Net present value (NPV): The present or current value of (discounted) future net cash flows given an interest rate (the
discount rate). A positive project NPV normally indicates that the investment should be made, unless other projects have
higher NPVs.
Present value (PV): The present or current value of (discounted) cost and benefit estimates given at an interest rate (the
discount rate). The PV of costs and benefits feed into the total NPV of cash flows.
Payback period: The breakeven point for an investment. This is the point in time at which net benefits (benefits minus costs)
equal initial investment or cost.
Return on investment (ROI): A measure of a project’s expected return in percentage terms. ROI is calculated by dividing
net benefits (benefits minus costs) by costs.
A NOTE ON CASH FLOW TABLES
The following is a note on the cash flow tables used in this study (see the example table below). The initial investment
column contains costs incurred at “time 0” or at the beginning of Year 1. Those costs are not discounted. All other cash flows
in years 1 through 3 are discounted using the discount rate (shown in the Framework Assumptions section) at the end of the
year. PV calculations are calculated for each total cost and benefit estimate. NPV calculations are not calculated until the
summary tables are the sum of the initial investment and the discounted cash flows in each year.
Sums and present value calculations of the Total Benefits, Total Costs, and Cash Flow tables may not exactly add up, as
some rounding may occur.
TABLE [EXAMPLE]
Example Table
Ref. Metric Calculation Year 1 Year 2 Year 3
Source: Forrester Research, Inc.
27
Appendix D: Supplemental Material
Related Forrester Research
“The Forrester Wave™: CRM Suites For Midsize Organizations, Q1 2015,” Forrester Research, Inc., March 25, 2015
“The Forrester Wave™: Agile Business Intelligence Platforms, Q3 2015,” Forrester Research, Inc., September 25, 2015
“A Crisis of Attention: Technology, Productivity, And Flow,” Forrester Research, Inc., July 14, 2014
Appendix E: Endnotes
1 Forrester risk-adjusts the summary financial metrics to take into account the potential uncertainty of the cost and benefit
estimates. For more information, see the section on Risks.